portfolio planning template - rmit universitymams.rmit.edu.au/owvioyyoyvvj.doc · web viewinforms...
TRANSCRIPT

PORTFOLIO PLANNING TEMPLATE2004-2006
Portfolio: RMIT Business
Date: March 2004

PLANNING TEMPLATE Page 2 of 61
CONTENTSSection of Planning
TemplateData Source Frequency Timeline Linkages to other Processes Resources available for assistance/Background
informationSection A: Executive Summary
PVC, based on SWOT analysis and review of other sections of plan, including workplan
Annually July/August Informs Portfolio Planning process (for academic portfolios)Informs development of University Strategic Plan and University Business PlanInforms Budget and workplanning activities
Planning Group staff to facilitate SWOT analysis and planning sessions
Environmental Scanning Guide (http://www2.rmit.edu.au/departments/planning/ircu/escan.php)
Industry Dossiers (available through http://www2.rmit.edu.au/departments/planning/ircu/industry.php (login required)
Internal Review outcomes (e.g. Faculty reviews, QART reviews, Schools Structure review)
AUQA report and Performance Portfolio (http://www.rmit.edu.au/auqa)
Section B: Profile by Fund Source (for academic portfolios)
OPIS Annually April Outcome of Profiles Process OPIS (http://www2.rmit.edu.au/departments/planning/planning.php)
Section C: Operating Budget
Business Warehouse Management Report
Annually October/ November
Outcome of Budget Process Available through Finance Officer
Section D: Scorecards T&L R&D Organisation and
Management
Refer to template for details
Annually Ongoing reporting
Updated July/August
Informs Profiles PlanningInforms Portfolio Planning processForms the basis of regular VCE reporting & EPSProvides linkage to Strategic Plan, Business Plan, T&L Strategy, R&I Strategy, etc.
Template for Annual ReportsProfessional Accreditation reports Student Feedback Top 10 Report
(http://www.rmit.edu.au/teachingandlearning/topten Profile Planning Guidelines (see
http://www2.rmit.edu.au/departments/planning/ircu/profiles.php login required)
Section E: Portfolio Workplan
Planning session/ facilitated input from portfolio staff
Annually September Used to inform PVC workplanning. Sections based on Profiles process template.
Budget processPlanning Group available to facilitate planning sessionsInformed by Portfolio planningRisk Management Strategy considered using AS4360
Section F: Risk Management Assessment
Internal AuditUniversity Risk Mngt Strategy
Updated Annually
August (forward to Internal Audit)
Used to inform University Risk Management strategy
Internal Audit Guidelines for AS/NZS Risk Management standard 4360 available at http://online.standards.com.au/online/autologin.asp
Section G: Workforce Profile
People ServicesSAP
Updated Annually(3 year forecast)
August Used to inform Portfolio/School/service group workplanning initiatives
People Services (Senior Consultants)Guidelines for workforce planning, available from http://www.rmit.edu.au/ps/workplanning
/tt/file_convert/5b3c38097f8b9a0e628d7524/document.doc

PLANNING TEMPLATE Page 3 of 61
Important Note for the Reader:
The following should be noted:
1. The most recent and shorter version of the Business plan template has been used as advised by the Planning Group. Similarly the School Business plan templates that accompany the Portfolio plan comprise the shorter version of the templates and that most recently provided by the Planning Group.
2. The following document has been prepared within a short timeline and before the official profile planning exercise and detailed workforce planning during the budget process. These major activities of budgetary forecasting and profiling have not yet occurred for 2005. Thus, what follows within this plan must be read within this context and the reader should expect that the details contained within this document and the accompanying school plans may vary as these vital planning activities inform our planning further. The 2005 Portfolio business plan will, therefore, be more detailed and more certain in terms of planning than the plan submitted in 2004. For instance, the portfolio’s share of the projected growth for research income is not realistic without careful strategic planning. If, for example, the research strategy was supported financially to allow for the appointment of innovation professors and/or other research only positions, then the projection might be more possible. One possibility might be that the SET portfolio, which has arguably greater capacity to meet the research income targets, could make more than a proportionate contribution to this goal for the university, while the Business Portfolio might take over, to a greater degree, the projections with respect to Internationalisation.
/tt/file_convert/5b3c38097f8b9a0e628d7524/document.doc

PLANNING TEMPLATE Page 4 of 61
SECTION A: EXECUTIVE SUMMARY
1. PURPOSE AND DIRECTION OF THE PORTFOLIO
In keeping with the RMIT University Business Plan, our mission is to provide quality professional and vocational education and training to individuals and enterprises on a regional and international basis; quality outcome-related research and consultancy services that address real world issues.
In order to achieve this mission at Business we focus on students, enterprises and communities with respect to three broad areas namely, teaching and learning, research and innovation, and organisation and management.
2. MAIN PRIORITIES WITHIN THE PLAN
All the Portfolio’s priorities are informed by a consistent focus on Quality, Viability and Relevance 1
Teaching and Learning
1. Student choice: Models for “Business with everything” for TAFE and HE and a feasibility study of offering a single B Bus degree with multiple streams commencing in 2006.
2. Student capabilities: Outcomes oriented staff development targeted at improving teaching quality for capability and competence outcomes for students - 100% of core courses in HE specialist streams and competence based TAFE courses revised through action learning approach by 2005 (35% by end 2004).
3. Offshore Students - Integration of RMIT quality assurance and student feedback processes for all offshore offerings.
4. Student employability: Differentiate RMIT Business though its Work Integrated Learning (WIL) focus – plan to embed WIL explicitly in all Business programs, on and offshore, TAFE and HE, FT and PT, 40% by 2004, 100% by end 2005.
Research and Innovation
1. Grow external income and consultancy through expanded research activity via the targeting of a range of income streams (such as prestige grants, commercial research), increasing ‘research active’ staff and the development of industry partnerships.
2. Improve HD Completions within DEST funded time.3. Continue to improve the output of DEST weighted publications.
Organisation and Management
1. Student services: Improve quality of student services and integration as key support systems to enhance learning.
2. Offshore Students: Appropriate integration of RMIT student services, policies, practices and procedures for all offshore offerings.
3. Sessional staff capability: Develop sessional staff capability to support achievement of Portfolio vision for student learning.
4. Student transition: Develop strategies for student transition appropriate to all major student groups in RMIT Business.
5. Implement the new school of TAFE. 6. Establish a Graduate School of Business positioned strategically within the graduate
education market.7. EQUIS Accreditation: Complete the self assessment phase and apply for accreditation.
1 Based on the RMIT T&L Strategy: Five objectives for Learning and Teaching in 2003 – 2006, the University Business Plan Strategic initiatives for 2004, and the outcomes of the Portfolio’s T&L Planning Day 2004.
/tt/file_convert/5b3c38097f8b9a0e628d7524/document.doc

PLANNING TEMPLATE Page 5 of 61
BACKGROUND AND OVERVIEW
Brief overview of operating environment of the Portfolio
RMIT Business is one of the largest Business “Schools” in Australia and is based at 239 Bourke Street in Melbourne’s Central Business District. Established in 1944 RMIT Business comprises approximately 500 staff working with approximately 18 600 students in Australia and overseas. RMIT Business earns almost three-quarters of its annual revenue from non-Government sources and is highly entrepreneurial and outward looking in its vision.
RMIT Business consists of six Schools, one Research Centre (Centre for Quality Management Research) and involvement in three CRC (CRC for Construction Innovation, CRC for Smart Internet Technology and the CRC Interactive Design) and the Office of the Pro Vice-Chancellor. Currently a Business Graduate School is being established.
The Schools are as follows:
School of Accounting and Law
School of Business Information Technology
School of Economics and Finance
School of Management
School of Marketing
Business TAFE School
The schools as a whole offer a comprehensive and seamless range of education and training from short courses and certificates through to research higher degrees. All courses, including Vocational Education and Training programs (VET), are available to Australian and International students, either in Victoria or at various overseas locations.
RMIT Business prides itself on its educational contribution to the global business community. Its Melbourne campus is a popular destination for international students and the Portfolio is involved in educational partnerships in a range of countries throughout South East Asia, including China, Hong Kong, Malaysia, Singapore Thailand and Vietnam. A wide range of offshore degree programs, including articulation arrangements, is offered in collaboration with local institutions.
RMIT Business aims to be accessible to a diverse range of communities, including those that are geographically isolated. To this end it has developed a number of new initiatives, including a new Bachelor of Commerce degree delivered entirely “On-Line”. Innovation and Entrepreneurship are at the forefront of the RMIT Business strategy for the future.
For further information, please also see: www.rmit.edu.au/bus
Note main stakeholders/clients and their expectations
The main stakeholders/clients for RMIT Business include students, industry clients, the professions, DEST and OTTE.
With respect to students, RMIT Business is one of the largest business “schools” in Australia, with approximately 12 300 higher education students and 6 300 TAFE students throughout Australia and the Asia Pacific Region. Approximately 13 000 students are studying in the heart of Melbourne's central business district while almost 5600 students undertake programs off-campus in Rural Victoria, China, Singapore, Malaysia and Hong Kong. RMIT Business has students studying in Melbourne from countries right around the world such as China, USA, The Netherlands, Malaysia, Indonesia, Vietnam, Hong Kong, Thailand, India, Papua New Guinea, Switzerland, and New Zealand.
The delivery of RMIT Business programs caters for a variety of students ranging from secondary school leavers to business professionals working in the city. RMIT Business caters for a large enrolment in part time study, with
/tt/file_convert/5b3c38097f8b9a0e628d7524/document.doc

PLANNING TEMPLATE Page 6 of 61
most part-time students attending classes at the Bourke Street campus, with over 50% of classes conducted after 5.30pm or on weekends.
Broadly RMIT Business stakeholders expect excellence, student and staff capability, employability, relevance, flexibility, on time deliverables, and clear communication channels. For instance, the Top Ten Report 2003 states that students across RMIT expect flexible, effective and accurate administrative systems; a clean, well resourced and appropriate learning environment; access to up to date reliable equipment that is well maintained; and a good library collection including current books and journals (p. 3). RMIT Business students also value committed academic/ teaching staff; the opportunity for Work Integrated Learning (WIL); opportunity to meet a diverse group of people; and the easy online access in the library. Students want more formative and summative feedback from staff, and advance notification of timetabling changes.
The School of Business Information Technology enjoys a strong association with the Australian Computer Society, the national accrediting body for Information Technology professionals. The undergraduate Bachelor of Business (Business Information Systems) is accredited with the ACS. The Head of School is a Fellow of the society, and one of the School’s senior lecturers is a member of the State Executive. Two of the School’s programs, the Bachelor of Business (Information and Knowledge Management) and the Graduate Diploma in Knowledge Management are accredited with the Australian Library and Information Association.
The School of Management has recently established a very successful undergraduate degree for young entrepreneurs, and is now totally revising and renewing its undergraduate degree in management.
The School of Accounting and Law has strong links with the professional accounting associations in Australia. Two of its degrees are accredited by the associations: completion of either the Bachelor of Business in Accountancy or the Master of Professional Accounting satisfies the academic requirements for membership. The Chair of the Australian Accounting Standards Board is an Adjunct Professor of the School.
The School of Marketing has industry links with all the various disciplines in the School. The five undergraduate programs in Marketing, Transport and Logistics Management, Hospitality, Tourism and International Business all foster industry connections and the co-op placement for students in these programs brings industry related and professional benefits to staff and students. The postgraduate programs in Marketing and in Logistics Management are designed for practising professionals and much of the research carried out in the School focuses on practical issues with real world relevance. The BRW Top 100 Fastest Growing Companies report for example is one of the better known research outputs from this School.
The School of Economics and Finance has developed strong links with the financial services sector. The undergraduate programs are accredited pathways for membership of the AIBF, the FPA and the professional accountancy bodies. The Master of Finance is recognised by the FTA and the Master of Financial Planning is a pathway for the CFP program as well as being recognised by ASIC as meeting PS146 requirements. Staff in the School hold official positions with industry bodies such as the FPA and the ASFE, as well as providing consulting services to a range of organisations. The School is well placed to contribute to the Victorian Government’s strategy of establishing Melbourne as the premier location in Australia for financial services education and training. The School of Economics and Finance has significant scholarship clusters in financial services, empirical finance and economic modelling. The research capability associated with these scholarship clusters has, over recent years, produced substantial research outputs across all DEST categories. Staff in the School also hold editorial positions with significant refereed journals in the accounting, finance and economics areas.
The Business TAFE School delivers programs in Accounting, Legal Studies, Financial Services, Real Estate, Marketing, Advertising, International Trade, Information Technology, Administration, Management, Conveyancing, and Foundation studies. Through traineeships, commercial activities, New Enterprise Workplace Activities and workplace student learning projects, the Business TAFE School has developed good industry links. The Business TAFE School is the only Registered Training Organisation offering a conveyancing specific program and the Program Coordinator presented at the industry state conference in March 2004. The Advertising program has a strong relationship with the Advertising Institute of Australia and the Business TAFE School is regarded by that industry as a leader in Advertising education and training. The internal and external research environment expects increased research income, timely successful research completions, and DEST approved publications, as well as increasing numbers of accredited research supervisors, research active staff and relevant student capabilities.
/tt/file_convert/5b3c38097f8b9a0e628d7524/document.doc

PLANNING TEMPLATE Page 7 of 61
In addition to meeting profile targets, OTTE expects growth in commercial income, increased traineeship intakes, delivery designed to meet priority student targets, improved completion rates, adherence to AQTF standards, reduced invalid enrolment rates, quality improvement that aligns with client/student expectations, and programs and services configured to enhance community and industry partnerships.
Note challenges and opportunities from SWOT analysis undertaken as part of Portfolio’s planning process, and the main impacts on the Portfolio’s operations (provide details in attachments as appropriate)
The challenges as perceived through SWOT analysis include:
1. Financial sustainability;2. The alignment of facilities/ resource/processes with planned growth;3. Staff capacity and capability;4. Growth in commercial activity (HEd and TAFE; on and off shore);5. Re-assess, re-invigorate and market strengths vis-a vis competitors;6. Implementation challenges- consultation between the centre and the portfolio and the development of integrated
systems;7. Continuous improvement in quality of teaching;8. Improved research performance;9. Staff morale.
The opportunities as perceived through SWOT analysis include:
1. The use of the RMIT Business brand to leverage our local and our international reputation on/off shore;2. The establishment of a Graduate School of Business;3. Reinvigorate our strengths, such as work integrated learning, in terms of the market opportunities;4. Exploit and expand our industry linkages and grow our industry connectedness.
Comment on student numbers (and projections) (See Profile by fund source template at Section E)
Whilst student growth is not anticipated in the Business TAFE sector, the Higher Education sector has projected steady growth over the next 3 years, particularly in the international onshore and offshore undergraduate market.
Although the 2005 COG allocation is yet to be determined, the current tentative projection of the university indicates a reduction in COG Business places over the next few years. Yet VTAC demand for undergraduate business places remains high. In 2003 and 2004 Business had three of the top ten most popular programs (Accountancy, Marketing and Business Administration). With common first year core courses and updating of programs, the popularity of RMIT’s business programs is guaranteed with the undergraduate student market. This unmet demand will most probably be met by other institutions, not in an improvement in AFP take up rates.
Slow growth is predicted for the undergraduate AFP market, as the community needs to undertake a culture change to accept that education is on a “user pays basis”.
The predicted portfolio level growth in the Postgraduate AFP, International Onshore and Offshore markets may prove challenging to achieve as the Post graduate sector is becoming increasingly competitive. Additionally, recent DIMIA changes make the Business 18 month Masters programs less attractive to prospective international students. The Portfolio will need to respond to this market need.
Note: The figures in the attached profile planning templates are what was submitted to the University during the 2003 profile planning process, and may change when the 2005 – 2007 profile is reviewed during 2004.
Provide overview of resource context (Finance, Staff Capability, Facilities)
A major challenge exists in terms of the projected student growth that is in excess of our current capacity to service. Thus, the current resource context (finance, staff capability, facilities) will need to grow if such targets are to be realised. For instance, the facilities at Building 108, given the compressed time slot of most classes (evenings, weekends), are at full capacity. Our computer facilities are in high demand. For example, the room audit conducted by Property services in 2002 showed a 95% usage rate. Additional facilities, such
/tt/file_convert/5b3c38097f8b9a0e628d7524/document.doc

PLANNING TEMPLATE Page 8 of 61
as medium to large classrooms, corporate/executive facilities, computer centres and space for examinations, are needed if we are to accommodate the intended development in student numbers. Further, we shall need to expand our staff capability, through ongoing professional development, the furthering of higher qualifications, and the enhancement of staff morale.
Provide overview of Portfolio’s contribution to relevant scholarship cluster (initiatives included in workforce profile and profile by funding source)
The planning surrounding scholarship clusters began early in 2004. In February the Portfolio executive held a planning day, of which one session was devoted to consideration of discipline or scholarship clusters. It is intended that further work will occur during 2004 and into 2005 as part of the overall university goal to better describe the distinctive features of the work that we do at RMIT. This planning session yielded a first draft in terms of nominating that which we believe to be areas of strength, those areas that are emerging and those that we need to consider further in terms of viability. From this work we will engage in further planning in the Portfolio in connection with the university project emanating from People Services. The plan will need to analyse academic areas within the Portfolio and map the discipline knowledge, qualifications and research capacity with respect to Academic staff.
The planning day yielded some initial thinking with respect to our current strengths, our emergent or potential areas of growth, and those areas that will need to be reviewed in terms of feasibility. While this initial thinking is presented below, it must be recognised that further developmental work and review is needed.
RMIT Business is internationally recognised as a key player in the world of business education, and aims to encompass the needs and demands of the information society in a lifelong learning context. The Portfolio aims to produce graduates who have the capabilities to operate confidently and effectively in a technological global environment.
The Business Portfolio is currently known for the quality of its educational programs in the following areas: Accounting People Management Marketing Financial Markets
The following areas are deemed as emergent or growing scholarship clusters within Business: Entrepreneurship Strategic Management Transport and Logistics Supply Chain Management Business Analysts Development Economics
The Portfolio has developed significant research capability and reputation within the areas of: Organisational accountability E-Commerce and Knowledge Management Financial Markets Practice Led Research Health Services Management Entrepreneurship and Innovation Enterprise Learning Frameworks
The following areas were deemed as possible areas for development but in need of review in terms of feasibility: Hospitality Tourism Development Economics
In 2003 scholarship triangles were developed for the School of Management, the School of Marketing and in the area of financial markets (refer to attachment). Such work will be continued across all schools as part of the on-going work related to scholarship cluster planning and review.
/tt/file_convert/5b3c38097f8b9a0e628d7524/document.doc

PLANNING TEMPLATE Page 9 of 61
It should be noted that the current operating budget will determine the ways in which we can contribute further to scholarship cluster development. The plans noted in section E of this document will be constrained by the budget. Ongoing plans will be maintained and any surplus will be devoted to key strategic goals such as the development of capability-driven curriculum, and the growth of research income.
/tt/file_convert/5b3c38097f8b9a0e628d7524/document.doc
PLANNING TEMPLATE Page 10 of 61
SECTION B: PROFILE BY FUND SOURCE 2004-2006 (for Academic Portfolios only)
VET PROFILE
P Profile L Profile
2003 2003 2004 2005 2006 2003 2003 2004 2005 2006
Enrolled* Perf Agt Profile Profile Profile Enrolled* Perf Agt Profile Profile Profile
VET Programs (SCH) 1,084,112 953,388 969,388 969,388 969,388 92,908 79,337 85,923 85,923 85,923
Foundation Studies (EFTSU)
Fee for Service ($)
Australian Fee Paying International Onshore
2003 2003 2004 2005 2006 2003 2003 2004 2005 2006
Enrolled* Perf Agt Profile Profile Profile Enrolled* Perf Agt Profile Profile Profile
VET Programs (SCH) 170,504 116,400 238,826 240,426 196,926 297,113 344,000 284,000 242,000 247,000
VET Programs (EFTSU) 237 162 332 334 274 413 478 394 336 343
Foundation Studies (EFTSU) 215 369 330 330 330
Fee for Service ($)
/tt/file_convert/5b3c38097f8b9a0e628d7524/document.doc

PLANNING TEMPLATE Page 11 of 61
VET PROFILE (cont’d)
International Offshore Other Funds TOTAL
2003 2003 2004 2005 2006 2003 2003 2004 2005 2006 2003 2003 2004 2005 2006
Enrolled* Perf Agt Profile Profile Profile Enrolled* Perf Agt Profile Profile Profile Enrolled* Perf Agt Profile Profile Profile
VET Programs (SCH) 242,690 355,000 227,000 240,000 265,000 9,355 0 1,896,682 1,848,125 1,805,137 1,777,7371,764,237
VET Programs (EFTSU) 337 493 315 333 368 13 2,634 2567 2,507 2,469 2,450
Foundation Studies (EFTSU) 215 369 330 330 330
Fee for Service ($)
* Enrolment figure as at Feb 2004 = Confirmed
Source: OPIS
/tt/file_convert/5b3c38097f8b9a0e628d7524/document.doc

PLANNING TEMPLATE Page 12 of 61
HIGHER EDUCATION PROFILE
Commonwealth Operating Grant Australian Fee Paying International Onshore
2003 2003 2004 2005 2006 2003 2003 2004 2005 2006 2003 2003 2004 2005 2006
Actual* Profile Profile Profile Profile Actual Profile Profile Profile Profile Actual* Profile Profile Profile Profile
PG Res 66.2 75.5 37.4 19.2 10.0 30.5 29.9 23.1 26.2 29.0 22.0 22.9 20.1 31.8 44.7
PG CWK 24.0 14.3 6.8 2.2 0.7 721.3 745.7 673.1 753.8 791.6 330.4 408.2 358.7 407.5 432.5
UG 2708.1 2783.9 2,515.9 2,430.9 2,399.2 211.6 154.5 147.8 161.4 185.2 1,435.2 1498.3 1,585.5 1,687.7 1,830.4
Total 2,796.3 2873.6 2,560.1 2,452.3 2,409.9 963.5 930.0 844.0 941.4 1,005.8 1,787.6 1929.3 1,964.3 2,127.0 2,307.6
International Offshore Other Total
2003 2003 2004 2005 2006 2003 2003 2004 2005 2006 2003 2003 2004 2005 2006
Actual* Profile Profile Profile Profile Actual Profile Profile Profile Profile Actual* Profile Profile Profile Profile
PG Res 3.8 11.0 3.3 2.9 2.8 14.0 0 10.3 6.0 10.0 134.5 139.2 94.1 86.2 96.5
PG CWK 299.9 281.2 283.6 333.3 331.1 0.3 0 78.0 107.4 116.2 1,375.8 1449.3 1,400.2 1,604.2 1,672.2
UG 2751.6 2881.1 3,100.2 3,358.6 3,532.2 153.3 208.8 284.6 373.6 395.8 7,259.5 7529.5 7,634.2 8,012.1 8,342.7
Total 3055.2 3176.4 3,387.1 3,694.8 3,866.1 167.3 208.8 372.9 487.0 522.0 8,769.8 9118.1 9,128.5 9,702.5 10,111.4
Source: OPIS
Note that the above tables show the consolidated profile context incorporating the schools within Business as well as the figures within the Office of the PVC: Business. The figures from the Office of the PVC: Business are attached separately, as are the Business plans for the six schools.
/tt/file_convert/5b3c38097f8b9a0e628d7524/document.doc

PLANNING TEMPLATE Page 13 of 61
SECTION C: OPERATING BUDGET 2004-2006
/tt/file_convert/5b3c38097f8b9a0e628d7524/document.doc
PLANNING TEMPLATE Page 14 of 61
Notes on Financials
The Hybrid Model:Care must be taken when comparing the financials from 2003 to 2004 as a change in the University’s methodology occurred in 2004. In 2003 the model was profit centre accounting whereby all the gross revenue was distributed to profit centres and University overheads were all charged as an expense below the gross contribution line. In 2004 this has changed to a hybrid model whereby some University overheads and capital expenditure are funded off the top and some other overheads are charged as expenses below the gross contribution line. This has resulted in reduced revenue distributed to profit centres, which has lead to diminished operating results. The comparison from 2004 on is more meaningful.
Assumptions used for 2005 and 2006:
The financials have been generated based on a status quo approach using currently available student profile data. Tuition fee revenue forecasts has been aligned to the student profile movements; salaries and on-costs have been increased by the proposed EB amounts, 4% in 2003 and 5% in 2004; and expenses have been increased by 3% per annum to reflect CPI increases. This simplistic approach has been used as program reviews; student profile targets; and detailed workforce planning are works in progress. The financial projections for 2005 and 2006 are only a first cut snapshot and are subject to change.
Business TAFE School
The Business TAFE School’s financial projections show a decline in revenue due to the impact of the profile for 2005 and 2006, which was developed in 2003. The profile contains significant reductions in student contact hours from the phasing out of old programs. These delivery reductions have yet to be reflected against the expenses. The TAFE Schools financials are in the formation stage and therefore cannot be relied on to give an accurate indication of projected performance.
/tt/file_convert/5b3c38097f8b9a0e628d7524/document.doc

PLANNING TEMPLATE Page 15 of 61
SECTION D: SCORECARDS
LEARNING AND TEACHING SCORECARD
In consultation with other members of VCE, as appropriate, PVCs to select relevant indicators from Learning and Teaching, Regional and Community and International (refer to Section 7) and develop targets, which will be agreed to by the Vice-Chancellor
Indicators in Strategic Plan Measured by: Data Source Portfolio Performance 2003
Portfolio Target2004
Portfolio Target2005
Portfolio Target2006
Status(Exceeding, On target, unlikely
to meet)Teaching Quality CEQ good
teaching agreement (HE)
CEQ
Program Leaders’ AR (These reports have not been submitted to the PVC)
38.9% 39% 41% Above national average of 46%
Given the lagging nature of CEQ as an indicator it is unlikely that the efforts of the Portfolio in 2004 will result in significant improvement in CEQ data until 2006 at the earliest
SOS good teaching instruction (VET)
SOS
Program Leaders’ AR (These reports have not been submitted to the PVC)
69.5% 70% 72% Above state average of 73.2%
Completion Rates Student Load Progress Rate (HE)
Planning Group
2002 Only:87.9%
88 90 92% -5% over the national average: 87% (2001)
On target
Module Load Planning 80.2% 81 82 81% - 5% over Exceeding
/tt/file_convert/5b3c38097f8b9a0e628d7524/document.doc

PLANNING TEMPLATE Page 16 of 61
Indicators in Strategic Plan Measured by: Data Source Portfolio Performance 2003
Portfolio Target2004
Portfolio Target2005
Portfolio Target2006
Status(Exceeding, On target, unlikely
to meet)Completion Rate (VET)
Group the state average:76.1% (2002)
Retention rates year to year
Unknown At or above national average within relevant FoS
Given the absence of information on current performance it may be difficult to achieve 2006 target until the scale of the gap is addressed
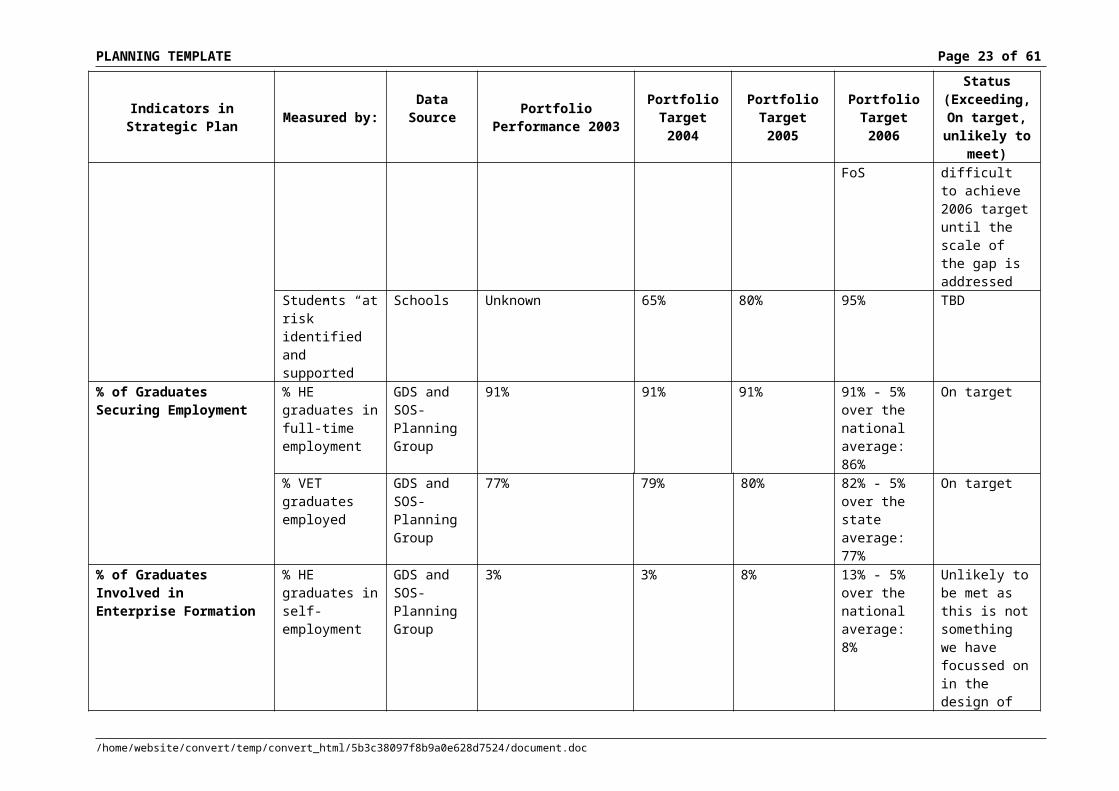
Students “at risk” identified and supported
Schools Unknown 65% 80% 95% TBD
% of Graduates Securing Employment
% HE graduates in full-time employment
GDS and SOS-Planning Group
91% 91% 91% 91% - 5% over the national average:86%
On target
% VET graduates employed
GDS and SOS-Planning Group
77% 79% 80% 82% - 5% over the state average:77%
On target
% of Graduates Involved in Enterprise Formation
% HE graduates in self-employment
GDS and SOS-Planning Group
3% 3% 8% 13% - 5% over the national average:8%
Unlikely to be met as this is not something we have focussed on in the design of our programs
% VET graduates in self-employment
GDS and SOS-Planning Group
3% 7% 11% 5% over the state average:11%
Unlikely to be met as this is not something which is a major goal in the development of competences set
/tt/file_convert/5b3c38097f8b9a0e628d7524/document.doc

PLANNING TEMPLATE Page 17 of 61
Indicators in Strategic Plan Measured by: Data Source Portfolio Performance 2003
Portfolio Target2004
Portfolio Target2005
Portfolio Target2006
Status(Exceeding, On target, unlikely
to meet)out in the National Training Packages
Graduate Capability
% of programs implementing a capability driven curriculum (HE)
Program approval process
20% 35% 70%
100% of core courses
90% of programs
On target
% of programs implementing a competency based curriculum (VET)
Program approval process
40% 60% 80% 80% of programs
On target for those awards offered by Business TAFE which are competency based
/tt/file_convert/5b3c38097f8b9a0e628d7524/document.doc

PLANNING TEMPLATE Page 18 of 61
BUSINESS PORTFOLIO TEACHING AND LEARNING SCORECARD
T&L Priorities in Business Portfolio Plan Measured by: Data Source Portfolio Performance
2003
Portfolio Target2004
Portfolio Target2005
Portfolio Target2006
Status(Exceeding, On target, unlikely
to meet)Student choice: Models for “Business with everything” for TAFE and HE
Enrolments of students from other portfolios in Business competences and courses
Collaborative teaching with Business staff involved in delivery with staff of other portfolios
AMS
Planning Unit
Common stem and stream architecture for all Business degrees but all run as separate programs
Common core of business competences for TAFE programs
Plans for a single B Bus degree with multiple streams to commence in 2006
Models for “Business with everything” for TAFE and HE
Cross portfolio delivery with Business involvement in teaching up 10% on 2003
Cross portfolio delivery with Business involvement up 50% on 2003
On target
Student capabilities: Outcomes oriented staff development
Participation of staff in workshops to re-design course guides and improve teaching quality delivering capability and competence outcomes for students
SIM
Schools and Academic Development Unit statistics on course guide renewals and staff participation rates
Two undergraduate degrees and two postgraduate degrees fully renewed
Majority of TAFE awards with Training Package Implementation plans developed
35% of core courses in HE specialist streams and competence based TAFE courses revised through action learning approach
100% of core courses in HE specialist streams and competence based TAFE courses revised through action learning approach
100% of programs renewed to have a capability/ competence focus
On target
Offshore Students - Quality assurance and student feedback
Student feedbackPartner feedback
Audit reports and student and partner feedback
Patchy; characterised by ad hoc approaches at program level; no consistency across all offerings
Development of prioritised action plan and commence implementation
Complete implementation; evaluate effectiveness
On target
Student employability: RMIT Business and Work Integrated Learning (WIL)
WIL related course enrolments
AMS WIL much talked about; co-op in almost all undergrad degrees for
Plan to embed WIL explicitly in all Business
100% by end 2005
100% On target
/tt/file_convert/5b3c38097f8b9a0e628d7524/document.doc

PLANNING TEMPLATE Page 19 of 61
BUSINESS PORTFOLIO TEACHING AND LEARNING SCORECARD
T&L Priorities in Business Portfolio Plan Measured by: Data Source Portfolio Performance
2003
Portfolio Target2004
Portfolio Target2005
Portfolio Target2006
Status(Exceeding, On target, unlikely
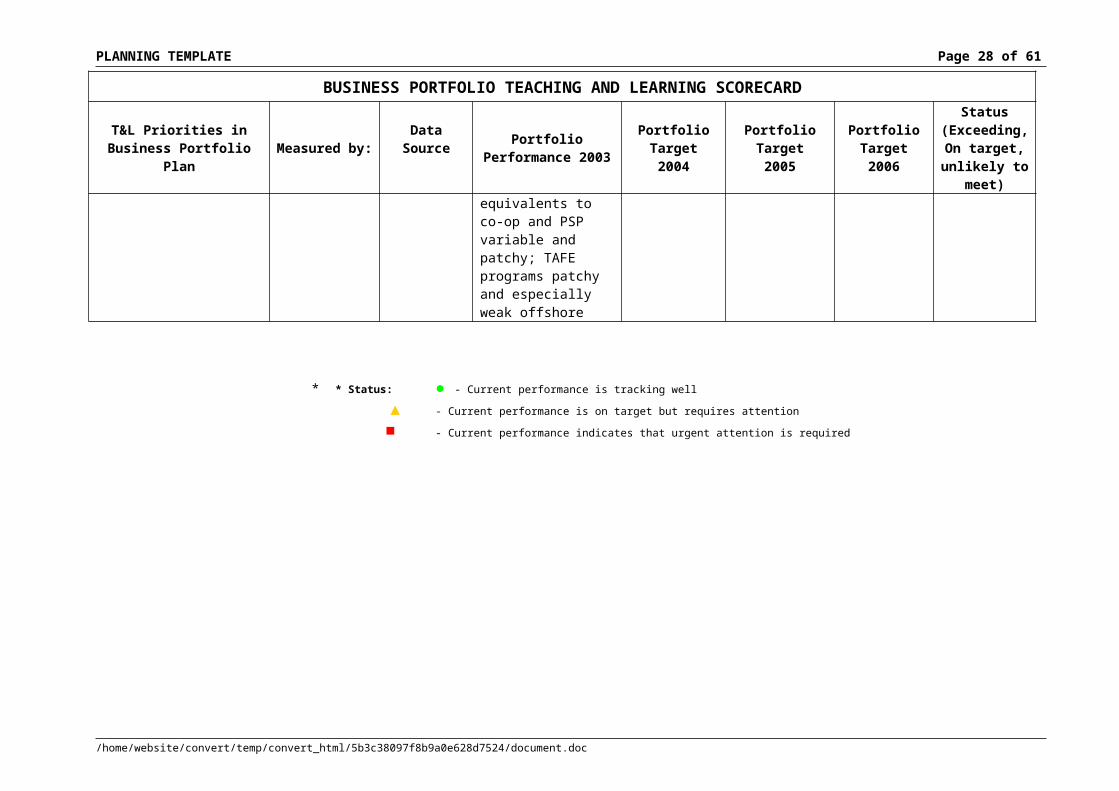
to meet)onshore FT students, Professional Skills Program available onshore and FT only; offshore and PT equivalents to co-op and PSP variable and patchy; TAFE programs patchy and especially weak offshore
programs, on and offshore, TAFE and HE, FT and PT, 40% by 2004
* * Status: ● - Current performance is tracking well
▲ - Current performance is on target but requires attention
■ - Current performance indicates that urgent attention is required
RESEARCH AND DEVELOPMENT SCORECARD
/tt/file_convert/5b3c38097f8b9a0e628d7524/document.doc

PLANNING TEMPLATE Page 20 of 61
In consultation with other members of VCE, as appropriate, PVCs to select relevant indicators from Research and Development, Regional and Community and International (refer to Section 7) and develop targets, which will be agreed to by the Vice-Chancellor
Indicator in Strategic Plan
Measured by: Data Source
Portfolio Performance 2003 Portfolio Target 2004 Portfolio Target 2005
Portfolio Target
2006
Status(Exceeding, On target, unlikely to
meet)DEST Reportable Research Income
DEST audited research income by category ($ and % mix)
R&IRDU DEST
Category$ %
Research Grant – State Govt
435,874 37.5
CRC Research Grants
12,500 1.1
Research Grants - Other Govt
196,119 17
Research Grant Non –Govt
323,736 27.8
Research Grant – International
23,578 2
Research Grant Non Govt Donations
35,993 3.1
Research Grants Non Govt S’ships
6,250 0.5
Research Grants Non Govt Coll.
87,412 7.5
ARC Large Grants
11,592 1
ARC Infrastructure Block Grant
30,000 2.5
TOTAL 1,163,054 100
DEST Category $ %CRC Research Grants
1,033,298 55.1
Research Grants - Other Govt
86,000 4.6
Research Grant Non –Govt
434,863 23.1
Research Grant – International
56,000 3.05
Research Grant Non Govt Donations
1,000 .05
Research Grants Non Govt Coll
30,000 1.6
ARC Large Grants
89,091 4.7
ARC Infrastructure Block Grant
77,221 4.1
ARC APA Industry
68,533 3.7
TOTAL $1,876,006 100
$2,400,000(100% increase on 2001 income: $1,522,136)
TOTAL: $3,044,272
Unlikely to meet target for 2006. 2001 income included TRC research income which was closed in 2002. Needs research investment strategy.
/tt/file_convert/5b3c38097f8b9a0e628d7524/document.doc

PLANNING TEMPLATE Page 21 of 61
Indicator in Strategic Plan
Measured by: Data Source
Portfolio Performance 2003 Portfolio Target 2004 Portfolio Target 2005
Portfolio Target 2006
Status(Exceeding, On target, unlikely to
meet)DEST Reportable Research Income
# of research only staff
RDU Schools to provide
data
300% increase on 2001 (2001 data is not available)
# of research active staff per grant application
Supervisor registration
1 application: 2 staff 3 applications: 5 staff 5 applications: 7 staff
200% increase on 2001:6 applications: 9 staff
On target
# of research active staff (using ATN definition)
Supervisor registration 75% of
academic workplans recognising research activity
100% of academic workplans taking into account research activity
On target
/tt/file_convert/5b3c38097f8b9a0e628d7524/document.doc
School #Marketing 3.6Economics & Finance
2
Management 7RDU 7CQM 1.5BIT 1Portfolio Office 1TOTAL 23.1
School #Marketing -Economics & Finance
2
Management 2RDU 9.5CQM 1.5BIT 2Portfolio Office
1
TOTAL 18
School #Accounting 14BIT 21Economics & Finance
16
Marketing 21Management 27Portfolio Office 12TOTAL 11160.9% academic staff
School #Accounting 13BIT 20Economics & Finance
15
Marketing 16Management 27Portfolio Office 14TOTAL 54.7% academic staff
105

PLANNING TEMPLATE Page 22 of 61
Indicator in Strategic Plan
Measured by: Data Source
Portfolio Performance 2003 Portfolio Target 2004 Portfolio Target 2005
Portfolio Target 2006
Status(Exceeding, On target, unlikely to
meet)% of HDR completions within DEST funded time
R&IRDU
Not available – pending Research Master
Not available – pending Research Master
Not available – pending Research Master
100% completion within time
Not available – pending Research Master
% of staff on academic supervisor register
Supervisor Register
Total academic staff March 2003 (FTE): 182.4
Total academic staff March 2004 (FTE): 191.7
50% of academic staff on supervisor register participating in supervision
50% of academic staff on supervisor register participating in supervision
On target
Research Publications
DEST Weighted R & IRDU
210 confirmed publications
(12 publications have been referred to the Expert Panel set up by R&I for review)
10% increase on previous year10% increase on previous year
At national average in terms of publications per research active staff
On target
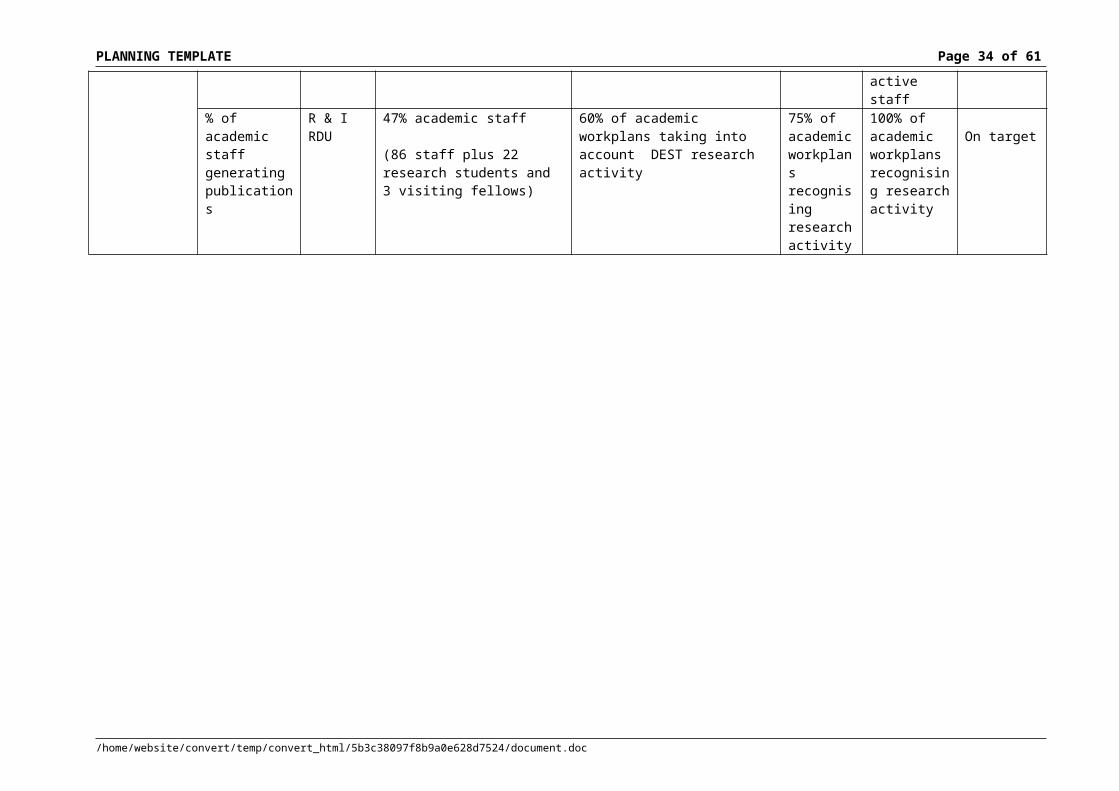
% of academic staff generating publications
R & IRDU
47% academic staff
(86 staff plus 22 research students and 3 visiting fellows)
60% of academic workplans taking into account DEST research activity
75% of academic workplans recognising research activity
100% of academic workplans recognising research activity
On target
/tt/file_convert/5b3c38097f8b9a0e628d7524/document.doc
School # %Accounting 14 7.7BIT 21 11.5Economics & Finance
16 8.8
Marketing 21 11.5Management 27 14.8Portfolio Office
12 6.6
TOTAL 111 60.9
School # %Accounting 13 6.8BIT 20 10.4Economics & Finance
15 7.8
Marketing 16 8.3Management 27 14.1Portfolio Office
14 7.3
TOTAL 105 54.7
PLANNING TEMPLATE Page 23 of 61
Indicator in Strategic Plan Measured by: Data Source Portfolio Performance
2003
Portfolio Target 2004
Portfolio Target 2005
Portfolio Target 2006
Status(Exceeding, On target, unlikely
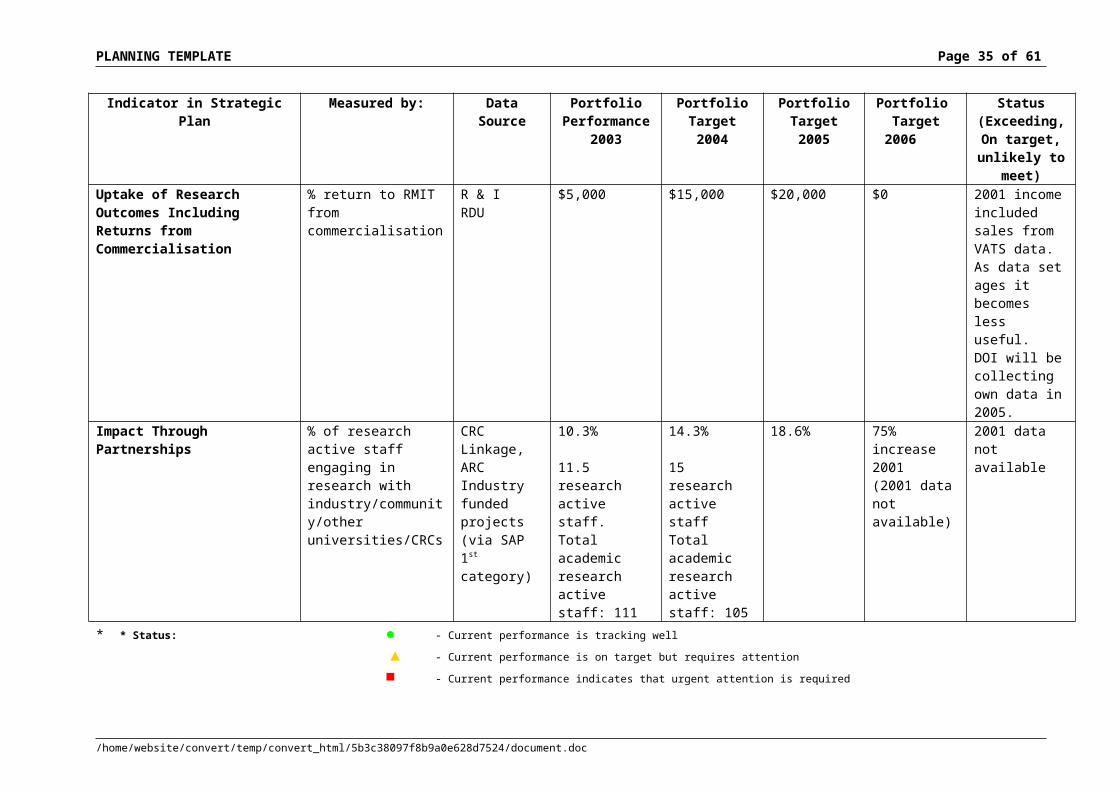
to meet)Uptake of Research Outcomes Including Returns from Commercialisation
% return to RMIT from commercialisation
R & IRDU
$5,000 $15,000 $20,000 $0 2001 income included sales from VATS data. As data set ages it becomes less useful. DOI will be collecting own data in 2005.
Impact Through Partnerships % of research active staff engaging in research with industry/community/other universities/CRCs
CRC Linkage, ARC Industry funded projects (via SAP 1st category)
10.3%
11.5 research active staff.Total academic research active staff: 111
14.3%
15 research active staffTotal academic research active staff: 105
18.6% 75% increase 2001(2001 data not available)
2001 data not available
* * Status: ● - Current performance is tracking well
▲ - Current performance is on target but requires attention
■ - Current performance indicates that urgent attention is required
/tt/file_convert/5b3c38097f8b9a0e628d7524/document.doc

PLANNING TEMPLATE Page 24 of 61
ORGANISATION AND MANAGEMENT SCORECARD
In consultation with other members of VCE, as appropriate, PVCs to select relevant indicators from Staffing and Resources (refer to Section 7) and develop targets, which will be agreed to by the Vice-Chancellor
Indicator in Strategic Plan Measured by: Data Source Performance 2003
Portfolio Target 2004
Portfolio Target 2005
Portfolio Target 2006
Status(Exceeding, On target, unlikely
to meet)Highly effective and responsive student support services
% and speed of resolution of formal student complaints
People Services Business: 82% overall resolved. (Details not kept on time frame of resolution)
85% resolved within 1 fortnight, remainder resolved within 1 month of submission
90% resolved within 1 fortnight, remainder resolved within 1 month of submission
95% resolved within 1 week, remainder resolved within 1 month of submission
Likely
% of Staff Initiated Turnover (not vdp’s)
Staff Initiated Turnover (not vdp’s)
People Services 12% 10% 10% Less than 10% p.a.
% of academic/ teaching staff with industry activity included within the workplan
To be consideredas part of the development of the staff profile in 2004
More than 80% TBD
Number of applicants who meet key selection criteria per position
Collected by People Services
Unknown 30% p.a. 30% p.a. 30% p.a. TBD
Return on Revenue To be determined
Data not held centrally
Unknown TBD TBD TBD TBD
Health and Safety Fully implemented OH & S strategy
Chair OH & S Committee: currently Damian Barry
Processes will be put in place
Date to be confirmed: consistent with People Services processes
TBD TBD TBD
/tt/file_convert/5b3c38097f8b9a0e628d7524/document.doc

PLANNING TEMPLATE Page 25 of 61
BUSINESS PORTFOLIO ORGANISATION AND MANAGEMENT SCORECARD
Organisation and Management Priorities in
Business Portfolio PlanMeasured by:
Data Source Portfolio Performance 2003
Portfolio Target2004
Portfolio Target2005
Portfolio Target2006
Status(Exceeding, On target, unlikely to
meet)Student services: Improve quality of student services and integration as key support systems to enhance learning
Related improvements in CEQ scores over time
SSC to advise Unknown Metrics agreed and current levels of student satisfaction understood
3% improvement over 2004
5% improvement over 2004
TBD
Offshore Students: Appropriate integration of RMIT student services, policies, practices and procedures for all offshore offerings
Student feedback
Partner feedback
Annual program reports
Audit reports
Extremely varied and different from one program to another and one partner to another
TBD
Sessional staff capability: Develop sessional staff capability to support achievement of Portfolio vision for student learning
Participation of sessional staff in workshops
Student feedback
Records of participation
Virtually no PD for sessionals other than induction
PD designed and piloted
Participation by at least 40% of sessional staff teaching at least 10 hours
Participation by at least 80% of sessional staff teaching at least 10 hours
TBD
Student transition: Develop strategies for student transition appropriate to all major student groups in RMIT Business
Student completions – module and course and program
Student satisfaction
Student completions – module and course and program
Increasing collaboration on Orientation under Student Services leadership
On target
Implement the new school of TAFE
TBD TBD TBD Complete implementation
Establish a Business Graduate School
TBD TBD TBD Complete planning phase
Application for EQUIS accreditation
/tt/file_convert/5b3c38097f8b9a0e628d7524/document.doc

PLANNING TEMPLATE Page 26 of 61
BUSINESS PORTFOLIO ORGANISATION AND MANAGEMENT SCORECARD
completed * * Status: ● - Current performance is tracking well
▲ - Current performance is on target but requires attention
■ - Current performance indicates that urgent attention is required
/tt/file_convert/5b3c38097f8b9a0e628d7524/document.doc

PLANNING TEMPLATE Page 27 of 61
SECTION E: PORTFOLIO WORKPLAN
The Portfolio workplan section should be structured using the following sections (as per the Strategic Plan)o Learning and Teachingo Research and Developmento Organisation and Management
Strategies should be categorised as per the Budget management processo 2004 Identified University Strategic Activitieso Change Activities (support a move from existing policy or practice to new policy/practice)o Core Operational Activities (support achievement of operational targets)
IMPLEMENTATION
Clear responsibilities, timeframes and resources should be allocated to the strategies within the workplan, which will inform individual staff workplans and performance reviews to ensure that staff are aware of their responsibilities. Key milestones and achievements should be reported and celebrated along the way.
/tt/file_convert/5b3c38097f8b9a0e628d7524/document.doc
PLANNING TEMPLATE Page 28 of 61
1. LEARNING AND TEACHING
RMIT BUSINESS PRIORITY ACTION FOR 2004: To improve teaching quality and the relevance and viability of programs.
/tt/file_convert/5b3c38097f8b9a0e628d7524/document.doc

PLANNING TEMPLATE Page 29 of 61
Key Result Area
Outcome Strategies Timeframe Overall Responsibility
Resources Required
Identified University Strategic and Change ActivitiesAcademic linkage and co-coordination
Relates to Business T&L Priority
Student choice: Models for “Business with everything” for TAFE and HE
Enrolments of students from other portfolios in Business competences and courses
Collaborative teaching with Business staff involved in delivery with staff of other portfolios
Build and enhance connections between Business portfolio and other portfolios, and interpret and translate policies and strategic directions to staff
Models for “Business with everything” for TAFE and HE (Also see below - Plan for a single B Bus degree with multiple streams to commence in 2006)
Develop strategic paper setting out issues and approaches leading to adoption by Business and other Academic Portfolios Portfolio of an agreed action plan by November 2004
PVCDean AcHoS
Assistance from other portfolios:AcademicT&LStudents
Program Quality and Relevance
Relates to Business T&L Priority
Student capabilities: Outcomes oriented staff development
Participation of staff in workshops to re-design course guides and improve teaching quality delivering capability and competence outcomes for students
Program renewal and Training Package implementation planning in selected areas
Staff development on capability / competence (through workshops on revising their course guides) - Course redevelopment in all specialist streams and core competences to redevelop assessment and revise course guides to embed capability / competence focus through educational design and assessment
Continue work on common core and linkages to B Bus suite of programs and to improve TAFE articulation
List approved by Programs committee completed for delivery in 2005
35% of HE and TAFE courses developed/ renewed by end 2004, 100% by end 2005
60% of academic staff
PVCDean AcHoS
Assistance from other portfolios:AcademicT&L (especially CID Group)Students (especially Registrar’s Office)Planning and Quality Unit
/tt/file_convert/5b3c38097f8b9a0e628d7524/document.doc

PLANNING TEMPLATE Page 30 of 61
Key Result Area
Outcome Strategies Timeframe Overall Responsibility
Resources Required
trained in 2004, remainder by end 2005
/tt/file_convert/5b3c38097f8b9a0e628d7524/document.doc

PLANNING TEMPLATE Page 31 of 61
Key Result Area
Outcome Strategies Timeframe Overall Responsibility
Resources Required
Viability: Common Architecture
Relates to Business T&L Priority
Student choice: Models for “Business with everything” for TAFE and HE
Enrolments of students from other portfolios in Business competences and courses
Collaborative teaching with Business staff involved in delivery with staff of other portfolios
Explore optimising economies of scale by offering one undergraduate degree for whole Portfolio with multiple streams
Develop an open architecture approach for TAFE and HE awards to enable students to integrate “Business with everything”
Plan with key milestones and deadlines by November 2004
Relevant University approvals for approval for single degree by key dates in 2005 (eg VTAC)
PVCDean AcHoS
Assistance from other portfolios:AcademicT&LStudents
/tt/file_convert/5b3c38097f8b9a0e628d7524/document.doc

PLANNING TEMPLATE Page 32 of 61
Key Result Area
Outcome Strategies Timeframe Overall Responsibility
Resources Required
Work Integrated Learning
Relates to Business T&L Priority:
Student employability: RMIT Business and Work Integrated Learning (WIL)
WIL related course enrolments
Work integrated learning focus in priority programs for both FT and PT students
Run a one-day conference for co-op students (in School of Marketing) to present their reflections on their placements to employers, year 2 students about to commence co-op, and academic staff. Conference to be organised professionally eg call for papers, selections of abstracts, poster sessions etc
Investigate potential to implement peer review procedures to increase linkages to practice based research industry focussed outcomes
WIL component in all B Bus degrees, on and offshore, and FT and PT, by end 2004
Pilot Co-op conference in September
PVCStaff in OPVCDean AcDean R&I Ho S MarketingSchool of MarketingADU / WIL Unit
Support and advice required from OPVC, WIL Unit and advice also required from relevant staff in other Schools
Support from Marketing Unit for use of web site for promotion and from WIL Unit for generic brochure
/tt/file_convert/5b3c38097f8b9a0e628d7524/document.doc

PLANNING TEMPLATE Page 33 of 61
Key Result Area
Outcome Strategies Timeframe Overall Responsibility
Resources Required
Proposed cross-disciplinary initiatives (double degrees, dual awards, service teaching, course sharing)
Relates to Business T&L Priority
Student choice: Models for “Business with everything” for TAFE and HE
Enrolments of students from other portfolios in Business competences and courses
Collaborative teaching with Business staff involved in delivery with staff of other portfolios
Cross portfolio project with Engineering on double degree development, delivery and academic service delivery – aiming to develop - Streamlined pathways for double degree options- Evolution of minor specialist streams in Business for rapid inclusion on other
degrees - Ways to make the double degree experience more coherent and integrated eg shared
projects, a capstone course, etc. and ways which provide students with the sense they are welcome in both Portfolios
- Single set of rules governing for example the award of a faculty pass- Ways to address practical difficulties for students - logistics of schedules and
students' convenience to be considered - School of Management and relevant SET schools to work together on course
revisions to have assessments of business related capabilities embedded into engineering design projects and assessed jointly by Business and Engineering staff
Some shared projects and cross SET – Business teaching and assessment in existing double degrees in Semester 2 2004
Issues paper by August 2004
PVC: BusinessDean AcHead of School of Management HoS
Assistance from other portfolios:Academic especially SETT&LStudents (student Services and Registrar’s office)Property Services (re timetabling)
/tt/file_convert/5b3c38097f8b9a0e628d7524/document.doc
PLANNING TEMPLATE Page 34 of 61
Key Result Area
Outcome Strategies Timeframe Overall Responsibility
Resources Required
Flexible delivery initiatives
Relates to Business T&L Priority
Student choice: Models for “Business with everything” for TAFE and HE andOffshore Students - Quality assurance and student feedback
Enrolments of students from other portfolios in Business competences and courses
Collaborative teaching with Business staff involved in delivery with staff of other portfolios
Student feedback
Partner feedback
Completion of electronic resources for flexible delivery of MBA into Vietnam, China and other offshore locations, with content available to be incorporated as support for local offerings and industry short courses.
Review of electronic flexible resources exiting for common core courses in both Diploma of Business and Bachelor of Commerce, with a view to increasing usage across all offerings.
The development of online resources for the following in Vietnam: the Bachelor of Finance, the Bachelor of Marketing and the Bachelor of Logistics.
Alberton Management College:Implementation of an improvement strategy of issues identified in the AUQA report
End of 2004
2004
Completion by end of 2004
Business Online T&L HoS Management HoS TAFEADU
TBD Likely ADU
PVC:BusinessDean Ac
Assistance from other Portfolios:IECDT&L
Some initial resources have been designated.Further resources will need to be sought.
Dissolving the Boundaries
Relates to Business T&L Priority
Student choice: Models for “Business with everything” for TAFE and HE
Enrolments of students from other portfolios in Business competences and courses
Collaborative teaching with Business staff involved in delivery with staff of other portfolios
Systematic approach to granting and evaluating advanced standing
Clearly documented articulation pathways between TAFE and HEAnalyse and address problems with advanced standing
Develop a record of current articulation arrangements for Melbourne, RIUV and Singapore
Plan to develop associate degrees for offshore delivery in 2005
Assoc Deans InternationalHo S TAFEHoS HEDean Ac
Assistance from other portfolios:IECDStudents
/tt/file_convert/5b3c38097f8b9a0e628d7524/document.doc
PLANNING TEMPLATE Page 35 of 61
Key Result Area
Outcome Strategies Timeframe Overall Responsibility
Resources Required
Regional and International Activity
Business Development
Hong Kong Role of Transport & Logistics at HKMA Implementation of travel cost project at HKMA Proposal to articulate an HKMA Assoc Degree into RMIT fulltime programs. Property Specialisation at HKMA Investigate role in PRC with HKMA
China Implementation of articulation arrangements at China partners. Consolidate operations at South China Normal University Decision on WUST diploma pathway. Investigate Master of Commerce at SCNU and/or WUST with IELTS of 6.0 or REW
pathway with 4 courses in China and 8 courses at RMIT. Develop list of target universities in line with China strategy. Implement the SUFE Master by Research project from China and elsewhere.
Singapore Clear articulation pathway to SIM and English language entrance requirements. All undergraduate programs contracts expire in December 2004. There is a need to
review and introduce changes. Implementation of travel costs project BB (Marketing) scheduled to start in January 2005 at SIM
Business development at Informatics:Bachelor of Education in Early Childhood EducationDiploma in FashionExpansion of current program to Hong Kong and to Karachi
Malaysia Review RMIT Business in Malaysia strategy
IndonesiaPossible implementation of SUPRA diploma pathway for articulation to SIFT, SIM or Melbourne
2004
2005
2004
June 20042004
2004
2004
2004
Assoc Deans International
Within existing resources
/tt/file_convert/5b3c38097f8b9a0e628d7524/document.doc

PLANNING TEMPLATE Page 36 of 61
Key Result Area
Outcome Strategies Timeframe Overall Responsibility
Resources Required
Strengthen current procedure
General Exchange rate risk management approach by RMIT as part of broader business risk
management strategy. Insurance issues to be looked at by People Services Improve connectivity to RMIT infrastructure Operations manual International study experience (student exchange, study tours, offshore students
studying in Melbourne comprising over 500 students): consolidation
2004
Regional and International Activity
Strengthen current procedures
CommercialStrategy
Moderation manuals English language entrance requirements to be further clarified and communicated Assistance to partners in areas of articulation including visits to sources of students Offshore teaching improvements projects
- conditions for offshore teachers- service teaching costs project- pay rates for offshore teaching
Portfolio role in co-ordinating RMIT and Portfolio study tours
Developing Partnerships Make an assessment of current relationship building rather than focus on tenders Create a steering committee for commercial relationships in the Portfolio including
Schools, Business Direct and Centres, and so on. Focus on using the most appropriate people to meet the needs of the client rather than an internal focus
Develop a university commitment to partnerships and rewards for staff. Seek to develop links, alliances, etc
Reputation Use the launch of the Graduate School of Business to reinvigorate marketing
including the website and to provide a focus point for the outside world on RMIT Business
Carry out perceptions survey using Alumni, Post Graduate Programs, Program Advisory Committees and corporate clients
Infrastructure Develop new career paths at RMIT recognising research, teaching and commercial
activity plus an associated performance management system Improve contract processing time – appoint a Portfolio Manager for contracts
2004
2004
Assoc Deans International
PVC: BusinessHOSAssociate Deans
Within existing resources
/tt/file_convert/5b3c38097f8b9a0e628d7524/document.doc

PLANNING TEMPLATE Page 37 of 61
Key Result Area
Outcome Strategies Timeframe Overall Responsibility
Resources Required
Begin process of developing 2 or 3 areas of cross business/industry expertise (curriculum, research and practice) supported by 15-20 active business people working in these areas as part time staff, on joint appointments and RMIT staff in positions in Business
/tt/file_convert/5b3c38097f8b9a0e628d7524/document.doc

PLANNING TEMPLATE Page 38 of 61
2. RESEARCH AND DEVELOPMENT Key Result Area
(Dot points provide example issues for consideration)
Outcome (Relevant KPI
from Scorecard)
Strategies (What)(Broad actions to achieve the
outcomes)
Timeframe(By When)
Overall Responsibility
(Who)(note where others
involved)
Resources Required(Note whether Additional or Within
existing Budget and Staff resources)
Identified University Strategic ActivitiesAUQA R&D recommendations
Monitoring of research supervision: quality
Ongoing Dean (R&I)Portfolio Research Committee
Within existing RDU Budget
Nelson Review To be determined
Await decision re. Nelson.Contribute to discussions.Consider models.The allocation of resources and other actions are subject to decision.
TBD Dean (R&I)Portfolio Research Committee
Within existing RDU Budget
Change ActivitiesResearch Growth New Grants (domestic,
international) Commercialisation initiatives Research consultancies
DEST Reportable research income
Mentoring ARC grant applicationsReview the positioning of CRCs in terms of the portfolio, and the engagement of CRCs in partnerships
Ongoing 2005 Dean (R&I)Portfolio Research Committee
Within existing RDU Budget
Core Operational ActivitiesResearch Management Research completions Supervisor training HDR support Progress Internal reviews
HDR completions within DEST funded time
Student facilityStudent support fundSupervisor registrationSupervisor training & development
Ongoing 2005 Dean (R&I)Portfolio Research Committee
Within existing RDU Budget
Research Income Grants Management Publications Income generation
DEST Reportable incomeResearch publications
Mentoring ARC grant applicationsPositioning in CRCsPublications auditStaff workplans
Ongoing 2005 Dean (R&I)Portfolio Research Committee
Within existing RDU Budget
Teaching/Research Nexus Research into teaching and
learning
TBD A plan for the development of links between teaching and learning as well as research and innovation will be developed.Research seminars.Opportunities for scholarship on teaching and learning/research will be sought.
Plan developed 2004
Dean (R&I)Portfolio Research Committee
Implementation of the plan will depend on budget.Seminars can occur within budget.Conferences and other major events will be constrained by budget.
/tt/file_convert/5b3c38097f8b9a0e628d7524/document.doc

PLANNING TEMPLATE Page 39 of 61
/tt/file_convert/5b3c38097f8b9a0e628d7524/document.doc

PLANNING TEMPLATE Page 40 of 61
3. ORGANISATION AND MANAGEMENT
/tt/file_convert/5b3c38097f8b9a0e628d7524/document.doc

PLANNING TEMPLATE Page 41 of 61
Key Result Area
(Dot points provide example issues for consideration)
Outcome (Relevant KPI from Scorecard)
Strategies (What)(Broad actions to achieve the
outcomes)
Timeframe(By When)
Overall Responsibility
(Who)(note where others
involved)
Resources Required(Note whether Additional or
Within existing Budget and Staff resources)
Identified University Strategic and Change ActivitiesAcademic Portfolio Implementation
Establishment of a TAFE school
Establishment of a Graduate school
Business Direct
School of Marketing
The merging of TAFE staff from five schools into one separate school is currently being managed by the Associate Director Business TAFE.Refinement of the implementation. Project manager has been appointed.Monitor, review and project management cycle.
The Business Graduate School: consultative process/project is in action.New Head to begin in semester 1 who will manage the planning and implementation according to the findings of the project report (due end of May).A formal plan will then be constructed for implementation.Plan to be presented to VCE.
Implementation of review recommendations
Completion and implementation of review recommendations
2004
Planning completed by 2004
Implementation completed by the end of 2004
Implementation completed by the end of 2004
PVC: BusinessAssociate Director/HOS Business TAFE
PVC: BusinessHead of the Graduate School
PVC: Business
PVC: BusinessHoS: Marketing
The PVC: Business Office will identify needs and the adequacy of resources (both existing and planned) in order to meet these new initiatives.
Within existing resources
Within existing resources
Nelson – HE positioning & reform implementation
To Be Determined Await decision re. Nelson.Contribute to discussions.Consider models.The allocation of resources and other actions are subject to decision.
PVC: BusinessDirector of Academic Services
/tt/file_convert/5b3c38097f8b9a0e628d7524/document.doc

PLANNING TEMPLATE Page 42 of 61
Key Result Area
(Dot points provide example issues for consideration)
Outcome (Relevant KPI from Scorecard)
Strategies (What)(Broad actions to achieve the
outcomes)
Timeframe(By When)
Overall Responsibility
(Who)(note where others
involved)
Resources Required(Note whether Additional or
Within existing Budget and Staff resources)
Change ActivitiesStaff Capabilities Staff Development
initiatives (including upgrading qualifications)
Research/Teaching Appointments
Staff Planning (refer to Workforce Profile)
TBD A three year staff profile forecast and recruitment plan will be developed.
End 2004 The service integration project in conjunction with key managers in the Business portfolio
Revenue Growth Refer to research growth and
program development/ commercialisation initiatives
Meet targets in projected budgets
Actively seek to further develop industry research partners, consultancy opportunities, opportunities for commercialisation both locally and internationally
2004 PVC: Business Within existing resources
Capital Growth Major equipment purchases,
leases
Relocation of Business in 2006-2008
Planning towards the relocation of Business in 2006-2008
Prior to 2006 PVC: Business Within existing resources
Core Operational ActivitiesStaff Culture Effective
Communication
Growth in Team Work/ Collective Recognition
Bullying Awareness: training has begun. A program of input to staff will be developed.
Development of both informal and formal networks/ groups/seminars within Schools and centres
Modelling by PEG members
End of 2004
On-going
Ongoing
PVC: Business
Within schools and centres
PVC: BusinessPEG members
Within existing resources
Within existing resources
/tt/file_convert/5b3c38097f8b9a0e628d7524/document.doc

PLANNING TEMPLATE Page 43 of 61
Key Result Area
(Dot points provide example issues for consideration)
Outcome (Relevant KPI from Scorecard)
Strategies (What)(Broad actions to achieve the
outcomes)
Timeframe(By When)
Overall Responsibility
(Who)(note where others
involved)
Resources Required(Note whether Additional or
Within existing Budget and Staff resources)
IT and Infrastructure IT initiatives Laboratories, teaching
facilities, etc. maintenance
High student and staff satisfaction with level of service: student survey
High student and staff satisfaction with level of service: student survey
25% reduction in lease penalties
10 % savings in acquisition costs
Employ project-planning methodologies to ensure timely deployment of IT infrastructure in student laboratories. Also to assist all IT projects to be implemented on time and within budget.
Seek adequate technical resource from within the Portfolio to meet project objectives and timelines.
Document a process to monitor leased equipment returns to avoid penalties and duplication charges for staff & student pc’s
Prepare and have a policy ratified to have IT equipment purchases countersigned by the Portfolio IT Manager
June 2004
End 2004
July 2004
June 2004
Director IT:Tony Woolham
Note that prime responsibility for this is likely to be transferred out of the Portfolio in 2004 as part of the service integration project
Within existing resources
Additional resources required
Within existing resources
Within existing resources
/tt/file_convert/5b3c38097f8b9a0e628d7524/document.doc

PLANNING TEMPLATE Page 44 of 61
Key Result Area
(Dot points provide example issues for consideration)
Outcome (Relevant KPI from Scorecard)
Strategies (What)(Broad actions to achieve the
outcomes)
Timeframe(By When)
Overall Responsibility
(Who)(note where others
involved)
Resources Required(Note whether Additional or
Within existing Budget and Staff resources)
Student Support (and Portfolio Implementation)
Relates to Business Organisation and Management Priority:
Student services: Improve quality of student services and integration as key support systems to enhance learning
Related improvements in CEQ scores over time
Implementation of the HUB at 108
Develop Service agreement with Student Services group to ensure student centred approach developed for delivery at local Portfolio level
Ensure that functions that require particularly localised student-centred approaches, e.g. pastoral care, specialist technical services, and some student administration are delivered at the School level.
Improve student-staff access to staff. Advise of action taken in response to feed back. Timetabling and room bookings Review to be initiated in conjunction with staff in Schools
More welcoming signage in Building 108:
- photos and consultation times with extension listings
- School names on doors from stairwell
- list of Schools/floors in lifts
Successful implementation in collaboration with PVC (students)Enhanced student services through the provision of another University- wide HUB [A]
Service agreement with Student Services by June 2004
Timetabling review report by August 2004
Signage in lifts and stair wells by August 2004
Photos of staff in each School Reception by August 2004
2004
End of May 2004
HoSPVCFacilities ManagerDean AcAssoc Deans International
PVC: BusinessPVC: Students
Assistance required from other Portfolios:StudentsIECD
Student Support and Services (Viability and quality)
Student feedback
Partner feedback
Assess costs and benefits to RMIT Business, offshore partners and the RMIT students of operating
Report by September 2004
Assoc Deans InternationalPVC
Assistance required from other Portfolios:Students including LSU and
/tt/file_convert/5b3c38097f8b9a0e628d7524/document.doc

PLANNING TEMPLATE Page 45 of 61
Key Result Area
(Dot points provide example issues for consideration)
Outcome (Relevant KPI from Scorecard)
Strategies (What)(Broad actions to achieve the
outcomes)
Timeframe(By When)
Overall Responsibility
(Who)(note where others
involved)
Resources Required(Note whether Additional or
Within existing Budget and Staff resources)
Relates to Business Organisation and Management Priority:
Offshore Students: Appropriate integration of RMIT student services, policies, practices and procedures for all offshore offerings
different academic calendars at the same partner and of operating different academic calendars at different partners in the same offshore location
Common operational manual to be developed to ensure consistency of RMIT policies and students administration across all programs and all partnerships. Priority areas to focus on implementation of University policies on assessment, appeals and complaints.
Develop a CD for RMIT students offshore to include: Instructions for accessing the RMIT Library, the DLS, the RMIT student email account, RMIT Business Writing Guidelines, DLS Online tutorial on referencing as part of educational element in the prevention of plagiarism
Operations manual first edition by October 2004
CD by October 2004
Dean Ac registrar’s OfficeT&L (especially Library)IECDFBS
Student Support and Services
Relates to Business Organisation and Management Priority:Sessional staff capability:Develop sessional staff capability to support achievement of Portfolio vision for student learning
PD designed and piloted to develop sessional staff capability to support achievement of Portfolio vision for student learning
Ensure sessional staff have e-mail, voicemail. Tell sessionals if they are expected to be available for consultation time; specify acceptable timeframe for them to
Pilot completed by Sept 2004
Improved services for sessional staff by Sept 2004
Dean AcHoS
Assistance from other PortfoliosT&L
/tt/file_convert/5b3c38097f8b9a0e628d7524/document.doc

PLANNING TEMPLATE Page 46 of 61
Key Result Area
(Dot points provide example issues for consideration)
Outcome (Relevant KPI from Scorecard)
Strategies (What)(Broad actions to achieve the
outcomes)
Timeframe(By When)
Overall Responsibility
(Who)(note where others
involved)
Resources Required(Note whether Additional or
Within existing Budget and Staff resources)
respond to student queries Student Support and Services
Relates to Business Organisation and Management Priority:
Student transition: Develop strategies for student transition appropriate to all major student groups in RMIT Business
Student completions – module and course and program
Student satisfaction
Closer links to Orientation Planning coordinated by Student Services
Business Mentor Scheme being expanded based on successful earlier scheme in Accounting and Law
Peer Assisted Learning Scheme piloted in 2003 being integrated with enhanced Mentoring Program
Implementation of Student Leadership courses and opportunities in association with Student Services
Continued work on concurrent English support and development for students of non-English speaking background with REW and IECD
Ongoing in 2004 PVC: BusinessDean AcHoS
Assistance from other PortfoliosStudentsT&LIECD
/tt/file_convert/5b3c38097f8b9a0e628d7524/document.doc

PLANNING TEMPLATE Page 47 of 61
Key Result Area
(Dot points provide example issues for consideration)
Outcome (Relevant KPI from Scorecard)
Strategies (What)(Broad actions to achieve the
outcomes)
Timeframe(By When)
Overall Responsibility
(Who)(note where others
involved)
Resources Required(Note whether Additional or
Within existing Budget and Staff resources)
Budget Management Processes to monitor and
review budget
Meet budget targets Monitor monthly: intervene; seek alternate revenue resources; ensure achievement of budget targets
On-going PVC: Business Manager: Finance & Resources
Within existing resources
Health and Safety1.Leadership/integration of Health & Safety into management structure & processes2. Systems for managing Health & Safety3. Safe equipment & safe facilities4. An active safety culture
All direct reports to be accountable for achieving this in their own work area
PVC accountable for achieving this in ‘portfolio office’
As per statistics forming part of quarterlyReport
Speed of taking corrective action where required
PVC: Business Within existing resources
/tt/file_convert/5b3c38097f8b9a0e628d7524/document.doc

PLANNING TEMPLATE Page 48 of 61
SECTION F: RISK MANAGEMENT ASSESSMENT
Portfolio Risk ManagementDuring 2003 all PVCs were involved in developing the Enterprise Risk Management Strategy for RMIT.
The major risks identified as being critical for RMIT to manage over the period to 2008 are: Decentralised operations leading to major inefficiencies and high overheads Inability to respond to market demand in order to grow revenue and meet financial targets High level of dependence on South east Asia and China to achieve growth targets Inability to fund future infrastructure spending that will support growth Variability of teaching and research quality across RMIT Lack of financial, commercial and relationship management expertise within certain parts of
RMIT Costly and unsustainable enterprise IT systems which will not be supportable in the future Inability to attract, develop and retain the right people to achieve RMIT’s vision Inability to recover from a disaster in a timely manner Physical harm to students and staff.
In taking the RMIT’s risk management obligations forward, all Portfolios are now required to complete risk assessments as part of their business planning for 2004. The Portfolio risk assessment is to focus on the active identification and management of the risks that may prevent, or impede, the Portfolio from achieving its business goals. This will require the explicit monitoring, reporting and management of the Portfolio’s risk by the Portfolio.
ApproachRMIT have adopted AS/NZ4360:1999 as a base, and from that have developed a methodology which will be available through the RMIT website. It is crucial that this approach be adopted when completing the Portfolio risk assessment. A template for the Risk Register is contained in this section, together with criteria for categorising Likelihood and Consequences. Ensuring that all risk registers are formatted using this template will enable the integration of cross-portfolio risk management into an RMIT-wide risk assessment for Council.
The Role of Internal Audit & Risk ManagementInternal Audit staff are available to provide guidance on the process for effectively developing a risk management assessment for each portfolio, and are obliged to oversight the process to ensure that risk assessment is undertaken and that the outcomes meet the requirements of RMIT. If necessary, appropriate consultants can be identified, and assistance provided in engaging them to facilitate development of the risk assessment. It is crucial that the consultant be prepared to utilise the RMIT methodology and adopt the format of output.
A risk assessment training program will be developed and made available through the Open Program. Staff involved in developing the risk assessment for your Portfolio should attend the training.
DeadlineThe RMIT-wide risk assessment will commence in September 2004. This means that all Portfolio risk assessment work must be made available to Internal Audit & Risk Management, in the specified format, during August 2004.
The Business PortfolioThe Portfolio of Business is planning to appoint a staff member within the Office of the PVC: Business to develop, manage and monitor an ongoing Risk Management strategy. The timing of the appointment is subject to budgetary constraints but the intention is that the appointment can occur within the first half of 2004 so that the abovementioned university timelines can be met..
/tt/file_convert/5b3c38097f8b9a0e628d7524/document.doc

PLANNING TEMPLATE Page 49 of 61
RISK REGISTER
Risk Title
5.1 From a commercial and financial management perspective, RMIT operates under a silo mentality leading to major inefficiencies across the organization.
Risk Rating Extreme
Likelihood * Almost Certain Consequence * Major
Risk Treatment
Activity Responsibility Expected Completion Date
Status *
Dealt with through the establishment of the Major Change Group to simplify and standardise business processes across RMIT.
Major Change Group(Malcolm McCormick)
June 04
Post Treatment Risk Rating
Likelihood Consequence
* The risk assessment of ‘Likelihood’ and ‘Consequence’ from AS/NZ4360:1999 are described in the following pages
/tt/file_convert/5b3c38097f8b9a0e628d7524/document.doc

PLANNING TEMPLATE Page 50 of 61
RISK ASSESSMENT CRITERIA
LIKELIHOODThe following definitions should be used to describe the likelihood of the risk occurring.
5. Almost Certain The event is expected to occur in most circumstancesRisk has more than a 75% chance of occurringWill occur within the next six months
4. Likely The event will probably occur in most circumstancesRisk has 50-74% chance of occurringWill occur within 18 months
3. Possible The event could occur at some timeRisk has 25-49% chance of occurringWill occur within 36 months
2. Unlikely The event is unlikely to occurRisk has less than 25% chance of occurringMay occur within 48 months
1. Rare The event may only occur in exceptional circumstancesNot likely to occur within next five years
To determine both the likelihood and consequence of each risk, consideration will be given to the current controls in place to minimise or manage risks.
CONSEQUENCESThe following definitions have been used to describe the consequences of a risk occurring
/tt/file_convert/5b3c38097f8b9a0e628d7524/document.doc

PLANNING TEMPLATE Page 51 of 61
5. Catastrophic Financial impact exceeds $10 million where risk is covered by insurance (insurance cover up to $10 million)Very high client sensitivity Irreparable damage to University’s image and reputationCessation of business due to non-compliance with regulationsBusiness and Strategic objectives unable to be achievedFinancial impact exceeds $1.5 m where risk is not covered by insurance
4. Major Financial impact between $5 million to $10 million where risk is covered by insurance Significant client sensitivity Significant damage to University’s image and reputationRestriction of business due by regulatorsSignificant impact on Business and Strategic objectives Financial impact exceeds $1 m where risk is not covered by insurance
3. Moderate Financial impact between $2 million to $5 million where risk is covered by insurance Moderate client sensitivity Medium damage to University’s image and reputationFines and penalties by regulators (e.g. delay in payment to client)Moderate impact on Business and Strategic objectives Financial impact exceeds $500,000 where risk is not covered by insurance
2. Minor Financial impact less than $2 million where risk is covered by insurance Low impact on client sensitivity Minimal damage to University’s image and reputationCensure by regulators Minimal impact on Business and Strategic objectives Financial impact exceeds $250,000 where risk is not covered by insurance
1. Insignificant Risk consequences are dealt with by routine operations
SECTION G: WORKFORCE PLAN
To support implementation of the initiatives, a 3 year forecast workforce profile should be aligned to the directions of the plan. Workforce planning involves identifying future organisational demands and supplies of staff and planning the steps necessary to ensure that the right number and type of individuals are available at the right time to fulfil organisational needs. A workforce profile:
- identifies the skills and desired staffing profile required to achieve the school/area’s plan- provides an objective basis for planning staff development- assists in achieving an appropriate staffing mix- assists in maximising notice periods for not issuing further fixed-term contracts.
Guidelines for developing a staff profile are available from People Services. The University’s staff profile is at http://www.rmit.edu.au/ps/statistics
Changes in Business Objectives or Key Activities Planned
Strategies to address changing of workforce needsrecruitment, training & development, retraining, redeployment, relocation, replacement
Cost/Resources Target Completion Date
/tt/file_convert/5b3c38097f8b9a0e628d7524/document.doc

PLANNING TEMPLATE Page 52 of 61
planning, restructuring, union negotiations, redundancy, career planning, change management
This work is to be completed in 2004.
/tt/file_convert/5b3c38097f8b9a0e628d7524/document.doc

PLANNING TEMPLATE Page 53 of 61
SCHOLARSHIP TRIANGLES
Scholarship Triangle – Head - Graduate School of Business
The Head of the Graduate School could potentially be in any of the five identified current and emerging research concentration areas of the Portfolio:
E-commerce / Knowledge Management Financial Markets Health Services Management Organisational Accountability Entrepreneurship and Innovation
The Head of the Graduate School would enhance the number of research active scholars (band 2) in a particular triangle, the number of research students (band 5) in a particular triangle and the amount of research income earned (band 9) in a particular triangle. These accountabilities are described in the position description.
Thus by way of illustration, consider the following example of the Head of Graduate School being in the financial markets area, although it should be noted that a comparable analysis could be presented in other areas.
CURRENT FINANCIAL MARKETS SCHOLARSHIP TRIANGLE
The current scholarship triangle for the financial markets research concentration is shown on the following page. Following are comments on the triangle.
1) Industry & Community Need
The research output has been shown to be of national significance and there is significant national demand for research in financial markets.Ratio = 85%. 2) Research Active Scholars 7/12 = 58.3%.
Robert BrooksSinclair DavidsonTony NaughtonMichael McKenzieHeather MitchellTim FryRichard Henney
The research concentration currently has the following associations:
Academic journals: Accounting Research Journal, Accounting and Finance, Studies in Economics and Econometrics.Academic Association: Asia-Pacific Finance Association.Industry Links: JB Were, Capital Partners, Sigma Ltd, Institute of Banking and Finance, Commonwealth Bank, ANZ Bank, NAB, Westpac, Zurich Financial Services, AXA, Bio Diem.
At this time the research concentration is involved in various tenders and grants that will leverage these relationships into earned finance.
/tt/file_convert/5b3c38097f8b9a0e628d7524/document.doc

PLANNING TEMPLATE Page 54 of 61
FINANCIAL MARKETS SCHOLARSHIP TRIANGLES
CURRENT 2003
3) Research Assistants/Post Doctorals = 3 = 100%
Required Ratio = 1 per three scholars. We have 7 scholars, we should have 2.33 Research Assistants.
4) Teaching Scholarship and Potential Research Active Scholars = 14. Desired ratio = 2 per scholar = 71.4%
Amalia di IorioTerry HallahanThomas JosevSveta RismanMagdy StephanStuart ThomasLisa YongHoa NguyenVikash RamiahMark Stewart
5) Research Students
Desired ratio = 6 EFTSU per scholarThe desired EFTSU = 42 EFTSU, Actual EFTSU =30
/tt/file_convert/5b3c38097f8b9a0e628d7524/document.doc
1 (85%)
2 (59%)
3 (100%)
4 (71%)
5 (71%)
6 (2%)
7 (100%)
8 (80%)
9 (77%)
10 (100%)

PLANNING TEMPLATE Page 55 of 61
Ratio = 71%
6) UG students in the relevant courses engaged in the scholarship area and doing fieldwork contributing to research.
In principle all students over the period of their UG studies will be engaged in research activity. This, however, can only be quantified by examining the Co-operative education year where students are required to undertake a project. The project component comprises 20% of the year. There are 100 co-op students and this is measured as 20%*100 = 20. Total UG EFTSU = 690.79 + 201.64 = 892.43.Ratio = 20/892.43 = 2%.(If we include ALL students, both UG and PG) the ratio = 18%.
7) Undergraduate underpinning
University SchoolHE Academic Staff 963 31
HE Students* 25094.21 1063.16Staff/student 0.038375 0.029158Student/Staff 26.05837 34.29548
* = EFTSURatio = 100%.The concentration currently has 1063 EFTSU studying in the scholarship area at undergraduate level.
8) Facilities, Equipment and Research Infrastructure
The concentration has a deficiency in office space that places a physical constraint on appointments, especially at the associate professor and professor levels.Ratio = 80%.
9) Earned Finance
Time % Basic Salary Research AllocationRobert Brooks 10 97109 9710.9
Sinclair Davidson 67 77942 52221.14Michael McKenzie 60 68359 41015.4
Heather Mitchell 20 60693 12138.6Tim Fry 50 97109 48554.5
Richard Heany 50 97109 48554.5Tony Naughton 20 97109 19421.8
Average/Total 220000.0
Budgeted Earned Finance = $170,000Ratio = 170000/220,000 = 77%
10) Finances Allocated
The research concentration has substantial COG underpinning plus in excess of 20% FFP students.
POTENTIAL FINANCIAL MARKETS SCHOLARSHIP TRIANGLE
The current scholarship triangle reveals gaps at band 2 around the number of research active scholars and at band 9 around finances earned. These new appointment would help in this regard. In addition it is also expected that the position would help as regards research student recruitment (band 5 of the scholarship
/tt/file_convert/5b3c38097f8b9a0e628d7524/document.doc

PLANNING TEMPLATE Page 56 of 61
triangle). Thus, this appointment could be expected to produce a new triangle, shown on the next page.
The following comments highlight the bands where changes will be made as a result of the new position.
2) Research Active Scholars 8/12 = 66%
FINANCIAL MARKETSSCHOLARSHIP TRIANGLES
NEW 2004
5) Research Students
Desired ratio = 6 EFTSU per scholarThe desired EFTSU = 48 EFTSU, Actual EFTSU after recruitment due to appointments = 36Ratio = 75%
9) Earned Finance
Time % Basic Salary Research AllocationRobert Brooks 10 97109 9710.9
Sinclair Davidson 67 77942 52221.14Michael McKenzie 60 68359 41015.4
Heather Mitchell 20 60693 12138.6Tim Fry 50 97109 48554.5
Richard Heany 50 97109 48554.5Time % Basic Salary Research Allocation
Tony Naughton 20 97109 19421.8
/tt/file_convert/5b3c38097f8b9a0e628d7524/document.doc
1 (85%)
2 (66%)
3 (100%)
4 (100%)
5 (75%)
6 (2%)
7 (100%)
8 (80%)
9 (95%)
10 (100%)

PLANNING TEMPLATE Page 57 of 61
Head, Graduate School 20 97109 19421Average/Total 240000.0
Budgeted Earned Finance = $240,000Ratio = 230,000/240,000 = 9567%Positions expected to earn research income. This is an illustrative example but the same type of effects are expected in all scholarship areas.
/tt/file_convert/5b3c38097f8b9a0e628d7524/document.doc

PLANNING TEMPLATE Page 58 of 61
SCHOLARSHIP TRIANGLES
Scholarship Triangle – School of Management
CURRENT ORGANISATIONAL ACCOUNTABILITY (SCHOOL OF MANAGEMENT) SCHOLARSHIP TRIANGLE
The current scholarship triangle for the organisational accountability research concentration is shown on the following page. Following are comments on the triangle.
1) Industry & Community Need
The research output has been shown to be of national significance and there is significant national demand for research in organisational accountability.Ratio = 85%. 2) Research Active Scholars 6/12 = 50%.
Carlene BoucherJames LathamDavid KimberChris SelvarajahJulie Wolfram-CoxIan Woodruff
The research concentration currently has the following associations:
Academic Association: Academy of Management (USA), Australian and New Zealand Academy of Management, Australian Business Ethics Network
Industry Links: St James Ethics Centre, Northern health network, Royal Melbourne Hospital, Western Hospital.
At this time the research concentration is involved in various tenders and grants that will leverage these relationships into earned finance.
/tt/file_convert/5b3c38097f8b9a0e628d7524/document.doc

PLANNING TEMPLATE Page 59 of 61
FINANCIAL MARKETS SCHOLARSHIP TRIANGLES
CURRENT 2003
3) Research Assistants/Post Doctorals = 2 = 100%Required ratio = 1 per three scholars.
4) Teaching Scholarship and Potential Research Active Scholars = 8. Desired ratio = 2 per scholar = 75%
Paul GibsonTim O’ShannessyGeorgina CaillardMargaret HeffernanMarianne GloetMark RoseGrant WaltersElizabeth Creese
5) Research Students
Desired ratio = 6 EFTSU per scholarThe desired EFTSU = 36 EFTSU, Actual EFTSU = 15
Ratio = 42%
6) UG students in the relevant courses engaged in the scholarship area and doing fieldwork contributing to research.
/tt/file_convert/5b3c38097f8b9a0e628d7524/document.doc
1 (85%)
2 (50%)
3 (100%)
4 (75%)
5 (42%)
6 (2%)
7 (100%)
8 (100%)
9 (100%)
10 (100%)

PLANNING TEMPLATE Page 60 of 61
7) Undergraduate underpinning
University SchoolHE Academic Staff 963 39
HE Students* 25094.21 2110.1Staff/student 0.038375 0.01848Student/Staff 26.05837 54.1051
* = EFTSURatio = 100%..
8) Facilities, Equipment and Research Infrastructure
None.Ratio = 100%.
9) Earned Finance
Time % Basic Salary Research AllocationCarlene Boucher 30 77942 23383James Latham 50 54485 27243David Kimber 20 77942 15588Chris Selvarajah 20 77942 15588Julie Wolfram-Cox 30 77942 23383Ian Woodruff 70 68359 47851
Total 153036
Budgeted Earned Finance = $180,000Ratio = 180000/153036 = 118%
10) Finances Allocated
The research concentration has substantial COG underpinning plus 10 FFP DBA students.
/tt/file_convert/5b3c38097f8b9a0e628d7524/document.doc

PLANNING TEMPLATE Page 61 of 61
SCHOLARSHIP TRIANGLES
Scholarship Triangle – Schools of MarketingThe Head of the School of Marketing (HSoM) could potentially be in any current or emerging research concentration areas of the Portfolio, including E-commerce/ Knowledge Management, Financial Markets, Organisational Accountability, and Entrepreneurship and Innovation, however an argument exist for the HSoM to have a strong background in Marketing. This view was expressed quite clearly during the SoM Planning Day in December 2003.
The HSoM would enhance the number of research active scholars (band 2) in a particular triangle, the number of research students (band 4) in a particular triangle, and the amount of research income earned (band 9) in a particular triangle. These accountabilities are described in the position description.
MARKETING SCHOLARSHIP TRIANGLE The current scholarship triangle for the marketing-related research concentration is shown on the following page. Below, comments on the triangle are outlined.
1) Industry & Community NeedThe research output is of national significance and there is significant national demand for research. An international research presence is demonstrated in the family business area. A critical goal is to establish solid research relationships with Industry Partners, particularly in marketing, supply chain management, transport and logistics, and international business. Basically, only 2 established active research scholars are undertaking investigations with industry partners. Notwithstanding, a number of academics have established industry links (e.g., media), which have not been translated into research quantum.Ratio = 35%.
2) Research Active Scholars (8/27 = 29.6%)
1. Professor Kosmas Smyrnios (Marketing)Fast Growth Firms, Development of Marketing Tools, Family Business
2. Associate Professor Booi Kam (Logistics)Designing Liveable Suburbs, Melbourne’s Housing Market, Transport Sustainable Cities, Freeway Development and Travel Behavior
3. Dr Anthony Lowe (Marketing)The Effects of Culture and Cultural Value on Purchasing Behavior
4. Associate Professor Michael Schwartz (Marketing)Ethics in Organizations
5. Dr Hernan Riquelme (Marketing)Marketing on the Internet, and e-government
6. Dr Dave Wilson (Logistics)Geographic Analysis, Inventory Mgt, Transport & Logistics Systems Modeling
7. Associate Professor David Foster (Hosp & Tourism)Hospitality & Tourism
8. Dr Robert Inbakaran (Hosp & Tourism)Tourism
/tt/file_convert/5b3c38097f8b9a0e628d7524/document.doc

PLANNING TEMPLATE Page 62 of 61
RESEARCH AREAS OF CONCENTRATION Electronic Marketing and Management of Service Organizations Family Business (Small-To-Medium Enterprises); Fast Growth Firms Housing Market Dynamics and Transport-Land Use Interactions Cross-Cultural and International Marketing of Food Macro Marketing: Marketing Ethics and Historiography Marketing Development, Opportunities and Strategy Within Professional Sport
Relationship Marketing Consumer Brand Equity, Brand Image, Brand Loyalty, Brand Personality, &
Brand Management Supply Chain Operations (e.g., in the Ports and Agricultural Sector)
The research concentration currently has the following associations:
Academic journals: Family Business Review, Academy of Management, Research in Ethical Issues in Organizations, Journal of Business Ethics.
Industry Links: In 2003, industry partners included: Boyd Partners, BDO Nelson, BRW, Australian Music Association, the Department of Natural Resources and Environment, and Australian Association for Professional & Applied Ethics.
The research concentration continues to be involved in grant applications [ARC (Discovery), ARC (Linkage), Industry-based] leveraging relationships into generating further funding and academic publications.
Emerging Researchers1. Dr Bill Callaghan (Marketing)2. Gill Stainforth (Marketing)3. Charles Lau (Logistics)4. Kate Westburg (Marketing)5. Con Stavros (Marketing)6. Shahadat Khan (Logistics)7. Brad Wilson (Logistics)8. Raju Mulye (Marketing)9. Kathy Griffith (Marketing)10. John Odgers (Logistics)
Potential Researchers1. Julie Mclaren (Marketing)2. Roger Oakden (Logistics) 3. Geoff Rigby (Logistics)4. Elsie Hooi (Logistics)5. Bernadette Harrison (Hosp & Tourism)6. Michael Bailey (Hosp & Tourism)7. Heather Mallinson (On Leave)8. Christopher Vaz (Hosp & Tourism)9. Margaret Melrose (Hosp & Tourism)
/tt/file_convert/5b3c38097f8b9a0e628d7524/document.doc

PLANNING TEMPLATE Page 63 of 61
3) Research Assistants/Post Doctoral = 0.8 = 30%Required Ratio = 1 per three scholars. We have 8 scholars; therefore we should have 2.66 Research Assistants.
4) Teaching Scholarship and Emerging and Potential Research Active Scholars = 19. Desired ratio = 2 per scholar (i.e., 16) = 79%
5) Research Students Desired ratio = 6 EFTSU per scholar. The desired EFTSU = 48 EFTSU, Actual EFTSU =17 Ratio = 35%
/tt/file_convert/5b3c38097f8b9a0e628d7524/document.doc

PLANNING TEMPLATE Page 64 of 61
SCHOOL OF MARKETING SCHOLARSHIP TRIANGLES
CURRENT 2003
1. Industry & Community Needs
2. Scholars
3. Research Assistants / Post Docs
4. Potential Scholars
5. Research Students
6. Senior UG Research / Fieldwork
7. UG underpinning
8. Facilities,Equipment
9. Finances(grants)
10. Finances(COG)
6) UG students in the relevant courses engaged in the scholarship area and doing fieldwork contributing to research.
In principle all students over the period of their UG studies will be engaged in research activity. This, however, can only be quantified by examining the Co-operative education year where students are required to undertake a project. The project component comprises 20% of the year. There are 345 co-op students and this is measured as 20%*345 = 69. Total UG EFTSU = 2450Ratio = 69/2450= 2.8%. (If we include ALL students, both UG and PG) the ratio = 14%
7) Undergraduate underpinning University School
HE Academic Staff 963 27HE Students* 25094 2770Staff/student 0.04 .01Student/Staff 26.06 102.6
* = EFTSU; Ratio = 100%.The concentration currently has 2770 EFTSU studying in the scholarship area at undergraduate level.
8) Facilities, Equipment and Research InfrastructureThe concentration has a deficiency in office space that places a physical constraint on appointments, especially at the Associate Professor and Professor levels.Ratio = 50%.
/tt/file_convert/5b3c38097f8b9a0e628d7524/document.doc
1. (35%)
2. (30%)3. (30%)
4. (79%)
5. (35%)
6. (%)
7. (%)
8. (50%)
9. (60%)
10. (100%)

PLANNING TEMPLATE Page 65 of 61
9) Earned FinanceAcademic Time % Basic Salary Research Allocation
Kosmas Smyrnios 50 97109 48554Booi Kam 20 88539 17707
Anthony Lowe 20 85813 17707Michael Schwartz 50 88539 44270Hernan Riquelme 50 76961 38480
Dave Wilson 41.6 76961 32016David Foster 50 88539 44270
Robert Inbakaran 52.7 64702 34097Average/Total 667163 277101
Budgeted Earned Finance for 2003 = $150,000Ratio = 90/150000 = 60%
10) Finances AllocatedThe research concentration has substantial COG underpinning.
ConclusionThe current scholarship triangle reveals gaps in all except band 10. There is a clear need to enhance deficiencies in the relevant bands, including international and national scholars, number of research active scholars, numbers of research assistants and postdoctoral fellows, number of research students, research partners and clients, and finances earned. This new professorial appointment would help in this regard.
/tt/file_convert/5b3c38097f8b9a0e628d7524/document.doc