portable electromagnetic induction sensor with integrated
TRANSCRIPT

Portable Electromagnetic Induction Sensor withIntegrated Positioning
MR-1712
Interim Report
Submitted to
Strategic Environmental Research and Development Program (SERDP)
April 16, 2012
Revision 1.1
By
U.S. Army Corps of Engineers Research and Development CenterCold Regions Research and Engineering Laboratory (CRREL)
72 Lyme RoadHanover, NH 03755
Principal InvestigatorsDrs. Ben Barrowes, David George, and Fridon Shubitidze

Report Documentation Page Form ApprovedOMB No. 0704-0188
Public reporting burden for the collection of information is estimated to average 1 hour per response, including the time for reviewing instructions, searching existing data sources, gathering andmaintaining the data needed, and completing and reviewing the collection of information. Send comments regarding this burden estimate or any other aspect of this collection of information,including suggestions for reducing this burden, to Washington Headquarters Services, Directorate for Information Operations and Reports, 1215 Jefferson Davis Highway, Suite 1204, ArlingtonVA 22202-4302. Respondents should be aware that notwithstanding any other provision of law, no person shall be subject to a penalty for failing to comply with a collection of information if itdoes not display a currently valid OMB control number.
1. REPORT DATE 16 APR 2012 2. REPORT TYPE
3. DATES COVERED 00-00-2012 to 00-00-2012
4. TITLE AND SUBTITLE Portable Electromagnetic Induction Sensor with Integrated Positioning
5a. CONTRACT NUMBER
5b. GRANT NUMBER
5c. PROGRAM ELEMENT NUMBER
6. AUTHOR(S) 5d. PROJECT NUMBER
5e. TASK NUMBER
5f. WORK UNIT NUMBER
7. PERFORMING ORGANIZATION NAME(S) AND ADDRESS(ES) U.S. Army Corps of Engineers Research and Development Center,ColdRegions Research and Engineering Laboratory (CRREL),72 Lyme Road,Hanover,NH,03755
8. PERFORMING ORGANIZATIONREPORT NUMBER
9. SPONSORING/MONITORING AGENCY NAME(S) AND ADDRESS(ES) 10. SPONSOR/MONITOR’S ACRONYM(S)
11. SPONSOR/MONITOR’S REPORT NUMBER(S)
12. DISTRIBUTION/AVAILABILITY STATEMENT Approved for public release; distribution unlimited
13. SUPPLEMENTARY NOTES
14. ABSTRACT SERDP project MR-1712 entitled ?Portable Electromagnetic Induction Sensor with IntegratedPositioning? is slightly more than halfway complete. The transmitter (Tx) and receiver (Rx) assemblies aredesigned and fabricated. The data acquisition (DAQ) electronics consists of the National Instruments (NI)cRIO platform which is much lighter and more efficient that prior DAQ platforms. Software to control thecRIO DAQ process has been written in NI?s LabVIEW. This software has been used to successfullyacquire initial data. Inversion of the data acquired during these initial tests has yielded satisfactorypolarizabilities of a spherical target. In addition, precise positioning of the Rx assembly has been achievedvia position inversion algorithms based solely on the data acquired from the receivers during the ?on-time?of the primary field. Major tasks still to complete include redesigning and integrating new transmitter andfilter board control circuitry as well as final cable construction and integration. The LabVIEW programsmust also be matured to become more user friendly. A more extensive prove-out is scheduled for May,2012 after which will follow an extensive data analysis. Finally, we intend to go to Aberdeen ProvingGround in the Fall of 2012 to perform a field test of Pedemis, test its protocols, and evaluate its performance.
15. SUBJECT TERMS
16. SECURITY CLASSIFICATION OF: 17. LIMITATION OF ABSTRACT Same as
Report (SAR)
18. NUMBEROF PAGES
38
19a. NAME OFRESPONSIBLE PERSON
a. REPORT unclassified
b. ABSTRACT unclassified
c. THIS PAGE unclassified

Standard Form 298 (Rev. 8-98) Prescribed by ANSI Std Z39-18

This report was prepared under contract to the Department of Defense Strategic Environmental Research and Development Program (SERDP). The publication of this report does not indicate endorsement by the Department of Defense, nor should the contents be construed as reflecting the official policy or position of the Department of Defense. Reference herein to any specific commercial product, process, or service by trade name, trademark, manufacturer, or otherwise, does not necessarily constitute or imply its endorsement, recommendation, or favoring by the Department of Defense.

MR-1712 - Interim Report CONTENTS
Contents
1 Abstract ii
2 Objectives 1
3 Technical Approach 43.1 Background . . . . . . . . . . . . . . . . . . . . . . . . . . . . . . . . . . . . . . . . . . . 43.2 Pedemis Design . . . . . . . . . . . . . . . . . . . . . . . . . . . . . . . . . . . . . . . . . 5
3.2.a Pedemis Tx Array . . . . . . . . . . . . . . . . . . . . . . . . . . . . . . . . . . . 63.2.b Pedemis Rx Array . . . . . . . . . . . . . . . . . . . . . . . . . . . . . . . . . . . 113.2.c Pedemis Control Electronics . . . . . . . . . . . . . . . . . . . . . . . . . . . . . . 13
3.3 Pedemis Rx Positioning . . . . . . . . . . . . . . . . . . . . . . . . . . . . . . . . . . . . . 143.4 Background Subtraction . . . . . . . . . . . . . . . . . . . . . . . . . . . . . . . . . . . . 203.5 Pedemis Operation Protocol . . . . . . . . . . . . . . . . . . . . . . . . . . . . . . . . . . 21
4 Results and Discussion 224.1 Pedemis Hardware and Fabrication . . . . . . . . . . . . . . . . . . . . . . . . . . . . . . . 224.2 Pedemis DAQ Control Software . . . . . . . . . . . . . . . . . . . . . . . . . . . . . . . . 234.3 Initial Data, November 2011 . . . . . . . . . . . . . . . . . . . . . . . . . . . . . . . . . . 23
5 Conclusions to Date 29
References 30
B. Barrowes, D. George, F. Shubitidze -i-

MR-1712 - Interim Report 1 ABSTRACT
1 Abstract
SERDP project MR-1712 entitled “Portable Electromagnetic Induction Sensor with Integrated Positioning”is slightly more than halfway complete. The transmitter (Tx) and receiver (Rx) assemblies are designedand fabricated. The data acquisition (DAQ) electronics consists of the National Instruments (NI) cRIOplatform which is much lighter and more efficient that prior DAQ platforms. Software to control the cRIODAQ process has been written in NI’s LabVIEW. This software has been used to successfully acquire initialdata. Inversion of the data acquired during these initial tests has yielded satisfactory polarizabilities of aspherical target. In addition, precise positioning of the Rx assembly has been achieved via position inversionalgorithms based solely on the data acquired from the receivers during the “on-time” of the primary field.
Major tasks still to complete include redesigning and integrating new transmitter and filter board controlcircuitry as well as final cable construction and integration. The LabVIEW programs must also be maturedto become more user friendly. A more extensive prove-out is scheduled for May, 2012 after which willfollow an extensive data analysis. Finally, we intend to go to Aberdeen Proving Ground in the Fall of 2012to perform a field test of Pedemis, test its protocols, and evaluate its performance.
B. Barrowes, D. George, F. Shubitidze -ii-
MR-1712 - Interim Report 1 ABSTRACT
List of Acronyms (and page references to first use)
BUD Berkeley UXO Discriminator – first used on page (4)CRREL Cold Regions Research and Engineering Lab – first used on page (1)DAQ Data AcQuisition – first used on page (ii)EMI Electromagnetic Induction – first used on page (1)ERDC Engineering Research and Development Center – first used on page (1)ESTCP Environmental Security Technology Certification Program – first used on page (5)FPGA Field Programmable Gate Array – first used on page (23)JD Joint Diagonalization – first used on page (3)MAS Method of Auxiliary Sources – first used on page (10)MPV Man-Portable Vector (subject of this final report) – first used on page (1)MR Munitions Response – first used on page (ii)NI National Instruments – first used on page (ii)NSMS Normalized Surface Magnetic Source – first used on page (3)ONVMS ortho-normalized volume magnetic source – first used on page (3)Pedemis PortablE Decoupled Electromagnetic Induction Sensor – first used on page (ii)RMS Root Mean Squared – first used on page (5)RT Real Time – first used on page (23)Rx Receiver – first used on page (ii)SERDP Strategic Environmental Research and Development Program – first used on page (ii)SNR Signal-to-noise ratio – first used on page (5)TEMTADS Time domain ElectroMagnetic Towed Array Detection System – first used on
page (1)Tx Transmitter – first used on page (ii)USACE United States Army Corps of Engineers – first used on page (1)VI Virtual Instruments – first used on page (23)
Keywords: electromagnetic induction, handheld, time domain, rigorous models, inversion
Acknowledgments: This project was funded by the Strategic Environmental Research andDevelopment Program (SERDP) under project MR-1712. We worked closely with G&G Sciencesand Dartmouth College for the duration of the project. Drs. Jeff Marqusee, Anne Andrews, andHerb Nelson, and the review committee for SERDP, provided support and constructive reviewsduring the course of the project.
B. Barrowes, D. George, F. Shubitidze -iii-

MR-1712 - Interim Report LIST OF FIGURES
List of Figures
2.1 Conceptual design of the proposed sensor. . . . . . . . . . . . . . . . . . . . . . 23.1 Examples of challenging terrain for which Pedemis could be deployed. . . . . . . 43.2 Pedemis Tx array . . . . . . . . . . . . . . . . . . . . . . . . . . . . . . . . . . 63.3 Pedemis Rx array . . . . . . . . . . . . . . . . . . . . . . . . . . . . . . . . . . 73.4 Pedemis control electronics . . . . . . . . . . . . . . . . . . . . . . . . . . . . . 83.5 Possible design of Tx array. . . . . . . . . . . . . . . . . . . . . . . . . . . . . . 93.6 Simulated 2x2 Tx array results . . . . . . . . . . . . . . . . . . . . . . . . . . . 103.7 Simulated 3x3 + 4vertical Tx array results . . . . . . . . . . . . . . . . . . . . . 113.8 Simulated 3x3 Tx array results . . . . . . . . . . . . . . . . . . . . . . . . . . . 123.9 Pedemis receiver cubes . . . . . . . . . . . . . . . . . . . . . . . . . . . . . . . 133.10 Pedemis control electronics . . . . . . . . . . . . . . . . . . . . . . . . . . . . . 143.11 Pedemis beacon example . . . . . . . . . . . . . . . . . . . . . . . . . . . . . . 163.12 Pedemis beacon example error . . . . . . . . . . . . . . . . . . . . . . . . . . . 173.13 Pedemis beacon target induced error . . . . . . . . . . . . . . . . . . . . . . . . 173.14 Pedemis Beacon Inversion #1 . . . . . . . . . . . . . . . . . . . . . . . . . . . . 183.15 Pedemis Beacon Inversion #2 . . . . . . . . . . . . . . . . . . . . . . . . . . . . 193.16 Pedemis DAQ Position #1 . . . . . . . . . . . . . . . . . . . . . . . . . . . . . 224.1 Pedemis RT control software . . . . . . . . . . . . . . . . . . . . . . . . . . . . 244.2 Pedemis FPGA control software . . . . . . . . . . . . . . . . . . . . . . . . . . 254.3 Initial Data Setup . . . . . . . . . . . . . . . . . . . . . . . . . . . . . . . . . . 264.4 Example data from Pedemis . . . . . . . . . . . . . . . . . . . . . . . . . . . . 274.5 Polarizabilities from data in Fig. 4.4. . . . . . . . . . . . . . . . . . . . . . . . . 28
B. Barrowes, D. George, F. Shubitidze -iv-

MR-1712 - Interim Report LIST OF TABLES
List of Tables
B. Barrowes, D. George, F. Shubitidze -v-
MR-1712 - Interim Report 2 OBJECTIVES
2 Objectives
The objective of this work is to design and fabricate a novel time-domain bistatic EMI sensor thatallows for the physical decoupling of the transmitter (Tx) and receiver (Rx) coil(s). This bistatic,physically decoupled, portable EMI instrument with precise positioning would be a valuable re-search instrument for several reasons. First, there is a pressing need for portable EMI instrumentsdeployable in adverse conditions where cart mounted systems cannot function. Furthermore, abistatic EMI instrument also delivers critical flexibility in operation and high fidelity data by al-lowing users to acquire sufficiently detailed data in one pass to satisfy inversion/discriminationroutines (see Sec. 3.5). Necessary in achieving this data quality is research into a more precisescheme for positioning the receiver assembly. We will to combine systematic modeling of the in-strument geometry, flexible operation design, and highly precise positioning into a single, portableEMI instrument.
This bistatic configuration allows greater positioning accuracy, improved depth detection, de-ployment flexibility, and deployment in difficult terrain. This sensor will have a built-in precisepositioning system, can be operated in either a carted or man-portable mode, and features an arrayof vector (coil) receivers. Figure 2.1 provides a sketch of the proposed design. In summary, thesensor will consist of a movable coplanar set of transmitting coils, a movable detachable array ofreceiver coils, and supporting hardware (e.g. in a backpack, see see Sec. 3.2). The system can beused in either a bistatic mode, i.e. with Tx and Rx physically decoupled; or in a monostatic mode(Tx and Rx in a fixed geometry). Subcentimeter or even submillimeter positioning of the receiverswill be a design goal via receiver cube detection of the primary field during the “on” time of thetransmitter (see Sec. 3.3). Transmitter and receiver geometries and characteristics were rigorouslymodeled in an effort to systematically determine optimal instrument configurations (see Sec. 3.2).
The specific objectives of this project are:1. Modeling of physically decoupled EMI instrument configurations (see Sec. 3.2)
This will be a bistatic instrument with the Tx and Rx coils physically decoupled and sepa-rately movable. This decoupling allows simpler data processing for some algorithms, whilesuimultaneously allowing multiple operational modes (see Sec. 3.2), but will require precisepositioning (see Sec. 3.3). The number, geometry, and arrangement of both the transmit-ters and receivers will be rigorously modeled and investigated with tools from prior SERDPprojects for maximum data information given hardware constraints. The receivers will bedB/dt vector coil receivers with a lighter core than those of the MPV (MR1443).
2. Versatile instrument with multiple operational modesThis instrument has two separate components: a square planar transmitting array consist-ing of nine coplanar 40cm TEMTADS size Tx coils, and a detachable 3x3 array of vectorreceivers which can be either placed to collect static data or moved around above the trans-mitting coils to obtain dynamic data (see Fig. 2.1). Both of these components can be affixedto a cart for larger scale detection surveys, or can be dismounted from the cart and carried bytwo people in a gurney like configuration for cued interrogation even in rugged and/or chal-lenging terrain. For increased depth detection and possible noise reduction, an additionalmode consisting of a stationary receiver assembly and multiple transmitter positions will beinvestigated. In summary, the following operational modes will be considered and evaluatedduring this project:
(a) Carted Mode (relative geometry fixed)
B. Barrowes, D. George, F. Shubitidze -1-

MR-1712 - Interim Report 2 OBJECTIVES
Figure 2.1: Conceptual design of the proposed sensor. Flexible modes of operation allow either cart mountedor man portable operation, static or dynamic data acquisition. This bistatic configuration allows greaterpositioning accuracy, improved depth detection, and deployment in difficult terrain. The nine red squarescorrespond to the Tx coils, while the receiver array is located on top of the Tx coils in the top figure.
(b) Cued Interrogation Mode (receivers detached, transmitters stationary [with or withoutcart])
(c) Man-Portable Detection Mode(d) Superposition Mode (receivers stationary, transmitters moved around)
3. Integrated positioning system (see Sec. 3.3)To use data from bistatic instruments, the local position of the sensor must be known withas high precision as possible. To this end, a novel beacon positioning system will be imple-mented into this instrument with the goal of attaining subcentimeter (possibly submillimeter)
B. Barrowes, D. George, F. Shubitidze -2-

MR-1712 - Interim Report 2 OBJECTIVES
level positioning of the receiver coil assembly relative to the transmitters. The receivers willdetect the primary magnetic field during the “on” time of the (stationary) transmitter. Com-bining and averaging the data from each of the transmitters will allow precise positioningof the receiver cubes by detecting the powerful and well known primary fields. These samereceiver cubes will then collect EMI data during the transmitter “off” time.
This multimode bistatic portable array instrument, called Pedemis (PortablE Decoupled Elec-tromagnetic Induction System), will fulfill these objectives based on research into the optimal size,constitution, and configuration of transmitters, receivers, and supporting hardware while also in-corporating several improvements over existing sensors (Sec. 3.2). This new positioning methodwill add to the information content of the data, allowing more accurate inversions, without addingany hardware to the instrument itself. We will incorporate instrument control software which candeliver some feedback to the operator regarding targets in real time (see Sec. 4.2). As well, theflexible operation of this instrument will allow deployment in both cart-trafficable sites and morechallenging sites.
Standard models such as the dipole model [1] and more rigorous models such as the Joint Diag-onalization (JD) method [2], Orthonormalized Volume Magnetic Source Method (ONVMS) [3, 4],NSMC [5–13], and analytical models [14–20] will be applied to the data acquired from this instru-ment (Sec. 4.3). These models, in tandem with the diverse, extremely high quality data from thisinstrument will result in more accurate discrimination capability and fewer false alarms.
The new Pedemis instrument is designed to attack successfully the task of close interrogationof signal anomalies, for discriminating UXO from clutter, in non-trafficable, rugged terrain.
B. Barrowes, D. George, F. Shubitidze -3-

MR-1712 - Interim Report 3 TECHNICAL APPROACH
3 Technical Approach
3.1 Background
The detection and discrimination of UXO depend on both realistic and rigorous modeling and high-quality, diverse data. Recently, several new electromagnetic induction (EMI) sensors have beendeveloped including TEMTADS (MR-0601, MR-1315), MetalMapper (MR-0603), BUD (MR-0437), Geometrics integrated magnetometers (MR-1512), and our MPV (MR-1443 continued inMR-201005) and GEM-3D+(MR-1537). These sensors represent the state of the art in the elec-tromagnetic induction sensing. However, there is still significant room for improvement. Forexample, most of the recent sensors are cart based systems meant for rapid surveying of sites withbenign terrain. As a result, the geometry of the sensor is fixed, which limits data diversity bylimiting the collection of data at only fixed location(s) above a target. Inversion modeling is thenbased on a few data points and a limited look at each anomaly. If additional data points (i.e. dif-ferent transmitter locations) are used in modeling an anomaly, geolocationing between data pointsbecomes critical but is limited in accuracy by the geolocationing system itself and cart motion. Inaddition, if there are multiple targets (counting clutter) in the field of view of the sensor, the limiteddata collected at one location may not be sufficient to resolve multiple targets. Moreover, thesecarted sensors cannot be deployed at treed sites or sites with challenging terrain (see e.g. Fig. 3.1).
Figure 3.1: Examples of challenging terrain for which Pedemis could be deployed.
B. Barrowes, D. George, F. Shubitidze -4-

MR-1712 - Interim Report 3 TECHNICAL APPROACH
Recent man-portable sensors include the MPV [21, 22], GEM-3D+and the “mini-TEMTADS”.The MPV shows promise with its five vector receivers, large sensor head, excellent SNR, and gooddepth of detection. With it we have been able to show excellent discrimination results at the CampBeale ESTCP demonstration site. Even with these encouraging results, the MPV has shown someweaknesses in the areas of positioning, data acquisition modes, and physical design. The beaconpositioning system conceived in ESTCP MR-0738 and implemented in the new MPV2 is simplerto operate and will work in treed and challenging sites. However, this positioning system adds tothe overall complexity of the instrument, adds time to data acquisition procedures, and currently atbest provides only 1 cm RMS positioning error. For high fidelity modeling and operational issues,a more accurate and less complicated positioning scheme is desired. Here we make the distinctionbetween positioning, or knowing the position of the Rx coils locally relative to the Tx coil, andgeolocationing, or knowing where the sensor is globally (using using e.g. GPS or RF).
All of the above mentioned sensors are monostatic or multistatic with the transmitter coil(s)either collocated with or physically attached to the receiver coils. While there are some advantagesto this arrangement (not the least of which is ease of design), data from monostatic sensors aremore difficult to model for some algorithms (e.g. upward continuation techniques from MR1590).The user is also typically forced into choosing either a carted sensor and its ability to stop andacquire a few high SNR data points, or a handheld sensor and its forte of acquiring copious dataas it is dynamically moved about. A sensor which combines both operational modes would be asignificant improvement over these existing sensors. In addition, in multi-static deployment of thisproposed sensor, because the Rx coils are movable with respect to the Tx coils, various operationalmodes which reduce noise and increase data quality are possible (see Sec. 4.3). Our Rx coil arrayalso has the ability to acquire spatial tensor gradients of the magnetic field which help in findingthe location of dipolar sources [23, 24] (see Sec. 4.3).
3.2 Pedemis Design
The Pedemis hardware can be considered in three major parts:
1. Tx array
2. Rx array
3. Controlling electronics
The following sections will describe the design considerations of each of these three aspects of theinstrument. As we designed Pedemis, we kept in mind the following design objectives:
1. maintain physical decoupling of Tx and Rx arrays (see Sec. 3.2.a and Sec. 3.2.b)
2. high SNR data
3. the target should be illuminated from multiple look angles (see Sec. 3.2.a)
4. Tx weight plus Rx weight remain under 45 pounds (see below)
5. 2 minute or less primary data collection sequence (excludes a follow up interrogation forsuspected deep targets, see Sec. 3.5)
6. controlling electronics be lighter weight than previous instruments (see Sec. 4.2)
B. Barrowes, D. George, F. Shubitidze -5-

MR-1712 - Interim Report 3 TECHNICAL APPROACH
7. flexible, simple, and robust user interface (see Sec. 4.2)
8. at most, two people required to operate
9. subcentimeter positioning of the Rx array (see Sec. 3.3)
10. be able to apply our advanced models at both the data acquisition stage and post processingstage
As of January, 2012, the Tx and Rx arrays have been fabricated as shown in Figs. 3.2–3.4.
Figure 3.2: Pedemis Tx array. Tx loops are the same size and template as the TEMTADS coils. 35cm loopsize with 40cm between centers. See Sec. 3.2.a for more information about the Pedemis transmitter array.
The combined weight of these arrays is about 38 pounds which does not include cabling or gurneypoles. The Tx array is 1.2 meters on a side, while the Rx array is 50cm on a side. The overallweight of the controlling electronics (NI cRIO) plus batteries is approximately 20 pounds. Themostly fabricated Pedemis instrument described herein fulfills the above design goals, resulting inan advanced and effective EMI instrument capable of acquiring high quality data from a flexibleplatform.
3.2.a Pedemis Tx Array
We considered various designs for the Pedemis Tx array. Here is a list of the designs considered:
B. Barrowes, D. George, F. Shubitidze -6-

MR-1712 - Interim Report 3 TECHNICAL APPROACH
Figure 3.3: Pedemis Rx array on top of the Tx array. Rx receiver coils are the same size and template asthe MPV2 coils. Receiver coils have an 8cm loop size with 20cm between centers. See Sec. 3.2.b for moreinformation about the Pedemis receiver array.
1. 4 or 9 horizontal coplanar coils
2. 4 vertical side coils or not
3. 1 large encompassing coil or not
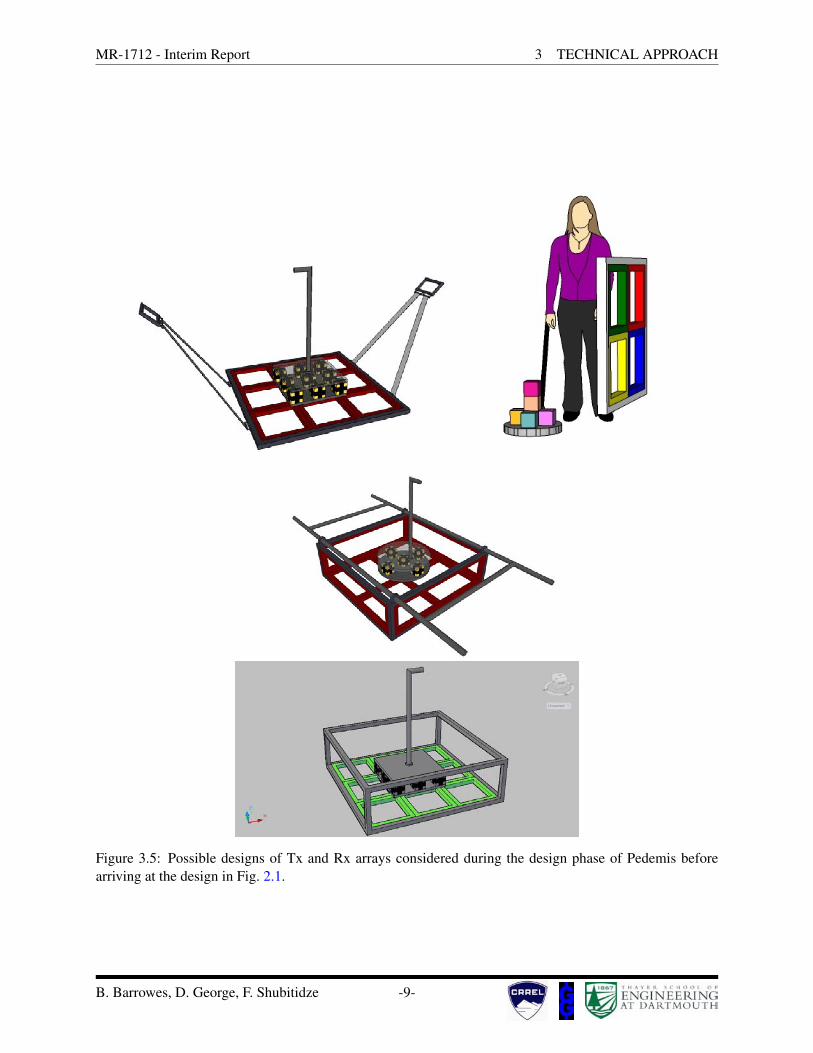
Together there were 8 possible base configurations not counting sizing of the coils. Figure 3.5shows some possibilities we considered during the design phase of Pedemis.
B. Barrowes, D. George, F. Shubitidze -7-
MR-1712 - Interim Report 3 TECHNICAL APPROACH
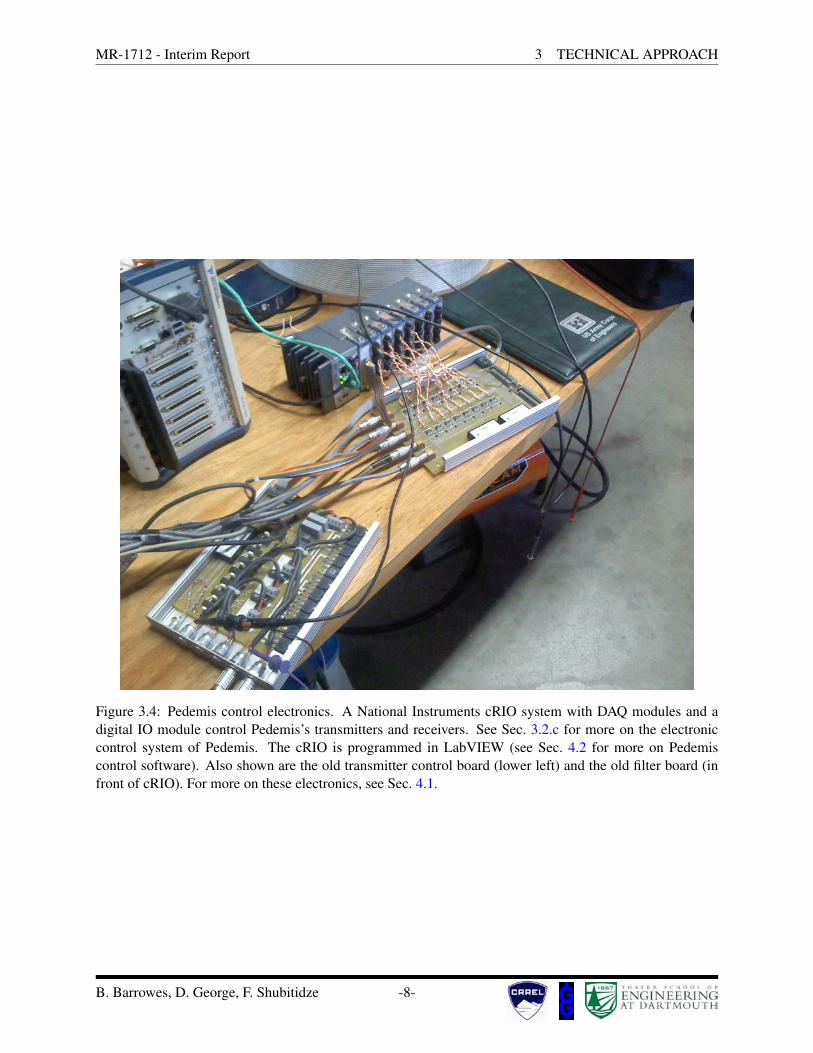
Figure 3.4: Pedemis control electronics. A National Instruments cRIO system with DAQ modules and adigital IO module control Pedemis’s transmitters and receivers. See Sec. 3.2.c for more on the electroniccontrol system of Pedemis. The cRIO is programmed in LabVIEW (see Sec. 4.2 for more on Pedemiscontrol software). Also shown are the old transmitter control board (lower left) and the old filter board (infront of cRIO). For more on these electronics, see Sec. 4.1.
B. Barrowes, D. George, F. Shubitidze -8-
MR-1712 - Interim Report 3 TECHNICAL APPROACH
Figure 3.5: Possible designs of Tx and Rx arrays considered during the design phase of Pedemis beforearriving at the design in Fig. 2.1.
B. Barrowes, D. George, F. Shubitidze -9-
MR-1712 - Interim Report 3 TECHNICAL APPROACH
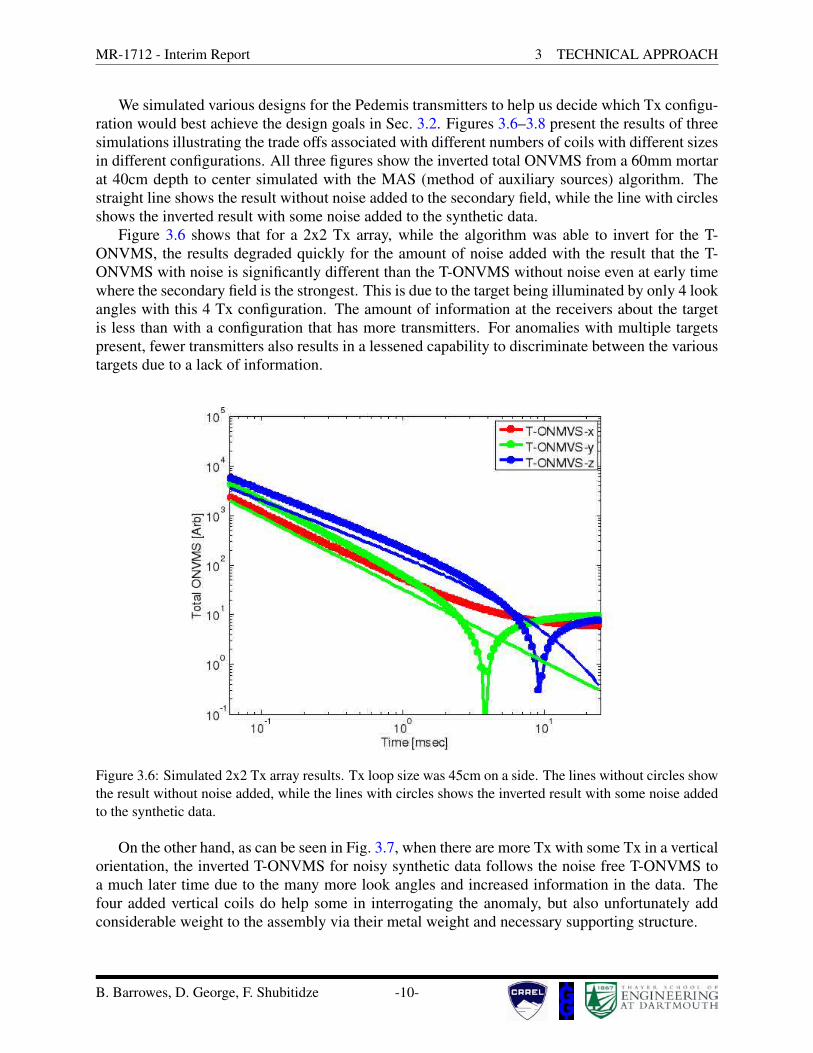
We simulated various designs for the Pedemis transmitters to help us decide which Tx configu-ration would best achieve the design goals in Sec. 3.2. Figures 3.6–3.8 present the results of threesimulations illustrating the trade offs associated with different numbers of coils with different sizesin different configurations. All three figures show the inverted total ONVMS from a 60mm mortarat 40cm depth to center simulated with the MAS (method of auxiliary sources) algorithm. Thestraight line shows the result without noise added to the secondary field, while the line with circlesshows the inverted result with some noise added to the synthetic data.
Figure 3.6 shows that for a 2x2 Tx array, while the algorithm was able to invert for the T-ONVMS, the results degraded quickly for the amount of noise added with the result that the T-ONVMS with noise is significantly different than the T-ONVMS without noise even at early timewhere the secondary field is the strongest. This is due to the target being illuminated by only 4 lookangles with this 4 Tx configuration. The amount of information at the receivers about the targetis less than with a configuration that has more transmitters. For anomalies with multiple targetspresent, fewer transmitters also results in a lessened capability to discriminate between the varioustargets due to a lack of information.
Figure 3.6: Simulated 2x2 Tx array results. Tx loop size was 45cm on a side. The lines without circles showthe result without noise added, while the lines with circles shows the inverted result with some noise addedto the synthetic data.
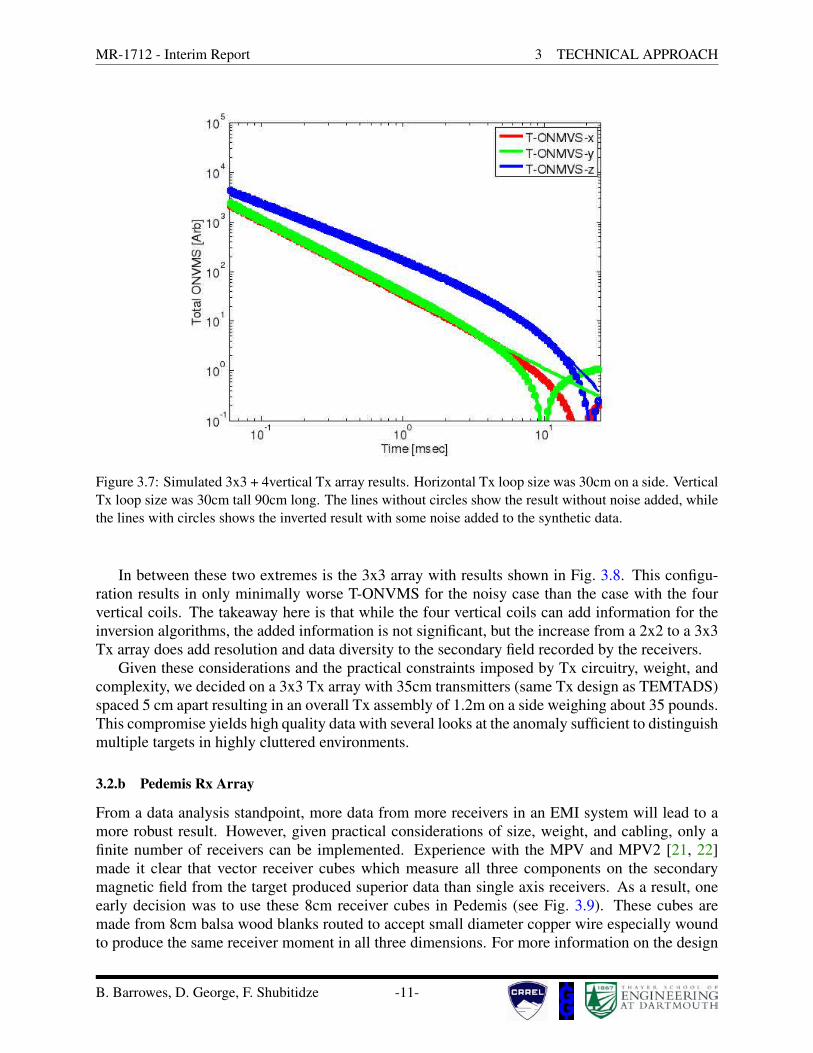
On the other hand, as can be seen in Fig. 3.7, when there are more Tx with some Tx in a verticalorientation, the inverted T-ONVMS for noisy synthetic data follows the noise free T-ONVMS toa much later time due to the many more look angles and increased information in the data. Thefour added vertical coils do help some in interrogating the anomaly, but also unfortunately addconsiderable weight to the assembly via their metal weight and necessary supporting structure.
B. Barrowes, D. George, F. Shubitidze -10-
MR-1712 - Interim Report 3 TECHNICAL APPROACH
Figure 3.7: Simulated 3x3 + 4vertical Tx array results. Horizontal Tx loop size was 30cm on a side. VerticalTx loop size was 30cm tall 90cm long. The lines without circles show the result without noise added, whilethe lines with circles shows the inverted result with some noise added to the synthetic data.
In between these two extremes is the 3x3 array with results shown in Fig. 3.8. This configu-ration results in only minimally worse T-ONVMS for the noisy case than the case with the fourvertical coils. The takeaway here is that while the four vertical coils can add information for theinversion algorithms, the added information is not significant, but the increase from a 2x2 to a 3x3Tx array does add resolution and data diversity to the secondary field recorded by the receivers.
Given these considerations and the practical constraints imposed by Tx circuitry, weight, andcomplexity, we decided on a 3x3 Tx array with 35cm transmitters (same Tx design as TEMTADS)spaced 5 cm apart resulting in an overall Tx assembly of 1.2m on a side weighing about 35 pounds.This compromise yields high quality data with several looks at the anomaly sufficient to distinguishmultiple targets in highly cluttered environments.
3.2.b Pedemis Rx Array
From a data analysis standpoint, more data from more receivers in an EMI system will lead to amore robust result. However, given practical considerations of size, weight, and cabling, only afinite number of receivers can be implemented. Experience with the MPV and MPV2 [21, 22]made it clear that vector receiver cubes which measure all three components on the secondarymagnetic field from the target produced superior data than single axis receivers. As a result, oneearly decision was to use these 8cm receiver cubes in Pedemis (see Fig. 3.9). These cubes aremade from 8cm balsa wood blanks routed to accept small diameter copper wire especially woundto produce the same receiver moment in all three dimensions. For more information on the design
B. Barrowes, D. George, F. Shubitidze -11-

MR-1712 - Interim Report 3 TECHNICAL APPROACH
Figure 3.8: Simulated 3x3 Tx array results. Tx loop size was 30cm on a side. The lines without circles showthe result without noise added, while the lines with circles shows the inverted result with some noise addedto the synthetic data.
of these Rx cubes, see the MPV-II documentation.The question of how many Rx cubes to implement on Pedemis involves many considerations
including weight, complexity, number of DAQ modules in the NI cRIO, cabling issues, protocol(see Sec. 3.5), operator fatigue, etc. Each receiver cube requires an additional preamplifier boardnear the cube itself to minimize stray EM noise from the surroundings. Additionally, 9 separatewires and 3 DAQ channels are required to accommodate each cube. Originally, we considered a6x6 stationary Rx array for Pedemis, but abandoned that due to practical considerations. Perhaps ifa multiplexed Rx array were to be designed, then this number of Rx channels (3×36 = 108) couldbe accommodated. Aside from these practical matters, we wanted the Rx array to be physicallydecoupled from the Tx array, so this fixed design was not implemented.
The 6x6 array of 20cm spaced secondary field samples was still desirable, however, so a com-promise 3x3 array moved into the 4 corners on top of the Pedemis Tx array was suggested. The20cm sampling size in our analysis is sufficient to discriminate between objects in close proximitywithout being redundant for most anomalies seen to date. Though the 3x3 array would requiremoving the Rx array 4 times for the most detailed data shot, the advantages of dense, high qualitydata while preserving a manageable cabling and DAQ module load outweighed the increase incomplexity of the data acquisition protocol. This compromise also conveniently allowed the Rxarray to be decoupled from the Tx array while keeping the weight to about 10 pounds. See Sec. 3.5for more information on Pedemis deployment protocols. The position of the Rx array is calculatedvia measurements of the primary field during the “on” time of the Pedemis transmitters. For moreon this positioning method, see Sec. 3.3.
B. Barrowes, D. George, F. Shubitidze -12-

MR-1712 - Interim Report 3 TECHNICAL APPROACH
Figure 3.9: Receiver cubes from the MPV-II instrument also used in the new Pedemis. Cubes are made from8cm balsa wood blanks routed to accept small diameter copper wire.
3.2.c Pedemis Control Electronics
Pedemis uses the NI cRIO for controlling the Tx and Rx arrays and associated circuitry. Thisrepresents a step forward from prior portable EMI systems like the MPV-II in terms of weight,power usage, and decreased complexity. The weight of the cRIO chassis and modules is around 8pounds compared to over 20 for the full PXI chassis and related electronics. Instead of 3 lithiumion batteries and 3 hour swap intervals, we expect to use only 2 of these batteries with a 5-6 hourswap interval. Also, the cRIO chassis, with its integrated modules, is simpler and more robust thanthe prior full PXI chassis, but the cRIO is still a fully functioning field ready computing platform.There are 4 main components to the cRIO control system shown in Fig. 3.10 and Fig. 3.4:
B. Barrowes, D. George, F. Shubitidze -13-

MR-1712 - Interim Report 3 TECHNICAL APPROACH
1. CRIO-9022, Real-Time PowerPC Embedded Controller for CompactRIO, 533 MHz, 2 GBstorage, 256 MB DRAM
2. cRIO-9116, 8-slot Virtex-5 LX 85 Reconfigurable Chassis for CompactRIO
3. NI 9222, 4-Ch, 10 V, 16-Bit, 500 kS/s, Simultaneous AI C Series Module for CompactDAQand CompactRIO (Pedemis needs 7 of these: 27 Rx channels and 1 Tx current channel)
4. NI 9401 8-Channel, 100 ns, TTL Digital Input/Output Module
Figure 3.10: Pedemis control electronics. Upper figure is as designed at NI.com. Lower figure is as config-ured for the initial data reported in Sec. 4.3. The NI-9401 is in the leftmost slot while the 7 NI-9222’s are inthe remaining 7 slots of the 8 slot chassis.
The only current disadvantage to using the NI-cRIO platform is that G&G’s EM3D control soft-ware written in Visual Basic and C# would not run on the cRIO, thus necessitating programmingPedemis control software in LabVIEW from scratch. We have made progress in programming thissoftware, and this is discussed in more detail in Sec. 4.2.
3.3 Pedemis Rx Positioning
The Rx array on Pedemis is not held in a fixed geometry relative to the Tx array except as noted inSec. 3.5 for cued interrogation mode #1. As a result, the position of the Rx array must be retrieved
B. Barrowes, D. George, F. Shubitidze -14-

MR-1712 - Interim Report 3 TECHNICAL APPROACH
in order for data shots taken at different Rx array positions to be be meaningful. This position ofthe Rx array is found on Pedemis by a beacon positioning approach, an approach first conceivedin our MR-1537 GEM-3D+project and continued in MR-1443 MPV and MR-201005 MPV2.
The beacon positioning concept relies on the capability of the receivers to measure the strengthof the primary field when each transmitter is being energized. After these data from the “on”time of the transmitter are recorded, the receivers then collect EMI data from the “off” time ofthe transmitters. Given these “on” time data, the geometry of the transmitters, and a record of thecurrent in the energized transmitter, it is possible to calculate where the Rx array is in 3D space tounder 1cm accuracy when the Rx array is within 2 meters of the Tx array.
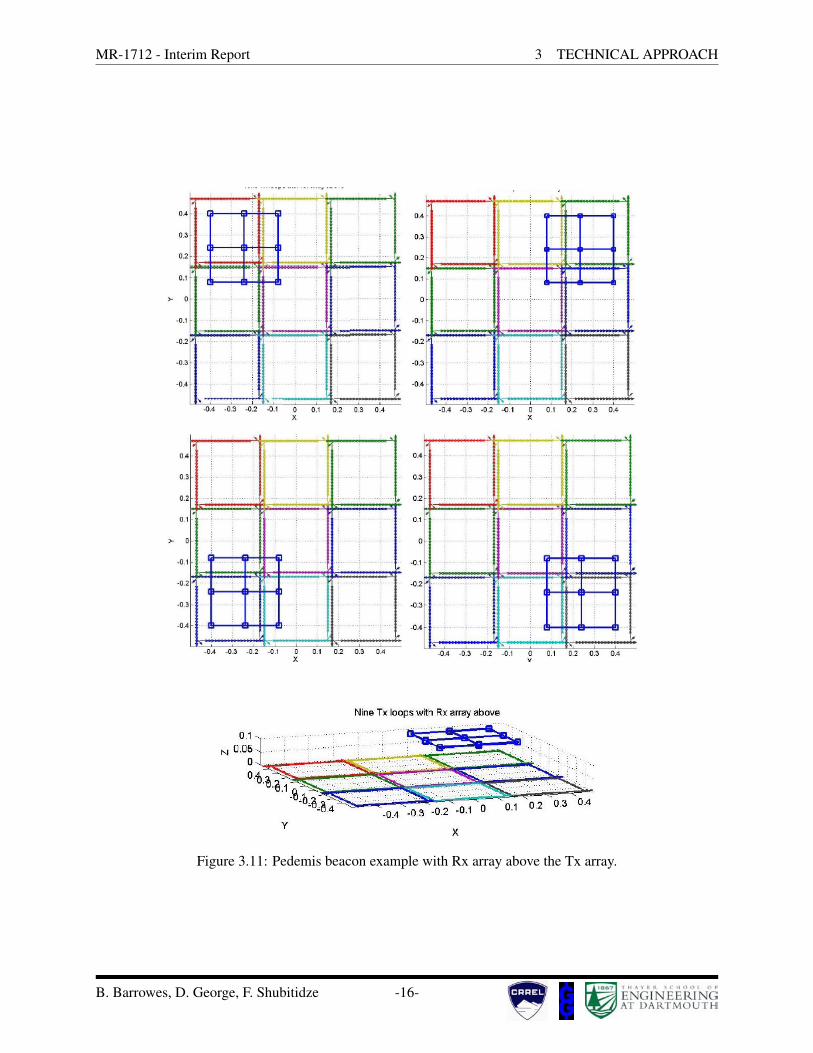
We modeled the Pedemis beacon positioning system in order to predict how accurate we couldexpect the calculated position to be. Figure 3.11 shows an example of the Rx array above a modelof the Tx array with the closest receiver at least 10cm away from the Tx coils. Using our simulationas a sanity check, if we use all four expected Rx array locations (as in cued interrogation mode #2,see Sec. 3.5), there is essentially only numerical error on the order of machine precision for theinverted position of the Rx array (see Fig. 3.12).
After these types of sanity checks, we also wanted to make sure targets under the Tx arraywould not distort the primary field sufficiently to degrade the “on” time measurements and producea false position. To this end, we added a simulated 10cm sphere only 10cm below the center ofthe Tx array to see what effect it would have on the primary field and thereby the inverted Rxarray position. Figure 3.13 shows the log10 positional error in the inverted Rx array location whenthe Rx array is 10cm above the Tx array and the sphere is present. Even though the presence ofthe sphere caused up to 1.5% perturbation of the primary field for some Tx/Rx combinations, theoverall position of the Rx array was accurate to within less than 1mm.
We applied the algorithms developed during the simulation phase to the initial data collectedin November 2011 in Grand Junction, CO (see Sec. 4.3). For the data shot #3 in Sec. 4.3, theMPV2 sensor head was left in one location (at the bottom right corner of the Tx array) while allnine transmitters fired in turn (see Fig. 4.3). For this case, with the Rx array directly over the(undamped) transmitters, the error in the inverted Rx array position was 2-3mm, which is on theorder of our physical measurement expected error.
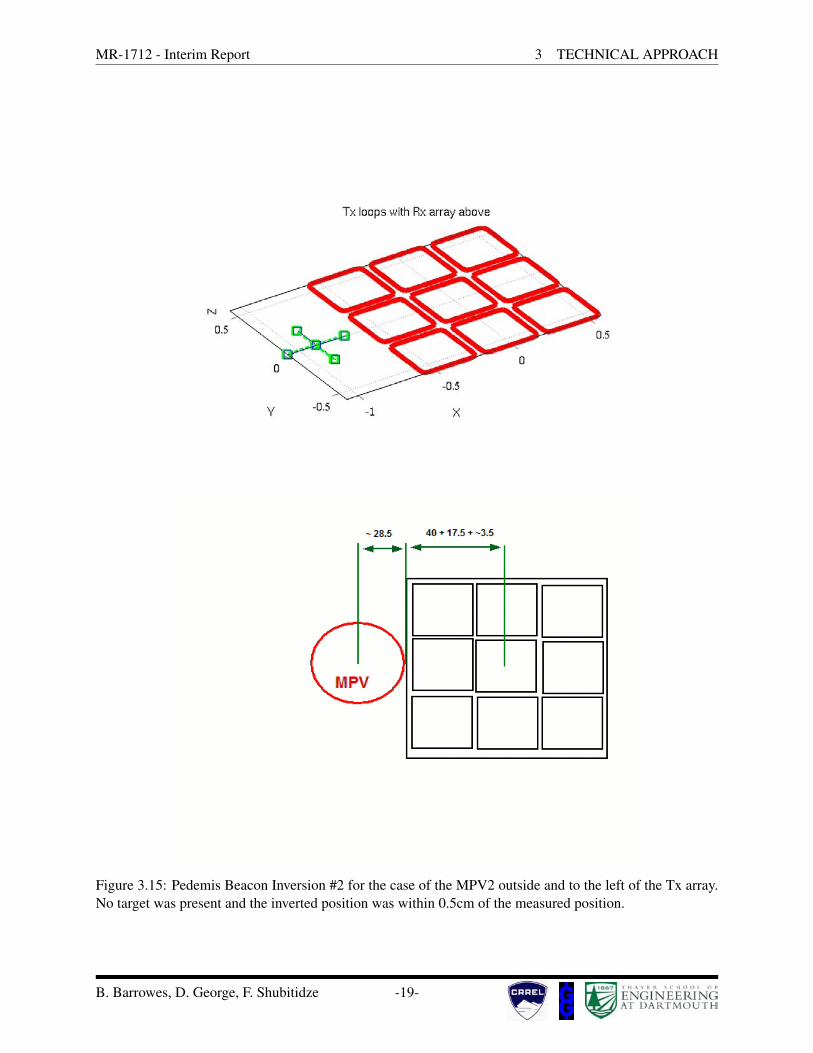
Our final test corresponding to data shot #4 in Sec. 4.3 tested whether the position of theRx array could be inverted for even when the Rx array was positioned outside the Tx array (seeFig. 3.14). Figure 3.15 shows the inverted position of the Rx array using our algorithms. Inthis case as well, the inverted position was withing half a centimeter which is within the manualpositioning and measurement error.
These results are encouraging in that they suggest that the beacon positioning system and al-gorithms can invert for the position of the Rx array when the Rx array is within a meter of the Txarray. The accuracy appears to be within 1cm and in most cases on the order of a few millimeters.
More details on the exact algorithms developed for Pedemis positioning will be included in thefinal report.
B. Barrowes, D. George, F. Shubitidze -15-
MR-1712 - Interim Report 3 TECHNICAL APPROACH
Figure 3.11: Pedemis beacon example with Rx array above the Tx array.
B. Barrowes, D. George, F. Shubitidze -16-
., 0.4 \
0.3
0.2 -0. I
>- 0
-0. I
-0.2 ,.
-0.4
.0.4 ·03 -0.2 -01 0 X
0.4
0.3
0.2
01
)- 0
·01
·0.2
-03
-0.4
·0.4 · 0.3 -0.2 -0.1 0 X
y
0.1
.~
. I
I
0.1
'
~ . 02 03 04
0.2 0.3 0.4
0 .4
0.3
0 .1
·0.1
·0.2
· 0 .3
-0.4
OA
0. 3
0.2
0. I
0
I
-0.2
3
-OA
~----"1----!---~r-----'~
-0.4 .0.3 -02 ·0 .1 0 0.1 02 0.3 0.4 X
•
-
'
-0.4 -0.3 -0.2 -0.1 0 0.1 0.2 0.3 0.4 l(
Nine Tx loops with Rx array above
X

MR-1712 - Interim Report 3 TECHNICAL APPROACH
Figure 3.12: Pedemis beacon example error. For this synthetic case, the error is essentially only numericalerror on the order of machine precision for the inverted position of the Rx array.
Figure 3.13: Pedemis beacon target induced error from a sphere placed under the Tx array.
B. Barrowes, D. George, F. Shubitidze -17-

MR-1712 - Interim Report 3 TECHNICAL APPROACH
Figure 3.14: Pedemis Beacon Inversion #1 for the case of the MPV2 at the lower right hand corner of theTx array. No target was present and the inverted position was within 0.5cm of the measured position.
B. Barrowes, D. George, F. Shubitidze -18-
MR-1712 - Interim Report 3 TECHNICAL APPROACH
Figure 3.15: Pedemis Beacon Inversion #2 for the case of the MPV2 outside and to the left of the Tx array.No target was present and the inverted position was within 0.5cm of the measured position.
B. Barrowes, D. George, F. Shubitidze -19-
N
0.5
y -0.5
T x loops with Rx array above
-1 X
- 28.5 40 + 17.5 + - 3.5 .............. ...
D D D D DOD

MR-1712 - Interim Report 3 TECHNICAL APPROACH
3.4 Background Subtraction
All EMI instruments generally have to account for background noise when acquiring data or theresults may be poor or corrupted. With all prior EMI instruments, the transmitter(s) and receiver(s)have been in a fixed geometry with respect to each other, so acquiring a background shot was arelatively simple matter of finding a quiet location and acquiring a data shot. Because the Tx andRx arrays on Pedemis are not in a fixed geometry, the “background” is not as simple to acquireand remove from the data. Background due to instrument noise is one type of background that wewould definitely like to remove from Pedemis data. But if the Rx array is at all moved off froma prior location, the instrument noise will change dramatically mainly because the Tx coils are soclose to the receivers. These Tx could can act like targets themselves, but their influence in theEMI data is considered instrument noise and is undesirable.
Our plan to remove this noise could center on simply taking thousands of measurements andinterpolating between them in the 6-space consisting of Pedemis’s 3D location in space and itscurrent 3 Euler angles. Not only is that laborious, but trying to get that many measurements,including in the 2 meters outside the Tx array could take years even on an automated platform likethe ERDC test stand.
Instead, we plan to reproduce the response (AKA instrument noise or instrument background)from the Tx coils using an equivalent source approach similar to the NSMS method. These equiva-lent sources will be found from a much smaller set of normal background measurements at knownlocations. Once this set of sources is known, the time domain response from the coils (as repre-sented by the sources) can be quickly calculated anywhere in space. The location of the Rx arraywill be known from the Pedemis beacon type positioning as described in Sec. 3.3. Any future back-ground type measurements in the air will be added to the training routine for the equivalent sourcesand their accuracy will be improved. This instrument background subtraction routine will be builtinto Pedemis so that any data collected by Pedemis will have this instrument noise removed beforerecording the data. Note that this solution for this instrument noise does not address the issue ofgelogical noise in the EMI due to the soil.
B. Barrowes, D. George, F. Shubitidze -20-

MR-1712 - Interim Report 3 TECHNICAL APPROACH
3.5 Pedemis Operation Protocol
There will be several data collection protocols for using Pedemis depending on whether Pedemiswill be used for detection and cued interrogation, and what the data quality is over each target. IfPedemis is to be used for the detection segment of the survey, then Pedemis is put into detectionmode (see below for mode descriptions) until an anomaly is detected. Once detected, Pedemis isthe placed over the anomaly, and data is acquired in cued interrogation mode #1. After this datais collected, a determination is made whether Pedemis should either 1) enter interrogation mode#2 (for widespread multiple targets) or #3 (for deep targets) or data collection over this anomalyshould conclude.
Pedemis will have the following data collection protocols:
• Detection Mode – Data is acquired at 10 samples per second as Pedemis is transported overthe ground. A plot of the z-component of the magnetic field will be displayed in real time oncontrolling device to facilitate anomaly detection. The Rx array is centered on the Tx arrayand fixed in position.
• Cued Interrogation Mode #1 – This mode directly follows a detection. Pedemis is set downcentered over the anomaly with the Rx array still fixed in position. A static data shot usingall nine Tx coils and all 9 receivers in this configuration is then taken. This data shot willtake around 30 seconds. Depending on the results of this data, users will follow one of thefollowing three courses of action:
1. Enter Cued Interrogation Mode #2
2. Enter Cued Interrogation Mode #3
3. Resume Detection Mode
• Cued Interrogation Mode #2 (for multiple and/or widespread targets) – Based on thedata from cued interrogation mode #1 using the JD method, a determination will be made(at first by expert users, later by computer algorithm) whether there are multiple and/orwidespread targets in the field of view of Pedemis. If this is the case, then this interroga-tion mode is used. In this mode, the Rx array is positioned near each of the four corners ofthe Tx array in sequence (see the sketch in Fig. 3.16) for four 30 second data shots. Totaltime for this interrogation will be about 2 minutes. This mode provides an equivalent 6x6array of vector magnetic field values from 9 independent transmitters over a 1.2m squarearea. These four positions avoid the Tx coils as much as possible (3.5cm smallest lateralseparation) while yielding a uniform 6x6 composite data shot.
• Cued Interrogation Mode #3 (for deep targets) – This cued interrogation mode is usedif deep targets seem to be present, but the data is not of sufficient SNR to make a reliableclassification of the target. For this mode, the Rx array is left in the center of the Tx array (asin detection and cued #1 modes), but a longer data shot is acquired in order to integrate moresamples and thus increase SNR for deep targets. This data shot may take up to 5 minutes tocomplete depending on the desired SNR.
During MR-1712, the determination of which data protocol to follow will be made by expertusers, however we hope to be able to systematize the decision process into computer algorithms infuture Pedemis work.
B. Barrowes, D. George, F. Shubitidze -21-

MR-1712 - Interim Report 4 RESULTS AND DISCUSSION
Figure 3.16: Pedemis DAQ Position #1 sketch. 35cm transmitters with 5cm spacing. The 50cm Rx array isshown in the lower left quadrant (AKA position “#1” of 4). These four positions avoid the Tx coils as muchas possible while yielding a uniform 6x6 composite data shot.
4 Results and Discussion
4.1 Pedemis Hardware and Fabrication
As of January, 2012, the Tx and Rx arrays have arrays have been fabricated as shown in Figs. 3.2–3.4. The combined weight of these arrays is about 38 pounds which does not include cabling orgurney poles. The Tx array is 1.2 meters on a side, while the Rx array is 50cm on a side. Theoverall weight of the controlling electronics (NI cRIO) plus batteries is approximately 20 pounds.
The control electronics, the NI cRIO platform described in Sec. 3.2.c, have been acquired andshown to perform well given the prototype stage of the control software described in Sec. 4.2. Thecables for Pedemis need to be constructed and connected to the Tx and Rx arrays.
As part of the Pedemis project, G&G Sciences has had enough funding to perform a criticalredesign on the both the transmitter control board and the anti-aliasing filter board. The transmittercontrol board currently handles only up to 3 transmitters at once and is outdated in other ways.This board will be redesigned and constructed to have 9 transmitters on a single board, thus savingweight and complexity. In addition, the anti-aliasing filter board will also be redesigned to accom-
B. Barrowes, D. George, F. Shubitidze -22-

MR-1712 - Interim Report 4 RESULTS AND DISCUSSION
modate more channels and to use updated components. These upgraded circuit boards will benefitother current and future projects which use G&G Sciences hardware.
We still need to decide on what GPS to use with Pedemis and how exactly to broadcast thewebpage.
4.2 Pedemis DAQ Control Software
At the Partners in Environmental Technology Symposium hosted by SERDP and ESTCP in Wash-ington DC in November 2011, one of the main comments from industry who worked with theMetalMapper was that the interface was difficult to use. One reason for this was the jump fromthe software being used by the programmer (David George) to being used by those who didn’twrite the software and weren’t used to all the particulars associated with digital geophysical map-ping with advanced EMI instruments. These comments underscored the need for simple to use yetpowerful software to control advanced EMI instruments like Pedemis.
Our goal with the Pedemis control software in written in LabVIEW is to program such a robust,powerful, simple, yet flexible and intuitive interface based on the web browser concept of tabs fordifferent functionality. For example, one tab or window of the browser would be dedicated toconfiguring data acquisition parameters for Pedemis. This tab would be available, but rarely usedin the field. Another tab would display information regarding the current or next anomaly andwould have a simple button for data collection, a comment box, and a field plot for checkingproper operation of the receivers. Yet another tab could be for a more in depth analysis of thecurrent data using techniques such as JD or a Gauss Newton multiple dipole search [1]. Anynearby web enabled device should be able to connect to and control Pedemis, from a smart phoneto an iPad, to a laptop computer.
The cRIO-9022 controller communicates with the cRIO-9116 FPGA chassis both controllingit and receiving data from the modules. This RT controller will also host this webserver describedabove. Most of the calculations and higher level operations are controlled on the RT controllerwhile the FPGA mainly specializes in collecting the data itself. Figure 4.1 shows part of theVirtual Instrument (VI) which runs on the RT controller.
The NI-9222 modules collect data from 4 channels at 500KS/s which is sufficient for the timebands we are interested in with Pedemis (100µs to 25ms). Seven of these modules are needed dueto the 27 receiver channels from the nine triaxial receiver cubes, and another channel monitors thetransmitter current. The core function of the VI that runs on the cRIO-9116 FPGA chassis can beseen in Fig. 4.2.
Both the RT VI in Fig. 4.1 and the FPGA VI in Fig. 4.2 have what’s referred to as a “frontpanel” that displays the information associated with each VI. The prototype front panel for thedata collection reported in Sec. 4.3 performed with only minimum functionality, but was sufficientfor acquiring data from Pedemis’s 9 transmitters. This interface will be continually improvedthroughout the remainder of this project and throughout any follow-on work.
4.3 Initial Data, November 2011
We were able to collect initial proof of concept data outside of G&G Sciences office in GrandJunction, CO in November, 2011. Pedemis was not fully fabricated, and the main differencebetween the hardware used to collect these data and the finished instrument are as follows:
B. Barrowes, D. George, F. Shubitidze -23-

MR-1712 - Interim Report 4 RESULTS AND DISCUSSION
Figure 4.1: Partial view of Pedemis RT control software. This VI manages file I/O, runs the webserver,performs the averaging and data analysis, and controls most all functions except actual data collection itselfwhich is handled on the cRIO-9116 FPGA chassis.
1. Tx array – The individual Tx coils were fabricated for this initial data, but the associatedcabling had not been. As a result, we had to manually hook up each transmitter during datacollection. As another result, because these coils were open circuit (if not the one beingenergized), they tended to have a longer than usual secondary z-component response for thereceivers. Thus, the z-component of the received field is noisier than the x or y componentsin this initial data.
2. Rx array – The Rx array was fabricated, but the cabling to hook it up to the cRIO DAQwas not complete. Instead, we used the 5 receiver cubes and associated cabling of the MPV2for this initial data. The MPV2 Rx cubes are the same design as the Pedemis cubes, sothese preliminary results should be very similar to the production data once Pedemis is fullyfabricated.
3. Transmitter Control Board – As mentioned in Sec. 4.1, the transmitter control board willbe redesigned for Pedemis. For these initial data shots, we used the MPV2 transmitter control
B. Barrowes, D. George, F. Shubitidze -24-

MR-1712 - Interim Report 4 RESULTS AND DISCUSSION
Figure 4.2: Pedemis FPGA control software. This VI
board.
4. Analog Anti-aliasing Filters – Likewise with the anti-aliasing filter boards, since these willbe redesigned for Pedemis, we used the MPV2 board.
We did use the cRIO based system with the LabVIEW VIs described in Sec. 4.2 to control theboards and sample the output of the Rx channels after the filter board (see Fig. 4.1). The corefunctionality of these VIs will be improved during the remainder of the project, but the core controllogic is complete.
Figure 4.3 show the data acquisition setup and process at Grand Junction, CO in November,2011. Data was collected (a “shot”) at 5 MPV2 positions over the Tx array with all 9 transmittersfiring in turn. In terms of orientation, the MPV2 handle is pointing in the negative y direction. Fourtotal data shots were collected:
1. A background shot
2. A shot over a 4 inch steel sphere. The sphere was located at depth 26 cm (to nearest point onsphere) under the corners of the four upper left transmitters.
3. Positioning test shot with no target. For this shot, the MPV2 sensor head was left in onelocation (at the bottom right corner of the Tx array) while all nine transmitters fired in turn.This was to test the positioning algorithms in Sec. 3.3 with no target present.
4. Positioning test shot with no target. This time, the MPV2 sensor head was outside the Txarray to the left.
B. Barrowes, D. George, F. Shubitidze -25-

MR-1712 - Interim Report 4 RESULTS AND DISCUSSION
Figure 4.3: Initial data setup in Grand Junction CO in November, 2011. The MPV2 receivers were used asthe Pedemis Rx cabling was incomplete.
The initial data was analyzed for satisfactory SNR and reasonableness in our lab. Figure 4.4shows the raw data from the 5 MPV2 receivers situated in the top left corner of the Tx array and thecenter transmitter firing. As expected, the z-components of the received magnetic field are morenoisy than the x or y components due to the open terminals at the remaining transmitter terminals.Note that we integrated and averaged one hundred 10Hz measurements for these data. Using ourGauss-Newton dipole inversion routine [1], we get the polarizabilities shown in Fig. 4.5 using onlythe x and y components of the received magnetic field.
B. Barrowes, D. George, F. Shubitidze -26-

MR-1712 - Interim Report 4 RESULTS AND DISCUSSION
10
−4
10
−2
10
01
0−
6
10
−5
10
−4
10
−3
10
−2
10
−1
10
0
cu
be
1
cub
e 2
cub
e 3
cub
e 4
cub
e 5
10
−4
10
−2
10
01
0−
6
10
−5
10
−4
10
−3
10
−2
10
−1
10
0P
edem
is d
ata:
po
siti
on
=1
, tx
=5
, −
− x
,y,z
.
d
ata−
bac
kg
roun
d
cu
be
1
cub
e 2
cub
e 3
cub
e 4
cub
e 5
10
−4
10
−2
10
01
0−
6
10
−5
10
−4
10
−3
10
−2
10
−1
10
0
cu
be
1
cub
e 2
cub
e 3
cub
e 4
cub
e 5
Figure 4.4: Example data from Pedemis. Raw data from the 5 MPV2 receivers situated in the top left cornerof the Tx array and the center transmitter firing. The lower subfigure shows the x-component, the centersubfigure shows the y-component, and the upper subfigure shows the z-component.
B. Barrowes, D. George, F. Shubitidze -27-

MR-1712 - Interim Report 4 RESULTS AND DISCUSSION
Figure 4.5: Polarizabilities from data in Fig. 4.4. These were calculated using only the x and y componentsof the received magnetic field due to the z-component being noisy (see discussion above).
B. Barrowes, D. George, F. Shubitidze -28-

MR-1712 - Interim Report 5 CONCLUSIONS TO DATE
5 Conclusions to Date
SERDP project MR-1712 entitled “Portable Electromagnetic Induction Sensor with Integrated Po-sitioning” is slightly more than halfway complete. A delay of a few months has developed dueto the other commitments of G&G Sciences. However, the remaining fabrication should be com-pleted by the end of April, 2012. The Tx and Rx assemblies are designed and fabricated. TheDAQ electronics consists of the National NI cRIO platform which is much lighter and more ef-ficient that prior DAQ platforms. Software to control the cRIO DAQ process has been written inNI’s LabVIEW. This software has been used to successfully acquire data initial over a sphere asshown in Sec. 4.3. Inversion of the data acquired during these initial tests has yielded satisfactorypolarizabilities of the spherical target. In addition, precise positioning of the Rx assembly has beenachieved via position inversion algorithms based solely on the data acquired from the receiversduring the “on-time” of the primary field (see Sec. 3.3).
Major tasks still to complete included redesigning and integrated new transmitter and filterboard control circuitry as well as final cable construction and integration. The LabVIEW programsmust also be matured to become more user friendly. A more extensive prove-out is scheduled forMay, 2012 after which will follow an extensive data analysis. Finally, we intend to go to AberdeenProving Ground in the Fall of 2012.
B. Barrowes, D. George, F. Shubitidze -29-

MR-1712 - Interim Report REFERENCES
References[1] Tomasz M. Grzegorczyk, Benjamin E. Barrowes, Fridon Shubitidze, Juan Pablo Fernandez, and Kevin O’Neill. Simultaneous
identification of multiple unexploded ordnance using electromagnetic induction sensors. IEEE Transactions on Geoscienceand Remote Sensing, 2011. ISSN 01962892. URL http://dx.doi.org/10.1109/TGRS.2011.2108302. 3, 23,26
[2] Fridon Shubitidze, Juan Fernndez, Irma Shamatava, Benjamin Barrowes, and Kevin O’Neill. Joint diagonalization applied tothe detection and discrimination of unexploded ordnance. Geophysics, submitted for publication. 3
[3] Fridon Shubitidze, Ben Barrowes, Irma Shamatava, Juano Pablo Fernndez, and Kevin O’Neill. The ortho normalized volumemagnetic source technique applied to live-site uxo data: Inversion and classification studies. SEG Special Issue, September2011. 3
[4] F. Shubitidze, D. Karkashadze, J. P. Fernandez, B. E. Barrowes, K. O’Neill, Grzegorczyk, and I. Shamatava. Applying avolume dipole distribution model to next-generation sensor data for multi-object data inversion and discrimination. Detectionand Sensing of Mines, Explosive Objects, and Obscured Targets Xv, 7664, 2010. doi: 10.1117/12.850651. 3
[5] F. Shubitidze, B. Barrowes, J. P. Fernandez, and K. O’Neill. Combined NSMC and Pseudo-Spectral Finite-Difference Methodfor Inverting a Buried Object Location. Symposium on the Application of Geophysics to Engineering and EnvironmentalProblems, 2007 . 3
[6] F. Shubitidze, B. Barrowes, J. P. Fernandez, Irma Shamatava, and K. O’Neill. NSMC for UXO discrimination in cases withoverlapping signatures. SPIE, 2007. 3
[7] F. Shubitidze, B. E. Barrowes, K. O’Neill, I. Shamatava, K. Sun, and K.D. Paulsen. Total normalized surface magnetic chargefor UXO discrimination. NATO Advanced Study Institute ”Imaging for Detection and Identification”, 23 July–5 August 2006.Ciocco, Italy. 3
[8] F. Shubitidze, B. Barrowes, and K. O’Neill. Normalized surface magnetic charge for UXO discrimination: multiple objects.SERDP Partners Symposium, November 2006. Poster. 3
[9] F. Shubitidze, K. O’Neill, B. Barrowes, J. P. Fernandez, I. Shamatava, K. Sun, and K.D. Paulsen. Application of the normal-ized surface magnetic charge model to UXO discrimination in cases with overlapping signals. J. Appl. Geophys., 61(3-4):292–303, Mar. 2007. 3
[10] F. Shubitidze, K. O’Neill, I. Shamatava, K. Sun, , and K. D. Paulsen. Total magnetic charge for fast screening ofhighly contaminated UXO sites. In proceedings of 2005 IEEE international symposium on Antennas and Propagation andUSNC/CN/URSI North American Radio Science meeting, on CD, 2005. 3
[11] F. Shubitidze, K. O’Neill, I. Shamatava, K. Sun, and K.D. Paulsen. Total magnetic charge for fast screening of highly con-taminated UXO sites. 2005 IEEE Antennas and Propagation Society International Symposium (IEEE Cat. No. 05CH37629),vol. 3A:856 – 9, 2005. 3
[12] Fridon Shubitidze, Kevin O’Neill, Irma Shamatava, Keli Sun, and Keith Paulsen. Combined differential evolution and sur-face magnetic charge model algorithm for discrimination of UXO from non-UXO items: Simple and general inversions.Proceedings of SPIE - The International Society for Optical Engineering, 5794(Part I):346 – 357, 2005. ISSN 0277-786X. 3
[13] L. R. Pasion. A unified approach to uxo discrimination using the method of auxiliary sources. Technical report, 2006. 3
[14] B. E. Barrowes, K. O’Neill, T. M. Grzegorczyk, X. Chen, and J. A. Kong. Broadband analytical magnetoquasistatic electro-magnetic induction solution for a conducting and permeable spheroid. IEEE Trans. on Geoscience and Remote Sensing, 42(11):2479–2489, 2004. 3
[15] B. E. Barrowes, K. O’Neill, T. M. Grzegorczyk, and J. A. Kong. On the asymptotic expansion of the spheroidal wave functionand its eigenvalues for complex size parameter. Studies in Applied Mathematics, 113(3):271–301, Oct. 2004. 3
[16] Chi On Ao, Henning Braunisch, Kevin O’Neill, and Jin Au Kong. Quasi-magnetostatic solution for a conducting and perme-able spheroid with arbitrary excitation. IEEE Trans. Geosci. Remote Sensing, 40:887–897, Apr. 2002. 3
[17] Henning Braunisch, Chi On Ao, Kevin O’Neill, and Jin Au Kong. Magnetoquasistatic response of conducting and permeableprolate spheroid under axial excitation. IEEE Trans. Geosci. Remote Sensing, 39:2689–2701, Dec. 2001. 3
B. Barrowes, D. George, F. Shubitidze -References--30-

MR-1712 - Interim Report REFERENCES
[18] X. Chen, K. O’Neill, B. E. Barrowes, T. M. Grzegorczyk, , and Jin Au Kong. Application of a spheroidal mode approachwith differential evolution in inversion of magneto-quasistatic data for UXO discrimination. Inverse Problems, 20(6):27–40,2004. 3
[19] F. Shubitidze, K. O’Neill, K. Sun, and I. Shamatava. Application of broadband EMI responses to infer buried object’s aspectratio. International Geoscience and Remote Sensing Symposium (IGARSS), 3:1542 – 1545, 2002. 3
[20] Benjamin E. Barrowes, Kevin O’Neill, Tomasz M. Grzegorczyk, and J. A. Kong. Broadband, Analytic Electromagnetic Induc-tion (EMI) Response from Spheroidal Objects for Arbitrary Excitation. Progress in Electromagnetics Research Symposium(PIERS), October 2003. 3
[21] Juan Pablo Fernandez, Benjamin Barrowes, Alex Bijamov, Tomasz Grzegorczyk, Nicolas Lhomme, Kevin O’Neill, IrmaShamatava, and Fridon Shubitidze. MPV-II: an enhanced vector man-portable emi sensor for uxo identification. volume 8017,page 801707. SPIE, 2011. doi: 10.1117/12.884085. URL http://link.aip.org/link/?PSI/8017/801707/1.5, 11
[22] F. Shubitidze, B. Barrowes, I. Shamatava, J. P. Fernandez, and K. O’Neill. Combining NSMC and High Quality MPV-TDData for UXO Discrimination. Proc. IEEE Int. Geosci. Remote Sensing Symp. (IGARSS), 2008. 5, 11
[23] Fridon Shubitidze, Juan Pablo Fernandez, Benjamin E. Barrowes, Irma Shamatava, and Kevin O’Neill. Normalized SurfaceMagnetic Source model applied to Camp Sibert data. In Applied Computational Electromagnetics Symposium (ACES),Monterey, CA, Mar. 2009. 5
[24] W. M. Wynn, C. P. Frahm, P. J. Carroll, R. H. Clark, J. Wellhoner, and M. J. Wynn. Advanced superconducting gradiome-ter/magnetometer arrays and a novel signal processing technique. IEEE Transactions on Magnetics, MAG-11(2):701 – 707,1975. URL http://dx.doi.org/10.1109/TMAG.1975.1058672. 5
B. Barrowes, D. George, F. Shubitidze -References--31-