pork & typhoons: the political economy of disaster ... · paper, we analyze the political...
TRANSCRIPT

Electronic copy available at: http://ssrn.com/abstract=1911915
Pork & Typhoons: The Political Economy of
Disaster Assistance in the Philippines
James Atkinson 5700 Haven Hall
505 S. State Street Ann Arbor, MI 48109-1045
Phone: 910-988-5721 Fax: 734-764-3522
Allen Hicken
Nico Ravanilla
University of Michigan
Abstract
This paper examines the extent to which political calculations direct public goods provision
following natural disasters, focusing on disaster response in the wake of typhoons and tropical
storms. The paper develops a novel methodology to produce baseline estimates of the objective
need for government resources in a given area based on a calculation of storm exposure across
municipalities. We apply this approach to the Philippines and find that the extent of storm
exposure in a given municipality highly and significantly affects the amount of per capita
targetable reconstruction funds it receives. However, we also find that political ties between
members of congress and local mayors, especially clan ties, increase per capita targetable funds
allocated to that municipality, controlling for the measure of typhoon exposure.

Electronic copy available at: http://ssrn.com/abstract=1911915
Typhoon Haiyan recently swept across the Philippines, leaving a path of devastation in its
wake. Similar to all governments in the aftermath of such disasters, the government of the
Philippines is mobilizing government resources to provide assistance to affected areas. In this
paper, we analyze the political economy of such disaster assistance in the Philippines. We seek
to both shed some light on the extent to which political calculations direct public goods provision
following natural disasters and to use the Philippines case as a window into the particularization
of public policy that is common in many democracies (Cox and McCubbins 2001).
We focus on disaster response in the wake of typhoons and tropical storms. Using a
unique dataset, we are able to produce estimates of the extent of typhoon exposure across
municipalities in the Philippines and then examine the extent to which disaster assistance
corresponds to the level of damage. We focus on a particular form of disaster assistance--
discretionary congressional funds for reconstruction of public infrastructures. As one would
expect, we find that the extent of storm damage in a given municipality significantly affects the
amount of targetable reconstruction funds allocated there. However, we also find that measures
of political ties between members of congress and local mayors, specifically a match in their
party affiliation or their clan affiliation, increase the level of targetable funds allocated to that
municipality, controlling for the measure of typhoon exposure. Finally, clan ties have a much
larger effect on the distribution of per capita reconstruction funds than party ties.
The paper makes two contributions. First, it develops a novel and replicable
methodological approach (storm exposure) to produce baseline estimates of the objective need
for government resources in a given area. One of the most difficult tasks for researchers is
estimating the extent to which political calculations play a role in distributive decisions,
particularly since we often lack an objective apolitical baseline against which to compare

3
(Golden and Min 2013). Our method produces baseline estimates that can then be compared to
actual patterns of distribution.
Second, the paper speaks to the broad literature on distributive politics by providing
systematic empirical evidence that clan-based relationships are a powerful predictor of
distribution. Although party-based partisanship has been shown to affect patterns of distribution,
especially in the context of intergovernmental transfers in federal states, we still know little
about how other kinds of political ties, such as clan or tribal ties, can impact distribution in
environments where parties are weak (Arulampalam et al. 2009; Brollo and Nannicini 2010;
Burden, Berry and Howell 2010; Larcinese, Snyder and Testa 2006; Solé-Ollé and Sorribas-
Navarro, 2008). Estimating the causal effect of clan-based alliances on distribution is challenging
because it is difficult to derive plausible exogenous variations in clan-based political alliances.
We propose to circumvent this issue by focusing on the geographical allocation of disaster
reconstruction funds. Because our measure of typhoon exposure can control for time-varying
factors that confound the relationship between clan ties and distribution, this, combined with a
fixed-effects regression specification, should bring us closer to plausible causal estimates of the
effect of clan ties on distribution. We find that clan ties direct disaster reconstruction funding in
the Philippines over and above the effect of party-based alliances and storm damages.
The paper proceeds as follows. In the next section, we review the literature on
distribution politics, highlighting the role of partisanships in explaining patterns of distribution.
Then, we develop our theory and outline several hypotheses about how political calculations
might affect the distribution of disaster assistance in the Philippines. We describe our data and
methodology and present our results in the following two sections. The final section concludes.

4
Partisanship and Distributive Politics in the Philippines
There is a large and well-developed literature that draws connections between political
parties, partisanship and distributive politics. For example, the existing literature on constituency
targeting—whether it argues for swing, core or mixed targeting—argues that the partisan identity
or tendency of voters or groups of voters helps shape the distribution of government goods and
services (Ansolabehere and Snyder 2006; Cox and McCubbins 1986; Dunning and Stokes 2010;
Hiskey 1999; McGillivray 2004; Pérez Yarahuan 2006; Stokes 2005; Stokes et al. 2013). This is
true even where parties are relatively weak and party discipline is low (e.g. in the case of the
weak-party majoritarian system example of the US).
Other work focuses on the connection between party/party system characteristics and the
prevalence of particularism and clientelism (Kitschelt 2000; Tabellini 2004). Keefer and
Khemani (2009), for example, demonstrate that strong links between voters and political parties
curb incentives for legislators to provide pork to their constituents. By contrast, where ties
between voters and candidates are of an ethnic, tribal or clan variety, politicians have strong
incentives to selectively target resources to their respective constituencies (Keefer and Khemani
2009; Kitschelt 2000; Pande 2003).
Recent work has focused on distributive politics in developing democracies where party
ties may be weak relative to ethnic, tribal, or clan ties (Blaydes 2011; Kasara 2007; Kitschelt and
Wilkinson 2007; Posner 2004; Stasavage 2005; Wantchekon 2003). Who do politicians target
where parties are not good cues for either voters or candidates and where, as a result, it is nearly
impossible to differentiate between a party’s core and marginal supporters? In this context,
voters with weak party affinities are more likely to attribute the benefits of redistribution to
individual politicians than to political parties that remain, for most voters, ephemeral

5
abstractions. Hence, individual politicians are unlikely to redistribute public funds based solely
on the partisan identities of voters.
This does not mean, however, that parties are superfluous in such democracies. In
weakly-institutionalized systems, parties often serve as umbrellas for networks of other, more
important power relationships. Particularly important is the relationship between upper-level
politicians who wield the redistribution power via their access to the national budget and local
leaders who control the power of mobilization via their dense social networks at the grassroots
level.1 Parties may exist on an ad hoc basis precisely because those who hold the power to
distribute resources need to strike bargains with those who have the power to mobilize electoral
support in a classic exchange of distributive benefits for votes (Hicken 2011). Indeed, the
political organization that could sustain such political exchange need not be the party; it may
very well be the personal ties among politicians such as ethnic affinities, tribal background, or
clan affiliations.
Such characterizations of political exchange in the context of democracies with weakly-
institutionalized party systems suggest a prediction about how distribution might unfold: upper-
level politicians who have the power to redistribute will favor politically aligned local leaders
(Ravanilla 2011). Broadly speaking, in the absence of stable party systems and an electorate with
strong partisan affinities, the political calculations that direct spending and public goods
1 On how mayors are able to mobilize support at the grassroots level in the Philippines, see
Agpalo (1972); Hollensteiner (1963); Kawanaka (2002); Villanueva et al. (1966); and Wolters
(1984). On more theoretical treatments of how the local politician-voter linkage may be
sustained, see Magaloni, Diaz-Cayeros and Estevez (2007); Medina and Stokes (2007);
Robinson and Verdier (2002); and Stokes et al. (2013).
6
provision is a function of the political organization (in this case, the ties between upper-level and
local politicians) that sustains the exchange of redistributive benefits for electoral support.
In short, party relationships may matter, but not in the way much of the literature
describes. Politicians are not making allocation decisions based on information about loyalty or
marginality (either at the group or district level)—partisan cues simply do not exist or are too
weak a predictor of voter sentiment and behavior to be meaningful. Instead, national-level
politicians are motivated by the need to mobilize voters. They might try and persuade individuals
or groups to support them through direct appeals, but they will also try and mobilize voters by
allocating resources to local politicians with networks necessary for voter mobilization.
Allocation decisions, then, hinge on calculations about the risk that local politicians will accept
resources but then shirk in some fashion and fail to mobilize voters (e.g. by not working as hard
as needed, pocketing funds, working on behalf of multiple candidates, etc.). Given this risk,
national politicians rely on cues that signal lower risk. Among these could be shared party
affiliation, but in weakly-institutionalized party systems other cues such as clan ties, may be even
more important.
The Philippines offers an ideal environment in which to assess the relative effects of
party and clan ties. The Philippines has one of the oldest democracies in Asia, but also one of the
weakest, underdeveloped party systems in the region. Philippine parties are highly factionalized
and undisciplined. Party switching has been a recurring phenomenon in the Philippines, with
about 40% of incumbent congresspersons switching their party affiliation from one election to
the next since the beginning of its democratic period in 1946 (Kasuya 2009). Moreover, party
labels carry little weight for either voters or candidates, as evidenced by the high level of
electoral volatility from election to election. In the words of one scholar: “Far from being stable,

7
programmatic organizations, the country’s main political parties are nebulous entities that can be
set up, merged with others, split, resurrected, regurgitated, reconstituted, renamed, repackaged,
recycled or flushed down the toilet anytime” (Quimpo 2005).
In contrast to the unstable party system, a defining and enduring feature of political life in
the Philippines are political clans. Political clans have historically dominated national and local
politics and clan ties continue to shape modern Filipino politics and business (Coronel et al.
2007; Cullinane 2003; Gutierrez 1992; Hutchcroft 1998; Querubin 2010a; Querubin 2010b; Sidel
1999; Simbulan 2005). In fact, family relationships and rivalries generally have proved more
robust than partisan differences. Descriptions about the influence of clan politics on public policy
abound.2
However, estimating the causal effect of clan-based alliances on distribution is
challenging because it is difficult to derive plausible exogenous variations in clan-based political
alliances. It is possible that the very factors that explain why clan politics is strong in some areas
also account for distributional patterns. Put differently, clan alliances may be endogenous to
distributional patterns. We attempt to address this issue by focusing on the geographical
allocation of disaster reconstruction funds. Because our measure of typhoon exposure is
exogenous to clan politics or prior distributions of government resources, controlling for the
same variable can account for an important time-varying factor that confounds the relationship
between clan ties and distribution. This, combined with a fixed-effects regression specification,
should bring us closer to plausible causal estimates of the effect of clan ties on distribution.
In the next section, we describe our strategy for using storm damage to produce a
baseline against which we can measure politically-motivated distribution.
2 For several examples, see Gutierrez et al. (1992).

8
Using Natural Disasters as a Distributive Baseline
Stories and scandals abound in the Philippines regarding the particularization of the
public purse.3 However, moving beyond anecdote and allegation has been challenging for
researchers. How do we estimate the extent to which political calculations play a role in the
distribution of public goods? Very rarely do we have good records of policy deliberations and so
we are unable to observe what arguments were put forward in favor of a particular distributive
solution versus another. Furthermore, even where such records are available, they rarely present
a clear picture. Politicians will cite many legitimate reasons for why a particular good or service
should be allocated to their constituents—e.g. helping the poor, promoting investment—but
seldom are they explicit about the political motivations behind their proposals. (At the same
time, they are eager to claim credit for any goods and services the government provides). But, if
we assume that almost all politicians are at least partially motivated by a desire for reelection (or,
as is often the case in the Philippines, for the election of their family members)4, then we begin
to see the possibility of pork everywhere. And, in fact, one constituency’s wasteful pork barrel
project is often another’s much needed public goods investment.
3 For a recent example, see: http://world.time.com/2013/09/11/philippines-pork-barrel-graft-
probe-has-lawmakers-squealing/
4 Many offices in the Philippines are term-limited. Given this constraint, a common tactic is to
attempt to pass offices from incumbents to other family members (e.g. spouses, children,
siblings).

9
Since we can seldom look at government budgets and straightforwardly distinguish what
is pork and what is not, one common strategy is to look at who does the allocating.5 The
assumption in such studies is that when the allocation of goods and services is controlled or
influenced by politicians, the pork-to-policy ratio will be higher than when non-elected
bureaucrats make allocation decisions.6 Reality, however, is more complicated. Politicians can
and do use a variety of allocation algorithms to distribute goods and services under their control,
some of which are expressly political (e.g. handing out health insurance cards only to political
supporters) and some of which are not (e.g. giving scholarships to the 100 poorest students in a
district).
What we often lack is a clear, objective counterfactual—a baseline we can use to gauge
how far a given policy departs from some sort of non-political, technocratic ideal (Golden and
Min 2013). In this paper, we use information about natural disasters in the Philippines,
specifically typhoons and tropical storms, in an attempt to create such a baseline. The question
we pose is the following: to what extent do political calculations affect the allocation of
government disaster reconstruction funds?
Large-scale natural disasters provide a natural experiment of sorts for researchers. While
not completely random (typhoons are more of a concern for the Philippines than for Poland), the
precise number, timing, scale, and location of natural disasters are impossible to determine very
5 That is not to say that it impossible to identify pork in such budgets. Egregious examples often
stand out: roads and bridges to nowhere, defense contracts for equipment the military does not
want or need, etc.
6 The pork-to-policy ratio is the extent to which government goods and services are allocated on
the basis of political versus technocratic calculations.

10
far in advance. In addition, large-scale disasters affect a large number of locales and some
locales more than others. (Locations at the epicenter of an earthquake, for example, will
experience more damage than those further away). The fact that natural disasters cannot be fully
anticipated means that governments will almost always need to respond to those disasters with
supplemental relief and reconstruction funds targeted to disaster areas, giving researchers an
opportunity to observe how such funds are distributed. Where we have information about the
extent of damage across locales, it is possible to estimate how relief funds should be distributed
if need-based technocratic criteria were the primary driver, and then observe how far from that
baseline governments stray.
For the Philippines, large-scale natural disasters are, unfortunately, commonplace. Each
year, the country experiences an average of U.S. $17-19 billion in economic losses due to natural
disasters (Dumitru 2009). This equates to just under 10% of the Philippines’ GDP. Local and
national government funds dedicated exclusively to disaster assistance total around $14 billion
annually. Typhoons and tropical storms are a particular concern. On average, twenty typhoons
and tropical storms strike the Philippines each year, affecting nearly every part of the country
(see Figure 1). While disastrous for Filipinos, the frequency and distribution of storm activity
and the scope of affected municipalities provide us with a rich source of data from which to test
hypotheses about the political economy of disaster assistance.
The Politics of Disaster Assistance
A politician in the Philippines (or elsewhere) with the power to allocate a certain amount
of disaster assistance in her district will likely consider several factors. One consideration is

11
presumably the comparative level of need (or the extent to which a particular area has been
devastated relative to other areas). This leads to our first hypothesis:
H1: The amount of per capita reconstruction funds distributed to a given area is positively
related to the extent of storm damage in that area.
While we expect that damage assessments will help drive allocations decisions, we also expect
political considerations to have an effect on those decisions. Politicians interested in reelection
should use disasters, and their control of reconstruction funds, in ways that help improve their
chances of remaining in office. This might include relatively innocuous activities like plastering
the politician’s name or picture on relief supplies handed out to disaster victims, or outright
corruption—e.g. diverting disaster funds into personal or campaign coffers.
We are particularly interested in whether political ties affect the flow of reconstruction
funds and, if so, which kinds of relationships exert the most influence over distribution decisions.
In a post-disaster situation, politicians are faced with the task of dividing their scarce resources
between several damaged areas. Given two areas that are the same in every way—same level of
damage, same population, same amount of economic activity, etc.—except that one area is
controlled by a political ally, while the other is not, we hypothesize that politicians will favor the
area controlled by the ally. The Philippines is replete with anecdotal examples of non-disaster-
related distribution decisions being based on such alliances. For example, the desire to put
oneself in a position to receive presidential pork produces massive switching to the president’s
party by members of Congress, governors and mayors after each election (Banlaoi and Carlos
1996; Hicken 2009). Members of Congress and local government officials regularly make the

12
distribution of government goods and services contingent on the recipient’s political support
(Cruz and Chua 2004). We expect to see a similar pattern in the distribution of disaster
assistance, hence the next hypothesis:
H2a: All else equal, areas controlled by political allies should receive more per capita
reconstruction funds than other areas.
More specifically, we are interested in exploring two kinds of alliances. First, do party
ties play a role in allocation decisions? If party ties play a role, then those areas where a
congressperson and mayor share partisan ties should receive disproportionate attention in the
wake of a disaster.7
H2b: All else equal, areas controlled by partisan allies should receive more per capita
reconstruction funds than other areas.
7 In future work, we plan to look at ties to the president as well. Recent scandals suggest that the
allocation of calamity funds by the president is also a politicized process (See “SONA Failed to
Chart Course, says minority.” Business World, 27 July 2010). In his 2010 state of the nation
address, President Aquino noted that the province of Pampanga – the second district of which
outgoing President Arroyo now represents in Congress - received a large portion of the budget
designated for national calamities, with the majority for that province (105 million pesos of the
108 million pesos) going to her district. He also noted that province Pangasinan only received 5
million pesos, even after being ravaged by typhoon Cosme in 2008.

13
In addition to partisan ties, we are interested in whether family or clan relationships will
play a role in distribution decisions.8 Furthermore, our expectation is that clan ties trump party
ties when it comes to the politics of disaster aid. This leads us to our next two hypotheses:
H2c: All else equal, areas controlled by members of the same clan should receive more per
capita reconstruction funds than other areas.
H3: All else equal, clan ties should be a stronger predictor of distributed per capita
reconstruction funds than partisan ties.
Data and Methods
We now turn to the task of determining the extent to which political calculations direct
the redistribution of disaster reconstruction funds. Specifically, we test the hypothesis that the
allocation of reconstruction funds across Philippine municipalities is a function not only of
typhoon exposure (the amount of damage) but also of political ties between members of
Congress and municipal mayors. Our main econometric specification is as follows:
8 We are assuming here that party and clan ties are useful proxies for political alliances.
However, there are certainly examples of competition and outright feuding between members of
the same party or clan. Such feuds should bias against our hypotheses, making it less likely that
clan and party ties are significant predictors of reconstruction flows. The fact that we still
observe support for our hypotheses, even with intra-clan and intra-party feuds introducing noise
into the data, is reassuring.

14
€
reconstructionijt = β0 + β1typhoon jt + β2party jt + β3clan jt + β4incomeijt + β5congressvote jt +
€
β6mayorvote jt + mun j +εj=1
1653
∑
where reconstructionijt is the per capita reconstruction funds allocated by a given congressperson
to individual i in municipality j in year t, typhoonjt is a measure of typhoon exposure of
municipality j in year t, partyjt is a dummy variable indicating 1 if the congressperson and mayor
are from the same party and 0 otherwise, and clanjt is a dummy variable indicating 1 if the
congressperson and mayor are from the same clan and 0 otherwise. We also include several
control variables. The variable incomeijt is the per capita internal revenue allotment of
municipality j in year t. The variables congressvotejt and mayorvotejt indicate the percentage of
the total votes for a particular congressperson and mayor, respectively, in municipality j and year
t. We include these two variables to proxy for swing versus core targeting strategy. This is an
admittedly simple measure, but if politicians target their core supporters we would expect a
positive relationship between vote share and reconstruction fund distribution while if swing
districts are the target, we would expect a negative relationship. Our expectation, however, is
that voting patterns in the Philippines reveal very little about partisan preferences of either voters
or candidates. If that is the case, then the vote share of either the congressperson or the mayor
should be relatively useless for politicians as a valid measure of municipal partisanship and we
should thus see no relationship between congressvote or mayorvote and the dependent variable.
Finally, the term
€
mun jj=1
1653
∑ controls for municipality fixed effects. To ensure asymptotic
consistency of the estimated standard errors, clustering is done at the municipal level.
Dependent Variable
Our main dependent variable is the per capita amount of annual congressional pork
allocation that is spent on repairs and reconstruction of local infrastructures in a given
15
municipality.9 Each year, members of Congress receive lump sum allocations from the General
Appropriations Act (GAA) known as the Department of Public Works and Highways -
Congressional Allocations (DPWH-CA). Between 2001-2010, the total amount of annual
DPWH-CA ranged between PHP 6.7-23.2 billion (roughly USD 156-540 million), which
accounted for about 4% to 12% of the total national discretionary budget (i.e. total budget net of
personal services, interest payments, and allotments to local government units). Within the same
period, each district congressperson received annual DPWH-CA that ranged from PHP 2-50
million (USD 47,000-1.2 million).
These congressional allocations are not all spent on disaster-related repairs. These funds
are also used for the construction and routine maintenance of public infrastructures such as
schools, roads and bridges, and irrigation systems. However, on average, 64% of these
allocations were spent on repairs and reconstruction. In our analysis, we isolate and focus only
on the portion of DPWH-CA that was spent on repairs and reconstruction.10
Looking at congressional pork that is spent on reconstruction funds has a number of
advantages. To begin with, DPWH-CA has an “equal sharing” provision wherein every district
congressperson, regardless of political affiliations, receives the same allocation as his or her
9 We include years for which disaggregated data are available: 2001, 2003, 2004, 2005, 2009,
and 2010. Data for years 2003, 2004, 2005, 2009, and 2010 comes from the Department of
Budget and Management website (http://www.dbm.gov.ph/). Data for year 2001 comes from the
Philippine Center for Investigative Journalism, which archived this previously published data
that is no longer available online.
10 We run the same analysis using DPWH-CA spent on construction of new infrastructure and
we do not find any effect of typhoon exposure.

16
colleagues in Congress every budget year.11 Hence, we are able to observe the individual
behavior of congresspersons within their districts, regardless of political affiliation or seniority.
In contrast, calamity funds that are released during or immediately after a typhoon are not very
well documented and could easily be the end result of (possibly conflicting) political calculations
by politicians at different levels of government.
Another advantage is that even though all releases are made through the DPWH, which
also administers the projects, congresspersons have the “power of the purse”, that is, the
authority to identify specific projects for a given location and to release the funds for that project.
As a result, the process of releasing these funds is transparent in that we can identify the amount
released to the local government unit.12
Finally, we are able to identify how the repair and reconstruction funds are spent—e.g. on
roads and bridges, flood control structures, water supply systems, multipurpose buildings and
pavements, school buildings, etc. This allows us to separate reconstruction spending into
“targetable projects” versus “non-targetable projects”, and examine further how political
calculations vary across these categories. Within the political economy framework of our study,
the definition of “targetable” project spending is guided by two principles: (1) the project has the
nature of being a “club good”, and (2) the attribution of benefits from using the good is
unambiguously directed to the granting congressperson and his/her local political allies. Hence,
projects that do not spill over across municipal jurisdictions (such as school buildings and
11 When and whether the allocation gets released or not, however, also depends on the approval
of the President.
12 Whether all funds released were actually spent on the project or pocketed as rents by the
congressperson or the mayors or the DPWH bureaucrats is another matter.

17
multipurpose buildings, which do not require coordination among local chief executives to be
implemented and are easily excludable) fall under the “targetable projects” category. On the
other hand, projects like roads and bridges, flood control structures, and water supply systems
fall under the “non-targetable” category, because they entail large spillovers across localities and
are highly non-excludable.13 Furthermore, school buildings and especially multipurpose
buildings are regarded by local politicians as a highly effective means of attracting supporters,
since these buildings often are used for other purposes such as town halls, basketball courts in
the summer, dance halls during fiestas, rice storage facilities, election polls, and, during
typhoons, as calamity shelters.
Focusing on congressional allocations for repair and reconstruction does have some
unavoidable disadvantages. One is that we do not account for calamity funds that are under the
discretion of the President in our analysis.14 A second disadvantage is that we are unable to
establish whether the funds distributed to each municipality were actually spent on the project or
pocketed by the local government officials. However, the likelihood that local officials
misappropriate congressional funds or that political calculations play a role in the allocation of
13 We do not include our results using non-targetable projects as the dependent variable due to
space concerns, but, as expected, the political effects we observe for targeted projects do not hold
for non-targetable projects.
14 Unfortunately detailed data on calamity fund distribution are not available.

18
Presidential discretionary funds15 implies that we may only be estimating a lower bound of how
partisanships moderate the responsiveness of public goods provision to typhoon exposure.
Typhoon Index
Developing a standard baseline measure for determining how disasters affect different
areas can be challenging. One measure commonly used to compare disaster levels across areas is
the death toll. Poorer nations (and poorer regions in a nation), however, suffer significantly
greater death counts than richer ones, which can lead to biased estimates of the intensity of the
disaster in a given area (Stromberg 2007). An alternative measure for comparing the impact of a
disaster in one locale versus another is to use estimated damages. However, these measures also
create biased estimates as wealthier nations may have sturdier buildings and infrastructure,
which can limit the damage, but they also can experience significantly higher damage estimates
because of the more expensive nature of the buildings and infrastructure affected.
To create a baseline for the comparison of storm damage across municipalities, we follow
the methodology found in Yang (2008) and develop a typhoon index using data on tropical
storms from the Japanese Meteorological Agency. The storm data include best tracks of each
storm, with date, time, location (latitude and longitude), windspeed, barometric pressure and type
of tropical storm or typhoon. Data are collected along each storm track at 6-hour intervals.
Figure 2 provides an example of the best tracks and corresponding data points of the storms that
affected the Philippines in 2009.
15 For instance, former President Gloria Arroyo is charged with plunder in the alleged misuse of
the PHP 900 million Malampaya Fund that was meant for disaster rehabilitation and
reconstruction in the wake of super typhoons "Ondoy" and "Pepeng" in 2009.
19
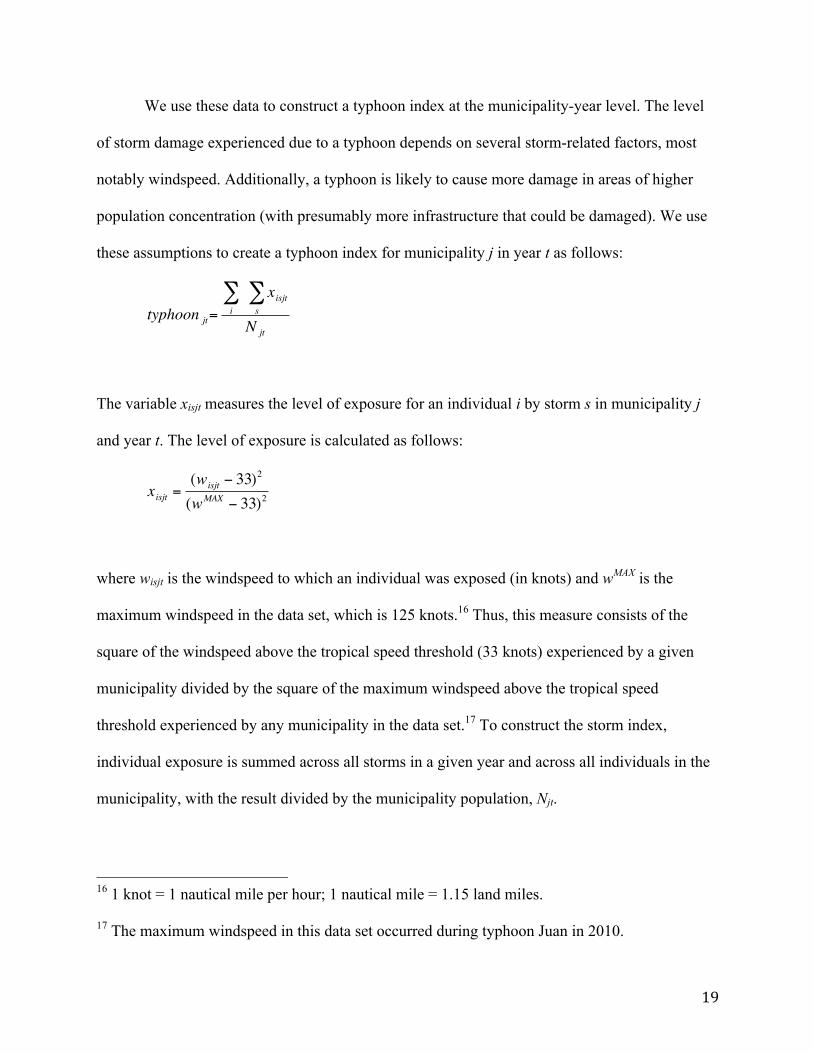
We use these data to construct a typhoon index at the municipality-year level. The level
of storm damage experienced due to a typhoon depends on several storm-related factors, most
notably windspeed. Additionally, a typhoon is likely to cause more damage in areas of higher
population concentration (with presumably more infrastructure that could be damaged). We use
these assumptions to create a typhoon index for municipality j in year t as follows:
The variable xisjt measures the level of exposure for an individual i by storm s in municipality j
and year t. The level of exposure is calculated as follows:
where wisjt is the windspeed to which an individual was exposed (in knots) and wMAX is the
maximum windspeed in the data set, which is 125 knots.16 Thus, this measure consists of the
square of the windspeed above the tropical speed threshold (33 knots) experienced by a given
municipality divided by the square of the maximum windspeed above the tropical speed
threshold experienced by any municipality in the data set.17 To construct the storm index,
individual exposure is summed across all storms in a given year and across all individuals in the
municipality, with the result divided by the municipality population, Njt.
16 1 knot = 1 nautical mile per hour; 1 nautical mile = 1.15 land miles.
17 The maximum windspeed in this data set occurred during typhoon Juan in 2010.
€
typhoon jt=i∑ xisjt
s∑N jt
€
xisjt =(wisjt − 33)
2
(wMAX − 33)2

20
The typhoon index is essentially a measure of “intensity-weighted events per capita”
(Yang 2008). An index of 1 would occur if all of the residents in a given municipality were
exposed to the highest intensity windspeed (xisjt =1) once in a given year. To construct the
individual-level exposure variable, we use population data at the barangay level.18 We use the
storm best-track data, a model of windspeed decay given distance from typhoon eyes, and
geographic information systems software (ArcGIS 10.0) to estimate the windspeed experienced
at each barangay for each separate storm (Dilley et al. 2005). This level of exposure is summed
across all storms and population-weighted barangay (as opposed to individuals) by year. Table 1
presents the mean storm index for the most affected municipalities in the Philippines from 2001
to 2010. The municipality with the highest mean typhoon index is Divilican, in the province of
Isabela. In 2010, the eye of the typhoon in the data set that reached the maximum windspeed
(Typhoon Juan at 125 knots) moved through the center of this municipality (along with the
second and third-highest municipalities on the list). Most of the barangay in Divilacan
experienced the maximum force of 125 knots (while not experiencing any other typhoons that
year). This resulted in a storm index near 1. If another typhoon of 125 knots had travelled
through the center of the municipality of Divilican in 2010, the storm index would have been
closer to 2. While the storm index has a lower bound of 0 (which is the value for many cities in
southern Mindanao completely unaffected by typhoons during this period), the upper limit is
unbounded.19
18 The 1623 municipalities in the Philippines are subdivided into 41,940 barangay.
19 One potential criticism of using storm severity as a predictor of need is the idea that
municipalities that are more susceptible to disasters may have better disaster preparedness and
mitigation policies and procedures. Thus, storm severity may not necessarily correlate with storm

21
Political Variables and Methodology
Our measure of political ties is broken down into partisan ties and family ties.
‘Partisanship’ is operationalized as the match in party affiliations of the incumbent district
congressperson and the incumbent municipal mayor. ‘Family ties’ is the match in clan
membership of the same politicians. To determine party affiliations and clan membership, we
use electoral data relevant for our period of study from election years 2001, 2004 and 2007,
obtained from the Commission on Elections (COMELEC).
Within these election periods, there were 37 unique party affiliations of winning
congresspersons and 58 unique party affiliations of winning mayors. Politicians in the
Philippines typically run under several party names, either to signify affiliations with a national
party and a local party (e.g. DIMASALANG/LAKAS-CMD), or to signify affiliations with an ad
hoc pre-election coalition among national parties (e.g. LAKAS-NUCD/UMDP). To determine
damage, and, therefore, with need. For example, we might expect some municipalities in Luzon,
which suffer several typhoons each year, to erect buildings that are more wind resistant than
buildings erected in southern Mindanao, where typhoons rarely make landfall. This type of
preparedness, however, has competing effects on the extent of monetary damages in a given area
(and, therefore, on the level of need). For less intense storms, wind-resistant construction
techniques may help to minimize economic losses if the buildings prove resistant. However, the
same attention to construction standards may increase economic losses if these more expensive
buildings are unable to withstand a major storm. Thus, the relationship between disaster
preparedness and disaster impact is not necessarily linear. Nevertheless, to account for the
discrepancy in levels of disaster preparedness between municipalities (along with other factors
potentially unaccounted for), we include municipality fixed effects in our statistical analysis.

22
the partisan ties between a municipal mayor and her respective district congressperson, we create
a variable called ‘partisanship’ which takes on a value of 1 if the congressperson’s party
affiliation matched with the mayor’s party affiliation and takes on a value of 0, otherwise.
For the second measure of political ties based on clan membership, we create a variable
called ‘family ties’ and, following Querubin (2010a), we match not only last-names of the
district congressperson and the municipal mayor, but also look at different combinations of last-
names, mid-names, and husband’s last-name (in the case of married women). This is done so as
not to miss filial affinities through wives and female relatives. In any case, the results in this
paper are very similar if family and relatives are only traced using last-names or mid-names.
A natural concern with the above method is that individuals from the same district who
share a last-name, mid-name or husband’s last-name may not necessarily be related by blood to
each other. While certainly a possibility, Querubin (2010b) explains how this is less of a concern
in the Philippines than in other countries because of how family names were historically
distributed across different provinces. Specifically, in 1849, during the Spanish era, a different
set of surnames was assigned to each town and local officials then assigned a different surname
to each family head. Nevertheless, the possibility of measurement error remains. Fortunately, if
our method frequently produces Type 1 errors (false positives) then this should bias against our
finding support for our hypotheses about family ties.
Results
Before turning to the results of our statistical models, we present a simple graphical
illustration of our analysis. Figure 3 shows a side-by-side comparison of levels of typhoon
exposure (on the left-hand side) and levels of reconstruction fund distribution (on the right-hand

23
side). The comparison shows some areas where high levels of typhoon exposure correspond to
high levels of reconstruction fund distribution (especially in the northern part of Luzon). But
there are discrepancies throughout the country where large distributions of reconstruction funds
flow to areas with low levels of storm exposure (and vice versa). The following statistical
analyses provide evidence for the political nature of these discrepancies.
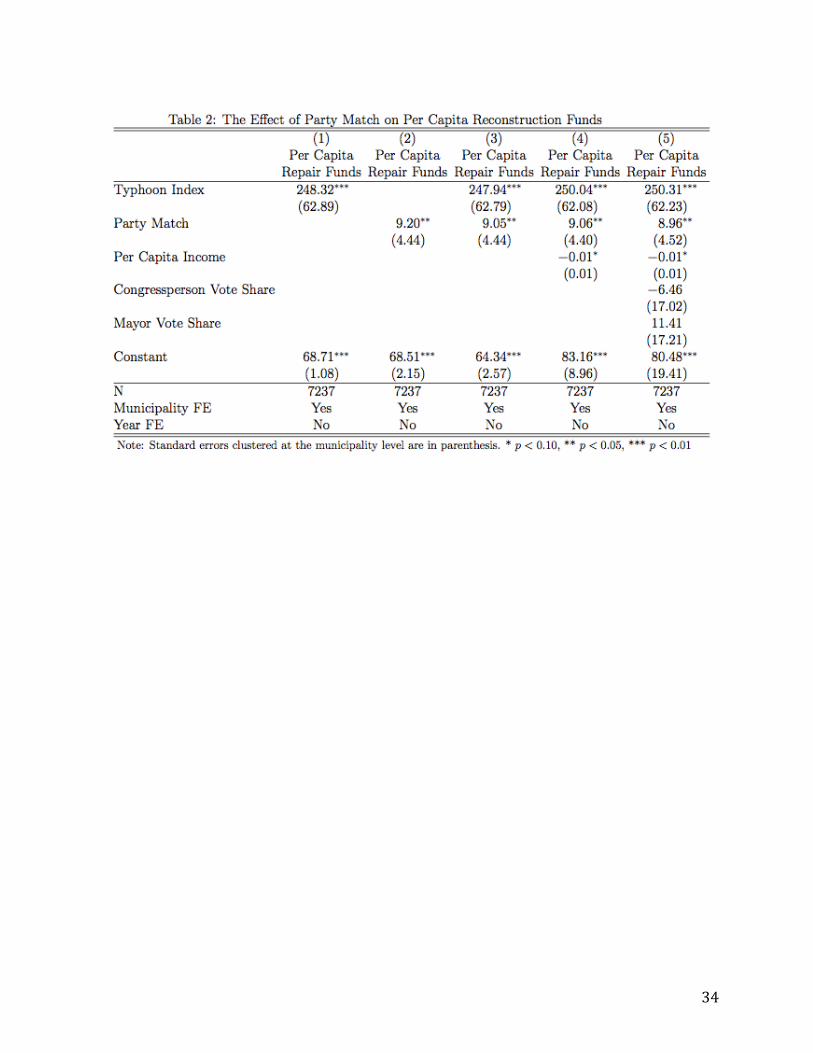
Table 2 presents the effects of party affiliation between the congressperson and mayor on
the distribution of per capita reconstruction funds. The results from Model 1 confirm Hypothesis
1 by showing a positive and significant relationship between the typhoon index (the amount of
storm damage) and the amount of per capita reconstruction funds provided. This coefficient for
the typhoon index is large, positive, and highly significant across all model specifications. An
increase from 0 to 1 on the typhoon index results in an increase of approximately 250 pesos per
person in reconstruction funds. For a municipality the size of Tacloban (221,174 people), which
was one of the areas devastated the most by Typhoon Haiyan recently, an increase in the typhoon
index from 0 to 1 would result in an increase in reconstruction funds of approximately PHP
55.36 million (USD 1.27 million).
Model 2 shows that a party match between the congressperson and the mayor in a given
municipality increases the per capita reconstruction funds allocated to that municipality. The
coefficient remains positive and statistically significant when controlling for the typhoon index
in Model 3 and with the inclusion of additional control variables in Models 4 and 5, thus
providing support for Hypothesis 2b. If a congressperson and mayor are from the same party, a
city the size of Tacloban can expect an increase in total reconstruction funds of approximately
PHP 1.98 million (USD 45,000).
24
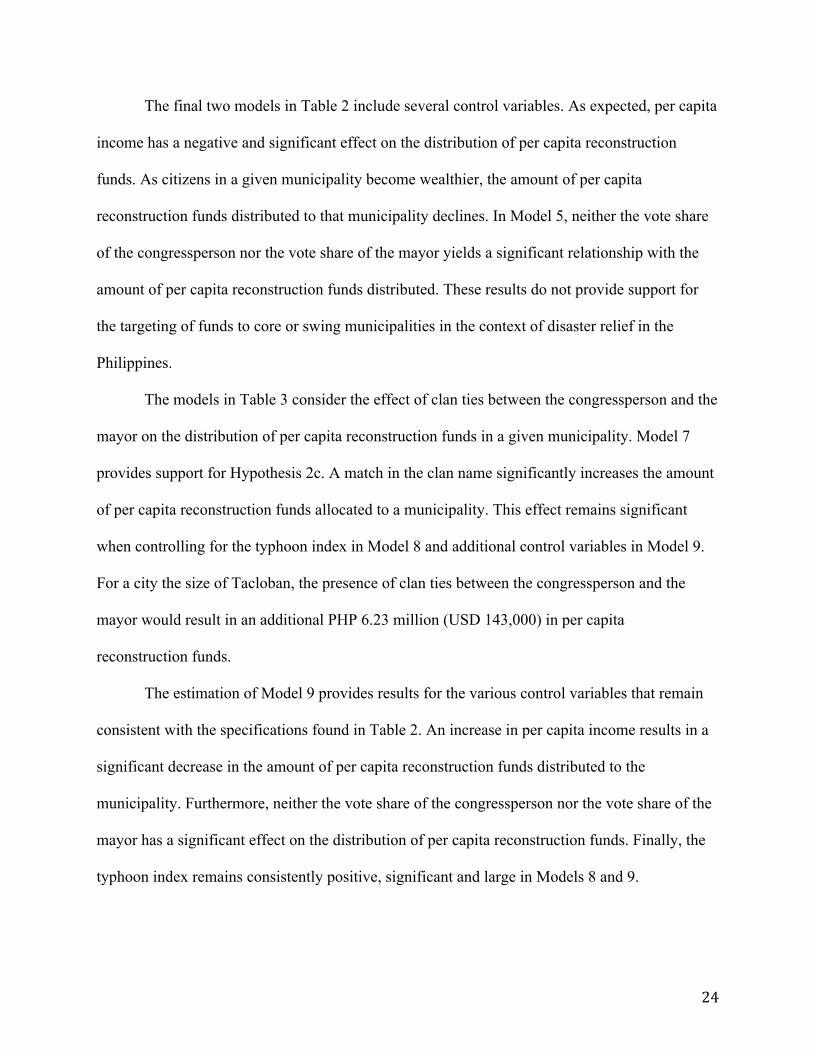
The final two models in Table 2 include several control variables. As expected, per capita
income has a negative and significant effect on the distribution of per capita reconstruction
funds. As citizens in a given municipality become wealthier, the amount of per capita
reconstruction funds distributed to that municipality declines. In Model 5, neither the vote share
of the congressperson nor the vote share of the mayor yields a significant relationship with the
amount of per capita reconstruction funds distributed. These results do not provide support for
the targeting of funds to core or swing municipalities in the context of disaster relief in the
Philippines.
The models in Table 3 consider the effect of clan ties between the congressperson and the
mayor on the distribution of per capita reconstruction funds in a given municipality. Model 7
provides support for Hypothesis 2c. A match in the clan name significantly increases the amount
of per capita reconstruction funds allocated to a municipality. This effect remains significant
when controlling for the typhoon index in Model 8 and additional control variables in Model 9.
For a city the size of Tacloban, the presence of clan ties between the congressperson and the
mayor would result in an additional PHP 6.23 million (USD 143,000) in per capita
reconstruction funds.
The estimation of Model 9 provides results for the various control variables that remain
consistent with the specifications found in Table 2. An increase in per capita income results in a
significant decrease in the amount of per capita reconstruction funds distributed to the
municipality. Furthermore, neither the vote share of the congressperson nor the vote share of the
mayor has a significant effect on the distribution of per capita reconstruction funds. Finally, the
typhoon index remains consistently positive, significant and large in Models 8 and 9.

25
Model 10 shows the results for the fully specified model and provides a test for our final
hypothesis. The typhoon index and the two alliance variables remain positive and significant in
the estimation of this model. The inclusion of both party and clan in Model 10 allows us to test
Hypothesis 3, which states that the effect of clan ties between the congressperson and mayor on
the distribution of per capita reconstruction funds will be greater than the effect of party ties
between these politicians. The coefficient on clan ties is nearly 4 times the size of the coefficient
on party ties, which provides some evidence supporting this final hypothesis.20
The results for clan affiliation are consistent with the findings elsewhere in the literature
on the importance of non-partisan linkages (e.g. ethnic or tribal ties) for allocation decisions in
countries with weak party systems (Eifert, Miguel and Posner 2010). Where party affiliations are
weak and ephemeral, politicians can and do make use of alternative networks to guide the
distribution of government goods and services. Family ties are among the least risky and most
effective institutions through which the political exchange of distributive benefits for electoral
support is possible, so it should not be surprising that dynastic politics, rather than party politics,
is pervasive in many countries.
It is important to note, however, that party ties still have a significant effect in our fully
specified model, which controls for clan ties. Thus, even in the Philippine context where party
affiliation is fluid, parties still matter in the distribution of reconstruction funds. Parties,
however, are not important in the process of identifying areas of core voters (as evidenced by the
insignificance of the vote share variables). Instead, it appears that parties (like clan ties) provide
20 A Wald test, however, does not provide evidence that the two coefficients are statistically
different from each other, thus weakening the support for this hypothesis.

26
another opportunity for upper-level politicians to identify lower-level allies with whom they can
engage in exchanging funds for the mobilization of voter support.
As a robustness check, we included year fixed effects in Model 11. Our fully specified
model (Model 10) assumes that there are no unexpected variation or special events across years
that affect the outcome variable. One problem with this assumption is that electoral cycles might
be driving our results because in some years (e.g. nearing the election), reconstruction funds just
happened to be particularly responsive to typhoons and partisanships. If this is the case, then our
results may be artifacts of the electoral cycle. After including year fixed effects, the coefficient
on party changes very little and remains significant. The coefficient on clan changes little and is
just at the 10% threshold for statistical significance. The key difference in Model 11 is that the
inclusion of year fixed effects results in a lack of statistical significance for the typhoon index
(and a reduction in the magnitude of the coefficient). This means that the effect of typhoons on
the direction of pork allocation is driven by outlying years for which typhoons particularly matter
(e.g. in 2001, there is a super typhoon that caused huge variation in the level of typhoon exposure
across municipalities), but that, otherwise, typhoon exposure does not predict reconstruction fund
allocation well. This result, though surprising, is quite telling since even in years for which
typhoons particularly matter for the direction of funds allocations, partisanships, especially clan
ties, still significantly explain variation in the allocation of reconstruction funds.
Conclusion Our goal in this paper has been to explore the extent to which political calculations shape
public goods provision following natural disasters in the Philippines. The paper makes three
contributions. First, it develops a novel methodological approach using storm track damage

27
estimates to produce an apolitical baseline estimate of need for government resources in a given
area. This method produces baseline estimates that can then be compared to actual patterns of
distribution. Second, the paper speaks to the broad literature on distributive politics by
demonstrating that even in weak party systems, party ties can be an important basis for
distributive politics. Finally, we provide systematic empirical evidence that clan-based
partisanships are powerful predictors of distribution. We find that clan ties are a stronger
predictor of disaster reconstruction funding in the Philippines than party-based affiliations.
We can identify several avenues for future research. One is to explore the extent to which
presidential ties shape disaster reconstruction allocation. A second avenue is to explore in more
detail, via case studies, the dynamics and mechanisms involved in reconstruction assistance in
select municipalities. Combining the current project with these additional research avenues is
key to developing any policy prescriptions that can mitigate the political allocation of
reconstruction funds in the aftermath of disasters.
28
References Agpalo, Remegio. 1972. The Political Elite and People: A Study of Politics in Occidental
Mindoro. Manila: College of Public Administration, University of the Philippines. Ansolabehere, Stephen and Snyder, James. 2006. “Party Control of State Government and the
Distribution of Public Expenditures.” Scandinavian Journal of Economics 108 (4): 547-569. Arulampalam, Wiji, Sugato Dasgupta, Amrita Dhillon, Bhaskar Dutta. 2009. “Electoral Goals
and Center-State Transfers: A Theoretical Model and Empirical Evidence from India.” Journal of Development Economics 88: 103-119.
Banlaoi and Carlos. 1996. Political Parties in the Philippines: From 1900 to the Present.
Makati: Konrad Adenauer Foundation. Bawn, Kathleen and Frances Rosenbluth. 1999. “Short versus Long Coalitions: Electoral
Accountability and the Size of the Public Sector.” American Journal of Political Science 50(2): 251-265.
Blaydes, Lisa. 2011. Elections and Distributive Politics in Mubarak’s Egypt. New York: Cambridge University Press. Brollo, Fernanda and Tommaso Nannicini, 2010. "Tying Your Enemy’s Hands in Close Races:
The Politics of Federal Transfers in Brazil." Working Papers 358, IGIER (Innocenzo Gasparini Institute for Economic Research), Bocconi University.
Burden, Barry, Christopher R. Berry, and William G. Howell. 2010. “The President and the
Distribution of Federal Spending.” American Political Science Review 104: 783-‐99. Chen, Jowei. 2011. ”Are Poor Voters Easier to Buy Off with Money? A Natural Experiment
from the 2004 Florida Hurricane Season.” University of Michigan – Ann Arbor. Typescript. Coronel, Sheila S. and Cecile C.A. Balgos. Pork and Other Perks: Corruption and Governance
in the Philippines. Pasig: Philippine Center for Investigative Journalism. Coronel, Sheila, Yvonne T. Chua, Luz Rimban and Booma B. Cruz. 2007. The Rulemakers: How
the Weatlhy and the Well-born Dominate Congress. Pasig: Philippine Center for Investigative Journalism.
Cox, Gary W. and Matthew D. McCubbins. 2001. ”The Institutional Determinants of Policy
Outcomes.” In Stephan Haggard and Mathew D. McCubbins, eds. Presidents, Parliaments, and Policy. Cambridge: Cambridge University Press.
Cox, Gary W. and Mathew D. McCubbins. 1986. “Electoral Politics as a Redistributive Game.”
The Journal of Politics 48 (2): 370-389.

29
Cruz, Yvonne T., and Booma B. Chua. 2004. “Pork Is a Political, Not a Developmental Tool” and “Legislators Feed on Pork.” Report from Philippine Center for Investigative Journalism, 6–7 September 2004. http://www.pcij.org/stories/2004/pork.html.
Cullinane, Michael. 2003. Illustrado Politics: Filipino Elite Responses to American Rule.
Ateneo Press. Dahlberg, Matz and Eva Johannson. 2002. ”The Vote-Purchasing Behavior of Incumbent
Governments.” American Political Science Review 96 (1): 27-40. Dilley, Maxx, Robert S. Chen, Uwe Deichmann, Arthur L. Lerner-Lam, and Margaret Arnold,
with Jonathan Agwe, Piet Buys, Oddvar Kjekstad, Bradfield Lyon, and Gregory Yetman. 2005. “Natural Disaster Hotspots: A Global Risk Analysis,” Disaster Risk Management Series No. 5, Hazard Management Unit, World Bank.
Dixit, Avinash and John Londregan. 1996. “Determinants of Success of Special Interests in
Redistributive Politics.” The Journal of Politics 58 (4): 1132-1155. Dixit, Avinash and John Londregan. 1998. “Ideology, Tactics, and Efficiency in Redistributive
Politics.” The Quarterly Journal of Economics (May): 497-529. Dumitru, Denisa M. 2009. “Philippines Disaster Risk Financing Strategy: Executive Summary.
August 24, 2009. http://www.stellar-re.com/images/Philippines%20-%20Risk%20Financing%20Strategy.pdf .
Dunning, Thad and Susan Stokes. 2010. “How Does the Internal Structure of Political Parties
Shape their Distributive Strategies?” Prepared for the workshop Political Parties in the Developing World, Princeton University, April 30– May 1, 2010.
Eifert, B., E. Miguel, and D. Posner (2010). Political competition and ethnic identification in africa.
American Journal of Political Science 54 (1), 494–510. Golden, Miriam and Brian Min. 2013. “Distributive Politics Around the World.” Annual Review
of Political Science 16: 73-99. Golden, Miriam A. and Devesh Tiwari. 2009. “Criminality and Malfeasance among National
Legislators in Contemporary India.” Paper prepared for the American Political Science Association Annual Meeting, Toronto, September 3-6, 2009.
Gutierrez, Eric U., Ildefonso C. Torrente, Noli G. Narca. 1992. All in the Family. Quezon City:
Institute for Popular Democracy. Hicken, Allen. 2011. “Clientelism.” Annual Review of Political Science. 14: 289-310. Hicken, Allen. 2009. Building Party Systems in Developing Democracies. New York:
Cambridge University Press.

30
Hiskey, Jonathan. 1999. Does Democracy Matter?: Electoral Competition and Local Development in Mexico. Ph.D. Dissertation, University of Pittsburgh.
Hollensteiner, Mary. 1963. The Dynamics of Power in a Philippine Municipality. Quezon City:
Community development Research Council, University of the Philippines. Hutchcroft, Paul D. 1998. Booty Capitalism: The Politics of Banking in the Philippines. Cornell
University Press. Kasara, Kimuli. 2007. Tax Me if You Can: Ethnic Geography, Democracy, and the Taxation of Agriculture in Africa. American Political Science Review 101 (1): 159- 172. Kasuya, Yuko. 2009. Presidential Bandwagon: Parties and Party Systems in the Philippines.
Keio University Press Inc. Kawanaka, Takeshi. 2002. Power in a Philippine City. Chiba, Japan: Institute of Developing
Economies. Keefer, Philip. 2007. “Clientelism, Credibility, and the Policy Choices of Young Democracies.”
American Journal of Political Science 51: 4, 804-21. Keefer, Philip and Stuti Khemani. 2009. “When Do Legislators Pass on Pork? The Role of
Parties in Determining Legislator Effort.” American Political Science Review 103(1): 99-112. Kitschelt, Hebert. 2000. “Citizens, Politicians, and Party Cartellization: Political Representation
and State Failure in Post-industrial Democracies.” European Journal of Political Research 37:149-79.
Kitschelt, Herbert and Steven Wilkinson. 2007. Citizen-Politician Linkages: An Introduction. In Patrons, Clients, and Policies: Patterns of Democratic Accountability and Political Competition, ed. Herbert Kitschelt, Steven Wilkinson, pp. 1-49. New York: Cambridge University Press. Landé, Carl H. 1996. Post-Marcos Politics: A Geographic and Statistical Analysis of the 1992
Philippine Elections. Singapore: Institute of Southeast Asian Studies. Larcinese, Valentino, James M. Snyder, Jr. and Cecilia Testa, 2006. "Testing Models Of
Distributive Politics Using Exit Polls To Measure Voterpreferences And Partisanship." STICERD -‐ Political Economy and Public Policy Paper Series 19. Suntory and Toyota International Centres for Economics and Related Disciplines, LSE.
Lindbeck, Assar and Jorgan W. Weibull. 1993. “A Model of Political Equilibrium in a
Representative Democracy.” Journal of Public Economics 51: 195-209.

31
Magaloni, Beatriz. 2006. Voting for Autocracy: Hegemonic Party Survival and its Demise in Mexico. Cambridge University Press.
Magaloni, Beatriz, Alberto Diaz-Cayeros and Federico Estevez. 2007. “Clientelism and Portfolio
Diversification: A Model of Electoral Investment with Applications to Mexico.” In Patrons, Clients, and Policies: Patterns of Democratic Accountability and Political Competition, eds. Herbert Kitschelt and Steven Wilkinson. Cambridge, New York: Cambridge University Press, 182-205.
McGillivray, Fiona. 2004. Privileging Industry. Princeton University Press: Princton, NJ. Medina, Luis Fernando and Susan Stokes. 2007. “Monopoly and Monitoring: An Approach to
Political Clientelism.” In Patrons, Clients, and Policies: Patterns of Democratic Accountability and Political Competition, eds. Herbert Kitschelt and Steven Wilkinson. Cambridge, New York: Cambridge University Press, 68-83.
Pande, Rohini. 2003, “Can Mandated Political Representation Increase policy Influence for
Disadvantaged Minorities? Theory and Evidence from India.” American Economic Review 93(4): 1132-51.
Pérez Yarahuan, Gabriela. 2006. Policy Making and Electoral Politics: Three Essays on the
Political Determinants of Social Welfare Spending in Mexico, 1988-2003. Ph.D. dissertation, University of Chicago.
Posner, Daniel. 2004. The Political Salience of Cultural Differences: Why Chewas and Tumbukas are Allies in Zambia and Adversaries in Malawi. American Political Science Review 98 (4): 529-545. Querubin, Pablo. 2010a. “Family and Politics: Dynastic Persistence in the Philippines.”MIT,
Boston. Typescript. Querabin, Pablo. 2010b. “Political Reform and Elite Persistence: Term Limits and Political
Dynasties in the Philippines.” MIT, Boston. Typescript. Ravanilla, Nico. 2011. “Who Eats the Pork? Legislator Incentive to Favor Local Political
Allies.” University of Michigan – Ann Arbor. Typescript. Robinson, James and Thierry Verdier. 2002. “The Political Economy of Clientelism.” CEPR
Discussion Paper No. 3205. Schady, Norbert. 2000. “The Political Economy of Expenditures by the Peruvian Social Fund
(FONCODES), 1991-1995.” American Political Science Review 94(2):289-304. Sidel, John T. 1999. Capital Coercion and Crime: Bossism in the Philippines. Stanford: Stanford
University Press.

32
Simbulan, Dante C. 2005. The Modern Principalia: The Historical Evolution of the Philippine Ruling Oligarchy. Quezon City: The University of the Philippines Press.
Solé-‐Ollé, Albert and Pilar Sorribas-‐Navarro, 2008. "Does partisan alignment affect the
electoral reward of intergovernmental transfers?" Working Papers 2008/2, Institut d'Economia de Barcelona (IEB).
Stasavage, David. 2005. Democracy and Education Spending in Africa. American Journal of Political Science 49 (2): 343-358. Stokes, Susan C. 2005. “Perverse Accountability: A Formal Model of Machine Politics with
Evidence from Argentina.” American Political Science Review 99(3): 315-25. Stokes, Susan, Thad Dunning, Marcelo Nazareno, and Valeria Brusco. 2013. Brokers, Voters,
and Clientelism. New York: Cambridge University Press. Stromberg, David. 2007. ”Natural Disasters, Economic Development, and Humanitarian Aid.”
Journal of Economic Perspectives 21 (3): 199-222. Tabellini, Guido. 2004. “The Role of the State in Economic Development.” CESifo working
papers, No. 1256, http://hdl.handle.net/10419/18894 Villanueva, Buenaventura, Patrocinio Villanueva, Elsa Perez, Juanita Pua and Caridad Cuenco.
1966. Government and Administration of a Municipality. Manila: Municipality Development Research Council, University of the Philippines.
Wantchekon, Leonard. 2003. Clientelism and Voting Behavior: Evidence from a Field Experiment in Benin. World Politics 55(3): 399-422. Wolters, Willem. 1984. Politics, Patronage and Class Conflict in Central Luzon. Quezon City:
New Day Publishers. Yang, Dean. 2008. ”Coping with Disaster: The Impact of Hurricanes on International Financial
Flows, 1970-2002.” The B.E. Journal of Economic Analysis & Policy 8 (1).

33
34

35

36
Figure 1: The number of typhoons and tropical storms per municipality, 2001-2010. The darkest areas experienced 26 storms during this period while the
lightest areas experienced zero.

37
Figure 2: Storm tracks in the Philippines in 2009
!
!
!
!
!
!!
! !
!
!
!
!!!
!!
!
!
!
!!
!
!
!
!
!
!
!
!!
!!!
!!
!!
!
!
!
!!
!!
!! !
!
!
!
!!
!
!
!
!
!
!!
!
!
!
!
!!
!
!
!!
!
!
!
!!!
!
!
!!
!
!!!!!
!
!
!
!
!
!
!
!
!
!
!
!
!
!
!
!!!!
!
!
!
!
!
!!
!!!
!
!
!
!
!!
!
!
!
!
!
!
!
!
! !
!
!
!
!
!!
!!!
!
!!
!!!
!
!
!
!!!!
!
!
!
!
!
!
!
!!
!
!
!
!
!
!
!
!
!
!
!
!
!
!
!
!
!
!
!
!
!
!
!!
!
!!
!!
!
!
!
!
!
!
!
!
!!
!!!!
!!
!!
!!
!
!!
!
!!
!
!
!
!
!
!
!
!
!
!
!
!
!
!
!
!
!
!
!
!
!
!
!
!
!
KIKO
KIKO
GORIOGORIO
FERIA
FERIA
ISANG
ISANG
SANTI
SANTI
RAMIL
RAMIL
DANTE
DANTE
ONDOY
ONDOY
EMONG
EMONG
PEPENG
PEPENG
MARING
MARING
QUEDAN
QUEDANJOLINA
JOLINA
LABUYO
LABUYO

38
Figure 3: Storm exposure in 2009 (left) and the distribution of reconstruction funds (right). Darker areas represent greater exposure and more funds, respectively.