pore water chemistry profiles across the sulfate-methane transition above marine gas hydrate
TRANSCRIPT

1
Pore Water Sulfate, Alkalinity, and Carbon Isotope Profiles in Shallow 1
Sediment above Marine Gas Hydrate Systems: A Numerical Modeling 2
Perspective 3
4
5
Sayantan Chatterjee1, Gerald R. Dickens2,3, Gaurav Bhatnagar1,4, Walter G. Chapman1, 6
Brandon Dugan3, Glen T. Snyder3 and George J. Hirasaki1,* 7
8
9
A manuscript in press: 10
Journal of Geophysical Research – Solid Earth 11
(DOI: 10.1029/2011JB008290) 12
June 1, 2011 13
14
1Department of Chemical and Biomolecular Engineering, Rice University, Houston, 15
Texas 77005, USA 16 17 2Department of Earth Science, Rice University, Houston, Texas 77005, USA 18 19 3Institutionen för Geologiska Vetenskaper, Stockholms Universitet 106 91 Stockholm, 20
Sweden 21
22 4Shell International Exploration and Production Inc., Houston, Texas 77082, USA 23 24
25
26
*Corresponding author: 27
Email: [email protected] (G. J. Hirasaki) 28
Phone: +1 713-348-5416 29
Fax: +1 713-348-5478 30
31

2
Abstract 32
Both the concentration and the carbon isotope composition of dissolved inorganic 33
carbon (DIC) vary considerably across the sulfate-methane transition (SMT) in shallow 34
marine sediment at locations with gas hydrate. This variability has led to different 35
interpretations for how carbon, including CH4, cycles within gas-charged sediment 36
sequences over time. We extend a one-dimensional model for the formation of gas 37
hydrate to account for downhole changes in dissolved CH4, SO42-, DIC, and Ca2+, and 38
the δ13C of DIC. The model includes advection, diffusion, and two reactions that 39
consume SO42-: degradation of particulate organic carbon (POC) and anaerobic 40
oxidation of methane (AOM). Using our model and site-specific parameters, steady-41
state pore water profiles are simulated for two sites containing gas hydrate but different 42
carbon chemistry across the SMT: Site 1244 (Hydrate Ridge; DIC = 38 mM, δ13C of DIC 43
= -22.4‰ PDB) and Site Keathley Canyon (KC) 151-3 (Gulf of Mexico; DIC = 16 mM, 44
δ13C of DIC = -49.6‰ PDB). The simulated profiles for CH4, SO42-, DIC, Ca2+, and δ13C 45
of DIC resemble those measured at the sites, and the model explains the similarities 46
and differences in pore water chemistry. At both sites, an upward flux of CH4 consumes 47
most net SO42- at a shallow SMT, and calcium carbonate removes a portion of DIC at 48
this horizon. However, a large flux of 13C-enriched HCO3- enters the SMT from depth at 49
Site 1244 but not at Site KC151-3. This leads to a high concentration of DIC with a δ13C 50
much greater than that of CH4, even though AOM causes the SMT. The addition of 51
HCO3- from depth impacts the slope of certain concentration cross-plots. Crucially, 52
neither the DIC concentration nor its carbon isotopic composition at the SMT can be 53
used to discriminate between sulfate reduction pathways. 54
55

3
1. Introduction 56
Solid gas hydrates form when water molecules encapsulate low molecular weight 57
gas molecules at relatively high pressure, low temperature, high water activity, and high 58
gas concentration [Sloan and Koh, 2007]. These conditions exist along many 59
continental margins where hydrocarbon gases, usually CH4, accumulate in sediment 60
pore space within a shallow depth interval commonly called the gas hydrate stability 61
zone (GHSZ). While their global abundance and distribution remain uncertain [Dickens, 62
2001a; Milkov, 2004; Buffett and Archer, 2004; Klauda and Sandler, 2005], marine gas 63
hydrates may constitute a future energy resource [e.g., Collett, 2002; Walsh et al., 64
2009], a deep-water geohazard [e.g., Borowski and Paull, 1997; Briaud and Chaouch, 65
1997; Kwon et al., 2010], and an important component of the global carbon cycle [e.g., 66
Dickens, 2003; Archer et al., 2009]. 67
The amount and distribution of gas hydrate within the GHSZ at a given location 68
depend on in situ concentrations of light hydrocarbons [e.g., Dickens et al., 1997; Xu 69
and Ruppel, 1999; Davie and Buffett, 2001; Milkov et al., 2003; Bhatnagar et al., 2007]. 70
In most marine settings with gas hydrate, CH4 concentration dominates total 71
hydrocarbon concentration, and gas hydrate arises when CH4 concentrations exceed 72
those on a dissolved gas-gas hydrate saturation curve. Usually, however, such excess 73
solubility does not occur in the upper part of the GHSZ (Figure 1). Instead, two 74
biogeochemical zones, separated by a thin (generally <2 m) sulfate-methane transition 75
(SMT), distinguish shallow sediment. From the seafloor to the SMT, dissolved SO42- 76
decreases from seawater concentration (~28 mM) at the seafloor to near-zero 77
concentration at the SMT; from the SMT to deeper zones, dissolved CH4 increases from 78

4
near-zero concentration at the SMT to a concentration on the saturation curve below 79
(Figure 1). This means that the top occurrence of gas hydrate at most locations lies 80
below the seafloor and within the GHSZ [e.g., Dickens et al., 1997; Xu and Ruppel, 81
1999; Davie and Buffett, 2001; Dickens, 2001a; Milkov et al., 2003; Bhatnagar et al., 82
2007; Malinverno et al., 2008]. Although a bottom simulating reflector (BSR) on seismic 83
profiles often marks the deepest presence of gas hydrate [Kvenvolden, 1993; Paull and 84
Matsumoto, 2000; Tréhu et al., 2004], remote sensing methods face difficulties 85
detecting the shallowest gas hydrate, presumably because physical properties of 86
sediment do not change significantly when small amounts of gas hydrate are present. In 87
addition, this boundary can be hard to locate accurately in well logs and sediment cores 88
from drill holes [Paull and Matsumoto, 2000; Tréhu et al., 2004]. 89
Pore water SO42- gradients in shallow sediment may offer a geochemical means 90
to determine underlying CH4 gradients and the uppermost occurrence of gas hydrate. 91
Many papers have attributed SMTs in shallow marine sediment to anaerobic oxidation 92
of methane (AOM) [e.g., Borowski et al., 1996, 1999; Valentine and Reeburgh, 2000; 93
Dickens, 2001b; D’Hondt et al., 2004; Snyder et al., 2007]. Specifically, the SMT 94
represents an interface where microbes utilize SO42- diffusing down from the seafloor 95
and CH4 rising up from depth according to [Reeburgh, 1976]: 96
2
4 4 3 2CH (aq) + SO HCO + HS + H O . (1) 97
This interpretation implies a 1:1 ratio of SO42- and CH4 fluxes into the SMT, and is 98
important to gas hydrate studies. If AOM principally causes the SMT in shallow 99
sediment above gas hydrate, and the overall system is near steady-state conditions, the 100

5
SO42- gradient and the SMT depth should relate to the underlying CH4 gradient and the 101
shallowest occurrence of gas hydrate (Figure 1). 102
Field observations, mass balance calculations, and numerical modeling results 103
support the assumptions and expected relationships between SO42- and CH4 fluxes 104
[Borowski et al., 1996, 1999; Dickens, 2001b; Davie and Buffett, 2003b; Paull et al., 105
2005; Snyder et al., 2007; Bhatnagar et al., 2008, 2011]. Nonetheless, the use of pore 106
water SO42- profiles to constrain gas hydrate distribution remains controversial because 107
of unresolved issues. A source of current debate concerns the concentration and 108
carbon isotope composition ( 13C, expressed relative to Pee Dee Belemnite) of 109
dissolved inorganic carbon (DIC) at the SMT [cf. Kastner et al., 2008a; Dickens and 110
Snyder, 2009]. The CH4 in many regions with gas hydrate has a 13C of -50‰ or lower 111
[Milkov, 2005]. Moreover, given the ubiquitous 7.0-8.3 pH of pore water in these 112
systems [e.g., Shipboard Scientific Party, 1996, 2003a, 2003b], almost all DIC consists 113
of HCO3-. If AOM (Equation 1) primarily drives the SMT, and the systems were closed, 114
one might predict DIC at this interface to be <28 mM with a 13C <-50‰ [Kastner et al., 115
2008a] (the DIC being less than the loss of SO42- because of authigenic carbonate 116
precipitation). Although this has been observed at some locations with underlying gas 117
hydrate, often DIC at the SMT is >30 mM and has a 13C >-30‰ (Figure 2) [Paull et al., 118
2000b; Borowski et al., 2000; Claypool et al., 2006, Torres and Rugh, 2006; Pohlman et 119
al., 2008; Kastner et al., 2008b; Torres and Kastner, 2009; Kim et al., 2011]. 120
There are two basic explanations for relatively high DIC and 13C across the SMT 121
in regions with gas hydrate [cf. Kastner et al., 2008a; Dickens and Snyder, 2009]. First, 122
rather than AOM, sulfate reduction of particulate organic carbon (POC) consumes much 123
6
of the pore water SO42- in shallow sediment. This bacterially mediated reaction [Berner, 124
1980; Boudreau and Westrich, 1984], here and elsewhere alternatively referred to as 125
degradation of POC or organoclastic sulfate reduction, can be expressed as: 126
2
2 4 3 22CH O (s) + SO 2HCO + H S . (2) 127
Notably, the reaction generates two moles of HCO3- for each mole of SO4
2-, in contrast 128
to AOM where the stoichiometry is 1:1 (Equation 1). The 13C of POC in marine 129
sediments typically lies between -26‰ and -16‰ [e.g., Conrad, 2005; Kim et al., 2007], 130
and there is minimal fractionation of carbon isotopes during such sulfate reduction. 131
Sulfate consumption via POC, therefore, should lead to higher DIC concentrations with 132
greater 13C than expected from AOM [Claypool et al., 2006; Kastner et al., 2008a; 133
Torres and Kastner, 2009]. However, this explanation fails to explain the high DIC (>40 134
mM) and modest 13C-depletion in DIC (<-15 ‰) at some sites (Figure 2). Alternatively, 135
along with CH4, HCO3- enriched in 13C can enter the SMT from below. Such 13C-rich 136
HCO3- forms during methanogenesis [e.g., Conrad, 2005], and a contribution from this 137
source would also lead to elevated DIC concentrations with relatively high 13C across 138
the SMT [Dickens and Snyder, 2009; Kim et al., 2011]. 139
We assess the alternate explanations for DIC concentration and carbon isotopic 140
composition within the context of a numerical model for gas hydrate distribution. First, 141
we review two sites with gas hydrate but very different carbon chemistry across the 142
SMT. We then extend a 1-D model for gas hydrate accumulation in marine sediment 143
[Bhatnagar et al., 2007, 2008, 2011] such that it more fully incorporates carbon 144
chemistry. Specifically, we include equations for both sulfate consumption reactions 145
(Equations 1 and 2), coupled mass balance equations for CH4, SO42-, DIC and Ca2+, 146
7
and coupled mass balance equations for the 12C and 13C of CH4 and DIC. We show how 147
mixtures of DIC derived from AOM and from depth can explain the wide difference in 148
concentrations and 13C of DIC across the SMT at both sites, and discuss the 149
implications of this result. 150
151
2. Pore water profiles across the sulfate-methane transition 152
2.1 Overview 153
Sediment cores have been recovered from many continental margins where 154
underlying strata hosts gas hydrate [e.g., Kvenvolden, 1993; Paull et al., 1996; 155
Shipboard Scientific Party, 1996, 2003a, 2003b; Snyder et al., 2007; Hiruta et al., 2009; 156
Kim et al., 2011]. From these cores, pore water profiles have been generated, showing 157
how concentrations of dissolved constituents change beneath the seafloor. Not all cores 158
(or sets of cores in the case of drilling) penetrate the SMT, and very few cores have 159
been examined for a wide array of dissolved constituents at high depth resolution. 160
Nonetheless, two “end-member” cases appear to exist with regards to the concentration 161
and 13C of DIC across the SMT (Figure 2). These can be highlighted with data from 162
two locations, which frame current discussions regarding carbon cycling across the 163
SMT [e.g., Claypool et al., 2006; Kastner et al., 2008a; Dickens and Snyder, 2009], as 164
well as our modeling. 165
166
2.2 Site 1244 (Hydrate Ridge) 167
Ocean Drilling Program (ODP) Leg 204 drilled Site 1244 at 890m below sea level 168
(mbsl) on the eastern flank of Hydrate Ridge offshore the central coast of Oregon 169

8
[Tréhu et al., 2003]. The pressure and temperature at the seafloor are 8.72 MPa and 170
3.8°C. Given a measured geothermal gradient of 0.061°C/m and the predominance of 171
CH4 (>99%) in gas samples [Kvenvolden, 1995], the base of the GHSZ should be ~133 172
m below seafloor (mbsf). Seismic data indicate a BSR at ~124 mbsf [Tréhu et al., 2003]. 173
As true with many locations, however, the amount and distribution of gas hydrates 174
between the seafloor and the base of the GHSZ remain uncertain. Various approaches 175
for detecting and quantifying gas hydrate suggest average gas hydrate saturation 176
between 2 and 10% of pore space below a depth at around 50 mbsf, which is 177
apparently the top of the gas hydrate zone [Tréhu et al., 2003; Lee and Collett, 2006]. 178
Headspace CH4 concentrations rise from 0.2 to 6.5 mM between 7 and 16 mbsf 179
[Shipboard Scientific Party, 2003b]. Beyond this depth, in situ methane concentrations 180
exceed those for gas solubility after core recovery (~STP), so they have little meaning 181
[Paull et al., 2000a; Shipboard Scientific Party, 2003b]. Methane δ13C values range 182
between -65‰ and -77‰ [Milkov et al., 2005; Claypool et al., 2006]. The amount and 183
average isotopic composition of organic carbon through the sequence are 1.27 wt% 184
[Shipboard Scientific Party, 2003b] and -24‰ [Yu et al., 2006], respectively. 185
The SO42- profile at Site 1244 (Figure 3a; [Tréhu et al., 2003]) is somewhat 186
complicated. Values decrease from 29.7 mM near the seafloor to 21.3 mM at ~4 mbsf; 187
below, they drop nearly linearly to <1 mM by 9.2 mbsf. This is where CH4 rises above 188
1.8 mM, and dissolved Ba2+ increases markedly [Tréhu et al., 2003]. The latter is 189
noteworthy because Ba2+ profiles (when measured) often show a steep rise just below 190
the SMT [e.g., Snyder et al., 2007]. 191

9
Alkalinity increases from 2.8 mM near the seafloor to 37 mM at 8.5 mbsf; below, 192
it rises to ~64 mM at 37 mbsf (Figure 3b; [Tréhu et al., 2003]). The pH throughout the 193
interval is between 7.1 and 8.1 [Shipboard Scientific Party, 2003b], strongly suggesting 194
that alkalinity, DIC and HCO3- concentrations are nearly the same. Thus, there is a 195
distinct change in HCO3- gradients across SMT, but values continue to rise with depth. 196
Dissolved Ca2+ is ~10 mM near the seafloor and decreases to ~4 mM at the 197
SMT; below, it slowly decreases (Figure 3c; [Tréhu et al., 2003]). An obvious inflection 198
in Ca2+ concentrations, opposite to that of alkalinity, spans the SMT. 199
Profiles of DIC δ13C also display inflections across the SMT. The δ13C of DIC is 200
0‰ near the sediment-water interface and decreases to a minimum of -22.5‰ at ~7.8 201
mbsf. Values then increase to +15‰ by ~55 mbsf (Figure 3d; [Torres and Rugh, 202
2006]). Importantly, the δ13C profile displays “concave-down” curvature below the SMT. 203
204
2.3 Site KC151-3 (Keathley Canyon) 205
A Department of Energy-sponsored Joint Industry Program drilled Site KC151-3 206
at 1322 mbsl in Keathley Canyon in the northern Gulf of Mexico [Ruppel et al., 2008]. 207
The pressure and temperature at the seafloor are 12.95 MPa and 4°C. Given the 208
geothermal gradient of 0.038°C/m and the predominance of CH4 in gas samples, the 209
base of the GHSZ should be at ~314 mbsf. A BSR is present between ~380 mbsf 210
[Kastner et al., 2008b] and 390 mbsf [Ruppel et al., 2008]. Several studies showed 211
uneven distribution of gas hydrates in fractured silty-clayey sediments between 220 and 212
300 mbsf occupying 1-12% of pore volume [e.g., Cook et al., 2008; Lee and Collett, 213
2008; Kastner et al., 2008b]. Cook et al. [2008] reported a few occurrences of fracture-214
10
filled hydrates in the shallow sandy clays between 110 and 115 mbsf, which might be 215
interpreted as being near the top of the gas hydrate zone. 216
Headspace CH4 concentrations rise from 0 to 13.8 mM between 5 and 12 mbsf 217
[Lorenson et al., 2008]. Again, deeper values probably represent residual CH4 after 218
significant degassing [Paull et al., 2000a; Lorenson et al., 2008]. Methane δ13C values 219
increase from -78.2‰ to -73.8‰ between 16 and 44 mbsf, and remain ~-72‰ in deeper 220
strata [Lorenson et al., 2008]. The amount of organic matter in the sediment sequence 221
ranges from 0.44% to 0.95% [Winters et al., 2008]. The δ13C of bulk sediment organic 222
matter ranges from -19.7‰ to -21.7‰ in this region, at least near the sediment-water 223
interface [Goni et al., 1998]. 224
The SO42- concentration profile at Site KC151-3 (Figure 3a; [Kastner et al., 225
2008b]) has a profile somewhat similar to that at Site 1244. Values decrease from ~28 226
mM near the seafloor to 16.5 mM at ~7 mbsf; below, they drop to <1 mM at ~10.4 mbsf. 227
By contrast, the alkalinity profile (Figure 3b; [Kastner et al., 2008b]) is much 228
different than that at Site 1244. Alkalinity gradually increases from <3 to 6.7 mM across 229
the upper 6 m of sediment, and reaches a maximum of 16.1 mM at 10.4 mbsf. Alkalinity 230
then drops, such that it is <4 mM at 24 mbsf. Assuming that alkalinity comprises mostly 231
HCO3-, there is an obvious bicarbonate peak at the SMT. 232
Dissolved Ca2+ is ~10 mM near the seafloor and decreases to ~8 mM at the 233
SMT; below, it slowly increases to ~14 mM at greater depths of ~40 mbsf (Figure 3c; 234
[Kastner et al., 2008b]). Thus, as at Site 1244, there is a minimum in Ca2+ at the SMT. 235
However, the Ca2+ profile is complicated at Site KC151-3 because a brine exists at 236
depth [Kastner et al., 2008b]. Extremely saline water with high concentrations of Ca2+ 237

11
(and other species) fills pore space of deep sediment across much of the northern Gulf 238
of Mexico [e.g., Kharaka et al., 1987; Macpherson, 1989; Castellini et al., 2006]. 239
As at Site 1244, the δ13C of DIC has a minimum at the depth of maximum 240
alkalinity (Figure 3d; [Kastner et al., 2008b]). However, it drops from 0‰ near the 241
seafloor to -49.6‰ at this horizon, and increases to only +6‰ by 100 mbsf. Thus, the 242
δ13C of DIC exhibits a clear inflection across the SMT, but is generally lower beneath 243
the SMT compared to Site 1244. 244
245
3. Numerical model 246
3.1 General framework 247
Several one-dimensional (1-D) numerical models for gas hydrate accumulation in 248
marine sediment have been developed [e.g., Rempel and Buffett, 1997; Egeberg and 249
Dickens, 1999; Xu and Ruppel, 1999; Davie and Buffett, 2001, 2003a, 2003b; Liu and 250
Flemings, 2007; Bhatnagar et al., 2007]. Although they have notable differences, these 251
models have similar conceptual frameworks. A series of coupled mathematical 252
expressions (i.e., mass, momentum and energy transport equations) express the 253
following basic processes. Particles, including organic carbon, settle on the seafloor and 254
become part of sediment, which has seawater within pore space. During burial, 255
pressure and temperature increase, porosity decreases, and a fraction of POC converts 256
to CH4 below the SMT. Methane can also be contributed from depth. Dissolved CH4 can 257
move between sediment depths during burial because of diffusion, advection, or both. 258
At appropriate pressure, temperature and water activity, dissolved CH4 concentrations 259
can surpass those for gas hydrate or free gas saturation. Eventually, steady-state 260

12
conditions are reached. At this point, as well as at transient states before, there is a 261
distribution of CH4 with respect to depth. The CH4 can occur dissolved in water, as gas 262
hydrate, or within free gas. 263
There are problems with current 1-D models. In particular, they do not account 264
for changes in water activity (~salinity) caused by gas hydrate formation and 265
dissociation [e.g., Egeberg and Dickens, 1999; Milkov et al., 2004], for heterogeneities 266
in sediment properties over depth [e.g., Tréhu et al, 2003; Malinverno et al., 2008], or 267
for lateral variations in various parameters. As such, resulting simulations give broad 268
profiles for the amount of CH4 occurring dissolved in water, in gas hydrate, and in free 269
gas with respect to depth. The various models also include several assumptions. For 270
example, reaction rates and diffusion coefficients do not change with depth and 271
temperature in the model by Bhatnagar et al. [2007]. Nonetheless, when appropriate 272
parameters are incorporated, the CH4 profiles generated from numerical modeling 273
provide good first-order descriptions of CH4 profiles at sites that have been examined by 274
direct measurements [e.g., Davie and Buffett, 2001, 2003a; Liu and Flemings, 2007; 275
Bhatnagar et al., 2007, 2011]. 276
277
3.2 Basic model 278
One recent and encompassing 1-D numerical model for gas hydrate 279
accumulation in marine sediments has been developed and described by Bhatnagar et 280
al. [2007]. This model differs from others in two important aspects. First, it computes 281
mass balances for a system in thermodynamic equilibrium over geologic timescales, so 282
avoids the necessity of kinetics regarding hydrate formation. Second, it frames results in 283

13
terms of dimensionless groups. This enables identification of key factors controlling gas 284
hydrate distribution and accumulation, and allows results to be compiled (and 285
compared) for a wide range of model parameters. 286
Three sets of mathematical expressions underpin this model [Bhatnagar et al., 287
2007]. There are those that: (1) calculate appropriate CH4 phase equilibrium and 288
solubility curves; (2) describe sediment burial and porosity reduction; and (3) account 289
for mass conservation of CH4, water, and organic carbon. The latter includes 290
expressions for CH4 diffusion driven by concentration gradients, fluid advection resulting 291
from sediment burial and compaction, and external fluid flow caused by overpressure in 292
deeper sediments. Parameters and equations for this model are presented, defined and 293
explained by Bhatnagar et al. [2007]. We re-introduce some of these here for 294
clarification and expansion. 295
In the original model, CH4 escaped the GHSZ over time through burial (as 296
dissolved gas or free gas) or through the seafloor. Clearly, the latter does not happen at 297
most locations, because of an SMT at or near the seafloor (Figure 1). The model was 298
thus extended with mathematical expressions that coupled CH4 and SO42- consumption 299
in shallow sediment [Bhatnagar et al., 2008, 2011]. It was assumed that CH4 drove all 300
net SO42- consumption, following arguments made by numerous authors [e.g., 301
Reeburgh, 1976; Borowski et al., 1996, 1999; Snyder et al., 2007]. Both the original and 302
revised models give good first-order estimates for the amount and distribution of gas 303
hydrate at different sites (e.g., ODP Sites 889 and 997; IODP Sites U1325 and U1326) 304
with appropriate input parameters [Bhatnagar et al., 2007, 2008, 2011]. However, the 305
models were not evaluated with coupled mass balances for carbon. Other models for 306

14
gas hydrate accumulation likewise do not track DIC, its carbon isotope composition, and 307
authigenic carbonate precipitation. Without revision, they cannot be used to assess the 308
divergent explanations for the concentration and 13C of pore water DIC across the 309
SMT. 310
311
3.3 Updated model: Reactions 312
Carbon cycling within and above marine gas hydrate systems involves multiple 313
chemical reactions. At the most basic level, four must be considered (excluding those 314
relating to CH4 phase changes). These are, with their corresponding rates: 315
(i) Methanogenesis (fermentation in sediment below the SMT) 316
2 2 4 32CH O H O CH + HCO + H r = -meth, (3) 317
(ii) Anaerobic oxidation of methane (at the SMT) 318
2
4 4 3 2 AOMCH SO HCO + HS + H O r = - c cl l
AOM m s, (4) 319
(iii) Organoclastic sulfate consumption (between the seafloor and the SMT) 320
2
2 4 3 POC2CH O SO 2HCO + HS + H r = - cl
POC s, (5) 321
(iv) Authigenic carbonate (calcite) precipitation (below the seafloor) 322
32+
3 3HCO + Ca H CaCO r = CaCO
ppt
c
t, (6) 323
where r = rate of reaction, = first-order methanogenesis reaction rate constant, AOM 324
and POC refer to second-order reaction rate constants for AOM and POC-driven sulfate 325
consumption respectively; = organic carbon content in sediment, c = component 326
mass fraction, and t = time; and, the subscripts m , s , 3CaCO refer to CH4, SO42-, and 327
CaCO3 components respectively, and the superscript l refers to the liquid phase 328

15
(Appendix A). Note that the first three reactions (Equations 3-5) are modeled as 329
irreversible and expressed with a kinetic rate, while the fourth reaction (Equation 6) is 330
modeled as a reversible equilibrium reaction. Whenever pore water concentrations 331
exceed equilibrium, we assume stoichiometric amounts of DIC and Ca2+ precipitate as 332
calcium carbonate. The rate of this reaction in the model is the amount of calcium 333
carbonate formed over a unit timestep. Thus, our model ignores hydrate formation 334
kinetics but includes CH4 formation kinetics (Equation 3). 335
We acknowledge that methanogenesis (Equation 3) involves intermediate 336
reactions (Appendix B). We also assume that excess H+ produced by the above 337
reactions forms dissolved organic acids and ammonium ion, because pore waters in 338
gas hydrate systems can have a deep yellow color and very high NH4+ concentrations 339
[e.g., Shipboard Scientific Party, 1996, 2003a, 2003b]. These species can then advect 340
or diffuse, although we do not model this. Lastly, we equate carbonate precipitation to 341
calcite precipitation throughout this work for simplicity. Authigenic calcite certainly forms 342
near the SMT above many gas hydrate systems [e.g., Rodriguez et al., 2000; Snyder et 343
al., 2007], although other carbonate minerals (aragonite and dolomite) can also 344
precipitate [Bohrmann et al., 1998; Greinert et al., 2001]. 345
346
3.4 Updated model: Equations 347
Starting with the existing model framework [Bhatnagar et al., 2007, 2008], key 348
mass balance equations are revised (Appendix C) to include organoclastic sulfate 349
consumption (Equation 5) and calcite precipitation (Equation 6). Additionally, we track 350
the 12C and 13C isotope compositions of CH4 and DIC, the two carbon species in our 351

16
model. We determine 12C and 13C compositions of CH4 and DIC by multiplying the 352
concentration and 13C/12C ratio of the species. Isotope compositions are then 353
normalized to those of the Pee Dee Belemnite (PDB) standard, such that they are 354
computed and expressed in conventional delta notation (δ13C) over time and depth. 355
The mass balance equations are then rewritten in dimensionless form (Appendix 356
C) following previous work [Bhatnagar et al., 2007, 2008, 2011]. This reduces the 357
number of parameters describing a particular system, and allows for straightforward 358
comparisons of different systems from a mechanistic perspective. 359
360
3.5 Numerical solution 361
The dimensionless mass balance equations (Equations C23-C29) were solved 362
in conservative form for specified initial and boundary conditions (Equations C32-C46) 363
to obtain steady-state solutions. The hyperbolic dimensionless partial differential 364
equation for POC (Equation C23) was solved numerically using an implicit, block-365
centered, finite-difference scheme. To solve the other six equations (Equations C24-366
C29), explicit numerical schemes were formulated. These six partial differential 367
equations were recast in a finite difference form and solved with simultaneous update of 368
the POC profile in time. Solution to the above equations ensured no material loss (all 369
simulations had material balance errors <10-8). A single-point, upstream weighting was 370
used to formulate the sediment and fluid advection terms. To calculate fluxes across 371
numerical grid faces, upstream grid point values (for species concentration) were used, 372
as opposed to using average values at two adjacent grid points. 373
374

17
4. Results and Discussion 375
4.1 Steady state concentration profiles 376
4.1.1 Case 1: Site 1244 377
Site 1244 is characterized by significant CH4 generation at relatively shallow 378
depth ( z < tL ), and relatively low fluid advection [Pohlman et al., 2009]. Steady-state 379
concentration profiles were simulated (Figure 4) for parameters (Table 1) given or 380
inferred from reports for this location [Tréhu et al., 2003]. The sedimentation rate was 381
used to calculate a 1Pe of 0.044. Because this relates to sediment burial and porosity 382
reduction (Equation C18), this parameter was fixed for all simulations at this location. 383
The thickness of the SMT (as opposed to depth) should depend on AOMDa 384
[Bhatnagar et al., 2008]. The dimensionless number, AOMDa characterizes the rate of 385
AOM reaction to diffusion. We chose 810AOMDa for all simulations unless otherwise 386
specified, because this results in a thin overlap of CH4 and SO42- profiles at the SMT, as 387
observed in many locations (although difficult to prove at Site 1244 with the low sample 388
resolution, Figure 3a). 389
The normalized dissolved CH4 concentration profile (Figure 4a) shows near-zero 390
values at the SMT ( 0.08z or 10.6 mbsf) underlain by a rapid rise with increasing depth 391
(n.b., concentration profiles are plotted to the base of the GHSZ, 1z , although 392
simulated to 2z ). Upon exceeding local solubility conditions, excess CH4 would form 393
gas hydrate. This depth occurs at 0.65z (or 86 mbsf), with the chosen parameters 394
(Table 1) and 2Pe = -1, which relates to an upward fluid velocity 0.2 mm/yr. There 395
should exist relationships between pore water SO42- concentrations, pore water CH4 396

18
concentrations, CH4 solubility, and the shallowest occurrence of gas hydrate (Figure 1). 397
These are emphasized elsewhere [Bhatnagar et al., 2008, 2011]. Here, the primary 398
points are that CH4 rises from depth due to a combination of advection and diffusion, 399
and it decreases to near zero concentration at the SMT. The overall profile emerges 400
because of dissolved CH4 production below the SMT, because of internal cycling of 401
methane phases within the GHSZ (although not specifically modeled in this paper), and 402
because of AOM at the SMT. Moreover, as discussed below, an increase in upward 403
fluid flux moves the methane profile and the SMT to shallower depths. 404
Normalized SO42- concentrations drop nearly linearly from unity at the seafloor to 405
effectively zero at the SMT (Figure 4a). This depth lies at 0.08z (10.6 mbsf) with the 406
aforementioned initial estimates, and relatively high and low values for dimensionless 407
groups related to rates for AOM ( 810AOMDa ) and organoclastic sulfate reduction 408
( 010POCDa ). The combination of AOM (at the SMT) and organoclastic sulfate reduction 409
(between the seafloor and the SMT) removes all SO42-. However, with these group 410
values, AOM dominates net SO42- consumption. 411
The depth of the SMT should change with upward methane flux [e.g., Borowski 412
et al., 1996; Davie and Buffett, 2003b; Bhatnagar et al., 2008]. This can be simulated 413
under conditions of finite 1Pe but varying 2Pe (Figure 4). For example, with conditions 414
stated so far, as the magnitude of 2Pe rises from 1 to 3, the SMT shoals from 0.08z to 415
0.03z (4 mbsf). The SO42- profile at Site 1244 exhibits a slight concave-up curvature 416
above the SMT, which could reflect a drop in sediment porosity with increasing depth 417
over the upper few meters [Dickens, 2001b]. Physical property records at Site 1244 418

19
appear consistent with this interpretation [Shipboard Scientific Party, 2003b], although 419
we have not incorporated such heterogeneity into our simulations. 420
The case where 2Pe is -1 is particularly interesting. This gives pore water CH4 421
and SO42- profiles similar to those at Site 1244, including an SMT at 10.6 mbsf ( 0.08z ) 422
(Figure 4a). Moreover, with 2Pe = -1, the CH4 profile intersects the solubility curve at 423
0.65z (86 mbsf), (not shown here). This would mark the shallowest occurrence of gas 424
hydrate, which is about the depth (50 mbsf) reported in field observations [Tréhu et al., 425
2003; Lee and Collett, 2006]. 426
With the initial estimate ( 2Pe
= -1), the model simultaneously simulates 427
normalized pore water profiles of DIC and Ca2+ concentrations, and the δ13C of DIC. For 428
DIC, values increase from unity at the seafloor ( ,b oc = 2.4 mM) to 16.6 (= 39.8 mM) at the 429
SMT ( 0.08z ); below, values increase more gradually with depth, giving rise to a 430
curvature similar to observations (Figure 4b). The overall shape arises for three primary 431
reasons: first, methanogenesis generates considerable DIC at depth; second, this DIC 432
enters the SMT through advection and diffusion to mix with DIC generated by AOM; 433
third, DIC decreases from the SMT to the seafloor as it leaves the sediment through 434
advection and diffusion. Calcite precipitation also removes a small amount of DIC within 435
0.5 m around the SMT. 436
The previously-noted simulations with different 2Pe demonstrate the effect of 437
increasing upward fluid flux upon the shape of the DIC profile (Figure 4b). As external 438
advection (and CH4 input from depth) increases, the SMT shallows and the production 439
of DIC at this horizon (by AOM) accelerates. In addition, greater amounts of DIC 440
generated by methanogenesis ascend with pore fluids. The total effect is to amplify the 441

20
“kink” in the DIC profile, such that greater amounts of DIC leave the system through the 442
seafloor. 443
Normalized Ca2+ concentrations (Figure 4c) decrease from unity at the 444
sediment-water interface ( ,Ca oc = 10 mM) to 0.37 (= 3.7 mM) at the SMT. Below this, 445
values continue to drop, although at a more gradual rate. The generic shape of the Ca2+ 446
profile arises for three fundamental reasons: first, seawater Ca2+ enters the SMT from 447
above, through diffusion; second, advection carries the fluid upward ( 1Pe + 2Pe < 0); and 448
third, Ca2+ reacts with DIC to precipitate as carbonate. These factors also make the 449
Ca2+ concentration profile a “mirror-image” of the DIC profile (albeit somewhat 450
distorted). As such, an increase in upward fluid flux changes the shape of the Ca2+ 451
profile predictably: above the SMT, the gradient steepens; below the SMT, the gradient 452
lessens slightly (Figure 4c). This is because fluids depleted in Ca2+ rise from depth and 453
increased fluid flux causes greater CaCO3 precipitation. Additionally, increased delivery 454
of DIC from below promotes CaCO3 precipitation and likewise the demand for Ca2+ from 455
seawater, resulting in the steepened Ca2+ gradients above the SMT. 456
The steady state profile for the δ13C of DIC (Figure 4d) is especially interesting. 457
For the initial estimates, the δ13C of DIC drops from zero at the seafloor to -26‰ at the 458
SMT, but with “concave-down” curvature; below the SMT, it increases with depth to 459
more positive values (+20‰), again with “concave-down” curvature. Importantly, the 460
value at the SMT and the shape around the SMT are not prescribed in the model. 461
Instead, these occur for two reasons. First, DIC produced during methanogenesis and 462
having an initial δ13C of +20‰ rises from depth to mix with DIC generated at the SMT 463
and having a δ13C of -66‰. Second, this “mixed-source” DIC moves toward the 464
21
seafloor, where DIC is fixed at 0‰. With an increase in external fluid flux, the δ13C of 465
DIC at the SMT attains a negative peak (~-25‰ when 2Pe = -3) at a relatively shallower 466
depth. In summary, this pore water 13C profile arises in a system where AOM 467
dominates net consumption of SO42- in shallow sediment. 468
469
4.1.2 Case 2: Site KC151-3 470
Site KC151-3 differs from Site 1244 in two fundamental ways: fluids rich in CH4 471
and poor in SO42- rise from depth but at a relatively high rate [Dugan, 2008; Daigle and 472
Dugan, 2010]; and concentrations of pore water DIC and Ca2+ are low (<10 mM) and 473
high (>20 mM), respectively, at the base of the simulated domain. We model pore water 474
concentration profiles at Site KC151-3 (Figure 5) in an identical manner to those at Site 475
1244, but with a different set of parameters based on observations for Site KC151-3 476
(Table 1). 477
From the sedimentation rate, we calculated a 1Pe of 0.095. Our initial estimate for 478
2Pe was -2, which relates to an upward fluid velocity 0.17 mm/yr (comparable to 2Pe = -479
1 at Site 1244). The dimensionless groups related to AOM rate ( AOMDa = 108) and 480
organoclastic sulfate reduction ( POCDa = 100) used to model location KC151-3 were the 481
same as used for Site 1244. The combined effects of AOM (at the SMT) and 482
organoclastic sulfate reduction (between the seafloor and the SMT) are responsible for 483
net SO42- consumption, although owing to the relatively low value of POCDa , AOM is 484
dominant also at KC151-3. 485
22
The normalized dissolved CH4 profile (Figure 5a) is zero between the seafloor 486
and the SMT ( 0.05z or 15.7 mbsf). Below 15.7 mbsf, it shows a rapid increase with 487
depth. Methane concentrations intersect those on the solubility curve at 0.45z (or 141 488
mbsf). This should mark the shallowest possible occurrence of gas hydrate, but log 489
interpretations suggest gas hydrate occurs between 110 and 115 mbsf [Cook et al., 490
2008]. 491
Normalized, steady-state SO42- concentrations (Figure 5a) decrease nearly 492
linearly from unity at the sediment-water interface to near-zero at the SMT ( 0.05z ). As 493
at Site 1244, the SO42- data exhibit a slight concave-up curvature above the SMT at Site 494
KC151-3. The simulated SO42- profile does not show such curvature, and this may again 495
relate to a drop in porosity over the first few meters. 496
Upon increasing the external fluid flux (and the magnitude of 2Pe ), the SMT 497
shoals (Figure 5a). For one particular parameter choice ( 2 3Pe ), the SO42- profile 498
drops to near-zero concentration at 0.031z . This implies that the SMT and the top of 499
gas hydrate occur at ~9.8 mbsf and ~82 mbsf ( 0.26z ), respectively. These values 500
agree favorably with field data, which suggest 10.4 mbsf and 110 mbsf respectively. 501
Normalized DIC profiles (Figure 5b) contrast markedly with those at Site 1244, 502
irrespective of fluid flux. For the initial estimate, concentrations increase with depth until 503
the SMT, below which they decrease to very low values (~4 mM). The prominent DIC 504
peak at the SMT arises for four primary reasons: first, and most importantly, AOM 505
generates DIC at the SMT; second, this DIC, through advection and diffusion, leaves 506
the SMT; third, methanogenesis produces DIC at depth; fourth, pore fluids enriched in 507
23
Ca2+ react with DIC below the SMT. Calcite precipitation also removes relatively more 508
DIC below the SMT at this location. 509
An increase in upward fluid flux changes the shape of the DIC profile above and 510
below the SMT (Figure 5b). However, the reason is somewhat different than that for 511
Site 1244. A higher fluid flux results in greater CH4 input to the SMT, greater DIC 512
generation by AOM, greater DIC input to the SMT from depth, and greater DIC removal 513
from the SMT towards the seafloor. It also raises the Ca2+ input from depth, which leads 514
to greater calcite precipitation, below the SMT. Similar to SO42-, DIC profiles also 515
approach the field data for a value of 2 3Pe . 516
Normalized pore water Ca2+ concentrations (Figure 5c) drop from unity at the 517
seafloor to a low value at the SMT and then increase to a constant value at depth. The 518
shape of Ca2+ profiles arises for multiple reasons: first, Ca2+ from the ocean water 519
enters the SMT from above due to diffusion; second, a high flux of Ca2+ enters the SMT 520
from deeper strata, through advection and diffusion; a third, significant amount of calcite 521
precipitates. The combination gives rise to the unusual Ca2+ profile with a “dip” below 522
the SMT. A higher upward fluid flux compresses this dip because of greater Ca2+ input 523
from depth, and because of greater calcite precipitation (Figure 5c). Our model 524
matches the data well when 2 3Pe . 525
The modeled profiles of DIC δ13C differ significantly from those at Site 1244 in 526
terms of magnitude (Figure 5d). For the initial estimate ( 2 2Pe ), normalized δ13C of 527
DIC is zero at the seafloor, drops to an extreme of -62‰ at the SMT, and then 528
increases gradually with depth, but only to 10‰. On increasing fluid flux from depth, the 529

24
δ13C values similarly drops from 0‰ to a negative peak at a relatively shallower SMT, 530
then increases more rapidly to more positive values at greater depth. 531
Crucially, the values and the curvature of the DIC δ13C profile result from 532
modeling the CH4 and SO42- mass balances using basic parameters for the site; they 533
are not specified. Moreover, and importantly, the values and the curvature arise for 534
same general reasons as at Site 1244. The difference between the sites mainly occurs 535
because the flux and carbon isotopic composition of DIC entering the SMT from below 536
are less at KC151-3, and because the DIC produced at SMT (by AOM) has a more 13C-537
depleted value (δ13C = -70‰). In other words, the proportion of DIC entering the SMT 538
from depth versus that produced by AOM is much lower at Site KC151-3 compared to 539
Site 1244. This gives a lower DIC concentration at the SMT and a more negative peak 540
in DIC δ13C at the SMT. 541
542
4.2 Variations in AOM and Organoclastic Sulfate Reduction 543
Anaerobic oxidation of methane at the SMT with minimal organoclastic sulfate 544
reduction at or above this horizon explains pore water profiles across the SMT at Sites 545
1244 and KC151-3. The very different carbon chemistry at these sites is predicted by 546
the numerical simulations because of major differences in the supply and isotope 547
composition of DIC from depth. So far, an unresolved issue is how changes in the 548
relative proportion of AOM and organoclastic sulfate reduction would affect the profiles. 549
This can be assessed by changing AOMDa and POCDa in model simulations for Site 1244. 550
A decrease in AOMDa from its initial value of 108 to 105 illustrates the effect of this 551
dimensionless number on pore water profiles (Figure 6a) with same parameters used to 552

25
simulate the field data at Site 1244 (Appendix A). As reported by Bhatnagar et al. 553
[2008], a decrease in AOMDa slows the AOM reaction, and leads to a thicker SMT. 554
Because the SMT horizon is usually thin (<2 m), this small value of AOMDa is probably 555
unrealistic. Moreover, a smaller AOMDa lowers the DIC generation at the SMT by AOM, 556
and the Ca2+ removal by calcite formation. This would render higher Ca2+ 557
concentrations at and above the SMT, and a more negative δ13C values for DIC. These 558
simulated profiles ( 510AOMDa ) would not match data at the site, suggesting typical 559
values of AOMDa are slightly on the high side. Thus, it is unlikely to have a small AOMDa , 560
implying relatively greater proportion of AOM reaction at the SMT at Site 1244. 561
An increase in POCDa should result in higher consumption of POC and SO4
2- 562
between the seafloor and the SMT, resulting in higher DIC generation above the SMT. 563
This would deplete SO42- at a faster rate and result in non-linear profiles with a 564
“concave-down” curvature. The pore water SO42- profile is near-linear above the SMT at 565
most locations overlying gas hydrate. Thus, increasing POCDa does not result in non-566
linear profiles if AOM is dominated ( 810AOMDa ). Consequently, POC also gets 567
depleted faster, leading to less available POC to form CH4, thereby reducing the 568
production of CH4 and DIC by methanogenesis. As a result, the fluids are richer in Ca2+ 569
and δ13C of DIC is much more negative due to low DIC flux entering the SMT from 570
below (Figure 6b). Hence, increased POCDa (=105) is not realistic, since we cannot 571
match the data and non-linear (“concave-down” curvature) SO42- profiles are not 572
commonly observed at most sites. Furthermore, AOM, is always more dominant over 573
organoclastic sulfate reduction and influences shape of profiles across the SMT. 574

26
575
4.3 Concentration Cross-plots of Alkalinity and Sulfate 576
Excess alkalinity (Alk*) represents the amount of DIC that would occur in pore 577
water if authigenic carbonate had not precipitated; it can be calculated by summing the 578
deviations in pore water alkalinity, Ca2+, and Mg2+ relative to their respective 579
concentrations in seawater. Plots can be constructed showing changes in excess 580
alkalinity ( Alk*) versus changes in SO42- ( SO4
2-) (Figure 7). Such cross-plots have 581
been used to interpret the relative influence of organoclastic sulfate reduction and AOM 582
upon SO42- consumption in sediment above the SMT [e.g., Claypool et al., 2006; 583
Kastner et al., 2008a; Torres and Kastner, 2009]. Because of the different molar 584
quantities in the reactions (Equations 1 and 2), the idea has been that a, 1:1 slope 585
would support SO42- removal by AOM, a 2:1 slope would support SO4
2- removal by 586
POC, and a slope in between would support consumption by both processes. Data from 587
Site KC151-3 above the SMT lie on a 1:1 slope (Figure 7). By contrast, at Site 1244, a 588
nearly 2:1 slope in Alk*: SO42- characterizes pore waters above the SMT (Figure 7). 589
This observation has been argued to indicate POC driven SO42- consumption at Site 590
1244 [Kastner et al., 2008a], However, presentation and discussion of the data in such 591
a manner assumes a closed system with little or no mass transfer of dissolved 592
constituents, and fails to account for changes in DIC below the SMT [Dickens and 593
Snyder, 2009]. 594
The departure of alkalinity (DIC) and SO42- concentrations relative to their 595
respective seawater values can be obtained from the simulated steady-state pore water 596

27
profiles. Because we have not included Mg2+ in our modeling, Alk* is only computed 597
using DIC and Ca2+ concentrations. We consider a series of simulations. 598
For the first three simulations, parameters pertain to Site 1244. However, the 599
fluid flux and the relative proportion of SO42- consumption by AOM and organoclastic 600
sulfate reduction are adjusted by changing 2Pe , AOMDa and POCDa (Figure 8). All three 601
simulations give a 2:1 relation in Alk*: SO42- (Figure 8). 602
In the first case, there is zero external fluid flux, no methanogenesis, no AOM 603
and only organoclastic sulfate reduction. Although a 2:1 slope in Alk*: SO42- occurs, 604
pore water profiles (not shown here) do not conform to observations. Pore water SO42- 605
decreases gradually with a “concave-down” curvature. Pore water DIC increases with 606
depth until the SMT, below which it attains a constant value as DIC is carried down by 607
advection (burial) and diffusion. The δ13C of DIC is zero at the seafloor, and attains a 608
constant negative value at and below the SMT. Without methanogenesis, there is no 609
change in the DIC and δ13C of DIC below the SMT. 610
In the second and the third cases, there is a low fluid flux ( 2Pe = -0.1), 611
methanogenesis (and thus a deep source of DIC), and AOM. The third case includes 612
organoclastic sulfate reduction. In these cases, a 2:1 slope in Alk*: SO42- occurs and 613
the profiles generally match the data. 614
Clearly, a cross-plot showing 2:1 slope for in Alk*: SO42- above the SMT 615
concentration does not imply organoclastic consumption of SO42-. It can result from 616
multiple combinations of fluid flux with AOM and a deep source of DIC (from 617
methanogenesis). More interestingly, changes in the fluid flux or the rate of 618
methanogenesis and deep source DIC concentration can affect the slope (Figure 9a). 619

28
An increase in upward fluid flux (greater magnitude of 2Pe ) will generally decrease the 620
slope on a Alk*: SO42- cross-plot. This is because the SMT shoals (Figure 4) and also 621
high flux of DIC enters the SMT from depth. By contrast, an increase in methanogenesis 622
(higher Da ) and a higher concentration of DIC at depth will generally increase the slope 623
(Figure 9a). This is because a greater concentration of DIC at depth as a result of 624
methanogenesis can then enter the SMT through advection and diffusion. 625
Simulated profiles for Site KC151-3 consistently render points that lie beneath a 626
2:1 slope; in fact, the slope in Alk*: SO42- is less than 1:1 (Figure 9b). This reflects the 627
dual facts that a portion of DIC leaves the SMT to accumulate as carbonate beneath 628
this horizon, and that excess Ca2+ enters shallow sediment from below. An increase in 629
upward fluid flux would decrease the slope of the cross-plot similar to our above result 630
shown at Site 1244 (Figure 9a). In any case, the slope of the line does not indicate the 631
reaction. 632
633
4.4 Flux cross-plots 634
In contrast to using Alk*: SO42- cross-plots, concentration gradients of alkalinity 635
(DIC), SO42- and Ca2+ in and out of the SMT might be used to evaluate the role of AOM 636
[Luff and Wallman, 2003; Snyder et al., 2007; Dickens and Snyder, 2009; Kim et al., 637
2011]. The basic idea is that the gradients are proportional to fluxes, so that the sum of 638
changes across the SMT should balance. 639
Starting from our simulated results, we compute concentration gradients by 640
linearly fitting the profiles above and below the SMT. Using these gradients, and 641
multiplying by sediment diffusion coefficients, we compute diffusive fluxes of CH4, SO42- 642

29
and DIC across the SMT horizon. Advective flux of any dissolved species is a function 643
of fluid flux and the solute concentration. In the vicinity of the SMT, both the CH4 and 644
SO42- concentrations approach zero. Thus, in the vicinity of the SMT both the transport 645
of CH4 and SO42- are diffusion-dominated. Furthermore, the net advective DIC flux 646
across the SMT is calculated as a difference in deeper flux from/to deeper sediment and 647
shallow flux to/from the seafloor. Across the SMT, this net advective DIC flux is zero as 648
the individual deep and shallow advective DIC fluxes are equal and opposite in sign. 649
Hence, the total flux (sum of advective and diffusive flux) is equal to the diffusive flux 650
across the SMT. 651
The diffusive fluxes of CH4 and DIC are now plotted relative to the SO42- flux 652
(Figure 10). Crucially, this cross-plot (Figure 10) not only represents a diffusive flux 653
cross-plot, but it is also equivalent to a net flux cross-plot for a given pair of species. 654
Both CH4 and DIC fluxes show a unique 1:1 correspondence relative to the SO42- flux. 655
This 1:1 correspondence implies dominance of the AOM at the SMT, due to its 656
stoichiometric balance (Equation 1). Increasing the reaction rate of organoclastic 657
sulfate reduction ( POCDa ) by few orders of magnitude (~102) does not alter the slope of 658
the flux cross-plot (Figure 10). Interestingly, increasing the rate of methanogenesis 659
( Da ) and a high DIC source at depth also correspond to a 1:1 relation between 660
respective fluxes. In essence, the difference between DIC flux leaving the SMT toward 661
the seafloor and the flux entering the SMT from below is equal to the flux added at the 662
SMT by AOM. This DIC flux added due to AOM at the SMT corresponds to the SO42- 663
flux entering the SMT from above by a simple 1:1 correlation, again because of the 664
stoichiometric relationship between CH4, DIC, and SO42- (Equation 1). In all these 665

30
cases the rate of downward SO42- flux via diffusion is able to keep pace with CH4 666
delivery from below, allowing DIC fluxes to also balance across the SMT. 667
668
4.5 Relationship between AOM and δ13C values 669
The data show a wide range in δ13C values of DIC at the SMT in shallow 670
sediment of gas hydrate systems (Figure 2). A series of papers have used this to 671
discriminate between potential causes for pore-water SO42- consumption [Claypool et 672
al., 2006; Kastner et al., 2008a; Torres and Kastner, 2009]. The basic idea has been 673
that the δ13C of DIC at the SMT relates to the relative proportion of DIC generated 674
through AOM and organoclastic sulfate reduction (Equations 1 and 2); the first reaction 675
would produce DIC exceptionally depleted in 13C (δ13C <-40‰, depending on the CH4 676
source) whereas the second reaction would produce DIC moderately depleted in 13C 677
(δ13C ~-23‰), roughly corresponding the 13C values of POC. 678
This approach, however, is fundamentally flawed because it neglects other inputs 679
(and outputs) of DIC to the SMT, especially DIC rising from depth. At most locations 680
including Sites 1244 and KC151-3, the CH4 is derived from methanogenesis 681
(Equations 3 and Appendix B). As such, both 13C-depleted CH4 and 13C-enriched DIC 682
are generated [e.g., Conrad, 2005], and the latter can enter and leave the SMT through 683
advection and diffusion. The δ13C of DIC at the SMT, therefore, depends on the mixing 684
of DIC with different carbon isotope compositions. Our simulations clearly show that a 685
range of DIC δ13C can (and should) occur across the SMT, even when AOM consumes 686
all SO42- in shallow sediment. 687
688

31
4.6 Influence of Carbonate Precipitation 689
Methane-charged sediment deposited on modern continental margins (including 690
Cascadia Margin and the Gulf of Mexico) often contains authigenic carbonate [e.g., Botz 691
et al., 1988; Greinert et al., 2001; Formolo et al., 2004]. Certainly, some of this 692
carbonate precipitates at or near an SMT [e.g., Rodriguez et al., 2000; Snyder et al., 693
2007], consistent with our model (Figure 4 and 5). Authigenic carbonate has also been 694
found in sedimentary rocks deposited along ancient continental margins that 695
presumably contained high CH4 concentrations [e.g., Campbell, 2006]. Various lines of 696
evidence (e.g., biomarkers) suggest that some of this carbonate formed in association 697
with AOM [Peckmann and Thiel, 2004; Allison et al., 2008]. 698
Authigenic carbonates, both modern and ancient, exhibit a wide range in δ13C 699
[e.g., Greinert et al., 2001; Campbell, 2006]. Various workers have generally attributed 700
this spread to the relative inputs of HCO3- from AOM, the oxidation of higher 701
hydrocarbons, and organoclastic sulfate reduction [Botz et al., 1988; Greinert et al., 702
2001; Formolo et al., 2004; Peckmann and Thiel, 2004; Campbell, 2006; Allison et al., 703
2008]. Our model results highlight a basic problem with this approach. As discussed for 704
pore water, carbonate precipitating at or near the SMT should have a wide range in 705
δ13C, even when AOM is the proximal cause for carbonate precipitation. Vertical inputs 706
and outputs of DIC to and from the SMT must be considered. 707
708
5. Conclusions 709
We have updated a 1-D numerical model for the formation of gas hydrate in 710
marine sediment [Bhatnagar et al., 2007, 2008, 2011] so that it has coupled mass 711

32
balance equations for CH4, SO42-, DIC, Ca2+ and the δ13C of CH4 and DIC in pore water. 712
This is an important progression because concentrations and carbon isotopic 713
composition of these species must be impacted collectively if CH4 cycling in marine gas 714
hydrate systems includes sediment burial, CH4 production from organic carbon, an 715
upward flux of methane, and significant loss of CH4 by AOM. Moreover differences in 716
key parameters, including solute transport from deeper sediment though advection and 717
diffusion, should cause significant variations in the pore water chemistry of shallow 718
sediment. 719
Model simulations were conducted at two locations: Site 1244 (Hydrate Ridge) 720
and Site KC151-3 (Gulf of Mexico). We chose these locations because they have very 721
different DIC concentrations and 13C of DIC across the SMT. At both sites, the 722
simulations give good first-order descriptions for the profiles of CH4, SO42-, DIC, Ca2+ 723
and the 13C of CH4 and DIC in shallow sediment (Figure 4 and 5). Importantly, model 724
results are constrained by field measurements of physical and chemical parameters, 725
and the concentrations and shapes of model profiles. Crucially, the concentrations and 726
shapes of various profiles stem from coupled mass balance equations and site-specific 727
parameters; in other words, the inputs and outputs of CH4 drive the profiles. Although 728
problems with our model remain (e.g., changing water activity, sediment 729
heterogeneities, lateral flow), the fact that CH4 distributions and multiple pore water 730
profiles can be simulated simultaneously and fairly accurately at different locations 731
supports the approach. 732
Our numerical modeling gives a mathematically robust, process-based 733
explanation for SMT depth as well as the difference in carbon chemistry across the SMT 734

33
at Sites 1244 and KC151-3. At both sites, an upward flux of dissolved CH4 reacts with 735
dissolved SO42- at the SMT via AOM. Moreover, at both sites, AOM dominates the net 736
consumption of SO42- in shallow sediment. At Site 1244, however, a high flux of 13C-737
enriched DIC, produced by methanogenesis at depth, enters the SMT from below. This 738
is not the case at Site KC151-3, where a flux of 13C-enriched DIC leaves the SMT in 739
both directions. As such, the SMT has relatively high concentrations of moderately 13C-740
depleted DIC at Site 1244 and relatively low concentrations of very 13C-depleted DIC at 741
Site KC151-3. Other factors, notably fluid flow and carbonate precipitation, secondarily 742
affect the carbon chemistry across the SMT at these sites. In any case, the differences 743
in DIC concentration and 13C of DIC do not relate to the relative importance of AOM 744
and organoclastic sulfate reduction. 745
Cross-plots showing changes in alkalinity and SO42- concentrations have been 746
used to assess the relative influence of AOM in marine sediment. The δ13C of DIC and 747
the δ13C of carbonate also have been used for this purpose. These approaches are not 748
appropriate for open systems without additional information, especially those where 749
large fluxes of 13C-enriched DIC enter shallow sediment from depth. Wide deviations in 750
Alk*: SO42- slopes and DIC δ13C are expected, even when AOM consumes all net 751
SO42- (Figure 2). 752
The DIC concentration and δ13C of DIC across the SMT exhibit broad ranges for 753
locations with underlying gas hydrate (Figure 2). On the basic of preliminary flux 754
arguments [Dickens and Snyder, 2009] and results presented here, we suspect this 755
range mostly signifies differences in fluid flux regime, and the relative proportions of 13C-756
depleted CH4 and 13C-enriched DIC entering the SMT. 757
758

34
Appendices 759
Appendix A: Nomenclature 760
j
ic , j
ic Mass fraction of component i and normalized value in phase j 761
,m eqbc
Equilibrium CH4 mass fraction in pore water at the base of the 762
GHSZ 763
,s oc , ,b oc , ,Ca oc Mass fraction of SO42-, DIC, and Ca2+ in seawater 764
mD , sD , bD , CaD
Diffusivities of CH4, SO42-, DIC, and Ca2+ 765
AOMDa , POCDa , Da Damköhler numbers for AOM, organoclastic sulfate reduction and 766
methanogenesis 767
dT dz Geothermal gradient 768
tL , zL
Depth to the base of the GHSZ, and simulation domain respectively 769
sL , L
SMT and compaction depth respectively 770
4CHM , 4SOM Molecular weight of CH4, and SO4
2- respectively 771
3 HCOM , CaM , POCM Molecular weight of DIC, Ca2+ and POC, respectively 772
oP Hydrostatic pressure at the seafloor 773
1Pe , 2Pe Peclet numbers for compaction driven and external fluid flow 774
r Reaction rate constant 775
S Sedimentation rate at the seafloor 776
t , t Dimensional and dimensionless time, respectively 777
oT Seafloor temperature 778
fU , sedU Net fluid flux and sediment flux, respectively 779

35
fU , sedU
Dimensionless net fluid flux and sediment flux, respectively 780
,f sedU , ,f extU Fluid flux due to sedimentation and compaction, and upward flow, 781
respectively 782
sv
Sediment velocity 783
z , z Vertical depth and normalized vertical depth, respectively 784
, Organic content in sediment and normalized value, respectively 785
o , Organic content at seafloor and normalized value, respectively 786
13
POCC
δ13C of POC 787
4
13
CHC ,3
13 HCOC
δ13C of CH4 and DIC, respectively 788
4
13
, CH methC δ13C of CH4 generated by methanogenesis 789
3
13
, HCO methC
δ13C of DIC generated by methanogenesis 790
3
13
, HCO POCC
δ13C of DIC produced by organoclastic sulfate reduction 791
m Fractionation factor for methanogenesis 792
, Sediment porosity and reduced sediment porosity, respectively 793
o , Sediment porosity at the seafloor and minimum porosity at depth, 794
respectively 795
, Reduced porosity parameters 796
AOM, POC ,
Rates of AOM, organoclastic sulfate reduction and methanogenesis 797
j , j Density of the phase j and normalized value, respectively 798
799
Subscripts and superscripts: 800

36
w , m , s Water, CH4 and SO42- components, respectively 801
b , Ca , 3CaCO DIC, Ca2+ and CaCO3 components, respectively 802
l , sed Liquid and sediment phase, respectively 803
AOM , POC AOM and organoclastic sulfate reduction reactions, respectively 804
meth , ppt Methanogenesis and calcite precipitation reactions, respectively 805
806
Appendix B: Chemical reactions 807
Methanogenesis is complex but can be represented with a simplified set of 808
reactions [e.g., Conrad, 2005] 809
Fermentation: 810
2 2 3 2 26CH O + 2H O 2CH COOH + 2CO + 4H (B1) 811
CO2 reduction and acetate methanogenesis 812
3 4 22CH COOH 2CH + 2CO (B2) 813
2 2 4 2CO + 4H CH + 2H O (B3) 814
Overall reaction: 815
2 4 22CH O CH CO (B4) 816
The carbon dioxide generated will react with pore water to form DIC: 817
2 2 3CO H O HCO H (B5) 818
Carbon isotope fractionation during methanogenesis is also complex and 819
depends on the composition of precursors, various fractionation factors, and the relative 820
contribution of methanogenic pathways [e.g., Conrad, 2005]. By combining fermentation 821

37
and both pathways for methanogenesis (Equations B1-B4), we have implicitly 822
integrated carbon isotope fractionation within intermediate reactions. 823
824
Appendix C: Updated Model Equations 825
C.1 Mass balances 826
C.1.1 Organic carbon 827
During sediment burial, microbes use a portion of POC in chemical reactions. We 828
define this labile (utilizable) organic carbon as . For this work, the reactions are 829
methanogenesis (Equation 3) and organoclastic sulfate consumption (Equation 5). 830
The overall mass balance equation for labile organic carbon is: 831
4
11 1 (1 ) ( )( )l
sed sed s sed sed wPOC
SO
sv ct z M
, (C1) 832
where sed = sediment density, w = water density, z = depth, sv = sediment velocity, 833
l
sc = dissolved SO42- concentration, = first-order rate constant of methanogenesis 834
(Equation 3), porosity, 4SOM = molecular weight of SO4
2-, and POC = second-order 835
rate constant of organoclastic sulfate reduction (Equation 5). 836
The two terms on the left of Equation C1 represent the accumulation of labile 837
organic carbon with time, and divergence of the transport of this component with depth. 838
The two terms on the right correspond to the reactions that consume labile POC 839
(Equations 3 and 5, respectively). Note three simplifications: the amount of degradable 840
POC at the seafloor is constant with time; organic carbon is buried (down) with sv 841
equivalent to the sedimentation rate ( S ); and the sedimentation rate is constant over 842
time. 843

38
844
C.1.2 Methane 845
Once CH4 forms in sediment, it can accumulate as dissolved gas, gas hydrate, or 846
free gas. In a dynamic system, CH4 also moves with respect to the seafloor over time. It 847
can advect down with sediment (burial) as gas hydrate, advect up or down with fluid as 848
dissolved or free gas, or diffuse due to concentration gradients in the dissolved phase. It 849
can also rise as free gas; however, free gas migration is not modeled in this study (n.b., 850
compelling evidence for free gas migration through the GHSZ does not exist at the sites 851
examined; e.g., Cook et al., 2008; Lee and Collett, 2008). Furthermore, dissolved CH4 852
transported towards the seafloor can react with SO42- (Equation 4). The overall mass 853
balance equation for dissolved CH4 is: 854
4
4
( )( ) 1
l l lCHl l m AOM w m w s
w m f w m w m sed
POC SO
Mc c cc U c D
t z z z M M, 855
(C2)
856
where fU = net fluid flux, l
mc = dissolved CH4 concentration, AOM AOM reaction rate 857
constant (Equation 4), mD = CH4 diffusivity4CHM and POCM = molecular weights of 858
CH4 and POC, respectively (and other parameters are defined above). The net fluid flux 859
fU is the sum of the fluid flux due to sedimentation (i.e., that carried down in pore space 860
through burial and compaction) and the external fluid flux (i.e., that moved relative to the 861
sediment from deeper sources). 862
The two terms on the left of Equation C2 represent the accumulation and 863
divergence of CH4 advection; the three terms on the right correspond to CH4 diffusion, 864
methanogenesis (Equation 3), and AOM (Equation 4). Methane production and 865

39
concentration are assumed zero at and above the SMT. Hence, methanogenesis in the 866
model only occurs in the absence of pore water SO42-. 867
The mass balance equations in Bhatnagar et al. [2007, 2008] include three 868
phases for CH4 (e.g., dissolved, hydrate, and free gas). In this study, we neglect the 869
hydrate and free gas phases in our calculations, and only solve for the dissolved CH4 870
concentration (basically, CH4 concentrations exceeding solubility do not form gas 871
hydrate or free gas). This simplifies the model, and allows us to focus on shallow pore 872
water chemistry profiles, the primary concern of this paper. This simplification also does 873
not affect the remaining pore water chemistry profiles (e.g., SO42-, DIC, Ca2+) as they 874
are all dissolved species and only relate to the dissolved phase concentration of CH4. 875
876
C.1.3 Sulfate 877
Deep ocean SO42- concentrations have been a constant value, ~28 mM, for 878
millions of years [Lowenstein et al., 2001], with the exception of anoxic zones. With 879
sediment burial, however, pore water SO42- concentrations can vary significantly 880
(Figure 3a) because of fluid advection, diffusion, and two consumption reactions 881
(Equations 4 and 5). The overall SO42- mass balance equation that incorporates these 882
factors is: 883
l
l l sw s f w s w s
cc U c D
t z z z
884
4
1 ( )( ) ( )( )
ll lPOC sed w sAOM w m w s
CH POC
cc c
M M
, (C3) 885
where sD = sulfate diffusivity (and other parameters are defined above). 886
40
The two terms on the left of Equation C3 represent the accumulation and 887
divergence of SO42- advection; the three terms on the right correspond to SO4
2- 888
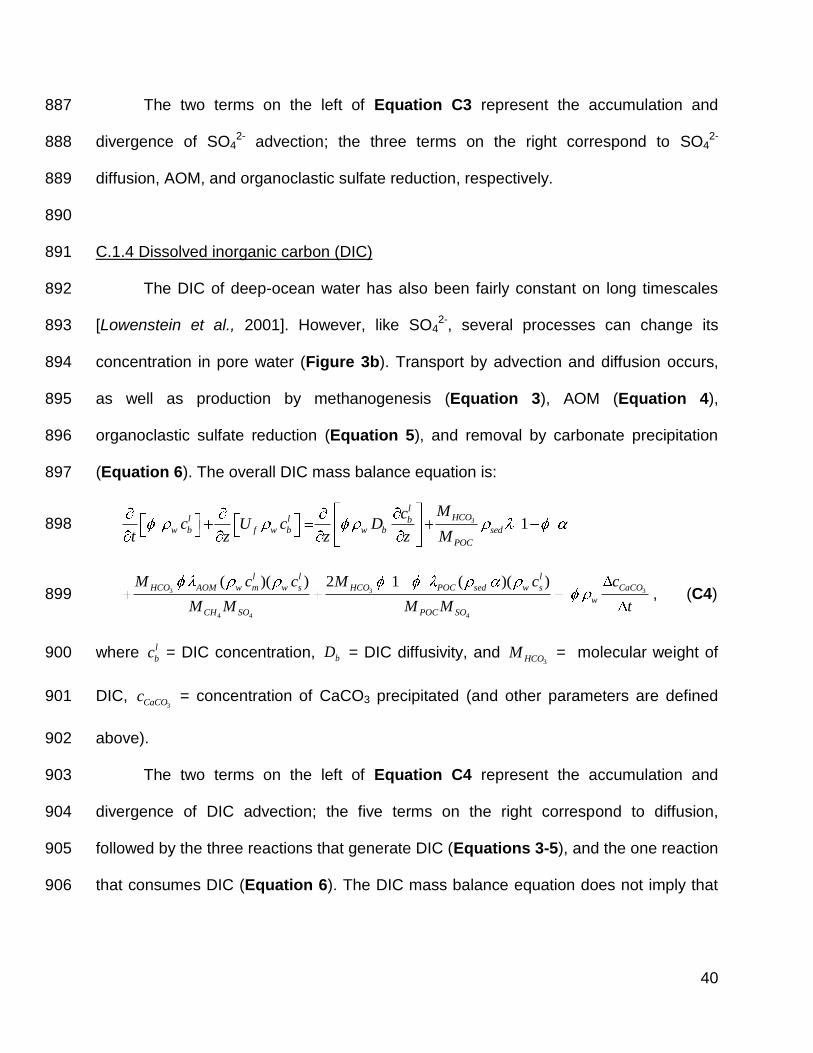
diffusion, AOM, and organoclastic sulfate reduction, respectively. 889
890
C.1.4 Dissolved inorganic carbon (DIC) 891
The DIC of deep-ocean water has also been fairly constant on long timescales 892
[Lowenstein et al., 2001]. However, like SO42-, several processes can change its 893
concentration in pore water (Figure 3b). Transport by advection and diffusion occurs, 894
as well as production by methanogenesis (Equation 3), AOM (Equation 4), 895
organoclastic sulfate reduction (Equation 5), and removal by carbonate precipitation 896
(Equation 6). The overall DIC mass balance equation is: 897
3
1l
HCOl l bw b f w b w b sed
POC
Mcc U c D
t z z z M 898
4
33 3
4 4
( )( ) 2 1 ( )( )
l l l
HCO AOM w m w s HCO POC sed w s
w
CH SO POC
CaC
O
O
S
M c c M c
M M M M t
c, (C4) 899
where l
bc = DIC concentration, bD = DIC diffusivity, and 3HCOM = molecular weight of 900
DIC, 3CaCOc = concentration of CaCO3 precipitated (and other parameters are defined 901
above). 902
The two terms on the left of Equation C4 represent the accumulation and 903
divergence of DIC advection; the five terms on the right correspond to diffusion, 904
followed by the three reactions that generate DIC (Equations 3-5), and the one reaction 905
that consumes DIC (Equation 6). The DIC mass balance equation does not imply that 906

41
all DIC will be consumed in sediment. In fact, as will be shown, significant loss of DIC to 907
the ocean can occur through the sediment-water interface. 908
909
C.1.5 Calcium 910
Dissolved Ca2+ concentrations of deep ocean water have also been relatively 911
constant on long timescales [Lowenstein et al., 2001], but often change in sediment 912
(Figure 3c) because of advection, diffusion, and carbonate precipitation. The Ca2+ 913
mass balance equation is: 914
3 l
l l Caw Ca f w C
CaCO
a w Ca w
cc U c D
t z z z
c
t, (C5) 915
where l
Cac = dissolved Ca2+ concentration, and CaD = Ca2+ diffusivity (and other 916
parameters are defined above). 917
The two terms on the left of Equation C5 represent the accumulation and 918
divergence of Ca2+ advection; the two terms on the right correspond to Ca2+ diffusion 919
and carbonate precipitation (Equation 6). As mentioned earlier, carbonate precipitation 920
has been modeled as an equilibrium reaction with calcite as the mineral precipitate. 921
922
C.1.6 Carbon isotopic composition 923
The carbon isotope composition ( 13C) of methane and DIC clearly change in 924
sediment (Figure 3d). Consequently, the 12C and 13C contents of these carbon-bearing 925
phases should be tracked, for which there are two main considerations. POC buried 926
with sediment has a 13C between -26 and -16‰ [Conrad, 2005; Kim et al., 2007]. 927
During methanogenesis, however, fractionation of carbon isotope values occurs, such 928

42
that the CH4 becomes depleted in 13C while the DIC becomes enriched in 13C [e.g., 929
Conrad, 2005]. 930
For CH4, we incorporate carbon isotopes into Equation C2 as follows: 931
4
4 4
13
13 13( )
CH
CH C
l
ml l
w m f w m w mH
CC C
cc U c D
t z z z 932
4
4
4
4
13
13
,
( )( ) 1
CH
CH meth
l l
CH AOM w m w s
sed
POC SO
M c c
M M
CC
, (C6) 933
where 4
13
CHC = δ13C of dissolved CH4, and 4
13
, CH methC = δ13C of CH4 produced during 934
methanogenesis (fixed site-specific parameter). 935
Likewise for DIC, we incorporate carbon isotope values into Equation C4 as 936
follows: 937
3
3 3
13
13 13( )
HCO
HCO HCO
l
bl l
w b f w b w b
cc U c D
z
C
t z zC C938
3 3
4
4
4
3
13
13
,
)( ) ( 1
l l
HCO HCO AOM w m CH
HCO meth
w s
sed
POC CH SO
M M c c
M M M
CC
939
3 3 3 3
4
13 13
,2 1 ( )( ) (
) HCO
l
HCO POC sed w s
w
POC SO
POC CaCO HCOC cc CM
M M t, (C7) 940
where 3
13
HCOC = δ13C of dissolved DIC, 3
13
,HCO methC = δ13C of DIC generated by 941
methanogenesis (a fixed, site-specific parameter), and 3
13
,HCO POCC = δ13C of DIC 942
generated by sulfate reduction of POC (a fixed, site-specific parameter). 943
The two terms on the left of Equation C7 represent the accumulation and 944
divergence of advection of 12C and 13C in DIC; the five terms on the right correspond to 945

43
the diffusion of 12C and 13C in DIC, followed by the three reactions that generate DIC 946
(Equations 3-5), and the one that consumes DIC (Equation 6). 947
948
C.2 Normalized variables and key dimensionless groups 949
The mass balance equations (Equations C1-C7) can be rewritten in 950
dimensionless form [Bhatnagar et al., 2007, 2008]. This reduces the number of 951
parameters describing a particular system, and allows for straightforward comparisons 952
of different systems from a mechanistic perspective. To accomplish this, key variables 953
need to be normalized. We follow the scaling schemes developed by Bhatnagar et al. 954
[2007]. All dimensionless variables are represented with a tilde ( ) to distinguish them 955
from their corresponding dimensional forms. 956
Vertical depth is scaled to the base of the GHSZ ( tL ): 957
t
zz
L. (C8)
958
This means that, for all gas hydrate systems examined, various calculations are made 959
and results presented with the seafloor and the base of the GHSZ having values of 0 960
and 1, respectively (e.g., Figures 4 and 5).
961
Time is normalized through a combination of tL and diffusivity of methane ( mD ). 962
2
t m
tt
L D. (C9) 963
Initial time is denoted by 0t when sediments start to land on the seafloor. Normalized 964
time 1t implies the diffusion time required to travel the distance between the base of 965
the GHSZ and the seafloor. 966

44
Contents of degradable POC in the sediment column ( ) are normalized to the 967
initial quantity deposited at the seafloor ( 0 ). The initial POC content deposited at the 968
seafloor is normalized with the equilibrium CH4 concentration at the base of GHSZ 969
(,m eqbc ). These are expressed as: 970
0
, ,
0 m eqbc
. (C10) 971
Likewise, dissolved CH4 concentations through the sediment column ( l
mc ) are 972
normalized to the equilibrium CH4 concentration at the base of GHSZ. This is because, 973
for the upper few hundreds of meters of marine sediment, the maximum possible l
mc will 974
typically occur at this depth [Zatsepina and Buffett, 1998; Bhatnagar et al., 2007]; 975
Figure 1a). The normalization is expressed as: 976
,
ll mm
m eqb
cc
c.
(C11) 977
By contrast, pore water SO42-, DIC, and Ca2+ concentrations are normalized to 978
their respective values in seawater, ,s oc , ,b oc , and ,Ca oc : 979
,
ll ss
s o
cc
c,
,
ll bb
b o
cc
c ,
ll caca
Ca o
cc
c
.
(C12) 980
In general, normalized SO42- and Ca2+ concentrations will diminish from 1 with depth, 981
while normalized DIC concentrations will exceed 1 with depth (Figures 4 and 5). 982
Porosity at a given depth is normalized to the minimum value at great depth ( ): 983
1. (C13)
984

45
However, to obtain appropriate porosity profile with depth and to simplify equations, two 985
additional parameters are introduced: 986
0
1,
1
,
(C14) 987
where o = porosity at the seafloor and = normalized porosity at the seafloor. In 988
general, porosity decreases with depth because of compaction, so that o > > and
989
> . At great depth, porosity approaches a minimum value and the fluid and sediment 990
velocities approach a common asymptotic value [Berner, 1980; Davie and Buffett, 2001; 991
Bhatnagar et al., 2007]. Fluid gets buried (downward) with the sediment and its velocity 992
increases with depth. However, the fluid flux (product of its velocity and porosity) at any 993
depth remains constant at steady-state conditions. 994
The downward component of the net fluid flux ( fU ), defined as ,f sedU , can be 995
expressed as a combination of sedimentation rate ( S ) and porosity parameters 996
[Bhatnagar et al., 2007]: 997
,
1
1
of sed SU
.
(C15) 998
The sediment flux ( sedU ) can be defined as: 999
1 sed oU S . (C16) 1000
It represents the downward transport of sediment grains, and is assumed to be 1001
constant. For convenience, it can be scaled with respect to , f sedU , which can be related 1002
to [Bhatnagar et al., 2007].
1003
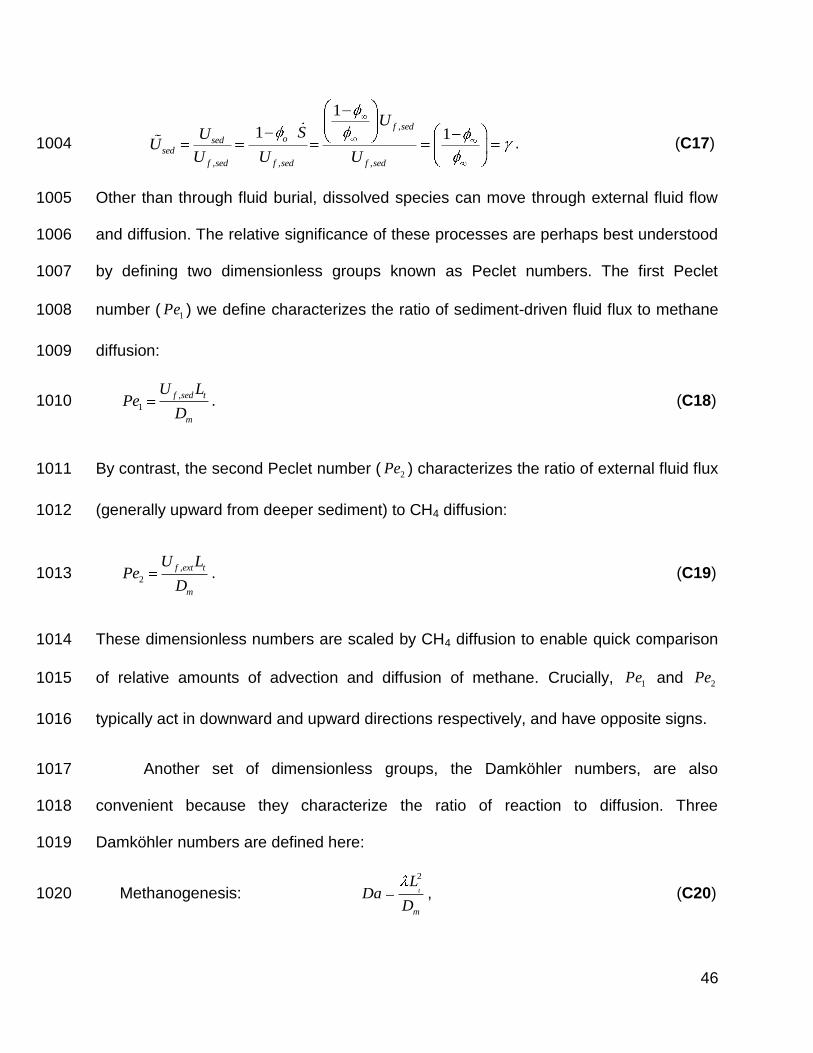
46
,
, , ,
1
1 1
f sed
osedsed
f sed f sed f sed
USU
UU U U
.
(C17) 1004
Other than through fluid burial, dissolved species can move through external fluid flow 1005
and diffusion. The relative significance of these processes are perhaps best understood 1006
by defining two dimensionless groups known as Peclet numbers. The first Peclet 1007
number ( 1Pe ) we define characterizes the ratio of sediment-driven fluid flux to methane 1008
diffusion: 1009
,
1
f sed t
m
U LPe
D.
(C18) 1010
By contrast, the second Peclet number ( 2Pe ) characterizes the ratio of external fluid flux 1011
(generally upward from deeper sediment) to CH4 diffusion: 1012
,
2
f ext t
m
U LPe
D.
(C19) 1013
These dimensionless numbers are scaled by CH4 diffusion to enable quick comparison 1014
of relative amounts of advection and diffusion of methane. Crucially, 1Pe and 2Pe 1015
typically act in downward and upward directions respectively, and have opposite signs. 1016
Another set of dimensionless groups, the Damköhler numbers, are also 1017
convenient because they characterize the ratio of reaction to diffusion. Three 1018
Damköhler numbers are defined here: 1019
Methanogenesis:
2
t
m
LDa
D, (C20) 1020

47
AOM: 4
2
, tAOMw m eqb
AOM
CH m
LcDa
M D, (C21) 1021
Organoclastic sulfate reduction:
2
, tPOCw m eqb
POC
POC s
LcDa
M D. (C22) 1022
All parameters and dimensionless groups are defined collectively, along with 1023
specific values in Appendix A and Table 1. 1024
1025
C.3 Dimensionless mass balance equations 1026
The dimensional mass balance equations (Equations C1-C7) can be rewritten in 1027
dimensionless form using the normalized variables and dimensionless groups defined 1028
above. The evolution of POC through depth and time can be expressed as: 1029
4
,
1
,
1 11(1 ) (1 )
1
s POC s o l
sed POC s
m SO m eqb
D M cPe U Da Da
t z D M cc .1030
(C23) 1031
For CH4, the dimensionless mass balance equation is: 1032
1 2
1 1 1 ( )
l ll m mm
c cc Pe Pe
t z z z 1033
4 4
4
,
,
1 1
CH CH s o l l
sed AOM m s
POC SO m eqb
cM M c
DaM
cDaM c
.
(C24)
1034
For SO42-:
1035
1 2
1 1 1 ( )
l ll s s ss
m
DPe Pe
c c
z Dc
t z z 1036

48
1 11
1
l l lsAOM m s sed POC s
m
c cD DaD
cD
a .
(C25) 1037
For DIC: 1038
1 2
1 1 1 ( )
l ll b b bb
m
DPe Pe
c c
t z z D zc 1039
3 3
4
, ,
, ,
1 1
HCO m eqb HCO s o l l
sed AOM m s
POC b o SO b o
M c M cDa Da c c
M c M c 1040
3
4
3, ,
, ,
1 12 1
(1 )
HCO s o Ca olssed POC s
SO b o b
Ca
m o
COM c cDDa c
M c D c
c
t.
(C26) 1041
For Ca2+: 1042
3
1 2
1 1 1 1 ( )
l ll Ca Ca Caa
C
C
O
m
aCcc D cc Pe Pe
t z z D z t.
1043
(C27) 1044
For 12C and 13C of CH4: 1045
4
4 4
13
13 1
2
3
1
1 1 1( )
CH
CH
l
CH
ml l
m m
cc Pe Pe c
t z z z
CC C 1046
4
4
4
4
4 13 13
,
,
,
11
CH CH s o l
CH meth C
l
sed AOM m s
POC SO m eq
H
b
M M cC CDa Da c c
M M c
. (C28) 1047
And, for 12C and 13C of DIC: 1048
3
3 3 1
13
1
2
3 13 1 1 1
( )HCO
HCO HCO
l
bl l bb b
m
cDc Pe Pe c C
t z
CC
z z D1049
3 4
3 3
4
, 13 13
,
,
, ,
1 1
HCO met
HCO m eqb HCO s o l l
sed AOM m s
POC b o SO b
h
o
CH
M c M cDa Da c c
M MC
c cC 1050

49
3 3 3
3
4
, ,
, ,
13
13
,
1 12 ( )1
1
CaCO HCO
HCO POC
HCO s o Ca olssed POC s
SO b o m b o
M c cDDa c
M c D
C
cC
t
c1051
. (C29)
1052
The above differential mass balance equations can be solved for finite solutions, 1053
with initial conditions and boundary conditions. 1054
1055
C.4 Initial conditions ( 0t ) 1056
Seafloor temperature ( 0T ) and the geothermal gradient ( dT dz ) are specified and 1057
remain invariant through time. Consequently, there is a fixed, increasing temperature 1058
profile with depth. 1059
Pressure is set to hydrostatic conditions throughout the sediment column. This 1060
appears valid for z < tL because, in several drill holes, the base of the GHSZ lies close 1061
to a depth predicted from gas hydrate stability conditions, measured temperatures, 1062
salinities and hydrostatic pressure [e.g., Paull et al., 1996; Tréhu et al., 2003]. With this 1063
assumption, the normalized porosity profile can be computed as an analytical 1064
expression [Bhatnagar et al., 2007]: 1065
(1 )e tN z , (C30) 1066
where tN = the depth to the base of the GHSZ relative to the compaction depth ( L ). 1067
These parameters are defined as: 1068
tt
LN
L, and
(1 )( )sed w
Lg
, (C31) 1069

50
where = characteristic constant with units of stress, and g = acceleration due to 1070
gravity. In all our simulations, 1tN , implying compaction depth ( L ) is equal to the 1071
thickness of the GHSZ ( tL ). Unit compaction depth further implies porosity at this depth 1072
is reduced by 1/e (or 36.8%) from its initial porosity at the seafloor. 1073
The labile organic carbon content ( ) is assumed to be 0% throughout all 1074
sediment at initial time 0t . No CH4 is present at this time in the sediment column, so 1075
the CH4 concentration ( l
mc ) is zero. Therefore, the normalized labile organic content 1076
( ), and the CH4 concentration ( l
mc ) are zero (Equation C32). 1077
( ,0) 0z , ( ,0) 0l
mc z . (C32) 1078
The pore water SO42- ( l
sc ), DIC ( l
bc ), Ca2+ ( l
Cac ) concentrations, and the carbon 1079
isotope compositions ( 13C ) are assumed to be seawater values at initial time for any 1080
depth z . The normalized pore water concentrations of SO42 ( l
sc ), DIC ( l
bc ), and Ca2+ 1081
( l
Cac ) are unity at 0t (Equation C33). At the same time, carbon isotope compositions 1082
in CH4 and DIC are zero because the carbon isotope compositions are normalized 1083
relative to a marine carbonate standard. 1084
( ,0) ( ,0) ( ,0) 1l l l
s b Cac z c z c z , 4 3
13 13( ,0) ( ,0) 0CH HCOC z C z . (C33) 1085
In essence, at 0t , there is a sediment column with prescribed physical 1086
conditions (i.e., temperature, pressure, and porosity). This column has no POC, and 1087
pore space is filled with seawater. For all 0t , POC is continuously deposited on the 1088
seafloor. A fraction of this is labile and, upon burial, drives a sequence of chemical 1089
reactions. These lead to changes in pore water CH4, SO42-, DIC, and Ca2+ 1090
51
concentrations, as well as the 13C of DIC. The amounts of CH4, DIC and Ca2+ are 1091
restricted because of solubility. 1092
1093
C.5 Boundary conditions 1094
As time progresses, pore water concentrations throughout the sediment column 1095
change from their initial values. We specify boundary values to all variables at the 1096
seafloor, and at the bottom of our simulation domain. Normalized labile POC content is 1097
unity at the seafloor. By contrast, due to very low CH4 concentrations in seawater, 1098
normalized CH4 concentration is zero at the seafloor. These boundary values are 1099
(Equation C34): 1100
(0, ) 1t ,
(0, ) 0l
mc t .
(C34) 1101
As discussed earlier, CH4 concentration is also zero below the seafloor until the SMT. 1102
Importantly, however, we do not prescribe this as a boundary value. Instead, this 1103
condition arises in our model because minimal methanogenesis occurs in the presence 1104
of SO42-, and because CH4 reacts with SO4
2- via AOM. 1105
At the seafloor, normalized pore water SO42, DIC and Ca2+ concentrations are 1106
unity, while normalized carbon isotope compostions in CH4 and DIC are zero. These are 1107
(Equation C35): 1108
(0, ) (0, ) (0, ) 1l l l
s b cac t c t c t ,
4 3
13 13(0, ) (0, ) 0CH HCOC t C t .
(C35) 1109
Upward fluid flux is modeled so as to transport dissolved CH4, DIC, Ca2+, and 1110
other pore water species from deeper sediments. Consequently, pore water 1111
concentrations need to be specified at the base of the simulation domain ( 2z tL L ). 1112

52
Pore water CH4 concentration at this depth (,
l
m extc ) equals the equilibrium CH4 1113
concentration ,m eqbc
at this depth (Equation C36): 1114
, ,( , ) ( )l l l
m z m ext m eqb zc L t c c L ,
(C36) 1115
where ,
l
m extc
= normalized specified CH4 concentration at depth zL ( z tL L ). The 1116
system, therefore, is charged with CH4 saturated water at the lowermost boundary. 1117
Similarly, normalized concentrations are specified at zL for SO42- (
,
l
s extc ), DIC 1118
(,
l
b extc ) and Ca2+ ( ,
l
ca extc ). Pore water SO42- is consumed above or at the SMT; hence, 1119
,
l
s extc is zero. Dissolved DIC and Ca2+ concentrations are set so they are in equilibrium 1120
with solubility concentrations of CaCO3 at depth. Collectively: 1121
,( , ) 0l l
s z s extc L t c ,
,( , )l l
b z b extc L t c ,
,( , )l l
ca z ca extc L t c .
(C37)
1122
During methanogenesis, a range of solid organic molecules with a range of carbon 1123
isotope compositions produces CH4 relatively depleted in 13C, and DIC relatively 1124
enriched in 13C. The pathways involved are somewhat complex, especially regarding 1125
isotope fractionation (Appendix B; [Conrad, 2005]). To simplify the modeling, we 1126
assume a fixed δ13C for POC and labile POC ( 13
POCC ), and a fixed δ13C for CH4 1127
generated during methanogenesis (4
13
, CH methC ). Both values will be site specific. The 1128
4
13
, CH methC values are determined by computing the average values of δ13C of CH4 1129
[Milkov et al., 2005; Lorenson et al., 2008] measured at the two sites. This implies that 1130
the fractionation factor ( m ) and the δ13C of DIC produced during methanogenesis 1131
(3
13
, HCO methC ) will also be fixed at a given site. For the two sites of immediate interest, 1132
the values are:
1133

53
13 24 oooPOCC
4
13
, 70 oooCH methC
(Site 1244), (C38) 1134
and 1135
13 22 oooPOCC
4
13
, 75 oooCH methC
(Site KC151-3). (C39) 1136
Fractionation factor ( m ) is defined as the ratio of δ13C of labile POC and CH4. 1137
4
13
13
1000
1000
POCm
CH
C
C
(C40) 1138
The 3
13
, HCO methC values and the fractionation factors at these sites are calculated 1139
using the carbon isotope compositions 13
POCC , and 4
13
, CH methC . 1140
3
13
, 22 oooHCO methC
1.049m (Site 1244), (C41) 1141
and 1142
3
13
, 31oooHCO methC
1.057m (Site KC151-3). (C42) 1143
The carbon isotope composition of DIC (3
13
HCOC ) produced by organoclastic 1144
sulfate reduction is equated to that of POC ( 13
POCC ). For sediment at respective sites: 1145
3
13 13
, 24 oooHCO POC POCC C
(Site 1244), (C43) 1146
and 1147
3
13 13
, 22 oooHCO POC POCC C
(Site KC151-3). (C44) 1148
The δ13C of CH4 (4
13
CHC ) and DIC (3
13
HCOC ) at the basal boundary ( zL ) are 1149
specified as observed in field data [Milkov et al., 2005; Torres and Rugh, 2006; 1150
Lorenson et al., 2008; Kastner et al., 2008a]. For Site 1244: 1151

54
4 4
13 13
, ( , ) 65 oooCH z CH extC L t C
,
3 3
13 13
, ( , ) 20 oooHCO z HCO extC L t C .
(C45) 1152
For Site KC151-3: 1153
4 4
13 13
, ( , ) 70 oooCH z CH extC L t C ,
3 3
13 13
, ( , ) 10 oooHCO z HCO extC L t C .
(C46) 1154
1155
Acknowledgments 1156
We acknowledge financial support from the Shell Center for Sustainability, and 1157
the Department of Energy (DE-FC26-06NT42960). We thank the captains, crews and 1158
fellow shipboard scientists of ODP Leg 204 and the GOM JIP for successful drilling and 1159
the collection and analyses of samples. This work was supported in part by the Shared 1160
University Grid at Rice funded by NSF under Grant EIA-0216467, and a partnership 1161
between Rice University, Sun Microsystems, and Sigma Solutions, Inc. We also thank 1162
Editor André Revil, Associate Editor, Walter S. Borowski and an anonymous reviewer 1163
for their constructive and critical commentaries on this manuscript. 1164
1165

55
References 1166
Allison, P. A., S. P. Hesslebo, and C. E. Brett (2008), Methane seeps on an Early 1167 Jurassic dysoxic seafloor. Palaeogeography, Palaeoclimatology, Palaeoecology, 1168 270: 230-238. 1169
1170 Archer D., B. A. Buffett, and V. Brovkin (2009), Ocean methane hydrates as a slow 1171
tipping point in the global carbon cycle, Proc. Natl. Acad. Sci. U.S.A., 106, 49, 1172 20596-20601. 1173
1174 Berner, R. A. (1980), Early Diagenesis: A Theoretical Approach, Princeton Univ. Press, 1175
Princeton, N.J. 1176 1177 Bhatnagar, G., W. G. Chapman, G. R. Dickens, B. Dugan, and G. J. Hirasaki (2007), 1178
Generalization of gas hydrate distribution and saturation in marine sediments by 1179 scaling of thermodynamic and transport processes, Am. J. Sci., 307, 861-900. 1180
1181 Bhatnagar, G., W. G. Chapman, G. R. Dickens, B. Dugan, and G. J. Hirasaki (2008), 1182
Sulfate-methane transition as a proxy for average methane hydrate saturation in 1183 marine sediments, Geophys. Res. Lett., 35, L03611, 1184 doi:10.1029/2007GL032500. 1185
1186 Bhatnagar, G., S. Chatterjee, W. G. Chapman, B. Dugan, G. R. Dickens, and G. J. 1187
Hirasaki (2011), Analytical theory relating the depth of the sulfate-methane 1188 transition to gas hydrate distribution and saturation, Geochem. Geophys. 1189 Geosyst., 12, Q03003, doi:10.1029/2010GC003397. 1190
1191 Bohrmann, G., J. Greinert, E. Suess, and M.E. Torres (1998), Authigenic carbonates 1192
from the Cascadia subduction zone and their relation to gas hydrate stability, 1193 Geology, 26, 647-650. 1194
1195 Borowski, W. S., C. K. Paull, and W. Ussler III (1996), Marine pore-water sulfate profiles 1196
indicate in situ methane flux from underlying gas hydrate, Geology, 24(7), 219 1197 655-658. 1198
1199 Borowski, W. S. and C. K. Paull (1997), The gas hydrate detection problem: 1200
Recognition of shallow-subbottom gas hazards in deep-water areas, 1201 Proceedings, Offshore Tech. Conf., vol. 1 OTC-8297, 211-216. 1202
1203 Borowski, W. S., C. K. Paull, and W. Ussler III (1999), Global and local variations of 1204
interstitial sulfate gradients in deep-water, continental margin sediments: 1205 Sensitivity to underlying methane and gas hydrates, Mar. Geol., 159, 131–154. 1206
1207 Borowski, W. S., N. Cagatay, Y. Ternois, and C. K. Paull (2000), Data report: carbon 1208
isotopic composition of dissolved CO2, CO2 gas, and methane, Blake-Bahama 1209 Ridge and northeast Bermuda Rise, ODP Leg 172, In Keigwin, L.D., Rio, D., 1210 Acton, G.D., and Arnold, E. (Eds.), Proc. ODP, Sci. Results, 172, College 1211

56
Station, TX (Ocean Drilling Program), 1–16 1212 doi:10.2973/odp.proc.sr.172.201.2000. 1213
1214 Botz, R., E. Faber, M. J. Whiticar, and J. M. Brooks (1988), Authigenic carbonates in 1215
sediments from the Gulf of Mexico, Earth Planet. Sci. Lett, 88, 263-272. 1216 1217 Boudreau, B. P., and J. T. Westrich (1984), The dependence of bacterial sulfate 1218
reduction on sulfate concentration in marine sediments, Geochim. Cosmochim. 1219 Acta, 48, 2503-2516. 1220
1221 Briaud, J.L., and A. Chaouch (1997), Hydrate melting in soil around hot conductor, J. 1222
Geotech. Geoenviron., 123, 645-653. 1223 1224 Buffett, B. A. and D. Archer (2004), Global inventory of methane clathrate: Sensitivity to 1225
changes in the deep ocean, Earth Planet. Sci. Lett., 227, 185–199. 1226 1227 Campbell, K. A. (2006), Hydrocarbon seep and hydrothermal vent paleoenvironments 1228
and paleontology: Past developments and future research directions, 1229 Palaeogeography, Palaeoclimatology, Palaeoecology, 232, 362-407. 1230
1231 Castellini, D. G., G. R. Dickens, G. T. Snyder, and C. D. Ruppel (2006), Barium 1232
recycling in shallow sediment above active mud volcanoes in the Gulf of Mexico, 1233 Chem. Geol., 226, 1-30. 1234
1235 Claypool, G.E., A. V. Milkov, Y. J. Lee, M. E. Torres, W. S. Borowski, and H. Tomaru 1236
(2006), Microbial methane generation and gas transport in shallow sediments of 1237 an accretionary complex, southern Hydrate Ridge (ODP Leg 204), offshore 1238 Oregon, USA, In Tréhu, A.M., Bohrmann, G., Torres, M.E., and Colwell, F.S. 1239 (Eds.), Proc. ODP, Sci. Results, 204: College Station, TX (Ocean Drilling 1240 Program), 1–52, doi:10.2973/odp.proc.sr.204.113.2006. 1241
1242 Collett, T. S. (2002), Energy resource potential of natural gas hydrates. AAPG Bull., 86, 1243
1971–1992. 1244
1245
Conrad, R. (2005), Quantification of methanogenic pathways using stable carbon 1246 isotopic signatures: a review and a proposal, Org. Geochem., 36, 739–752. 1247
1248 Cook, A. E., D. Goldberg, and R. L. Kleinberg (2008), Fracture-controlled gas hydrate 1249
systems in the northern Gulf of Mexico, Mar. Petr. Geol., 25, 932-941. 1250 1251 Daigle, H., and B. Dugan (2010), Origin and evolution of fracture-hosted methane 1252
hydrate deposits, J. Geophys. Res., 115, B11103, doi:10.1029/2010JB007492. 1253 1254 Davie, M. K. and B. A. Buffett (2001), A numerical model for the formation of gas 1255
hydrate below the seafloor, J. Geophys. Res., 106, 497-514. 1256 1257

57
Davie, M. K., and B. A. Buffett (2003a), Sources of methane for marine gas hydrate: 1258 inferences from a comparison of observations and numerical models, Earth 1259 Planet. Sci. Lett., 206, 51-63. 1260
1261 Davie, M. K., and B. A. Buffett (2003b), A steady state model for marine hydrate 1262
formation: Constraints on methane supply from pore water sulfate profiles, J. 1263 Geophys. Res., 108, 2495, doi:10.1029/2002JB002300. 1264
1265 D’Hondt, S., B. B. Jorgensen, et al. (2004), Distributions of microbial activities in deep 1266
subseafloor sediments, Science, 306(5705), 2216-2221. 1267 1268 Dickens, G. R., C. K. Paull, P. Wallace, and the ODP Leg 164 Shipboard Scientific 1269
Party (1997), Direct measurement of in situ methane quantities in a large gas 1270 hydrate reservoir, Nature, 385, 426–428. 1271
1272 Dickens, G. R. (2001a), The potential volume of oceanic methane hydrates with variable 1273
external conditions, Org. Geochem., 32, 1179-1193. 1274 1275 Dickens, G. R. (2001b), Sulfate profiles and barium fronts in sediment on the Blake 1276
Ridge: Present and past methane fluxes through a large gas hydrate reservoir. 1277 Geochim. Cosmochim. Acta, 65, 529-543. 1278
1279 Dickens, G. R. (2003), Rethinking the global carbon cycle with a large, dynamic and 1280
microbially mediated gas hydrate capacitor, Earth Planet. Sci. Lett., 213, 169-1281 183. 1282
1283 Dickens, G. R., and G. T. Snyder (2009), Interpreting upward methane flux, Fire in the 1284
Ice, Winter, 7-10. 1285 1286 Dugan B. (2008), Fluid flow in the Keathley Canyon 151 mini-basin, Northern Gulf of 1287
Mexico, Mar. Petr. Geol. 25, 919–923. 1288 1289 Egeberg, P. K., and G. R. Dickens (1999), Thermodynamic and pore water halogen 1290
constraints on gas hydrate distribution at ODP Site 997 (Blake Ridge). Chem. 1291 Geol., 153, 53-79. 1292
1293 Formolo, M. J., T. W. Lyons, C. Zhang, C. Kelley, R. Sassen, J. Horita, and D. R. Cole 1294
(2004), Quantifying carbon sources in the formation of authigenic carbonates at 1295 gas hydrate sites in the Gulf of Mexico, Chemical Geology, 205, 253-264. 1296 1297
Goni, M. A., K. C. Ruttenberg, and T. I. Eglington (1998), A reassessment of the 1298 sources and importance of land-derived organic matter in surface sediments from 1299 the Gulf of Mexico, Geochim. Cosmochim. Acta, 62, 3055–3075. 1300
1301 Greinert, J., G. Bohrmann, and E. Suess (2001), Methane-venting and gas hydrate-1302
related carbonates at the hydrate ridge: Their classification, distribution and 1303

58
origin, In C. K. Paull and W. P. Dillon (Eds.), Natural Gas Hydrates: occurrence, 1304 distribution, and detection, AGU Geophysical Monograph, 124, 99-113. 1305
1306 Hiruta, A., G. T. Snyder, H. Tomaru, and R. Matsumoto (2009), Geochemical 1307
constraints for the formation and dissociation of gas hydrate in an area of high 1308 methane flux, eastern margin of the Japan Sea, Earth Planet. Sci. Lett, 279, 3-4, 1309 326-339. 1310
1311 Iversen, N., and B. B. Jørgensen (1993), Diffusion coefficients of sulfate and methane in 1312
marine sediments: Influence of porosity, Geochim. Cosmochim. Acta, 57, 571-1313 578. 1314
1315 Kastner, M., M. E. Torres, E. Solomon, and A. J. Spivack (2008a), Marine pore fluid 1316
profiles of dissolved sulfate: do they reflect in situ methane fluxes? Fire in the Ice, 1317 Summer, 6-8. 1318
1319 Kastner, M., G. Claypool, and G. Robertson (2008b), Geochemical constraints on the 1320
origin of the pore fluids and gas hydrate distribution at Atwater Valley and 1321 Keathley Canyon, Northern Gulf of Mexico, Mar. Petr. Geol. 25, 860-872, 1322 doi:10.1016/ j.marpetgeo.2008.01.022. 1323
1324 Kharaka, Y. K., A. S. Maest, W. W. Carothers, L. M. Law, and P. J. Lamothe (1987), 1325
Geochemistry of metal-rich brines from central Mississippi Salt Dome basin, 1326 USA, Appl. Geochem., 2, 543– 561. 1327
1328 Kim, J. H., M. H. Park, U. Tsunogai, T. J. Cheong, B. J. Ryu, Y. J. Lee, H. C. Han, J. H. 1329
Oh, and H. W. Chang (2007), Geochemical characterization of the organic 1330 matter, pore water constituents and shallow methane gas in the eastern part of 1331 the Ulleung Basin, East Sea (Japan Sea), Island Arc, 16, 93–104. 1332
1333 Kim, J. H., M. H. Park, J. H. Chun, and Y. J. Lee (2011), Molecular and isotopic 1334
signatures in sediments and gas hydrate of the central/southwestern Ulleung 1335 Basin: high alkalinity escape fuelled by biogenically sourced methane, Geo-Mar. 1336 Lett., 31, 37–49, doi: 10.1007/s00367-010-0214-y. 1337
1338 Klauda, J. B., and S. I. Sandler (2005), Global distribution of methane hydrate in ocean 1339
sediment: Energy and Fuels, 19, 459–470. 1340 1341 Kvenvolden, K. A. (1993), Gas hydrates: Geological perspective and global change, 1342
Rev. Geophys., 31,173-187. 1343 1344 Kvenvolden, K. A. (1995), A review of the geochemistry of methane in natural gas 1345
hydrate, Organic Geochem., 23, 997-1008. 1346 1347

59
Kwon T. H., K. I. Song, and G. C. Cho (2010), Destabilization of Marine Gas Hydrate-1348 Bearing Sediments Induced by a Hot Wellbore: A Numerical Approach, Energy & 1349 Fuels, 24, 5493-5507. 1350
1351 Lee, M. W., and T. S. Collett (2006), Gas hydrate and free gas saturations estimated 1352
from velocity logs on Hydrate Ridge, offshore Oregon, U.S.A. In Tréhu, A. M., 1353 Bohrmann, G., Torres, M.E., and Colwell, F.S. (Eds.), Proc. ODP, Sci. Results, 1354 204: College Station, TX (Ocean Drilling Program), 1–25., 1355 doi:10.2973/odp.proc.sr.204.103.2006. 1356
1357 Lee, M. W., T. S. Collett (2008), Integrated analysis of well logs and seismic data to 1358
estimate gas hydrate concentrations at Keathley Canyon, northern Gulf of 1359 Mexico, Mar. Petr. Geol., 25, 924–931. 1360
1361 Li, Y., and S. Gregory (1974), Diffusion of ions in sea water and in deep-sea sediments: 1362
Geochim. Cosmochim. Acta, 38, 703-714. 1363 1364 Liu, X. L. and P. B. Flemings (2007), Dynamic multiphase flow model of hydrate 1365
formation in marine sediments, J. Geophys. Res., 112, B03101, doi: 1366 10.1029/2005JB004227. 1367
1368 Lorenson, T. D., G. E. Claypool, and J. A. Dougherty (2008), Natural gas geochemistry 1369
of sediments drilled on the Gulf of Mexico JIP cruise. Mar. Petr. Geol., 25, 873-1370 883. 1371
1372 Lowenstein T. K., M. N. Timofeeff, S. T. Brennan, L. A. Hardie, and R. M. Demicco 1373
(2001), Oscillations in Phanerozoic seawater chemistry: evidence from fluid 1374 inclusions: Science, 294, 1086–1088. 1375
1376 Luff, R., and K. Wallman (2003), Fluid flow, methane fluxes, carbonate precipitation and 1377
biogeochemical turnover in gas hydrate-bearing sediments at Hydrate Ridge, 1378 Cascadia Margin: Numerical modeling and mass balances, Geochim. 1379 Cosmochim. Acta, 67, 3403-3421. 1380
1381 Macpherson, G. L. (1989), Lithium, boron and barium in formation waters and 1382
sediments, northwestern Gulf of Mexico Sedimentary Basin, Ph.D. dissertation, 1383 University of Texas, Austin, Texas, USA. 1384
1385 Malinverno, A., M. Kastner, M. E. Torres, and U. G. Wortmann (2008), Gas hydrate 1386
occurrence from pore water chlorinity and downhole logs in a transect across the 1387 Northern Cascadia margin (Integrated Ocean Drilling Program Expedition 311), 1388 J. Geophys. Res., 113, B08103, doi:10.1029/2008JB005702. 1389
1390 Milkov, A. V., G. E. Claypool, Y.J. Lee, W. Xu, G. R. Dickens, W. S. Borowski, and ODP 1391
Leg 204 Scientific Party (2003), In situ methane concentrations at Hydrate Ridge, 1392

60
offshore Oregon: new constraints on the global gas hydrate inventory from an 1393 active margin, Geology, 31, 833–836. 1394
1395 Milkov, A. V. (2004), Global estimates of hydrate-bound gas in marine sediments: how 1396
much is really out there? Earth-Sci. Rev., 66, 183-197. 1397 1398 Milkov, A. V., G. R. Dickens, G. E. Claypool, Y. J. Lee, W. S. Borowski, M. E. Torres, 1399
W. Xu, H. Tomaru, A. M. Tréhu, and P. Schultheiss (2004), Co-existence of gas 1400 hydrate, free gas, and brine within the regional gas hydrate stability zone at 1401 Hydrate Ridge (Oregon margin): evidence from prolonged degassing of a 1402 pressurized core, Earth Planet. Sci. Lett., 222, 829-843. 1403
1404 Milkov, A. V. (2005), Molecular and stable isotope compositions of natural gas hydrates: 1405
A revised global dataset and basic interpretations in the context of geological 1406 settings, Organic Geochem., 36(5), 681-702. 1407
1408 Milkov, A. V., G. E. Claypool, Y.J. Lee, and R. Sassen (2005), Gas hydrate systems at 1409
Hydrate Ridge offshore Oregon inferred from molecular and isotopic properties of 1410 gas hydrate-bound and void gases, Geochim. Cosmochim. Acta, 69(4), 1007-1411 1026, doi:10.1016/j.gca.2004.08.021. 1412
1413 Paull, C. K., R. Matsumoto, P. J. Wallace, and W. P. Dillon (1996), Proc. ODP Init. 1414
Repts., 164, College Station, TX, (Ocean Drilling Program), 1415 doi:10.2973/odp.proc.ir.164.1996. 1416
1417 Paull, C. K., and R. Matsumoto (2000), Leg 164 overview, In Paull, C. K., R. 1418
Matsumoto, P. J. Wallace, and W. P. Dillon, (Eds.), Proc. ODP, Sci. Results, 164, 1419 College Station, TX (Ocean Drilling Program), 3–10, 1420 doi:10.2973/odp.proc.sr.163.204.2000. 1421
1422 Paull, C. K., T. D. Lorenson, G. Dickens, W. S. Borowski, W. Ussler III, and K. 1423
Kvenvolden (2000a), Comparisons of in situ and core gas measurements in ODP 1424 Leg 164 bore holes, Annals of the New York Academy of Sciences, 912, 23-31. 1425
1426 Paull, C. K., T. D. Lorenson, W. S. Borowski, W. Ussler, III, K. Olsen, and N. M. 1427
Rodriguez (2000b), Isotopic composition of CH4, CO2 species, and sedimentary 1428 organic matter within samples from the Blake Ridge: gas source implications. In 1429 Paull, C. K., R. Matsumoto, P. J. Wallace, W. P. Dillon, (Eds.), Proc. ODP, Sci. 1430 Results, 164, College Station, TX (Ocean Drilling Program), 67-78, 1431 doi:10.2973/odp.proc.sr.164.207.2000. 1432
1433 Paull, C. K., W. Ussler III, T. Lorenson, W. Winters, and J. Dougherty (2005), 1434
Geochemical constraints on the distribution of gas hydrates in the Gulf of Mexico, 1435 Geo-Mar. Lett., 25, 273-280. 1436
1437

61
Peckmann, J., and V. Thiel (2004), Carbon cycling at ancient methane-seeps, Chem. 1438 Geol., 205, 443-467. 1439
1440 Pohlman, J., C. Ruppel, D. R. Hutchinson, R. Downer, and R. B. Coffin (2008), 1441
Assessing sulfate reduction and methane cycling in a high salinity pore water 1442 system in the northern Gulf of Mexico, Mar. Petr. Geol., 25, 942–951. 1443
1444 Pohlman, J., M. Kaneko, V. B. Heuer, R. B. Coffin, and M. Whiticar (2009), Methane 1445
sources and production in the northern Cascadia margin gas hydrate system, 1446 Earth Planet. Sci. Lett., 287, 504-512. 1447
1448 Reeburgh, W. S., (1976) Methane consumption in Cariaco trench waters and 1449
sediments, Earth Planet. Sci. Lett., 28, 337-344. 1450 1451 Rempel, A. W. and B. A. Buffett (1997), Formation and accumulation of gas hydrate in 1452
porous media, J. Geophys. Res., 102, 10151-10164. 1453 1454 Rodriguez, N. M., C. K. Paull, and W. S. Borowski (2000), Zonation of authigenic 1455
carbonates within gas hydrate-bearing sedimentary sections on the Blake Ridge: 1456 offshore southeastern North America, In C. K. Paull, R. Matsumoto, P. J. 1457 Wallace, and W. P. Dillon, (Eds.), Proc. ODP, Sci. Results, 164: College Station, 1458 TX (Ocean Drilling Program), 301–312, doi:10.2973/odp.proc.sr.164.227.2000. 1459
1460 Ruppel, C., R. Boswell and E. Jones (2008), Scientific results from Gulf of Mexico Gas 1461
Hydrates Joint Industry Project Leg 1 Drilling: Introduction and overview, Mar. 1462 Petr. Geol., 25, doi: 10.1016/j.marpetgeo.2008.02.007. 1463
1464 Shipboard Scientific Party (1996), Sites 997, In C. K. Paull, R. Matsumoto, P. J. 1465
Wallace, et al., Proc. ODP, Init. Repts., 164, College Station, TX (Ocean Drilling 1466 Program), 277–334, doi:10.2973/odp.proc.ir.164.110.1996. 1467
1468 Shipboard Scientific Party (2003a), Site 1230, In D'Hondt, S.L., Jørgensen, B.B., Miller, 1469
D.J., et al., Proc. ODP, Init. Repts., 201: College Station, TX (Ocean Drilling 1470 Program), 1-107, doi:10.2973/odp.proc.ir.201.111.2003. 1471
1472 Shipboard Scientific Party (2003b), Site 1244, In Tréhu, A.M, Bohrmann, G., Rack, F.R., 1473
Torres, M.E., et al., Proc. ODP, Init. Repts., 204: College Station, TX (Ocean 1474 Drilling Program), 1-132, doi:10.2973/odp.proc.ir.204.103.2003. 1475
1476 Sloan, E. D. J., and C. Koh (2007), Clathrate hydrates of natural gases, 3rd ed. CRC 1477
Press 1478 1479 Snyder, G. T., A. Hiruta, R. Matsumoto, G. R. Dickens, H. Tomaru, R. Takeuchi, J. 1480
Komatsubara, Y. Ishida, and H. Yu (2007), Pore water profiles and authigenic 1481 mineralization in shallow marine sediments above the methane-charged system 1482

62
on Umitaka Spur, Japan Sea, Deep-Sea Res. II, 54, 1216-1239, 1483 10.1016/j.dsr2.2007.04.001. 1484
1485 Torres, M. E. and W. D. Rugh (2006), Data report: isotopic characterization of dissolved 1486
inorganic carbon in pore waters, In Tréhu, A. M., G. Bohrmann, M. E. Torres, and 1487 F. S. Colwell, (Eds.), Leg 204, Proc. ODP, Sci. Results, 204, College Station, TX, 1488 (Ocean Drilling Program) doi:10.2973/odp.proc.sr.204.117.2006. 1489
1490 Torres, M. E. and M. Kastner (2009), Data report: clues about carbon cycling in 1491
methane-bearing sediments using stable isotopes of the dissolved inorganic 1492 carbon, IODP Expedition 311, In Riedel, M., Collett, T.S., Malone, M.J., and the 1493 Expedition 311 Scientists Proc. IODP, 311, Washington, DC, Integrated Ocean 1494 Drilling Program, doi:10.2204/iodp.proc.311.206.2009. 1495
1496 Tréhu, A. M., G. Bohrmann, F. R. Rack, M. E. Torres et al. (2003), Proc. ODP Init. 1497
Repts., 204, College Station, TX (Ocean Drilling Program), 1498 doi:10.2973/odp.proc.ir.204.2003. 1499
1500 Tréhu, A. M., P. E. Long, M. E., Torres, G. Bohrmann, F. R. Rack, T. S. Collett, et al. 1501
(2004), Three-dimensional distribution of gas hydrate beneath southern Hydrate 1502 Ridge: Constraints from ODP Leg 204, Earth Planet. Sci. Lett., 222, 845-862. 1503
1504 Valentine, D. L., and W. S. Reeburgh (2000), New perspectives on anaerobic methane 1505
oxidation, Environmental Microbiology, 2, 477-484. 1506 1507 Walsh, M. R., S. H. Hancock, S. J. Wilson, S. L. Patil, G. J. Moridis, R. Boswell, T. S. 1508
Collett, C. A. Koh, and E. D. Sloan (2009), Preliminary report on the commercial 1509 viability of gas production from natural gas hydrates, Energy Economics, 31, 815-1510 823. 1511
1512 Winters, W. J., B. Dugan, and T. S. Collett (2008), Physical properties of sediments 1513
from Keathley Canyon and Atwater Valley, JIP Gulf of Mexico Gas Hydrate 1514 Drilling Program, Mar. Petr. Geol., 25, 896-905. 1515
1516 Xu, W. and C. Ruppel (1999), Predicting the occurrence, distribution, and evolution of 1517
methane gas hydrate in porous marine sediments. J. Geophys. Res., 104, 5081-1518 5096. 1519
1520 Yu, X., J. Li, J. Gong, J. Chen, X. Jin, L. Young-Lee, H. Li, and J. Xu (2006), Stable 1521
carbon and nitrogen isotopic composition of gas hydrate-bearing sediment from 1522 Hydrate Ridge, Cascadia Margin, Science in China: Series D Earth Sciences, 49, 1523 872-880. 1524
1525 Zatsepina, O. Y. and B. A. Buffett (1998), Thermodynamic conditions for the stability of 1526
gas hydrate in the seafloor, J. Geophys. Res., 103, 24127–24139. 1527 1528

63
Table 1. Model parameters 1529 1530
Symbol Definition (units) Hydrate
Ridge 1244
Keathley Canyon 151-3
sfL Seafloor depth (m) a890 b1322
0P Seafloor pressure (MPa) 8.72 12.95
0T Seafloor temperature (ºC) a3.8 b4
dT dz Geothermal gradient (ºC/m) a0.061 b0.038
tL Depth to GHSZ (mbsf) 133.4 314.1
sL Depth to SMT (mbsf) 9.2 10.4
S Sedimentation rate (cm/kyr) 27 25
,f sedU Fluid flux due to sedimentation (m/s) 2.85 x 10⁻¹³ 2.64 x 10⁻¹³
1Pe First Peclet number - compaction-driven fluid flow 0.044 0.095
2Pe Second Peclet number - external fluid flow -1, -2, -3 -2, -3, -5
TOC Total organic carbon (%) 1.27 0.5
Normalized organic content at seafloor 3 0.47
,m eqbc CH4 solubility at base of the GHSZ 1.701 x 10⁻³ 2.101 x 10⁻³
,s oc
Seawater SO42- concentration (mM) 28
,b oc
Seawater DIC concentration (mM) 2.4
,Ca oc
Seawater Ca2+ concentration (mM) 10
mD CH4 diffusivity (m2/s) c0.87 x 10-9
sD SO42- diffusivity (m2/s) c0.56 x 10-9
bD DIC diffusivity (m2/s) d0.60 x 10-9
caD Ca2+ diffusivity (m2/s) d0.40 x 10-9

64
Da Damköhler number (methanogenesis) 0.22
POCDa Damköhler number (organoclastic sulfate
reduction) 1
AOMDa Damköhler number (AOM) 108
Rate constant for methanogenesis (s-1)
1.07 x 10⁻¹³ 1.94 x 10⁻¹⁴
POC
Rate constant for organoclastic sulfate reduction
(m3/mol.s) 5.55 x 10⁻¹⁶ 8.10 x 10⁻¹⁷
AOM Rate constant for AOM (m3/mol.s)
4.60 x 10⁻⁸ 6.71 x 10⁻⁹
tN
Ratio of L to tL 1
sed Sediment density (kg/m3) 2650
w Water density (kg/m3) 1000
1531
aTréhu et al., [2003] 1532
bRuppel et al., [2008] 1533
cIversen and Jørgensen, [1993] 1534
dLi and Gregory, [1974] 1535
1536
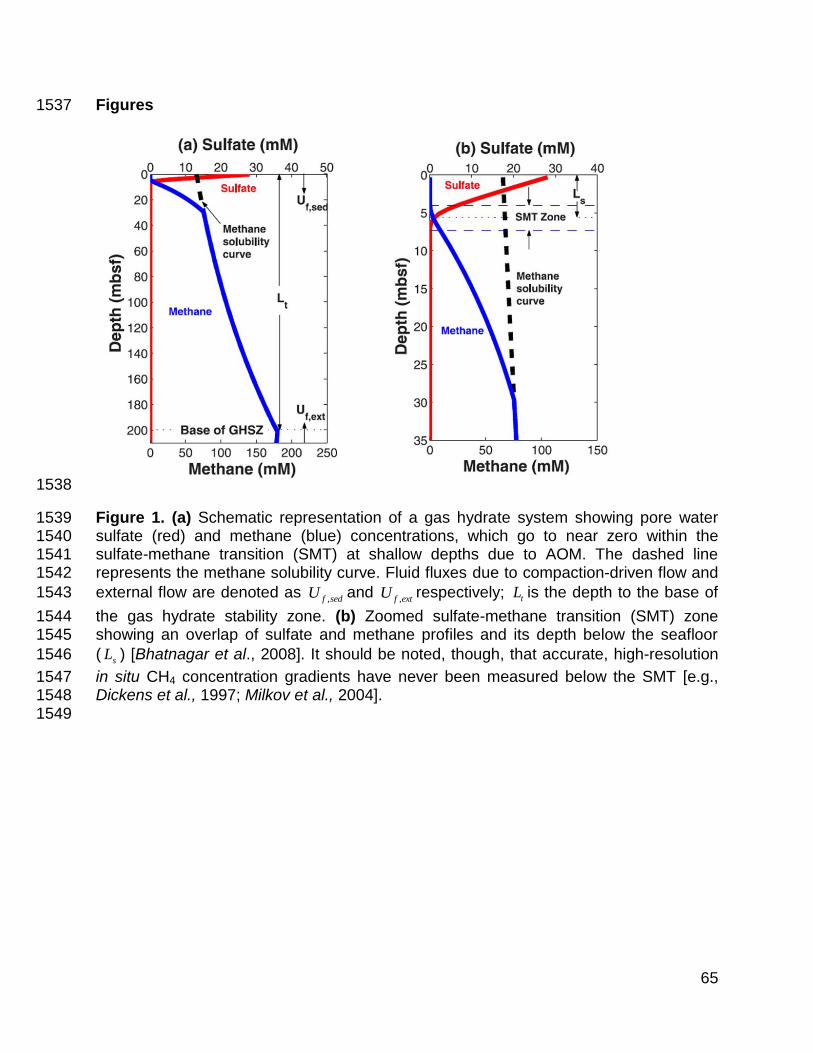
65
Figures 1537
1538
Figure 1. (a) Schematic representation of a gas hydrate system showing pore water 1539 sulfate (red) and methane (blue) concentrations, which go to near zero within the 1540 sulfate-methane transition (SMT) at shallow depths due to AOM. The dashed line 1541 represents the methane solubility curve. Fluid fluxes due to compaction-driven flow and 1542
external flow are denoted as ,f sedU and
,f extU respectively; tL is the depth to the base of 1543
the gas hydrate stability zone. (b) Zoomed sulfate-methane transition (SMT) zone 1544 showing an overlap of sulfate and methane profiles and its depth below the seafloor 1545
( sL ) [Bhatnagar et al., 2008]. It should be noted, though, that accurate, high-resolution 1546
in situ CH4 concentration gradients have never been measured below the SMT [e.g., 1547 Dickens et al., 1997; Milkov et al., 2004]. 1548
1549

66
1550
Figure 2. Alkalinity versus δ13C of DIC at the SMT for multiple locations known to have 1551 gas hydrate at depth. Note the general trend from sites with low alkalinity and low δ13C 1552 of DIC to those with high alkalinity and relatively high δ13C of DIC. Traditionally, 1553 alkalinity and δ13C of DIC at the SMT were being used to discriminate between AOM 1554 and POC-driven sulfate reduction to explain this trend. We suggest the dominant cause 1555 for this trend arises from the relative flux of upward 13C-enriched DIC (FDICDp). Data 1556 from: ODP 994-997, Paull et al. [2000b]; ODP Site 1059, Borowski et al. [2000]; ODP 1557 Sites 1244-1252, Claypool et al. [2006], Torres and Rugh [2006]; 1326, 1329, Torres 1558 and Kastner [2009]; KC03-5-19, Pohlman et al. [2008]; KC151-3-3, AT13-2, Kastner et 1559 al. [2008b]; O7GHP-1, Kim et al. [2011]. The hachured line for Hole 1252A represents a 1560 range of values spanning the SMT. Octagons represent the two sites (1244C and 1561 KC151-3) modeled within this paper. 1562
1563
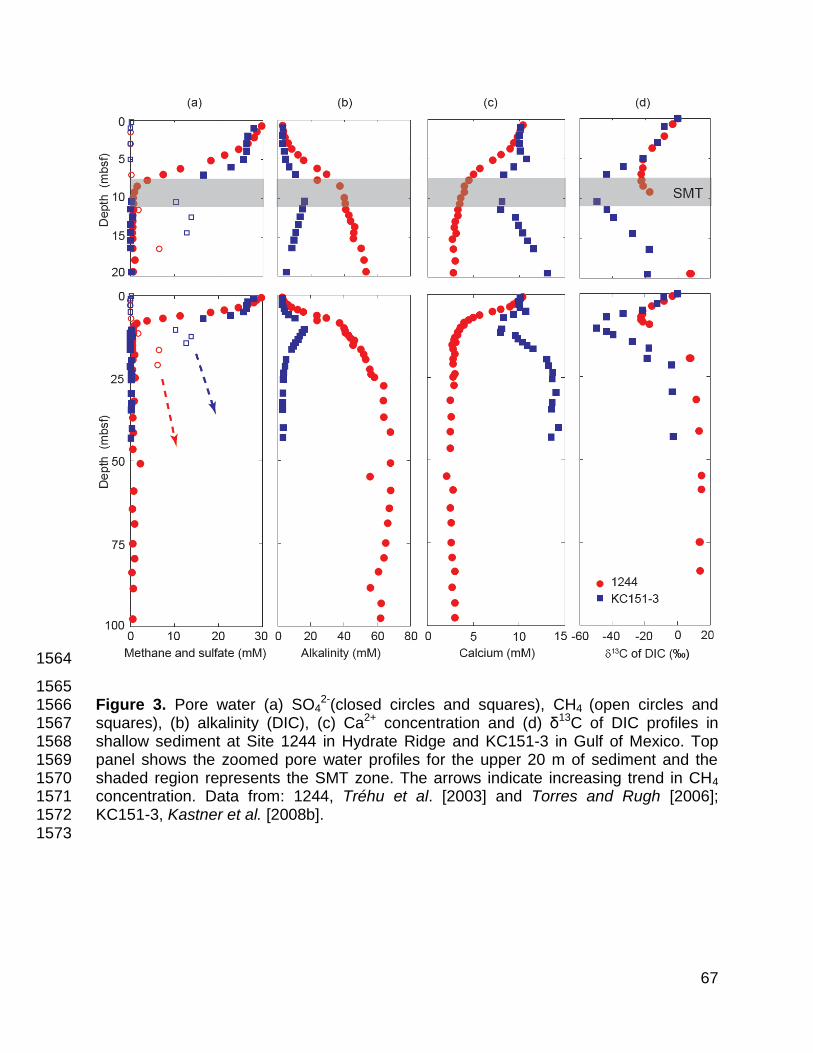
67
1564
1565 Figure 3. Pore water (a) SO4
2-(closed circles and squares), CH4 (open circles and 1566 squares), (b) alkalinity (DIC), (c) Ca2+ concentration and (d) δ13C of DIC profiles in 1567 shallow sediment at Site 1244 in Hydrate Ridge and KC151-3 in Gulf of Mexico. Top 1568 panel shows the zoomed pore water profiles for the upper 20 m of sediment and the 1569 shaded region represents the SMT zone. The arrows indicate increasing trend in CH4 1570 concentration. Data from: 1244, Tréhu et al. [2003] and Torres and Rugh [2006]; 1571 KC151-3, Kastner et al. [2008b]. 1572
1573

68
1574
1575 Figure 4. Steady state normalized pore water concentration profiles at Site 1244. 1576 (a) CH4 (solid), and SO4
2- (dashed), (b) DIC, (c) Ca2+, and (d) δ13C of DIC. The blue, 1577 green and red curves correspond to increasing magnitude of Pe2 (fluid flux from depth) 1578 shown by direction of arrow. Site 1244 data (black circles) [Tréhu et al., 2003; Torres 1579
and Rugh, 2006]. Parameters: 1 0.044Pe , 0.22Da , 1POCDa , 810AOMDa , 3, 1580
, 27b extc and 3
13
, 20HCO extC ‰. 1581
1582
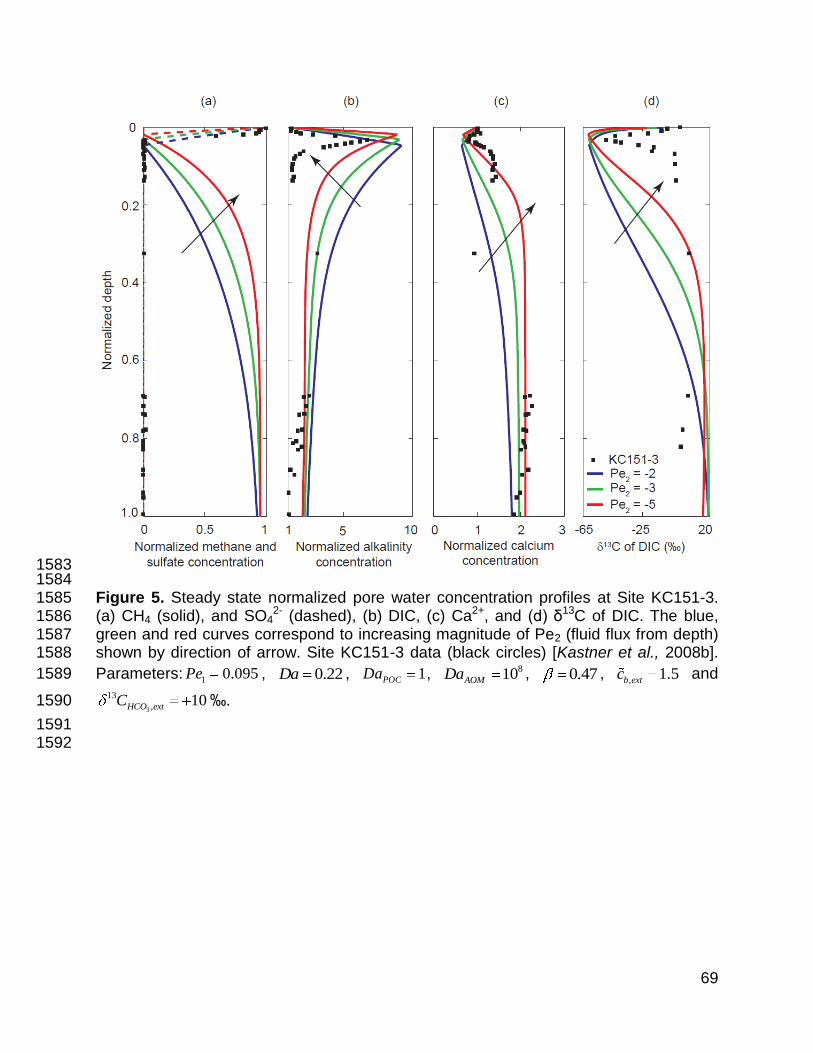
69
1583 1584 Figure 5. Steady state normalized pore water concentration profiles at Site KC151-3. 1585 (a) CH4 (solid), and SO4
2- (dashed), (b) DIC, (c) Ca2+, and (d) δ13C of DIC. The blue, 1586 green and red curves correspond to increasing magnitude of Pe2 (fluid flux from depth) 1587 shown by direction of arrow. Site KC151-3 data (black circles) [Kastner et al., 2008b]. 1588
Parameters: 1 0.095Pe , 0.22Da , 1POCDa , 810AOMDa , 0.47 , , 1.5b extc and 1589
3
13
, 10HCO extC ‰. 1590
1591 1592

70
1593

71
Figure 6. (a) Steady state pore water profiles to study the effect of AOMDa at Site 1244. 1594
Decrease in AOMDa results in a thicker SMT horizon. Parameters: 1 0.044Pe , 2 1Pe , 1595
0.22Da , 1POCDa , 3, , 27b extc and
3
13
, 20HCO extC ‰. (b) Effect of POCDa on 1596
pore water chemistry at Site 1244. Parameters: 1 0.044Pe , 2 1Pe , 0.22Da , 1597 810AOMDa , 3,
, 27b extc and 3
13
, 20HCO extC ‰. In both cases, decreasing 1598
AOMDa and increasing POCDa result in higher POC depletion, lesser CH4 and DIC 1599
production, greater Ca2+ concentration in pore fluids above and below the SMT and a 1600 more negative δ13C of DIC at the SMT. 1601 1602 1603
1604 1605
Figure 7. Concentration cross-plot of “excess alkalinity” ( Alk*) corrected for carbonate 1606
precipitation versus SO42- (mM) relative to the seafloor for shallow sediment at Site 1607
1244 on Hydrate Ridge [Tréhu et al., 2003] and Site KC151-3 [Kastner et al., [2008b]. 1608 As emphasized by Kastner et al. [2008], there is a 2:1 relationship for pore water 1609 concentrations above the SMT for Site 1244 (red circles) and 1:1 for Site KC151-3 (blue 1610 squares). Note, however, that excess alkalinity continues to rise below the SMT at Site 1611 1244. This clearly implies an upward flux of alkalinity from depth; whereas, at Site 1612 KC151-3, excess alkalinity decrease below the SMT. This decrease is because DIC is 1613 consumed by Ca2+ resulting in calcite precipitation. 1614
1615

72
1616 Figure 8. Concentration cross-plots for Alk* and SO4
2- relative to seawater. Three 1617 cases are illustrated here corresponding to a 2:1 slope. Blue dashed line represents a 1618 case with organoclastic sulfate reduction, no upward fluid flux, no AOM and no deep 1619
DIC source (methanogenesis). Parameters: 1 0.044Pe , 2 0Pe , 0Da , 1POCDa , 1620
0AOMDa , 3 and , 0b extc . Red solid line represents another case with low and finite 1621
upward fluid flux, AOM, methanogenesis, and a deep DIC source, but no organoclastic 1622
sulfate reduction. Parameters: 1 0.044Pe , 2 0.1Pe , 1Da , 0POCDa , 810AOMDa , 1623
3 and , 79b extc . The green dashed line represents a third case (combination of the 1624
first two cases). It is characterized by AOM, organoclastic sulfate reduction, 1625
methanogenesis, deep DIC source and low upward fluid flux. Parameters: 1 0.044Pe , 1626
2 0.1Pe , 1Da , 1POCDa , 810AOMDa , 3 and , 79b extc . A 2:1 slope is not only 1627
achieved by organoclastic sulfate reduction alone, but also by a combined effect of 1628 AOM, methanogenesis and a deep DIC source. The depth below the seafloor until the 1629
SMT is shown by the direction of the arrow; below the SMT, Alk* increases with no 1630
change in SO42- implying high DIC flux entering the SMT from below. 1631
1632

73
1633 1634
Figure 9(a). Concentration cross-plots for Alk* and SO42- relative to the seafloor with 1635
AOM, organoclastic sulfate reduction, methanogenesis, deep DIC source and upward 1636 fluid flux at Site 1244. The solid lines correspond to parameters same as in Figure 4. 1637 Dashed lines correspond to a case with higher rate of methanogenesis rate and greater 1638
DIC flux from depth ( 1Da and , 50b extc ). The blue, green, and red colors indicate 1639
increasing fluid flux (corresponding to 2Pe = -1, -2 and -3). Cross-plot constructed from 1640
Site 1244 data (black circles) [Tréhu et al., 2003] matches well with our simulated cross-1641 plots. The slope decreases with increase in fluid flux from depth. Higher DIC input (due 1642 to higher methanogenesis and/or high DIC source at depth) results in a greater slope. 1643
Notably, negligence of Mg2+ in Alk* calculations above, results in a slope less than 2:1 1644 as compared to Figure 7. 1645
1646

74
1647 1648
Figure 9(b). Concentration cross-plots for Alk* and SO42- relative to the seafloor with 1649
AOM, organoclastic sulfate reduction, methanogenesis, relatively depleted DIC source 1650 at depth and upward fluid flux at Site KC151-3. Parameters used are same as in Figure 1651
5. Increasing upward fluid flux (corresponding to 2Pe = -2, -3 and -5) are represented by 1652
blue, green and red curves. Data from Site KC151-3 data [Kastner et al., 2008b] is used 1653 to construct cross-plots shown by black circles. The slope of the cross-plot decreases 1654
as fluid flux increases (same as in Figure 9a). Contrary to Figure 9a, Alk* decreases 1655
with no change in SO42- beyond the SMT, implying DIC flux leaving the SMT both 1656
above and below. 1657 1658
1659

75
1660 1661 Figure 10. Flux cross-plots of CH4 (circles) and DIC (stars) versus SO4
2- across the 1662 SMT corresponds to a 1:1 slope. Case 1 corresponds to simulations shown in Figure 4. 1663
The simulation results that best matches Site 1244 data ( 2Pe = -1; Figure 4) show 17 1664
mol/m2kyr of SO42- entering the SMT from above, 17 mol/m2kyr is the difference 1665
between amounts of DIC entering from below and leaving toward the seafloor (including 1666 carbonate precipitation). This gives a net change of 17 mol/m2kyr of DIC across the 1667 SMT, which balances the downward flux of SO4
2- and supports a 1:1 stoichiometry and 1668 dominance of AOM at the SMT. Case 2 increases the rate of organoclastic sulfate 1669
reduction by two orders of magnitude ( 210POCDa ; all other parameters are same as 1670
Case 1) and the relative flux correspondence across the SMT is unaltered. Case 3 1671 corresponds to high DIC flux entering the SMT from below and high methanogenesis 1672 rate also results in the same 1:1 correlation between CH4 and DIC fluxes relative to 1673
SO42- flux (parameters same as dashed curves in Figure 9a). The 2Pe values 1674
(equivalent to upward fluid flux) are noted in parenthesis and the arrow indicates 1675 increase in upward fluid flux. 1676