pore pressure prediction in front of drill bit based on
TRANSCRIPT

Vol.:(0123456789)1 3
Journal of Petroleum Exploration and Production Technology (2020) 10:2439–2446 https://doi.org/10.1007/s13202-020-00896-3
ORIGINAL PAPER -EXPLORATION ENGINEERING
Pore pressure prediction in front of drill bit based on grey prediction theory
Ya‑nan Sheng1 · Weiting Li1 · Zhi‑chuan Guan2 · Jinbao Jiang1 · Kai Lan3 · Hua Kong1
Received: 14 January 2020 / Accepted: 28 April 2020 / Published online: 9 May 2020 © The Author(s) 2020
AbstractAt present, the method of formation pressure is mainly divided into pressure prediction before drilling, pressure monitoring while drilling, and post-drilling pressure detection. The drilling monitoring method and the post-drilling pressure detec-tion method cannot predict the pressure value of the formation in front of the drill bit. The pre-drilling prediction method is used to predict pressure by seismic data, but the accuracy of the result is not high. How to infer the pressure information of complex and unknown drilling strata based on very limited known formation pressure information is the key technical problem to be solved in this paper. In order to solve this problem, a method based on grey theory is proposed to predict the formation pressure in front of the drill. The prediction results of formation pore pressure based on the method in this paper are compared with the monitoring results of formation pore pressure while drilling: the maximum error is 3.408%, and the average relative error is 3.038%, which indicates that the model has high accuracy. It can meet the requirements of field drill-ing construction. Through the research of this paper, it can provide more accurate pore pressure information of the formation to be drilled under the bit. Based on the pressure prediction results of the formation to be drilled, dynamic engineering risk assessment can be carried out, so as to assist the drilling operators to make quick and accurate decisions and prevent drilling risk caused by inaccurate understanding of pressure information.
Keywords Pore pressure prediction · Pore pressure monitoring · Grey prediction theory · Drilling safety
Introduction
Formation pressure is the basic data reflecting the fluid situation, rock type, engineering mechanical properties and geological structure in the formation. Accurate prediction of formation pressure is an important prerequisite to ensure the smooth and safe drilling from design to construction (Jiang 2006; Du et al. 1995; Hubbert and Rubey 1959). Therefore, formation pressure monitoring and prediction has always been an important task in oil and gas drilling. At present, the methods of obtaining abnormal formation pressure are
mainly divided into the following categories (Chen and Guan 2006): pre-drilling pressure prediction, pressure moni-toring while drilling, geophysical logging pressure detection, and pressure measurement. The prediction of pre-drilling pressure is mainly to calculate the formation pore pressure by using the seismic layer velocity data and the relationship model between the formation pore pressure and the forma-tion pore pressure. The commonly employed approaches include (Fillippone 1979, 1982; Ifeanyl 2015; Sayers et al. 2000): equivalent depth method, single point prediction model and comprehensive prediction model, etc. Pressure monitoring with various drilling and logging parameters has been widely used in the actual drilling process of oil and gas fields, which plays a real-time role in guiding drilling engineering (Majidi et al. 2017; Jincai and Shangxian 2017; Emmanuel et al. 2016). Geophysical logging is generally recognized as an important means for accurate prediction of formation pressure. The commonly employed approaches include (Eaton 1975; Bowers 1995; Ben-Awuah et al. 2017; Dutta 2002): shale acoustic time difference method, shale resistivity method, shale density method, etc. However, this
* Ya-nan Sheng [email protected]
1 Drilling Engineering and Technology Research Institute, Zhongyuan Petroleum Engineering Co., Ltd., SINOPEC, Puyang 457001, China
2 School of Petroleum Engineering, China University of Petroleum, Qingdao 266580, China
3 Southwest Drilling Company, Zhongyuan Petroleum Engineering Co., Ltd., Chengdu 610000, China

2440 Journal of Petroleum Exploration and Production Technology (2020) 10:2439–2446
1 3
method is a post-prediction method, which cannot predict the pore pressure of the undrilled formation below the bot-tom of the well. Neither MWD nor PWD can predict the pressure of the formation to be drilled in front of the bit. At present, the prediction method of formation pressure before drilling is to predict formation pressure by seismic data, but the accuracy of prediction results is not high. In addition to the complexity of underground geological conditions, the more important reason is that there is too little information under the bottom of the well, or there is no useful infor-mation at all. How to infer the pressure information of the complex and unknown formation to be drilled from the very limited known formation pressure information is the key technical problem to be solved in this paper.
Pore pressure prediction mode in front of bit
Grey prediction theory
(1) Grey prediction method
The theory of grey system was first put forward by Professor Deng Julong of Huazhong University of science and tech-nology in 1982, and then, it has been paid attention to at home and abroad (Wen 2003). The theory of grey system is a subject that takes the uncertain system of “part informa-tion is known, part information is unknown” as the research object. Its characteristic is to extract valuable information through the generation and development of “part” known information, to realize the accurate description and effective monitoring of system operation behaviour. “Poor informa-tion, small sample system” is the main research content of grey system theory. Through the processing, mining and utilization of the existing “poor information” and through the correct grasp and description of the evolution law of the system operation behaviour, it can realize the recognition of the real world and the prediction of the future state.
(2) Modelling principle of grey prediction model (Xie and Liu 2005; Yang et al. 2011)
S e t X(0) a s r a w d a t a s e q u e n c e : X(0)=
{x(0)(1), x(0)(2),… , x(0)(n)
}.
X(1) is a new data sequence generated by first-order accu-mulation of X(0).
X(1)={x(1)(1), x(1)(2),… , x(1)(n)
} . I n f o r m u l a ,
x(1)(k) =∑k
i=1x(0)(i)(k = 1, 2,… , n).
Z(1) is mean generation with consecutive neighbours of X(1).
Z(1)={z(1)(2), z(1)(3),… , z(1)(n)
}.
In formula, z(1)(k) = 0.5(x(1)(k) + x(1)(k − 1)
), k = 2, 3,… , n.
Assume the parameters are listed as:
The least squares est imat ion sequence of x(0)(k) + az(1)(k) = b is: � =
[BTB
]−1BTY .
The solution process is as follows:① The solution of whitening equation dx
(1)
dt+ ax(1) = b (also
called time response function) is:
② The solution (also called time response series) of x(0)(k) + az(1)(k) = b is:
③ Reduction value:
Pore pressure prediction mode
Based on the grey theory, this paper establishes the predic-tion model of formation pressure while drilling and predicts the formation pressure to be drilled in front of the bit accord-ing to the monitoring results of the pressure while drilling in front of the bit. The pressure monitoring results while drilling of the drilled formation within a certain depth of the upper part of the bit position are selected as the initial raw data. In order to reduce the randomness and uncertainty of the original series, the moving average method is used. Then, the differential dynamic equation of the system is con-structed by fitting, and the model built according to the new sequence is reduced and generated, and finally the pressure prediction model is established. The steps are as follows:① Construct primitive sequence
Take the depth of the bit as the origin and take the for-mation pressure monitoring values of n points equidistant upward as the original data:
② Preprocessing the original sequenceThe moving average method is applied to preprocess the
original sequence:
� = [a, b]T, and B =
⎡⎢⎢⎢⎣
−z(1)(2)1
−z(1)(3)1
⋮
−z(1)(n)1
⎤⎥⎥⎥⎦,
Y =�x(0)(2), x(0)(3),… , x(0)(n)
�T.
(1)x(1)(t) =(x(1)(1) −
b
a
)e−at +
b
a
(2)
x̂(1)(k + 1) =(x(0)(1) −
b
a
)e−ak +
b
a, (k = 1, 2, 3,… , n)
(3)
x(1)(k + 1) =(x(0)(1) −
b
a
)e−ak +
b
a, (k = 1, 2, 3,… , n)
(4)p(0) =
{p(0)(k)
}={p(0)(1), p(0)(2),… , p(0)(n)
}, k = 1, 2,… , n.
2441Journal of Petroleum Exploration and Production Technology (2020) 10:2439–2446
1 3
③ Building grey model GM (1, 1)Make 1-AGO (first order accumulation) of p�(0) to get the
generating sequence:p(1) =
{p(1)(k)
}, k = 1, 2,… , n. I n f o r m u l a ,
p(1)(k) =∑k
j=1p
�(0)(j).The mean value of p(1) is processed, and its generating
sequence is:
In formula, z(1)(k) = 0.5[p(1)(k) + p(1)(k − 1)
]. k = 2,… , n.
Establish the grey differential equation:
Using the grey differential equation, the coefficient a, b are calculated:
Substituting coefficient into grey differential equation,The coefficient is substituted into the grey differential
equation, and the equation is solved according to the least square method. The solution is as follows:
④ Solve restore modelMaking 1-IAGO for p(1) to get the reduction model
When k = 1, 2,… , n − 1 , the simulated value p(0) of the original sequence p�(0) can be obtained.⑤ Carry out residual inspection
Set Δ(k) as the residual value, �(k) the relative residual value, and q the average precision:
(5)p
�(0) ={p
�(0)(k)}={p
�(0)(1), p�(0)(2),… , p
�(0)(n)}, k = 1, 2,… , n.
(6)
⎧⎪⎪⎪⎨⎪⎪⎪⎩
p�(0)(1) =
3p(0)(1) + p�(0)(2)
4
p�(0)(n) =
p(0)(n − 1) + 3p(0)(n)
4
p�(0)(k) =
p(0)(k − 1) + 2p(0)(k) + p�(0)(k + 1)
4, k = 2,… , n − 1.
z(1) ={z(1)(k)
}={z(1)(1), z(1)(2),… , z(1)(n)
}, k = 1, 2,… , n.
(7)dp(1)
dk+ ap(1) = b
(8)p(1)(k) = az(1)(k) = b
(9)p(1)(k + 1) =
(p
�(0)(1) −b
a
)e−ak +
b
a
(10)p(0)(k + 1) = −a
(p
�(0)(1) −b
a
)e−ak
p(0)(k + 1) = p
(1)(k + 1) − p
(1)(k)
(11)Δ(k)(0) = p�(0)(k) − p
(0)(k), �(k)(0) = Δ(k)(0)∕p
�(0)(k)
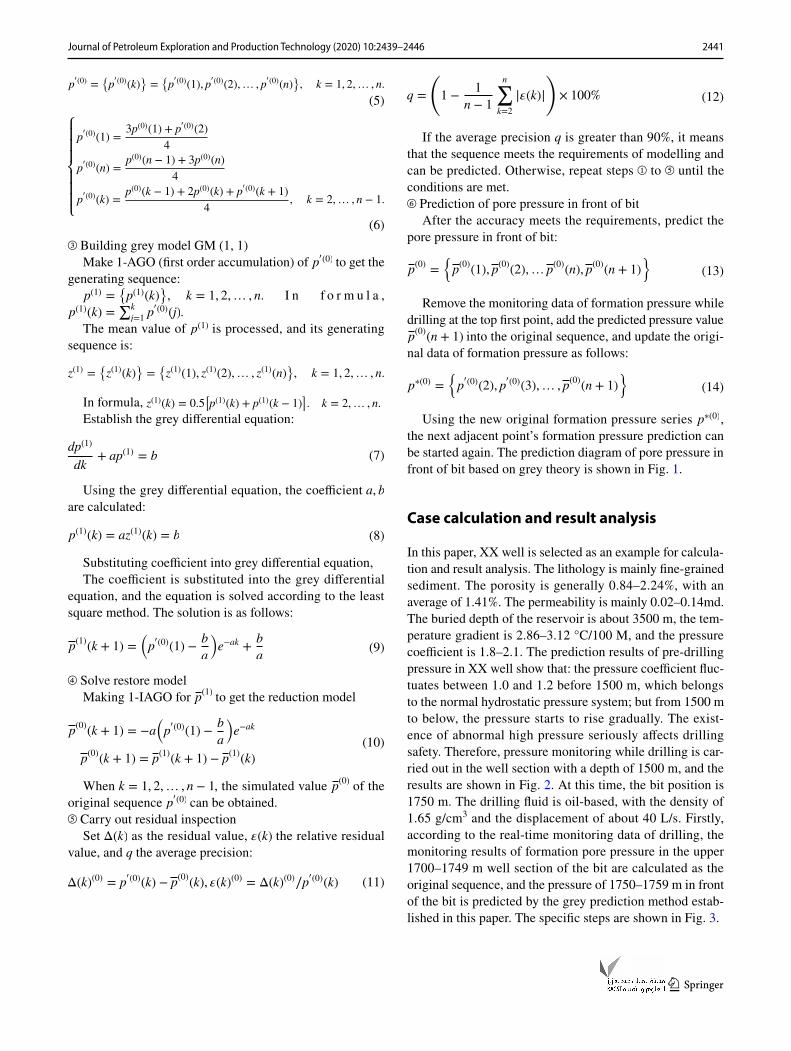
If the average precision q is greater than 90%, it means that the sequence meets the requirements of modelling and can be predicted. Otherwise, repeat steps ① to ⑤ until the conditions are met.⑥ Prediction of pore pressure in front of bit
After the accuracy meets the requirements, predict the pore pressure in front of bit:
Remove the monitoring data of formation pressure while drilling at the top first point, add the predicted pressure value p(0)(n + 1) into the original sequence, and update the origi-
nal data of formation pressure as follows:
Using the new original formation pressure series p∗(0) , the next adjacent point’s formation pressure prediction can be started again. The prediction diagram of pore pressure in front of bit based on grey theory is shown in Fig. 1.
Case calculation and result analysis
In this paper, XX well is selected as an example for calcula-tion and result analysis. The lithology is mainly fine-grained sediment. The porosity is generally 0.84–2.24%, with an average of 1.41%. The permeability is mainly 0.02–0.14md. The buried depth of the reservoir is about 3500 m, the tem-perature gradient is 2.86–3.12 °C/100 M, and the pressure coefficient is 1.8–2.1. The prediction results of pre-drilling pressure in XX well show that: the pressure coefficient fluc-tuates between 1.0 and 1.2 before 1500 m, which belongs to the normal hydrostatic pressure system; but from 1500 m to below, the pressure starts to rise gradually. The exist-ence of abnormal high pressure seriously affects drilling safety. Therefore, pressure monitoring while drilling is car-ried out in the well section with a depth of 1500 m, and the results are shown in Fig. 2. At this time, the bit position is 1750 m. The drilling fluid is oil-based, with the density of 1.65 g/cm3 and the displacement of about 40 L/s. Firstly, according to the real-time monitoring data of drilling, the monitoring results of formation pore pressure in the upper 1700–1749 m well section of the bit are calculated as the original sequence, and the pressure of 1750–1759 m in front of the bit is predicted by the grey prediction method estab-lished in this paper. The specific steps are shown in Fig. 3.
(12)q =
(1 −
1
n − 1
n∑k=2
|�(k)|)
× 100%
(13)p(0)
={p(0)(1), p
(0)(2),… p
(0)(n), p
(0)(n + 1)
}
(14)p∗(0) ={p
�(0)(2), p�(0)(3),… , p
(0)(n + 1)
}

2442 Journal of Petroleum Exploration and Production Technology (2020) 10:2439–2446
1 3
Fig. 1 Sketch map of formation pressure prediction in front of bit based on grey theory
Fig. 2 Variation of interval transit time, resistivity and pore pressure with depth of XX well

2443Journal of Petroleum Exploration and Production Technology (2020) 10:2439–2446
1 3
First of all, 1700–1749 m formation pressure monitoring data while drilling is selected as the original sequence, as shown in Table 1.
Set the original data sequence of formation pressure as:
Z(1) is mean generation with consecutive neighbours of P:
In formula, z(1)(k) = 0.5[p(1)(k) + p(1)(k − 1)
], k = 2,… , 50.
The prediction model of formation pressure while drill-ing is established by using 50 groups of monitoring data series of formation pressure while drilling with the help of
P(0) ={p(0)(k)
}={p(0)(1), p(0)(2),… , p(0)(50)
}, k = 1, 2,… , 50.
z(1) ={z(1)(k)
}={z(1)(1), z(1)(2),… , z(1)(50)
}, k = 1, 2,… , 50.
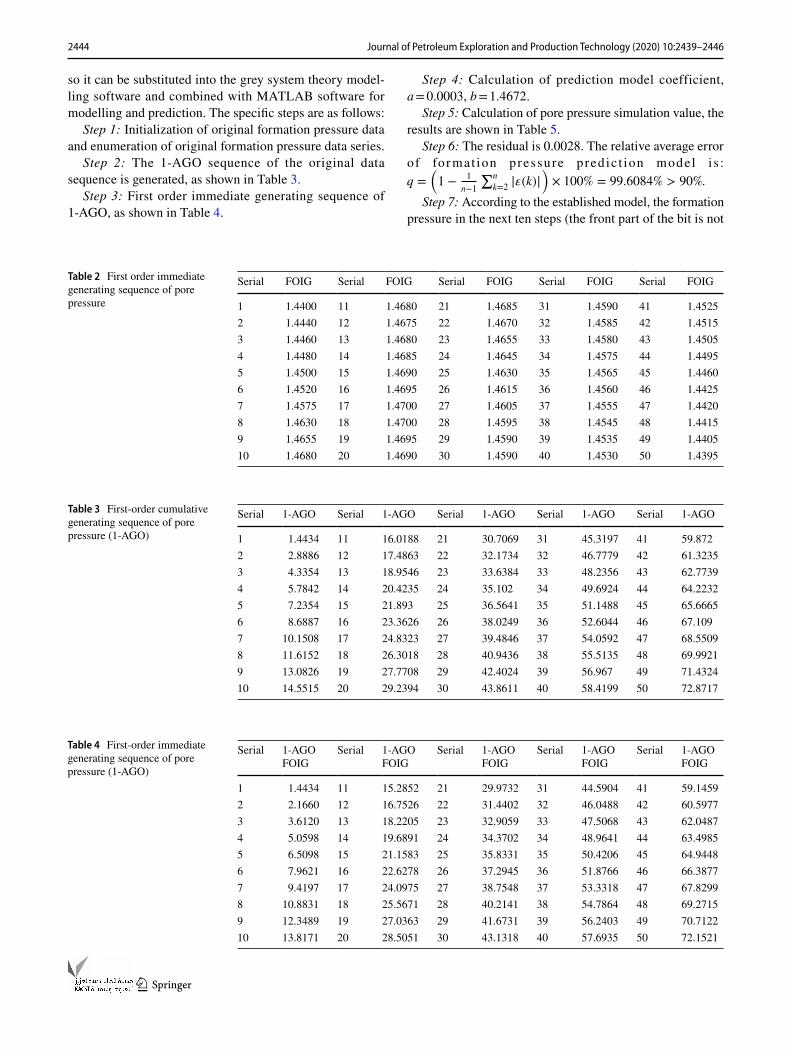
grey system theory modelling software (Gtms3.0) and MAT-LAB software. Using the grey system theory modelling soft-ware to do the first-order immediate generating sequence, the results are shown in Table 2. The first-order immediate generating sequence is substituted into the smooth sequence judgment condition, which satisfies the smooth sequence condition. The first-order accumulation generation (1-AGO) is made for the original data sequence, and the results are shown in Table 3.
It can be seen from Table 3 that the first-order accumula-tion generation sequence of formation pressure is a non-neg-ative increasing sequence with good smoothness. According to the above two steps, it can be judged that the original data sequence of formation pressure has a good smoothness ratio,
Fig. 3 Flow chart of pressure prediction 10 m in front of bit at 1750 m
Table 1 Monitoring data of formation pore pressure during drilling from 1700 to 1749 m
Depth (m) Pp coefficient Depth (m) Pp coefficient Depth (m) Pp coefficient Depth (m) Pp coefficient Depth (m) Pp coefficient
1700 1.4434 1710 1.4673 1720 1.4675 1730 1.4586 1740 1.45211701 1.4452 1711 1.4675 1721 1.4665 1731 1.4582 1741 1.45151702 1.4468 1712 1.4683 1722 1.4650 1732 1.4577 1742 1.45041703 1.4488 1713 1.4689 1723 1.4636 1733 1.4568 1743 1.44931704 1.4512 1714 1.4695 1724 1.4621 1734 1.4564 1744 1.44331705 1.4533 1715 1.4696 1725 1.4608 1735 1.4556 1745 1.44251706 1.4621 1716 1.4697 1726 1.4597 1736 1.4548 1746 1.44191707 1.4644 1717 1.4695 1727 1.4590 1737 1.4543 1747 1.44121708 1.4674 1718 1.4690 1728 1.4588 1738 1.4535 1748 1.44031709 1.4689 1719 1.4686 1729 1.4587 1739 1.4529 1749 1.4393
2444 Journal of Petroleum Exploration and Production Technology (2020) 10:2439–2446
1 3
so it can be substituted into the grey system theory model-ling software and combined with MATLAB software for modelling and prediction. The specific steps are as follows:
Step 1: Initialization of original formation pressure data and enumeration of original formation pressure data series.
Step 2: The 1-AGO sequence of the original data sequence is generated, as shown in Table 3.
Step 3: First order immediate generating sequence of 1-AGO, as shown in Table 4.
Step 4: Calculation of prediction model coefficient, a = 0.0003, b = 1.4672.
Step 5: Calculation of pore pressure simulation value, the results are shown in Table 5.
Step 6: The residual is 0.0028. The relative average error of for mat ion pressure predic t ion model i s : q =
�1 −
1
n−1
∑n
k=2�𝜀(k)�
�× 100% = 99.6084% > 90%.
Step 7: According to the established model, the formation pressure in the next ten steps (the front part of the bit is not
Table 2 First order immediate generating sequence of pore pressure
Serial FOIG Serial FOIG Serial FOIG Serial FOIG Serial FOIG
1 1.4400 11 1.4680 21 1.4685 31 1.4590 41 1.45252 1.4440 12 1.4675 22 1.4670 32 1.4585 42 1.45153 1.4460 13 1.4680 23 1.4655 33 1.4580 43 1.45054 1.4480 14 1.4685 24 1.4645 34 1.4575 44 1.44955 1.4500 15 1.4690 25 1.4630 35 1.4565 45 1.44606 1.4520 16 1.4695 26 1.4615 36 1.4560 46 1.44257 1.4575 17 1.4700 27 1.4605 37 1.4555 47 1.44208 1.4630 18 1.4700 28 1.4595 38 1.4545 48 1.44159 1.4655 19 1.4695 29 1.4590 39 1.4535 49 1.440510 1.4680 20 1.4690 30 1.4590 40 1.4530 50 1.4395
Table 3 First-order cumulative generating sequence of pore pressure (1-AGO)
Serial 1-AGO Serial 1-AGO Serial 1-AGO Serial 1-AGO Serial 1-AGO
1 1.4434 11 16.0188 21 30.7069 31 45.3197 41 59.8722 2.8886 12 17.4863 22 32.1734 32 46.7779 42 61.32353 4.3354 13 18.9546 23 33.6384 33 48.2356 43 62.77394 5.7842 14 20.4235 24 35.102 34 49.6924 44 64.22325 7.2354 15 21.893 25 36.5641 35 51.1488 45 65.66656 8.6887 16 23.3626 26 38.0249 36 52.6044 46 67.1097 10.1508 17 24.8323 27 39.4846 37 54.0592 47 68.55098 11.6152 18 26.3018 28 40.9436 38 55.5135 48 69.99219 13.0826 19 27.7708 29 42.4024 39 56.967 49 71.432410 14.5515 20 29.2394 30 43.8611 40 58.4199 50 72.8717
Table 4 First-order immediate generating sequence of pore pressure (1-AGO)
Serial 1-AGOFOIG
Serial 1-AGOFOIG
Serial 1-AGOFOIG
Serial 1-AGOFOIG
Serial 1-AGOFOIG
1 1.4434 11 15.2852 21 29.9732 31 44.5904 41 59.14592 2.1660 12 16.7526 22 31.4402 32 46.0488 42 60.59773 3.6120 13 18.2205 23 32.9059 33 47.5068 43 62.04874 5.0598 14 19.6891 24 34.3702 34 48.9641 44 63.49855 6.5098 15 21.1583 25 35.8331 35 50.4206 45 64.94486 7.9621 16 22.6278 26 37.2945 36 51.8766 46 66.38777 9.4197 17 24.0975 27 38.7548 37 53.3318 47 67.82998 10.8831 18 25.5671 28 40.2141 38 54.7864 48 69.27159 12.3489 19 27.0363 29 41.6731 39 56.2403 49 70.712210 13.8171 20 28.5051 30 43.1318 40 57.6935 50 72.1521

2445Journal of Petroleum Exploration and Production Technology (2020) 10:2439–2446
1 3
drilled 1750–1759 m) is predicted and compared with the formation pressure monitoring results while drilling. The results are shown in Table 6.
Comparing the prediction results of formation pore pres-sure in 1750–1759 m well section based on grey theory with the monitoring results of formation pore pressure while drill-ing, it is found that: the maximum relative error is 3.408%, and the average relative error is 3.038%. It shows that the model has high accuracy and can accurately predict the for-mation pore pressure 10 m below the bit, which can meet the requirements of field drilling construction.
Conclusions and suggestions
A. The methods of obtaining formation pressure are mainly divided into pre-drilling pressure prediction, pressure monitoring while drilling, geophysical logging pressure detection, and pressure measurement. Neither MWD nor PWD can predict the pressure of the formation to be drilled in front of the bit. The prediction method of for-mation pressure before drilling is to predict formation
pressure by seismic data, but the accuracy of prediction result is not high.
B. In this paper, the grey prediction theory is applied to predict the pore pressure of the formation to be drilled in front of the bit in the process of drilling, and a pres-sure prediction model is constructed, and an example is applied. The results show that: the maximum relative error is 3.408%, and the average relative error is 3.038%. It shows that the model has high precision and can meet the requirements of drilling construction.
C. Through the research of this paper, it can provide more accurate pore pressure information of the formation to be drilled under the bit. Based on the pressure prediction results of the formation to be drilled, dynamic engineer-ing risk assessment can be carried out, so as to assist the drilling operators to make quick and accurate decisions and prevent drilling risk caused by inaccurate under-standing of pressure information.
Acknowledgements The authors would like to acknowledge the aca-demic and technical support of Drilling Engineering and Technol-ogy Research Institute, Zhongyuan Petroleum Engineering Co., Ltd., SINOPEC. This paper is supported by Program for Sinopec Petro-leum Engineering Technology Service Co., Ltd. project “Research on measurement technology of downhole drilling string engineering parameters”. Contract No.: SG 17-12 k. Post-doctoral project of Sin-opec Zhongyuan Petroleum Engineering Company “Research on risk assessment and early warning technology of South Sichuan shale gas drilling project”.
Open Access This article is licensed under a Creative Commons Attri-bution 4.0 International License, which permits use, sharing, adapta-tion, distribution and reproduction in any medium or format, as long as you give appropriate credit to the original author(s) and the source, provide a link to the Creative Commons licence, and indicate if changes were made. The images or other third party material in this article are included in the article’s Creative Commons licence, unless indicated otherwise in a credit line to the material. If material is not included in the article’s Creative Commons licence and your intended use is not permitted by statutory regulation or exceeds the permitted use, you will need to obtain permission directly from the copyright holder. To view a copy of this licence, visit http://creat iveco mmons .org/licen ses/by/4.0/.
Table 5 Simulation value of pore pressure
Serial Result Serial Result Serial Result Serial Result Serial Result
1 1.4432 11 1.4633 21 1.4595 31 1.4558 41 1.45212 1.4666 12 1.4629 22 1.4591 32 1.4554 42 1.45183 1.4662 13 1.4625 23 1.4588 33 1.4551 43 1.45144 1.4658 14 1.4621 24 1.4584 34 1.4547 44 1.45105 1.4654 15 1.4617 25 1.4580 35 1.4543 45 1.45076 1.4651 16 1.4614 26 1.4577 36 1.4540 46 1.45037 1.4647 17 1.4610 27 1.4573 37 1.4536 47 1.44998 1.4643 18 1.4606 28 1.4569 38 1.4532 48 1.44929 1.4640 19 1.4603 29 1.4566 39 1.4529 49 1.449510 1.4636 20 1.4599 30 1.4562 40 1.4525 50 1.4488
Table 6 The error between formation pressure prediction value and monitoring value
Serial Depth (m) Pp prediction value PWD Error %
1 1750 1.4785 1.4356 2.9012 1751 1.4881 1.4373 3.4083 1752 1.4897 1.4391 3.3924 1753 1.4883 1.4391 3.3035 1754 1.4847 1.4376 3.1716 1755 1.4796 1.4362 2.9337 1756 1.4782 1.4354 2.8918 1757 1.4768 1.4342 2.8819 1758 1.4755 1.4342 2.79810 1759 1.4745 1.4346 2.699

2446 Journal of Petroleum Exploration and Production Technology (2020) 10:2439–2446
1 3
References
Ben-Awuah J, Padmanabhan E, Sokkalingam R (2017) Geochemis-try of Miocene sedimentary rocks from offshore West Baram Delta, Sarawak Basin, Malaysia, South China Sea: implications for weathering, provenance, tectonic setting, paleoclimate and paleoenvironment of deposition. Geosci J 21(2):167–185
Bowers GL (1995) Pore-pressure estimation from velocity data: accounting for overpressure mechanisms besides under compac-tion. Int J Rock Mech Min Sci Geomech Abstr 10(2):89–95
Chen T, Guan Z (2006) Theory and technology of drilling engineering. Petroleum University Press, Dongying, pp 51–54
Du Y, Zheng H, Jiao X (1995) Abnormal pressure and hydrocarbon accumulation. Earth Sci Front 2(3):137–148
Dutta NC (2002) Deepwater geo-hazard prediction using pre-stack in version of large offset P wave data and rock model. Lead Edge Geophys 21(2):193–198
Eaton BA (1975) The equation for geo-pressure prediction from well logs. In: SPE5544
Emmanuel A, Emmanuel A, Ilechukwu JN et al (2016) Prediction of pore pressure using well logs and seismic data in Fabi Field, Onshore Niger delta, Nigeria. Int J Adv Geosci 4(2):55–63
Fillippone WR (1979) Prediction of abnormally pressured sedimentary rocks from seismic data. In: OTC
Fillippone WR (1982) Estimation of formation parameters and predic-tion of overpressures from seismic data. In: SEG-1982-0502.1982
Hubbert MK, Rubey WW (1959) Role of fluid pressure in mechan-ics of overthrust faulting. Part I: mechanics of fluid-filled porous solids and its application to overthrust faulting. AAPG Bull 37(8):155–166
Ifeanyl NR (2015) Comparing methods of predicting pore pressure. Int J Sci Eng Res 47(2):77–90
Jiang X (2006) Drilling accidents and complex problems, 2nd edn. Petroleum Industry Press, Beijing, pp 72–80
Jincai Z, Shangxian Y (2017) Real-time pore pressure detection: indi-cators and improved methods. Geofluids 10(3):1–12
Majidi R et al (2017) Pore pressure estimation by use of mechanical specific energy & drilling efficiency. In: SPE 178842, SPE drilling & completions, June, 2017
Sayers CM, Johnson GM, Denyer G (2000) Predrill pore-pressure pre-diction using seismic data. Geophysics 67(4):1286
Wen L (2003) Grey system theory and its application. Harbin Engineer-ing University, Nangang
Xie N, Liu S (2005) Discrete GM (1,1) and mechanism of grey fore-casting model. Theory Pract Syst Eng 12(1):93–99
Yang H, Liu J, Zheng B (2011) Improvement and application of grey prediction GM(1,1) model. Math Pract Theory 41(23):39–46
Publisher’s Note Springer Nature remains neutral with regard to jurisdictional claims in published maps and institutional affiliations.