population. what is population? the collection of people living in a given geographic area, or...
TRANSCRIPT

PopulationPopulation

What is Population?What is Population? The collection of people living in a given The collection of people living in a given
geographic area, or space, usually measured by geographic area, or space, usually measured by a censusa census
DemographyDemography The study of human populationsThe study of human populations
Various aspects of human behavior in Various aspects of human behavior in populations are studied in Sociology, populations are studied in Sociology, Economics, and GeographyEconomics, and Geography
The study of populations is almost always The study of populations is almost always governed by the laws of probability governed by the laws of probability
www.census.gov/main/www/popclock.html

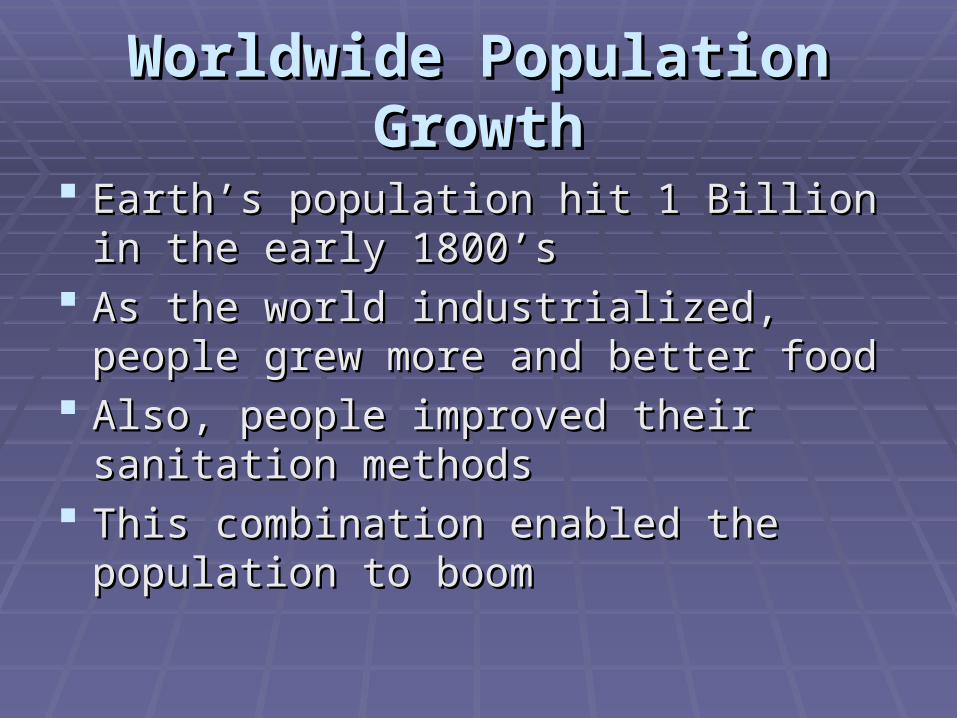
Worldwide Population GrowthWorldwide Population Growth
Earth’s population hit 1 Billion in the early Earth’s population hit 1 Billion in the early 1800’s1800’s
As the world industrialized, people grew As the world industrialized, people grew more and better foodmore and better food
Also, people improved their sanitation Also, people improved their sanitation methodsmethods
This combination enabled the population This combination enabled the population to boomto boom
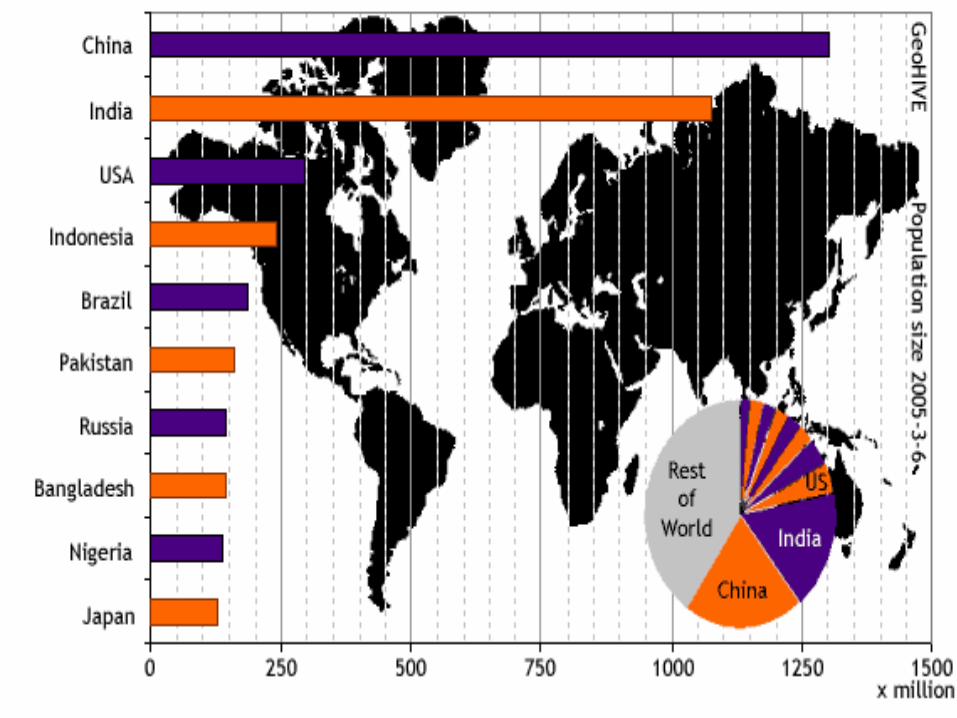

Rank Country Population Density (people/ km²)
— World 6,661,208,350 43
1 China 1,315,844,000 136
2 India 1,110,000,000 328
3 United States 300,000,000 30
4 Indonesia 222,781,000 126
5 Brazil 186,405,000 21
6 Pakistan 164,000,000 202
7 Bangladesh 145,000,000 1,002
8 Russia 142,800,000 8
9 Nigeria 131,530,000 139
10 Japan 127,000,000 337
11 Mexico 107,000,000 54

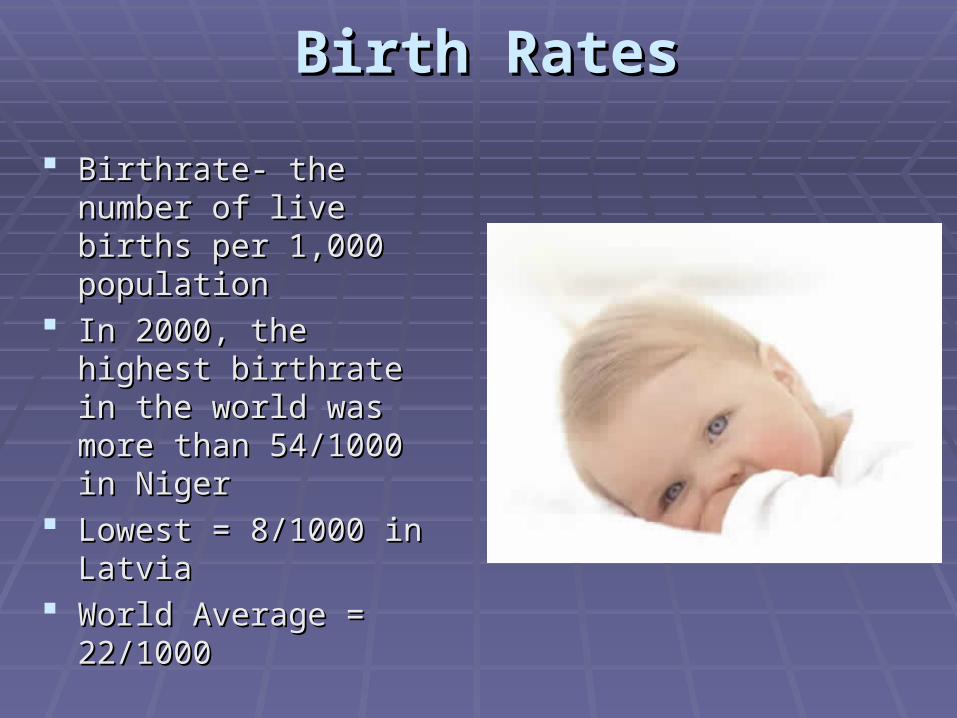
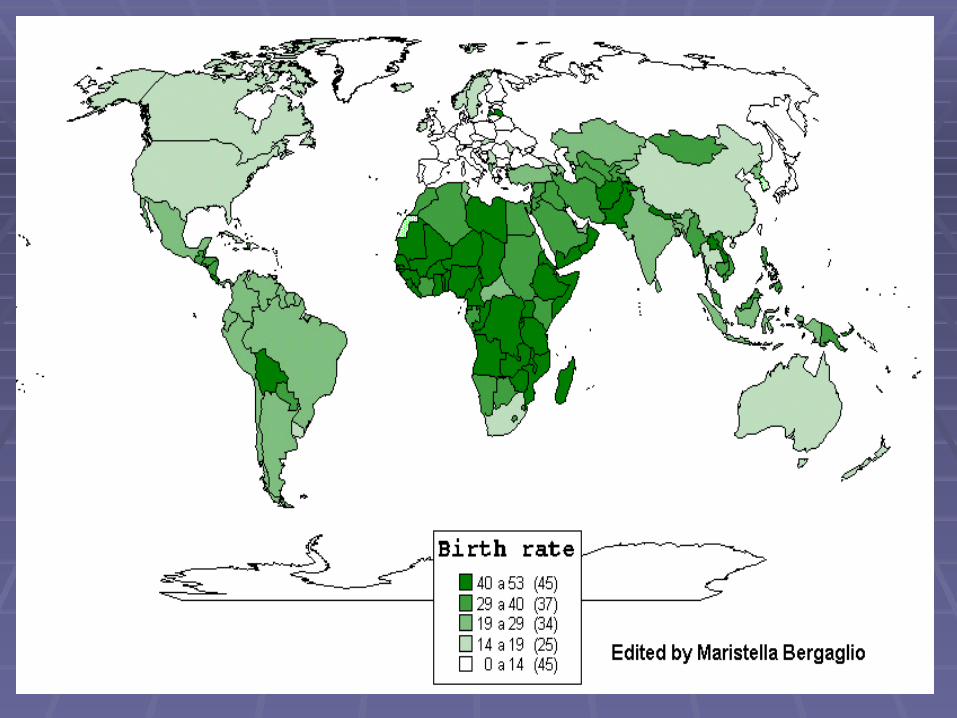
Birth RatesBirth Rates
Birthrate- the number of Birthrate- the number of live births per 1,000 live births per 1,000 populationpopulation
In 2000, the highest In 2000, the highest birthrate in the world was birthrate in the world was more than 54/1000 in more than 54/1000 in NigerNiger
Lowest = 8/1000 in LatviaLowest = 8/1000 in Latvia World Average = 22/1000World Average = 22/1000

Fertility RateFertility Rate
Shows the average number of children a Shows the average number of children a woman of childbearing years woman of childbearing years wouldwould have have in her lifetimein her lifetime
A fertility rate of 2.1 is necessary just to A fertility rate of 2.1 is necessary just to replace current populationreplace current population
Today, the worldwide average fertility rate Today, the worldwide average fertility rate is about 3.0is about 3.0


Mortality RateMortality Rate Also called the death rateAlso called the death rate Number of deaths per Number of deaths per
1,000 people1,000 people Generally, a society is Generally, a society is
considered healthy if it considered healthy if it has a low mortality ratehas a low mortality rate
However, some healthy However, some healthy nations have higher nations have higher mortality rates because mortality rates because they have large numbers they have large numbers of elderly peopleof elderly people

Infant Mortality RateInfant Mortality Rate
For this reason, geographers also look at For this reason, geographers also look at infant mortality rates infant mortality rates
Infant Mortality RateInfant Mortality Rate Shows the number of deaths among infants Shows the number of deaths among infants
under age 1 per 1,000 live birthsunder age 1 per 1,000 live births
In the 1800’s, the worldwide I.M.R. was In the 1800’s, the worldwide I.M.R. was 300/1,000300/1,000

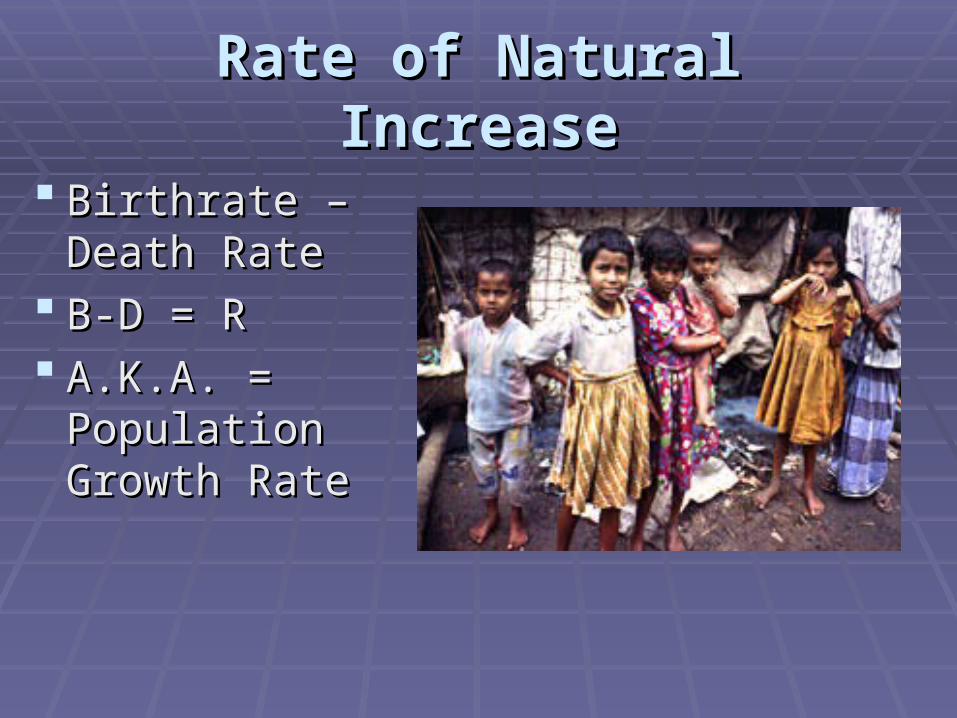
Rate of Natural IncreaseRate of Natural Increase
Birthrate – Birthrate – Death RateDeath Rate
B-D = RB-D = R A.K.A. = A.K.A. =
Population Population Growth RateGrowth Rate

Human Population Growth Rate

Population PyramidPopulation Pyramid
Another way to analyze populations is to use a Another way to analyze populations is to use a population pyramidpopulation pyramid
PP = a graphic device that shows sex & age PP = a graphic device that shows sex & age distribution of a populationdistribution of a population
Allows geographers to examine how events in Allows geographers to examine how events in society, such as wars, famine, or epidemics, affect society, such as wars, famine, or epidemics, affect the population of a country or regionthe population of a country or region


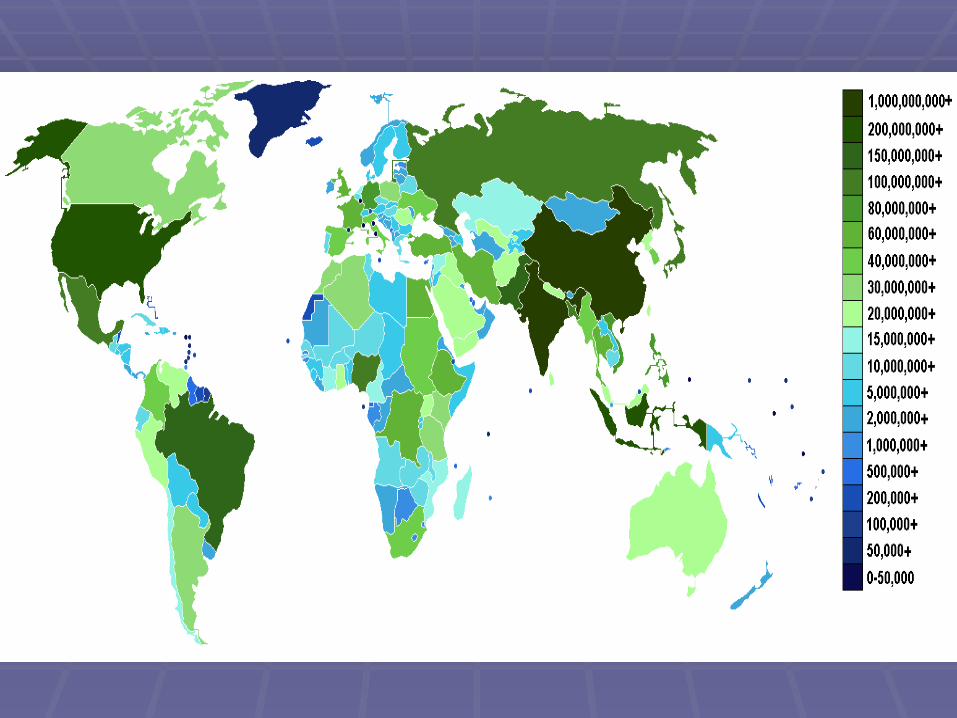
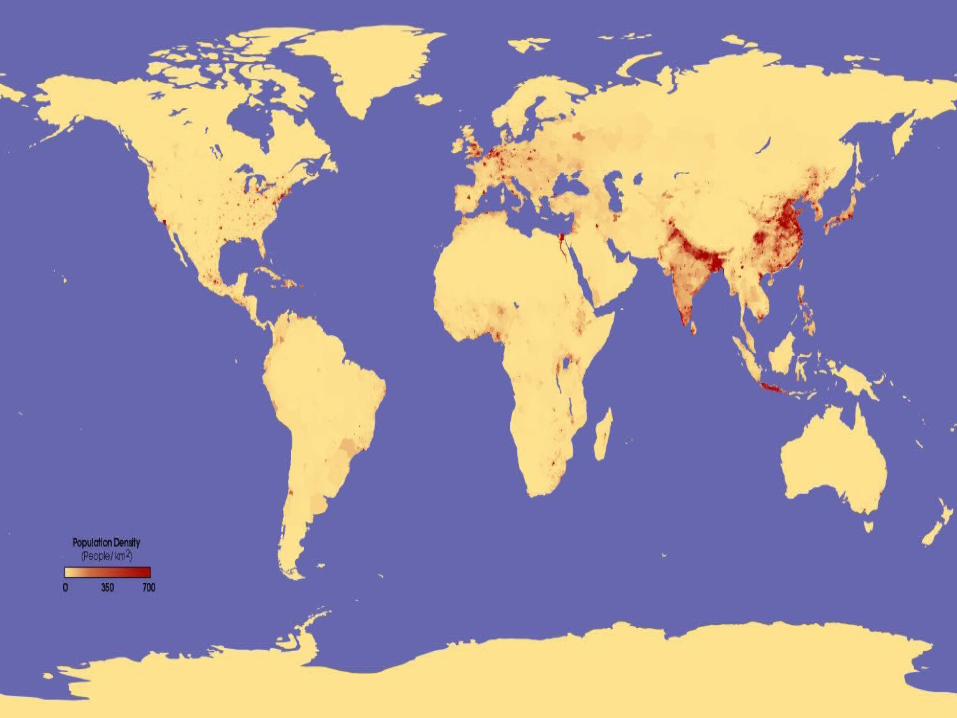
Population DistributionPopulation Distribution
Of the billions of people in the world, most Of the billions of people in the world, most are not distributed equally across the earthare not distributed equally across the earth
Some lands are not suitable for human Some lands are not suitable for human habitationhabitation Examples?Examples?
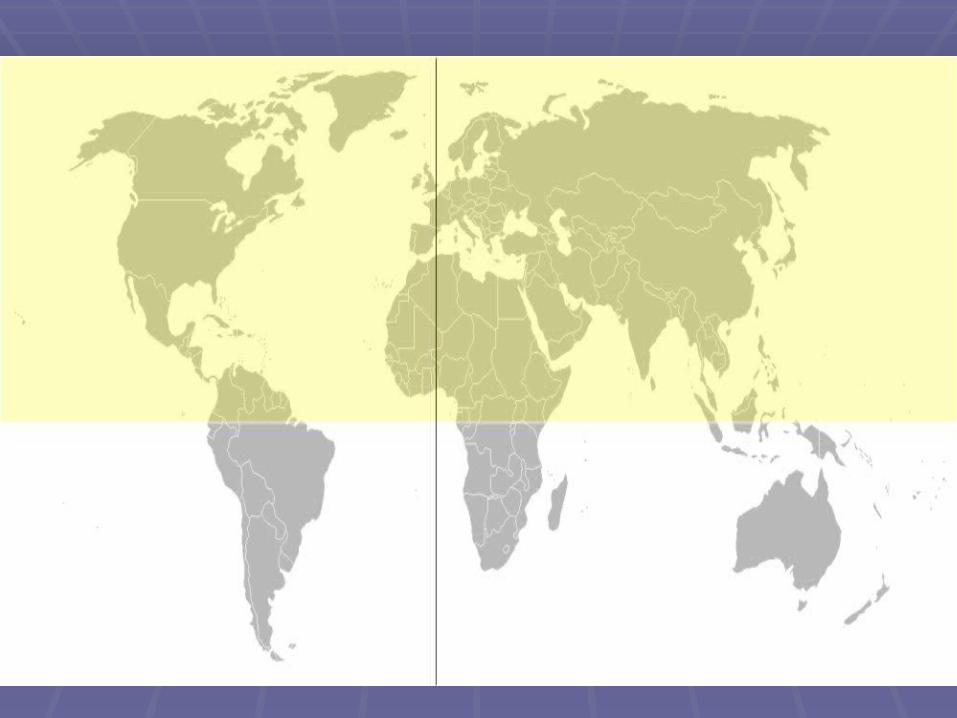
Almost 90% of the world’s population lives Almost 90% of the world’s population lives in the Northern Hemispherein the Northern Hemisphere N.H.- ½ of the planets surface, which is north N.H.- ½ of the planets surface, which is north
of the equatorof the equator

Population DistributionPopulation Distribution
1 in 4 people in the world 1 in 4 people in the world live in East Asia, and 1 in live in East Asia, and 1 in 2 people live in either 2 people live in either East Asia or South AsiaEast Asia or South Asia
Factors:Factors: ClimateClimate AltitudeAltitude Access to waterAccess to water All influence where people All influence where people
livelive

Urban-Rural MixUrban-Rural Mix
Currently, more than ½ of the world’s Currently, more than ½ of the world’s population lives in rural areaspopulation lives in rural areas
However, this number is changing rapidlyHowever, this number is changing rapidly More and more people are migrating to More and more people are migrating to
citiescities Particularly, cities with populations of more Particularly, cities with populations of more
than one million peoplethan one million people

MegacitiesMegacities
In 1950, New York City was the only World City In 1950, New York City was the only World City with more than 10 million residentswith more than 10 million residents
Today, 26 giant cities are home to a total of Today, 26 giant cities are home to a total of more than 250 million peoplemore than 250 million people
The largest of these is TokyoThe largest of these is Tokyo 34 million inhabitants34 million inhabitants
These huge cities struggle with overcrowded These huge cities struggle with overcrowded conditions and immense demand for water & conditions and immense demand for water & sanitationsanitation
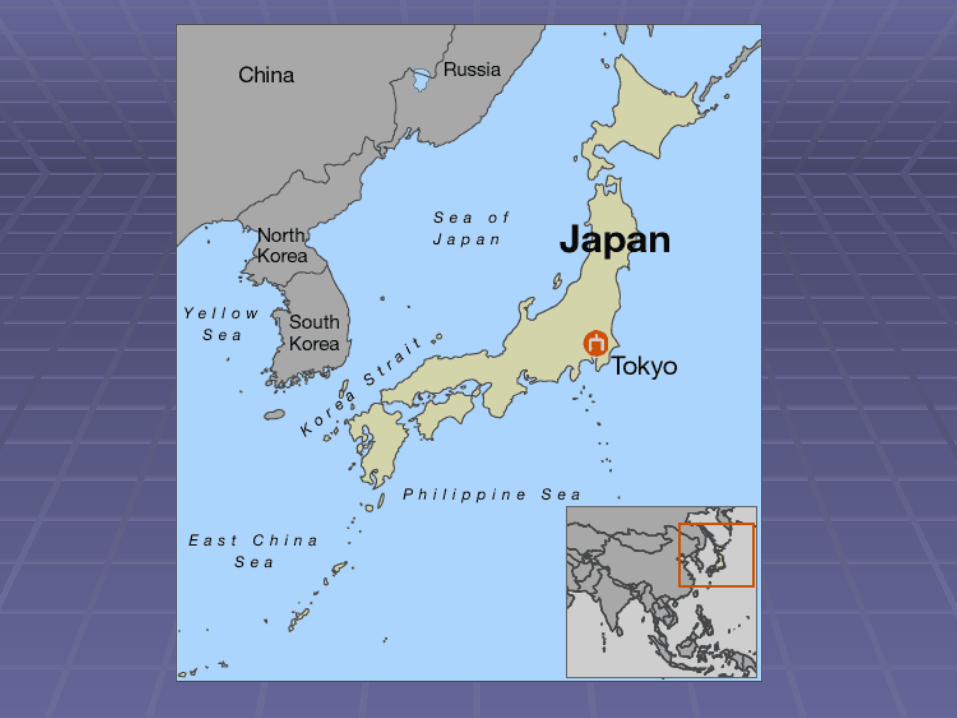

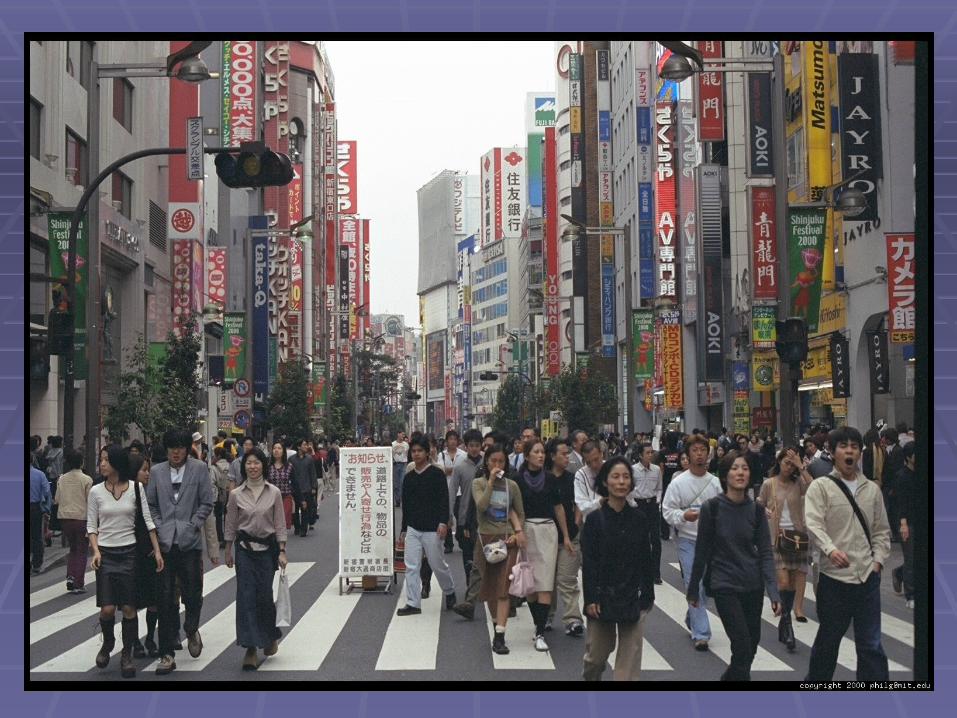

Tokyo

MegacitiesMegacities
Mexico City, Mexico (22,800,000) Mexico City, Mexico (22,800,000) Seoul, South Korea (22,300,000) Seoul, South Korea (22,300,000) New York City, USA (21,900,000) New York City, USA (21,900,000) São Paulo, Brazil (20,200,000) São Paulo, Brazil (20,200,000) Mumbai (Bombay), India (19,850,000) Mumbai (Bombay), India (19,850,000) Delhi, India (19,700,000) Delhi, India (19,700,000) Shanghai, China (18,150,000) Shanghai, China (18,150,000) Los Angeles, USA (18,000,000) Los Angeles, USA (18,000,000) Osaka, Japan (16,800,000) Osaka, Japan (16,800,000)

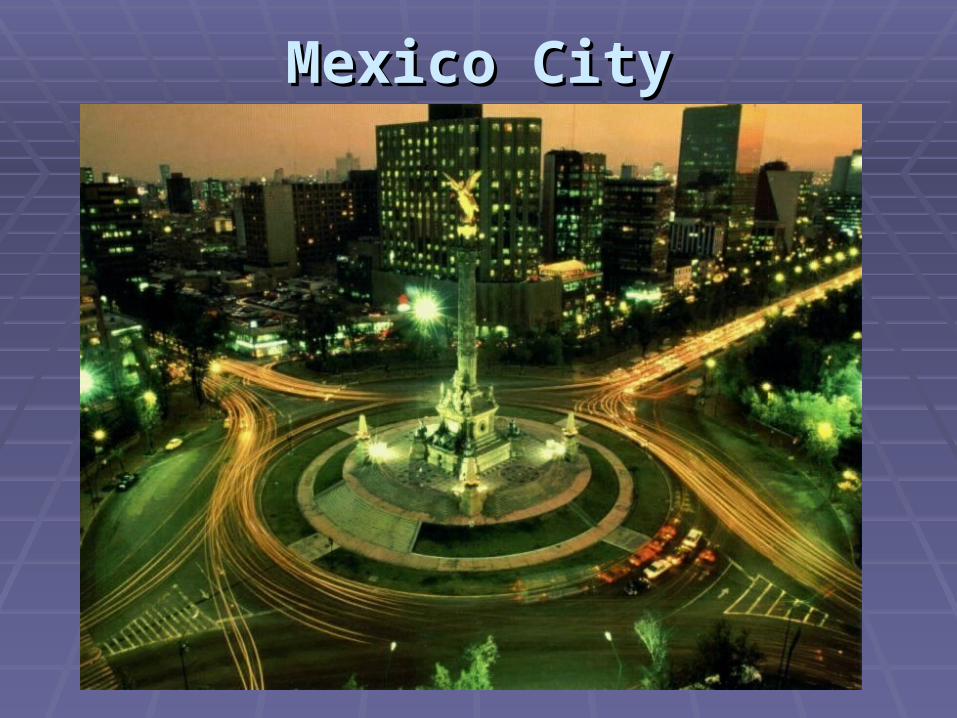
Mexico CityMexico City

Seoul, South KoreaSeoul, South Korea
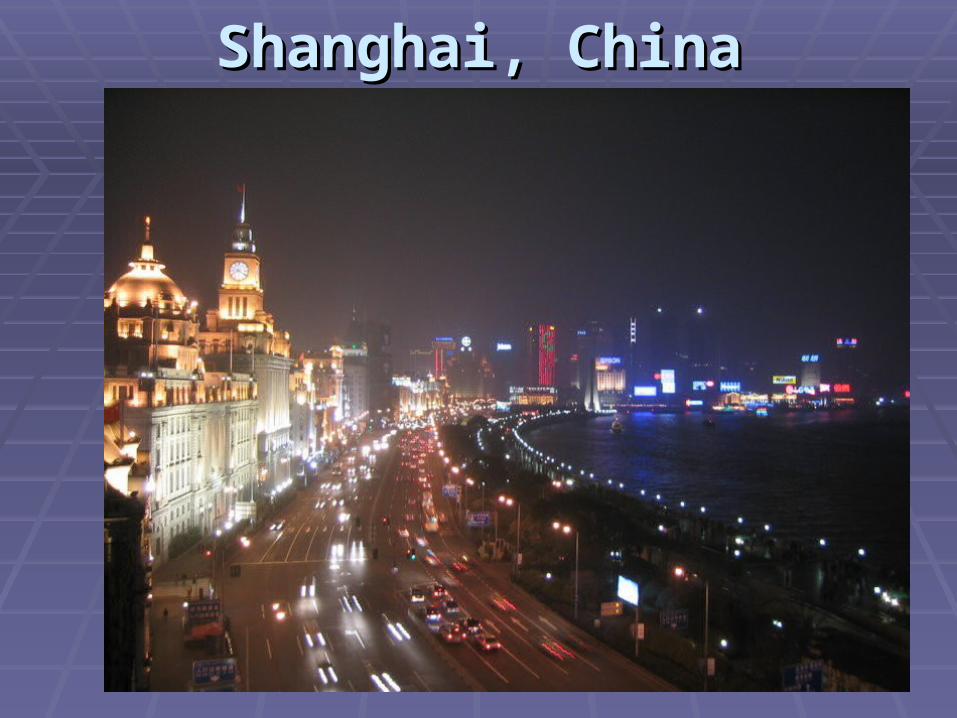
Shanghai, ChinaShanghai, China

MigrationMigration
The large-scale The large-scale migration of people from migration of people from one location to another one location to another also alters the also alters the distribution of populationdistribution of population
Reasons for migrating Reasons for migrating are referred to as: Push-are referred to as: Push-Pull FactorsPull Factors

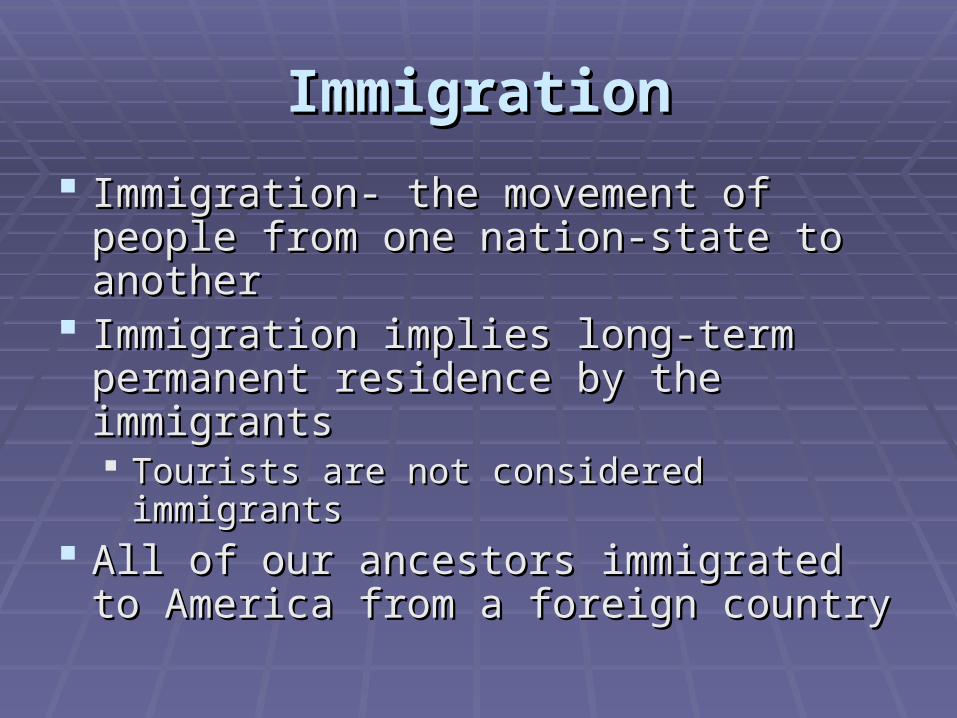
ImmigrationImmigration
Immigration- the movement of people from Immigration- the movement of people from one nation-state to anotherone nation-state to another
Immigration implies long-term permanent Immigration implies long-term permanent residence by the immigrantsresidence by the immigrants Tourists are not considered immigrantsTourists are not considered immigrants
All of our ancestors immigrated to America All of our ancestors immigrated to America from a foreign countryfrom a foreign country

Push FactorsPush Factors
Push Factors-Push Factors- those that cause people to those that cause people to leave their homeland & migrate or leave their homeland & migrate or immigrate to another region or countryimmigrate to another region or country DroughtDrought Natural DisastersNatural Disasters Political – war, persecutionPolitical – war, persecution Religious ReasonsReligious Reasons Economic OpportunityEconomic Opportunity

Irish Potato Famine (1845-1849)Irish Potato Famine (1845-1849)
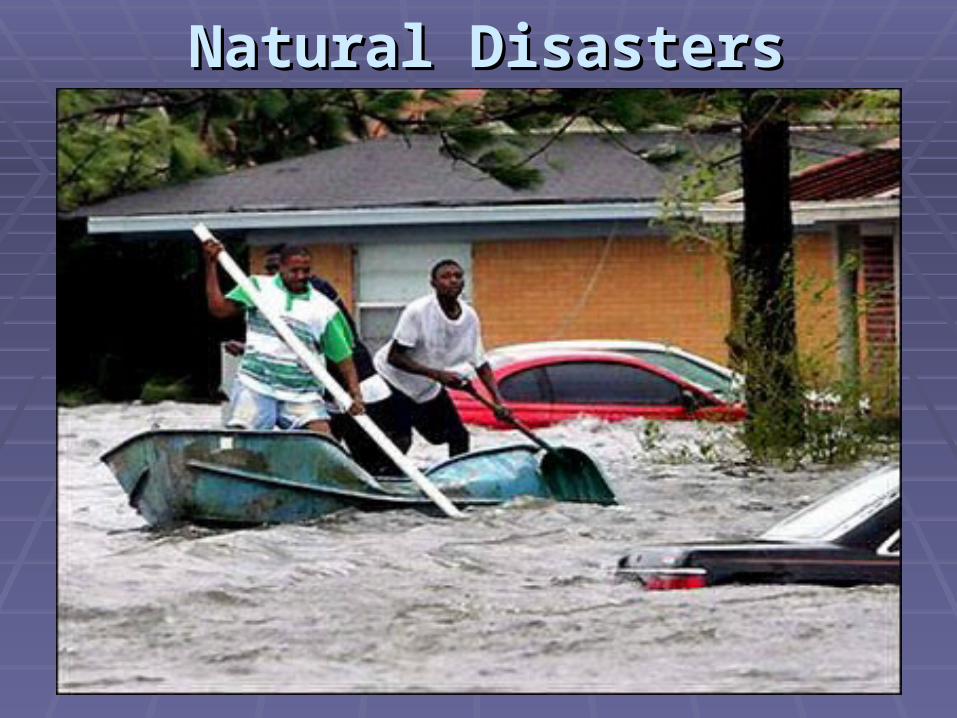
Natural DisastersNatural Disasters
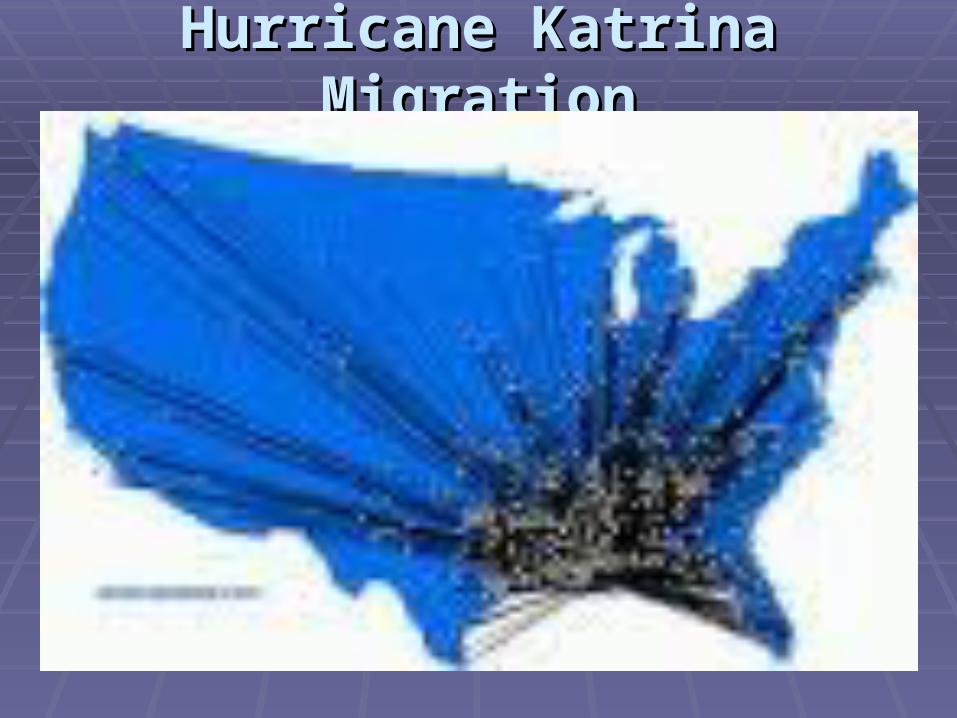
Hurricane Katrina MigrationHurricane Katrina Migration

Religious PersecutionReligious Persecution

Pull FactorsPull Factors
Pull factors draw or attract people to another Pull factors draw or attract people to another locationlocation
Why would someone from Harlan, IA be “pulled” Why would someone from Harlan, IA be “pulled” to Chicago or Kansas City?to Chicago or Kansas City?
Why were our ancestors “pulled” to America?Why were our ancestors “pulled” to America? Countries with good economic opportunities & Countries with good economic opportunities &
high salaries are the likely destinations of high salaries are the likely destinations of migrants & immigrants migrants & immigrants
Favorable Climate is another pull factor.Favorable Climate is another pull factor. ““Snow Birds”Snow Birds”

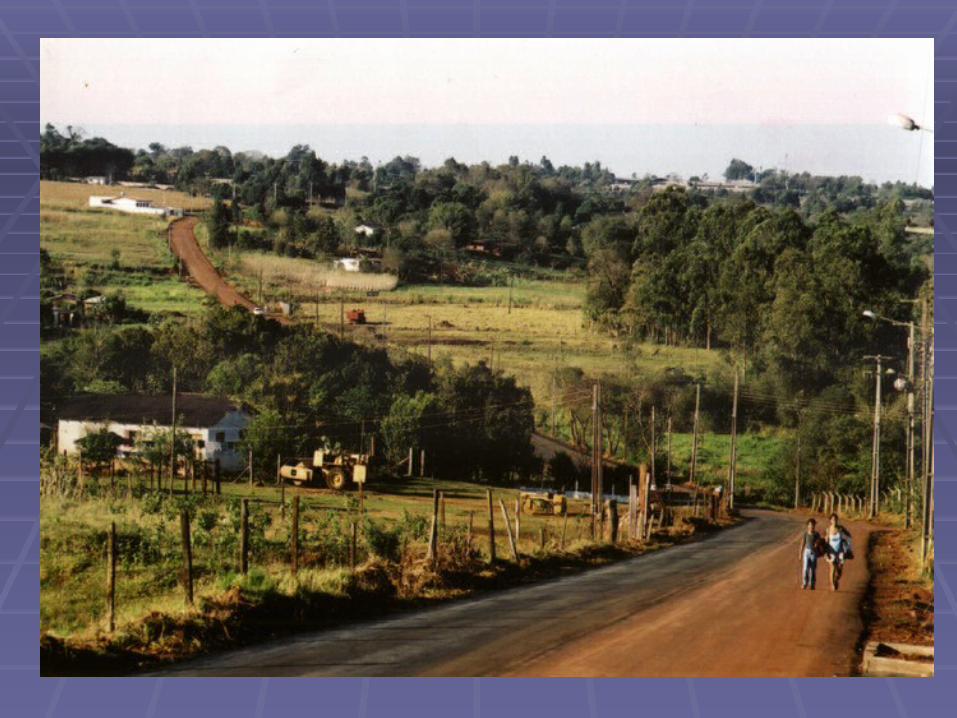
Population DensityPopulation Density
The average number of people who live in The average number of people who live in a measurable area, such as a square milea measurable area, such as a square mile
The number is reached by dividing the The number is reached by dividing the number of inhabitants in an area by the number of inhabitants in an area by the total amount of land they occupytotal amount of land they occupy
Geographers use this to understand how Geographers use this to understand how heavily populated an area isheavily populated an area is


Population DensityPopulation Density This number can be misleading for an entire This number can be misleading for an entire
nationnation Why?Why?
Example: U.S. P.D. Example: U.S. P.D. 1990 1990 AlaskaAlaska= huge land area, small population = huge land area, small population
1 person per square mile1 person per square mile
New JerseyNew Jersey= small land area, large population= small land area, large population 1,098 people per square mile1,098 people per square mile
Total U.S. Population Density = 70.3 people Total U.S. Population Density = 70.3 people per square mileper square mile

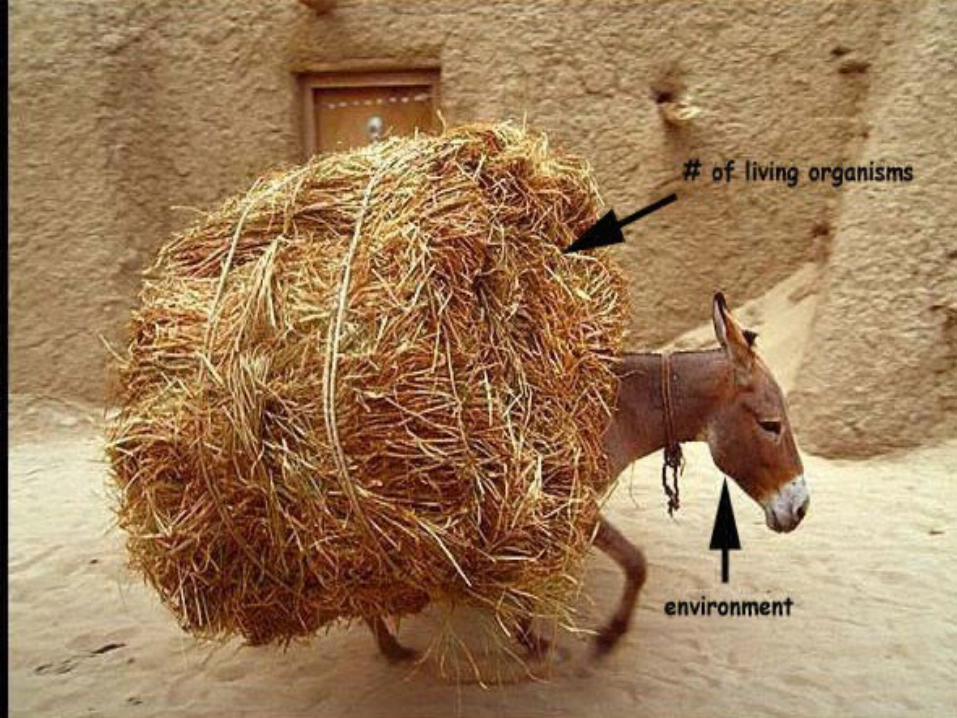
Carrying CapacityCarrying Capacity The number of individuals The number of individuals
an environment can an environment can support without significant support without significant negative impactsnegative impacts
A region with fertile land A region with fertile land may be able to support may be able to support far more people than one far more people than one with land of poor quality with land of poor quality or with little land available or with little land available for cultivationfor cultivation
TechnologyTechnology Level of technology of a Level of technology of a
group living on the land group living on the land may affect carrying may affect carrying capacitycapacity

Carrying CapacityCarrying Capacity