population size and conservation strategies for the ...€¦population size and conservation...
TRANSCRIPT

Population Size and Conservation Strategies for the Northeast Rufous Gnateater, a Threatened
Subspecies of a Relictual Atlantic Forest
Ileyne Lopes Wesley Silva
Universidade Estadual de Campinas, UNICAMP - Brazil

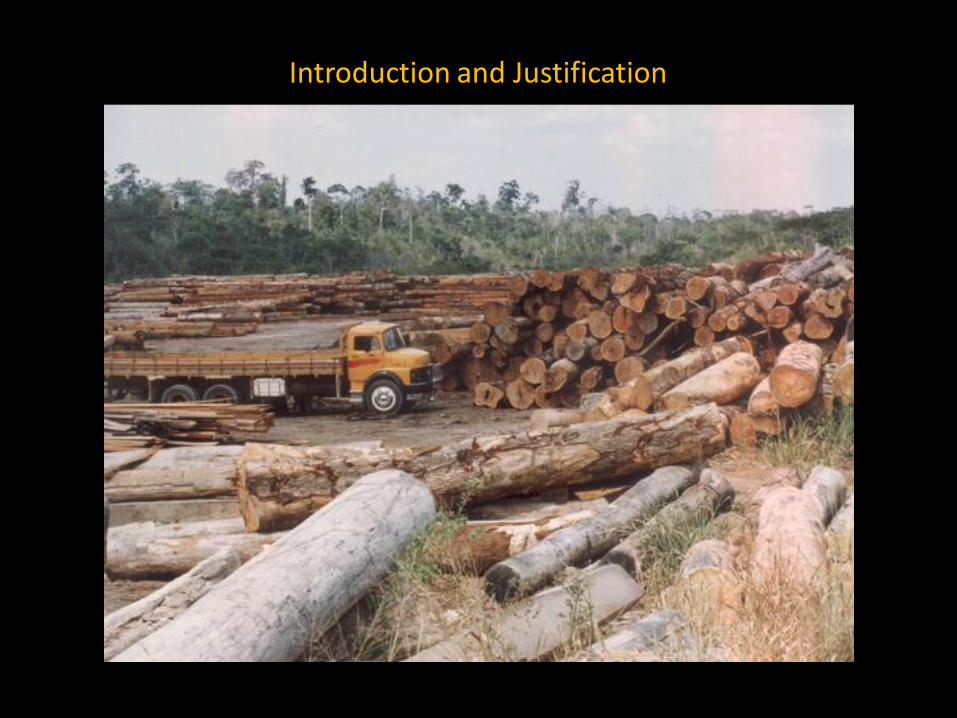
Introduction and Justification
MYERS et al., 2000 The Atlantic forest is a Hotspot of biodiversity
Introduction and Justification
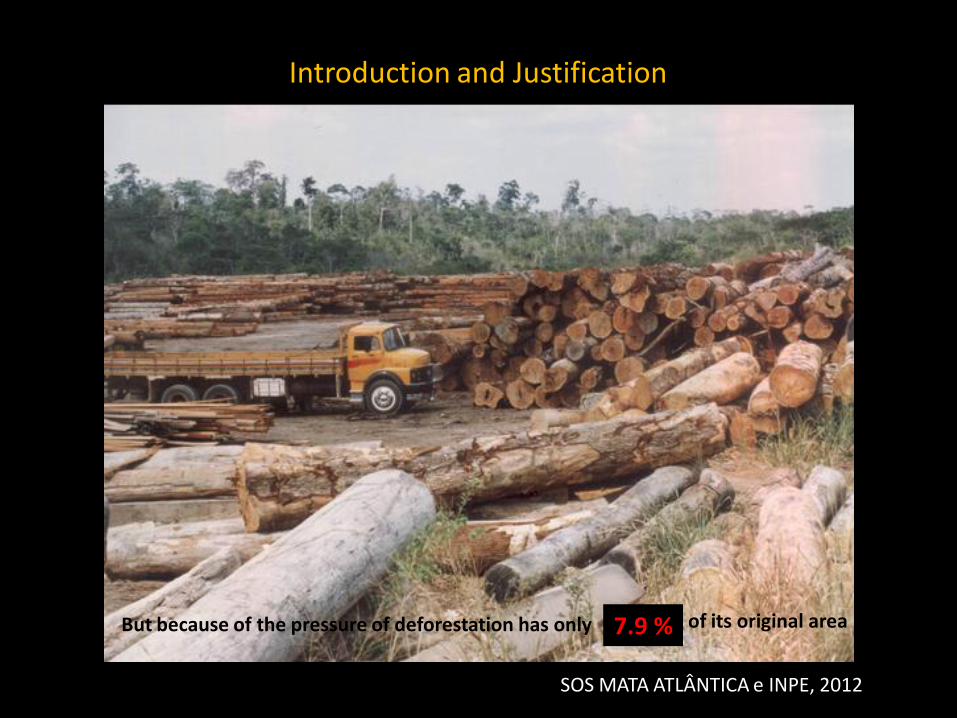
7.9 %
SOS MATA ATLÂNTICA e INPE, 2012
Introduction and Justification
But because of the pressure of deforestation has only of its original area
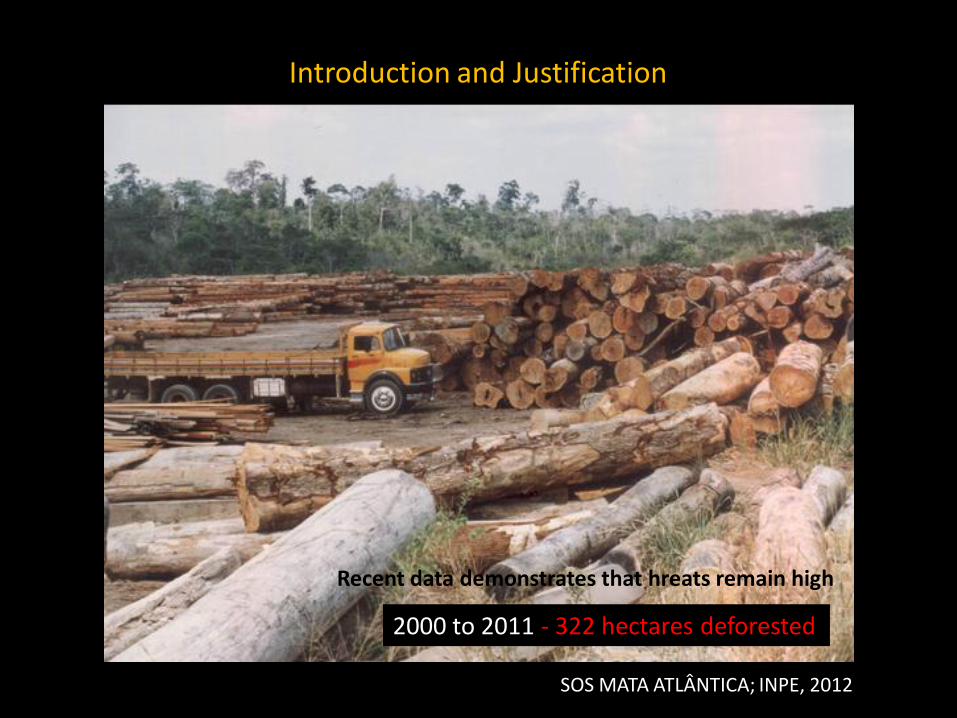
2000 to 2011 - 322 hectares deforested
SOS MATA ATLÂNTICA; INPE, 2012
Introduction and Justification
Recent data demonstrates that hreats remain high

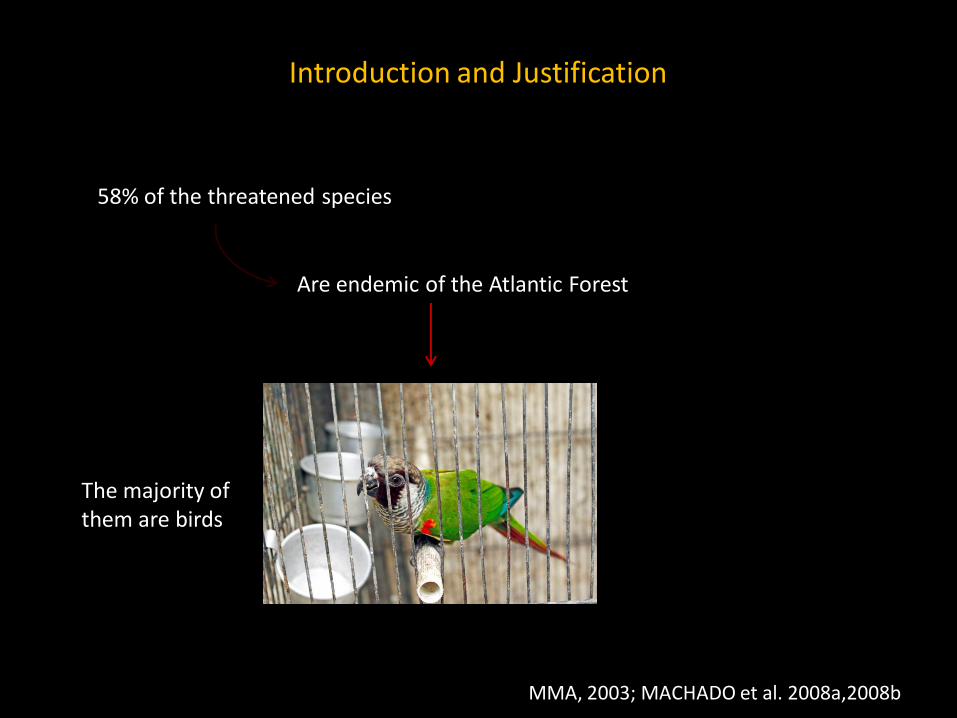
MMA, 2003; MACHADO et al. 2008a,2008b
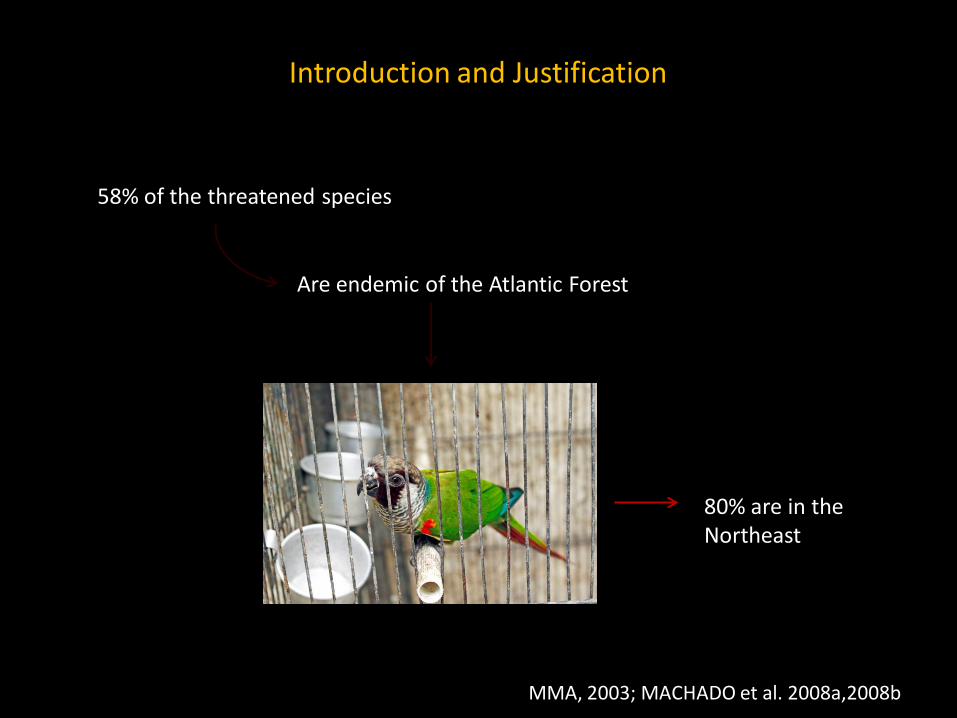
58% of the threatened species
Are endemic of the Atlantic Forest
Introduction and Justification
In Brazilian redlist
MMA, 2003; MACHADO et al. 2008a,2008b
Are endemic of the Atlantic Forest
Introduction and Justification
58% of the threatened species
The majority of them are birds
MMA, 2003; MACHADO et al. 2008a,2008b
Are endemic of the Atlantic Forest
80% are in the Northeast
Introduction and Justification
58% of the threatened species
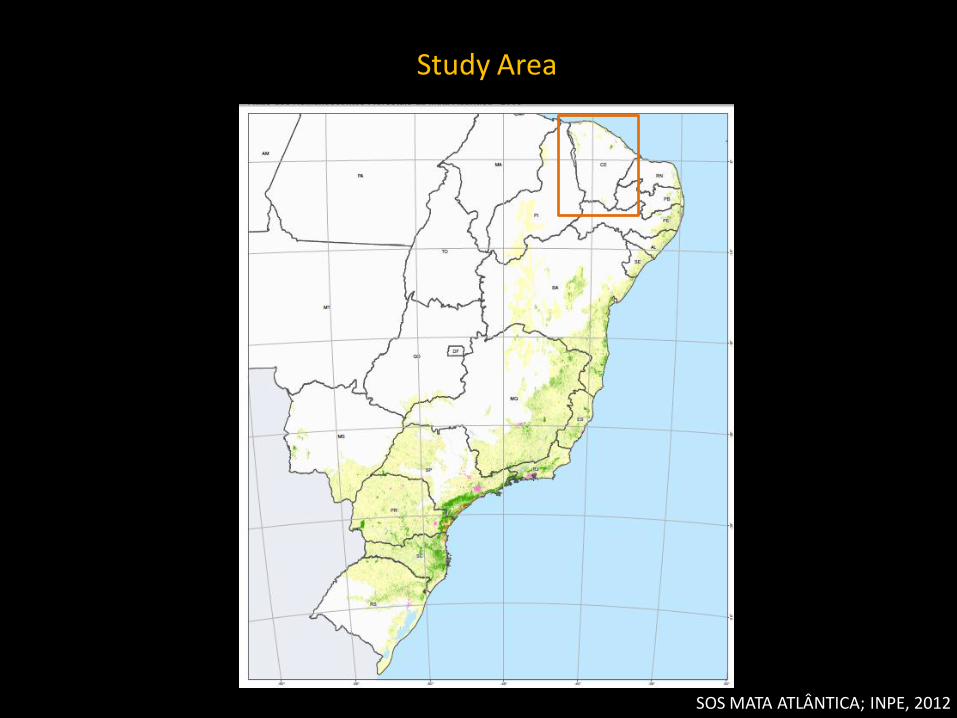
Study Area
SOS MATA ATLÂNTICA; INPE, 2012
SOS MATA ATLÂNTICA; INPE, 2012
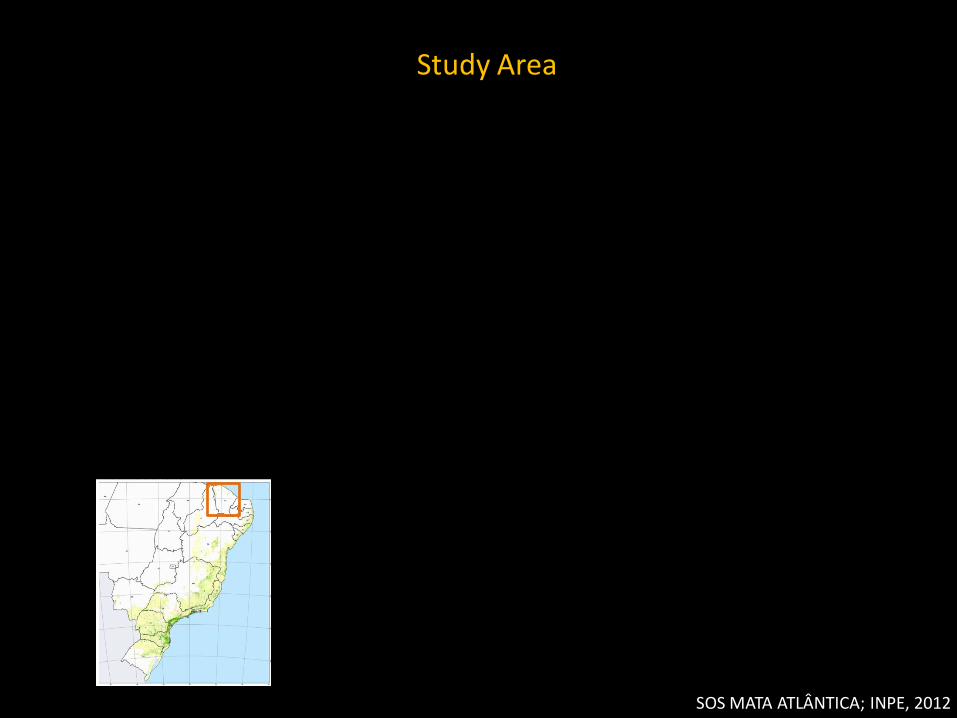
Study Area
SOS MATA ATLÂNTICA; INPE, 2012
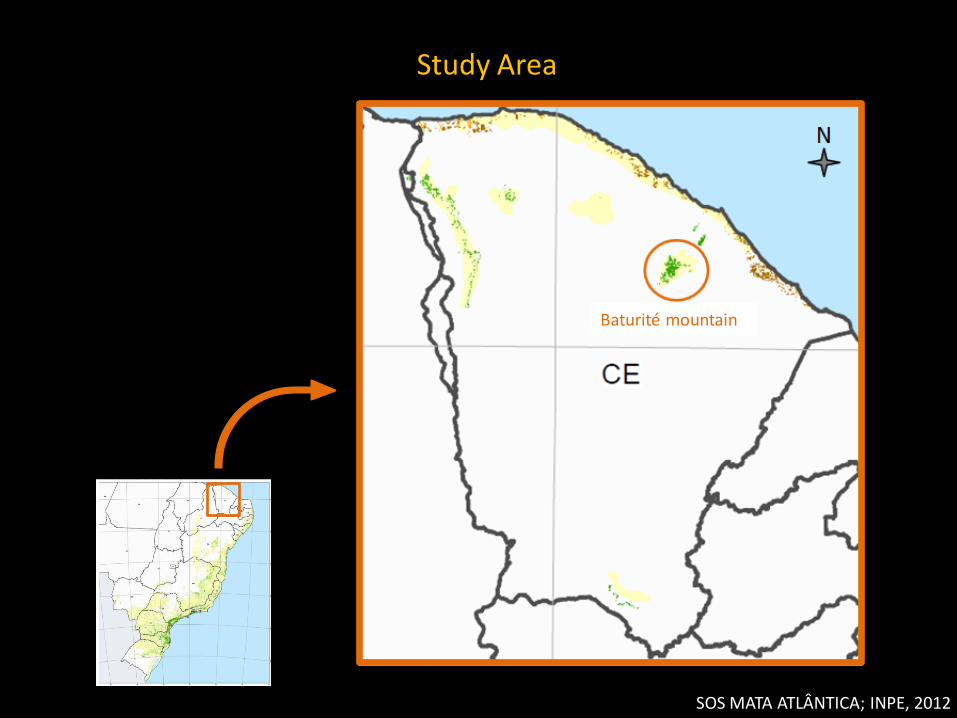
Study Area
Baturité mountain
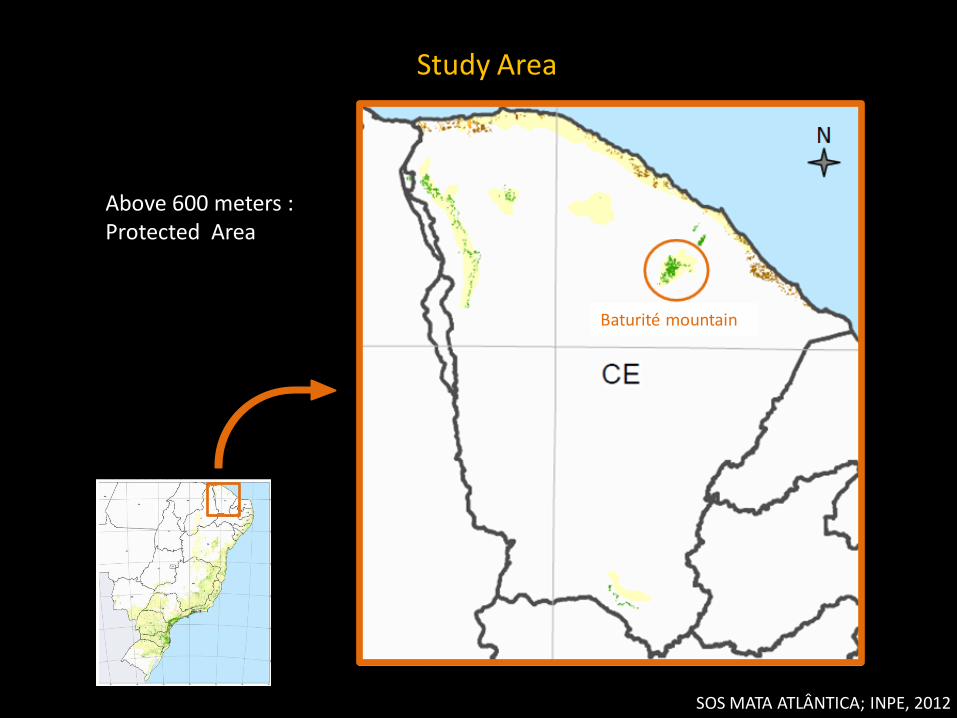
SOS MATA ATLÂNTICA; INPE, 2012
Study Area
Baturité mountain
Above 600 meters : Protected Area
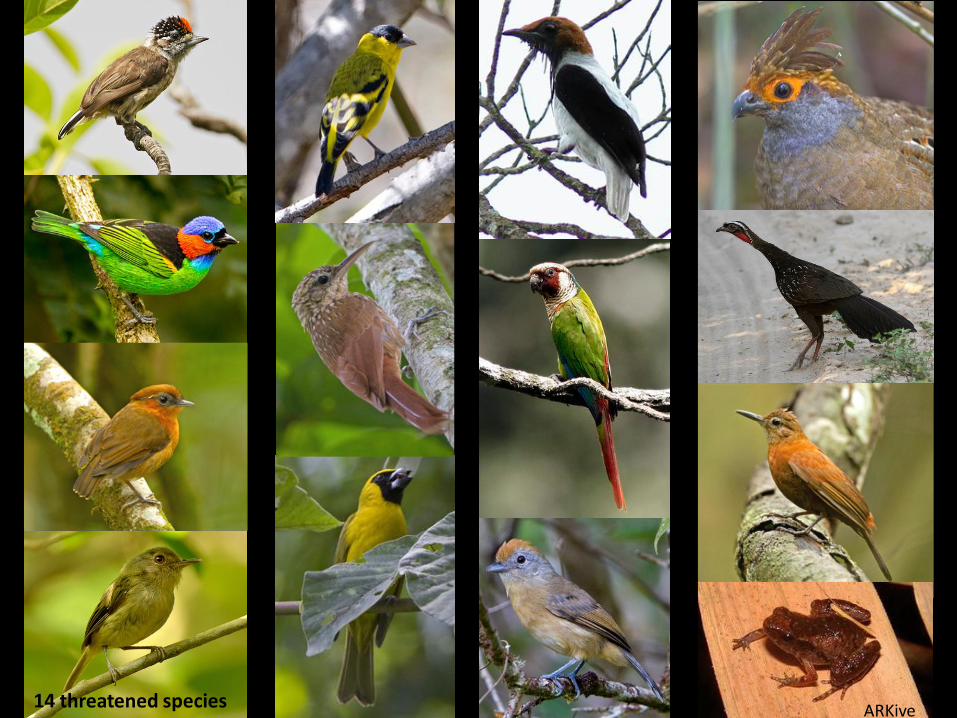
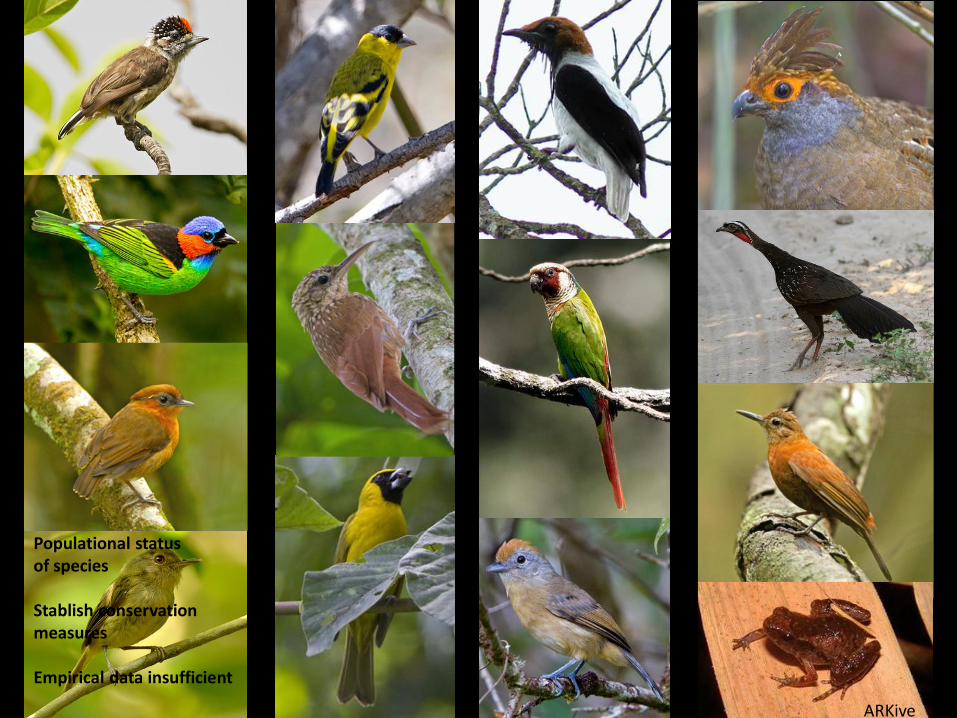
14 threatened species ARKive
ARKive
Populational status of species Stablish conservation measures Empirical data insufficient
ARKive

BROOKS et al., 1999; MMA, 2003
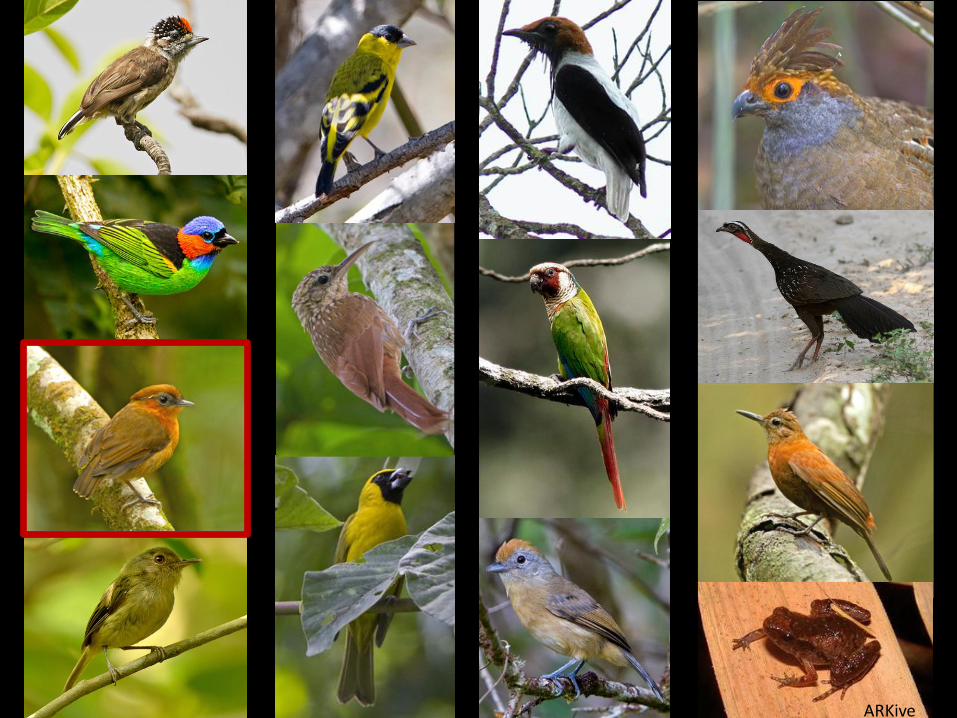
Northeast Rufous Gnateater Conopophaga lineata cearae
Vulnerable
Endemic
Territorial and forest habits
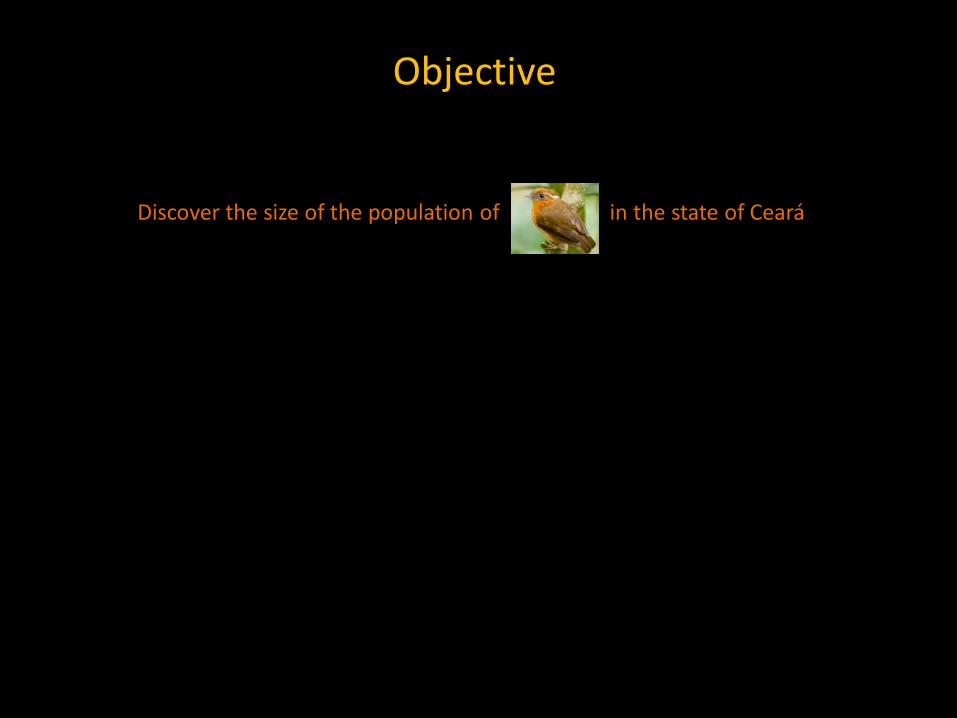
Discover the size of the population of in the state of Ceará
Objective
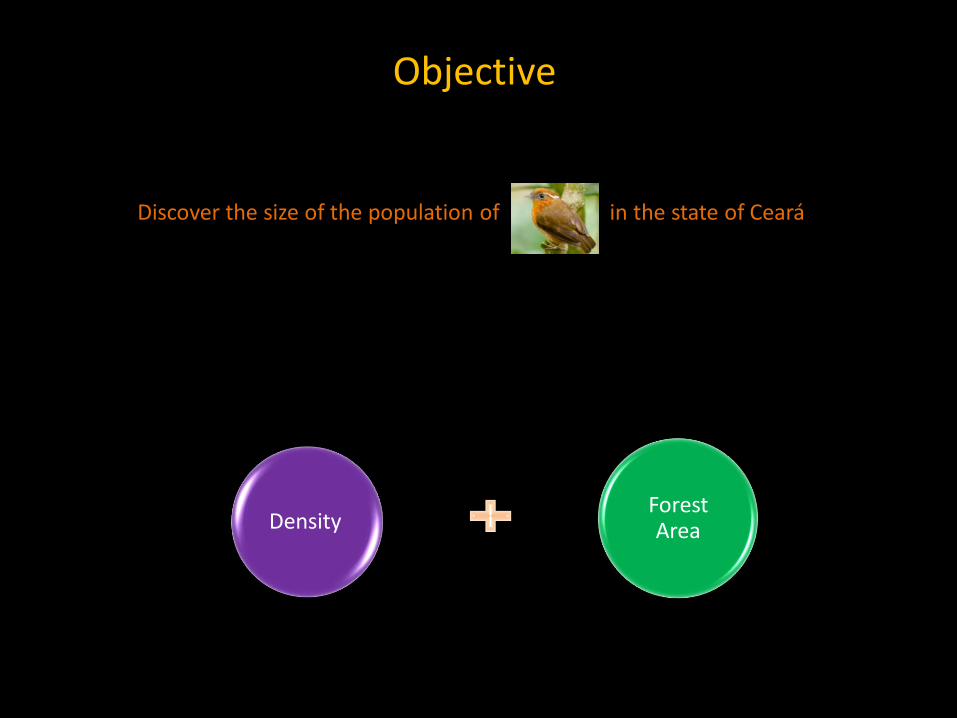
Density Forest Area
Discover the size of the population of in the state of Ceará
Objective
Density Forest Area
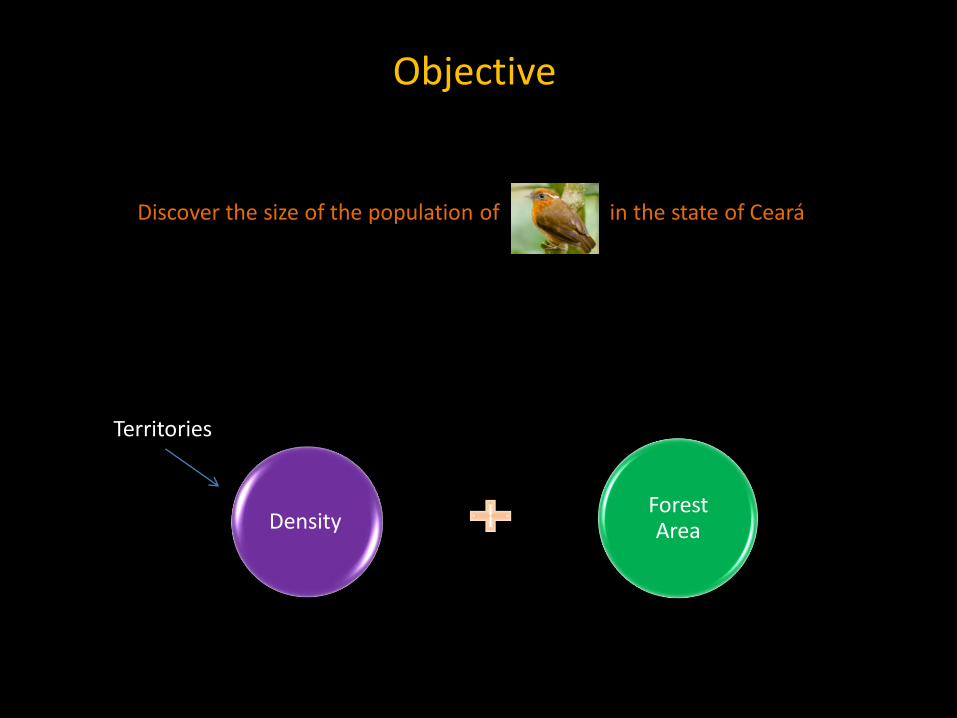
Discover the size of the population of in the state of Ceará
Objective
Territories
Density Forest Area
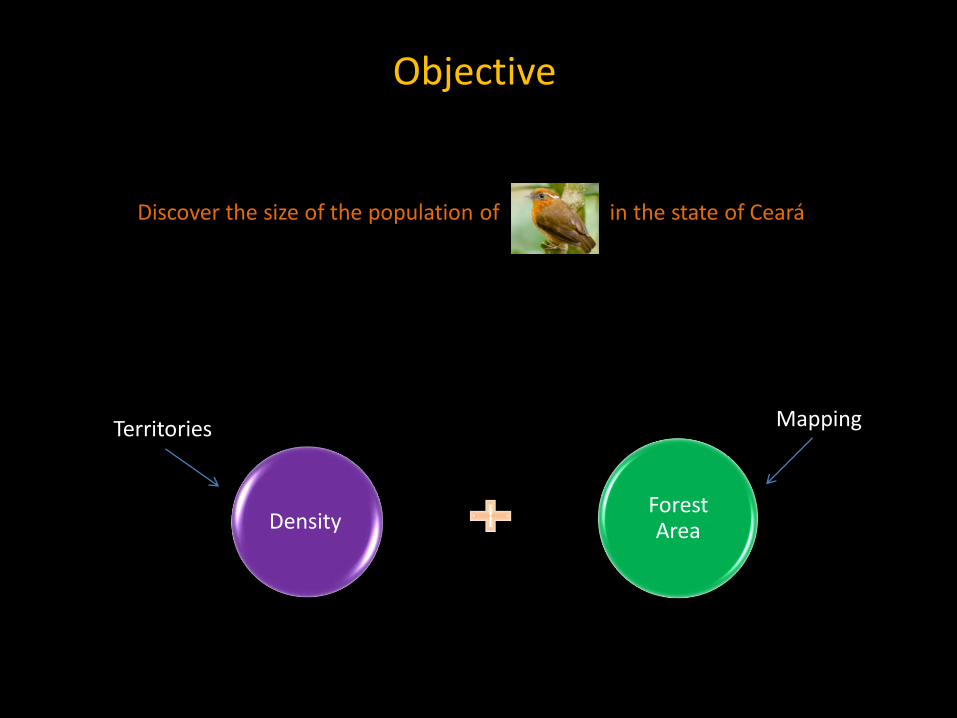
Discover the size of the population of in the state of Ceará
Objective
Territories Mapping
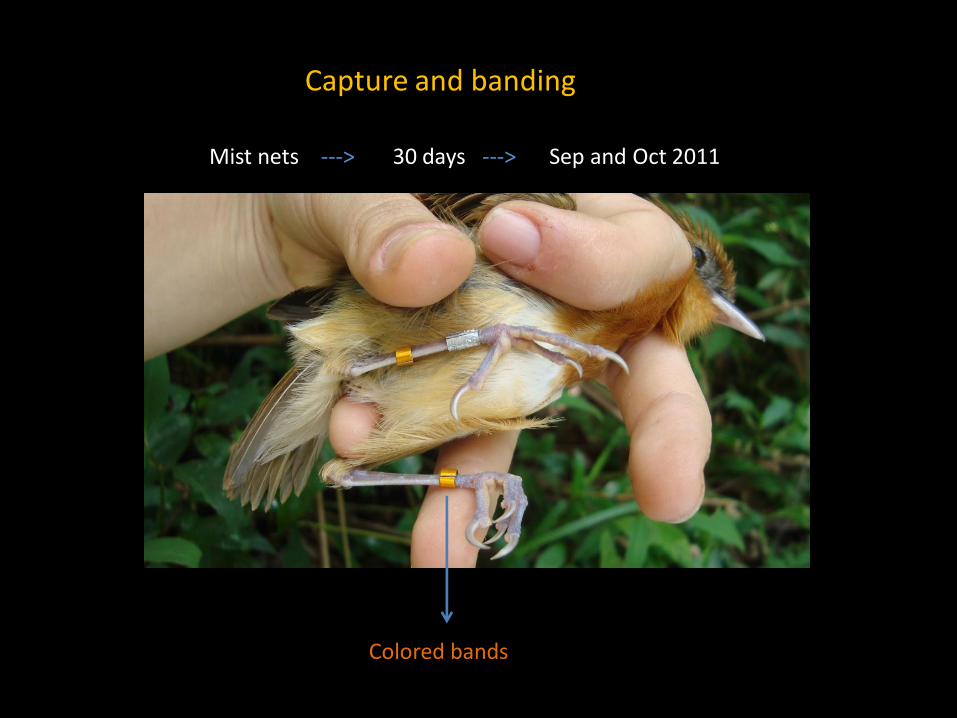
Capture and banding
Colored bands
Mist nets ---> 30 days ---> Sep and Oct 2011
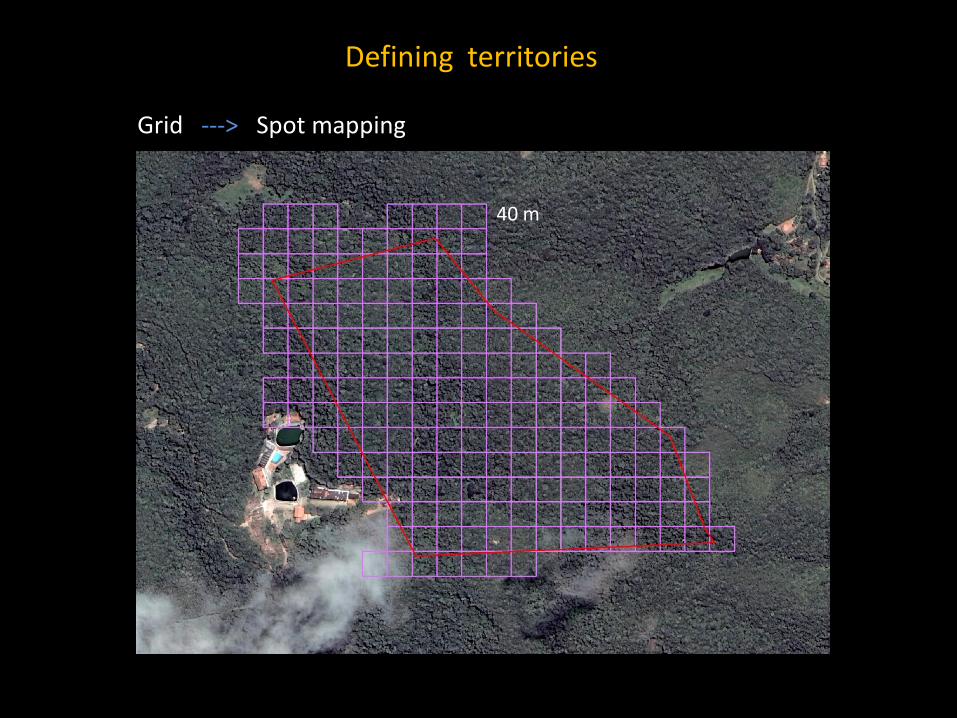
Defining territories
40 m
Grid ---> Spot mapping

Dec 2011 to Aug 2012
Defining territories
6 visits

Banded
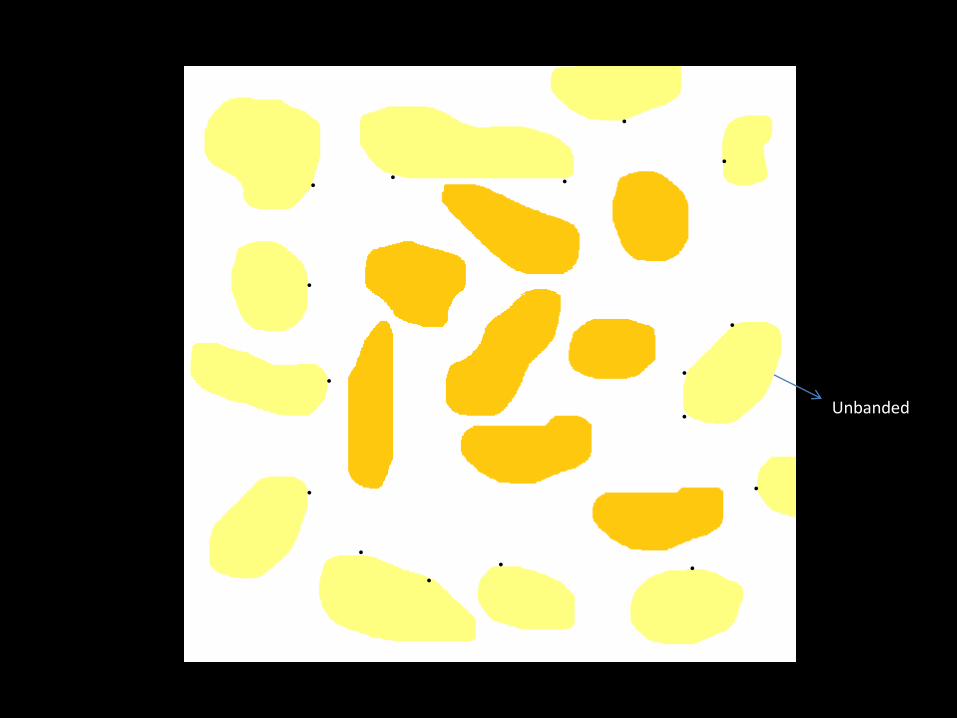
Unbanded

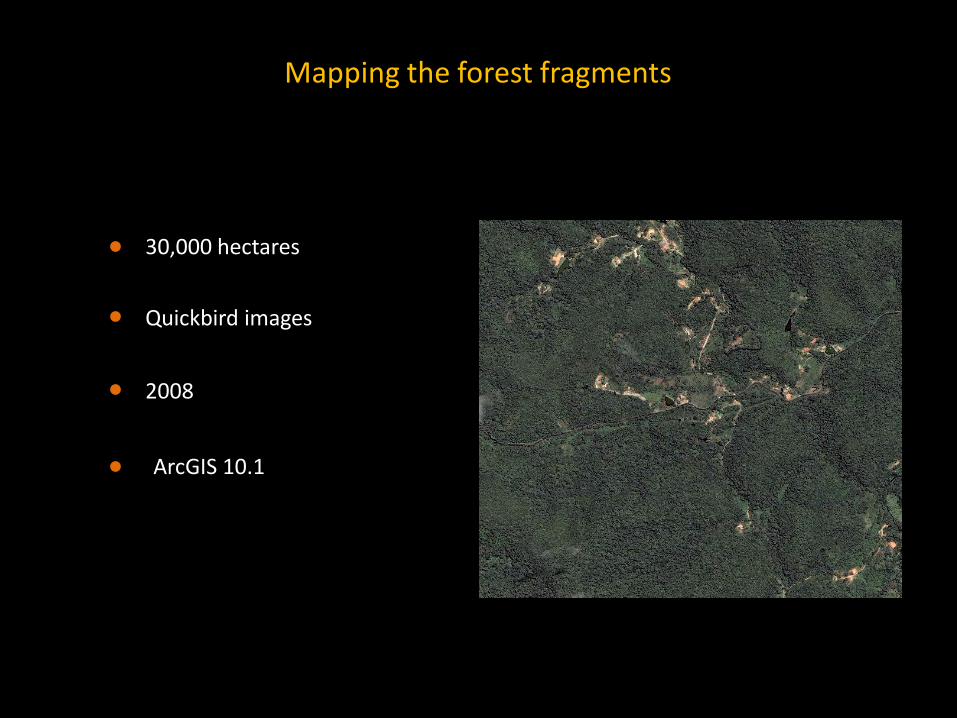
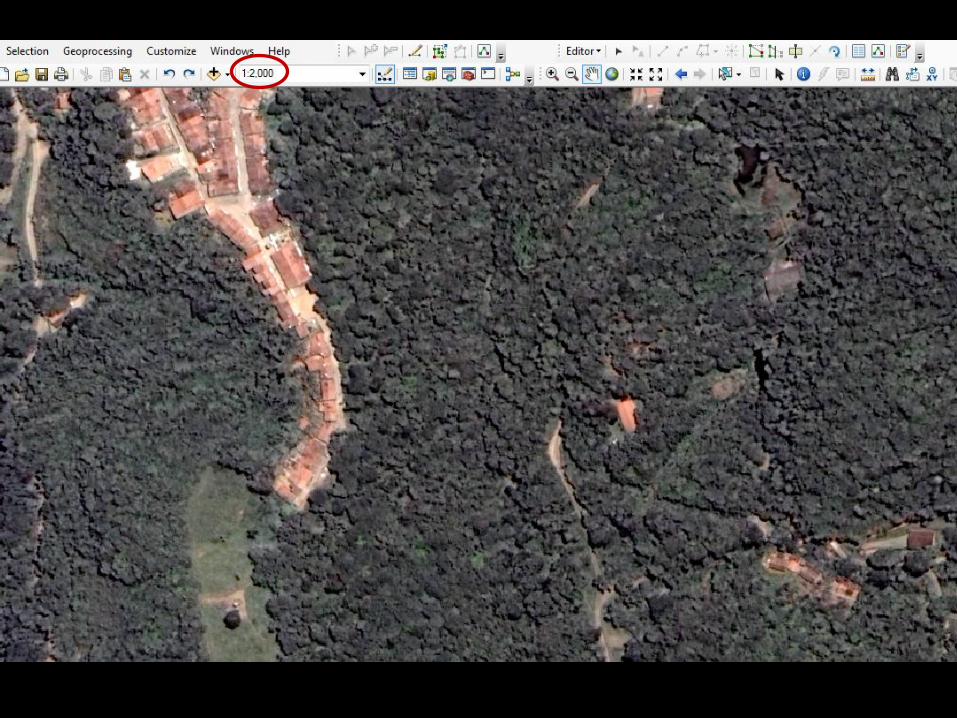
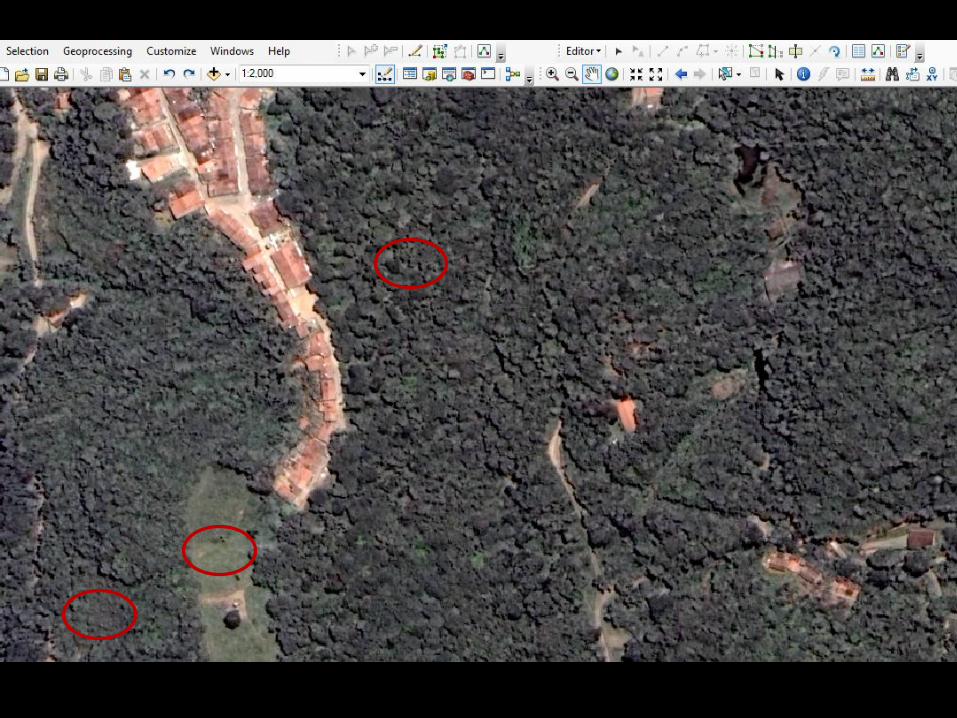
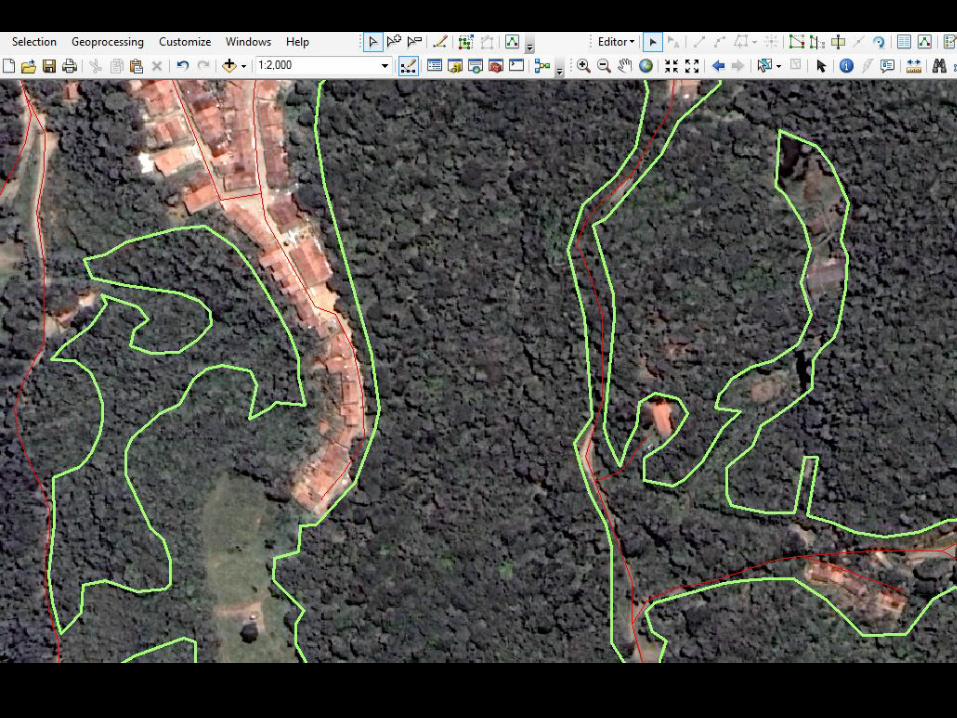
Mapping the forest fragments
ArcGIS 10.1
30,000 hectares
2008
Quickbird images
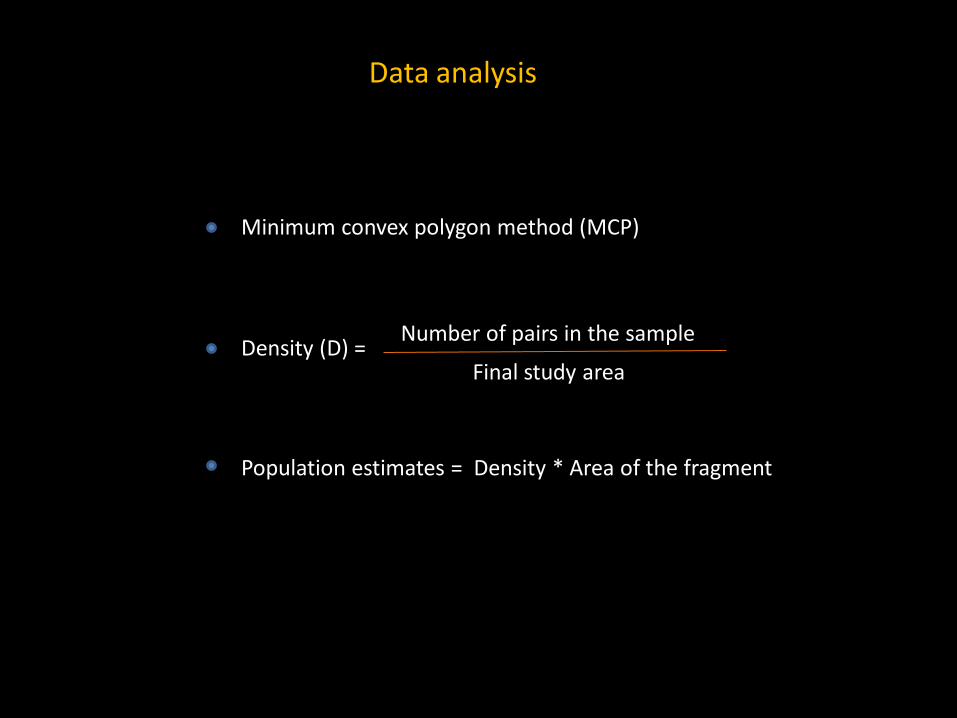
Data analysis
Minimum convex polygon method (MCP)
Density (D) = Final study area
Population estimates = Density * Area of the fragment
Number of pairs in the sample
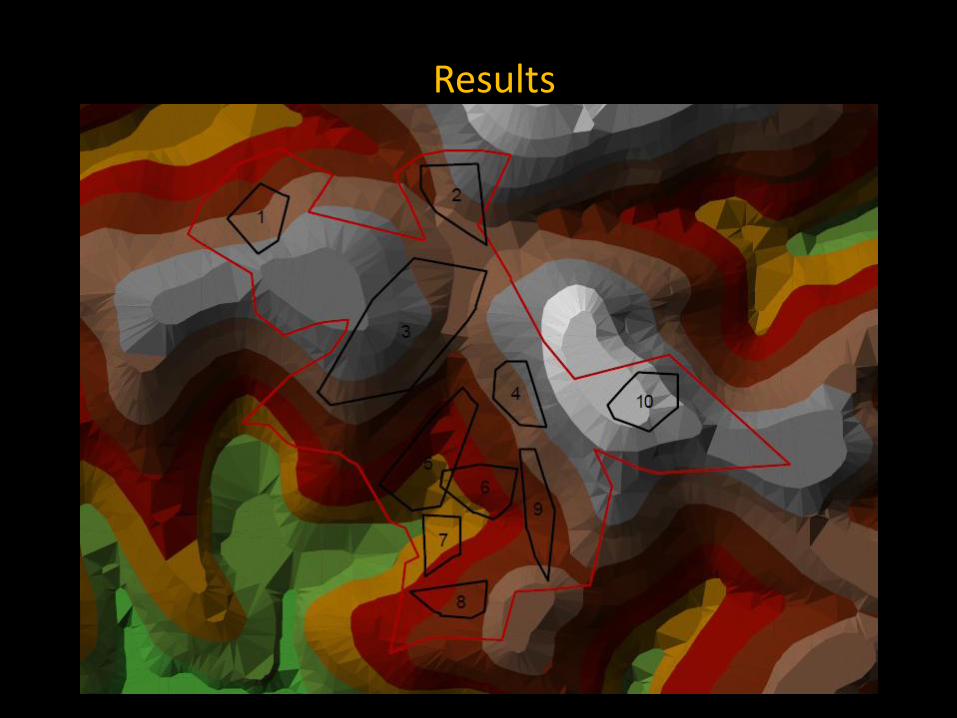
Results
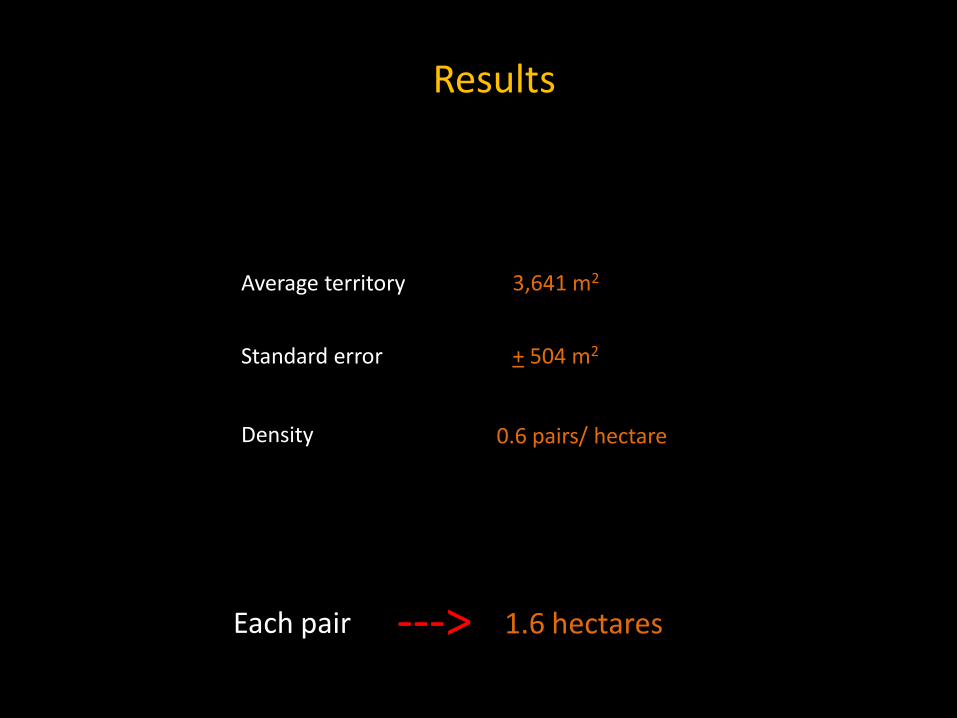
Average territory
0.6 pairs/ hectare Density
3,641 m2
Standard error + 504 m2
Results
Each pair 1.6 hectares --->

T. caerulescens
P. leucoptera
D. mentalis
12,2 g 20,6 g 26,5 g
0,7 ha 1,0 ha 1,3 ha
DUCA et al., 2006; LIMA, 2008
24 g
1,6 ha
18 g
2,0 ha
C. lineata cearae
C. melanops
Thamnophilidae
Conopophagidae
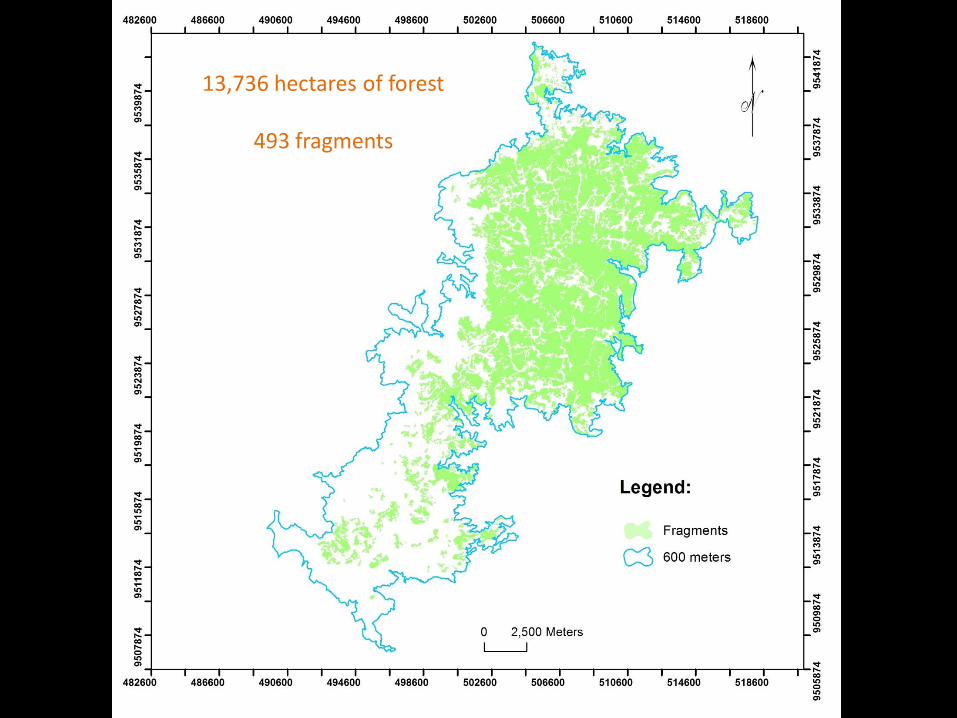
13,736 hectares of forest
493 fragments

Cities
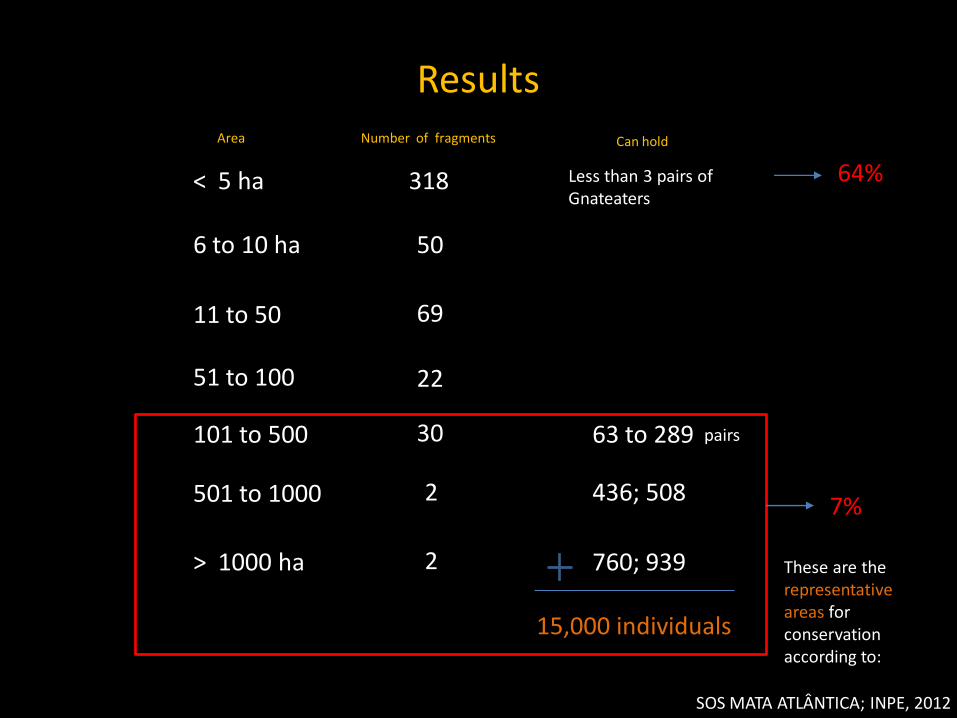
6 to 10 ha
11 to 50
51 to 100
101 to 500
501 to 1000
> 1000 ha
69
22
30
2
2
< 5 ha 318
50
64%
7%
Results
63 to 289
436; 508
760; 939
Less than 3 pairs of Gnateaters
15,000 individuals
SOS MATA ATLÂNTICA; INPE, 2012
Number of fragments Area Can hold
pairs
These are the representative areas for conservation according to:
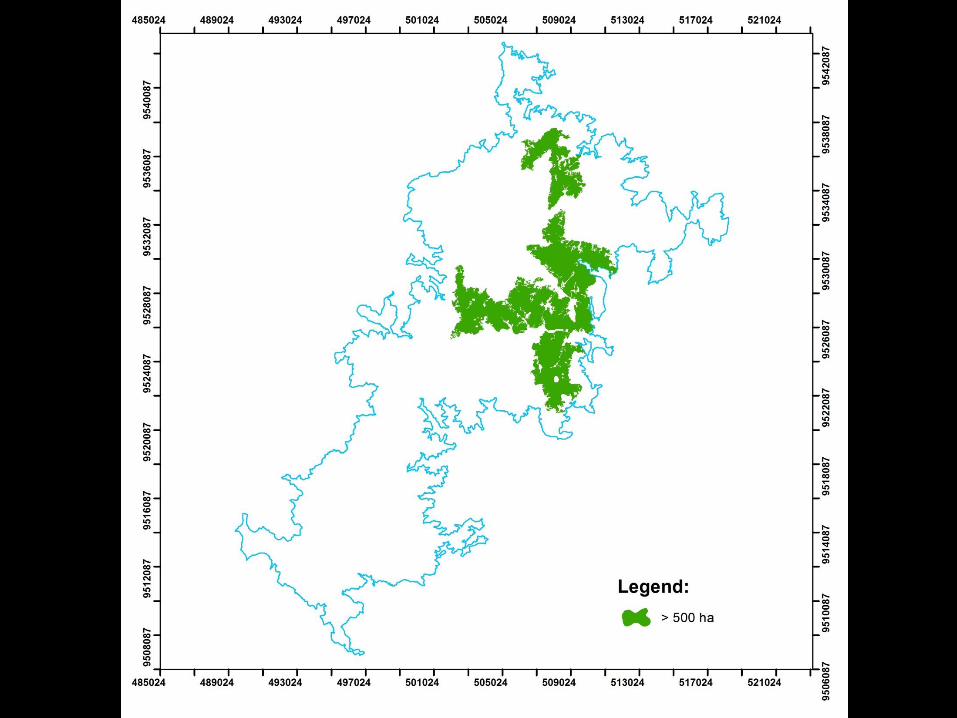
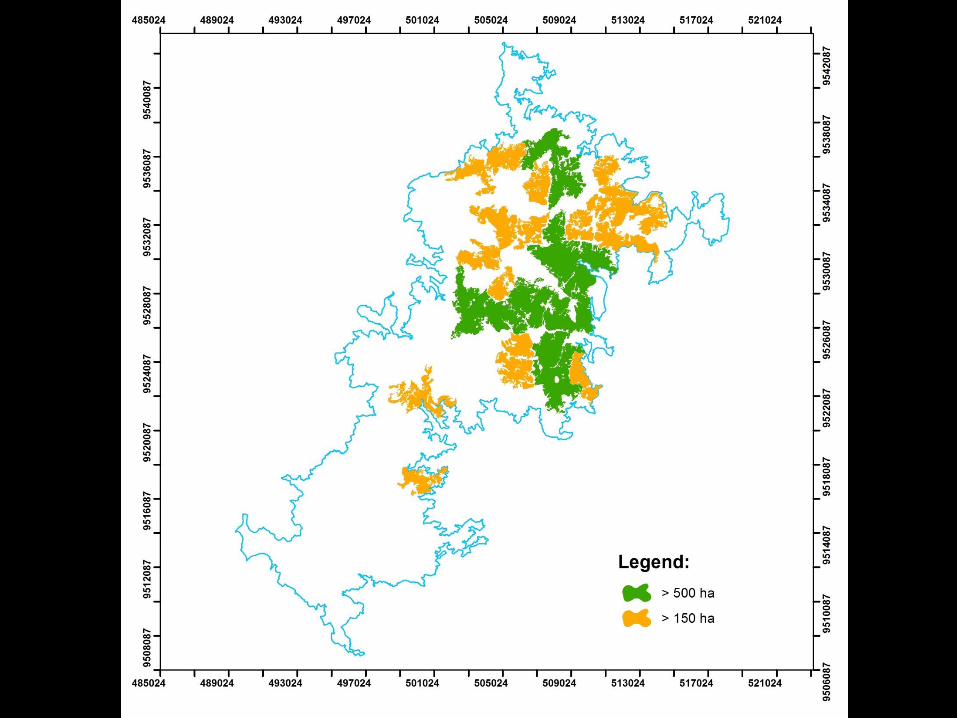
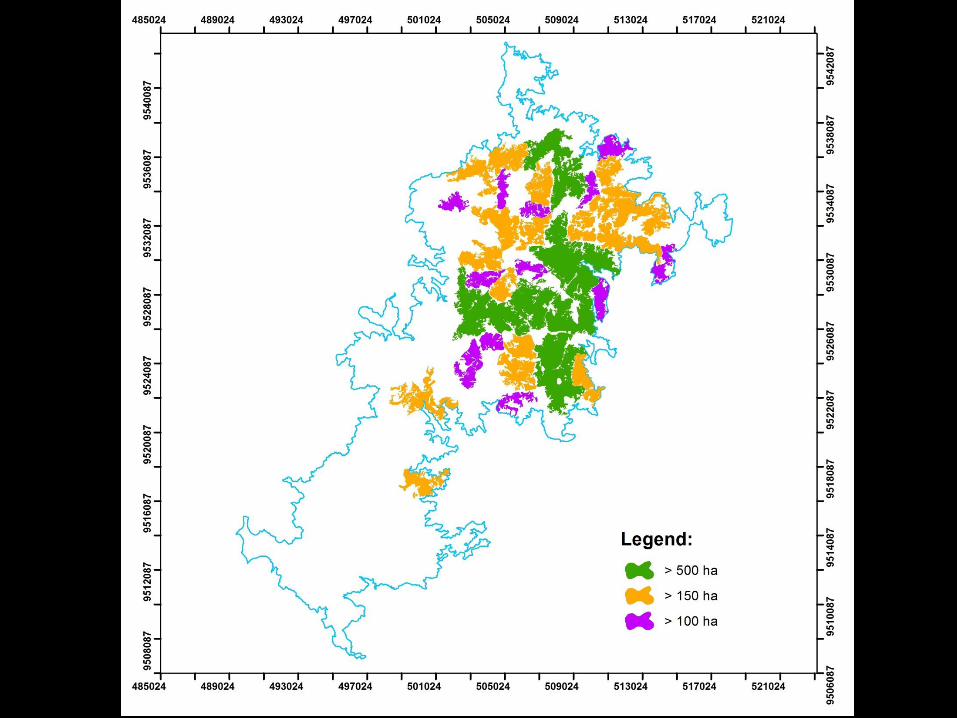
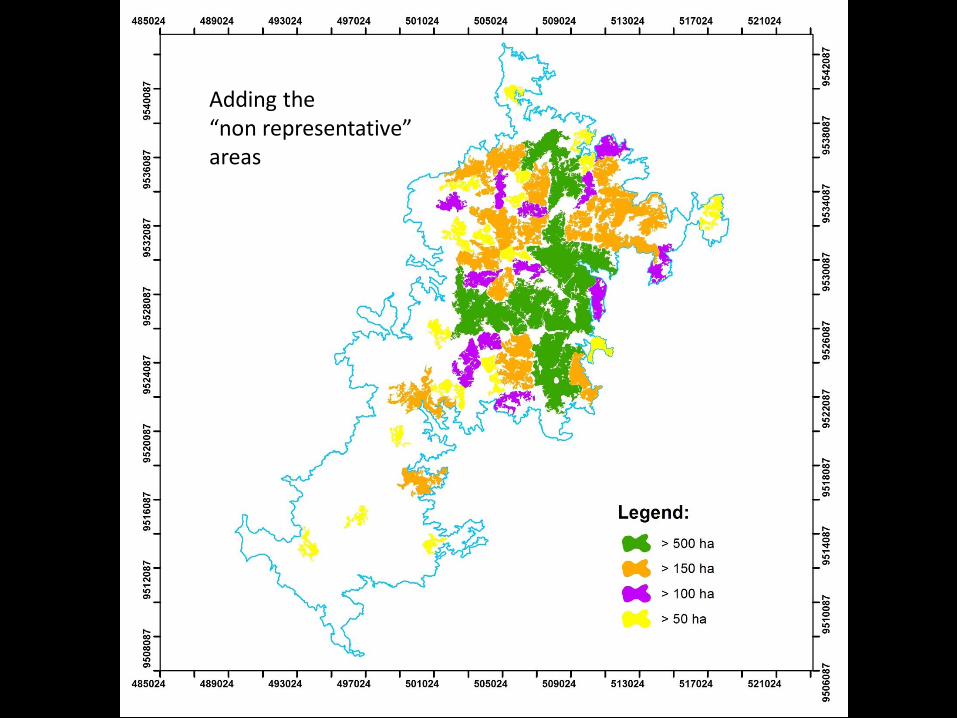
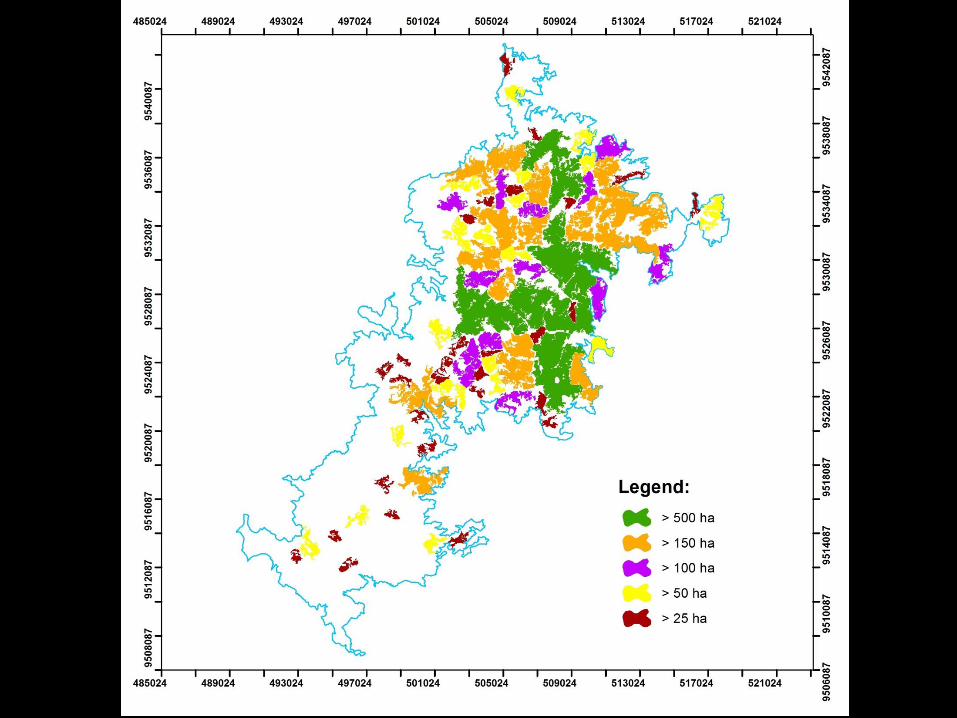
Adding the “non representative” areas
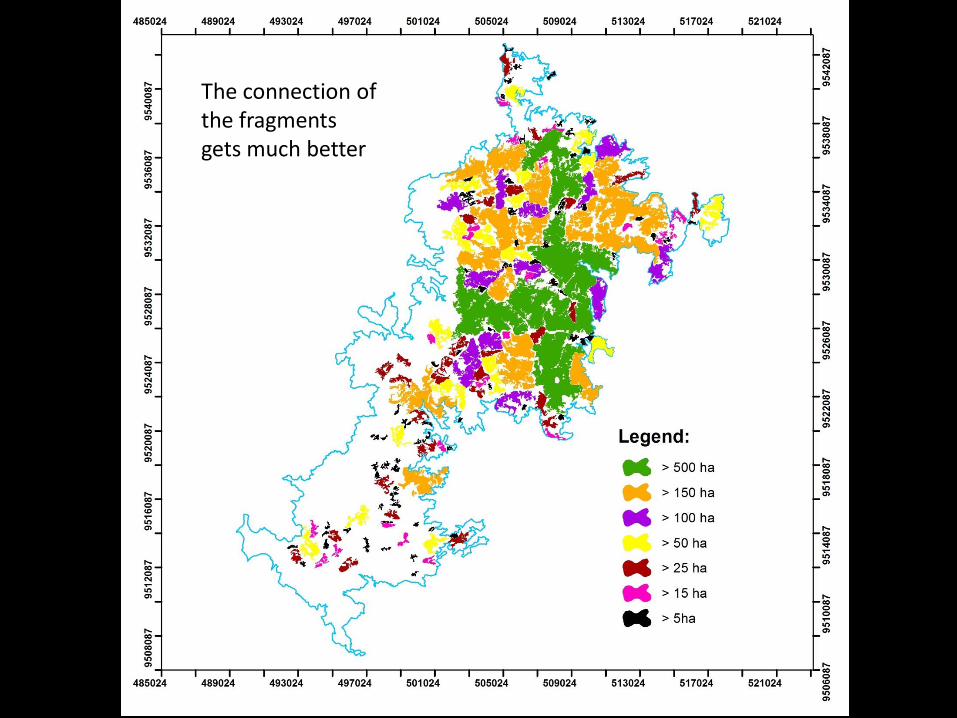
The connection of the fragments gets much better
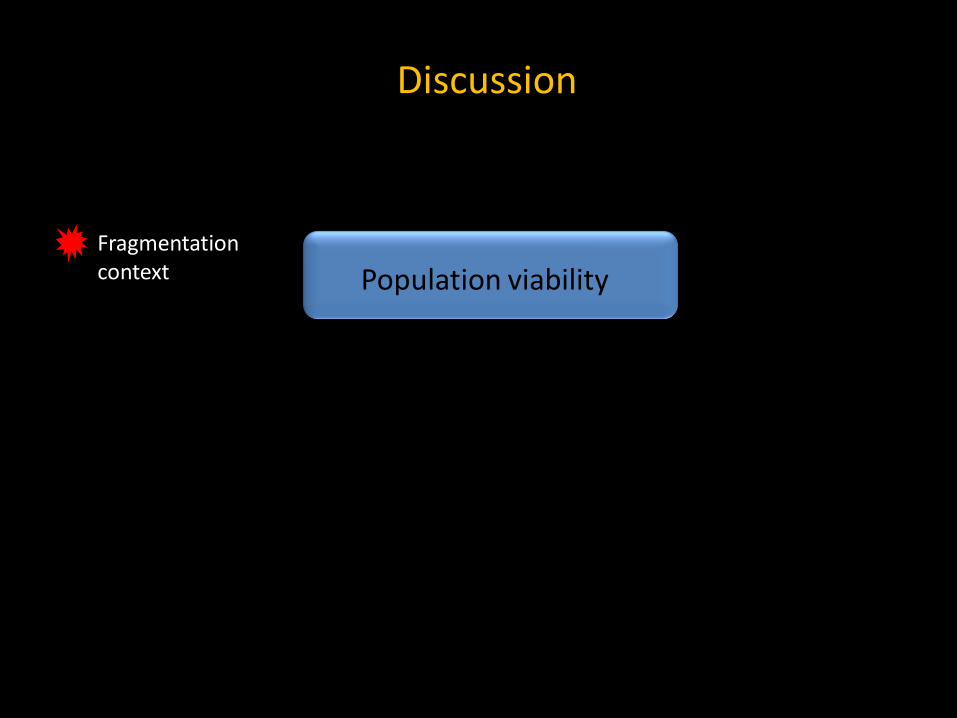
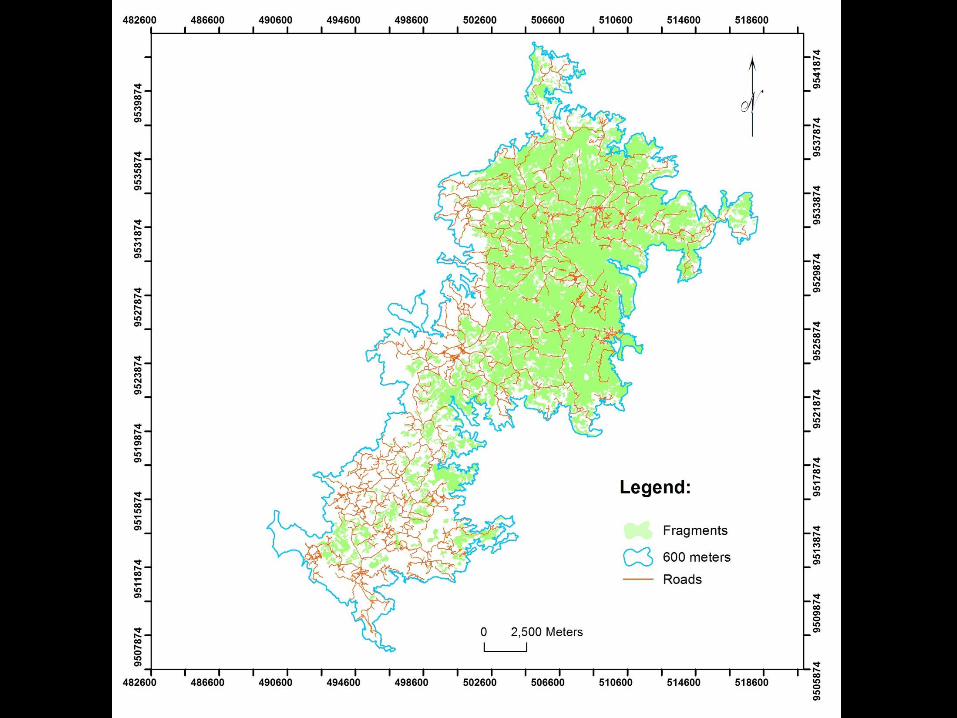
Discussion
Fragmentation context Population viability
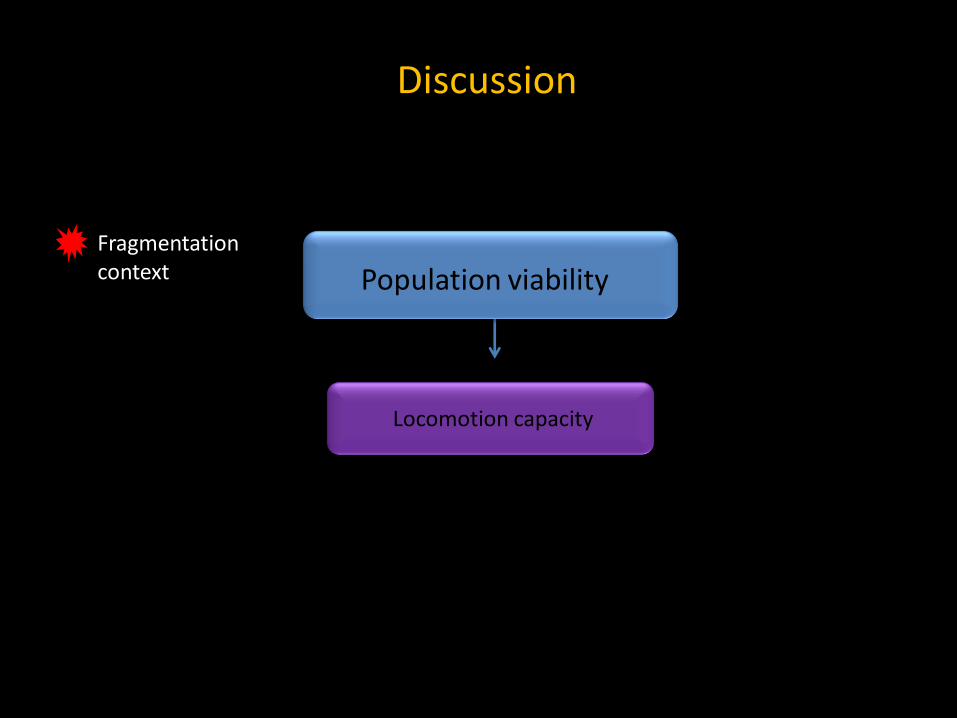
Locomotion capacity
Permeabilidade da matriz
Discussion
Fragmentation context Population viability

Matrix permeability
Locomotion capacity
Discussion
Fragmentation context Population viability
Improving matrix permeability is a crucial conservation strategy

We expect that our results can influence the decision-making process to implement the permeability of the landscape through project of :
Planting seedlings

Agroforest systems

Environmental education of landowners

and their children
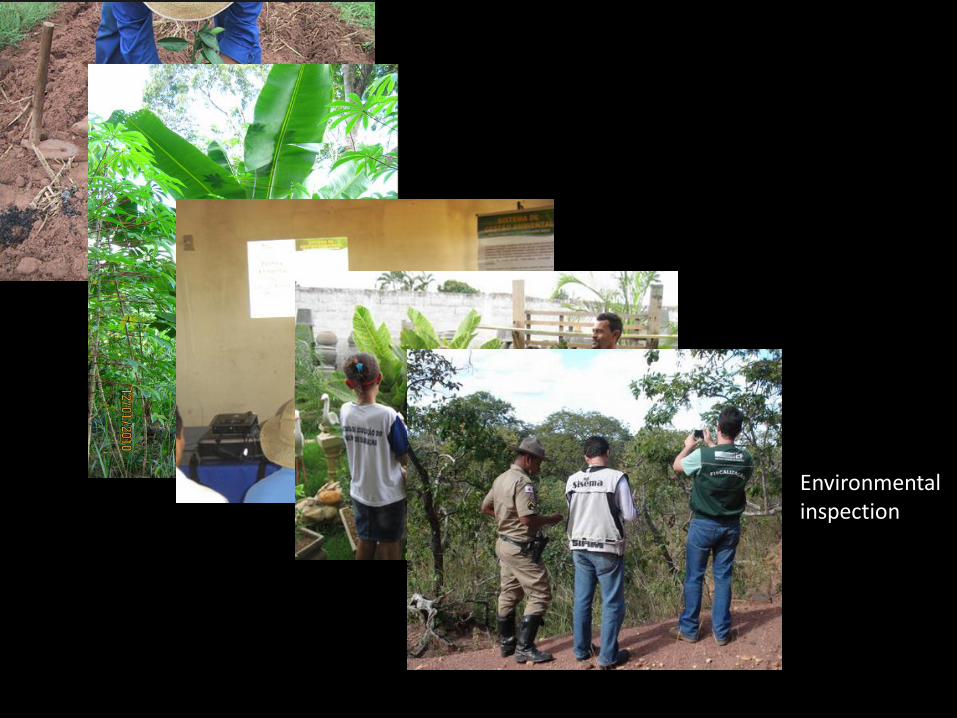
Environmental inspection
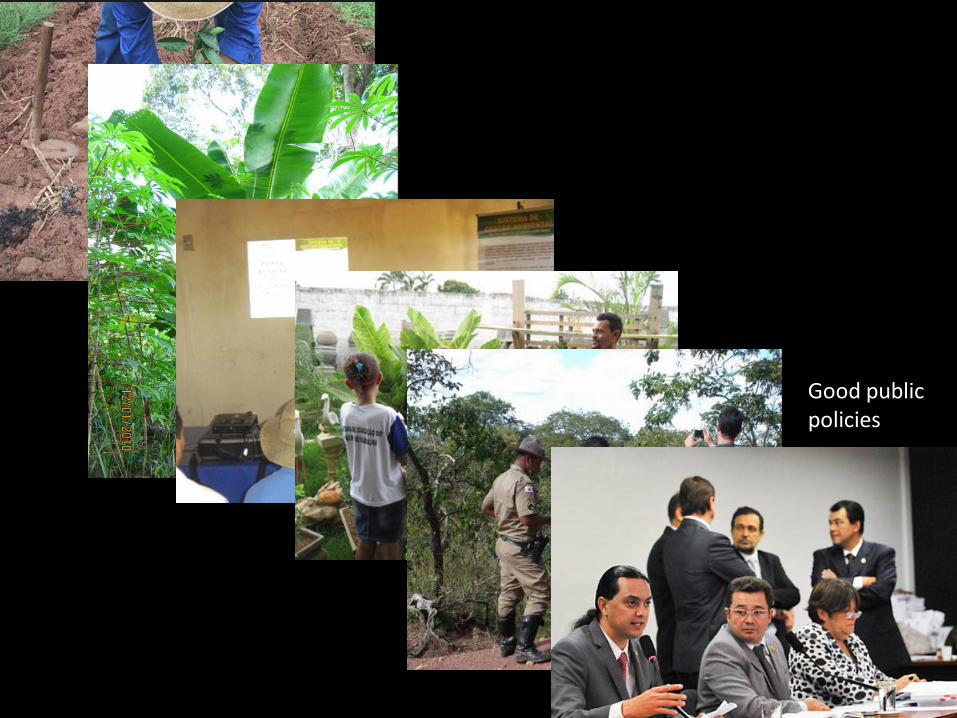
Good public policies

References:
BROOKS, T.; TOBIAS, J.; BALMFORD, A. Deforestation and bird extinctions in the Atlantic forest. Animal Conservation, v. 2, p. 211–222, 1999. DUCA, C.; GUERRA, T.J.; MARINI, M.A. Territory size of three Antbirds (Aves, Passeriformes) in an Atlantic Forest fragment in southeastern Brazil. Revista Brasileira de Zoologia, v. 23, n. 3, p. 692-698, 2006. IUCN. The IUCN Red List of Threatened Species. Version 2012.2 <http://www.iucnredlist.org>. 2012. KENDEIGH, S. C. Measurement of Bird Populations. Ecological Monographs, Illinois, v. 14, n. 1, p. 67-106, 1944. LIMA, A. M. X. Dinâmica populacional de aves de sub-bosque na Floresta Atlântica do Paraná. Dissertação de mestrado, UFPR, 2008. MACHADO, A. B. M.; DRUMMOND, G. M.; PAGLIA, A. P. (Eds.) Livro Vermelho da fauna brasileira ameaçada de extinção. Fundação Biodiversitas, MMA, Brasília, v. 1, 2008a. MACHADO, A. B. M.; DRUMMOND, G. M.; PAGLIA, A. P. (Eds.) Livro Vermelho da fauna brasileira ameaçada de extinção. Fundação Biodiversitas, MMA, Brasília, v. 2, 2008b. MYERS, N.; MITTERMEIER, R. A.; MITTERMEIER, C. G.; FONSECA, G. A. B.; KENT, J. Biodiversity hotspots for conservation priorities. Nature, v. 403, p. 853-858, 2000. SOS MATA ATLÂNTICA; INPE. Atlas dos remanescentes florestais da Mata Atlântica, período 2010 - 2011. Fundação SOS Mata Atlântica e Instituto Nacional de Pesquisas Espaciais, São Paulo, 2012. <http://www.sosma.org.br/5697/sos-mata-atlantica-e-inpe-divulgam-dados-do-atlas-dos-remanescentes-florestais-da-mata-atlantica-no-periodo-de-2010-a-2011/>. http://www.arkive.org/adelophryne/adelophryne-baturitensis/#src=portletV3api

Acknowledgments:
Thank you!!