population-level evaluation of the appropriateness of end
TRANSCRIPT
Dissertation submitted in the fulfilment
of the requirements to obtain the
PhD-degree in Social Health Sciences
Faculty of Medicine and Pharmacy
Vrije Universiteit Brussel (VUB)
Robrecht De Schreye
2019-2020
Population-level evaluation
of the appropriateness of
end-of-life care in Belgium
Promotor: Prof. Dr. Joachim Cohen
Co-promotor: Prof. Dr. Luc Deliens
Prof. Dr. Tinne Smets
End-of-Life Care Research Group
Vrije Universiteit Brussel (VUB)
and Ghent University

2
Non-judgment illuminates deep phenomena
- a quote generated by wisdomofchopra.com, on 08-08-2020
3
Table of Contents
Table of contents 3
Dankwoord 7
List of abbreviations 10
Chapter 1: Introduction 11
1. Importance of appropriate end-of-life care 12
2. Concerns for inappropriate end-of-life care 13
3. Appropriateness of care as an indicator of performance of the
health care system
15
4. Using quality indicators of appropriateness and
inappropriateness of end-of-life care
17
5. Cancer, COPD and dementia 21
6. Objective and aims 22
7. Methods 24
7.1 The quality indicator development process 24
7.2 Administrative databases 26
7.3 Evaluating the appropriateness of end-of-life care in
people with cancer, dementia and COPD
30
7.4 Examining trends in the appropriateness of end-of-life
Care
31
8. Outline of this dissertation 32
PART I: Developing indicators and using big data 39
Chapter 2: Developing indicators of appropriate and
inappropriate end-of-life care in people with Alzheimer’s
disease, cancer or chronic obstructive pulmonary disease for
41

4
population-level administrative databases: A RAND/UCLA
appropriateness study.
Chapter 3: Using linked administrative and disease-specific
databases to study end-of-life care on a population level.
69
PART II: Measuring quality indicators for end-of-life
care in Belgium
91
Chapter 4: Applying quality indicators for administrative
databases to evaluate end-of-life care for cancer patients in
Belgium.
93
Chapter 5: Appropriateness of end-of-life care in people dying
from COPD. Applying quality indicators on linked administrative
databases.
117
Chapter 6: Appropriateness of end-of-life care in people dying
with dementia. Applying quality indicators on linked
administrative databases.
141
Chapter 7: Trends in appropriateness of end-of-life care in
people dying from cancer, COPD or with dementia: applying
quality indicators on administrative databases.
169
PART III: General discussion 199
Chapter 8: Main findings and discussion 201
1. Quality indicator development 202
2. Using linked administrative databases to study end-of-life
care
203
3. Appropriateness of end-of-life care 204
3.1 Dying from cancer 204
3.2 Dying from COPD 205
3.3 Dying with dementia 206
4. Trends 207
5
5. Methodological strengths and limitations 209
5.1 Strengths 209
5.1.1 Using the RAND/UCLA appropriateness method to
develop new indicators
209
5.1.2 Routinely collected data to study vulnerable
populations
209
5.2 Limitations 210
5.2.1 Developing indicators with input from current
practice
210
5.2.2 Limitations specific to the selected
administrative databases
212
5.2.3 Data unavailable in the available administrative
databases
214
5.2.4 Limitations of a decedent cohort study design 215
5.2.5 Evaluating the health system from within 216
6. Discussion of the findings 218
6.1 Scientific relevance of the indicators 218
6.2 Determining standards and setting goals for quality
improvement
220
6.2.1 Goals for improvement of end-of-life care for
people dying from cancer
223
6.2.2 Goals for improvement of end-of-life care for
people dying from COPD
225
6.2.3 Goals for improvement of end-of-life care for
people dying with dementia
226
7. Implications and recommendations 228
7.1 Implications and recommendations for practice 228
7.2 Implications and recommendations for research 231

6
7.3 Implications and recommendations for policy 234
Samenvatting van de belangrijkste bevindingen 246
Curriculum vitae and list of publications 262
Appendix 266

7
Dankwoord
Dit proefschrift is de neerslag van enkele jaren werk. Van mij, maar
ook van een aantal andere mensen, van wie de inspanningen mogelijks
nog meer essentieel waren dan de mijne. Daarom wil ik hen hier
expliciet bedanken.
Joachim en Lieven, jullie hadden het oorspronkelijke idee voor dit
project, jullie hebben het initiatief genomen en het op poten gezet,
waarvoor dank.
Tinne, Joachim en Dirk, jullie hebben me dagelijks leiding gegeven,
van feedback en goede ideeën voorzien. Veel van wat in dit proefschrift
staat zijn eigenlijk jullie hersenspinsels in mijn woorden. Of zelfs
in jullie woorden, waarvoor dank.
Luc, bedankt voor de constructieve bedenkingen en het strategische
advies. Als doorgewinterde onderzoeker heb je het onderzoek op
sleutelmomenten de juiste richting gegeven. Bedankt ook voor het
oprichten en inspireren van een schitterende onderzoeksgroep, die
kwaliteit van onderzoek en ambitie hoog in het vaandel draagt.
Joachim, nog een derde maal bedankt, want jij hebt dit onderzoek altijd
weer op het goede spoor gezet. Ik heb veel geleerd van je ambitie,
doorzetting, grondige werk en intelligente commentaar.
Kathleen, veel van mijn werk bouwt voort op het jouwe. Bedankt om het
goede voorbeeld te geven in het werken met kwaliteitsindicatoren en
met expertpanels.
Arno, Kristof, we werkten de voorbije jaren samen met dezelfde
gegevens, om elk onze eigen vragen te beantwoorden. Ik heb veel geleerd

8
van jullie manier van werken: jullie analytische vaardigheden en
grondigheid probeer ik zoveel mogelijk over te nemen. We waren een
goed team en hoe langer ik met jullie samen werk, hoe meer ik jullie
gezelschap apprecieer.
Maarten, bedankt voor alle grappige, eerlijke en aangename gesprekken,
die de werksfeer menselijker maken. Het is fijn om iemand te hebben
om ook op het werk persoonlijke dingen te kunnen delen, bij een
boterham met salami of choco, een gevleugelde aardbei of een glas
estus.
Nicholas, thank you for your wise reflections. You will not learn
anything new from this thesis, as there is probably a Star Trek episode
about every topic discussed here. Thank you for your excellent
chocolate and rum, your non-eurocentric views and your door that is
always ajar.
Bedankt aan alle mede-onderzoekers van de End-of-life Care Research
Group. Voor de gezellige middagen met doorgaans intelligente
gesprekken, voor het engagement en de wil tot samenwerking die jullie
elke dag ten toon spreiden. Bedankt Anne-Lore en Lenzo voor de
gezellige avonden met de studenten.
Sarah, bedankt voor de ondersteuning thuis, de aanmoediging en het
doorzettingsvermogen. Je begrijpt de context van levenseindezorg goed,
spijtig genoeg. Door jou begrijp ik beter waar dit onderzoek over
gaat, maar je bent er ook steeds om samen na te denken of iets mooi
te delen.

9
Mijn familie, bedankt voor de gezelligheid, de positieve houding en
het klankbord om al deze wetenschappelijke bevindingen af te toetsen
aan een breder publiek.
Bedankt ook aan onze externe partners, met name Birgit, Cindy en
Patrick van respectievelijk het Intermutualistisch Agentschap, het
Kankerregister en StatBel. Dankzij jullie zeer professionele
medewerking was dit onderzoek mogelijk. Ik ben blij dat jullie mee in
dit experiment stapten en ons bijstonden met raad en daad.
Als laatste bedank ik graag alle experten die hebben meegewerkt aan
dit onderzoek, in interviews, in expertpanels, in projectgroepen.
Jullie zijn allen drukbezette mensen die de speerpunt vormen van
kwaliteitsvolle palliatieve zorg in België. Bedankt dat we een beroep
mochten doen op jullie expertise en kennis ter zake.
10
List of abbreviations
ACP Advance Care Planning
ATC Anatomical Therapeutic Chemical Classification
BCR Belgian Cancer Registry
CBSS Crossroads Bank for Social Security Crossroads
Bank for Social Security
COPD Chronic Obstructive Pulmonary Disease
ED Emergency department
ICD-10 International Statistical Classification of
Diseases and Related Health Problems
IMA Intermutualistic Agency
KCE Federaal Kenniscentrum voor de Gezondheidszorg
PDCA Plan-Do-Check-Act
PROMS Patient Reported Outcome Measures
QI Quality indicator
RIZIV National Institute for Health and Disability
Insurance
Statbel Statistics Belgium
TNM Tumour Node Metastasis
TTP Trusted Third Party
VPN
Virtual Private Network

11
Chapter 1: Introduction

12
1. Importance of appropriate end-of-life care
Worldwide, the average age across populations is rising.1,2 Life
expectancy has been dramatically increasing for over a century, with
the exception of the two world wars.1 In the last decades, the fertility
ratio has been dropping in western countries, contributing to the
increasing average age of the population.2 Medical knowledge and
medical technology are growing steadily, to a point that many once
common and deadly diseases can be treated or prevented.3 Highly
effective emergency care enables possibly life-saving interventions.
Progress in hygiene measures during medical interventions greatly
increases the success rate of most medical treatments.4 It is not
surprising that faith in medicine has increased as well. However,
there are still diseases that cannot be cured with the current medical
technology and their prevalence in the population increases. For
instance, although treatability for certain types of cancer is
increasing and survival rates are higher, the percentage of people
dying from cancer has increased across the population.5 The percentage
of people with dementia is also growing and is expected to grow the
coming decennia.6,7 There currently is no cure for Chronic Obstructive
Pulmonary Disease (COPD).8 Due to an increasingly aging population the
prevalence of these currently incurable diseases rises among the most
prevalent causes of death.5 This creates a growing subpopulation
suffering from incurable diseases in an end-of-life situation, with
no realistic hope of recovery, with often a relatively predictable
trajectory of functional decline, depending on the diseases they
suffer from.9 In this situation, care goals can gradually shift towards
an increasing emphasis on comfort care.10 As such, what is deemed
appropriate care can shift as well and previously appropriate curative
13
care may become inappropriate in the end-of-life care context.11 The
European Association for Palliative Care has expressed its concern
with the treatment of people near the end of life and estimates an
increasing number of people in need of palliative care.12 With an
increasing number of people living with incurable diseases, providing
high quality and appropriate end-of-life care grows in importance.10,13
What is appropriate end-of-life care?
Appropriate end-of-life care has been defined as ‘treatment and/or
medication for which the expected health benefit (i.e. improved
quality of life, increased life expectancy, pain relief, improvement
of functional status) exceeds possible negative outcomes (i.e.
mortality, decrease in quality of life, pain, symptom burden)’.11,14
Inappropriate end-of-life care, then, is the opposite, where the
benefits do not exceed possible negative outcomes. Examples of
inappropriate end-of-life care could include unwanted transfer to
hospital close to death, people not dying in their preferred place,
aggressive life-prolonging treatments that have a negative effect on
the patient's quality of life and receiving medication close to death
that should only be used for long-term prevention.15–17 Some treatments
have considerable burdensome side-effects and are very stressful for
the patients and those close to them.15,16 Such an aggressive approach
to treatment, especially with patients near the end of their lives,
could be considered inappropriate care.
2. Concerns for inappropriate end-of-life care
Inappropriate end-of-life care is a thoroughly discussed topic in
Belgian health care literature.18,19 In 2017, the KCE (Federaal

14
Kenniscentrum voor de Gezondheidszorg) published a detailed report on
the current state of "appropriate care at the end of life" in Belgium10
In this report, the authors draw on a large evidence base to illustrate
their point that inappropriate care at the end of life in Belgium is
a major problem, and that there is a consensus that it should and can
be reduced. Similar concerns have risen in other countries, for example
in the USA, Canada and Germany.3,20,21
A palliative care approach
For people suffering from life-limiting conditions such as cancer,
COPD or dementia, appropriate end-of-life care often includes some
form of palliative care.22,23 During the last weeks, months or even
years of their life, care goals ideally gradually shift from primarily
prolonging life to primarily improving comfort and quality of life.24
A palliative care approach can combine life-prolonging elements with
increasing attention for patient's physical, social, mental and
existential well-being, as well as care for family caregivers and
berievement care.25 Early initiation of palliative care, advance care
planning and high quality terminal care are an integral part of
appropriate end-of-life care and could increase well-being
considerably in people suffering from advanced life-threatening
conditions.26–28 Appropriate end-of-life care also includes avoiding
unnecessary care transitions, unnecessary treatment and medication,
and being cared for by people who know and respect the patient's wishes
for end-of-life care, among other aspects of care.

15
Contributing factors
The 2017 KCE report mentions a list of determinants and contributing
factors that might be directly or indirectly influencing the
occurrence of inappropriate end-of-life care, related to the health
care professionals involved, the patients, the patient’s relatives and
societal and health care organizational factors.10 The report
delineates the end-of-life care context as a complex situation where
health care professionals might feel inexperienced, where patients,
relatives and care professionals are not comfortable to talk about
their wishes or expectations and where the society as a whole and the
health care system supports aggressive treatment, rather than clear
communication, care planning and focus on quality of life.
With this many important factors possibly contributing to the
occurrence of inappropriate end-of-life care, recently concerns have
been rising among health care professionals, policy makers and
researchers, about inappropriate care provision for patients who are
suffering from incurable diseases and approach the end of their
life.29,30 Therefore, efforts have been made to study and improve the
appropriateness of end-of-life care in Belgium.10,31,32
3. Appropriateness of care as an indicator of performance of the
health care system
Studying the appropriateness of end-of-life care can be done at the
level of the health care system.15,33,34 Appropriateness of care is often
perceived from the individual patient's or the clinical perspective.
Especially near the end of life, tailoring care to the patient's wishes

16
is essential. However, all health care patients receive takes place
in the context of the health care system. Providing, evaluating and
promoting appropriate care to people near the end of life is not just
a concern of the individual patient, it is a public health issue.35,36
In previous research, in Belgium and abroad, the quality of care has
been evaluated in specific settings, such as hospitals, specialist
palliative care services or nursing homes.17 However, to evaluate the
appropriateness and inappropriateness of end-of-life care in an entire
health system, e.g. Belgium, we need to assess health care use at
regional and national level, rather than within the context of one
isolated specific health care service. The registration of health care
use on a national level by the National Institute for Health and
Disability Insurance (RIZIV) provides us with an opportunity to study
the practice of end-of-life care on a population level.37–39
The Belgian health care sytem
In Belgium, the government has a major influence on the provision of
health care, through reimbursement policy. Every Belgian citizen is
obliged to have a health insurance by joining or registering with one
of the seven sickness funds. Reimbursement covers a substantial
percentage of health care costs.40 The Belgian government, through the
National Institute for Health and Disability Insurance (RIZIV)40,
determines what health care is reimbursed, which will determine to a
certain extent what health care is offered to and used by a large
proportion of the population. Reimbursements are processed by the
sickness funds (also called mutualities).41 For administrative reasons,
they register all reimbursements and transfer these registrations to
a central national database managed by the Intermutualistic Agency

17
(IMA/AIM)42. For each reimbursement, a selection of variables is
stored, including details on the patient, the prescriber, the
institution where a treatment was given and the date of prescription
and provision. This presents us with unique research opportunities in
Belgium. The IMA databases contain data on all reimbursed treatments
and medication for almost the entire Belgian population. If we can
access these data, we can measure the occurrence of treatments and
medication that are considered indicators of appropriate or
inappropriate end-of-life care. Provided there is a way to identify
valid indicators of appropriateness, we can use reimbursement data to
evaluate the performance of the Belgian health system in terms of
appropriateness of end-of-life care. Studying health care use by
analyzing reimbursed care can inform policy makers about the
appropriateness of care provided by the health system.33,34,43
4. Using quality indicators of appropriateness and
inappropriateness of end-of-life care
Quality indicators
Health care that could be considered appropriate or inappropriate end-
of-life care can be expressed in quality indicators.44,45 Quality
indicators are ‘well-defined and measurable aspects of care’34, and
are considered to be a valid method of evaluating quality and
appropriateness of care within a given health care system. They have
been employed in various contexts, including children’s health care46,
and performance assessment of primary care47 or hospital care on a
18
system level48 An example of a quality indicator of inappropriate end-
of-life care could be:
"The percentage of people who died from cancer who received surgery
during the last 30 days prior to death."
As seen in this example a quality indicator consists of:
1. A numerator, identifying the care that could be inappropriate, in
this case the number of people who received surgery;
2. A denominator, identifying the population the indicator is measured
for, in this case the number of people who died from cancer;
3. A specification about the time period the quality indicator is
measured, in this case 30 days prior to death. This is optional, as
some quality indicators are not measured in a specific time period.
Each quality indicator provides us with a percentage across a
population. This expression at an aggregate level (e.g. a country,
region, health care service) is an important distinction of quality
indicators with outcome measures, which are expressed at individual
patient level.17,49,50 When this percentage is above or below a certain
threshold, this provides an indication that inappropriate or
appropriate care is occurring. Determining this threshold, however,
requires the establishment of standards. In some domains of health
care such standards have been established based on evidence on what
is an acceptable quality.51,52 However, in the absence of such a clear
evidence-base for standards - as is the case with end-of-life care -
relevant questions to set standards are: Is the percentage higher or
lower than measured in other, comparable populations? Is the
percentage higher or lower than previous measurements in the same
19
population? Is it higher or lower than the expectations of relevant
policy makers? Quality indicator results provide meaningful
information only in comparison. Repeated measurements of quality
indicators are one way to provide extra insight in possible
evolutions.50 In the studies in this dissertation, we employed
geographical comparison across regions in Belgium and comparison with
other countries, as well as comparison through time by using repeated
measurements.
Developing standards
Measuring quality indicators with population-level health care data
enables us to describe selected aspects of end-of-life care practice
in Belgium. To go beyond describing practice towards evaluating the
performance of the health care system in terms of appropriateness of
end-of-life care, performance standards are required.33,53 These
standards answer the question: what is our preferred performance for
each indicator? For example, if "the percentage of people receiving
specialist palliative care in the last year of life" is an indicator
of appropriate end-of-life care, what percentage of the population
receiving specialist palliative care could be aimed for? Setting
standards can be done in several ways: standards can either be
predetermined (e.g. by government or service policy makers) or data-
driven.44,54 Predetermined standards for some aspects of appropriateness
of end-of-life care are currently in development18, but are mainly
lacking. Measuring quality indicators on population level provides us
with the opportunity to suggest data-driven relative standards based
on the measurement results. In previous research, the best scoring
decile or quartile have been suggested as possible data-driven

20
standards.33 For example, if 25% of all health care regions in Belgium
achieve the standard of 35% or more of their population receiving
specialist palliative care in the last year of their life, this could
be a Belgian standard for all health care regions. Relative data-
driven standards have the benefits of being both achievable and
ambitious, as they take the existing situation into account and aim
to improve by using best performers as standards.33 Studying the
variation across the population has the added benefit of pinpointing
room for improvement.50 Some quality indicators will have more
variation across the population than others, indicating there is a
larger gap between better and worse performing regions.
A fair comparison
Establishing relative standards is only relevant if we can establish
a fair comparison within the full population (in our example: comparing
health care regions in Belgium). A fair comparison requires us to
control for confounding variables (e.g. age, sex, household type,
diagnostic characteristics, care dependency) that vary between
subpopulations (e.g. regions) and affect the care provision, but are
not a sign of the quality of care provided.55–57 This reinforces the
attributional validity of our results: if we find differences between
regions while controlling for these confounding variables, we can
attribute them to real differences in health care practice, rather
than differences in population characteristics.56,58 For example, the
average age can differ between regions and has an impact on the care
patients receive.57 If, for example, older people receive less
palliative care near the end of life and on average, and people in one
region are older than people in another, we will find less palliative

21
care in the first region, even when people at each age are treated
equally in both regions. This does not reflect a difference in the
quaility of end-of-life care practice between the two regions but a
difference in risk profile. Therefore, when measuring quality of end-
of-life care, we control for age and numerous other confounders to
eliminate their influence from the equasion and leave us with real
health care differences between regions. As such, having access to
several relevant socio-demographic, clinical and socio-economic
variables that might be confounding factors is essential.59,60
5. Cancer, COPD and dementia
Efforts to improve the quality of end-of-life care and appropriateness
of care have historically mostly focused on patients with cancer.
Palliative care provision is higher in people with cancer than in
other populations.23 However, people suffering from other progressive
illnesses have equal needs of palliative care and appropriate care
near the end of life.22 The literature has distinguished three types
of end-of-life trajectories: a terminal disease with acute decline in
physical functioning (mostly cancer), organ failure with long term
limitations and acute exacerbations with partial recovery (e.g. COPD,
cardio-vascular diseases) and frailty with low physical functioning
and prolonged gradual decline (e.g. dementia).9,61 Patient's needs in
term of care are likely to vary according to their dying trajectory,
so appropriateness of care will also at least partially vary between
populations suffering from these diseases.24 According to the WHO,
dementia and COPD were the third and fifth most common cause of death
in high-income countries in 2016, with different types of cancer taking

22
several spots in the top 10 list.5 Globally, 47 million people were
estimated to live with dementia in 2015, other estimates ranging from
5 to 7 percent of those aged 60 and older in most regions of the
world.62–64 The prevalence of COPD has been estimated to be at 10.7
percent of the global population of 30 years and older, with an
increase of 68.7 percent between 1990 and 2010.65 Other studies found
similar results and stress that the prevalence of COPD is expected to
rise in coming years.66,67 For cancer, the WHO reports 9.6 million cancer
deaths and an incidence of 18.1 million new cases worldwide in 2018.5,68
If we measure appropriateness of end-of-life care in populations from
these three disease trajectories, we cover the most prevalent
trajectories in the dying population.
6. Objective and aims
The main objective of this dissertation is to assess the performance
of the Belgian health care system in terms of appropriateness of end-
of-life care for people dying from cancer, COPD or dementia by
developing and measuring quality indicators of appropriate and
inappropriate end-of-life care. This objective can be divided into 4
aims.
Aim 1: Developing indicators of appropriate and inappropriate end-of-
life care for people with Alzheimer’s disease, cancer or COPD for
population-level administrative databases. We aim to identify
treatments and medications that, when received by a large proportion
at the level of a population, indicate the occurrence of appropriate
or inappropriate end-of-life care.

23
Aim 2: Using linked administrative and disease-specific databases to
study end-of-life care on a population level. We aim to explore several
Belgian national databases with health care, diagnostic, sociologic,
economic and demographic data that enable us to measure quality
indicators on end-of-life care and how these databases can be linked.
Aim 3: Evaluating appropriateness of end-of-life care in people dying
from cancer, from COPD or with dementia in Belgium by measuring quality
indicators in linked administrative databases. We aim to use
administrative data to measure the developed indicator set (aim 1) for
each disease group (cancer, COPD and dementia) across the Belgian
population, for all people who died within the same year. We also aim
to examine what risk factors may influence exposure to potentially
appropriate or inappropriate end-of-life care for people dying from
cancer. For end-of-life COPD and dementia care, we aim to suggest
relative performance standards based on the variation across health
care regions.
Aim 4: Describing trends in indicators of appropriateness or
inappropriateness of end-of-life care for people dying from cancer,
COPD or with dementia between 2010 and 2015 in Belgium. We aim to use
administrative data to describe trends in the developed indicator sets
for each disease group (cancer, COPD and dementia) across the Belgian
population, for all people who died between 2010 and 2015.

24
7. Methods
7.1 The quality indicator development process
We developed indicators measurable with available administrative
health care databases, limiting indicators to reimbursed treatment and
medication and excluding other important aspects of appropriateness
of end-of-life care such as communication or care planning. As
indicators of appropriate or inappropriate end-of-life care might
differ across disease groups, we developed quality indicators for
three groups of patients: people suffering from cancer, COPD or
dementia. These represent very different disease trajectories and
together, they represent a large group of people who are dying from
non-communicable, relatively predictable diseases that require
palliative care in most patients in the final stages of the diseases.9
The development process involved three steps:
1. A literature search to identify existing candidate indicators;
2. Interviews with experts in care for patients with cancer, COPD
or dementia to suggest additional candidate indicators;
3. Expert panels to evaluate all candidate indicators listed in
steps 1 and 2 and construct a valid set of indicators for cancer, COPD
and dementia.
We started our literature search from the 2013 updated systematic
review by De Roo et al.69 on quality indicators for palliative and end-
of-life care, followed by a cascading hand search. Since existing
quality indicators specifically on end-of-life care were limited, we
performed an additional literature review on appropriate or
25
inappropriate treatments and medication at the end-of-life for cancer,
COPD or dementia that can be adapted to measurable quality indicators.
We also interviewed physicians involved in the treatment of patients
near the end of life with cancer, COPD or dementia, to suggest quality
indicators from personal experience with end-of-life care practice in
Belgium. To evaluate the candidate quality indicators found in
literature and interviews, we presented them to three expert panels,
one for cancer, one for COPD and one for dementia. Each panel consisted
of 10-12 physicians and nurses of the disciplines involved with end-
of-life care for these diseases. Only indicators on which consensus
was reached were retained for the final quality indicator sets,
following the RAND/UCLA appropriateness method stipulations.70 The
indicators developed cover five domains: aggressiveness of care, pain
and symptom treatment, palliative care, place of treatment and place
of death, coordination and continuity of care. A detailed description
of all indicators as presented to the expert panels, can be found in
the appendix as supplementary material S.1, S.2 and S.3. (only
available in Dutch)
Limitation in scope
Because we developed indicators to be measured with administrative
data, we a priori excluded several aspects of appropriate end-of-life
care that are not currently reimbursed by the Belgian health care
system, such as patient-physician communication, patient's wishes and
care for relatives. They are included in previous studies that did not
target indicators measurable with administrative data.69,71 However,
due to the level of detail and broadness of spectrum of the available
data in Belgium, we found a relatively large number of quality

26
indicators, compared to other studies developing quality indicators
measurable with routinely collected data.15,34
Adapting the quality indicators
After the quality indicator development process, where the most
relevant aspects of appropriateness and inappropriateness of end-of-
life care are selected for each disease, statistical measures have to
be employed to evaluate the quality indicator sets. Quality indicators
must be statistically relevant. For example, aspects of care that
occur in less than 1% of the relevant population are not meaningful
as a quality indicator.44 When measurement results are close to 100%
or 0% or vary too little across the populations to provide any useful
information, they may not proof to be useful in practice, even if
approved by experts.33
Chapter 2 describes the quality indicator development process and the
resulting quality indicator sets for people with cancer, COPD or
dementia.72 Following a design based on the RAND/UCLA appropriateness
method70, candidate indicators were drawn from literature and
interviews with experts in end-of-life care in general and from each
disease group specific. All indicators were consequently evaluated and
validated by expert panels.
7.2 Administrative databases
To evaluate the appropriateness of end-of-life care in Belgium across
the population, population-level data are required. Collecting such

27
data through interviews or questionnaires would be a titanic endeavor,
outside the scope of this project. However, in Belgium databases exist
that contain health care data on a national level, covering almost the
entire Belgian population.
Seven Belgian health insurance organisations ('mutualiteiten')
register all reimbursed health care for reimbursement and funding
purposes. The Intermutualistic Agency (IMA)42 collects reimbursement
data from the insurers. Reimbursement data of all Belgian residents
are available in the IMA database, since health insurance is mandatory
in Belgium. The IMA administers three databases relevant for our
research: (1) a socio-demographic database; (2) a health care database
with all reimbursed treatments and medication, except medications
delivered by public pharmacies and (3) a pharmaceutical database
containing medication data from public pharmacists. When used to
measure valid quality indicators, these data enable us to evaluate the
appropriateness of end-of-life care in Belgium.
The Belgian Cancer Registry (BCR) manages a database with diagnostic
information on all incidences of cancer in Belgium, including date of
diagnosis and type of cancer.59 No similar registries are available to
identify people who died with COPD or dementia.
However, the death certificate database, managed by Statistics Belgium
(StatBel)60, can be used to identify all direct ('underlying') and
indirect ('associated' and other) causes of death. Statistics Belgium
also manages the national demographic database, containing the
household composition of every Belgian household and data from the
nationwide Socio-Economic Survey in 2001 and the national Census in
2011 with information about the highest educational level attained,

28
the occupation and housing characteristics of every Belgian citizen.
They also manage the national fiscal database with data on net taxable
income. All socio-economic and demographic factors mentioned have been
identified as affecting end-of-life care patterns73,74 and therefore
are meaningful to be used as control variables in population-level
measurement of quality indicators.
Methodological opportunities
The IMA, BCR and StatBel databases are not designed to be used for
research. They do, however, contain high quality data. With each
reimbursement, several pieces of information about the patient, the
care provider and the date and place of provision are registered and
stored. That data can be used to study the occurrence of certain types
of health care in detail.42 If we can identify specific treatments and
medication as indicators of appropriate or inappropriate care, we can
use this big volume of detailed health care data as a tool to map the
appropriateness of end-of-life care in Belgium. Selecting the data
necessary to measure a selection of quality indicators requires
medical and database expertise. As such, the expert knowledge of IMA-
employed physicians who regularly work with the claims databases is
invaluable to our research. They are repeatedly consulted during the
indicator development process and the indicator measurement process.
The aims of this research project only scratch the surface of
opportunities with administrative health claims data. Within the end-
of-life care research domain, examples from other research include an
evaluation of resource use and costs in end-of-life care, examining
the effectiveness of government measures to support palliative home
care, or describing discontinuation of medication near the end of

29
life.38,39,75–77 Access to such detailed high quality full-population data
is unique in an international context, with similar research in other
countries using only service-specific or population-specific
databases.33,43 Administrative databases offer several advantages
compared to sample-based primary data-collections, such as a minimised
selection bias, recall bias and non-response bias.78 They have a
clearly defined population, including populations that tend to be
under-represented in surveys or observational studies due to practical
or ethical considerations. People near the end of life are a prime
example of a population difficult to reach for ethical reasons.79
Administrative data registrations are usually continuously collected,
which enables trend analyses and longitudinal studies. Specifically
when working with quality indicators, continuous collection provides
repeated measurements and enables comparison of indicator scores over
time.18 Moreover, since the data have already been collected, they are
relatively inexpensive when compared with original data collections,
with the main cost being data storage and access to the data.33,79 In
Belgium, the IMA, BCR and StatBel database administrators are
currently increasingly engaged in sharing data for research
purposes.80,81 The increased availability and overall high quality of
the data available make them more than ever interesting to use in
health care research.
Chapter 3 describes the database linking procedure.37 All databases
were linked in an ethically responsible manner and, in accordance with
Belgian law, approvals for access to all databases were obtained from
the two relevant national sectoral committees for privacy protection:
the ‘Sectoral Committee of Social Security and Health, Section Health’
and the ‘Statistical Supervisory Committee’, whose responsibilities

30
were recently transferred to the 'Informatieveiligheidscomité'82. Both
were at the time of approval subcommittees of the Belgian Commission
for the Protection of Privacy, which recently became the official
Belgian data protection authority83.
7.3 Evaluating the appropriateness of end-of-life care in people
with cancer, dementia and COPD
Study design and data
To measure the indicators in the Belgian population, we conducted
three decedent cohort studies, one to describe the indicators for
people with cancer, one for COPD and one for dementia. For the
indicators on cancer, we selected all people who died from cancer in
Belgium in 2012. For the indicators on COPD, we selected all people
who died from COPD in Belgium in 2015. For the indicators on dementia,
we selected all people who died with dementia in Belgium in 2015. We
used cohort data from all selected population-level databases, managed
by IMA, BCR and StatBel mentioned above. As for socio-economic and
demographic variables, we included decedents’ age, sex, education
level, region of residence, the degree of urbanicity of the
municipality of residence, type of household, housing comfort and net
taxable income.
Analysis
To examine the population characteristics of people who died from
cancer, COPD or with dementia and to calculate the quality indicators,
we use descriptive statistics. Additionally, for people dying from
cancer, we examine risk factors for exposure to appropriate or
inappropriate end-of-life care. We perform a principal component

31
analysis to reduce the list of quality indicators to a smaller set of
main components. We consequently perform analysis of variance to
evaluate which population characteristics are associated with higher
or lower scores for the components.
For people dying from COPD or with dementia, additionally, we perform
a comparison on indicator scores between health care regions in
Flanders and Brussels, followed by a suggestion of relative
benchmarks. The division in health regions is based on natural patient
flow towards major hospitals in each region. As to this date, no
official similar regions exist in Wallonia. To obtain a fair
comparison, we perform risk adjustment procedures. We select a set of
possible risk factors based on relevance for end-of-life care and
availability of data in the current dataset. We will suggest relative
performance standards for each indicator, based on the best scoring
quartiles across health care regions.
All analyses are conducted with SAS Enterprise Guide, version 7.1.
7.4 Examining trends in the appropriateness of end-of-life care
To evaluate the trends in appropriateness of end-of-life care in
Belgium between 2010 and 2015 in people dying from cancer, from COPD
or with dementia, we conduct a decedent cohort study. Again, data from
all linked databases are used. We use all three validated sets of
quality indicators mentioned above. To present real evolutions in
appropriateness of end-of-life care, we control for variables that
might influence health care use and changed between the selected years,
based on a selection of available data. We show trends over the six
32
years for which data were available (2010-2015) and calculate the
differences between 2010 and 2015 for all risk adjusted indicator
scores. We rank all these risk adjusted differences from most positive
to most negative.
8. Outline of this dissertation
The introduction of this dissertation describes the context, the
objectives and methodology of this research project. Part one includes
two chapters concerning the methodological basis of our research: the
development of the quality indicators (chapter two)72 and the linking
of the relevant administrative databases (chapter three)37. Part two
describes the results of the quality indicator measurements and an
evaluation of the current state of appropriate and inappropriate end-
of-life care for people with cancer (chapter four), COPD (chapter
five) or dementia (chapter six) in Belgium. It concludes with an
evaluation of trends in appropriateness of end-of-life care between
2010 and 2015 in Belgium (chapter seven). Lastly, part three discusses
the meaning of our findings. It summarizes the main results and
concerns the consequences of these findings, with some concluding
words.

33
References
1. Roser M, Ortiz-Ospina E, Ritchie H. Life Expectancy. Our World Data
[Internet]. 2013 [cited 2020 Jan 6]; Available from:
https://ourworldindata.org/life-expectancy
2. World Population Prospects - Population Division - United Nations
[Internet]. [cited 2020 Jan 21]. Available from:
https://population.un.org/wpp/
3. Kaufmann TL, Kamal AH. Oncology and Palliative Care Integration:
Cocreating Quality and Value in the Era of Health Care Reform. J Oncol
Pract. 2017;13:580–8.
4. WHO | Global guidelines on the prevention of surgical site infection
[Internet]. WHO. [cited 2020 Jan 21]. Available from:
http://www.who.int/infection-prevention/publications/ssi-prevention-
guidelines/en/
5. WHO | The top 10 causes of death [Internet]. WHO. [cited 2016 Apr 27].
Available from: http://www.who.int/mediacentre/factsheets/fs310/en/
6. Bondi MW, Edmonds EC, Salmon DP. Alzheimer’s Disease: Past, Present, and
Future. J Int Neuropsychol Soc JINS. 2017;23:818–31.
7. Dementia statistics | Alzheimer’s Disease International [Internet].
[cited 2020 Jan 21]. Available from:
https://www.alz.co.uk/research/statistics
8. Chronic obstructive pulmonary disease (COPD) - Treatment [Internet].
nhs.uk. 2017 [cited 2020 Jan 21]. Available from:
https://www.nhs.uk/conditions/chronic-obstructive-pulmonary-disease-
copd/treatment/
9. Murray SA, Kendall M, Boyd K, Sheikh A. Illness trajectories and
palliative care. BMJ. 2005;330:1007–11.
10. Appropriate care at the end of life [Internet]. [cited 2019 Oct 9].
Available from: /en/appropriate-care-at-the-end-of-life
11. Park RE, Fink A, Brook RH, Chassin MR, Kahn KL, Merrick NJ, et al.
Physician ratings of appropriate indications for six medical and
surgical procedures. Am J Public Health. 1986;76:766–72.
12. (15) (PDF) EAPC Atlas of Palliative Care in Europe 2019 [Internet].
ResearchGate. [cited 2020 Jan 6]. Available from:
https://www.researchgate.net/publication/333390123_EAPC_Atlas_of_Palliat
ive_Care_in_Europe_2019
13. For a Healthy Belgium - For a Healthy Belgium [Internet]. [cited 2019
Oct 25]. Available from: https://www.healthybelgium.be/en/
14. Chassin MR, Brook RH, Park RE, Keesey J, Fink A, Kosecoff J, et al.
Variations in the use of medical and surgical services by the Medicare
population. N Engl J Med. 1986;314:285–90.

34
15. Earle CC, Park ER, Lai B, Weeks JC, Ayanian JZ, Block S. Identifying
potential indicators of the quality of end-of-life cancer care from
administrative data. J Clin Oncol. 2003;21:1133–8.
16. Wright AA, Keating NL, Ayanian JZ, Chrischilles EA, Kahn KL, Ritchie
CS, et al. Family Perspectives on Aggressive Cancer Care Near the End of
Life. JAMA. 2016;315:284–92.
17. De Roo ML. Quality Indicators for Palliative Care from an
international perspective. Koersel, Belgium; 2014. 242 p.
18. End of life - For a Healthy Belgium [Internet]. [cited 2019 Oct 9].
Available from: https://www.healthybelgium.be/en/health-system-
performance-assessment/specific-domains/end-of-life
19. Organisation of palliative care in Belgium [Internet]. [cited 2019
Dec 11]. Available from: /en/organisation-of-palliative-care-in-belgium
20. Canada H. Palliative care [Internet]. aem. 2016 [cited 2019 Nov 6].
Available from: https://www.canada.ca/en/health-
canada/services/palliative-care.html#s5
21. pallcare. Germany has developed National Guideline on Palliative Care
for Patients with Incurable Cancer [Internet]. EAPC Blog. 2017 [cited
2019 Nov 6]. Available from:
https://eapcnet.wordpress.com/2017/02/01/germany-has-developed-national-
guideline-on-palliative-care-for-patients-with-incurable-cancer/
22. Murtagh FEM, Bausewein C, Verne J, Groeneveld EI, Kaloki YE,
Higginson IJ. How many people need palliative care? A study developing
and comparing methods for population-based estimates. Palliat Med.
2014;28:49–58.
23. Seow H, O’Leary E, Perez R, Tanuseputro P. Access to palliative care
by disease trajectory: a population-based cohort of Ontario decedents.
BMJ Open. 2018;8:e021147.
24. Kelley AS, Meier DE. Palliative Care — A Shifting Paradigm. N Engl J
Med. 2010;363:781–2.
25. WHO | WHO Definition of Palliative Care [Internet]. WHO. [cited 2020
Jan 21]. Available from:
https://www.who.int/cancer/palliative/definition/en/
26. Bakitas MA, Tosteson TD, Li Z, Lyons KD, Hull JG, Dionne-Odom JN, et
al. Early Versus Delayed Initiation of Concurrent Palliative Oncology
Care: Patient Outcomes in the ENABLE III Randomized Controlled Trial. J
Clin Oncol. 2015;33:1438–45.
27. Greer JA, Pirl WF, Jackson VA, Muzikansky A, Lennes IT, Heist RS, et
al. Effect of early palliative care on chemotherapy use and end-of-life
care in patients with metastatic non-small-cell lung cancer. J Clin
Oncol Off J Am Soc Clin Oncol. 2012;30:394–400.
28. Vanbutsele G, Pardon K, Belle SV, Surmont V, Laat MD, Colman R, et
al. Effect of early and systematic integration of palliative care in
patients with advanced cancer: a randomised controlled trial. Lancet
Oncol. 2018;19:394–404.

35
29. Passende zorg in de laatste levensfase [Internet]. [cited 2019 Jul
9]. Available from: /nl/passende-zorg-in-de-laatste-levensfase
30. Lavis JN, Anderson GM. Appropriateness in health care delivery:
definitions, measurement and policy implications. CMAJ. 1996;154:321–8.
31. PACE | PACE - Palliative Care for Older People in care and nursing
homes in Europe [Internet]. [cited 2019 Nov 6]. Available from:
http://www.eupace.eu/
32. Scheerens C, Pype P, Cauwenberg JV, Vanbutsele G, Eecloo K, Derom E,
et al. Early-Integrated Palliative home care and standard care for end-
stage COPD (EPIC): A Phase II pilot RCT testing feasibility,
acceptability and effectiveness. J Pain Symptom Manage [Internet]. 2019
[cited 2019 Nov 6];0. Available from:
https://www.jpsmjournal.com/article/S0885-3924(19)30532-9/abstract
33. Earle CC, Neville BA, Landrum MB, Souza JM, Weeks JC, Block SD, et
al. Evaluating claims-based indicators of the intensity of end-of-life
cancer care. Int J Qual Health Care. 2005;17:505–9.
34. Grunfeld E, Urquhart R, Mykhalovskiy E, Folkes A, Johnston G, Burge
FI, et al. Toward population-based indicators of quality end-of-life
care: testing stakeholder agreement. Cancer. 2008;112:2301–8.
35. Cohen J, Deliens L. A Public Health Perspective on End of Life Care
Joachim. Nurs Older People. 2012;24:8.
36. Stjernswärd J, Foley KM, Ferris FD. The Public Health Strategy for
Palliative Care. J Pain Symptom Manage. 2007;33:486–93.
37. Maetens A, De Schreye R, Faes K, Houttekier D, Deliens L, Gielen B,
et al. Using linked administrative and disease-specific databases to
study end-of-life care on a population level. BMC Palliat Care.
2016;15:86.
38. Faes K, Cohen J, Annemans L. Resource Use During the Last 6 Months of
Life of Individuals Dying with and of Alzheimer’s Disease. J Am Geriatr
Soc. 2018;66:879–85.
39. Maetens A, Deliens L, Van den Block L, Beernaert K, Cohen J. Are We
Evolving Toward Greater and Earlier Use of Palliative Home Care Support?
A Trend Analysis Using Population-Level Data From 2010 to 2015. J Pain
Symptom Manage. 2019;58:19-28.e10.
40. Onthaal - RIZIV [Internet]. [cited 2016 Jun 6]. Available from:
http://www.riziv.fgov.be/nl/Paginas/default.aspx
41. Organisatie van de gezondheidszorg /. 2015.
42. IMA-AIM [Internet]. [cited 2016 Apr 13]. Available from:
http://www.aim-ima.be/
43. Earle CC, Neville BA, Landrum MB, Ayanian JZ, Block SD, Weeks JC.
Trends in the aggressiveness of cancer care near the end of life. J Clin
Oncol. 2004;22:315–21.
44. Donabedian A. The quality of care: How can it be assessed? JAMA.
1988;260:1743–8.
36
45. Donabedian A. Evaluating the quality of medical care. Milbank Mem
Fund Q. 1966;44:Suppl:166-206.
46. Wiles LK, Hooper TD, Hibbert PD, White L, Mealing N, Jaffe A, et al.
CareTrack Kids-part 1. Assessing the appropriateness of healthcare
delivered to Australian children: study protocol for clinical indicator
development. BMJ Open. 2015;5:e007748.
47. Visca M, Donatini A, Gini R, Federico B, Damiani G, Francesconi P, et
al. Group versus single handed primary care: a performance evaluation of
the care delivered to chronic patients by Italian GPs. Health Policy
Amst Neth. 2013;113:188–98.
48. Stefan MS, Pekow PS, Nsa W, Priya A, Miller LE, Bratzler DW, et al.
Hospital performance measures and 30-day readmission rates. J Gen Intern
Med. 2013;28:377–85.
49. Dudgeon D. The Impact of Measuring Patient-Reported Outcome Measures
on Quality of and Access to Palliative Care. J Palliat Med. 2018;21:S76–
80.
50. Leemans K, Deliens L, Van den Block L, Vander Stichele R, Francke AL,
Cohen J. Systematic Quality Monitoring For Specialized Palliative Care
Services: Development of a Minimal Set of Quality Indicators for
Palliative Care Study (QPAC). Am J Hosp Palliat Care. 2016;
51. Djulbegovic B, Guyatt GH. Progress in evidence-based medicine: a
quarter century on. Lancet Lond Engl. 2017;390:415–23.
52. Rendell V, Schmocker R, Abbott DE. Expanding the Scope of Evidence-
Based Cancer Care. Surg Oncol Clin N Am. 2018;27:727–43.
53. International benchmarking and best practice management: in search of
health care and hospital excellence. - PubMed - NCBI [Internet]. [cited
2016 Jun 6]. Available from: http://www.ncbi.nlm.nih.gov/pubmed/25985514
54. Bowers DG, Franklin JL. Survey-Guided Development: Data Based
Organizational Change [Internet]. MICHIGAN UNIV ANN ARBOR INST FOR
SOCIAL RESEARCH; 1975 Jun [cited 2020 Jan 23]. Available from:
https://apps.dtic.mil/docs/citations/ADA012868
55. Brookhart M, Stürmer T, Glynn R, Rassen J, Schneeweiss S. Confounding
control in healthcare database research: challenges and potential
approaches. Med Care. 2010;48:S114–20.
56. Silva LK. Validity of the risk adjustment approach to compare
outcomes. Cad Saude Publica. 2003;19:287–95.
57. Wong J, Xu B, Yeung HN, Roeland EJ, Martinez ME, Le QT, et al. Age
disparity in palliative radiation therapy among patients with advanced
cancer. Int J Radiat Oncol Biol Phys. 2014;90:224–30.
58. Risk Adjustment for Measuring Health Care Outcomes, 3rd edition |
International Journal for Quality in Health Care | Oxford Academic
[Internet]. [cited 2020 Feb 16]. Available from:
https://academic.oup.com/intqhc/article/16/2/181/1819128
59. Belgian Cancer Registry — Get all the facts [Internet]. [cited 2017
Jan 31]. Available from:
http://www.kankerregister.org/default.aspx?lang=EN

37
60. Statbel, the Belgian statistical office | Statbel [Internet]. [cited
2020 Jan 21]. Available from: https://statbel.fgov.be/en
61. Lunney JR, Lynn J, Foley DJ, Lipson S, Guralnik JM. Patterns of
functional decline at the end of life. JAMA. 2003;289:2387–92.
62. Prince MJ. World Alzheimer Report 2015: The Global Impact of Dementia
[Internet]. 2015 [cited 2020 Feb 17]. Available from:
https://www.alz.co.uk/research/world-report-2015
63. Prince M, Bryce R, Albanese E, Wimo A, Ribeiro W, Ferri CP. The
global prevalence of dementia: a systematic review and metaanalysis.
Alzheimers Dement J Alzheimers Assoc. 2013;9:63-75.e2.
64. Ferri CP, Prince M, Brayne C, Brodaty H, Fratiglioni L, Ganguli M, et
al. Global prevalence of dementia: a Delphi consensus study. The Lancet.
2005;366:2112–7.
65. Adeloye D, Chua S, Lee C, Basquill C, Papana A, Theodoratou E, et al.
Global and regional estimates of COPD prevalence: Systematic review and
meta–analysis. J Glob Health [Internet]. [cited 2020 Feb 17];5.
Available from: https://www.ncbi.nlm.nih.gov/pmc/articles/PMC4693508/
66. Halbert RJ, Natoli JL, Gano A, Badamgarav E, Buist AS, Mannino DM.
Global burden of COPD: systematic review and meta-analysis. Eur Respir
J. 2006;28:523–32.
67. Mannino DM, Buist AS. Global burden of COPD: risk factors,
prevalence, and future trends. The Lancet. 2007;370:765–73.
68. Bray F, Ren J-S, Masuyer E, Ferlay J. Global estimates of cancer
prevalence for 27 sites in the adult population in 2008. Int J Cancer.
2013;132:1133–45.
69. De Roo ML, Leemans K, Claessen SJJ, Cohen J, W. Pasman HR, Deliens L,
et al. Quality Indicators for Palliative Care: Update of a Systematic
Review. J Pain Symptom Manage. 2013;46:556–72.
70. The RAND/UCLA Appropriateness Method User’s Manual - MR1269.pdf
[Internet]. [cited 2016 Apr 13]. Available from:
https://www.rand.org/content/dam/rand/pubs/monograph_reports/2011/MR1269
71. Bekelman JE, Halpern SD, Blankart CR, Bynum JP, Cohen J, Fowler R, et
al. Comparison of Site of Death, Health Care Utilization, and Hospital
Expenditures for Patients Dying With Cancer in 7 Developed Countries.
JAMA. 2016;315:272–83.
72. De Schreye R, Houttekier D, Deliens L, Cohen J. Developing indicators
of appropriate and inappropriate end-of-life care in people with
Alzheimer’s disease, cancer or chronic obstructive pulmonary disease for
population-level administrative databases: A RAND/UCLA appropriateness
study. Palliat Med. 2017;31:932–45.
73. Chang CM, Wu CC, Yin WY, Juang SY, Yu CH, Lee CC. Low Socioeconomic
Status Is Associated With More Aggressive End-of-Life Care for Working-
Age Terminal Cancer Patients. Oncologist. 2014;19:1241–8.
38
74. Hanchate A, Kronman AC, Young-Xu Y, Ash AS, Emanuel E. Racial and
ethnic differences in end-of-life costs: why do minorities cost more
than whites? Arch Intern Med. 2009;169:493–501.
75. Maetens A, Beernaert K, De Schreye R, Faes K, Annemans L, Pardon K,
et al. Impact of palliative home care support on the quality and costs
of care at the end of life: a population-level matched cohort study. BMJ
Open. 2019;9:e025180.
76. Faes K, De Frène V, Cohen J, Annemans L. Resource Use and Health Care
Costs of COPD Patients at the End of Life: A Systematic Review. J Pain
Symptom Manage. 2016;52:588–99.
77. Paque K, De Schreye R, Elseviers M, Vander Stichele R, Pardon K,
Dilles T, et al. Discontinuation of medications at the end of life: A
population study in Belgium, based on linked administrative databases.
Br J Clin Pharmacol. 2019;85:827–37.
78. Benchimol EI, Manuel DG, To T, Griffiths AM, Rabeneck L, Guttmann A.
Development and use of reporting guidelines for assessing the quality of
validation studies of health administrative data. J Clin Epidemiol.
2011;64:821–9.
79. Billings J. Using Administrative Data to Monitor Access, Identify
Disparities, and Assess Performance of the Safety Net. Tools Monit
Health Care Saf Net [Internet]. 2003 [cited 2020 Jan 22]; Available
from: https://nyuscholars.nyu.edu/en/publications/using-administrative-
data-to-monitor-access-identify-disparities-
80. Permanente steekproef (EPS) - IMA-AIM [Internet]. [cited 2020 Mar
17]. Available from: https://ima-aim.be/Permanente-steekproef-EPS
81. Open Data | Statbel [Internet]. [cited 2020 Mar 17]. Available from:
https://statbel.fgov.be/en/open-data
82. Informatieveiligheidscomité (IVC) | KSZ - Kruispuntbank van de
Sociale Zekerheid [Internet]. [cited 2020 Mar 17]. Available from:
https://www.ksz-
bcss.fgov.be/nl/gegevensbescherming/informatieveiligheidscomite-ivc
83. Belgian Privacy Commission becomes DPA [Internet]. [cited 2020 Mar
17]. Available from: https://iapp.org/news/a/belgian-privacy-commission-
becomes-dpa/

39
PART I: Developing indicators
and using big data

40
41
Chapter 2: Developing indicators of appropriate and
inappropriate end-of-life care in people with
Alzheimer’s disease, cancer or chronic obstructive
pulmonary disease for population-level administrative
databases: A RAND/UCLA appropriateness study.
Robrecht De Schreye, Dirk Houttekier, Luc Deliens, Joachim
Cohen
Published in Palliative Medicine (2017)

42
Abstract
Background: A substantial amount of aggressive life-prolonging
treatments in the final stages of life has been reported for people
with progressive life-shortening conditions. Monitoring appropriate
and inappropriate end-of-life care is an important public health
challenge and requires validated quality indicators (QIs).
Aim: To develop indicators of appropriate and inappropriate end-of-
life care for people with cancer, COPD or Alzheimer’s disease,
measurable with population-level administrative data.
Design: modified RAND/UCLA appropriateness method
Setting/participants: Potential indicators were identified by
literature review and expert interviews and scored in a survey among
three panels of experts (one for each disease group). Indicators for
which no consensus was reached were taken into group discussions.
Indicators with consensus among the experts were retained for the
final QI sets.
Results: The final sets consist of 28 QIs for Alzheimer’s disease, 26
QIs for cancer and 27 QIs for COPD. The indicator sets measure aspects
of aggressiveness of care, pain and symptom treatment, specialist
palliative care, place of care and place of death, and coordination
and continuity of care.
Conclusion: We developed a comprehensive set of QIs of appropriate and
inappropriate end-of-life care in people with Alzheimer’s disease,
cancer or COPD, to be used in population-level research. Our focus on
administrative health care databases limits us to treatment and
medication, excluding other important quality aspects such as
communication, which can be monitored using complementary approaches.
Nevertheless, our sets will enable an efficient comparison of health
care providers, regions and countries in terms of their performance
on appropriateness of end-of-life care.

43
Introduction
Treatment goals for people with progressive life-shortening conditions
ideally move seamlessly from curative or life-prolonging to comfort
care1 as they approach the end of life and the benefits of curative
treatment no longer outweigh the negative effects.2–6 Nonetheless, a
substantial amount of aggressive life-prolonging treatment in the
final stages of life has been reported for people with life-shortening
conditions such as cancer.7–10 The high prevalence of aggressive care
near the end of life in certain patient groups suggests the importance
of critical evaluation of the appropriateness of care near the end of
life in health care systems.
Appropriate care can be defined as ‘treatment and/or medication for
which the expected health benefit (i.e. improved quality of life,
increased life expectancy, pain relief, improvement of functional
status) exceeds possible negative outcomes (i.e. mortality, decrease
in quality of life, pain, symptom burden)’.11,12 While potentially
inappropriate care has been evaluated in several domains of
healthcare, it remains under-investigated in end-of-life care,
particularly in groups other than people with cancer. Quality
indicators (QIs) i.e. ‘well-defined and measurable aspects of care’13,
are considered to be a valid method of evaluating quality and
appropriateness of care within a given health care system. QIs have
been used to evaluate appropriateness of care in various other
contexts, ranging from substance abuse treatment in adolescents14,
children’s health care15,16 and surgery for neonatal children17, to
assessing the performance of primary care18 or hospital care on a
system level19. A limited number of recent efforts have been undertaken
to develop QIs specifically for end-of-life care.20 However, these sets
of indicators are limited to populations using a specific health
service (e.g. a hospice or palliative care service) or to specific
disease groups such as cancer.13,20–25
Additionally, to evaluate health care system performance in terms of
end-of-life care, it is necessary to develop population-level quality
indicators of end-of-life care focusing on health care use across
populations, settings and services instead of individual patients
receiving a certain health care service.13,22,26 Such population-level

44
evaluations allow assessment of the performance of the health care
system as a whole. Additionally, variation by countries, regions,
health care settings, or socio-economic and cultural background can
be studied27.
Population-level use of QIs requires population-level data. In many
countries, including Belgium28, full population health insurance data
are collected routinely, due to the legal obligation for all citizens
to have health insurance and the central gathering of information by
government database administrators. Previous studies have demonstrated
that routinely collected data from health care insurance organisations
provide a reliable source for effective measurement of population-
level QIs.22,29,30 Using routinely collected data also avoids specific
problems of data collection in an end-of-life care context and has low
costs.31,32
However, previous efforts to develop and calculate population-level
QIs for end-of-life care have had a number of limitations. Firstly,
existing indicators have been developed specifically for measurement
in the existing health claims databases of the United States of America
and Canada (e.g. Medicare databases). Countries in Europe and other
parts of the world may have different databases which changes and/or
increases the number of candidate measurable QIs. Secondly, the
selection of QIs was primarily done through expert consultations with
clinicians from the USA. However, what care is deemed appropriate near
the end of life may be influenced by the health care system, cultural
differences and socio-demographic variations and thus may be different
in different countries.33–35 Thirdly, the existing indicators focus on
a limited population: cancer patients age 65 and older (because
Medicare data do not cover the younger population which would be about
half of all cancer-related deaths22). In Belgium, for instance, full
population health insurance data are available, without restriction
on age, disease or socio-demographic variables. Fourthly, QIs for
populations other than cancer who have similar end-of-life care needs
but typically have different care and dying trajectories36,37 are needed
to adequately monitor health care system performance in terms of end-
of-life care. QIs need to be included, for instance, for patients
with Alzheimer’s disease and COPD. Both are leading causes of disease

45
burden in high-income countries38 39 and life-shortening illnesses with
predictable disease trajectories and clear end-of-life stages.²²
Cancer, Alzheimer’s and COPD have different possible health care
interventions near the end of life (and the extent of appropriateness
of these interventions differs). This implies that different QIs for
end-of-life care are warranted for the different disease populations.
The aim of this study is to develop a set of QIs (well-defined and
measurable on a population level) of appropriate and inappropriate
health care at the end of life for people dying with cancer, COPD or
Alzheimer’s disease, to be used in administrative population-level
databases across health care settings.
Methods
A design based on the RAND/UCLA Appropriateness Method was used39 to
develop three different sets of QIs: one for Alzheimer’s disease (AD),
one for cancer, one for COPD.
The focus of our approach was explicitly based on possibilities with
available administrative health care databases, which was limited to
to treatment and medication (and excluded other important quality
aspects such as communication, which cannot be evaluated with
administrative data).
The approach involved three steps:
1. Searches of the relevant literature to select candidate
indicators for each set
2. Interviews with relevant experts in the field of Alzheimer’s
disease, cancer and COPD to suggest additional candidate
indicators (not in the original RAND/UCLA method)
3. Expert evaluations to define a valid set of indicators for
Alzheimer’s disease, cancer and COPD

46
Definitions & Criteria
Throughout the QI development process, the following definitions were
used:
Quality indicators (QIs) are defined as ‘explicitly defined measurable
items referring to the outcomes, processes, or structure of care. They
are usually described with a numerator, denominator, and/or
performance standard. Quality indicators can indicate either poor or
good quality in relevant care domains.’25,40 They express quality at an
aggregated level, usually the level of a healthcare service,
institution, region or country and are generally expressed as a number
or percentage.41 They are not used to evaluate the quality of care for
individual patients.
Appropriate care is defined as treatment and/or medication in which
‘the expected health benefit (e.g., increased life expectancy, relief
of pain, reduction in anxiety, improved functional capacity) exceeds
the expected negative consequences (e.g., mortality, morbidity,
anxiety, pain, time lost from work) by a sufficiently wide margin that
the procedure is worth doing, exclusive of cost.11,12
Inappropriate care is then defined as treatment and/or medication in
which the expected health benefit (e.g., increased life expectancy,
improved functional capacity) does not exceed the expected negative
consequences (e.g., morbidity, anxiety, pain) by a sufficiently wide
margin that the procedure is worth doing, exclusive of cost.
Additionally, selected QIs needed to meet all following criteria:
1. Providing a valid indication of appropriate or inappropriate care
at the end of life
2. Relating to people with Alzheimer’s disease, cancer or COPD
3. Being well defined, without ambiguity
4. Being measurable on a population level
5. Being measurable with available administrative data

47
Literature search
Our primary literature source was the 2009 systematic review by Pasman
et al.24, updated in 2013 by De Roo et al.25 on QIs for palliative and
end-of-life care. Co-authors of this paper (LD, JC) were involved in
both reviews. We used the search string from the review to perform an
updated search from September 2014 until November 2015. Additionally,
a cascading hand search was performed starting from the references
from the review of De Roo et al25.
Existing end-of-life care QIs are limited and we did not want a priori
to limit the set of candidate indicators to QIs published in
literature. Therefore, to identify QIs not yet identified or developed
as such, an additional literature review was done focusing on
appropriate or inappropriate treatments and medication at the end-of-
life for COPD, Alzheimer’s disease or cancer. We used search strings
combining keywords related to COPD, Alzheimer’s disease,
neoplasms/cancer and quality of life and hand-selected literature
relevant to the end-of-life care context. Those aspects identified in
literature as appropriate or inappropriate end-of-life care that could
be translated into a QI, meeting all the predefined criteria (cf.
above), were retained for the candidate QI list.
Both search strategies were limited to publications in English.
Interviews with relevant experts
To identify additional candidate QIs (and in addition to the standard
RAND/UCLA appropriateness method), we conducted interviews, between
March 2015 and November 2015, with 14 physicians involved in the
treatment of patients near the end of life with Alzheimer’s disease,
cancer or COPD. The 14 experts in oncology, pharmacology, pneumology,
family medicine and neurology from different university hospitals were
asked to suggest candidate QIs and for each one to formulate the
numerator, denominator, possible exclusion criteria and reasoning as
to why the indicator should be included. Prior to the interview,
experts were sent the definitions of QIs, appropriateness and
inappropriateness of care and the five selection criteria. During the
48
interview, experts could freely bring up QIs from personal experience
with end-of-life care practice in Belgium, while guided by the
interviewer in what information was required about each one
(numerator, denominator, reasoning, inclusion criteria).
Expert evaluation of candidate QIs
To evaluate the candidate QIs found in literature and interviews, they
were presented to expert panels. In advance, QIs from literature and
interviews were collected, re-evaluated and refined by the researchers
where needed to meet all criteria mentioned above. Three sets of
candidate QIs were composed: one for people suffering from Alzheimer’s
disease, one for people with cancer and one for people with COPD. Each
set of QIs was presented to a panel of 10-12 physicians and nurses of
the relevant disciplines involved in the treatment of patients with
these diseases in an end-of-life context. (Table 1) The RAND/UCLA
appropriateness method suggests seven to 15 experts in each panel.42
To cover different perspectives involved in end-of-life care, equal
numbers of doctors and nurses were included.
49
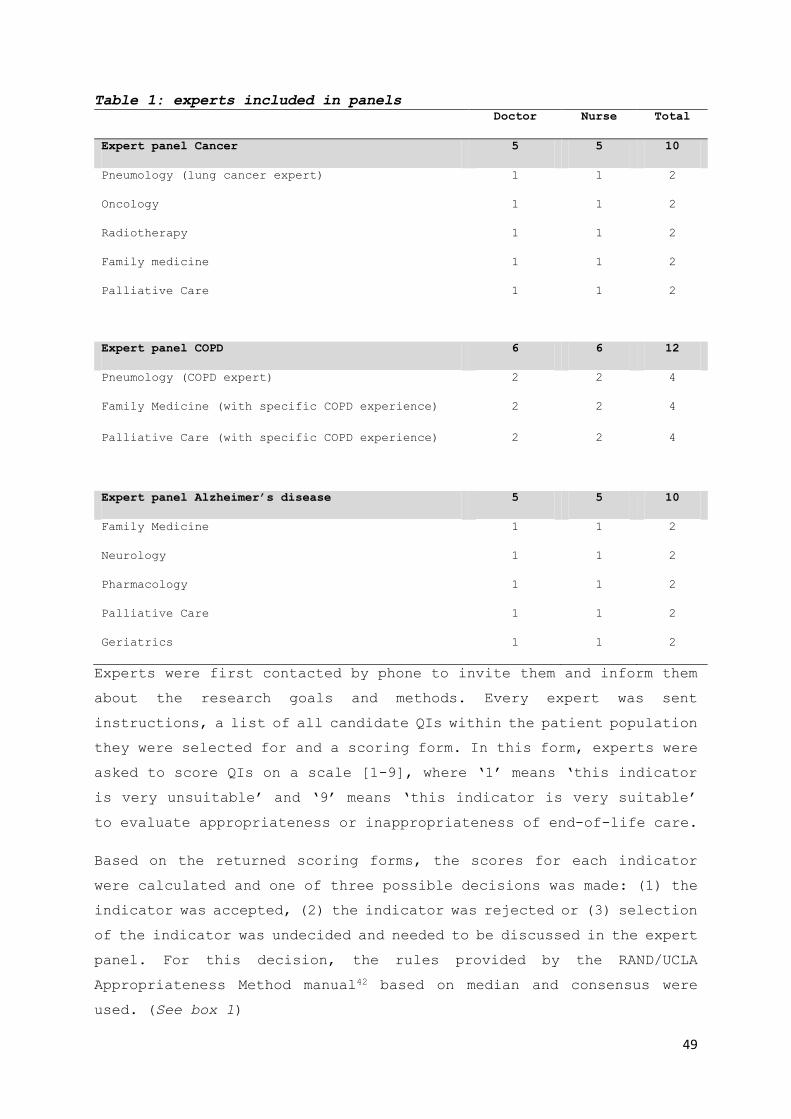
Table 1: experts included in panels
Doctor Nurse Total
Expert panel Cancer 5 5 10
Pneumology (lung cancer expert) 1 1 2
Oncology 1 1 2
Radiotherapy 1 1 2
Family medicine 1 1 2
Palliative Care 1 1 2
Expert panel COPD 6 6 12
Pneumology (COPD expert) 2 2 4
Family Medicine (with specific COPD experience) 2 2 4
Palliative Care (with specific COPD experience) 2 2 4
Expert panel Alzheimer’s disease 5 5 10
Family Medicine 1 1 2
Neurology 1 1 2
Pharmacology 1 1 2
Palliative Care 1 1 2
Geriatrics 1 1 2
Experts were first contacted by phone to invite them and inform them
about the research goals and methods. Every expert was sent
instructions, a list of all candidate QIs within the patient population
they were selected for and a scoring form. In this form, experts were
asked to score QIs on a scale [1-9], where ‘1’ means ‘this indicator
is very unsuitable’ and ‘9’ means ‘this indicator is very suitable’
to evaluate appropriateness or inappropriateness of end-of-life care.
Based on the returned scoring forms, the scores for each indicator
were calculated and one of three possible decisions was made: (1) the
indicator was accepted, (2) the indicator was rejected or (3) selection
of the indicator was undecided and needed to be discussed in the expert
panel. For this decision, the rules provided by the RAND/UCLA
Appropriateness Method manual42 based on median and consensus were
used. (See box 1)

50
Box 1: Decision model based on median and consensus
Scoring results Decision
Median score* Indication of consensus
In range 7-9 2 or fewer experts score
in range 1-3
indicator = suitable;
accepted;
In range 7-9 3 or more experts score
in range [1-3]
indicator = undecided; to
be decided in plenary
expert panel
In range 4-6 (any) indicator = undecided; to
be decided in plenary
expert panel
In range 1-3 3 or more experts score
in range 7-9
indicator = undecided; to
be decided in plenary
expert panel
In range 1-3 2 or fewer experts score
in range 7-9 ;
indicator = unsuitable;
rejected
*Score ranged from 1 to 9 with 1= ‘this indicator is very unsuitable’ and 9 = ‘this indicator
is very suitable’
One half-day expert panel was organized for each set of indicators in
February-March 2016. During the panel meeting, all undecided QIs were
discussed. Experts could freely suggest adaptations to QIs. After
about 15 minutes of discussion about each indicator, experts were
asked to vote for the QI to be (1) rejected, (2) adapted and taken
into the final set, or (3) taken into the final set without
adaptations. Only indicators for which consensus was reached (see box
1) were taken into the final set.
Ethical approval
The study was approved by the Medical Ethics Committee of the
University Hospital Brussels, Belgium. (reference number B.U.N.
143201627075)
Results
Figure 1 displays the QI development process and how many indicators
resulted from each step. In the literature search, 23 unique QIs were
identified. Expert interviews resulted in 32 additional unique
indicators. Indicators selected based on literature referred almost
equally to appropriate (12) and inappropriate (14) care, while
51
indicators from interviews rarely referred to appropriate care (6) and
often referred to inappropriate care (26).
For the expert evaluation of the candidate QIs, 1/32 experts did not
participate (doctor in neurology for panel in Alzheimer’s disease);
63/95 of the QIs were accepted directly into the final set (22/31 for
Alzheimer’s disease, 20/32 for cancer, 21/32 for COPD); 32 potential
QIs were discussed in expert panels (Alzheimer’s disease: 9, Cancer:
12, COPD: 11) Expert panels eventually rejected 13 and adapted 14 QIs,
evenly divided between the panels.
The final set consists of 28 QIs for Alzheimer’s disease (Table 2),
26 QIs for cancer (Table 3) and 27 QIs for COPD (Table 4). For
Alzheimer’s disease, indicators of appropriate care (7) were less
common than indicators of inappropriate care (21). For cancer,
indicators of appropriate (12) and inappropriate (14) end-of-life care
were evenly divided. For COPD, indicators of appropriate care (9) were
again less common than those of inappropriate care (19). A total of
14 QIs were found valid in the three pathology groups, albeit with
slight variations in the time period of measurement.

52
Figure 1: the QI development process: literature search and expert interviews
to select QIs, followed by expert panels to establish consensus.
Phase 1:
Literature review
Phase 2: Expert
interviews
Phase 3a: Expert
Selection of QIs
(scoring round)
Alzheimer
Disease
COPD Cancer
12 17 18
+19 +15 +14
31 32 32
Rejected: 0
Accepted:
22
Phase 3b: Expert
Selection of QIs
(plenary discussion)
9 11 12
Final QI set 28 28 26
Rejected: 0 Rejected: 0
Rejected: 3
Accepted: 6
(6 with
adaptations)
Rejected: 4
Accepted: 7
(4 with
adaptations)
Rejected: 6
Accepted: 6
(5 with
adaptations)
Accepted:
21
Accepted:
20
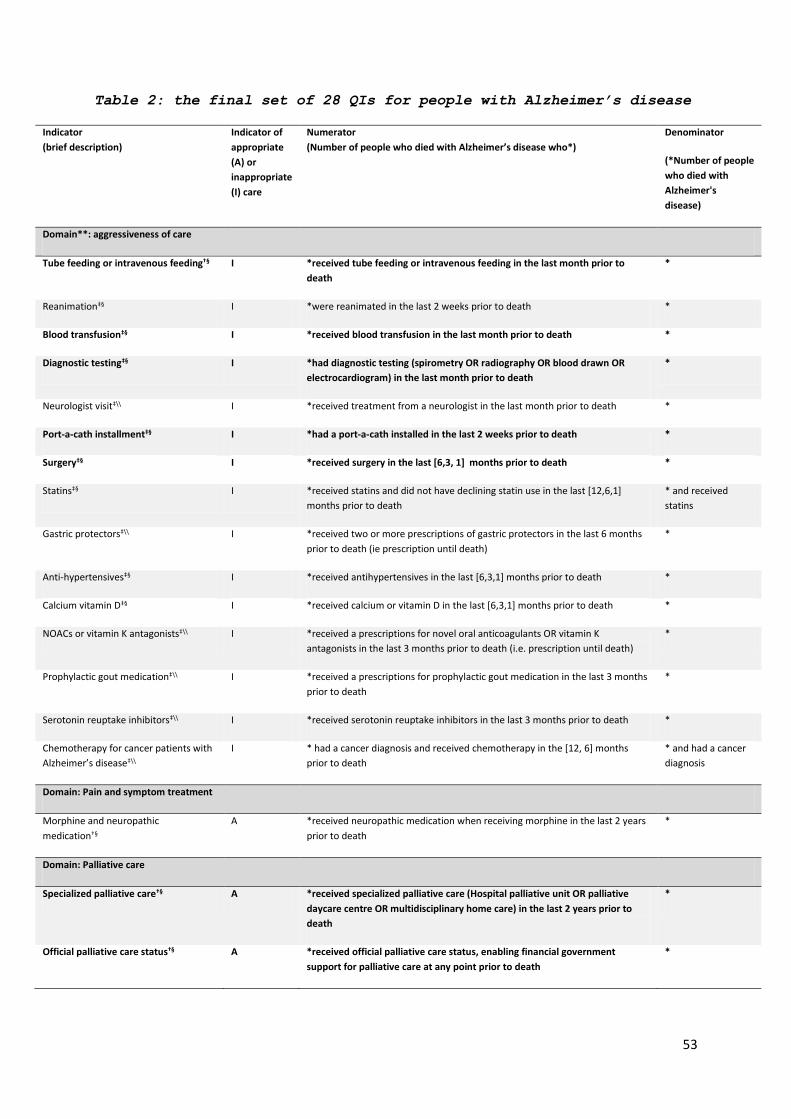
53
Table 2: the final set of 28 QIs for people with Alzheimer’s disease
Indicator
(brief description)
Indicator of
appropriate
(A) or
inappropriate
(I) care
Numerator
(Number of people who died with Alzheimer’s disease who*)
Denominator
(*Number of people
who died with
Alzheimer's
disease)
Domain**: aggressiveness of care
Tube feeding or intravenous feeding†§ I *received tube feeding or intravenous feeding in the last month prior to
death
*
ReanimationठI *were reanimated in the last 2 weeks prior to death *
Blood transfusionठI *received blood transfusion in the last month prior to death *
Diagnostic testingठI *had diagnostic testing (spirometry OR radiography OR blood drawn OR
electrocardiogram) in the last month prior to death
*
Neurologist visit‡\\ I *received treatment from a neurologist in the last month prior to death *
Port-a-cath installmentठI *had a port-a-cath installed in the last 2 weeks prior to death *
SurgeryठI *received surgery in the last [6,3, 1] months prior to death *
StatinsठI *received statins and did not have declining statin use in the last [12,6,1]
months prior to death
* and received
statins
Gastric protectors‡\\ I *received two or more prescriptions of gastric protectors in the last 6 months
prior to death (ie prescription until death)
*
Anti-hypertensivesठI *received antihypertensives in the last [6,3,1] months prior to death *
Calcium vitamin DठI *received calcium or vitamin D in the last [6,3,1] months prior to death *
NOACs or vitamin K antagonists‡\\ I *received a prescriptions for novel oral anticoagulants OR vitamin K
antagonists in the last 3 months prior to death (i.e. prescription until death)
*
Prophylactic gout medication‡\\ I *received a prescriptions for prophylactic gout medication in the last 3 months
prior to death
*
Serotonin reuptake inhibitors‡\\ I *received serotonin reuptake inhibitors in the last 3 months prior to death *
Chemotherapy for cancer patients with
Alzheimer’s disease‡\\
I * had a cancer diagnosis and received chemotherapy in the [12, 6] months
prior to death
* and had a cancer
diagnosis
Domain: Pain and symptom treatment
Morphine and neuropathic
medication†§
A *received neuropathic medication when receiving morphine in the last 2 years
prior to death
*
Domain: Palliative care
Specialized palliative care†§ A *received specialized palliative care (Hospital palliative unit OR palliative
daycare centre OR multidisciplinary home care) in the last 2 years prior to
death
*
Official palliative care status†§ A *received official palliative care status, enabling financial government
support for palliative care at any point prior to death
*

54
Late initiation of palliative care †§ I *had a first referral to specialized palliative care OR received the official
palliative statute in the last week before death
*
Domain: Place of treatment and place of death
Hospital admissions†§ I *had one or more hospital admissions in the last [6, 3, 1] month/s prior to
death
*
ICU admissionsठI *had one or more admissions to the intensive care unit in the last month prior
to death
*
ED admissions†§ I *had one or more emergency department visit/s in the last [6, 3, 1] month/s
prior to death
*
Died in hospital†§ I *died in hospital *
Home death†§ A *died at home *
Home death or death in nursing home
of residence †§
A *lived and died in a nursing home OR who died at home *
Domain: Coordination and continuity of care
GP contact†§ A *an increase in average number of contacts with a family physician in the last
month prior to death compared to the previous 23 months
*
Primary caregiver contact†§ A Sum of number of contacts with a family physician or other primary care
professional in the last 3 months prior to death
*
ICU admissions from nursing homeठI *lived in a nursing home and had one or more intensive care unit admissions
in the last month prior to death
*and lived in a
nursing home
†Indicator from literature, ‡Indicator from expert interviews, §Accepted in phase 3a scoring round,
¶Accepted in phase 3b plenary discussion, \\Adapted and accepted in phase 3b plenary discussion.
**Subdivision in domains was not part of the original methodology, but added later to facilitate
interpretation and was based on existing classification of quality domains in end-of-life-care43
Bold denotes indicators that are common across all three pathologies (cancer, COPD, Alzheimer’s).

55
Table 3: the final set of 26 QIs for people with cancer
Indicator
(brief description)
Indicator of
appropriate
(A) or
inappropriate
(I) care
Numerator
(Number of people who died with cancer who*)
Denominator
(*Number of people
who died with
cancer)
Domain**: aggressiveness of care
Tube feeding or intravenous feeding†§ I *received tube feeding or intravenous feeding in the last month prior to
death (excluding people with gatro-intestinal cancer)
*
Blood Transfusion‡\\ I *received blood transfusion in the last month before death (for people with a
hematologic condition in the last 2 weeks)
*
Diagnostic TestingठI *had diagnostic testing (spirometry OR radiography OR blood drawn OR
electrocardiogram) in the last month prior to death
*
Port-a-cath installmentठI *had a port-a-cath installed in the last 2 weeks prior to death *
SurgeryठI *received surgery in the last [6,3, 1] month/s prior to death *
Chemotherapy †\\ I *received 1 or more chemotherapy treatments in the last month prior to death *
Chemotherapy interval†\\ I Number of days between last chemotherapy treatment and death *
Chemotherapy new Line†§ I *had a new chemotherapy line initiated in the last 3 months prior to death *
Cisplatin in old ageठI *received Cisplatin and were age 80 or older *and were age 80 or
older
New anti-depressant‡\\ I *had initiation of a new anti-depressant treatment in the last 2 months prior to
death
*
Domain: Pain and symptom treatment
Opioids†§ A *received opioids in the last [6,3, 1] months prior to death *
Morphine and neuropathic
medication†§
A *received neuropathic medication when receiving morphine in the last 2 years
prior to death
*
Anti-emetics with chemotherapy†§ A *received strong anti-emetics when receiving chemotherapy in the last 2 years
prior to death
* and received
chemotherapy
Radiotherapy with Bone Metastases†§ A *had bone metastasis and received radiation therapy in the last 2 years prior to
death
*and had bone
metastasis
Radiotherapy with small cell lung
cancer‡§
A *died with small cell lung cancer and received antalgic radiotherapy in the last
2 years prior to death
*and had small cell
lung cancer
Domain: Palliative care
Specialized palliative care†§ A *received specialized palliative care (Hospital palliative unit OR palliative
daycare center OR multidisciplinary home care) in the last 2 years prior to
death
*
Official palliative care status†§ A *received official palliative care status, enabling financial government
support for palliative care at any point prior to death
*

56
Late initiation of palliative care †¶ I *had a first referral to specialized palliative care OR received official palliative
status in the last week before death
*
Domain: Place of treatment and place of death
Hospital admissions†§ I *had one or more hospital admissions in the last [6, 3, 1] months prior to
death
*
ICU admissions from nursing homeठA * lived in a nursing home and had one or more intensive care unit admissions
in the last [6, 3, 1] months prior to death
*and lived in a
nursing home
ED admissions†§ I *had one or more emergency hospital visits in the last [6, 3, 1] months prior
to death
*
Home death†§ A *died at home *
Death in nursing home of residence †\\ A *died in the nursing home where they lived *and lived in a
nursing home
Domain: Coordination and continuity of care
GP contact†§ A * had an increase in average number of contacts with a family physician in
the last month prior to death compared to the previous 23 months
*
Primary caregiver contact†§ A Total number of contacts with a family physician or other primary care
professional in the last 3 months prior to death
*
Multi-disciplinary Oncologic ConsultठA *had a Multidisciplinary Medical Consult *
†Indicator from literature, ‡Indicator from expert interviews, §Accepted in phase 3a scoring round,
¶Accepted in phase 3b plenary discussion, \\Adapted and accepted in phase 3b plenary discussion.
**Subdivision in domains was not part of the original methodology, but added later to facilitate
interpretation and was based on existing classification of quality domains in end-of-life-care43
Bold denotes indicators that are common across all three pathologies (cancer, COPD, Alzheimer’s).

57
Table 4: the final set of 27 QIs for people with COPD
Indicator
(brief description)
Indicator of
appropriate (A) or
inappropriate (I)
care
Numerator
(Number of people who died with COPD who*)
Denominator
(*Number of
people who died
with COPD)
Domain: aggressiveness of care
Tube feeding or intravenous
feeding †§
I *received tube feeding or intravenous feeding in the last month prior to
death
*
Endotracheal intubation or
tracheotomy†§
I *received endotracheal intubation or tracheotomy in the last [12, 6, 3, 1]
months prior to death
*
Continuous endotracheal
intubation†§
I *received continuous endotracheal intubation for 5 days or more in the last
[12, 6, 3, 1] months prior to death
*
Repeated intubationठI *received intubation 2 or more times in the last [12, 6, 3, 1] months prior to
death
*
Reanimation after intubationठI *were reanimated after intubation in the last week prior to death *
Late physiotherapyঠI *started physiotherapy treatment in the last 2 weeks prior to death *
Blood transfusion‡\\ I *received blood transfusion in the last month prior to death *
Port-a-cath installmentठI *had a port-a-cath installed in the last 2 weeks prior to death *
Lung volume reduction surgery†§ I *received Lung Volume Reduction Surgery in the last 3 months prior to death *
Coronary or abdominal surgeryठI *received coronary or abdominal surgery in the last 3 months prior to death *
SurgeryठI *received surgery in the last [6, 3, 1] months prior to death *
Diagnostic testingठI *had diagnostic testing (spirometry OR radiography OR blood drawn OR
electrocardiogram) in the last month prior to death
*
Starting Antidepressants‡\\ I *received antidepressants in the last month prior to death and did not
receive antidepressants before
*
Domain: Pain and symptom treatment
Opioids†§ A *received opioids in the last [6,3, 1] months prior to death *
Inhalation therapyठA *received inhalation corticosteroids OR anticholinergics OR Beta-2-memetics
in the last [6, 3, 1] months prior to death
*
Domain: Palliative care
Specialized palliative care†§ A *received specialized palliative care (hospital palliative unit OR palliative
daycare centre OR multidisciplinary home care) in the last 2 years prior to
death
*
Official palliative care status†§ A * received official palliative care status, enabling financial government
support for palliative care at any point prior to death
*
Late initiation of palliative care †¶ I * had a first referral to specialized palliative care OR received official
palliative status during the last week before death
*

58
Domain: Place of treatment and place of death
Hospital admissions†¶ I * had one or more hospital admission/s in the last [6, 3, 1 }months prior to
death
*
ICU admissionsठI * had one or more admissions to the intensive care unit in the last month
prior to death
*
ICU admissions from nursing
home‡§
I *lived in a nursing home and had 1 or more ICU visits in the last month
prior to death
*and lived in a
nursing home
ED admissions†\\ I * had one or more emergency hospital visits in the last [6, 3, 1 }months
prior to death
*
Hospital death†¶ I *died in hospital *
Home death†§ A *died at home *
Death in nursing home of residence
†§
A *lived and died in a nursing home *and lived in a
nursing home
Domain: Coordination and continuity of care
GP contact†§ A *had an increase in average number of contacts with a family physician in
the last month prior to death compared to the previous 23 months
*
Primary caregiver contact †§ A Sum of number of contacts with a family physician or other primary care
professional in the last 3 months prior to death
*
†Indicator from literature, ‡Indicator from expert interviews, §Accepted in phase 3a scoring round,
¶Accepted in phase 3b plenary discussion, \\Adapted and accepted in phase 3b plenary discussion.
**Subdivision in domains was not part of the original methodology, but added later to facilitate
interpretation and was based on existing classification of quality domains in end-of-life-care43
Bold denotes indicators that are common across all three pathologies (cancer, COPD, Alzheimer’s).
Supplementary table S.4 (see appendix) presents all QIs that were
rejected by the expert panels with a reason for rejection. The most
common reasons were: (1) the lack of an alternative given the patient’s
medical status, thus not inappropriate; (2) the QI would only be
relevant to a specific subpopulation that is unidentifiable with
available data; (3) strong individual variation between patients
determines appropriateness, therefore population-level measurement
cannot be valid; (4) the QI is not measurable in a reliable or valid
manner with the currently available administrative data.

59
Discussion
Summary of main findings
We developed a set of quality indicators that can be measured using
routinely collected administrative data for population level
measurement of the appropriateness of end-of-life care for patients
with COPD, Alzheimer’s disease or cancer. Consensus was reached by
multidisciplinary expert panels on a total of 82 indicators across the
three pathologies, all measurable with administrative data.
Strengths and limitations
Our study used a RAND/UCLA appropriateness method to select QIs, which
is a widely accepted consensus method.40,42 The addition of expert
interviews broadened the scope of our search for candidate indicators,
while still using the same strict criteria for indicator evaluation
by consensus in the expert panels. Our focus of measurability with
available administrative data limited the number of candidate QIs when
compared with previous studies that did not target indicators based
on administrative data25,43. As a result, several important quality
aspects, such as communication, patient satisfaction or psychosocial
wellbeing are not included in the current set. As soon as countries
systematically start to record this information the QI sets can be
complemented with indicators covering these quality of care aspects.
Another limitation of our study is that we did not include certain
groups of stakeholders that can provide additional perspectives on
quality of care, such as patients and families44. However, this choice
was based on to the medical-administrative approach of our study. We
limited our study to medical experts (doctors and nurses) with
potential expertise on what could be validly operationalized with the
available health claims and administrative data and who would have
sufficient technical and medical understanding of which techniques,
interventions and medications would indicate potential
inappropriateness at an aggregated level. Nevertheless, we believe
that the missing perspectives can be reintroduced as soon as scores
for the quality indicators are presented and discussed in an
interdisciplinary group, as a form of additional face validation.
60
Comparison with previous research
Previous studies developing and validating population-level QIs for
end-of-life care measurable with administrative data were strongly
focused on cancer 21–23,25,29. Compared with these studies, we identified
a larger number of QIs. This is mainly the result of the level of
detail and broadness of spectrum of the available administrative data
in Belgium that contain detailed health care information45. Because it
is very likely that such data are also available in other countries
our indicator set may have a broader international relevance and
applicability.46 However, a particularly important addition in our
study compared to the state of the art is the development and
validation of QI sets for end-of-life care, measurable with
administrative data, in COPD and Alzheimer dementia. These patient
groups can be identified using either diagnostic data (e.g. death
certificate data) or validated algorithms based on specific treatments
and medication use. The use of these sets in different national and
international evaluations of end-of-life care may be an important
contribution to an increased attention to monitoring and improving
end-of-life care in COPD and Alzheimer Dementia.
Implications for policy, practice and research
The QIs developed in this study have multiple uses. They allow the
provision of evidence for the level of appropriate and inappropriate
end-of-life care within a country, comparison between regions and
health care providers (and provider types), or between subgroups of
patients determined, for instance, by age, gender, educational
attainment, income, etc.47 The QIs cannot serve as indicators for
appropriate or inappropriate care at the level of individual patients,
because clinical factors justifying an intervention or personal
preferences can widely vary between individual patients. Rather, QIs
provide a snapshot of the performance of the health care system, with
respect to appropriateness of end-of-life care. The use of the QIs can
pinpoint discrepancies between health care use and government policy
goals, uncover possible inequities in end-of-life care delivery, and
eventually isolate underlying factors explaining differences48. This
provides a unique perspective on use, access and availability of
appropriate care across subpopulations. A strength of our QI sets is

61
that their reliance on routinely collected administrative data
provides a large amount of information without incurring any
measurement burden on health care staff or institutions49.
An important goal for these QIs is to establish benchmarks for policy
makers and care professionals that would indicate areas of good
practice or underperformance50 that could then serve as relative
standards to improve the quality of care. For the current QI set no
such benchmarks have been validated in the literature.21,22,29 However,
we could use descriptive statistics to show the distribution of
appropriate and inappropriate care across the population. Earle, for
example, suggests using the best decile as a desirable benchmark. This
was applied to eight indicators in the set from Earle et al. for cancer
patients (e.g. the best decile benchmark for ‘percentage of patients
with more than one hospitalization in the last month of life’ was set
at <4%).22 Using such a data driven approach provides the advantage of
setting realistic norms that are attainable by default.51 Moreover,
they can be recalculated as the quality of care improves, stimulating
continuous quality development.22 However, before these benchmarks are
used when comparing regions or care providers, determining appropriate
risk adjustment is essential52. Relevant variations in patient
population that have a considerable effect on the indicator scores
need to be controlled for in order to increase the so-called
attributional validity, i.e. the conviction that observed outcome
differences causally relate directly to quality of care rather than
to other factors. Moreover, even with sophisticated risk adjustment
strategies caution is needed about the manner in which our end-of-life
care QI sets are used in comparisons. Examples from other domains of
health care have shown how the use of performance indicators in pay-
for-performance models have led some clinicians or health-care
facilities to ‘game’ the system by avoiding patients who can lower a
performance score52.
While the purpose of QIs is often to measure quality of care at an
organizational level for internal monitoring53,13,21,40, our sets can
provide a basis for cross-regional and cross-national measurement and
comparison. Although the validity of the sets may not necessarily
transfer to other countries, they can be relevant for all countries

62
where administrative health care databases are accessible. Several
indicators can be transferred directly and used in an international
context (e.g. because they are derived from international literature),
others may demand country-specific translations.
Further research questions
Developing these QIs is only a first step. The next step would be to
measure them using the available administrative databases. Our QI sets
have now been evaluated for validity and acceptability (through the
expert meetings) and feasibility (measurability with the existing
administrative data as a premise), although other countries that wish
to use the indicator set may want to evaluate acceptability and
feasibility within their own national context. In measuring the QIs
quantitatively we can further evaluate reliability (e.g. when measured
across health care settings) and sensitivity to change.40 QIs must also
relate to enough patients to make comparing data feasible - for
example, by excluding those aspects of care that occur in less than
1% of clinical audit samples.40 Some of the QIs developed in this study
may not proof to be useful in practice, even if approved by experts,
e.g. because measurement result may have a ceiling effect (close to
100% or 0%) or vary too little across subpopulations to provide any
useful information. Finally, necessary additional measures are needed
to go from measuring quality towards improving it. The QIs indicate
end-of-life care areas that need improvement but it requires QI-based
policy-setting, which can include appropriate end-of-life care
training, financial incentives or infrastructure to actually improve
care.
Conclusion
We developed comprehensive sets of QIs of appropriate and
inappropriate end-of-life care in people with Alzheimer’s disease,
cancer or COPD, to be used in population-level research and monitoring
using administrative health care databases. Our approach focusing on
options provided by administrative health care databases is limited
to to treatment and medication and excludes other important quality
aspects, such as communication, which are ideally monitored using
complementary approaches. Nevertheless, our sets will enable an

63
efficient comparison of health care providers, regions and countries
in terms of their performance on appropriateness of end-of-life care.
Acknowledgements
The authors thank all medical experts, doctors and nurses involved in
the interviews and expert panels. They made this study possible. We
thank Jane Ruthven and Miete Tilkin for professional language support
as native English speakers.

64
References
1. Byock, I. Completing the continuum of cancer care: integrating life-
prolongation and palliation. CA. Cancer J. Clin. 50, 123–132 (2000).
2. Numico, G. et al. Active treatment given in the last weeks of life:
poor quality cancer care or justifiable behavior? Support. Care Cancer 22,
2813–2819 (2014).
3. Greer, J. A. et al. Effect of early palliative care on chemotherapy
use and end-of-life care in patients with metastatic non-small-cell lung
cancer. J. Clin. Oncol. Off. J. Am. Soc. Clin. Oncol. 30, 394–400 (2012).
4. Bakitas, M. A. et al. Early Versus Delayed Initiation of Concurrent
Palliative Oncology Care: Patient Outcomes in the ENABLE III Randomized
Controlled Trial. J Clin Oncol 33, 1438–45 (2015).
5. Bakitas, M. et al. Effects of a palliative care intervention on
clinical outcomes in patients with advanced cancer: the Project ENABLE II
randomized controlled trial. JAMA 302, 741–749 (2009).
6. Mack, J. W. et al. Associations between end-of-life discussion
characteristics and care received near death: a prospective cohort study.
J. Clin. Oncol. Off. J. Am. Soc. Clin. Oncol. 30, 4387–4395 (2012).
7. Pataky, R. E. et al. Population-based trends in systemic therapy use
and cost for cancer patients in the last year of life. Curr. Oncol. Tor.
Ont 23, S32-41 (2016).
8. Pacetti, P. et al. Chemotherapy in the last 30 days of life of
advanced cancer patients. Support Care Cancer (2015). doi:10.1007/s00520-
015-2733-6
9. Morrison, R. S. & Meier, D. E. Clinical practice. Palliative care. N
Engl J Med 350, 2582–90 (2004).
10. Institute of Medicine, (voornaam). Dying in America: Improving
Quality and Honoring Individual Preferences Near the End of Life.
11. Chassin, M. R. et al. Variations in the use of medical and surgical
services by the Medicare population. N Engl J Med 314, 285–90 (1986).
12. Park, R. E. et al. Physician ratings of appropriate indications for
six medical and surgical procedures. Am J Public Health 76, 766–72 (1986).
13. Grunfeld, E. et al. Toward population-based indicators of quality
end-of-life care: testing stakeholder agreement. Cancer 112, 2301–8 (2008).
14. Cacciola, J. S. et al. Assessing Adolescent Substance Abuse Programs
with Updated Quality Indicators: The Development of a Consumer Guide for
Adolescent Treatment. J. Child Adolesc. Subst. Abuse 24, 142–154 (2015).
15. Wiles, L. K. et al. CareTrack Kids-part 1. Assessing the
appropriateness of healthcare delivered to Australian children: study
protocol for clinical indicator development. BMJ Open 5, e007748 (2015).
65
16. Hooper, T. D. et al. CareTrack Kids-part 2. Assessing the
appropriateness of the healthcare delivered to Australian children: study
protocol for a retrospective medical record review. BMJ Open 5, e007749
(2015).
17. van Heurn, E. et al. Quality Measurement in Neonatal Surgical
Disorders: Development of Clinical Indicators. Eur. J. Pediatr. Surg. Off.
J. Austrian Assoc. Pediatr. Surg. Al Z. Für Kinderchir. 25, 526–531 (2015).
18. Visca, M. et al. Group versus single handed primary care: a
performance evaluation of the care delivered to chronic patients by Italian
GPs. Health Policy Amst. Neth. 113, 188–198 (2013).
19. Stefan, M. S. et al. Hospital performance measures and 30-day
readmission rates. J. Gen. Intern. Med. 28, 377–385 (2013).
20. Dy, S. M. et al. Measuring What Matters: Top-Ranked Quality
Indicators for Hospice and Palliative Care From the American Academy of
Hospice and Palliative Medicine and Hospice and Palliative Nurses
Association. J. Pain Symptom Manage. 49, 773–781 (2015).
21. Earle, C. C. et al. Identifying potential indicators of the quality
of end-of-life cancer care from administrative data. J Clin Oncol 21, 1133–
8 (2003).
22. Earle, C. C. et al. Evaluating claims-based indicators of the
intensity of end-of-life cancer care. Int J Qual Health Care 17, 505–9
(2005).
23. Setoguchi, S. et al. Comparison of Prospective and Retrospective
Indicators of the Quality of End-of-Life Cancer Care. J. Clin. Oncol. 26,
5671–5678 (2008).
24. Pasman, H. R. W., Brandt, H. E., Deliens, L. & Francke, A. L. Quality
Indicators for Palliative Care: A Systematic Review. J. Pain Symptom
Manage. 38, 145–156.e21 (2009).
25. De Roo, M. L. et al. Quality Indicators for Palliative Care: Update
of a Systematic Review. J. Pain Symptom Manage. 46, 556–572 (2013).
26. Teno, J. M., Byock, I. & Field, M. J. Research agenda for developing
measures to examine quality of care and quality of life of patients
diagnosed with life-limiting illness. J. Pain Symptom Manage. 17, 75–82
(1999).
27. Ross, J. S. & Siu, A. L. The importance of population-based
performance measures. Health Serv. Res. 42, 1–6 (2007).
28. IMA-AIM. Available at: http://www.aim-ima.be/. (Accessed: 13th April
2016)
29. Grunfeld, E. et al. Towards using administrative databases to measure
population-based indicators of quality of end-of-life care: testing the
methodology. Palliat Med 20, 769–77 (2006).
30. Doiron, D., Raina, P., Fortier, I. & participants, L. B. C. and H. C.
U. D. M. of C. S. workshop. Linking Canadian population health data:

66
maximizing the potential of cohort and administrative data. Can J Public
Health 104, e258-61 (2013).
31. Seow, H. et al. A framework for assessing quality indicators for
cancer care at the end of life. J Pain Symptom Manage 38, 903–12 (2009).
32. Casarett, D. J., Teno, J. & Higginson, I. How should nations measure
the quality of end-of-life care for older adults? Recommendations for an
international minimum data set. J. Am. Geriatr. Soc. 54, 1765–1771 (2006).
33. Meñaca, A. et al. End-of-life care across Southern Europe: A critical
review of cultural similarities and differences between Italy, Spain and
Portugal. Crit. Rev. Oncol. Hematol. 82, 387–401 (2012).
34. Andrew, E. V. W. et al. Social-cultural factors in end-of-life care
in Belgium: a scoping of the research literature. Palliat. Med. 27, 131–143
(2013).
35. Gysels, M. et al. Culture and End of Life Care: A Scoping Exercise in
Seven European Countries. PLoS ONE 7, (2012).
36. Murtagh, F. E. M., Vinen, K., Farrington, K. & O’Donoghue, D. End of
life trajectories across conditions. BMJ 342, d989 (2011).
37. Mino, J.-C. & Frattini, M.-O. Chronic palliative care: specific
practices for Alzheimer’s disease sufferers. J. Palliat. Care 25, 257–263
(2009).
38. WHO | The top 10 causes of death. WHO Available at:
http://www.who.int/mediacentre/factsheets/fs310/en/. (Accessed: 27th April
2016)
39. OECD Leading causes of burden of disease.pdf. Available at:
http://www.oecd.org/els/health-systems/48831921.pdf. (Accessed: 27th April
2016)
40. Campbell, S. M., Braspenning, J., Hutchinson, A. & Marshall, M. N.
Research methods used in developing and applying quality indicators in
primary care. BMJ 326, 816–819 (2003).
41. Donabedian A. The quality of care: How can it be assessed? JAMA 260,
1743–1748 (1988).
42. The RAND/UCLA Appropriateness Method User’s Manual - MR1269.pdf.
Available at:
https://www.rand.org/content/dam/rand/pubs/monograph_reports/2011/MR1269.pd
f. (Accessed: 13th April 2016)
43. Leemans, K. et al. Systematic Quality Monitoring For Specialized
Palliative Care Services: Development of a Minimal Set of Quality
Indicators for Palliative Care Study (QPAC). Am. J. Hosp. Palliat. Care
(2016). doi:10.1177/1049909116642174
44. Lakin, J. R. et al. Improving Communication About Serious Illness in
Primary Care: A Review. JAMA Intern. Med. 176, 1380–1387 (2016).

67
45. Maetens, A., Faes, K. & De Schreye, R. Using linked administrative
databases and disease-specific databases to study end-of-life care on a
population level.
46. Hashimoto, R. E., Brodt, E. D., Skelly, A. C. & Dettori, J. R.
Administrative Database Studies: Goldmine or Goose Chase? Evid.-Based
Spine-Care J. 5, 74–76 (2014).
47. Bekelman, J. E. et al. Comparison of Site of Death, Health Care
Utilization, and Hospital Expenditures for Patients Dying With Cancer in 7
Developed Countries. JAMA 315, 272–283 (2016).
48. Benchmarking facilities providing care: An international overview of
initiatives. Available at:
http://www.ncbi.nlm.nih.gov/pmc/articles/PMC4712789/. (Accessed: 6th June
2016)
49. Jacob, J. A. Medicare at 50: Reflections From Former CMS
Administrator Donald M. Berwick. JAMA 314, 324–326 (2015).
50. International benchmarking and best practice management: in search of
health care and hospital excellence. - PubMed - NCBI. Available at:
http://www.ncbi.nlm.nih.gov/pubmed/25985514. (Accessed: 6th June 2016)
51. Coory, M. & Gibberd, R. New measures for reporting the magnitude of
small-area variation in rates. Stat. Med. 17, 2625–2634 (1998).
52. Smith, P. C., Mossialos, E. & Papanicolas, I. Performance Measurement
for Health System Improvement: Experiences, Challenges and Prospects.
(2014). Available at: http://www.euro.who.int/en/about-
us/partners/observatory/publications/studies/performance-measurement-for-
health-system-improvement-experiences,-challenges-and-prospects. (Accessed:
14th December 2016)
53. De Roo, M. L. Quality Indicators for Palliative Care from an
international perspective. (2014).

68

69
Chapter 3: Using linked administrative and disease-
specific databases to study end-of-life care on a
population level.
Arno Maetens, Robrecht De Schreye, Kristof Faes, Dirk
Houttekier, Luc Deliens, Birgit Gielen, Cindy De Gendt,
Patrick Lusyne, Lieven Annemans, Joachim Cohen
Published in BMC Palliative Care (2016)
70
Abstract
Background: The use of full-population databases is under-explored to
study the use, quality and costs of end-of-life care. Using the case
of Belgium, we explored: (1) which full-population databases provide
valid information about end-of-life care, (2) what procedures are
there to use these databases, and (3) what is needed to integrate
separate databases.
Methods: Technical and privacy-related aspects of linking and
accessing Belgian administrative databases and disease registries were
assessed in cooperation with the database administrators and privacy
commission bodies. For all relevant databases, we followed procedures
in cooperation with database administrators to link the databases and
to access the data.
Results: We identified several databases as fitting for end-of-life
care research in Belgium: the InterMutualistic Agency's national
registry of health care claims data, the Belgian Cancer Registry
including data on incidence of cancer, and databases administrated by
Statistics Belgium including data from the death certificate database,
the socio-economic survey and fiscal data. To obtain access to the
data, approval was required from all database administrators,
supervisory bodies and two separate national privacy bodies. Two
Trusted Third Parties linked the databases via a deterministic
matching procedure using multiple encrypted social security numbers.
Conclusion: In this article we describe how various routinely
collected population-level databases and disease registries can be
accessed and linked to study patterns in the use, quality and costs
of end-of-life care in the full population and in specific diagnostic
groups.

71
Background
It has been argued that there is a particular challenge for end-of-
life care research to develop a public health approach1 which would
include, among other things, the need for a focus on total populations
instead of individuals at risk or those receiving a certain health
care service. This means that many, often ‘hidden’, publics also need
to be studied.1,2 End-of-life care research indeed often suffers from
selection bias, recall bias and non-response bias3–5 and difficult-
to-reach populations tend to be under-represented due to ethical and
practical considerations6 .
Administrative data can provide a major opportunity in this respect.
They allow not only the monitoring of usage, quality and costs of end-
of-life care on a population level7, but also identifying populations
dying of or dying with a specific disease such as cancer, chronic
obstructive pulmonary disease (COPD) or Alzheimer’s disease in order
to evaluate patterns of end-of-life care within and across different
trajectories of dying.8 Many healthcare institutions generate, store
and exchange large amounts of individual patient data.9 Increasing
digitalisation in recent years has further facilitated and improved
this process.10 Although big data serve administrative purposes
particularly (e.g. billing, tracking of health care reimbursement)
they can provide useful research material from a public health
perspective.11 They often have a well-defined population and include
subgroups or difficult-to-reach populations.6 Because administrative
data registrations are usually standardized and continuously collected
they enable trend analyses and longitudinal studies. Moreover, since
the data have already been collected, they are relatively inexpensive
when compared with original data collections.2,12 The expanding
availability and quality of data input make them increasingly
interesting to use in health research. Although full-population
databases have been used to study end-of-life care since the late
nineties (e.g. in Australia13 and Canada14), the use of such data in
end-of-life care research is still under-explored.
End-of-life care researchers may face several challenges when using
administrative data. Administrative data are, for instance, not
specifically designed for research purposes and therefore not directly

72
usable for the evaluation of quality of care or quality of dying. They
are not structured in readily available variables for analysis and may
often lack the essential disease-specific or relevant socio-
demographic information needed in end-of-life care research.
Additionally, healthcare data, socio-demographic data, socio-economic
data and clinical data gathered on every citizen are stored in separate
databases that are owned and handled by different organisations. Also,
data security and confidentiality must be publicly guaranteed when
using administrative databases for healthcare research. The challenge
is thus to collect, link, integrate, store and process them so that
they provide a useful input for end-of-life care research.
Using the case of Belgium, we describe how several full-population
data sources can be accessed, linked, handled and stored in order to
obtain a rich database for evaluating the use, quality and costs of
end-of-life care. Our research questions are: (1) what data and
databases are available that provide information about end-of-life
care, (2) what are the procedures to obtain/use these data, (3) what
is needed to integrate separate databases, and (4) what variables are
available in these databases to study use, quality and costs of end-
of-life care.
Methods
To address our research aims we systematically collected the necessary
information in four phases:
1. First, we had to identify what databases provide information on
the health care use, quality and costs near the end of life. We aimed
to retrieve healthcare use data from all decedents for the two years
prior to their death. A group of end-of-life researchers and health
economics experts explored what data are available on healthcare and
medication use that additionally (1) allow identification of people
dying with or from cancer, Alzheimer’s disease or COPD; and (2) provide
relevant socio-economic and demographic information that is known from
literature to influence end-of-life care patterns. Health claims data
were used as the starting point as they provide critical data about
patterns in formal care and medication prescription at the end of
73
life. Other administrative databases and disease registries were
explored to supplement the health claims database.
2. Once the databases and the data handling organisations were
identified, the associated access procedures and permissions as well
as linking possibilities were explored.
3. To complete the linking procedure, technical aspects and privacy
protection measures were determined, explored and followed.
4. Finally, we composed an overview of available variables through
this process. We examined how they can be used to study use, quality
and costs of end-of-life care.
Results
Identification and selection of databases
A total of seven population-level databases handled by three different
organizations were identified as providing the necessary information
(Table 1).

74
Table 1: Overview of population-level databases identified as relevant
for end-of-life care research
Database
administrators
Database name Population Information provided in database
Inter Mutualistic
Agency (IMA)
Population Database Every Belgian citizen who is a
member of one of the seven
(compulsory) Belgian sickness
funds, information in
Population Database is updated
twice each year from 2002
onwards
Socio-demographic characteristics
(age, sex, date of death, place of
residence, family composition, use of
supportive measures)
Pharmanet Database Medication supply characteristics
(substance, quantity, prescriber,
expenses, refunds, delivery date)
Medical Claims
Database
Health and medical care use
characteristics (quantity of use,
reimbursement, supplier, supplier
institution, length of treatment)
Belgian Cancer
Registry
Cancer registry Every new cancer diagnosis of
Belgian residents, registered by
oncological care programs and
laboratories for anatomic
pathology
Diagnostic characteristics (date of
diagnosis, type of cancer, TNM
gradation)
Statistics Belgium Death certificate
database
Every Belgian decedent with a
registered death certificate
Direct and indirect causes of death
(in ICD-10 codes), socio-
demographics about the deceased,
place of death
Demographic dataset Every Belgian citizen Nationality group, household
composition
Socio-economic
survey (SES) 2001
and Census 2011
Every Belgian citizen,
information gathered from
multiple external administrative
databases using social security
number (Census 2011)
Highest attained education level,
occupation, housing comfort
IPCAL dataset Every Belgian citizen Net income by category
Identified but not used in our research
Belgian Ministry of
Health
Minimal Hospital
Dataset
Every hospital admission in
non-psychiatric general
hospitals
Medical, nursery and personnel data
for in-hospital care

75
The Inter Mutualistic Agency (IMA) manages the databases that included
all reimbursement data of health care consumption from all seven
healthcare insurers. Since health insurance with one of these insurers
is legally mandatory in Belgium, reimbursement data of all legal
residents are available in the IMA database. Moreover, thorough
quality procedures result in reliable usability of the database for
healthcare research. The IMA manages three databases: (1) a population
database containing socio-demographic data of all insured persons; (2)
a health care database containing health care use and costs data of
both ambulatory and hospital care and (3) a pharmaceutical database
containing medication prescription and costs data. The databases thus
provide information on an individual level across the entire Belgian
population. The IMA databases contain no information regarding medical
diagnoses or any disease specific information.
The Belgian Cancer Registry was identified as a database to identify
people who died with cancer. All Belgian oncological care programmes
of hospitals and laboratories for anatomic pathology are legally bound
to register each new cancer diagnosis with the cancer registry. The
latter manages a database with diagnostic information on all
incidences of cancer i.e. date of diagnosis, type of cancer and TNM
(tumour node metastasis) classification of malignant tumours.16
However, the cancer registry data does not make it possible to
distinguish between those who died ‘from’ cancer and those who died
‘with’ cancer. Additionally, since no similar registries were
available to identify those who died with or from Alzheimer’s disease
and COPD we identified the death certificate data as a necessary
additional database. Death certificate data in Belgium are collected
by three administrations (corresponding to the three semi-autonomous
regions in the country, i.e. Brussels, Flanders and Wallonia) and are
integrated by Statistics Belgium into one national database for cause
of death statistics. This database provides the causes of death and
associated causes of death (coded in ICD-10 [10th revision of the
International Statistical Classification of Diseases and Related
Health Problems] codes) for all decedents.
Statistics Belgium also manages the national demographic database,
derived from the population register17 and containing for example the

76
household composition of every citizen and data from the Socio-
Economic Survey 2001 and Census 2011, nationwide full population
surveys based on the tradition of population count18. The database
contains information about the highest educational level attained, the
last held occupation (as a measure of socio-economic position) and
housing characteristics, which are all socio-economic factors that
have been identified in previous studies as affecting end-of-life care
patterns.19–21 Finally a database containing fiscal data (i.e. net
taxable household income), also managed by Statistics Belgium, was
identified as providing additional socio-economic variables of
influence on end-of-life care patterns.
For more specific clinical data, the Minimal Hospital dataset,
providing clinical information associated with hospitalizations, was
looked at for possible inclusion. This dataset has high quality data
and provides diagnostic information (in ICD-codes), which allows for
a more exact clinical description of the study population. It is
however limited to in-hospital data, limiting the study population.
Additionally, clinical information can be abstracted from health care
claims data using specific algorithms. Obtaining cause of death
information and using healthcare claims data makes up for the lack of
clinical data. Therefore inclusion of the Minimal Hospital dataset was
found to be unnecessary.
The combination of identified databases would provide information on
formal health care and medication prescription, causes of death, main
diagnosis (through the cancer diagnostic information of the cancer
registry and algorithmic estimation methods in the IMA databases), and
various relevant socio-demographic and socio-economic information.
Access procedures
Two types of approval were needed for every database: (1) internal
approval from database administrator organisations and (2) approval
from the relevant Belgian Privacy Commission bodies.
(1) To obtain access to the IMA and cancer registry databases several
steps are required. First, a declaration of interest needs to be set
up between researchers and IMA and cancer registry programme managers.
Research goals, databases, variables and linking possibilities (see

77
Data linkage procedure) need to be discussed. After IMA and cancer
registry programme managers agree on cooperation, the research project
(research goals and requested data) is presented to IMA and cancer
registry directory boards for approval.
To obtain access to the databases administered by Statistics Belgium,
no formal approval of the directory board is required, since Statistics
Belgium is legally committed to providing data for research. Based on
the requested data, variables and linking possibilities (see Data
linkage procedure) the statisticians of Statistics Belgium deliver
non-binding advice. Data requests should be filed directly to the
Privacy Committee.
All involved partners then discuss the final selection of data and
variables and initiate preparations for the linking procedure. The
linking of the databases is a main issue for approval by the involved
Privacy Commission bodies.
(2) We needed the approval of two separate national sectoral committees
for privacy protection for access to the various databases and the
database integrating all databases: the ‘Sectoral Committee of Social
Security and Health, Section Health’ and the ‘Statistical Supervisory
Committee’. Both are subcommittees of the Belgian Commission for the
Protection of Privacy. The former is responsible for privacy
protection of health care data (IMA and cancer registry databases),
the latter for privacy of national statistical data (Statistics
Belgium databases). The application to the Sectoral Committee of
Social Security and Health, Section Health consists of two phases.
Phase 1 is the submission of the application and a first assessment
by the committee in a plenary meeting. The primary investigator of the
study presents the research goals and data linkage procedure to the
committee at this plenary meeting. In our application special
attention was given to the selection of different variables to receive
data with sufficient detail for analysis, but at the same time reducing
the risk of re-identification of deceased individuals and their
families in order to preserve privacy. Changes in the linking procedure
and storage on a separate server were requested (see section on data
linkage for more details). Phase 2 is the formal approval during a
second plenary meeting of the committee, after having received
78
additional information from the applicant. In our case, the committee
requested an additional risk analysis to ensure privacy of the included
individuals, which was not requested in the first phase. Formal
approval was granted only after a third plenary meeting. The full
process took six months from application to formal approval.
The Statistical Supervisory Committee application procedure consists
of one phase in which the application is assessed and discussed on a
plenary meeting. Formal approval was granted after the first meeting.
Data linkage procedure
All eligible databases needed to be linked into one integrated database
for analysis; a common unique identifier (i.e. social security number)
made deterministic linking possible. Although the death certificate
database does not contain this unique identifier, Statistics Belgium
performed a linkage between the death certificate database and the
national registry database based on date of birth, sex, and
municipality of residence in order to include this unique identifier
as a variable. Unique linkage was possible for 98.4% of deaths .
For privacy reasons, Trusted Third Parties (TTPs) ‘eHealth’ and
‘Crossroads Bank for Social Security (CBSS)’ were responsible for the
simple deterministic one-to-one record linkage of the IMA, cancer
registry and Statistics Belgium databases. The linkage procedure
(Figure 1) consisted of 13 steps of data-coding or decoding and data
transfers needed to ensure that none of the involved parties would
have access to both the sensitive data and the social security numbers
or to their own databases enriched with data from one of the other
parties. Only the researchers have access to the complete linked
database without unique identifiers using a Virtual Private Network
(VPN) connection with secure token.

79
Figure 1: The linkage procedure
Linkage of all data for deaths in 2012 (including health care
information about the two years prior to death) were completed in a
first phase of the project. In a second phase all data for all deaths
2010-20xx are linked, where data from subsequent years will be added
upon availability. A major consideration in the decision to adopt this
phased approach is the size of the linked database. The linked database
(deaths in one year) will be used for the initial analysis, after
which a selection of variables and/or information can be made.

80
Variables with too many missing data or variables that are inaccurate
can be dropped. Additionally, the initial analysis will inform on what
health care interventions or medications are suitable for further
analyses. Finally, based on this first analysis phase, detailed
information can be aggregated. The second and third delivery will
therefore include more cases with more condensed information per case.
Since all databases depend on submission by individual organisations
or institutions, a two-year delay is common. Linkage can only be
initiated after all data are complete.
Available information and data handling
Variables selected in this study include data on health care use,
prescribed medication, demographics, socio-economics and use of
special reimbursement rules. A complete list of variables can be found
in the appendix, supplementary table S.5.
Several steps were necessary to make the data analysis-ready:
1. In the IMA databases, health care and medication data are coded as
nomenclature and Anatomical Therapeutic Chemical Classification (ATC)
codes. In order to answer research questions, nomenclature numbers had
to be interpreted and possibly aggregated by the researchers into
meaningful categories.
2. Due to privacy concerns, no raw dates (e.g. date of birth,
prescription date) were provided by database administrators. Dates of
medication delivery or health service provision were therefore
transformed into a number of days before death. Combinations of these
recoded dates and nomenclature or ATC codes are used to determine
whether certain interventions occur within a certain time period
before death.
3. Since no data were provided on diagnosis in the current set of
linked databases (only causes of death are available), algorithms were
used to abstract diagnostic information from health care and
medication prescription data. Algorithms were developed to identify
people with COPD or Alzheimer’s disease, based on treatments and
medication received. The algorithms were developed using existing
evidence22–24 and were validated by medical experts and medical data
81
experts from the IMA. They were then applied by the IMA, prior to the
linking procedure, because data were used that were not available to
the researchers; data provided to the researchers were limited to two
years prior to death, while data used for identification of patients
with Alzheimer’s disease went back to six years before death.
Combinations of the algorithmic identification of diagnosis and the
causes of death (including the associated causes) can be used to
identify relevant disease groups in the analyses.
Discussion
Summary of main results
In linking information from seven different datasets we managed to
obtain a database that can provide information about patterns in the
use, quality and costs of end of life care at the level of the full
population and their associations with various clinical, socio-
demographic, socio-economic and environmental factors. The process of
obtaining this involved detailed identification of databases fitting
the study aims, negotiation with and formal approval of three database
administrators, three supervisory bodies and two national privacy
commissions and eventual linking of all databases through two Trusted
Third Parties (TTPs) using multiple encrypted social security numbers.
We believe that the described process can be particularly helpful to
researchers in other countries in compiling similar population-level
databases on end-of-life care. A number of considerations
(limitations, strengths and opportunities) and recommendations can be
made based on our experience.
Limitations of our study
Our study involved a systematic and thorough exploration of how several
databases providing information on end-of-life care can be accessed,
handled and linked into an integrated and enriched database. However,
an important limitation is that linkage with information on patient-
related outcomes of healthcare services, such as specific Patient
Reported Outcome Measures (PROMs) was not explored in our study. Even
82
though PROMs are important indicators to evaluate whether increased
healthcare expenditure results in better health outcomes, their
inclusion in a population-level database is only meaningful if there
is sufficient standardization in the measurement methodology. In
Belgium, a common coding system for PROMs is lacking and would be
time-consuming to perform.25 Future efforts could be made to include
PROMs at a population level.
Opportunities of the collected database
Our efforts resulted in a population-level database with detailed
information about formal end-of-life care, the costs of care and
demographic, socio-economic and diagnostic information on decedents.
The opportunities provided by such a database to study use, quality
and costs of end-of-life care are considerable. The main overall
advantage is that data are population-level and therefore not subject
to sample bias such as in surveys or medical records studies of
selected groups of patients. Compared to primary data collection,
using linked routinely collected databases as in our case is less
expensive and less time-consuming. In the end-of-life care context
specifically, primary data collection can be burdensome for patients
and caregivers. Furthermore, in routinely collected databases, high-
quality data are available on the spot, although they are not
deliberately collected for research aims.
Although the linked database does not include certain types of
information that are important in evaluating quality of care, such as
patient-specific preferences of care, psycho-social information,
patient or family reported outcomes and experiences or information
about pain and symptom management or communication aspects26, the
full-population data have the potential to provide robust and
population-level measures of the quality of end-of-life care using
specific claims-based quality indicators. These quality indicators,
e.g. mapping inappropriate end-of-life care, have been used in various
studies as measures for the quality of end-of-life care.27 If preceded
by an adequate validation process, they can provide a detailed image
of the quality of end-of-life care by regions or health care
providers.27 The linked database also contains data on all direct
medical costs and reimbursed service and medication use, which offers

83
opportunities to study direct medical costs and patterns in the use
of specific end-of-life care for full populations. Policy measures
that support palliative care include financial compensation directed
towards the patient (e.g. monthly lump sum to cover additional costs
for palliative home patients). Using this database, patterns in the
uptake of these measures can be mapped and compared between population
or pathology groups. As the linked database contains individual data,
these data can be aggregated on multiple levels, which makes
longitudinal, disease-, treatment- or provider-specific analyses
possible. As a result, it is also possible to evaluate the influence
of certain policy measures and governmental support programmes.
Without the rich population-level data we collected it would be
impossible to answer these example research questions without facing
major issues of reliability, generalizability, feasibility and costs.
Data allow us to follow back the treatment history and costs of those
treatments up to two years before death. Although a shorter period
before death may be sufficient to study several aspects of end-of-life
care in specific disease groups, for other (particularly non-cancer)
longer time periods are warranted. The decision to request all health
care and medication data up to two years before death (irrespective
of when the diagnosis was made) was also made for practical reasons
as going further back would substantially increase storage and
analysis requirements.
Limitations of the collected database
A limitation of these types of routinely collected population-level
data is that services not covered by insurers are not included.
Researchers from other countries that wish to compile a similar
database need to remember that what is not covered by insurance (and
hence not found in the data) may be country- or even region-specific.
In Belgium, data are relatively complete, for health care services in
the hospital, nursing homes and at home. Nevertheless use of certain
services cannot be identified because there is no individual
reimbursement (e.g. mobile hospital palliative care teams) or such
reimbursement is not regulated or generalized (e.g. consultations of
a psychologist). Secondly, total out-of-pocket spending is not
available in the integrated database. This results in an overall

84
underestimation of the total cost of end-of-life care. Nevertheless,
administrative data are an essential source of information for studies
on the financial burden of end-of-life care for the health care budget
and are valuable for policymakers in informing their decisions on
health care policy.8
Considerations and actions for researchers considering similar
database constructions (Table 2)
The linkage process is crucial in obtaining a useful population-level
database. It enables the enriching of the population-level data on
formal end-of-life care and the costs of that care with putative
demographic, socio-economic and diagnostic information for the study
of end-of-life care patterns. This allows the development of
explanatory models and the provision of public health information to
policy makers, for example on social differences and differences
between pathology groups. It can support discussions on the
organization of the health care system, based for instance on possible
existing inequities.
Table 2: Considerations for researchers planning to link databases
Topics Considerations
Exploring relevant
databases
Are my research questions clear and well-defined? What data are needed to answer
them?
What is/are my study population(s)? What data are needed to identify it?
What database(s) contains the core data and could thus be selected as a starting
point?
When a starting database is chosen, what data are lacking to fully address the
research questions? Where can we find them?
How can we establish contact with the database administrators of the databases?
Obtain principal approval from all administrators (e.g. by presenting the study to
the board of directors)
What is the cost associated with each database?
Variable selection
What specific variables do we need from the selected databases to answer our
research questions?
Are the variables we want available and linkable between the different databases?

85
Does the preferred selection of variables complicate the linking procedure
considerably? Balance the gain in information with the increase in complexity and
time.
What is the required level of detail for each variable? Balance the preferred level
with what is allowed in terms of data protection (e.g. through small cells risk
analysis to determine risk of re-identification based on a combination of variables)
Do we have sufficient storage capacity and analysis hardware to store and analyze
all the data we want?
Access procedures
What ethical and privacy procedures need to be followed to link and access the
selected database?
What technical procedures need to be followed to link and access the selected
databases?
Infrastructure
How will data be stored safely? Is infrastructure provided by researchers or by
database administrators? What is the cost for this infrastructure?
How will data be protected? Physical and digital protection need to be guaranteed.
How can data be accessed in a safe and easy way? What hardware and software do
we need to access and analyze the requested data?
The flip side is that the linking can create additional difficulties
in the process of obtaining the data. While deterministic linking is
relatively easy to complete on a technical level (even without
identical unique identifiers a deterministic linking is possible based
on a combination of variables), the main challenges for researchers
lie in the fact that 1) several separate organizations have to be
convinced to cooperate and 2) special attention needs to be given to
privacy-related issues.
Databases across health and social care may not always contain a unique
identifier variable, or not always contain accurate and fully
available information that allows identifying unique persons. In such
cases where the possibility to perform deterministic linkage is
limited the method of probabilistic linking can present a solution.
In this approach the likelihood of a correct linking is calculated and
a linking is done when the likelihood is sufficiently large.28 Several
tools have been developed to perform this probabilistic linking.29
Nevertheless, a lack of accurate and fully available personal
identifiable information constrains a probabilistic linking method.
86
A final consideration for researchers who wish to have access to
similar data in their country is that establishing and maintaining
good relationships with database administrators is crucial. Gaining
access to administrative data is an iterative process that requires a
lot of preparatory work. Database administrators are the researchers’
access points to the data and have all the information about internal
procedures. Strict procedures need to be followed, in close
cooperation with database administrators. We were able to arrange an
updated dataset where data from subsequent years will be added upon
availability in the same approval and agreement, which limits the time
of going through all necessary permissions each time an updated dataset
is needed. Since administrative data are often not gathered with the
intention of research, or only for internal use, the process of making
the data analysis-ready can take time. Researchers must adapt to how
data are registered and stored, before they can effectively use them
for research.
Conclusion
Linking and accessing various routinely collected population-level
databases involves challenges but offers substantial opportunities to
study patterns in the use, quality and costs of end-of-life care both
in the full population and for specific diagnostic groups. This study
has identified that it is possible to combine data from different
databases in order to obtain a rich database for such analysis,
including information about all reimbursed care and medication as well
as disease, demographic, socio-economic and environmental information.
While some aspects may be specific to the Belgian context, our study
has a much broader application as most developed countries collect
similar population-level databases. The process described in our
study can be a helpful aid for researchers in these countries to
compile similar data and eventually develop an international
comparative end-of-life care research agenda using administrative
health care data.
87
Declarations
Ethics approval and consent to participate
In accordance with Belgian law, approvals for access to the various
databases and the database integrating all databases were obtained
from two separate national sectoral committees for privacy protection:
the ‘Sectoral Committee of Social Security and Health, Section Health’
and the ‘Statistical Supervisory Committee’. Both are subcommittees
of the Belgian Commission for the Protection of Privacy. Additionally,
the ethics committee of the Ghent University Hospital provided
approval (B670201422382).
Authors' contributions
AM, RDS and KF have equally contributed as first authors. All authors
have contributed to the design of the study. All authors have been
involved in critically revising the first draft and read and approved
the final manuscript.

88
References
1. Cohen, J. & Deliens, L. A Public Health Perspective on End of Life
Care. (Oxford University Press, 2012).
2. Riley, G. F. Administrative and claims records as sources of health
care cost data. Med. Care 47, S51-55 (2009).
3. Benchimol, E. I. et al. Development and use of reporting guidelines
for assessing the quality of validation studies of health administrative
data. J. Clin. Epidemiol. 64, 821–829 (2011).
4. Wilchesky, M., Tamblyn, R. M. & Huang, A. Validation of diagnostic
codes within medical services claims. J. Clin. Epidemiol. 57, 131–141
(2004).
5. Brownell, M. D. & Jutte, D. P. Administrative data linkage as a tool
for child maltreatment research. Child Abuse Negl. 37, 120–124 (2013).
6. Billings, J. Using Administrative Data To Monitor Access, Identify
Disparities, and Assess Performance of the Safety Net. Agency for health
care research and quality (2003). Available at:
http://archive.ahrq.gov/data/safetynet/billings.htm. (Accessed: 21st
January 2016)
7. Blais, C. et al. Quebec Integrated Chronic Disease Surveillance
System (QICDSS), an innovative approach. Chronic Dis. Inj. Can. 34, 226–235
(2014).
8. Murray, S. A., Kendall, M., Boyd, K. & Sheikh, A. Illness
trajectories and palliative care. BMJ 330, 1007–1011 (2005).
9. Jensen, P. B., Jensen, L. J. & Brunak, S. Mining electronic health
records: towards better research applications and clinical care. Nat. Rev.
Genet. 13, 395–405 (2012).
10. Murdoch & Detsky. The inevitable application of big data to health
care. JAMA 309, 1351–1352 (2013).
11. Allan, D. E., Stajduhar, K. I. & Reid, R. C. The uses of provincial
administrative health databases for research on palliative care: Insights
from British Columbia, Canada. BMC Palliat. Care 4, 2 (2005).
12. Waien, S. A. Linking large administrative databases: a method for
conducting emergency medical services cohort studies using existing data.
Acad. Emerg. Med. Off. J. Soc. Acad. Emerg. Med. 4, 1087–1095 (1997).
13. Hunt, R. & McCaul, K. A population-based study of the coverage of
cancer patients by hospice services. Palliat. Med. 10, 5–12 (1996).
14. Johnston, G. M. et al. Identifying potential need for cancer
palliation in Nova Scotia. Can. Med. Assoc. J. 158, 1691–1698 (1998).
15. Shugarman, L. R., Decker, S. L. & Bercovitz, A. Demographic and
social characteristics and spending at the end of life. J. Pain Symptom
Manage. 38, 15–26 (2009).

89
16. Belgian Cancer Registry. Manuel Web Based Cancer Registration WBCR.
(2013).
17. FOD Binnenlandse Zaken - Algemene directie Instellingen en Bevolking.
Rijksregister - Rijksregister - IBZ Instellingen en Bevolking.
Rijksregister (2014). Available at:
http://www.ibz.rrn.fgov.be/nl/rijksregister/. (Accessed: 6th April 2016)
18. Statistics Belgium. Census 2011 - Statistics & Analyses. Census 2011
(2013). Available at: http://statbel.fgov.be/en/statistics/surveys-
methodology/census/Census2011/. (Accessed: 6th April 2016)
19. Hanchate, A., Kronman, A. C., Young-Xu, Y., Ash, A. S. & Emanuel, E.
Racial and Ethnic Differences in End-of-Life Costs: Why Do Minorities Cost
More Than Whites? Arch. Intern. Med. 169, 493 (2009).
20. Huang, C.-Y., Hung, Y.-T., Chang, C.-M., Juang, S.-Y. & Lee, C.-C.
The association between individual income and aggressive end-of-life
treatment in older cancer decedents in Taiwan. PloS One 10, e0116913
(2015).
21. Chang, C.-M. et al. Low socioeconomic status is associated with more
aggressive end-of-life care for working-age terminal cancer patients. The
Oncologist 19, 1241–1248 (2014).
22. Waldemar, G. et al. Recommendations for the diagnosis and management
of Alzheimer’s disease and other disorders associated with dementia: EFNS
guideline. Eur. J. Neurol. 14, e1-26 (2007).
23. Schmitt, F. A., van Dyck, C. H., Wichems, C. H., Olin, J. T. &
Memantine MEM-MD-02 Study Group. Cognitive response to memantine in
moderate to severe Alzheimer disease patients already receiving donepezil:
an exploratory reanalysis. Alzheimer Dis. Assoc. Disord. 20, 255–262
(2006).
24. Smidth, M., Sokolowski, I., Kærsvang, L. & Vedsted, P. Developing an
algorithm to identify people with Chronic Obstructive Pulmonary Disease
(COPD) using administrative data. BMC Med. Inform. Decis. Mak. 12, 38
(2012).
25. Black, N. et al. Patient-reported outcomes: pathways to better
health, better services, and better societies. Qual. Life Res. Int. J.
Qual. Life Asp. Treat. Care Rehabil. (2015). doi:10.1007/s11136-015-1168-3
26. Grunfeld, E. et al. Towards using administrative databases to measure
population-based indicators of quality of end-of-life care: testing the
methodology. Palliat. Med. 20, 769–777 (2006).
27. Earle, C. C. et al. Identifying potential indicators of the quality
of end-of-life cancer care from administrative data. J. Clin. Oncol. Off.
J. Am. Soc. Clin. Oncol. 21, 1133–1138 (2003).
28. Newcombe, H. B. Handbook of record linkage: methods for health and
statistical studies, administration, and business. (Oxford University
Press, Inc., 1988).

90
29. Aldridge, R. W., Shaji, K., Hayward, A. C. & Abubakar, I. Accuracy of
Probabilistic Linkage Using the Enhanced Matching System for Public Health
and Epidemiological Studies. PloS One 10, e0136179 (2015).
91
PART II: Measuring quality
indicators for end-of-life care
in Belgium

92

93
Chapter 4: Applying quality indicators for
administrative databases to evaluate end-of-life care
for cancer patients in Belgium
Robrecht De Schreye, Tinne Smets, Lieven Annemans, Luc
Deliens, Birgit Gielen, Cindy De Gendt, Joachim Cohen
Published in Health Affairs (2017)

94
Abstract
Background: End-of-life cancer care has been criticized for being too
frequently aggressive. To evaluate to what extent end-of-life cancer
care is appropriate within a health care system, population-level
quality indicators can be used. We aim to evaluate end-of-life cancer
care using quality indicators measured with population-level data.
Methods: We conducted a retrospective observational study of all
cancer decedents in 2012 in Belgium. We use full-population databases
with health care use, cancer diagnostics, demographic and socio-
economic variables. Indicators of appropriate care are calculated,
covering aggressiveness of care, pain and symptom treatment,
continuity of care, palliative care and place of death.
Principal component analysis and analysis of variance are used to
examine associations between dimensions underlying the quality
indicator set and patient characteristics.
Results: In 2012 in Belgium, 26,464 (24.54% of all deaths) people died
of cancer. 52% received specialist palliative care; 29% died at home.
In the last 30 days, 17% received chemotherapy and 82% received
diagnostic testing. For 16%, palliative care was initiated only in the
last 14 days.
Discussion: Our study suggests an overuse of inappropriate cancer care
at the end of life and an opportunity to increase the proportion of
people receiving specialist palliative care and dying at home.
95
Background
Health care at the end of life in people with cancer has often been
criticized for being too frequently inappropriate and aggressive.1–4
Curative and life-prolonging care goals often, even in the final phases
of cancer, prevail over comfort-oriented care even though the benefits
no longer outweigh the possible negative impacts.3,5–10 Research in the
USA, Canada and Australia has, for instance, evaluated end-of-life
care in cancer patients using several indicators of aggressiveness of
care and has found substantial proportions of patients receiving
chemotherapy in the last 7 days before death, having multiple
hospitalizations or emergency room visits in the last 30 days of life
and a large number of patients dying in an acute care institution.11–
14 These studies also found large variations between geographical and
health regions.11–13,15 A large international comparison study measuring
health care use found large variations between countries in death in
acute care hospitals and ICU admissions in the last months of life of
people dying with cancer.16
Inappropriate care can be defined as ‘treatment and/or medication for
which the expected health benefit (e.g. improved quality of life,
increased life expectancy, pain relief, improvement of functional
status) does not exceed possible negative outcomes (e.g. mortality,
decrease in quality of life, pain, symptom burden)’.17,18 In addition
to a quality-of-care dimension inappropriate care also has an economic
and justice dimension, for instance, through its incurred opportunity
cost: where resources are used for treatments with little
effectiveness and possibly several negative effects, the same
resources cannot be used more efficiently for other aspects of care
that are more beneficial for the patient, such as comfort care.
Providing optimally appropriate end-of-life care to people with cancer
is a major public health priority which requires an adequate assessment
of the performance of health care systems19,20. Ideally, such
assessments are done at a population level as it reduces the risk for
selection bias, and under-representation of difficult-to-reach
populations21–24 Additionally, population-level assessments of end-of-
life care, due to the use of larger numbers and its inclusivity of all
96
populations, better allow identifying variation by countries, regions,
health care settings, or socio-economic and cultural background of
patients.
To detect any quality issues in health care in the final stages of
life (and evaluate whether available resources in the health care
system are effectively used) we need to measure and evaluate the
appropriateness of end-of-life care within different populations in a
valid way.25 Quality indicators, defined as ‘well-defined and
measurable aspects of care’26 are considered to be a valid way to
measure and evaluate quality and appropriateness of care in general
and end-of-life care more specifically.27–30 Quality indicators require
a clear and unambiguous definition of what is to be measured, express
quality at an aggregated level (usually the level of a healthcare
service, institution, region or country) and are generally expressed
as a number or percentage.31 They are not used to evaluate the quality
of care for individual patients.
Previous research using quality indicators of end-of-life care has a
number of limitations: it is often limited to relatively small groups
of patients and specific care services26,29 , focused only on a limited
set of quality indicators as they were developed specifically for
measurement in the existing health claims databases of the United
States of America and Canada (e.g. Medicare databases) - as such
excluding indicators that may be measurable in health claims databases
in other countries - and were selected by experts in countries that
may not necessarily share the same views on appropriate care near the
end of life as other (e.g. European) countries 32–34. Also, previous
studies often focused on a limited population: cancer patients aged
65 years and older (because Medicare data do not cover the younger
population, which would be about half of all cancer-related deaths11).
In the context of these limitations in previous research a set of 26
quality indicators for end-of-life cancer care measurable with
routinely collected administrative data was developed including
indicators of aggressiveness of care, pain and symptom management,
palliative care, place of treatment and place of death and coordination
and continuity of care.21

97
Using the developed indicator set, this study will evaluate end-of-
life care in people dying from cancer on a population level in Belgium
using quality indicators measured with linked routinely collected
population- level data. The specific research objectives are:
1. To assess end-of-life care in people dying from cancer in Belgium
using 26 validated quality indicators of potentially appropriate and
inappropriate end-of-life care.
2. To examine the risk factors for exposure to potentially appropriate
or inappropriate end-of-life care including cancer type, socio-
demographic and socio-economic variables.
Method
Study design and data sources
We conducted a retrospective observational study of all individuals
who died from cancer in 2012 in Belgium. For this, cohort data from
eight routinely collected population-level databases, handled by three
different organizations, were linked into one database for analysis35
(see more detailed description of databases in the appendix S.3):
(1) Population database with socio-demographic data of all individuals
with healthcare insurance (legally mandatory in Belgium);
(2) Health care database containing all reimbursed health care use
data of ambulatory and hospital care;
(3) Pharmaceutical database containing all reimbursed medication data;
(4) Belgian Cancer Registry36 data with diagnostic information on all
incidences of cancer including date of diagnosis and type of cancer;
(5) Death certificate data containing cause of death information of
every death case;
(6) Population registry data containing information about citizens’
nationality and household composition;
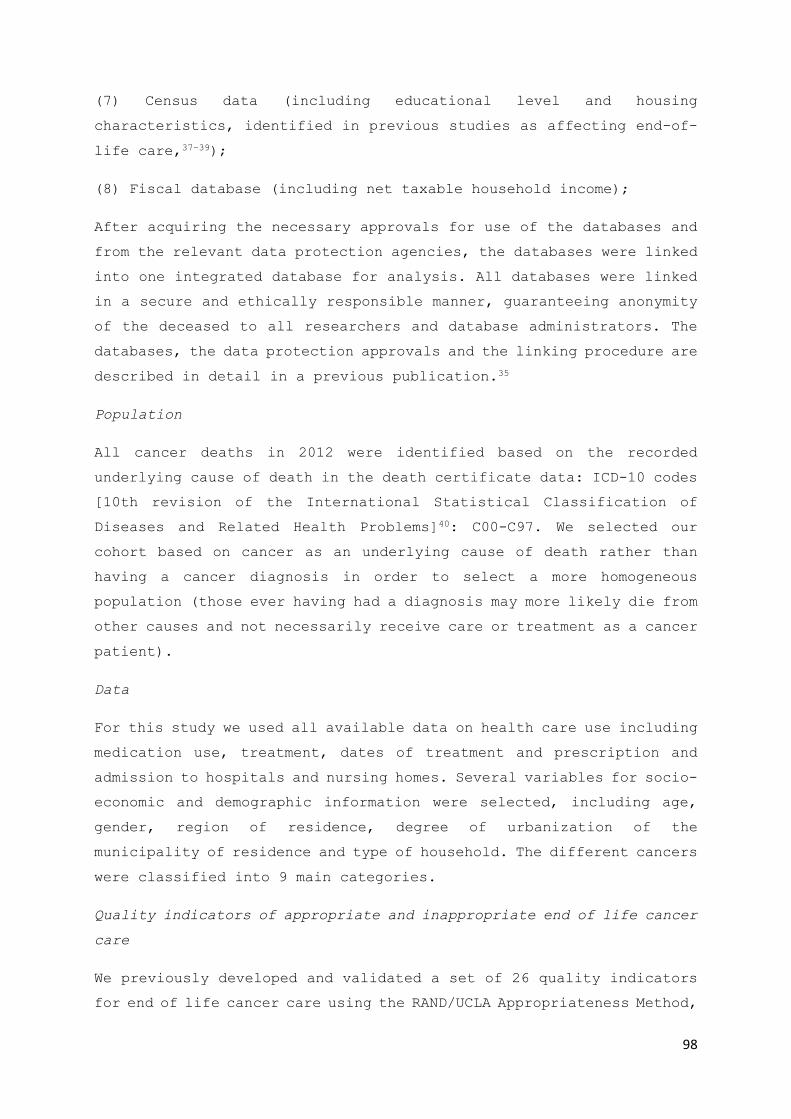
98
(7) Census data (including educational level and housing
characteristics, identified in previous studies as affecting end-of-
life care,37–39);
(8) Fiscal database (including net taxable household income);
After acquiring the necessary approvals for use of the databases and
from the relevant data protection agencies, the databases were linked
into one integrated database for analysis. All databases were linked
in a secure and ethically responsible manner, guaranteeing anonymity
of the deceased to all researchers and database administrators. The
databases, the data protection approvals and the linking procedure are
described in detail in a previous publication.35
Population
All cancer deaths in 2012 were identified based on the recorded
underlying cause of death in the death certificate data: ICD-10 codes
[10th revision of the International Statistical Classification of
Diseases and Related Health Problems]40: C00-C97. We selected our
cohort based on cancer as an underlying cause of death rather than
having a cancer diagnosis in order to select a more homogeneous
population (those ever having had a diagnosis may more likely die from
other causes and not necessarily receive care or treatment as a cancer
patient).
Data
For this study we used all available data on health care use including
medication use, treatment, dates of treatment and prescription and
admission to hospitals and nursing homes. Several variables for socio-
economic and demographic information were selected, including age,
gender, region of residence, degree of urbanization of the
municipality of residence and type of household. The different cancers
were classified into 9 main categories.
Quality indicators of appropriate and inappropriate end of life cancer
care
We previously developed and validated a set of 26 quality indicators
for end of life cancer care using the RAND/UCLA Appropriateness Method,

99
measurable using administrative databases (table 1).21 These quality
indicators are meant to indicate both potential appropriate and
inappropriate end-of-life care. They measure the prevalence of
specific medication types (selections based on the Anatomical
Therapeutic Chemical Classification System [ATC] codes) or healthcare
interventions (recorded as nomenclature codes for reimbursement
purposes) within a specified period before death. For example, the
quality indicator on chemotherapy in the last 30 days of life is
calculated by dividing the number people who died from cancer and
received chemo medication (all reimbursed medication with an ATC-code
containing L01*) in the last 30 days prior to death by the total number
of people who died from cancer (table 1).
Table 1: the set of quality indicators (QIs) for people dying from
cancer
Indicator
(brief description)
Indicator of
appropriate
(A) or
inappropriate
(I) care
Numerator
(Number of people who died from cancer who*)
Denominator
(*Number of people
who died from
cancer)
Tube feeding or
intravenous feeding
I *received tube feeding or intravenous feeding in the last month prior to death
(excluding people from gastro-intestinal cancer)
*
Blood transfusion I *received blood transfusion in the last month before death (for people with a
hematologic condition in the last 2 weeks)
*
Diagnostic testing† I *had diagnostic testing (spirometry OR blood drawn OR electrocardiogram OR
echography OR radiography) in the last month prior to death
*
Port-a-cath installment I *had a port-a-cath installed in the last 2 weeks prior to death *
Surgery I *received surgery in the last [6, 3, 1] month/s prior to death *
Chemotherapy I *received 1 or more chemotherapy treatments in the last month prior to death *
Chemotherapy interval I Number of days between last chemotherapy treatment and death *
Cisplatin in old age I *received Cisplatin and were age 80 or older *and were age 80 or
older
New anti-depressant‡ I *had initiation of a new anti-depressant treatment in the last 2 months prior to
death
*
Opioids A *received opioids in the last [6, 3, 1] months prior to death *
Opioids and neuropathic
medication
A *received neuropathic medication while receiving morphine in the last 2 years
prior to death
*
Specialized palliative care A *received specialized palliative care (Hospital palliative unit OR palliative daycare
center OR multidisciplinary home care) in the last 2 years prior to death
*
100
Official palliative care
status
A *received official palliative care status, enabling financial government support for
palliative care at any point prior to death
*
Late initiation of
palliative care
I *had a first referral to specialized palliative care OR received official palliative
status in the last two weeks before death
*
Hospital admissions I *had one or more hospital admissions in the last [6, 3, 1] months prior to death *
ICU admissions from
nursing home
I * lived in a nursing home and had one or more intensive care unit admissions in
the last [6, 3, 1] months prior to death
*and lived in a nursing
home
ED admissions I *had one or more emergency hospital visits in the last [6, 3, 1] months prior to
death
*
Home death A *died at home *
Death at home or in
nursing home of
residence
A *died at home or in the nursing home where they lived *
Family physician contact
increase
A * had an increase in average number of contacts with a family physician in the last
month prior to death compared to the previous months
*
Primary caregiver contact A Total number of contacts with a family physician or other primary care
professional in the last 3 months prior to death
*
Multi-disciplinary
Oncology Consult
A *had a Multidisciplinary Oncology Consult *
Four indicators from the original QI set were omitted in this study because they were
immeasurable with the current data set: Chemotherapy new Line, Anti-emetics with chemotherapy,
Radiotherapy with Bone Metastases and Radiotherapy with small cell lung cancer. †For blood
drawn, we included clinical biology analysis but excluded monitoring analyses. ‡Non-selective
monoamine reuptake inhibitors (ATC-code: N06AA) were excluded from this indicator to avoid
including neuropathic pain medication.
In those quality indicators where time before death is relevant, we
calculated the quality indicator in 7 time intervals (7, 14, 30, 90,
180, 360 and 720 days before death). The time intervals for which each
quality indicator was validated by the expert panels in previous
research21 is indicated in tables 3 and 4.
Statistical Analyses
The characteristics of people who died from cancer and the quality
indicators are calculated using descriptive statistics.
To examine the predictors (or risk factors) for the outcomes of end-
of-life care corresponding to the developed set of quality indicators,
we performed a principal component analysis (PCA) on the quality
indicators with the aim of data reduction. Using PCA allowed us to
identify underlying components of the 24 measured quality indicators.
(Appendix, supplemental material S.6 and S.7) We performed exploratory
PCA, combining quality indicators with a logical consistency within a
101
specific quality of care theme (e.g. aggressive cancer treatments,
appropriate pain medication). The scores for selected components were
saved for each individual in the cohort.
We then performed an analysis of variance to evaluate which patient
characteristics are associated with higher or lower scores for these
components (and hence propensity for appropriate or inappropriate end-
of-life care).
All analyses were conducted with SAS Enterprise Guide, version 7.1.
Ethics
The study was approved by the committee for medical ethics of the
University Hospital Brussels (UZ Brussels) (B.U.N. 143201627075).
Results
Cohort characteristics
A total of 26,464 people who died from cancer in 2012 were included
in the analysis, of which 56.5% were men (table 2). The mean age at
death was 77.9. The majority lived with a partner (55.7%); 34% lived
in a low comfort home without central heating and 59% lived in an area
with strong morphologic urbanization. The most prevalent types of
primary cancer were digestive tract (29.7%), and respiratory tract
(27.0%) cancers.
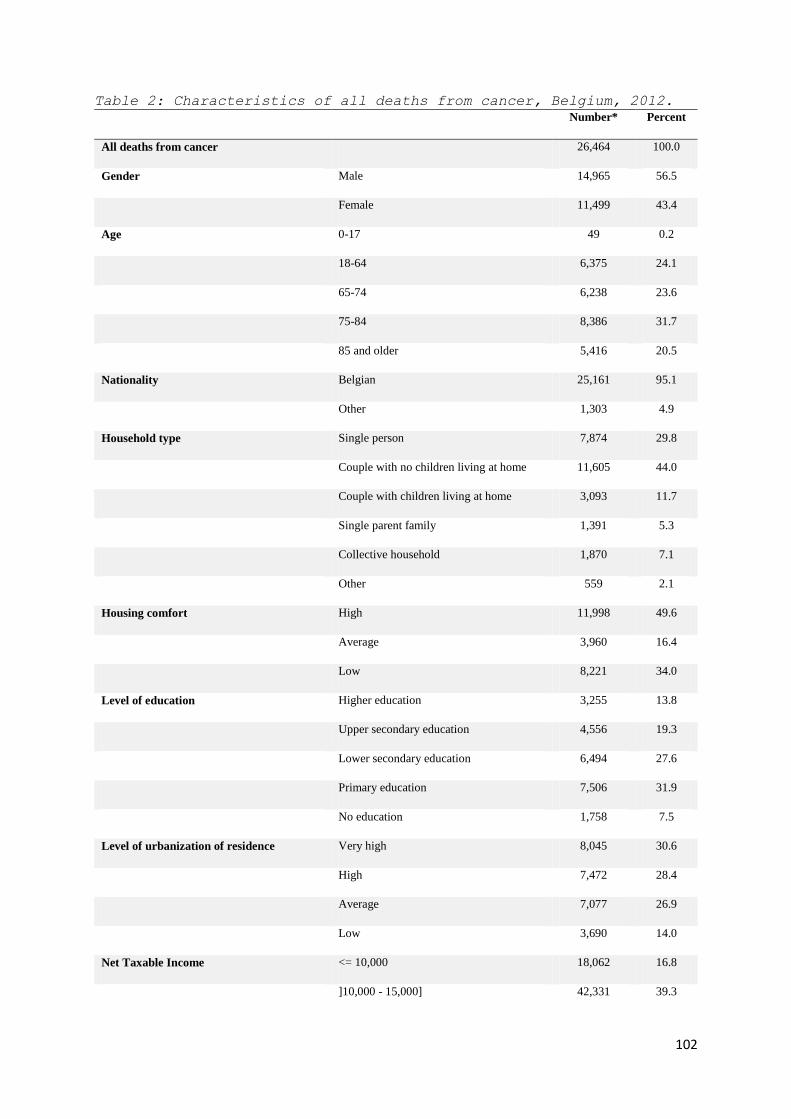
102
Table 2: Characteristics of all deaths from cancer, Belgium, 2012.
Number* Percent
All deaths from cancer 26,464 100.0
Gender Male 14,965 56.5
Female 11,499 43.4
Age 0-17 49 0.2
18-64 6,375 24.1
65-74 6,238 23.6
75-84 8,386 31.7
85 and older 5,416 20.5
Nationality Belgian 25,161 95.1
Other 1,303 4.9
Household type Single person 7,874 29.8
Couple with no children living at home 11,605 44.0
Couple with children living at home 3,093 11.7
Single parent family 1,391 5.3
Collective household 1,870 7.1
Other 559 2.1
Housing comfort High 11,998 49.6
Average 3,960 16.4
Low 8,221 34.0
Level of education Higher education 3,255 13.8
Upper secondary education 4,556 19.3
Lower secondary education 6,494 27.6
Primary education 7,506 31.9
No education 1,758 7.5
Level of urbanization of residence Very high 8,045 30.6
High 7,472 28.4
Average 7,077 26.9
Low 3,690 14.0
Net Taxable Income <= 10,000 18,062 16.8
]10,000 - 15,000] 42,331 39.3

103
]15,000 – 20,000] 27364 25.4
> 20,000 20083 18.6
Type of cancer Digestive tract 7862 29.7
Respiratory tract 7153 27.0
Breast 1961 7.4
Urinary tract 1643 6.2
Female genital organs 1371 5.2
Male genital organs 1167 4.4
Head and neck 860 3.3
Melanoma 521 2.0
Other 3925 14.8
*May not always add up to 26,464 because of missing values, which were always lower than 2.5%,
except for level of education (10.9%).
Quality indicators of appropriate end-of-life care
From the people who died from cancer in 2012, 69% received opioid
prescriptions in the last 30 days of life (table 3). Just over half
(52%) received specialist palliative care (admission to a hospital
palliative care unit, palliative daycare center or multidisciplinary
home care); 29% died at home (increasing to 39% when also including
those dying in a nursing home where they had been resident for at
least 180 days before death).
The average number of family physician contacts per 7 days increased
as people were closer to death (from 0.11 in the last 720 days, to
0.40 in the last 7 days). The number of contacts with a family
physician increased for 22% in the last week and for 30% in the last
two weeks compared to earlier periods.
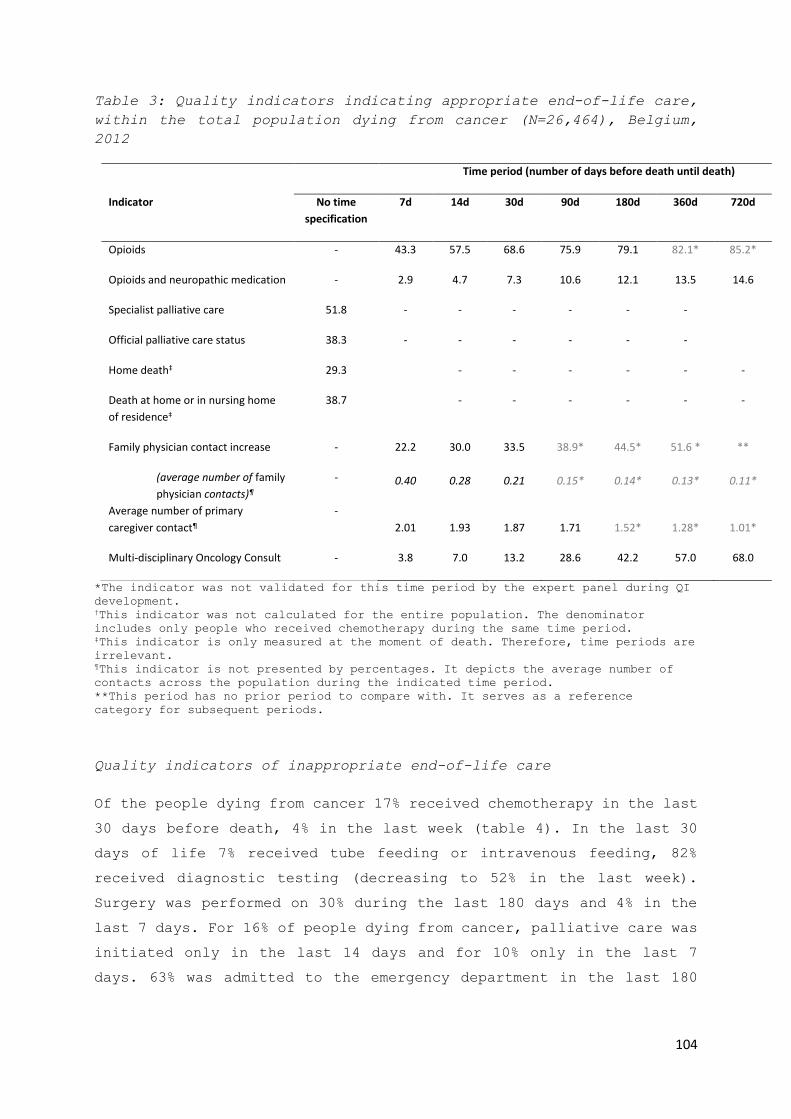
104
Table 3: Quality indicators indicating appropriate end-of-life care,
within the total population dying from cancer (N=26,464), Belgium,
2012
Time period (number of days before death until death)
Indicator No time
specification
7d 14d 30d 90d 180d 360d 720d
Opioids - 43.3 57.5 68.6 75.9 79.1 82.1* 85.2*
Opioids and neuropathic medication - 2.9 4.7 7.3 10.6 12.1 13.5 14.6
Specialist palliative care 51.8 - - - - - -
Official palliative care status 38.3 - - - - - -
Home death‡ 29.3 - - - - - -
Death at home or in nursing home
of residence‡
38.7 - - - - - -
Family physician contact increase - 22.2 30.0 33.5 38.9* 44.5* 51.6 * **
(average number of family
physician contacts)¶
- 0.40 0.28 0.21 0.15* 0.14* 0.13* 0.11*
Average number of primary
caregiver contact¶
-
2.01 1.93 1.87 1.71 1.52* 1.28* 1.01*
Multi-disciplinary Oncology Consult - 3.8 7.0 13.2 28.6 42.2 57.0 68.0
*The indicator was not validated for this time period by the expert panel during QI
development. †This indicator was not calculated for the entire population. The denominator
includes only people who received chemotherapy during the same time period. ‡This indicator is only measured at the moment of death. Therefore, time periods are
irrelevant. ¶This indicator is not presented by percentages. It depicts the average number of
contacts across the population during the indicated time period.
**This period has no prior period to compare with. It serves as a reference
category for subsequent periods.
Quality indicators of inappropriate end-of-life care
Of the people dying from cancer 17% received chemotherapy in the last
30 days before death, 4% in the last week (table 4). In the last 30
days of life 7% received tube feeding or intravenous feeding, 82%
received diagnostic testing (decreasing to 52% in the last week).
Surgery was performed on 30% during the last 180 days and 4% in the
last 7 days. For 16% of people dying from cancer, palliative care was
initiated only in the last 14 days and for 10% only in the last 7
days. 63% was admitted to the emergency department in the last 180

105
days, 13% in the last week; 86% was hospitalized in the last 180 days,
33% in the last week.
Table 4: Quality indicators indicating inappropriate end-of-life
care, within the total population dying from cancer (N=26,464),
Belgium, 2012.
Time period (number of days before death until death)
Indicator 7d 14d 30d 90d 180d 360d 720d
Chemotherapy 3.9 8.6 17.2 35.6* 45.6* 52.6* 56.5*
Tube feeding or intravenous feeding† 5.7 6.2 7.2 8.3* 9.0* 9.6* 10.1*
Cisplatin in old age‡ 0.0 0.1 0.2 0.5 0.9 1.6 2.12
Diagnostic testing 52.0 67.4 81.6 93.1* 96.8* 98.4* 99.0*
Port-a-cath installment 0.2 0.5 1.1* 2.8* 4.5* 5.7* 5.7*
New antidepressant 2.0 3.7 6.7 12.7 17.4* 23.6* **
Surgery 3.5 5.7 9.7 20.0 30.0 44.0* 58.6*
Blood transfusion¶ 2.2 3.9 7.1* 12.9* 16.4* 19.1* 21.0*
Late initiation of palliative care 10.0 16.1 - - - -
ED admissions 12.9 20.6 33.8 53.2 62.6 70.2* 76.5*
Hospital admissions 32.6 45.6 61.6 78.5 85.8 91.1* 94.7*
ICU admissions from nursing home 0.8 1.5 2.9 4.8 5.8 5.9 6.3
*The indicator was not validated for this time period by the expert panel during QI
development. †This indicator was not calculated for the entire population. The denominator does
not include people who died from gastro-intestinal cancer. ‡This indicator was not calculated for the entire population. The denominator
consists of all people who died from cancer age 80 and older at the time of death. ¶This indicator was not calculated for the entire population. The denominator does
not include people who died from any hematological cancer.
**This period has no prior period to compare with. It serves as a reference
category for subsequent periods.
Risk factors for exposure to potential appropriate or inappropriate
end-of-life care
The PCA component analysis revealed 4 dimensions (supplemental table
S.7) within all outcomes of end-of-life care corresponding to the
quality indicators: (1) aggressive tumor treatment (chemotherapy in
the last 30 days; surgery in the last 30 days), (2) hospital

106
transitions and hospital care (ED admissions and hospital admission
in last 30 days; diagnostic testing in last 14 days), (3) comfort and
palliative care (received the official palliative care status;
received specialized palliative care; family physician contact
increase in last 30 days; average number of primary caregiver contact
in the last 30 days and death at home or in nursing home of residence)
and (4) pain and symptom treatment (opioids and opioids with
neuropathic pain medication in the last 30 days).
A multivariable ANOVA analysis (table 5) indicated that component
scores for aggressive tumor treatment decrease with increasing age,
and are higher in couples, compared to people living alone.
Table 5: Associations between 4 components of potential appropriate
and inappropriate end-of-life care and patient characteristics,
unbalanced ANOVA analysis*
Component 1:
Curative tumor
treatment
Component 2:
Hospital transitions
and hospital care
Component 3:
Comfort and palliative
care
Component 4:
Pain and symptom
treatment
Number of cases in regression
analysis†
26,464† 26,284† 24,017† 26,464†
Gender
Male - 0.10‡ - -0.057‡
Female - (ref. cat.) - (ref. cat.)
Age
0-17 0.713‡ 0.210 - 0.142
18-64 0.508‡ 0.374‡ - 0.520‡
65-74 0.446‡ 0.334‡ - 0.299‡
75-84 0.250‡ 0.222‡ - 0.152‡
85+ (ref. cat.) (ref. cat.) - (ref. cat.)
Region
Brussels - 0.068 -0.330‡ -
Wallonia - 0.087‡ -0.147‡ -
Flanders - (ref. cat.) (ref. cat.) -
Household type

107
Couple no children 0.171‡ - 0.259‡ -
Couple with children 0.211‡ - 0.297‡ -
Single parent family 0.193‡ - 0.186‡ -
Collective household 0.134‡ - -0.513‡ -
Other 0.207‡ - 0.181‡ -
Single person (ref.cat.) - (ref. cat.) -
Level of urbanization of residence
Very high - (ref. cat.) - -
High - -0.037 - -
Average - -0.040‡ - -
Low - -0.146‡ - -
Type of cancer
Digestive tract - - 0.094‡ 0.009
Female genital organs - - 0.123‡ 0.044
Head and neck - - -0.030 0.066
Male genital organs - - 0.037 0.188‡
Melanoma - - -0.013 0.151‡
Respiratory tract - - 0.032 0.098‡
Urinary tract - - 0.130‡ 0.151‡
Other - - -0.061 -0.027
Breast - - (ref. cat.) (ref. cat.)
*Results from ANOVA using the SAS General Linear Model (GLM) procedure with factor
scores for the different components as dependent variables (with an overall mean of
0 and standard deviation of 1). Presented results are estimates of the differences
of least squares means and represent the increase or decrease on the factor score
compared with the reference category. †number of cases in analysis might differ from 26,464 ‡ p-value for difference between this category and the reference category is <0.01
Potentially inappropriate hospital transitions and hospital care are
more prevalent in younger (75 years old or younger) than in to older
people, and less likely in people living in rural areas.
Potentially appropriate comfort and palliative care are associated
with region (more likely in Flanders than in Wallonia and Brussels)
and with household type (more likely in couples than in people living
single and people in collective households) and is most likely in

108
those with urinary tract, female genital organs or digestive tract
cancers.
Potentially appropriate pain and symptom treatment is more likely in
women and in younger adults and is more likely in those dying from
male genital cancer, urinary tract cancer, melanoma, or respiratory
tract cancer than in those dying from other cancer types.
Discussion
Using a set of validated quality indicators of end-of-life care, we
were able to provide a snapshot of the performance of the Belgian
healthcare system in terms of end-of-life care in people who died from
cancer. Of all patients, more than half received an opioid prescription
in the final 2 weeks (57.5%) and received specialist palliative care
(51.8%) but also more than half had diagnostic testing in the final 2
weeks (67.4%) or acute care hospital admissions in the final month
(61.1%). About a third (33.8%) had an ED admission in the final month
and a similar proportion had increased contacts with their family
physician in the last two weeks.
Several of the presented validated quality indicators had not been
measured before. Future systematic comparison of different countries
using our set of indicators would allow qualification of end-of-life
care performance of health care systems (such as the Belgian one) and
identification of the most pertinent quality issues. Nevertheless, a
number of the quality indicators used have already been reported in
studies from other countries and these provide a reference to evaluate
Belgian end-of-life cancer care. While the proportion of people dying
from cancer having an ED admission in the last 30 days (34%) seems
high (higher than in Germany for instance16), it is lower than the
percentages reported for the USA (46%), England (48%) and Canada
(58%).16 The percentage of people receiving palliative care (52%) is
comparable to some other countries (e.g. in Canada 47.3% received
palliative home care15) but lower than the proportion receiving hospice
care in the USA (59.5% in 2009)41. The proportion dying at home (29.3%)
varies highly among countries, with Belgium being at the same level
of Spain (31.6%) and England (26.1%). This is much lower than, for

109
instance, in The Netherlands (46.3%), but higher than Canada (16.1%)
or France (19.1%).42 We found lower percentages of chemotherapy use in
the last 14 days (8.6%) than the standard considered appropriate by
Earle et al (10.0%)11. However, we found a higher use in the last 30
days compared to all countries reported in an international study
executed in 7 countries.16 Therefore, although further international
comparison for all quality indicators is required, this limited
comparison suggests an overuse of chemotherapy near the end of life
in Belgium and that there is a margin for improvement to increase the
proportion of people receiving specialist palliative care and dying
at home.
Using quality indicators for systematic comparisons and setting
quality standards
The quality indicators we measured on a population level in Belgium
can be used to compare health care practice on a national level, as
well as on an international level. Based on both national and
international benchmarking, health care policy can focus on reducing
the occurrence of inappropriate end-of-life care and optimizing the
use of appropriate end-of-life care.
On an international level, differences between health care systems,
such as payment models, health insurance and access to health care can
be evaluated on their effect on quality of care provided by the system.
On a national level, differences between health care providers or
regions can be used to set benchmarks for all the quality indicators,
for example based on best practice example as established in the USA
by Earle et al.11, e.g. using the best scoring quartile or decile for
each quality indicator. To allow a correct comparison between health
care providers or regions a risk-adjustment should be made to increase
the ‘attributional validity’ of the quality indicators (i.e. the
conviction that observed quality indicator differences causally relate
directly to quality of care rather than to other contributing factors
such as a different patient mix).43 Our findings regarding the patient
characteristics associated with different aspects of appropriate or
inappropriate end-of-life care suggest that age, household type, type
of cancer, and living in a rural or urban environment are important

110
risk adjusters for various quality indicators. We found that younger
patients are more likely to receive potentially appropriate pain and
symptom treatment than older patients, but at the same time are also
more likely to receive potentially inappropriate tumor treatment,
hospital transitions and hospital care at the end of life. Furthermore,
people living with a partner and those living in a single parent
household are more likely to receive appropriate comfort and
palliative care at the end of life than those who live alone. However,
people who live in a collective household, such as a nursing home, are
less likely to receive appropriate comfort and palliative care at the
end of life. Type of cancer is a risk factor for the occurrence of
specific treatments, but there does not seem to be one cancer type
that is consistently related to more potentially appropriate and less
potentially inappropriate care at the end of life. Gender was not a
significant risk factor for appropriate or inappropriate end-of-life
care.
Strengths and limitations
Our use of routinely collected administrative data entails several
strengths. Compared to using sample data, our study does not suffer
from selection bias, it avoids non-response bias inherent to surveys
and avoids recall bias.44,45 It has a clearly defined population and
includes difficult-to-reach subgroups that tend to be under-
represented in surveys or observational studies. Administrative data
are relatively inexpensive in comparison with original data
collections.23 These data are routinely collected by health insurance
companies and since health insurance in Belgium is obligatory, these
data provide information on 99% of the entire population’s health care
use.
A disadvantage in using routinely collected data is that the data were
not collected to answer the specific research questions and therefore
needed to be adapted accordingly. Careful operationalizations of the
indicators and several checks with medical experts who are familiar
with the used databases and reimbursement codes were done to mitigate
this problem. This eventually also led to four quality indicators
being withdrawn because a sufficiently valid operationalization was
not deemed to be possible with the available administrative data (these

111
are: Initiation of new regimen of chemotherapy, Radiotherapy in people
with bone metastases, Anti-emetics with chemotherapy and Radiotherapy
in people with small cell lung cancer). A second limitation is that
medication use is measured indirectly through prescription and
delivery. Medication might be purchased, but never used. Also, some
prescriptions cover the use of medication for longer periods, e.g.
several weeks. This makes quality indicators with short time
intervals, e.g. opioid use in the last 7 days before death, more
complicated to interpret. A third limitation is that only reimbursed
treatments and medication are registered in the health insurance
databases. We know that people with cancer, especially those treated
at a university hospital, frequently receive experimental treatments.
We currently have no evidence on how common this practice is.
Furthermore, quality indicators measured on a population level provide
quantitative information on care provision, but do not provide
information about the quality of the care provided. A final limitation
of this study is sometimes referred to as ‘resurrecting of treatment
histories’.46 In a retrospective design, we cannot say whether
treatment was performed with end-of-life intent, especially on an
individual level. We mitigate this limitation by interpreting our
quality indicators strictly on an aggregate level.
Conclusions
Our study evaluated the performance of the Belgian health care system
in terms of end-of-life cancer care and suggests a possible overuse
of potentially inappropriate cancer care at the end of life and an
opportunity to increase the proportion of people with cancer receiving
specialist palliative care and dying at home.
The use of our quality indicators provides health care policy makers
with an informative tool to compare the end-of-life care performance
of different health care system, health care regions within health
care systems, and health care providers within regions. This provides
them with the information basis to eventually improve end-of-life care
across the population.
112
References
1. Pacetti P, Paganini G, Orlandi M, et al. Chemotherapy in the last
30 days of life of advanced cancer patients. Support Care Cancer. Epub
ahead of print April 2015. DOI: 10.1007/s00520-015-2733-6.
2. Morrison RS, Meier DE. Clinical practice. Palliative care. N Engl J Med
2004; 350: 2582–90.
3. Earle CC, Neville BA, Landrum MB, et al. Trends in the aggressiveness of
cancer care near the end of life. J Clin Oncol 2004; 22: 315–21.
4. Pataky RE, Cheung WY, de Oliveira C, et al. Population-based trends in
systemic therapy use and cost for cancer patients in the last year of
life. Curr Oncol Tor Ont 2016; 23: S32-41.
5. Byock I. Completing the continuum of cancer care: integrating life-
prolongation and palliation. CA Cancer J Clin 2000; 50: 123–132.
6. Numico G, Trogu A, Cristofano A, et al. Active treatment given in the
last weeks of life: poor quality cancer care or justifiable behavior?
Support Care Cancer 2014; 22: 2813–9.
7. Greer JA, Pirl WF, Jackson VA, et al. Effect of early palliative care on
chemotherapy use and end-of-life care in patients with metastatic non-
small-cell lung cancer. J Clin Oncol Off J Am Soc Clin Oncol 2012; 30:
394–400.
8. Bakitas MA, Tosteson TD, Li Z, et al. Early Versus Delayed Initiation of
Concurrent Palliative Oncology Care: Patient Outcomes in the ENABLE III
Randomized Controlled Trial. J Clin Oncol 2015; 33: 1438–45.
9. Bakitas M, Lyons KD, Hegel MT, et al. Effects of a palliative care
intervention on clinical outcomes in patients with advanced cancer: the
Project ENABLE II randomized controlled trial. JAMA 2009; 302: 741–749.
10. Mack JW, Cronin A, Keating NL, et al. Associations between end-of-
life discussion characteristics and care received near death: a
prospective cohort study. J Clin Oncol Off J Am Soc Clin Oncol 2012; 30:
4387–4395.
11. Earle CC, Neville BA, Landrum MB, et al. Evaluating claims-based
indicators of the intensity of end-of-life cancer care. Int J Qual
Health Care 2005; 17: 505–9.

113
12. Barbera L, Seow H, Sutradhar R, et al. Quality of end-of-life cancer
care in Canada: a retrospective four-province study using administrative
health care data. Curr Oncol Tor Ont 2015; 22: 341–355.
13. Ho TH, Barbera L, Saskin R, et al. Trends in the aggressiveness of
end-of-life cancer care in the universal health care system of Ontario,
Canada. J Clin Oncol 2011; 29: 1587–91.
14. Goldsbury DE, O’Connell DL, Girgis A, et al. Acute hospital-based
services used by adults during the last year of life in New South Wales,
Australia: a population-based retrospective cohort study. BMC Health
Serv Res 2015; 15: 537.
15. Barbera L, Seow H, Sutradhar R, et al. Quality Indicators of End-of-
Life Care in Patients With Cancer: What Rate Is Right? J Oncol Pract
2015; 11: e279-287.
16. Bekelman JE, Halpern SD, Blankart CR, et al. Comparison of Site of
Death, Health Care Utilization, and Hospital Expenditures for Patients
Dying With Cancer in 7 Developed Countries. JAMA 2016; 315: 272–283.
17. Chassin MR, Brook RH, Park RE, et al. Variations in the use of
medical and surgical services by the Medicare population. N Engl J Med
1986; 314: 285–90.
18. Park RE, Fink A, Brook RH, et al. Physician ratings of appropriate
indications for six medical and surgical procedures. Am J Public Health
1986; 76: 766–72.
19. Sepúlveda C, Marlin A, Yoshida T, et al. Palliative Care: The World
Health Organization’s Global
Perspectivehttp://citeseerx.ist.psu.edu/viewdoc/download?doi=10.1.1.629.
4519&rep=rep1&type=pdf (accessed 25 January 2017).
20. Brennan F. Palliative Care as an International Human Right. J Pain
Symptom Manage 2007; 33: 494–499.
21. De Schreye R, Houttekier D, Deliens L, et al. Developing indicators
of appropriate and inappropriate endof- life care in people with
Alzheimer’s disease, cancer or COPD for population-level administrative
databases: a RAND/UCLA appropriateness study (unpublished).
22. Ross JS, Siu AL. The importance of population-based performance
measures. Health Serv Res 2007; 42: 1–6.
114
23. Riley GF. Administrative and claims records as sources of health care
cost data. Med Care 2009; 47: S51-55.
24. Cohen J, Deliens L. A Public Health Perspective on End of Life Care
Joachim. Nurs Older People 2012; 24: 8.
25. Campbell SM, Roland MO, Buetow SA. Defining quality of care. Soc Sci
Med 1982 2000; 51: 1611–1625.
26. Grunfeld E, Urquhart R, Mykhalovskiy E, et al. Toward population-
based indicators of quality end-of-life care: testing stakeholder
agreement. Cancer 2008; 112: 2301–8.
27. De Roo ML, Leemans K, Claessen SJJ, et al. Quality Indicators for
Palliative Care: Update of a Systematic Review. J Pain Symptom Manage
2013; 46: 556–572.
28. Pasman HRW, Brandt HE, Deliens L, et al. Quality Indicators for
Palliative Care: A Systematic Review. J Pain Symptom Manage 2009; 38:
145–156.e21.
29. Earle CC, Park ER, Lai B, et al. Identifying potential indicators of
the quality of end-of-life cancer care from administrative data. J Clin
Oncol 2003; 21: 1133–8.
30. Setoguchi S, Earle CC, Glynn R, et al. Comparison of Prospective and
Retrospective Indicators of the Quality of End-of-Life Cancer Care. J
Clin Oncol 2008; 26: 5671–5678.
31. Grunfeld E, Lethbridge L, Dewar R, et al. Towards using
administrative databases to measure population-based indicators of
quality of end-of-life care: testing the methodology. Palliat Med 2006;
20: 769–77.
32. Meñaca A, Evans N, Andrew EVW, et al. End-of-life care across
Southern Europe: A critical review of cultural similarities and
differences between Italy, Spain and Portugal. Crit Rev Oncol Hematol
2012; 82: 387–401.
33. Andrew EVW, Cohen J, Evans N, et al. Social-cultural factors in end-
of-life care in Belgium: a scoping of the research literature. Palliat
Med 2013; 27: 131–143.
115
34. Gysels M, Evans N, Meñaca A, et al. Culture and End of Life Care: A
Scoping Exercise in Seven European Countries. PLoS ONE; 7. Epub ahead of
print 3 April 2012. DOI: 10.1371/journal.pone.0034188.
35. Maetens A, De Schreye R, Faes K, et al. Using linked administrative
and disease-specific databases to study end-of-life care on a population
level. BMC Palliat Care 2016; 15: 86.
36. Belgian Cancer Registry — Get all the
factshttp://www.kankerregister.org/default.aspx?lang=EN (accessed 31
January 2017).
37. Hanchate A, Kronman AC, Young-Xu Y, et al. Racial and Ethnic
Differences in End-of-Life Costs: Why Do Minorities Cost More Than
Whites? Arch Intern Med 2009; 169: 493.
38. Huang C-Y, Hung Y-T, Chang C-M, et al. The association between
individual income and aggressive end-of-life treatment in older cancer
decedents in Taiwan. PloS One 2015; 10: e0116913.
39. Chang C-M, Wu C-C, Yin W-Y, et al. Low socioeconomic status is
associated with more aggressive end-of-life care for working-age
terminal cancer patients. The Oncologist 2014; 19: 1241–1248.
40. ICD-10
Version:2010http://apps.who.int/classifications/icd10/browse/2010/en
(accessed 31 January 2017).
41. Teno JM, Gozalo PL, Bynum JPW, et al. Change in End-of-Life Care for
Medicare Beneficiaries: Site of Death, Place of Care, and Health Care
Transitions in 2000, 2005, and 2009. JAMA 2013; 309: 470–477.
42. Cohen J, Pivodic L, Miccinesi G, et al. International study of the
place of death of people with cancer: a population-level comparison of
14 countries across 4 continents using death certificate data. Br J
Cancer 2015; 113: 1397–1404.
43. Silva LK. Validity of the risk adjustment approach to compare
outcomes. Cad Saude Publica 2003; 19: 287–295.
44. Benchimol EI, Manuel DG, To T, et al. Development and use of
reporting guidelines for assessing the quality of validation studies of
health administrative data. J Clin Epidemiol 2011; 64: 821–829.

116
45. Validation of diagnostic codes within medical services
claimshttp://www.sciencedirect.com/science/article/pii/S0895435603002464
(accessed 31 January 2017).
46. Bach PB, Schrag D, Begg CB. Resurrecting treatment histories of dead
patients: a study design that should be laid to rest. JAMA 2004; 292:
2765–70.
117
Chapter 5: Appropriateness of end-of-life care in
people dying from COPD. Applying quality indicators
on linked administrative databases.
Robrecht De Schreye, Tinne Smets, Luc Deliens, Lieven
Annemans, Birgit Gielen, Joachim Cohen
Published in Journal of Pain and Symptom Management (2018)

118
Abstract
Introduction
Large-scale evaluations of the quality of end-of-life care in people
with COPD are lacking. By means of a validated set of quality
indicators, this study aims to:
1. Assess appropriateness of end-of-life care in people dying from
COPD,
2. Examine variation between care regions,
3. Establish performance standards.
Methods
We conducted a retrospective observational study of all deaths from
COPD (ICD10 codes J41-J44) in 2012 in Belgium, using data from
administrative population-level databases. QI scores were risk-
adjusted for comparison between care regions.
Results
4,231 people died from COPD. During the last 30 days of life, 60% was
admitted to hospital, 11.8% received specialized palliative care.
Large regional variation was found in specialized palliative care use
(4.0% to 32.0%) and diagnostic testing in the last 30 days of life
(44.0% to 69.7%). Based on best performing quartile scores, relative
standards were set (e.g. ≤54.9% for diagnostic testing)
Conclusion
Our study found indications of inappropriate end-of-life care in
people with COPD, such as high percentages of diagnostic testing and
hospital admissions and low proportions receiving specialized
palliative care. Risk-adjusted variation between regions was high for
several QIs, indicating the usefulness of relative performance
standards to improve quality of end-of-life COPD care.
119
Background
Chronic Obstructive Pulmonary Disease (COPD) is a progressive life-
limiting condition and a major cause of mortality worldwide.(1,2) The
disease trajectory of people suffering from COPD typically involves
slow functional decline with acute life-threatening exacerbations.(3)
Patients often experience increasing dyspnea, severe physical
disability, loneliness, depression and anxiety.(4,5) They usually
survive several exacerbation episodes, while each episode causes sharp
functional decline and may result in death. The exact timing of death,
however, is difficult to predict.(6) Nevertheless, there are concerns
that end-of-life care for COPD patients often involves inappropriate
life-prolonging care.(7) Research has confirmed that, despite clear
palliative care needs, specialized palliative care is not common
practice in people suffering from COPD.(8–10) As for any chronic
disease with changing care needs near the end of life, appropriate
end-of-life care is of extreme importance for people dying from COPD.
This means receiving care of which the expected health benefit (e.g.
increased life expectancy or symptom relief) exceeds possible negative
outcomes (e.g. mortality, reduced quality of life).(11,12) So far,
research on appropriateness of end-of-life care in people with COPD
is lacking.
A previous study developed a set of quality indicators for end-of-life
care in people suffering from COPD(13), based on literature,
interviews with medical experts and a consensus process. The validated
set of indicators is meant to evaluate appropriateness of end-of-life
care in populations dying from COPD(13), measuring the prevalence of
specific diagnostics, medication prescription, treatments or care
received during a specific time period prior to death that indicate
potential appropriate or inappropriate end-of-life care. The quality
indicators were developed to be measured on a population level, using
administrative data.
Population-level indicators for appropriateness of end-of-life care
in COPD provide a tool for policy makers to evaluate the performance
of a health care system(14). Currently, no standards exist for COPD
quality indicators. However, by comparing indicator scores across
health care regions within a country, taking into account population

120
differences between regions for a fair comparison (e.g. differences
in clinical or socio-demographic characteristics of the populations),
relative standards can be established.(15) For example, the best
performing quartile of health care regions could be set as a
performance standard within the health care system.(16)
Our study has three aims:
1. To assess end-of-life care in people dying from COPD in Belgium
using validated quality indicators.
2. To compare the quality indicator scores of end-of-life COPD care
between all health care regions in Flanders, Belgium.
3. To establish relative performance standards for quality indicator
scores based on the variation across health care regions.
Methods
Study design and data sources
We conducted a retrospective observational study of all people who
died from COPD in 2012 in Belgium. We combined data from eight
administratively collected population-level databases into one
database for analysis(17):
(1) Socio-demographic database of all individuals with health care
insurance (legally mandatory in Belgium);
(2) Health care database containing all reimbursed health care data
of home, nursing home, outpatient and hospital care, except medication
dispensed in pharmacies;
(3) Pharmaceutical database containing all reimbursed medication
dispensed in pharmacies;
(4) Belgian Cancer Registry database with diagnosis and type of cancer
data for all incident cancers;
(5) Death certificate database containing cause of death;
121
(6) Population registry database including citizens’ household
composition;
(7) Census database, including educational level and housing
characteristics;
(8) Fiscal database, including net taxable income;
After acquiring approvals from the relevant data protection agencies,
all databases were linked in an ethically responsible and secure
manner, preserving anonymity of the deceased. The linking procedure
is described in detail in a previous publication.(17)
Population
All people who died from COPD in 2012 were identified by the underlying
cause of death reported on the death certificate (ICD-10 codes J41-
J44).
Data
We used health care data, including medication use, other treatments,
dates of treatment and prescription and admission to hospitals and
nursing homes. Multiple socio-economic, demographic and clinical
variables were selected, including age, gender, lung cancer diagnosis,
dependence on care, receipt of government support for health care,
level of education, household composition, degree of urbanization of
residence and net taxable income.
Quality indicators
We used a set of 28 quality indicators for end of life COPD care that
are measurable using administrative databases.(13) This set was
developed and validated using the RAND/UCLA appropriateness
method.(18) All indicators were extracted from literature and expert
interviews and validated by a multidisciplinary expert panel of twelve
doctors and nurses specializing in pneumology, family medicine or
palliative care. The quality indicators demonstrate either appropriate
or inappropriate end-of-life care. They measure the prevalence of
specific health care interventions or delivery of medication types in
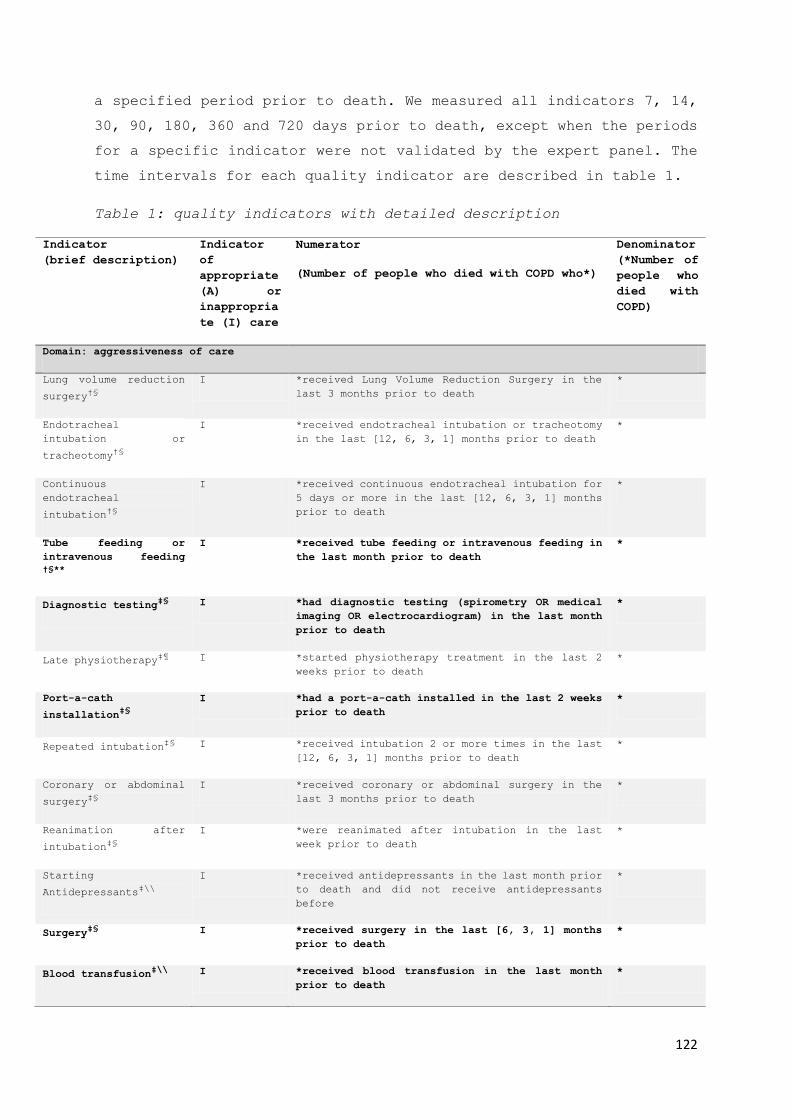
122
a specified period prior to death. We measured all indicators 7, 14,
30, 90, 180, 360 and 720 days prior to death, except when the periods
for a specific indicator were not validated by the expert panel. The
time intervals for each quality indicator are described in table 1.
Table 1: quality indicators with detailed description
Indicator
(brief description)
Indicator
of
appropriate
(A) or
inappropria
te (I) care
Numerator
(Number of people who died with COPD who*)
Denominator
(*Number of
people who
died with
COPD)
Domain: aggressiveness of care
Lung volume reduction
surgery†§
I *received Lung Volume Reduction Surgery in the
last 3 months prior to death
*
Endotracheal
intubation or
tracheotomy†§
I *received endotracheal intubation or tracheotomy
in the last [12, 6, 3, 1] months prior to death
*
Continuous
endotracheal
intubation†§
I *received continuous endotracheal intubation for
5 days or more in the last [12, 6, 3, 1] months
prior to death
*
Tube feeding or
intravenous feeding
†§**
I *received tube feeding or intravenous feeding in
the last month prior to death
*
Diagnostic testingठI *had diagnostic testing (spirometry OR medical
imaging OR electrocardiogram) in the last month
prior to death
*
Late physiotherapyঠI *started physiotherapy treatment in the last 2
weeks prior to death
*
Port-a-cath
installation‡§
I *had a port-a-cath installed in the last 2 weeks
prior to death
*
Repeated intubationठI *received intubation 2 or more times in the last
[12, 6, 3, 1] months prior to death
*
Coronary or abdominal
surgery‡§
I *received coronary or abdominal surgery in the
last 3 months prior to death
*
Reanimation after
intubation‡§
I *were reanimated after intubation in the last
week prior to death
*
Starting
Antidepressants‡\\
I *received antidepressants in the last month prior
to death and did not receive antidepressants
before
*
SurgeryठI *received surgery in the last [6, 3, 1] months
prior to death
*
Blood transfusion‡\\
I *received blood transfusion in the last month
prior to death
*

123
Domain: Pain and symptom treatment
Opioids†§ A *received opioids in the last [6,3, 1] months
prior to death
*
Inhalation therapyठA *received inhalation corticosteroids OR
anticholinergics OR Beta-2-memetics in the last
[6, 3, 1] months prior to death
*
Psychologist visit‡§** A *had at least one psychologist visit in the last
2 months prior to death
*
Domain: Palliative care
Specialized palliative
care†§
A *received specialized palliative care (hospital
palliative unit OR multidisciplinary palliative
home care) in the last 2 years prior to death
*
Official palliative
care status†§
A * received official palliative care status,
enabling financial government support for
palliative care at any point prior to death
*
Late initiation of
palliative care †¶
I * had a first referral to specialized palliative care OR received official palliative status
during the last week before death
*
Domain: Place of treatment and place of death
Home death†§ A *died at home *
Hospital admissions†¶ I * had one or more hospital admission/s in the
last [6, 3, 1] months prior to death
*
ED admissions†\\
I * had one or more emergency hospital visits in
the last [6, 3, 1] months prior to death
*
Death in nursing home
of residence †§
A *lived and died in a nursing home *and lived in
a nursing
home
Hospital death†¶ I *died in hospital *
Domain: Coordination and continuity of care
Family physician
contact†§
A *had an increase in average number of contacts
with a family physician in the last month prior
to death compared to the previous 23 months
*
Primary caregiver
contact †§
A Sum of number of contacts with a family physician
or other primary care professional in the last 3
months prior to death
*
ICU admissionsठI * had one or more admissions to the intensive
care unit in the last month prior to death
*
ICU admissions from
nursing home‡§
I *lived in a nursing home and had 1 or more ICU
visits in the last month prior to death
*and lived in
a nursing
home
†Indicator from literature, ‡Indicator from expert interviews, §Accepted in phase 3a scoring
round, ¶Accepted in phase 3b plenary discussion, \\Adapted and accepted in phase 3b plenary
discussion, **This indicator was not included in the current study, since it could not be
measured with the existing data.

124
Risk factors for comparison across health care regions
We performed risk adjustment procedures for the comparison of QIs
across health care regions. The northern part of Belgium has 14 major
health care regions, based on natural patient flow.(19) These regions
cover the administrative regions of Flanders and Brussels; no
equivalent exists in the Walloon region. We therefore limited this
analysis to Flanders and Brussels. From a comprehensive list of
possible risk factors(20), we identified the following factors as
relevant and measurable with the current dataset: age, gender, lung
cancer diagnosis, comorbidity status (using all ICD-10 codes on death
certificates, including associated and intermediate causes of death),
eligible for additional government health care support (based on care
dependency), educational level, household composition, degree of
urbanization of residence and net taxable income. We used the period
of 30 days prior to death for all indicators where timing is relevant,
or less if the indicator was validated only for a shorter period prior
to death.
Statistical analyses
The characteristics of people who died from COPD and the quality
indicators were calculated using descriptive statistics.
The risk-adjusted comparison consisted of several steps: First we
listed potential risk factors that could influence quality indicator
outcomes, based on literature(21). We evaluated the effects of these
potential risk factors on individuals’ outcomes for each of the quality
indicators separately, using logistic regression. We used stepwise
model building, with a significance level of 0.3 for entry and 0.05
to stay. Based on the logistic regression, predicted scores were
calculated for each individual.
For each health care region, the average risk-adjusted score was
calculated by dividing the average predicted score by the average
observed score, multiplied by the average observed score across all
regions.
All analyses were conducted with SAS Enterprise Guide, version 7.1.

125
Ethics
The study was approved by the Medical Ethics Committee of the
University Hospital Brussels (UZ Brussels) (B.U.N. 143201627075).
Results
Study Population Characteristics
4,231 people died from COPD in Belgium in 2012 (4 percent of all
deaths), of whom 61 percent were men. The mean age at death was 79
(data not shown). 43 percent lived with a partner, either with or
without children. 33 percent lived in an area with the highest degree
of urbanization. (Table 2)
Table 2: Characteristics of all deaths from COPD, Belgium, 2012. People who died from COPD
Number* Percent
All deaths 4,231 100.0
Gender Male 2,597 61.4
Female 1,634 38.6
Age 0-17 0 0.0
18-64 429 10.1
65-74 833 19.7
75-84 1,596 37.7
85 and older 1,373 32.5
Nationality Belgian 3,971 93.9
Other 260 6.2
Household type† Single person 1,380 32.7
Couple with no children living at home 1,529 36.2
Couple with children living at home 279 6.6
Single parent family 211 5.0
Collective household 732 17.3
Other 95 2.3
Housing
comfort‡
High 1,392 34.8

126
Average 809 20.2
Low 1,575 39.3
Level of
education
Higher education 267 14.6
Upper secondary education 501 11.8
Lower secondary education 896 21.2
Primary education 1,548 36.6
No education 400 9.5
Unknown 469 11.1
Level of
urbanization
of residence§
Very high 1,374 32.5
High 1,145 27.1
Average 1,061 25.1
Low 628 14.8
Net Taxable
Income
<= 10,000 521 12.3
]10,000 - 15,000] 2,001 47.3
]15,000 – 20,000] 1,131 26.7
> 20,000 578 13.7
*May not always add up to 4,231 because of missing values, which were always lower than 1.0%, except for housing comfort (11,1%).
†Married and unmarried couples living together were taken together in one group ‡Defined by the number of rooms and facilities (e.g. bathroom) available in the persons home §Degree of urbanization as categorized by Eurostat (http://ec.europa.eu/eurostat) and OECD
(http://www.oecd.org/

127
Quality Indicators of Appropriate End-Of-Life Care
Of all people who died from COPD in Belgium in 2012, 32.8 percent
received opioid medication and 81.8 percent received inhalation
therapy in the last 30 days prior to death; 11.8 percent received
specialized palliative care (inpatient palliative care unit or
multidisciplinary palliative home care); 24.4 percent died at home;
43.3 percent had an increase in family physician contact during the
last two weeks, with an average of 0.56 reimbursed contacts per week.
(Table 3)
Table 3: Quality indicators indicating appropriate end-of-life care,
within the total population dying from COPD (N=4,231), Belgium, 2012
Time period (number of days before death until
death)
Indicator No time
specification
7d 14d 30d 90d 180d 360d 720d
Opioids* - 18.9 24.8 32.8 41.6 47.0 - -
Inhalation therapy
- 49.3 66.4 81.8 90.9 93.3 - -
Specialized palliative
care†
11.8 - - - - - - -
Official palliative
care status
8.6 - - - - - - -
Home death 24.4 - - - - - - -
Death at home or in
nursing home of
residence
42.2 - - - - - - -
Family physician
contact increase
-
29.2 43.3 45.8 - - - -
(average number of
family physician
contacts per week) §
-
0.72 0.56 0.71 - - - -
Average number of
primary caregiver
contact per week§
-
1.11 1.16 1.29 1.52 - - -
*For quality indicators involving medication, the time of delivery was employed, since
no information on actual use is provided in our administrative data sources. †This includes care by a hospital palliative care unit and multidisciplinary palliative
home care. §This indicator is not presented by percentages. It depicts the average number of
contacts per week across the population during the indicated time period.
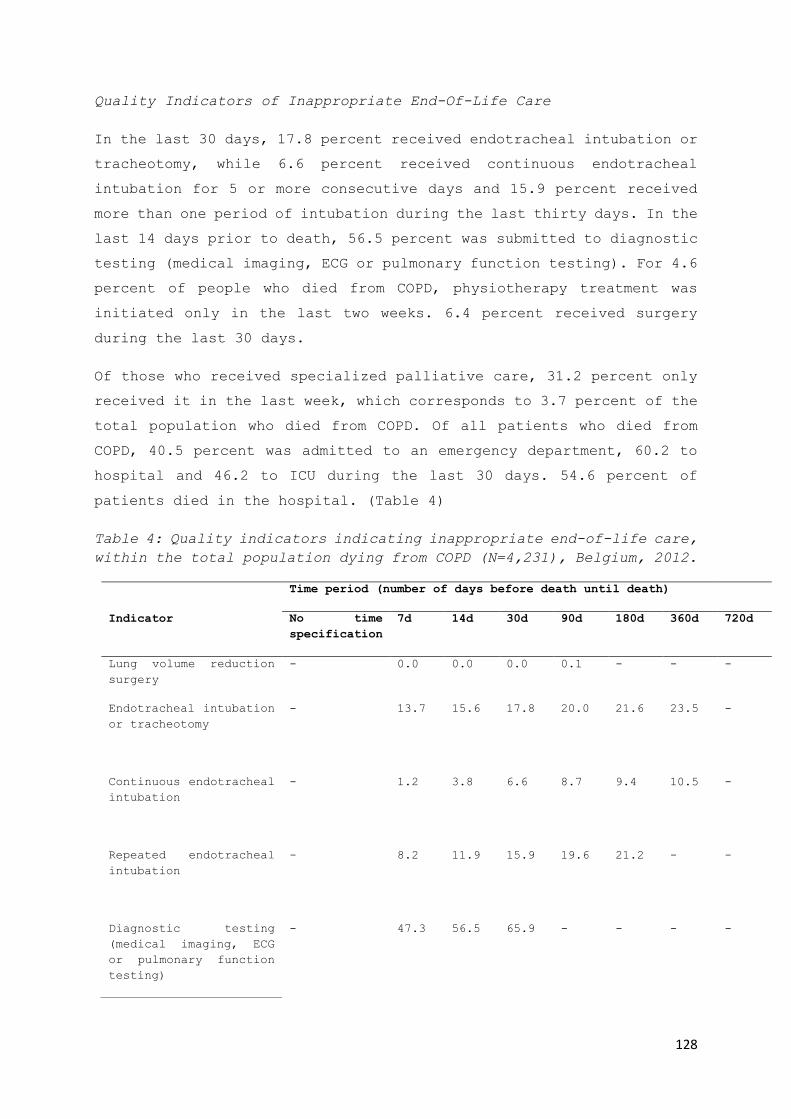
128
Quality Indicators of Inappropriate End-Of-Life Care
In the last 30 days, 17.8 percent received endotracheal intubation or
tracheotomy, while 6.6 percent received continuous endotracheal
intubation for 5 or more consecutive days and 15.9 percent received
more than one period of intubation during the last thirty days. In the
last 14 days prior to death, 56.5 percent was submitted to diagnostic
testing (medical imaging, ECG or pulmonary function testing). For 4.6
percent of people who died from COPD, physiotherapy treatment was
initiated only in the last two weeks. 6.4 percent received surgery
during the last 30 days.
Of those who received specialized palliative care, 31.2 percent only
received it in the last week, which corresponds to 3.7 percent of the
total population who died from COPD. Of all patients who died from
COPD, 40.5 percent was admitted to an emergency department, 60.2 to
hospital and 46.2 to ICU during the last 30 days. 54.6 percent of
patients died in the hospital. (Table 4)
Table 4: Quality indicators indicating inappropriate end-of-life care,
within the total population dying from COPD (N=4,231), Belgium, 2012.
Time period (number of days before death until death)
Indicator No time
specification
7d 14d 30d 90d 180d 360d 720d
Lung volume reduction
surgery
- 0.0 0.0 0.0 0.1 - - -
Endotracheal intubation
or tracheotomy
- 13.7 15.6 17.8 20.0 21.6 23.5 -
Continuous endotracheal
intubation
- 1.2 3.8 6.6 8.7 9.4 10.5 -
Repeated endotracheal
intubation
- 8.2 11.9 15.9 19.6 21.2 - -
Diagnostic testing
(medical imaging, ECG
or pulmonary function
testing)
- 47.3 56.5 65.9 - - - -
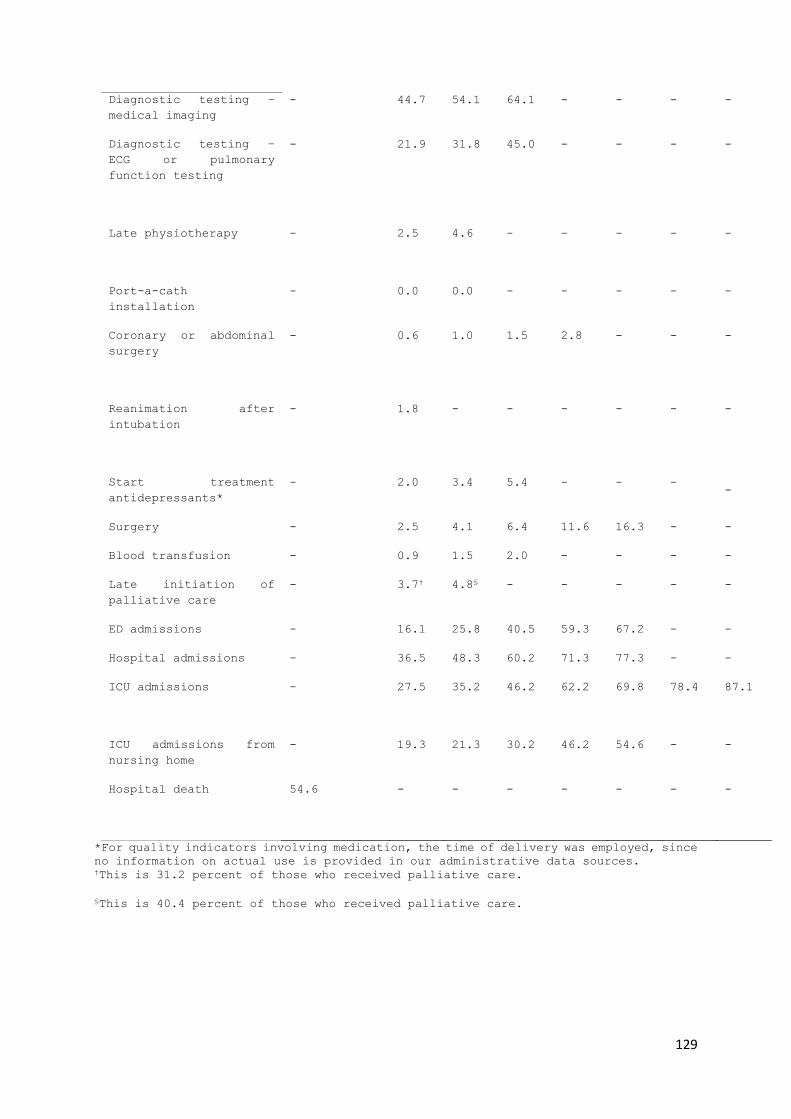
129
Diagnostic testing –
medical imaging
- 44.7 54.1 64.1 - - - -
Diagnostic testing –
ECG or pulmonary
function testing
- 21.9 31.8 45.0 - - - -
Late physiotherapy
- 2.5 4.6 - - - - -
Port-a-cath
installation
- 0.0 0.0 - - - - -
Coronary or abdominal
surgery
- 0.6 1.0 1.5 2.8 - - -
Reanimation after
intubation
- 1.8 - - - - - -
Start treatment
antidepressants*
- 2.0 3.4 5.4 - - - -
Surgery - 2.5 4.1 6.4 11.6 16.3 - -
Blood transfusion - 0.9 1.5 2.0 - - - -
Late initiation of
palliative care
- 3.7† 4.8§ - - - - -
ED admissions - 16.1 25.8 40.5 59.3 67.2 - -
Hospital admissions - 36.5 48.3 60.2 71.3 77.3 - -
ICU admissions
- 27.5 35.2 46.2 62.2 69.8 78.4 87.1
ICU admissions from
nursing home
- 19.3 21.3 30.2 46.2 54.6 - -
Hospital death
54.6 - - - - - - -
*For quality indicators involving medication, the time of delivery was employed, since
no information on actual use is provided in our administrative data sources. †This is 31.2 percent of those who received palliative care.
§This is 40.4 percent of those who received palliative care.
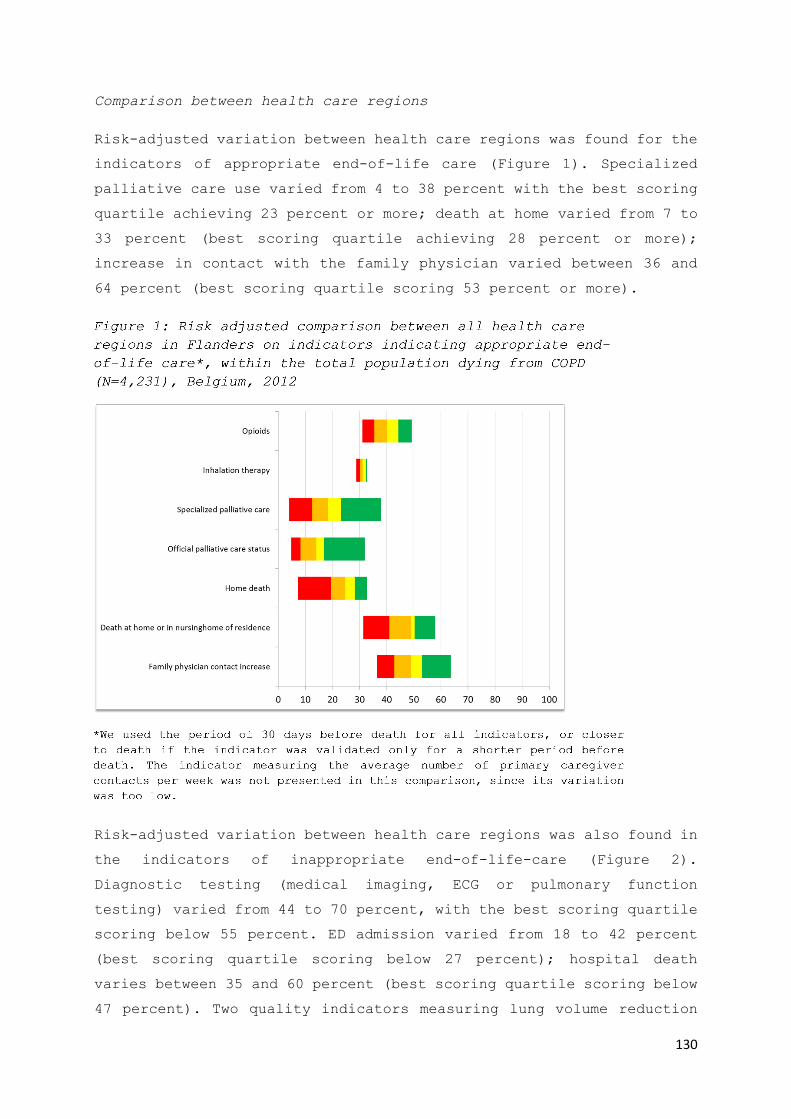
130
Comparison between health care regions
Risk-adjusted variation between health care regions was found for the
indicators of appropriate end-of-life care (Figure 1). Specialized
palliative care use varied from 4 to 38 percent with the best scoring
quartile achieving 23 percent or more; death at home varied from 7 to
33 percent (best scoring quartile achieving 28 percent or more);
increase in contact with the family physician varied between 36 and
64 percent (best scoring quartile scoring 53 percent or more).
Risk-adjusted variation between health care regions was also found in
the indicators of inappropriate end-of-life-care (Figure 2).
Diagnostic testing (medical imaging, ECG or pulmonary function
testing) varied from 44 to 70 percent, with the best scoring quartile
scoring below 55 percent. ED admission varied from 18 to 42 percent
(best scoring quartile scoring below 27 percent); hospital death
varies between 35 and 60 percent (best scoring quartile scoring below
47 percent). Two quality indicators measuring lung volume reduction

131
surgery and port-a-cath installation are not presented in this
comparison, since their variation was too low.
Based on these results, a relative performance standard for each
indicator can be suggested, set at the best scoring quartile, as a
goal to be pursued by the different regions in Brussels and Flanders.
(Table 5)
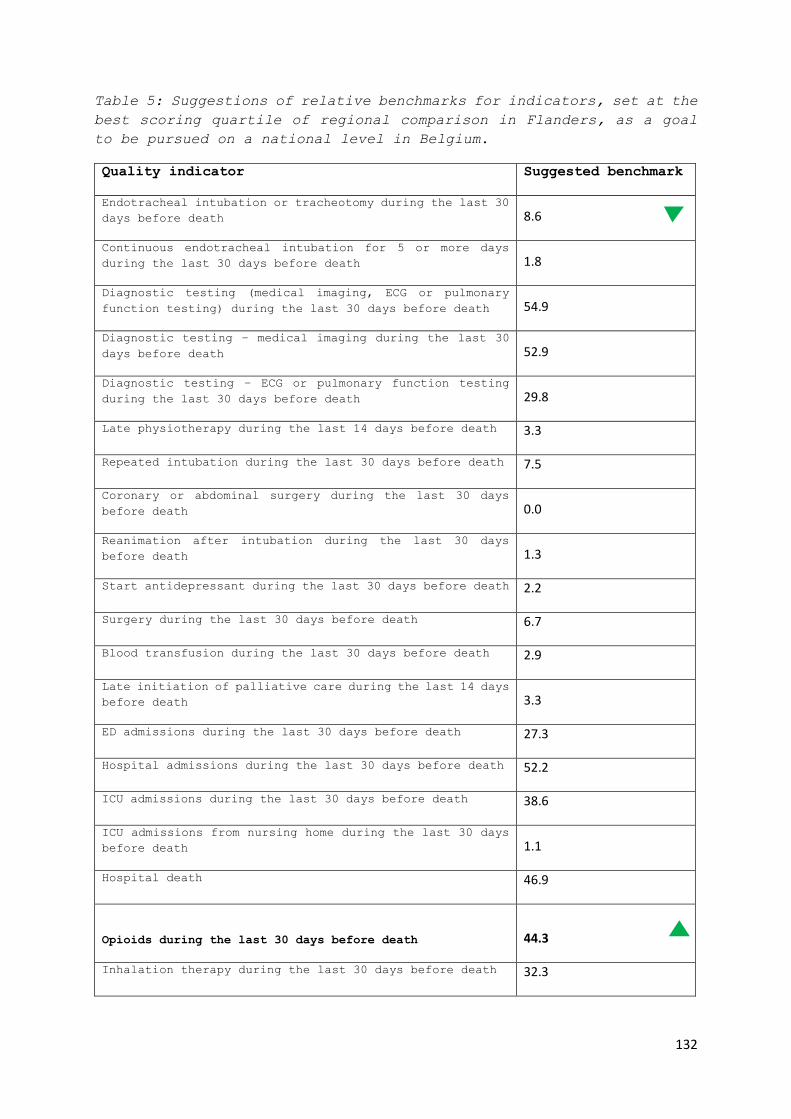
132
Table 5: Suggestions of relative benchmarks for indicators, set at the
best scoring quartile of regional comparison in Flanders, as a goal
to be pursued on a national level in Belgium.
Quality indicator Suggested benchmark
Endotracheal intubation or tracheotomy during the last 30
days before death 8.6
Continuous endotracheal intubation for 5 or more days
during the last 30 days before death 1.8
Diagnostic testing (medical imaging, ECG or pulmonary
function testing) during the last 30 days before death 54.9
Diagnostic testing – medical imaging during the last 30
days before death 52.9
Diagnostic testing – ECG or pulmonary function testing
during the last 30 days before death 29.8
Late physiotherapy during the last 14 days before death 3.3
Repeated intubation during the last 30 days before death 7.5
Coronary or abdominal surgery during the last 30 days
before death 0.0
Reanimation after intubation during the last 30 days
before death 1.3
Start antidepressant during the last 30 days before death 2.2
Surgery during the last 30 days before death 6.7
Blood transfusion during the last 30 days before death 2.9
Late initiation of palliative care during the last 14 days
before death 3.3
ED admissions during the last 30 days before death 27.3
Hospital admissions during the last 30 days before death 52.2
ICU admissions during the last 30 days before death 38.6
ICU admissions from nursing home during the last 30 days
before death 1.1
Hospital death 46.9
Opioids during the last 30 days before death 44.3
Inhalation therapy during the last 30 days before death 32.3

133
Specialized palliative care 23.2
Official palliative care status 16.9
Home death* 28.2
Death at home or in nursing home of residence* 50.3
Family physician contact increase during the last 30 days
before death 53.0
Discussion
Summary of main findings
Using a set of validated quality indicators of end-of-life care, we
were able to provide a snapshot of the performance of the Belgian
health care system in terms of end-of-life care in people who died
from COPD. Specialized palliative care was scarcely used and often
only in the last 2 weeks before death, while diagnostic testing,
hospital admissions, ICU admissions and emergency department
admissions were relatively frequent in the last 30 days of life. Large
regional variation was also found for these quality indicators. Due
to our risk adjustment procedure, this variance likely points at
differences in terms of quality of end-of-life care.
Strengths and weaknesses
Working with population level data from health insurance
administrators allowed us to include the entire population of
interest. Possible biases due to population selection and burden on
participants were thus avoided. In limiting our study population to
those who reportedly died from COPD, we selected a population that
presumably had a disease trajectory typical of COPD. Several
comorbidities or other underlying diseases are highly prevalent among
people suffering from COPD (e.g. lung cancer and/or cardiovascular
disease) and these are frequently reported as underlying cause of
death.(22)

134
A major limitation of using administrative data is that health care
interventions that are not reimbursed are not measured. Quality of
care aspects related to communication, for instance, cannot be
measured and the quality indicators were therefore also limited to
those measurable with administrative data.(13) Nevertheless, because
reimbursement of each health care intervention is dependent on
registration, the data can be assumed to reliably reflect actual
practice. The linking of eight different databases allowed the
performance of an extensive risk adjustment for the comparison between
regions, which contributes to a larger attributional validity of the
quality indicator scores.(23)
Interpretation and implications
Our study found indications that a relatively large proportion of
people with COPD receives potentially inappropriate end-of-life care.
A comparison with people dying from cancer(24), using similar quality
indicators, shows several disadvantages for people dying from COPD:
they receive opioids considerably less often at the end of life,
receive specialized palliative care about four times less and undergo
more diagnostic testing near the end of life. Although care preferences
are similar in both disease groups(7), discussions on prognosis and
advance care planning rarely occurred in people dying from COPD.(25–
28) The relatively low use of specialized palliative care in people
dying from COPD corroborates previous studies.(9,29–31)
Possible causes of large proportions of COPD patients receiving
inappropriate end-of-life care and few patients using specialized
palliative care relate to the difficulty to predict the COPD disease
trajectory, as well as the high prevalence of comorbidities that may
cause unexpected deterioration or death.(22,32) In addition, treating
physicians report a hesitation to communicate the prognosis with COPD
patients because of several reasons, such as a lack of communication
training and a fear of instilling unnecessary anxiety or depression
in the patient.(32,33) Because of this lack of communication on
prognosis, COPD patients often have little insight in the severity of
their condition,(10) inhibiting the discussion of end-of-life care
options.(26,32)

135
One of the surprising findings of our study is the substantial
variation between health care regions in the indicators for
appropriate and inappropriate end-of-life care. Our extensive risk
adjustment procedures rule out that these differences are due to age,
gender, lung cancer diagnosis, dependence on care, receipt of
government health care support, highest level of education, household
composition, degree of urbanization of the municipality of residence
and net taxable income. This implies that differences between health
care regions likely cannot be explained by differences between the
populations in those regions and reflect quality of care differences.
From a health care policy and equity perspective, such differences are
not acceptable.
Towards quality of care improvement
The suggested standards based on the comparison between regions are a
possible starting point for quality improvement. Particularly the
indicators for which there is large variance between regions, and
hence a larger room for improvement, require attention. For example,
specialized palliative care use can be increased to a (risk-adjusted)
percentage of 23.2 percent, diagnostic testing (medical imaging, ECG
or pulmonary function testing) in the last 30 days can be limited to
a population percentage of 54.9 percent and hospital admissions to
52.2 percent. These standards should be attainable, as currently 25%
of regions attain them.
Organizational, national and international health care policy makers
can use the suggested benchmarks to further analyze practice, search
for reasons for the differences between regions, and develop and test
interventions that can improve practice within a region.(34,35)
Interventions to improve the timely identification of palliative care
needs in COPD may, for instance, have a positive influence on several
indicators of appropriate care. They could lead to timely initiation
of care planning and inclusion in palliative care and a reduction of
avoidable inappropriate end-of-life care.(32) Duenk and colleagues
(36) present a list of indicators to identify patients with COPD that
could benefit from palliative care. Previous research also found
effective communication, decision making and goal setting as main
methods for improving end-of-life care in COPD.(37)

136
The usefulness of quality indicators increases as measurements are
repeated; we therefore recommend both repetition of the measurement
as well as comparative measurement in an international context. The
quality indicators in this study are transferable to other
contexts.(13)
Conclusion
We found several indications of potentially inappropriate end-of-life
care in people dying from COPD in Belgium, especially for diagnostic
testing, hospital admissions and use of specialized palliative care.
Risk-adjusted variation between regions was substantial for several
QIs, suggesting obvious room for improvement in the care for people
dying from COPD. The performance standards set by our study are useful
in that respect: set at the best performing 25% of regions, they can
be considered ambitious and achievable goals.
137
Acknowledgements
The authors thank dr. Bernard Landtmeters and dr. Bernard Debbaut for
their contributions to the operationalization of the quality
indicators. We thank Miete Tilkin for professional language support.
We also thank the Intermutualistic Agency, the Belgian Cancer Registry
and Statistics Belgium for providing all data required for this study.
Author contributions
Robrecht De Schreye is the primary writer of this manuscript, with
full access to the data and responsibility for the integrity of the
data and the accuracy of the data analysis. Tinne Smets and Joachim
Cohen are major contributing authors, writing parts of the
manuscripts, providing feedback and supervising the data analysis on
a daily basis. Luc Deliens, Lieven Annemans and Birgit Gielen are
contributing authors, providing regular feedback and providing
specific expertise.

138
References
1. Lopez AD, Mathers CD, Ezzati M, Jamison DT, Murray CJL. Global and
regional burden of disease and risk factors, 2001: systematic analysis
of population health data. Lancet Lond Engl. 2006 May 27;367(9524):1747–
57.
2. Mathers CD, Loncar D. Projections of Global Mortality and Burden of
Disease from 2002 to 2030. PLOS Med. 2006 Nov 28;3(11):e442.
3. Lal AA, Case AA. Palliation of chronic obstructive pulmonary disease.
Ann Palliat Med. 2014 Nov 1;3(4):276–85.
4. Pauwels RA, Buist AS, Calverley PM, Jenkins CR, Hurd SS, GOLD Scientific
Committee. Global strategy for the diagnosis, management, and prevention
of chronic obstructive pulmonary disease. NHLBI/WHO Global Initiative
for Chronic Obstructive Lung Disease (GOLD) Workshop summary. Am J
Respir Crit Care Med. 2001 Apr;163(5):1256–76.
5. Elkington H, White P, Addington-Hall J, Higgs R, Pettinari C. The last
year of life of COPD: a qualitative study of symptoms and services.
Respir Med. 2004 May;98(5):439–45.
6. Murray SA, Kendall M, Boyd K, Sheikh A. Illness trajectories and
palliative care. BMJ. 2005 Apr 30;330(7498):1007–11.
7. Claessens MT, Lynn J, Zhong Z, Desbiens NA, Phillips RS, Wu AW, et al.
Dying with lung cancer or chronic obstructive pulmonary disease:
insights from SUPPORT. Study to Understand Prognoses and Preferences for
Outcomes and Risks of Treatments. J Am Geriatr Soc. 2000 May;48(5
Suppl):S146-153.
8. Duenk RG, Verhagen C, Dekhuijzen P, Vissers K, Engels Y, Heijdra Y. The
view of pulmonologists on palliative care for patients with COPD: a
survey study. Int J Chron Obstruct Pulmon Dis. 2017;12:299–311.
9. Curtis JR. Palliative and end-of-life care for patients with severe
COPD. Eur Respir J. 2008 Sep;32(3):796–803.
10. Gore JM, Brophy CJ, Greenstone MA. How well do we care for patients
with end stage chronic obstructive pulmonary disease (COPD)? A
comparison of palliative care and quality of life in COPD and lung
cancer. Thorax. 2000 Dec;55(12):1000–6.
11. Chassin MR, Brook RH, Park RE, Keesey J, Fink A, Kosecoff J, et al.
Variations in the use of medical and surgical services by the Medicare
population. N Engl J Med. 1986 Jan;314(5):285–90.
12. Park RE, Fink A, Brook RH, Chassin MR, Kahn KL, Merrick NJ, et al.
Physician ratings of appropriate indications for six medical and
surgical procedures. Am J Public Health. 1986 Jul;76(7):766–72.
13. De Schreye R, Houttekier D, Deliens L, Cohen J. Developing indicators
of appropriate and inappropriate endof- life care in people with
Alzheimer’s disease, cancer or COPD for population-level administrative
databases: a RAND/UCLA appropriateness study (unpublished). Palliat Med.
2017;

139
14. Grunfeld E, Urquhart R, Mykhalovskiy E, Folkes A, Johnston G, Burge
FI, et al. Toward population-based indicators of quality end-of-life
care: testing stakeholder agreement. Cancer. 2008 May;112(10):2301–8.
15. Earle CC, Neville BA, Landrum MB, Souza JM, Weeks JC, Block SD, et
al. Evaluating claims-based indicators of the intensity of end-of-life
cancer care. Int J Qual Health Care. 2005 Dec;17(6):505–9.
16. Kiefe CI, Weissman NW, Allison JJ, Farmer R, Weaver M, Williams OD.
Identifying achievable benchmarks of care: concepts and methodology. Int
J Qual Health Care J Int Soc Qual Health Care. 1998 Oct;10(5):443–7.
17. Maetens A, De Schreye R, Faes K, Houttekier D, Deliens L, Gielen B,
et al. Using linked administrative and disease-specific databases to
study end-of-life care on a population level. BMC Palliat Care. 2016 Oct
18;15(1):86.
18. The RAND/UCLA Appropriateness Method User’s Manual - MR1269.pdf
[Internet]. [cited 2016 Apr 13]. Available from:
https://www.rand.org/content/dam/rand/pubs/monograph_reports/2011/MR1269
19. 20160830_Tussentijds rapport zorgregio’s.pdf [Internet]. [cited 2017
Oct 27]. Available from: https://www.zorg-en-
gezondheid.be/sites/default/files/atoms/files/20160830_Tussentijds%20rap
port%20zorgregio%27s.pdf
20. Spilsbury K, Rosenwax L, Arendts G, Semmens JB. The Association of
Community-Based Palliative Care With Reduced Emergency Department Visits
in the Last Year of Life Varies by Patient Factors. Ann Emerg Med. 2017
Apr;69(4):416–25.
21. Smith PC, Mossialos E, Papanicolas I, Leatherman S. Performance
Measurement for Health System Improvement: : experiences, challenges and prospects. Cambridge University Press; 2009.
22. Smith MC, Wrobel JP. Epidemiology and clinical impact of major
comorbidities in patients with COPD. Int J Chron Obstruct Pulmon Dis.
2014;9:871–88.
23. Silva LK. Validity of the risk adjustment approach to compare
outcomes. Cad Saude Publica. 2003 Feb;19(1):287–95.
24. De Schreye R, Smets T, Annemans L, Deliens L, Gielen B, De Gendt C,
et al. Applying Quality Indicators For Administrative Databases To
Evaluate End-Of-Life Care For Cancer Patients In Belgium. Health Aff
Proj Hope. 2017 Jul 1;36(7):1234–43.
25. Heffner JE, Fahy B, Hilling L, Barbieri C. Attitudes regarding
advance directives among patients in pulmonary rehabilitation. Am J
Respir Crit Care Med. 1996 Dec;154(6 Pt 1):1735–40.
26. Elkington H, White P, Higgs R, Pettinari CJ. GPs’ views of
discussions of prognosis in severe COPD. Fam Pract. 2001 Aug;18(4):440–
4.
27. Halliwell J, Mulcahy P, Buetow S, Bray Y, Coster G, Osman LM. GP
discussion of prognosis with patients with severe chronic obstructive
pulmonary disease: a qualitative study. Br J Gen Pract J R Coll Gen
Pract. 2004 Dec;54(509):904–8.

140
28. Curtis JR, Wenrich MD, Carline JD, Shannon SE, Ambrozy DM, Ramsey PG.
Patients’ perspectives on physician skill in end-of-life care:
differences between patients with COPD, cancer, and AIDS. Chest. 2002
Jul;122(1):356–62.
29. Faes K, De Frène V, Cohen J, Annemans L. Resource Use and Health Care
Costs of COPD Patients at the End of Life: A Systematic Review. J Pain
Symptom Manage. 2016 Oct;52(4):588–99.
30. Au DH, Udris EM, Fihn SD, McDonell MB, Curtis JR. Differences in
health care utilization at the end of life among patients with chronic
obstructive pulmonary disease and patients with lung cancer. Arch Intern
Med. 2006 Feb 13;166(3):326–31.
31. Yohannes AM. Palliative care provision for patients with chronic
obstructive pulmonary disease. Health Qual Life Outcomes. 2007 Apr
3;5:17.
32. Patel K, Janssen DJA, Curtis JR. Advance care planning in COPD.
Respirol Carlton Vic. 2012 Jan;17(1):72–8.
33. Curtis JR, Engelberg RA, Wenrich MD, Au DH. Communication about
palliative care for patients with chronic obstructive pulmonary disease.
J Palliat Care. 2005;21(3):157–64.
34. Palliative Care Outcomes Collaboration [Internet]. [cited 2018 Jan
18]. Available from: http://www.pcoc.org.au/
35. about IKNL [Internet]. [cited 2018 Jan 18]. Available from:
https://www.iknl.nl/over-iknl/about-iknl
36. Duenk RG, Heijdra Y, Verhagen SC, Dekhuijzen RPNR, Vissers KCP,
Engels Y. PROLONG: a cluster controlled trial to examine identification
of patients with COPD with poor prognosis and implementation of
proactive palliative care. BMC Pulm Med. 2014 Apr 2;14:54.
37. Rocker GM, Dodek PM, Heyland DK, Canadian Researchers at the End of
Life Network. Toward optimal end-of-life care for patients with advanced
chronic obstructive pulmonary disease: insights from a multicentre
study. Can Respir J. 2008 Aug;15(5):249–54.

141
Chapter 6: Appropriateness of end-of-life care in
people dying with dementia. Applying quality
indicators on linked administrative databases.
Robrecht De Schreye, Tinne Smets, Luc Deliens, Lieven
Annemans, Birgit Gielen, Joachim Cohen
Published in the Journal of the American Medical Directors
Association (2020)

142
Abstract
Objectives
Dementia is a progressive incurable life-limiting illness. Previous
research suggests end-of-life care for people with dementia should
have a symptomatic focus with an effort to avoid burdensome
interventions that would not improve quality of life.
This study aims to assess the appropriateness of end-of-life care in
people who died with dementia in Belgium and to establish relative
performance standards, by measuring validated population-level quality
indicators (QIs).
Design
We conducted a retrospective observational study.
Setting and participants
We included all persons deceased with dementia in 2015 in Belgium.
Data from eight administratively collected population-level databases
was linked.
Measures
We used a validated set of 28 quality indicators for end-of-life
dementia care. We compared quality indicator scores across 14 health
care regions to establish relative benchmarks.
Results
In Belgium in 2015, 10,629 people died with dementia. For indicators
of appropriate end-of-life care, people who died with dementia had on
average 1.83 contacts with their family physician in the last week
before death, while 68.4 percent died at home or in their nursing home
of residence.
For indicators of inappropriate end-of-life care, 32.4 percent were
admitted to hospital and 36.3 percent underwent diagnostic testing in
the last 30 days before death, while 25.1 percent died in the hospital.
In the last 30 days, ED admission varied between 19 and 31 percent,
dispensing of gastric protectors between 18 and 42 percent, and anti-

143
hypertensives between 40 and 53 percent between health care regions,
with at least 25% of health regions below 46 percent.
Conclusions and implications
Our study found indications of appropriate as well as inappropriate
end-of-life care in people with dementia, including high rates of
family physician contact, as well as high percentages of diagnostic
testing and ED and hospital admissions. We also found high risk-
adjusted variation for multiple QIs, indicating opportunity for
quality improvement in end-of-life dementia care.

144
Background
Dementia is a progressive incurable life-limiting illness and its
prevalence is increasing worldwide. Dementia contributes strongly to
functional disability, care dependence and institutionalization in the
older population.1,2 People with dementia experience progressive
cognitive and physical impairment and often suffer from burdensome
symptoms and clinical complications at the end of life.3–5 In contrast
with people suffering from cancer or organ failure, their disease
trajectory is characterized by a gradual functional decline.6–8
Because of this irreversible gradual decline, experts advocate the
main care goals for people with advanced dementia include providing a
comfortable, painless, dignified end of life, while avoiding
unnecessary treatment, medication and care transitions.6,9,10 However,
experts are concerned that these goals are often not met and
inappropriate end-of-life care for people with dementia is
occurring.6,11,12 Appropriate end-of-life care, regardless of the
disease, can be defined as receiving care of which the expected health
benefit (e.g. increased life expectancy or symptom relief) exceeds
possible negative outcomes (e.g. mortality, loss of quality of
life)13,14.
Using a RAND/UCLA Appropriateness method, we developed a set of quality
indicators that measure aspects of care that may indicate appropriate
or inappropriate care at the end of life in people who died with
dementia.10 The set includes indicators on aggressiveness of care, pain
and symptom management, specialized palliative care delivery, place
of care and death and continuity of care. The indicators were developed
specifically to be used at a population level, using administrative
health data. The use of the indicators, in a benchmarking of different
health care regions, also allows to set relative performance standards
as attainable targets for quality improvement.15 Previous population-
level health care research found substantial variation in health care
provision across health care regions in Belgium.16,17 If variation in
appropriateness of care is found between regions, although government
policy and funding across all regions are equal (e.g. reimbursement
of care), this means variation in practice indicates opportunities for
improvement in regions where appropriate care is more prevalent. This

145
is a first step towards improvement of the quality of end-of-life care
and it is novel in dementia research.
The aims of our study are threefold:
1. To assess the quality of end-of-life care in all people who died
with dementia in Belgium using previously validated quality indicators
of potentially appropriate or inappropriate end-of-life care.
2. To compare the quality indicator scores of end-of-life care in
people who died with dementia between all health care regions within
the country.
3. To establish relative performance standards based on this
comparison.
Method
Study design and data sources
We conducted a retrospective observational study of all deceased with
dementia in 2015 in Belgium. Data from eight administratively
collected population-level databases was linked into one database for
analysis18 (Chapter 3 provides a detailed description of the
databases):
(1) Socio-demographic database of all individuals with healthcare
insurance (legally mandatory in Belgium);
(2) Health care database containing all reimbursed health care use
data of home, nursing home and hospital care, except medication
dispensed in public pharmacies;
(3) Pharmaceutical database containing all reimbursed medication data
dispensed in public pharmacies;
(4) Cancer Registry database with diagnostic information on all
incidences of cancer including type of cancer and date of diagnosis;
(5) Death certificate database containing all reported causes of
death;

146
(6) Population registry database including household composition;
(7) Census database, including housing characteristics and educational
level;
(8) Fiscal database, including net taxable income;
After acquiring approval from all relevant data protection agencies,
all databases were linked in a secure and ethically responsible manner,
guaranteeing anonymity of the deceased. The database linking procedure
is described in detail in a previous publication.18
Population
All people who died with dementia in 2015 were identified based on the
underlying, intermediate and associated causes of death reported on
the death certificate, coded in ICD-10 codes (F00 or G30).
Data
In the Belgian health care system, health care costs are reimbursed
directly to the patient by health insurers and every reimbursement is
registered. A central agency collects the data from all health
insurance registries in a central health care database and pharmacy
database, which were part of the linking procedure mentioned in the
methods section. This provides detailed information on every care
action that was reimbursed. We used all available data on health care
use including medication use, treatment, dates of treatment and
prescription and admission to hospitals and nursing homes. Multiple
socio-economic, demographic and clinical variables were selected,
including age, gender, dependence on care, highest attained level of
education, household composition, degree of urbanization of the
municipality of residence and net taxable income.
Quality indicators
We used a validated set of 28 quality indicators for end-of-life
dementia care. It was developed and validated using a RAND/UCLA
Appropriateness method.10,19 The expert panel consisted of neurologists,
pharmacologists, nursing home coordinating and advisory physicians,

147
geriatrists and palliative care specialists. The quality indicators
measure the prevalence of specific healthcare interventions in a
specified period before death. We measured all indicators 7, 14, 30,
90, 180, 360 and 720 days prior to death, except the periods for which
the specific indicators were not validated by the expert panel (as
indicated in table 1). One indicator on tube feeding or intravenous
feeding could not be measured, as they are reimbursed as a package in
the hospital context, not as individual interventions.
Table 1: Quality indicators with detailed description
Indicator
(brief description)
Indicator
of
appropriate
(A) or
inappropria
te (I) care
Numerator
(Number of people who died with dementia
who*)
Denominator
(*Number of
people who
died with
dementia)
Domain: aggressiveness of care
Tube feeding or
intravenous
feeding†§
I *received tube feeding or intravenous
feeding in the last month prior to death
*
Diagnostic testingठI *had diagnostic testing (spirometry OR
radiography OR blood drawn OR
electrocardiogram) in the last month prior
to death
*
StatinsठI *received statins and did not have declining
statin use in the last [12,6,1] months
prior to death
* and
received
statins
Port-a-cath
installment‡§
I *had a port-a-cath installed in the last 2
weeks prior to death
*
Neurologist visit‡\\ I *received treatment from a neurologist in
the last month prior to death
*
Gastric protectors‡\\ I *received two or more prescriptions of
gastric protectors in the last 6 months
prior to death (ie prescription until death)
*
Anti-hypertensivesठI *received antihypertensives in the last
[6,3,1] months prior to death
*
Calcium vitamin DठI *received calcium or vitamin D in the last
[6,3,1] months prior to death
*
NOACs or vitamin K
antagonists‡\\
I *received a prescriptions for novel oral
anticoagulants OR vitamin K antagonists in
the last 3 months prior to death (i.e.
prescription until death)
*

148
Prophylactic gout
medication‡\\
I *received a prescriptions for prophylactic
gout medication in the last 3 months prior
to death
*
Cardiopulmonary
resuscitation‡§
I *were reanimated in the last 2 weeks prior
to death
*
Chemotherapy‡\\ I * had a cancer diagnosis and received
chemotherapy in the [12, 6] months prior to
death
* and had a
cancer
diagnosis
Serotonin reuptake
inhibitors‡\\
I *received serotonin reuptake inhibitors in
the last 3 months prior to death
*
SurgeryठI *received surgery in the last [6,3, 1]
months prior to death
*
Blood transfusionठI *received blood transfusion in the last
month prior to death
*
Domain: Pain and symptom treatment
Morphine and
neuropathic
medication†§
A *received neuropathic medication when
receiving morphine in the last 2 years prior
to death
*
Domain: Palliative care
Specialized
palliative care†§
A *received specialized palliative care
(hospital palliative unit OR palliative
daycare centre OR multidisciplinary home
care) in the last 2 years prior to death
*
Official palliative
care status†§
A * received official palliative care status,
enabling financial government support for
palliative care at any point prior to death
*
Late initiation of
palliative care †¶
I * had a first referral to specialized
palliative care OR received official
palliative status during the last week
before death
*
Domain: Place of treatment and place of death
Home death†§ A *died at home *
Hospital
admissions†¶
I * had one or more hospital admission/s in
the last [6, 3, 1 }months prior to death
*
ED admissions†\\ I * had one or more emergency hospital visits
in the last [6, 3, 1 }months prior to death
*
Home death or death
in nursing home of
residence †§
A *lived and died in a nursing home *and lived
in a
nursing
home
Hospital death†¶ I *died in hospital *
ICU admissionठI *had one or more admissions to the intensive
care unit in the last month prior to death
*

149
Domain: Coordination and continuity of care
Family physician
contact†§
A *had an increase in average number of
contacts with a family physician in the last
month prior to death compared to the
previous 23 months
*
Primary caregiver
contact †§
A Sum of number of contacts with a family
physician or other primary care
professional in the last 3 months prior to
death
*
ICU admissions from
nursing home‡§
I *lived in a nursing home and had 1 or more
ICU visits in the last month prior to death
*and lived
in a
nursing
home
†Indicator from literature, ‡Indicator from expert interviews, §Accepted in phase 3a
scoring round, ¶Accepted in phase 3b plenary discussion, \\Adapted and accepted in
phase 3b plenary discussion.
Risk factors for comparison across health care regions and relative
benchmarks
For the comparison of QIs across health care regions, we performed
risk adjustment procedures. The northern part of Belgium has 14 major
health care regions, based on natural patient flow towards major
hospitals in each region.20 These regions cover the administrative
regions of Flanders and Brussels; no equivalent exists in the Walloon
region. We therefore limited this analysis to Flanders and Brussels.
To obtain a fair comparison across health care regions, we performed
risk adjustment procedures. We started from a comprehensive list of
possible risk factors21 and made a selection based on availability of
data in the current dataset. The following risk factors were identified
as relevant and measurable with the current dataset: age, gender,
living situation (e.g. alone, with children, in a nursing home), being
entitled to a higher degree of reimbursement due to lower degree of
self-reliance, being officially recognized by the physician as having
heavy care needs, frequent (more than 5 in the same year) or extended
(at least 120 days in one year) hospital stays, highest level of
education, household composition, degree of urbanization of the
municipality of residence and net taxable income.
150
Statistical analyses
The characteristics of the decedents with dementia and the quality
indicators were calculated using descriptive statistics.
Risk adjusted comparison and the establishment of relative benchmarks
consisted of four steps:
1) We evaluated the effects of the potential risk factors on
individuals’ outcomes for each of the quality indicators (coded binary
as present [1] or absent [0]) using logistic regression. We used the
period of 30 days before death for all indicators, or closer to death
if the indicator was validated only for a shorter period before death.
2) We used stepwise model building, with a significance level of 0.3
for entry and significance level of 0.05 to stay in the model. Based
on the logistic regression, predicted scores (between 0 and 1) were
calculated for each individual. For example: age and being entitled
to a higher degree of reimbursement due to lower degree of self-
reliance were associated with higher ICU admission, while living in a
nursing home was associated with lower ICU admission. No other socio-
demographic variables were withheld by the stepwise model-building
process for ICU admission.
3) For each health care region, an average risk adjusted score was
calculated by dividing the average predicted score by the average
observed score for that health care region, multiplied by the average
observed score across all regions. In the example of ICU admission,
this score was calculated using the age, lower degree of self-reliance
and living in a nursing home for all people who died of dementia living
in this each region.
4) To establish relative benchmarks, quartiles across health care
regions were calculated for each quality indicator. For indicators of
appropriate care, the relative benchmark was established at the third
quartile (or above), while for indicators of inappropriate care, the
relative benchmark was established at the first quartile (or below).
All analyses were conducted with SAS Enterprise Guide, version 7.1.

151
Ethics
The study was approved by a university hospital committee for medical
ethics (B.U.N. 143201627075). The administrative data linking process
was approved by the national Belgian Data Protection Authority
(project SA1/STAT/MA-2015-026-020-MAV) and by the Statistical
Monitoring Committee (project STAT-MA-2015-026).
Results
Study Population Characteristics
The study population consisted of 10,629 people who died with dementia
in Belgium in 2015 (10.6 percent of all deceased), of whom 65.8 percent
were women. The mean age at death was 85 (data not shown). 46.5 percent
lived in a collective household (most likely a nursing home). 7.8
percent completed higher education and 8.6 percent did not complete
primary education. 59.7 percent lived in a highly or very highly
urbanized region. (Table 2)
Table 2: Characteristics of all deaths from or with dementia,
Belgium, 2015. People who died with dementia
Number* Percent
All deaths 10,629 100.0
Gender Male 3,633 34.2
Female 6,996 65.8
Age 0-64 87 0.8
65-74 411 3.9
75-84 3,642 34.3
85 and older 6,489 61.1
Nationality Belgian 10,162 95.6
Other 467 4.4
Underlying
cause of death
Dementia 7,005 65.9
Cancer 369 3.47
Ischemic heart disease 323 3.04
Heart failure 261 2.46
Other 2671 25.13
Household type† Single person 1,994 18,77

152
Couple with no children living at home 2.647 24.9
Couple with children living at home 417 3.9
Single parent family 388 3.6
Collective household 4,944 46.5
Other 235 2.2
Housing
comfort‡
High 3,842 40.0
Average 2,247 23.4
Low 3,521 34.6
Level of
education
Higher education 829 7.8
Upper secondary education 1,272 12.0
Lower secondary education 2,254 21.2
Primary education 3,979 37.4
No completed education 916 8.6
Unknown 1,379 12.9
Level of
urbanization
of residence§
Very high 3,287 30.9
High 3,059 28.8
Average 2,702 25.4
Low 1,403 13.2
Net Taxable
Income
Decile 1 44 0.4
Decile 2 44 0.4
Decile 3 78 0.7
Decile 4 1,119 10.5
Decile 5 2,165 20.4
Decile 6 3,469 32.7
Decile 7 2,078 19.6
Decile 8 803 7.6
Decile 9 519 4.9
Decile 10 306 2.9
*May not always add up to 10,629 because of missing values, which were always lower than 1.0%, except for housing comfort
(9,6%) and education level (13.0%).
†Married and unmarried couples living together were taken together in one group. People living in a nursing
home are registered as ‘collective household’ if (1) they officially live in the nursing home for more than
a year OR (2) they were admitted to a nursing home at least 180 days before death. ‡Defined by the number of rooms and facilities (e.g. bathroom) available in the persons home, as provided in
the 2001 census. §Degree of urbanization of the official residence, as categorized by Eurostat (http://ec.europa.eu/eurostat)
and OECD (http://www.oecd.org/)

153
Quality Indicators of Appropriate End-Of-Life Care
Of all people who died with dementia in Belgium in 2015, 9.8 percent
received specialist palliative care, and 68.4 percent died at home or
in the nursing home where they lived. Of all people living in a nursing
home at least 180 days before death, 79.2 percent died in the nursing
home. (data not shown) 60.2 percent had an increase in family physician
contacts during the last week of life compared with the period before,
with an average of 1.83 reimbursed contacts per week during the last
week of life. (Table 3)

154
Table 3: Quality indicators indicating appropriate end-of-life care,
within the total population dying with dementia (N=10,629), Belgium,
2015
Time period (number of days before death until
death)
Indicator No time
specification
7d 14d 30d 90d 180d 360d 720d
Dispensing of
morphine and
neuropathic
medication
-
1.3 1.8 2.2 2.8 3.2 3.7 4.5
Specialist palliative
care
9.8 - - - - - - -
Official palliative
care status
5.8 - - - - - - -
Home death*† 10.9 - - - - - - -
Death at home or in
nursing home of
residence*‡
68.4 - - - - - - -
Family physician
contact increase
-
60.2 74.0 74.1 - - - -
(average number of
family physician
contacts per week)§
-
1.83 1.25 0.85 - - - -
Average number of
primary caregiver
contact per week§
-
2.32 1.79 1.47 1.34 - - -
*This indicator is only measured at the moment of death. Therefore, time periods are
irrelevant. †The denominator of this indicator is people who did not stay in a nursing home at least 180
days before death, being 32.6 percent of the population. ‡The denominator of this indicator is people who lived in a nursing home at least 180 days
before death, being 67.4 percent of the population. §This indicator is not presented by percentages. It depicts the average number of contacts per
week across the population during the indicated time period.
Quality Indicators of Inappropriate End-Of-Life Care
Of all people who died with dementia, 25.6 percent were admitted to
an emergency department, 32.4 to hospital and 2.2 to ICU during the
last 30 days of life. 25.1 percent of people died in the hospital.
In the last two weeks prior to death, 25.8 percent of people who died
with dementia was submitted to diagnostic testing (medical imaging,
ECG or pulmonary function testing). 0.8 percent received surgery
during the last 30 days.

155
Of those who died with dementia and had a cancer diagnosis, 1.7 percent
received chemotherapy during the last 30 days prior to death.
Regarding drug dispensing in the last 30 days prior to death, 43.8
percent received anti-hypertensives, 38.5 percent received NOACs or
vitamin K antagonists, 26.5 percent received gastric protectors and
6.5 percent received statins.
Of those who received specialist palliative care 38.3 percent received
it only in the last week, which corresponds to 3.7 percent of the
total population who died with dementia. (Table 4)
Table 4: Quality indicators indicating inappropriate end-of-life
care, within the total population dying with dementia (N=10,629),
Belgium, 2015.
Time period (number of days before death until death)
Indicator No time
specification
7d 14d 30d 90d 180d 360d 720d
Diagnostic testing - 16.7 25.8 36.3 - - - -
Diagnostic testing
– medical imaging*
- 16.1 24.3 35.1 - - - -
Diagnostic testing
– ECG or pulmonary
function testing
- 8.4 13.5 22.1 - - - -
Chemotherapy† - 0.3 0.8 1.7 2.9 8.1 10.8 -
Surgery - 0.2 0.4 0.8 1.6 - -
Blood transfusion - 0.2 0.4 0.7 1.2 - - -
Late palliative
care
- 3.7‡ 4.7§ - - - - -
Hospital admission - 17.7 24.0 32.4 43.0 56.9 - -
ED admission - 9.5 15.3 25.6 39.5 50.8 - -
Hospital death 25.1 - - - - - - -
ICU admission - 1.0 1.5 2.2 3.2 - - -
ICU admission from
nursing home
0.4 0.7 1.0 1.3 2.7 - -
Dispensing of:

156
Statins - 2.5 3.9 6.5 13.4 18.7 30.2 -
Gastric protectors - 13.3 18.8 26.5 39.6 44.1 - -
Anti-
hypertensives\\
- 22.4 31.5 43.8 61.4 68.3 - -
Calcium vitamin D¶ - 2.3 4.3 8.6 16.1 21.5 - -
NOACs or vitamin K
antagonists
- 19.0 27.4 38.5 - - - -
Prophylactic gout
medication
- 0.7 1.0 1.8 3.6 - - -
Serotonin reuptake
inhibitors
- 4.2 6.4 10.2 17.9 - - -
*This indicator measures the occurrence of radiography or echography
†This indicator was measured only for people who also had a cancer diagnosis. (N=1.194)
‡This is 38.3 percent of those who received specialized palliative care.
§This is 47.7 percent of those who received specialized palliative care.
\\Anti-hypertensives: this includes all antihypertensives (C02), diuretics (C03), beta blocking
agents (C07), Calcium channel blockers (C08) and renin-angiotensin systemic agents(C09)
¶Not all forms of Calcium or vitamin K antagonists are reimbursed in Belgium, some variants
can be bought over the counter and as such are not included in this measurement.
Comparison of quality indicator scores of end-of-life dementia care
between health care regions
Variation of scores between different health care regions in Flanders
and Brussels (N = 7,581) is found for the indicators of appropriate
end-of-life-care (Figure 1): dying at home or in a nursing home of
residence varies between 52 and 62 percent, with the best scoring
quartile scoring above 59 percent. Having an increase in contacts with
the family physician in the last 30 days compared to the period before
varies between 72 and 86 percent, with the best scoring quartile above
83 percent. The use of specialist palliative care varies between 5 and
11 percent between regions, with the best scoring quartile scoring
above 9 percent.
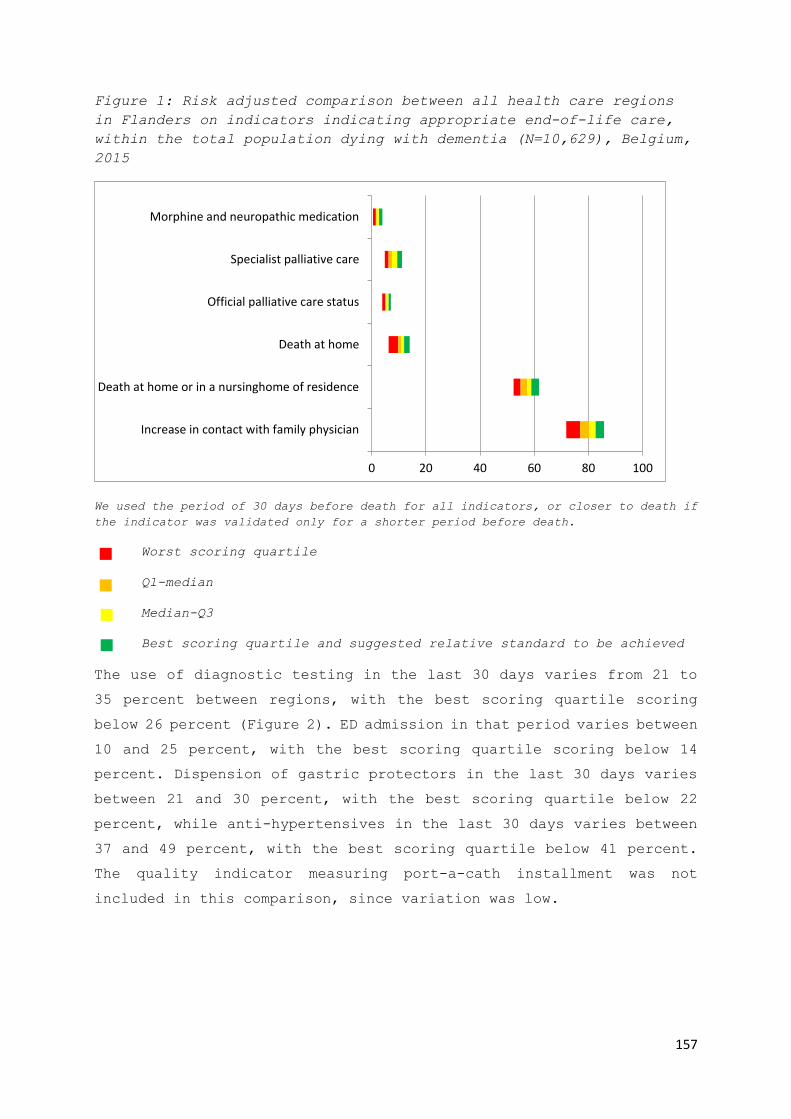
157
Figure 1: Risk adjusted comparison between all health care regions
in Flanders on indicators indicating appropriate end-of-life care,
within the total population dying with dementia (N=10,629), Belgium,
2015
We used the period of 30 days before death for all indicators, or closer to death if
the indicator was validated only for a shorter period before death.
Worst scoring quartile
Q1-median
Median-Q3
Best scoring quartile and suggested relative standard to be achieved
The use of diagnostic testing in the last 30 days varies from 21 to
35 percent between regions, with the best scoring quartile scoring
below 26 percent (Figure 2). ED admission in that period varies between
10 and 25 percent, with the best scoring quartile scoring below 14
percent. Dispension of gastric protectors in the last 30 days varies
between 21 and 30 percent, with the best scoring quartile below 22
percent, while anti-hypertensives in the last 30 days varies between
37 and 49 percent, with the best scoring quartile below 41 percent.
The quality indicator measuring port-a-cath installment was not
included in this comparison, since variation was low.
0 20 40 60 80 100
Increase in contact with family physician
Death at home or in a nursinghome of residence
Death at home
Official palliative care status
Specialist palliative care
Morphine and neuropathic medication

158
Figure 2: Risk adjusted comparison between all health care regions
in Flanders on indicators indicating inappropriate end-of-life care,
within the total population dying with dementia (N=10,629), Belgium,
2015
We used the period of 30 days before death for all indicators, or closer to death if
the indicator was validated only for a shorter period before death.
Worst scoring quartile
Q1-median
Median-Q3
Best scoring quartile and suggested relative standard to be achieved
Based on these results, we suggest a relative benchmark for each
indicator, set at the best scoring quartile. (Table 5)
0 10 20 30 40 50 60 70 80 90 100
ICU admission from nursing home
ICU admission
ED admission
Hospital admission
Late palliative care
Blood transfusion
Surgery
Serotonin reuptake inhibitors
Chemotherapy
Prophylactic gout medication
NOACs or vitamin K antagonists
Calcium vitamin D
Anti-hypertensives
Gastric protectors
Statins
Diagnostic testing - ECG or pulmonary function…
Diagnostic testing - medical imaging
Diagnostic testing

159
Table 5: Suggestions of relative benchmarks for indicators, set at
the best scoring quartile of regional comparison in Flanders, as a
goal to be pursued on a national level in Belgium. (all measured at
30 days before death where time is relevant)
Quality indicator Suggested benchmark
Morphine and neuropathic medication Above 2.7
Specialist palliative care 9.5
Official palliative care status 6.2
Death at home 12.0
Death at home or in a nursing home of residence 58.9
Increase in contact with family physician 82.6
Diagnostic testing Below 25.5
Diagnostic testing – Medical imaging 24.9
Diagnostic testing – ECG or pulmonary function testing 15.5
Statins 4.7
Gastric protectors 22.4
Anti-hypertensives 41.1
Calcium Vitamin D 5.5
NOACs or vitamin K antagonists 31.1
Prophylactic gout medication 1.1
Chemotherapy 0.0
Serotonin reuptake inhibitors 7.2
Surgery 0.5
Bloodtransfusion 0.3
Late palliative care 2.6
Hospital admission 23.2
ED admission 14.1
ICU admission 1.0
ICU admission from nursing home 0.2
160
Discussion
Summary of main findings
Using a validated set of quality indicators to describe the quality
of end-of-life care in people who died with dementia, we found
remarkable percentages for several indicators of appropriate care.
The majority died at home or in a nursing home of residence(68.4
percent), with large variation across health care regions. Specialized
palliative care was not used very often. We also found large
percentages for several indicators of inappropriate care, including
the percentage of people with dementia dying in the hospital (25.0
percent), which is comparable to previous research12. Many people with
dementia receive gastric protectors (26.5 percent), antihypertensives
(43.8 percent), NOACs or vitamin K antagonists (38.5 percent) in the
last month before death, with large variation across health care
regions.
Strengths and limitations
Our study provides an insightful overview of end-of-life care
provision for people who died with dementia. The use of routinely
collected administrative data is a main strength of this study. In
contrast to studies using sample data, the use of administrative data
precludes sampling, nonresponse and recall bias.22,23 Studying end-of
life care in a vulnerable population like people with dementia is
otherwise ethically and methodologically challenging. Additionally,
administrative data are relatively inexpensive,24 as they are routinely
collected by health insurance companies (for example, in the United
States, Japan and Belgium) or by governments (for example, in the
United Kingdom).
A second main strength of this study is the linking and use of socio-
demographic and death certificate databases, which provide background
variables to make a fair comparison between health care regions, taking
into account socio-demographic and economic differences between
regions.
The third main strength of this study is that the results are directly
comparable to those in other countries, such as the US, Canada or the

161
UK. This goes for the quality indicator results, as well as the
relative benchmarks. The methodology we use to measure quality
indicators and to establish relative benchmarks is novel and can also
be replicated in other countries.
A limitation of this study is that the linked administrative data do
not include diagnostic information. We therefore must rely on death
certificate data to select the dementia population. Literature
suggests death certificate data tend to underestimate the prevalence
of dementia.25–27 To identify comorbidities that might influence
treatment, we used death certificate data as a proxy, where diagnostics
data would be more accurate.
Furthermore, the linked administrative databases do not contain data
on non-reimbursed care. As such, palliative care included in regular
nursing home care and generalist palliative care by the family
physician or other carers are not measured in quality indicators
measuring specialist palliative care. They do not contain data on non-
reimbursed medication, except for laxatives, calcium combinations and
several analgesics that are registered, although not reimbursed. This
affects the results for the gastric protectors and calcium with vitamin
D quality indicators. In practice, they are dispensed to a higher
percentage of people with dementia than calculated in these
indicators.
Data on non-reimbursed care and diagnostic information would increase
the robustness of the risk adjustment method and reduce the possibility
that some of the variation between regions is due to unmeasured
confounders at the individual level.
Interpretation
Several indicators of inappropriate end-of-life care are highly
prevalent, especially hospital death, diagnostic testing and ED
admission. Similar results were found in previous research in the US
and the UK.28,29 This suggests a high number of people who died with
dementia underwent an aggressive curative trajectory with one or more
care transitions. This occurs in people who lived in a nursing home
as well as people who lived at home. We also found large variations
across health care regions on these indicators, even when taking into

162
account a number of relevant confounding variables. This indicates
there are opportunities for improvement, at least in several regions.
Especially for these indicators, ambitious and realistic standards
should be established to decrease the number of hospital deaths, ED
admissions and diagnostic tests, and thus increase the quality of end-
of-life care for people dying with dementia.
Specialized palliative care is remarkably rare in people who died with
dementia, taking into account the progressive and terminal nature of
the disease, especially compared to people dying with cancer30. A large
percentage of those who receive it, do so only in the last week before
death (47.7 percent). There are three plausible causes for this: first,
palliative care included in regular nursing home care is not measured
in this indicator, which might occur often in people who died with
dementia.4,31 Secondly, during the dementia disease trajectory,
prognosis of functional decline more than several months ahead is
often difficult.3,9 This makes the decision to initiate palliative care
especially difficult.7,10
Thirdly, health care providers are not always aware that palliative
care is appropriate for people suffering with dementia, or that
dementia is a life-limiting condition.32
We found high percentages of people using antihypertensives, gastric
protectors and NOACs or vitamin K antagonists. These medications
mainly have a prophylactic rather than an aggressive curative
function. They can and should be discontinued when patients near the
end of life, to avoid adverse effects and costs when no benefits are
present.33,34 Our findings are corroborated by recent research on
polypharmacy.35,36 The indicators on antihypertensives, gastric
protectors and NOACs or vitamin K antagonists mark an area where we
have the opportunity and necessity to enhance the quality of end-of-
life care for people with Dementia.
Towards quality improvement
We indicated three main opportunities for quality improvement:
reducing care transitions and aggressive care (e.g. diagnostic
testing, ED admissions, hospital death), earlier initiation of
palliative care and discontinuation of prophylactic medication (e.g.
163
antihypertensives, gastric protectors and NOACs or vitamin K
antagonists) near the end of life. As we controlled for the most
impactful population differences across regions, such as differences
in degree of urbanization, income, age, or education level, variation
across regions is likely to be determined by real differences in health
care practice across regions. The suggested standards for these
indicators, based on the fair comparison between regions, are a
starting point for quality improvement.15 These standards are both
ambitious and attainable, as currently 25% of regions achieve them.
To improve practice, policy makers can use the suggested benchmarks
to further analyze the reasons for the inconsistencies between
regions, and develop and test interventions that can improve practice
within a region.37,38 For instance, the implementation of advance care
planning can support the decision making process when treating people
with dementia.39 This might in turn lead to earlier initiation of
palliative care, fewer care transitions and discontinuation of
ineffective medication near the end of life.
Conclusions and implications
The evidence in this study suggests the occurrence of potentially
inappropriate end-of-life care in people who died with dementia in
Belgium, especially diagnostic testing, hospital and ED admissions,
lack of discontinuation of potentially inappropriate medication and
late initiation of specialized palliative care. We found substantial
risk-adjusted variation between regions for multiple QIs, suggesting
opportunities for quality improvement in dementia end-of-life care. A
first step towards quality improvement could be using evidence-based
relative standards, as developed in this study.
Conflict of interest
The authors have no conflicts of interest to declare. All individuals
who merit authorship are included as authors.

164
References
1. Prince M, Bryce R, Albanese E, Wimo A, Ribeiro W, Ferri CP. The
global prevalence of dementia: a systematic review and metaanalysis.
Alzheimers Dement J Alzheimers Assoc. 2013;9:63–75.e2.
2. Wimo A, Jönsson L, Bond J, Prince M, Winblad B, Alzheimer Disease
International. The worldwide economic impact of dementia 2010.
Alzheimers Dement J Alzheimers Assoc. 2013;9:1–11.e3.
3. Mitchell SL, Teno JM, Kiely DK, Shaffer ML, Jones RN, Prigerson HG, et
al. The clinical course of advanced dementia. N Engl J Med.
2009;361:1529–38.
4. Mitchell SL, Kiely DK, Hamel MB. Dying with advanced dementia in the
nursing home. Arch Intern Med. 2004;164:321–6.
5. Vandervoort A, Van den Block L, van der Steen JT, Volicer L, Vander
Stichele R, Houttekier D, et al. Nursing home residents dying with
dementia in Flanders, Belgium: a nationwide postmortem study on clinical
characteristics and quality of dying. J Am Med Dir Assoc. 2013;14:485–
92.
6. Aminoff BZ, Adunsky A. Dying dementia patients: too much suffering, too
little palliation. Am J Hosp Palliat Care. 2005;22:344–8.
7. Klapwijk MS, Caljouw MA, van Soest-Poortvliet MC, van der Steen JT,
Achterberg WP. Symptoms and treatment when death is expected in dementia
patients in long-term care facilities. BMC Geriatr. 2014;14:99.
8. Murray SA, Kendall M, Boyd K, Sheikh A. Illness trajectories and
palliative care. BMJ. 2005;330:1007–11.
9. Birch D, Draper J. A critical literature review exploring the challenges
of delivering effective palliative care to older people with dementia. J
Clin Nurs. 2008;17:1144–63.
10. De Schreye R, Houttekier D, Deliens L, Cohen J. Developing indicators
of appropriate and inappropriate endof- life care in people with
Alzheimer’s disease, cancer or COPD for population-level administrative
databases: a RAND/UCLA appropriateness study (unpublished). Palliat Med.
2017;

165
11. Lamberg JL, Person CJ, Kiely DK, Mitchell SL. Decisions to
hospitalize nursing home residents dying with advanced dementia. J Am
Geriatr Soc. 2005;53:1396–401.
12. Miranda R, Penders YWH, Smets T, Deliens L, Miccinesi G, Vega Alonso
T, et al. Quality of primary palliative care for older people with mild
and severe dementia: an international mortality follow-back study using
quality indicators. Age Ageing. 2018;47:824–33.
13. Chassin MR, Brook RH, Park RE, Keesey J, Fink A, Kosecoff J, et al.
Variations in the use of medical and surgical services by the Medicare
population. N Engl J Med. 1986;314:285–90.
14. Park RE, Fink A, Brook RH, Chassin MR, Kahn KL, Merrick NJ, et al.
Physician ratings of appropriate indications for six medical and
surgical procedures. Am J Public Health. 1986;76:766–72.
15. Earle CC, Neville BA, Landrum MB, Souza JM, Weeks JC, Block SD, et
al. Evaluating claims-based indicators of the intensity of end-of-life
cancer care. Int J Qual Health Care. 2005;17:505–9.
16. For a Healthy Belgium - For a Healthy Belgium [Internet]. [cited 2019
Oct 25]. Available from: https://www.healthybelgium.be/en/
17. End of life - For a Healthy Belgium [Internet]. [cited 2019 Oct 9].
Available from: https://www.healthybelgium.be/en/health-system-
performance-assessment/specific-domains/end-of-life
18. Maetens A, De Schreye R, Faes K, Houttekier D, Deliens L, Gielen B,
et al. Using linked administrative and disease-specific databases to
study end-of-life care on a population level. BMC Palliat Care.
2016;15:86.
19. The RAND/UCLA Appropriateness Method User’s Manual - MR1269.pdf
[Internet]. [cited 2016 Apr 13]. Available from:
https://www.rand.org/content/dam/rand/pubs/monograph_reports/2011/MR1269
20. 20160830_Tussentijds rapport zorgregio’s.pdf [Internet]. [cited 2017
Oct 27]. Available from: https://www.zorg-en-
gezondheid.be/sites/default/files/atoms/files/20160830_Tussentijds%20rap
port%20zorgregio%27s.pdf

166
21. Spilsbury K, Rosenwax L, Arendts G, Semmens JB. The Association of
Community-Based Palliative Care With Reduced Emergency Department Visits
in the Last Year of Life Varies by Patient Factors. Ann Emerg Med.
2017;69:416–25.
22. Benchimol EI, Manuel DG, To T, Griffiths AM, Rabeneck L, Guttmann A.
Development and use of reporting guidelines for assessing the quality of
validation studies of health administrative data. J Clin Epidemiol.
2011;64:821–9.
23. Validation of diagnostic codes within medical services claims
[Internet]. [cited 2017 Jan 31]. Available from:
http://www.sciencedirect.com/science/article/pii/S0895435603002464
24. Riley GF. Administrative and claims records as sources of health care
cost data. Med Care. 2009;47:S51-55.
25. Garcia-Ptacek S, Kåreholt I, Cermakova P, Rizzuto D, Religa D,
Eriksdotter M. Causes of Death According to Death Certificates in
Individuals with Dementia: A Cohort from the Swedish Dementia Registry.
J Am Geriatr Soc. 2016;64:e137–42.
26. Vandormael S, Meirschaert A, Steyaert J, De Lepeleire J. Insights on
dying, dementia and death certificates. Arch Public Health [Internet].
2018 [cited 2018 Apr 30];76. Available from:
https://www.ncbi.nlm.nih.gov/pmc/articles/PMC5846233/
27. Perera G, Stewart R, Higginson IJ, Sleeman KE. Reporting of
clinically diagnosed dementia on death certificates: retrospective
cohort study. Age Ageing. 2016;45:668–73.
28. Feng Z, Coots LA, Kaganova Y, Wiener JM. Hospital and ED use among
Medicare beneficiaries with dementia varies by setting and proximity to
death. Health Aff Proj Hope. 2014;33:683–90.
29. Sleeman KE, Perera G, Stewart R, Higginson IJ. Predictors of
emergency department attendance by people with dementia in their last
year of life: Retrospective cohort study using linked clinical and
administrative data. Alzheimers Dement. 2018;14:20–7.
30. De Schreye R, Smets T, Annemans L, Deliens L, Gielen B, De Gendt C,
et al. Applying Quality Indicators For Administrative Databases To
Evaluate End-Of-Life Care For Cancer Patients In Belgium. Health Aff
Proj Hope. 2017;36:1234–43.
167
31. Mitchell SL, Kiely DK, Miller SC, Connor SR, Spence C, Teno JM.
Hospice care for patients with dementia. J Pain Symptom Manage.
2007;34:7–16.
32. Chen I-H, Lin K-Y, Hu SH, Chuang Y-H, Long CO, Chang C-C, et al.
Palliative care for advanced dementia: Knowledge and attitudes of long-
term care staff. J Clin Nurs. 2018;27:848–58.
33. Todd A, Husband A, Andrew I, Pearson SA, Lindsey L, Holmes H.
Inappropriate prescribing of preventative medication in patients with
life-limiting illness: a systematic review. BMJ Support Palliat Care
[Internet]. 2016; Available from:
http://www.ncbi.nlm.nih.gov/pubmed/26733578
34. Paque K, De Schreye R, Elseviers M, Vander Stichele R, Pardon K,
Dilles T, et al. Discontinuation of medications at the end of life: A
population study in Belgium, based on linked administrative databases.
Br J Clin Pharmacol. 2019;
35. Wauters M, Elseviers M, Vaes B, Degryse J, Dalleur O, Vander Stichele
R, et al. Polypharmacy in a Belgian cohort of community-dwelling oldest
old (80+). Acta Clin Belg. 2016;71:158–66.
36. Kristensen RU, Nørgaard A, Jensen-Dahm C, Gasse C, Wimberley T,
Waldemar G. Polypharmacy and Potentially Inappropriate Medication in
People with Dementia: A Nationwide Study. J Alzheimers Dis JAD.
2018;63:383–94.
37. Palliative Care Outcomes Collaboration [Internet]. [cited 2018 Jan
18]. Available from: http://www.pcoc.org.au/
38. about IKNL [Internet]. [cited 2018 Jan 18]. Available from:
https://www.iknl.nl/over-iknl/about-iknl
39. Dixon J, Karagiannidou M, Knapp M. The Effectiveness of Advance Care
Planning in Improving End-of-Life Outcomes for People With Dementia and
Their Carers: A Systematic Review and Critical Discussion. J Pain
Symptom Manage. 2018;55:132–150.e1.

168

169
Chapter 7: Trends in appropriateness of end-of-life
care in people dying from cancer, COPD or with
dementia: applying quality indicators on
administrative databases.
Robrecht De Schreye, Luc Deliens, Lieven Annemans, Birgit
Gielen, Tinne Smets, Joachim Cohen
Submitted for publication in Palliative Medicine (2020)

170
Abstract
Background
Recent efforts from governments and practitioners aimed to increase
appropriateness of end-of-life care of patients with advanced illness,
such as cancer, COPD or dementia. An assessment of a possible shift
in appropriateness of end-of-life care across the population is
lacking.
Aim
Measuring quality indicators with routinely collected population-level
data, this study aims to evaluate the appropriateness of end-of-life
care for people with cancer, COPD or dementia between 2010 and 2015
in Belgium.
Design
We conducted a population-level decedent cohort study, using data from
eight population-level databases, including death certificate and
health claims data. We measured validated sets of quality indicators
for appropriateness of end-of-life care.
Setting/participants
We included all people who died from cancer or COPD or with dementia
between 1st January 2010 and 1st January 2016 in Belgium.
Results
We observed three trends common across cancer, COPD and dementia
decedents: an increase in the percentage of people (1) with an
increased contact with a family physician, (2) who received
specialized palliative care (mostly initiated in the last 14 days),
and (3) admitted to an emergency department, all in the last 30 days.
We found additional trends specifically for each disease group.
Conclusion
Although we found an increase of specialized palliative care and
generalist palliative care use, we also found an increase in indicators
of inappropriate care, including emergency department and intensive

171
care unit admissions. To increase the appropriateness of end-of-life
care, palliative care should be initiated earlier and unnecessary care
transitions and medication should be avoided.
172
Background
In people with advanced serious diseases such as cancer, chronic
obstructive pulmonary disease (COPD) or dementia, when death is
imminent in the foreseeable future, the emphasis of care ideally
gradually shifts to comfort care. Continuing disease-modifying
treatment when the benefits no longer outweigh possible negative
impacts in terms of quality of life, comfort or dignity, could be
considered inappropriate end-of-life care.1,2 In contrast, appropriate
care near the end of life, such as the timely initiation of palliative
care, could increase well-being considerably in people suffering from
advanced life-threatening conditions.3–6
In the last decades, measuring the appropriateness of end-of-life care
and changing care practices at the end of life towards more appropriate
end-of-life care has been on the agenda of many researchers and policy
makers.3,5,7–9 In contrast, research shows there has mainly been an
increase in indicators of aggressive treatment near the end of life
in western countries. Earle et al., for instance, found an increase
in chemotherapy use and continuation of chemotherapy closer to death
in Medicare patients with cancer in the US between 1993 and 1996.10
Teno et al. found an increase between 2000 and 2009 in the USA in
intensive care unit (ICU) admission and healthcare transition in the
final 30 days of life, despite an increase in out-of-hospital death
and hospice use.11 Similar research in the US, Canada and Korea shows
an increasing occurrence of multiple emergency department (ED) visits,
ICU admissions and hospital admissions in the last weeks of life.12–
16

173
Recent efforts from governments and practitioners have aimed to
increase the appropriateness of end-of-life care and the quality of
life of patients with advanced illness, for instance by promoting the
timely introduction of palliative care and advance care planning.4,17–
19 While traditionally, these efforts focus on people with cancer,
efforts have also been made to increase access to palliative care and
promote advance care planning for people with dementia and COPD.20,21
Appropriateness of end-of-life care received increasing attention from
policy makers in countries such as the US, Canada, Germany and Belgium,
among others.22–25 When comparing Belgian government advisory
documents of 2009 to those of 2017, the increasing emphasis on
appropriateness of end-of-life care is evident, moving from providing
definitions of palliative care in 200926, to reporting on the
appropriateness of end-of-life care and providing advice to promote
palliative care use in 201725. These efforts in research and policy
might be a reflection of a broader societal evolution towards more
attention for appropriateness of end-of-life care and positive
attitudes towards palliative care. If that is the case, a shift towards
more appropriate end-of-life care could be expected.
However, a comprehensive assessment of the appropriateness of end-of-
life care across the population, measuring a wide range of indicators
of both appropriate and inappropriate end-of-life care is currently
lacking. Using a previously developed quality indicators set based on
administrative data9, this study aims to evaluate the appropriateness
and inappropriateness of end-of-life care for people with cancer, COPD
or dementia between 2010 and 2015 in Belgium. The specific research
questions are:

174
1. Did people dying from cancer or COPD or with dementia in Belgium
receive more appropriate end-of-life care in 2015 than they did in
2010? And If so, what changes can be observed?
2. What indicators of appropriate or inappropriate end-of-life care
present the largest changes in this time period?
Methods
Study design and data sources
We conducted a population-level decedent cohort study of all deceased
from cancer, from COPD or with dementia between 31th December 2009 and
1st January 2016 in Belgium. Data from eight administratively managed
population-level databases was linked27. At the moment of the linking
procedure, data from 2015 were the most recent data fully available
in all linked databases. As healthcare insurance is legally mandatory
in Belgium, the central health care claims databases contain data on
almost the entire Belgian population.28
(1) The health care claims database containing all health care use
data of reimbursed home, nursing home and hospital care, except
medication dispensed in public pharmacies;
(2) The database with socio-demographic data on all people with
healthcare insurance;
(3) The pharmaceutical database containing data on all reimbursed
medication dispensed in public pharmacies;
(4) The Cancer Registry database with data on all incidences of cancer
including the type of cancer and date of diagnosis of each incidence;
175
(5) The national death certificate database containing all registered
causes of death;
(6) The population registry database with data on household
composition;
(7) The census database, containing data from national censuses held
in 2011 and 2001, including housing characteristics and educational
level;
(8) The fiscal database, including the net taxable income of each
Belgian citizen;
After acquiring approval from all relevant data protection agencies,
all databases were linked in a secure and ethically responsible manner,
guaranteeing anonymity of the deceased.27 The database linking
procedure is described in detail in a previous publication.27
Unfortunately, the data are not publicly available and due to privacy
regulations, cannot be shared by the authors.
Population
We included all people who died from cancer or COPD or with dementia
between 31th December 2009 and 1st January 2016 in Belgium. People
dying from cancer (ICD10 codes C00-C99) or COPD (ICD10 codes J41-J44)
were identified using the underlying cause of death on the death
certificate only. People who died with dementia were identified using
the underlying, intermediate, external and associated causes of death
reported on the death certificate (ICD-10 codes F00, F01, F02, F03 or
G30). We used this broader selection because dementia is often
underreported as a primary cause of death and people with advanced
dementia often die from other causes, most commonly pneumonia.29,30 That

176
is why, in contrast to cancer and COPD, we report on people dying
'with' and not necessarily 'from' dementia.
Data
In the Belgian health care system, health care costs for a wide range
of treatments and medication are reimbursed to the patient. Every
reimbursement is registered by health insurers, while a central agency
collects data from all health insurance registries.28 The resulting
central health and pharmacy databases were part of the linking
procedure mentioned in the methods section.27 From these databases, we
used all available data on health care use including treatment,
medication use, dates of treatment and prescription and admission to
hospitals, emergency departments, intensive care units and nursing
homes. We also selected multiple socio-economic, demographic and
clinical variables from other administrative databases that might
influence health care use including age, gender, net taxable income,
dependence on care, highest attained level of education, household
composition and degree of urbanization of the municipality of
residence.
Quality indicators
We used three validated sets of quality indicators for appropriateness
of end-of-life care: one for people dying with dementia (28
indicators), one for people dying from COPD (28 indicators) and one
for people dying from cancer (26 indicators). They were developed and
validated using a RAND/UCLA Appropriateness method.9,31 The expert
panels for this validation consisted of general practitioners,
pharmacologists and palliative care specialists, adding neurologists,

177
nursing home coordinating and advisory physicians and geriatrists for
indicators for people with dementia, oncologists, pneumologists and
radiotherapists for indicators for people with cancer and
pneumologists for indicators for people with COPD.9
The quality indicators in all three sets measure the prevalence of
specific healthcare interventions in a specified period before death
(e.g. 7 days, 14 days, 30 days, 180 days), within the specific
population they were developed for. For the purpose of this trend
study all indicators were measured for the period of 30 days before
death, except when specific indicators were not validated by the expert
panel for that time period, or time before death was irrelevant for
the quality indicator. One indicator measuring tube feeding or
intravenous feeding could not be measured with the available data, as
these are not reimbursed as individual interventions, but as a package
in the hospital context.
Risk adjustment and trend analysis
To obtain a trend analysis portraying real evolutions in
appropriateness of end-of-life care rather than changes in the risk
profile of the population (i.e. attributional validity32), we
controlled for variables that changed across years and might influence
health care use. We used a comprehensive list of possible confounders
and made a selection based on availability in the linked dataset27.
The following risk factors were identified as relevant and measurable
with the current dataset: age, gender, highest attained level of
education, net taxable income, household composition (e.g. married,
single, with or without children, in a nursing home), being officially
recognized as having high care needs, being entitled to a higher degree

178
of reimbursement due to lower degree of self-reliance, and degree of
urbanization of the municipality of residence. These variables were
used to calculate risk adjusted quality indicator scores for each of
the years.
Statistical analyses
We calculated the population characteristics using descriptive
statistics. To perform the risk adjusted trend analysis, we used
stepwise logistic regression model building (with a significance level
of 0.3 for entry and 0.05 to stay in the model), to identify what
variables were associated with each quality indicator (coded binary
as present [1] or absent [0]) across years. Using the results from
this predictive model, we calculated a predicted quality indicator
score for each quality indicator per year. A risk-adjusted score was
then calculated by dividing the average predicted score by the average
observed score for each year, multiplied by the average observed score
across all years. This way, a trend analysis was performed, taking
into account relevant population differences across years.
We also calculated all risk adjusted indicator score differences
between 2010 and 2015. We subtracted the indicator scores in 2015 with
the indicator scores of 2010 and divided this by the score in 2010,
to obtain a relative (percentage) increase. We then inverted all
results of indicators of inappropriateness of care (multiplied by -1)
and joined all indicators for each disease (cancer, COPD, dementia)
in a ranking from most positive to most negative evolutions.
All analyses were conducted with SAS Enterprise Guide, version 7.1.
Programming codes are available from the authors on request.

179
Reporting, ethics and funding
We report our results following the RECORD guidelines for
observational routinely-collected health data.33
The study was approved by the Brussels university hospital committee
for medical ethics (B.U.N. 143201627075).
The administrative data linking process was approved by the national
Data Protection Authority (project SA1/STAT/MA-2015-026-020-MAV) and
by the Statistical Monitoring Committee (project STAT-MA-2015-026).
This study is part of a research study funded by the Research
Foundation Flanders (FWO grant number G012414N) and by the
Wetenschappelijk Fonds Willy Gepts.
Results
Cohort characteristics
A total of 634,445 people who died between 1ste January 2010 and 1st
January 2016 in Belgium were included in the analysis, of which 25.2%
(159,590) died from cancer, 6.0% (37,930) died from COPD and 9.5%
(59,967) with dementia (table 1). The mean age at death across all
years was 74, with 72 in people with cancer, 76 in people with COPD
and 84 in people with dementia. (data not shown)

180
Table 1: Summarized* population description of all people who died
from cancer, with COPD or with dementia in Belgium from 2010 until
2015.
Dying from Cancer
(N = 159,590)
Dying with COPD
(N = 37,930)
Dying with
Dementia (N
=59,967)
2010
(N =
26,768)
2015
(N =
26,493)
2010
(N =
6,878)
2015
(N =
6,185)
2010
(N =
10,017)
2015
(N =
10,629)
Average age 68.2 73.8 72.0 78.2 79.5 86.6
Agecategory <65 24.6 22.9 11.7 11.6 1.3 0.8
65-74 23.6 24.3 19.4 21.2 5.1 3.9
75-84 35.6 34.4 44.5 40.6 41.5 34.3
>84 16.2 18.4 24.4 26.6 52.1 61.1
Sex Female 43.6 44.1 32.7 36.7 65.4 65.8
Householdtype Single 29.3 29.9 31.6 31.3 20.4 18.8
Single parent 5.0 5.3 5.2 4.7 3.8 3.7
Couple with
children 12.1 11.5 7.6 7.1 4.4 3.9
Couple without
children 44.7 44.4 37.2 36.5 27.2 24.9
Collective
(i.e. nursing
home) 7.1 7.2 15.9 18.1 41.9 46.5
Other 1.9 1.7 2.5 2.2 2.4 2.2
Housing
Comfort
High
47.2 51.6 35.8 39.8 34.5 40.0
Average 17.1 14.9 20.6 18.7 27.4 23.4
Low 26.9 26.3 30.5 31.3 25.8 26.5
None
8.8 7.2 13.1 10.2 12.3 10.2
Degree of
urbanization
of residence
Very high
31.5 30.0 32.6 30.9 33.9 30.9
High 28.2 28.8 26.3 27.5 28.6 28.8
Average 26.7 26.2 25.7 24.3 24.9 25.4
Low 13.6 13.9 15.3 16.2 12.6 13.2

181
Region Flanders 58.9 58.3 49.6 48.1 57.9 57.0
Wallonia 33.1 34.0 41.7 44.5 32.3 35.3
Brussels 8.0 7.7 8.7 7.4 9.8 7.7
Cancertype Respiratory 27.8 25.2
Digestive tract 28.9 28.4
Urinary tract 6.4 6.5
Head and neck 3.2 3.4
Melanoma 2.6 3.4
Breast 6.9 7.6
Female genital
organs 5.2 4.9
Male genital
organs 4.9 5.9
Other 13.9 14.7
*A detailed description of all population variables across all years can be found
in the appendix as supplementary tables 8, 9 and 10.
Risk adjusted differences in quality indicators scores between 2010
and 2015 (table 2)
Across the study populations, for all three disease groups, we found
a large increase between 2010 and 2015 in the percentage of people who
had an increased contact with a family physician towards the end of
life, i.e. more contacts with the GP in the final 30 days than in the
period before (+21.7% in cancer, +33.7% in COPD and +89.4% in
dementia). We also found an overall increase in people who received
specialized palliative care, (+5.4% in cancer, +25.6% in COPD, +8.8%
in dementia) with particularly a late initiation of palliative care
(in last 14 days only) increasing, (+4.6% in cancer, +36.9% in COPD,
+17.8% in dementia). Another major trend across all three disease
groups is the increase in percentage of people who are admitted to an

182
emergency department in the last 30 days (+7.0% in cancer, +4.4% in
COPD and +8.2% in people dying with dementia). (table 2, figures 1, 2
and 3)
Table 2: Trends overview, containing all risk adjusted differences
between 2010 and 2015, ranking all indicators* from most positive to
most negative evolution in relative percentage increase.†
Cancer
indicators
Improvement
score†
COPD
indicators
Improvement
score†
Dementia
indicators
Improvement
score†
Relative
increase
in
indicator
score
between
2010 and
2015
Absolute
increase
in
indicator
score
between
2010 and
2015
Relative
increase
in
indicator
score
between
2010 and
2015
Absolute
increase
in
indicator
score
between
2010 and
2015
Relative
increase
in
indicator
score
between
2010 and
2015
Absolute
increase
in
indicator
score
between
2010 and
2015
Increased
number of
contact with
family
physician
+21.7% +9.8
Increased
number of
contact with
family
physician
+33.7% +13.7
Increased
number of
contact with
family
physician
+89.4% +32.5
Multidiscipl
inary
oncology
consult
+14.7% +1.8
Specialist
palliative
care
+25.6% +2.6
Blood
transfusion
(last 14
days before
death)
-26.2% -0.1
ICU
admissions
from a
nursing home
-9.3% -0.2
Official
palliative
care status
+23.7% +1.9
Opioids and
neuropathic
medication
+24.5% +0.4
Chemotherapy -5.8 -1.0
Start taking
an
antidepressa
nt
-20.4% -1.1
ICU
admissions
from nursing
home
-19.1% -0.2
Specialist
palliative
care
+5.4% +2.5
Continuous
endotracheal
intubation
-20.2% -1.4 ICU
admissions -17.1% -0.5
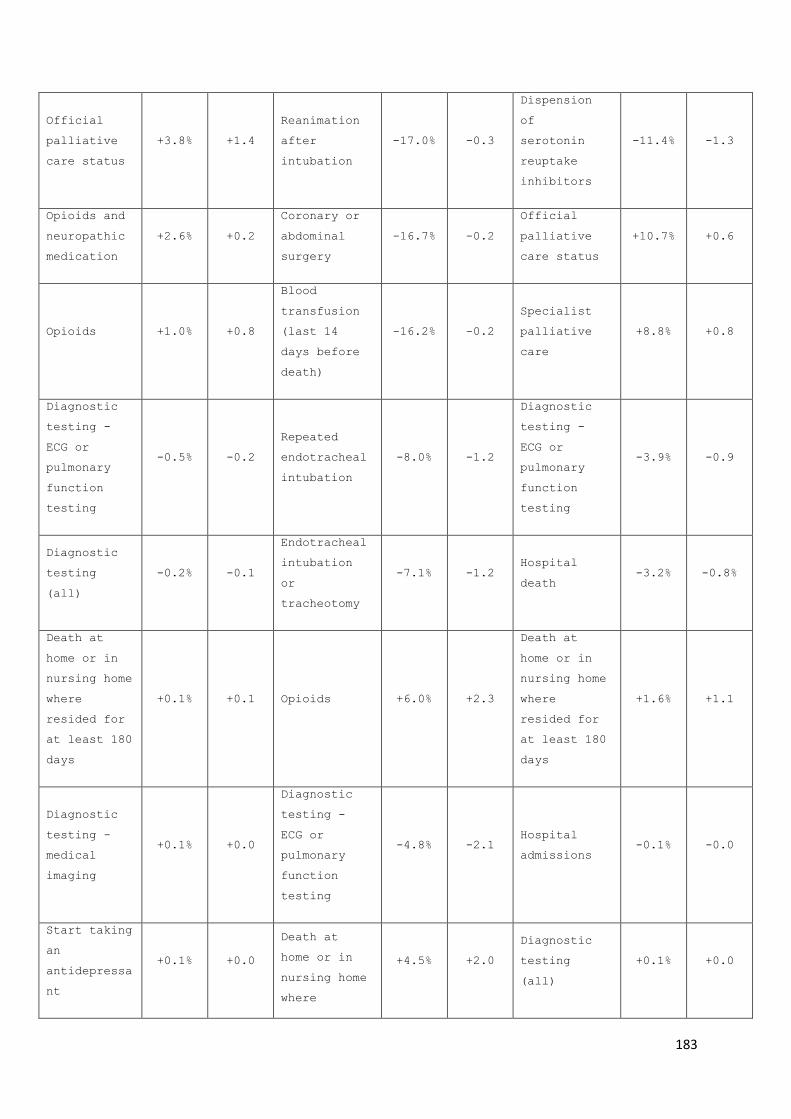
183
Official
palliative
care status
+3.8% +1.4
Reanimation
after
intubation
-17.0% -0.3
Dispension
of
serotonin
reuptake
inhibitors
-11.4% -1.3
Opioids and
neuropathic
medication
+2.6% +0.2
Coronary or
abdominal
surgery
-16.7% -0.2
Official
palliative
care status
+10.7% +0.6
Opioids +1.0% +0.8
Blood
transfusion
(last 14
days before
death)
-16.2% -0.2
Specialist
palliative
care
+8.8% +0.8
Diagnostic
testing -
ECG or
pulmonary
function
testing
-0.5% -0.2
Repeated
endotracheal
intubation
-8.0% -1.2
Diagnostic
testing -
ECG or
pulmonary
function
testing
-3.9% -0.9
Diagnostic
testing
(all)
-0.2% -0.1
Endotracheal
intubation
or
tracheotomy
-7.1% -1.2 Hospital
death -3.2% -0.8%
Death at
home or in
nursing home
where
resided for
at least 180
days
+0.1% +0.1 Opioids +6.0% +2.3
Death at
home or in
nursing home
where
resided for
at least 180
days
+1.6% +1.1
Diagnostic
testing -
medical
imaging
+0.1% +0.0
Diagnostic
testing -
ECG or
pulmonary
function
testing
-4.8% -2.1 Hospital
admissions -0.1% -0.0
Start taking
an
antidepressa
nt
+0.1% +0.0
Death at
home or in
nursing home
where
+4.5% +2.0
Diagnostic
testing
(all)
+0.1% +0.0

184
resided for
at least 180
days
Blood
transfusion
(last 14
days before
death)
+0.7% +0.0 Hospital
death -3.9% -2.1
Diagnostic
testing -
medical
imaging
+0.7% +0.2
Hospital
admissions +0.8% +0.5
ICU
admissions
from nursing
home
-1.7% -0.0
Dispension
of anti-
hypertensive
s
+4.5% +1.9
Surgery +1.0% +0.0 Death at
home +1.0% +0.3
ED
admissions +8.2% +1.9
Death at
home -1.9% -0.6
Diagnostic
testing
(all)
-0.3% +0.2
Dispension
of NOAC's or
vitamin K
antagonists
+9.0% +3.2
Feeding tube
or
intravenous
feeding
+3.7% +0.1 Inhalation
therapy -0.2% -0.2
Dispension
of
prophylactic
gout
medication
+13.4% +0.2
Late
initiation
of
palliative
care
+4.6% +1.6
Diagnostic
testing -
medical
imaging
+0.1% +0.0 Dispension
of statins +14.5% +0.8
ED
admissions +7.0% +2.3
Hospital
admissions +1.7% +1.0
Death at
home -16.1% -2.0
Late
initiation
of
physiotherap
y
+3.1% +0.2
Late
initiation
of
palliative
care
+17.8% +0.7
Surgery +8.3% +0.1 Chemotherapy +23.5% +0.1

185
*Only indicators measured as a percentage are included in this table, to
enable comparability.
†For the ranking order, all results of indicators of inappropriateness of
care were inverted (multiplied by -1), so a higher ranking means a decrease
of these indicators
For those who died from cancer, we additionally found an increasing
percentage receiving a multidisciplinary oncology consult from 12.3%
to 14.1% and a decrease of those receiving chemotherapy in the last
30 days of life from 17.5% to 16.5%. (table 2, figure 1)
ED
admissions +10.9% +4.4
Dispension
of gastric
protectors
+23.7% +5.0
ICU
admissions +12.3% +1.6 Surgery +32.5% +0.2
Late
initiation
of
palliative
care
+36.9% +1.3
Dispension
of calcium
vitamin D
+36.0% +2.3

186
Figure 1: Trends in indicators of appropriate or inappropriate care
in the last 30 days of life for people dying from cancer, thematically
grouped.
For COPD, we found an increase in the percentage of people receiving
the official palliative care status (+23.7%) and the percentage of
people who received opioids (+6.0%). We also found a decrease in the
percentage of people receiving endotracheal intubation or tracheotomy
(-7.12%), continuous (-20.18%) and repeated endotracheal intubation
(-7.95%). However, the percentage of people admitted to the ICU
increased (+12.29%). (table 2, figure 2)

187
Figure 2: Trends in indicators of appropriate or inappropriate care
in the last 30 days of life for people for people dying from COPD,
thematically grouped.
In people who died with dementia, in addition to the changes described
above, we found an increase in the percentage of people with dispension
of NOAC's or vitamin K antagonists (+8.98%), gastric protectors
(+23.67%), and calcium and vitamin D (+36.04%). The percentage
receiving serotonin reuptake inhibitors decreased (11.44%). (table 2,
figure 3)

188
Figure 3: Trends in indicators of appropriate or inappropriate care
in the last 30 days of life for people for people dying with dementia,
thematically grouped.

189
Discussion
Main findings
Using full-population data we observed three trends in the
appropriateness of end-of-life care that were common across cancer,
COPD and dementia decedents: (1) a large increase in the percentage
of people who had an increased contact with a family physician in the
last 30 days, (2) an increase in the proportion who received
specialized palliative care (mostly an increased late initiation of
palliative care, i.e. in the last 14 days), and (3) a large increase
in the percentage of people admitted to an emergency department in the
last 30 days. Additionally, we found several trends specifically for
people dying from cancer, from COPD or with dementia.
Strengths and limitations
A first strength of this study is that the use of routinely collected
administrative data allows us to study diverse and hard-to-reach
populations, such as cognitively impaired and vulnerable participants,
without discrimination. Other research suffers from issues adapting
data collection methods for these populations (e.g. translating or
adapting questionnaires) or selection bias, where our data collection
method includes (almost) the entire Belgian population.33–35 Including
people with COPD and dementia is a second strength of this study, as
end-of-life care research has traditionally mainly focused on people
with cancer.36,37 Linking administrative databases including socio-
demographic and death certificate databases also provides information
on possible confounding variables, so we can observe trends in health
care provision, unaffected by possible demographic and diagnostic
evolutions.

190
A first limitation of this study is that we rely on death certificate
data to select the COPD and dementia population. Literature suggests
death certificate data tend to underestimate the prevalence of
dementia.38,39 A second limitation is that the selected routinely
collected databases do not contain data on non-reimbursed care. Some
important aspects of care, such as patient-carer communication,
patients’ preferences, or health care that is not specifically
reimbursed, such as palliative care included in regular nursing home
care, cannot be measured. This implies that important aspects of
appropriateness of end-of-life care are not measured in this study,
but also that there might be residual confounding in comparing quality
indicator scores across years. However, we assume to have captured the
most impactful population-level changes between years with available
routinely collected data.
Interpretation
We found an overall increase in the percentage of people receiving
specialized palliative care, with the largest growth for people dying
from COPD. This increase, however, seems mostly due to specialized
palliative care initiated in the last two weeks of life. A remaining
challenge would, therefore, be to match increased access to palliative
care service with their increased timely initiation. The percentage
of people with increasing contacts with a general practitioner (GP)
near the end of life has also risen. This might entail that so-called
generalist palliative care, in which the GP usually plays a large
role40, is also increasing.

191
Despite the increase in palliative care, we found an increase in
several indicators of possible inappropriate end-of-life care, most
notably emergency department (ED) visits rising in all disease groups
and ICU admissions in people dying from COPD or with dementia. These
seemingly contradictory findings are in line with the results of Teno
et al.15, who found an increased use over time in the USA of hospice
and hospital-based palliative care near the end of life, but at the
same time a reduced average length of stay in the hospice, alongside
an increase in ICU admissions and multiple hospital visits near the
end of life. With Teno et al. we can argue that increased use of
palliative care does not reduce resource use in general. It may even
be that palliative care is sometimes combined with aggressive
treatment rather than replacing it.15
For people dying with dementia, we found an alarming trend in
medication provision: only the percentage of people receiving
serotonine reuptake inhibitors in the last month of life is decreasing,
while rates for all other indicators on possibly inappropriate
medication are rising. It has been argued that polypharmacy and the
continued intake of long-term preventive medication has adverse
effects on the health and quality of life of frail older adults,
including those with dementia.8,41 People with dementia near the end of
life in Belgium often live in a nursing home. Studies report a number
of barriers to discontinuing medication in this context, including
perceived opposition of the patient’s family or the patient
him/herself.42,43 It has been argued that the initiation of some of the
medications mentioned might benefit patients in a palliative care
context, to treat symptoms.43 This, coupled with a lack of
discontinuation, would lead to a rise in medication use. However, the
192
use of standardized medication reviews with tools such as the
STOPPFrail41 criteria, which have been circulated from 2015 onwards,
could facilitate the discontinuation of inappropriate medication
prescription in people with dementia.
Implications
Overall, our findings suggest there is an increase in several
indicators of appropriate end-of-life care, but little reduction in
indicators of inappropriateness of end-of-life care. The increased use
of specialized palliative care does not come with a reduction in
inappropriate end-of-life care.
We suggest that, to increase appropriateness of end-of-life care, an
effort should be made to reduce the number of ED and ICU admissions
of people with serious and chronic illness near the end of life.
Palliative care should be initiated earlier and, especially for people
with dementia, medication policies should focus on deprescribing and
discontinuation of inappropriate medication. Systematic monitoring of
quality indicator scores and reestablishing relative standards, could
help define goals for future improvement of the quality of end-of-life
care.

193
Conclusion
We present a trend analysis of a large set of validated indicators of
appropriate and inappropriate end-of-life care in people dying from
cancer, from COPD or with dementia. Although we found indications of
an increase of both specialized palliative care use and generalist
palliative care use, we also found an increase in several indicators
of inappropriate care in the last month of life, including ED and ICU
admissions. To increase the appropriateness of end-of-life care,
palliative care should be initiated earlier, unnecessary care
transitions should be avoided and unnecessary medication should be
discontinued.

194
References
1. Chassin MR, Brook RH, Park RE, Keesey J, Fink A, Kosecoff J, et al.
Variations in the use of medical and surgical services by the Medicare
population. N Engl J Med. 1986;314:285–90.
2. Earle CC, Landrum MB, Souza JM, Neville BA, Weeks JC, Ayanian JZ.
Aggressiveness of cancer care near the end of life: is it a quality-of-
care issue? J Clin Oncol. 2008;26:3860–6.
3. Lorenz KA, Lynn J, Dy SM, Shugarman LR, Wilkinson A, Mularski RA, et al.
Evidence for improving palliative care at the end of life: a systematic
review. Ann Intern Med. 2008;148:147–59.
4. Vanbutsele G, Pardon K, Belle SV, Surmont V, Laat MD, Colman R, et al.
Effect of early and systematic integration of palliative care in
patients with advanced cancer: a randomised controlled trial. Lancet
Oncol. 2018;19:394–404.
5. van der Steen JT, Radbruch L, Hertogh CM, de Boer ME, Hughes JC, Larkin
P, et al. White paper defining optimal palliative care in older people
with dementia: a Delphi study and recommendations from the European
Association for Palliative Care. Palliat Med. 2014;28:197–209.
6. Halpin DMG. Palliative care for people with COPD: effective but
underused. Eur Respir J. 2018;51:1702645.
7. Approaching death: improving care at the end of life--a report of the
Institute of Medicine. Health Serv Res. 1998;33:1–3.
8. Todd A, Husband A, Andrew I, Pearson SA, Lindsey L, Holmes H.
Inappropriate prescribing of preventative medication in patients with
life-limiting illness: a systematic review. BMJ Support Palliat Care
[Internet]. 2016; Available from:
http://www.ncbi.nlm.nih.gov/pubmed/26733578
9. De Schreye R, Houttekier D, Deliens L, Cohen J. Developing indicators of
appropriate and inappropriate endof- life care in people with
Alzheimer’s disease, cancer or COPD for population-level administrative
databases: a RAND/UCLA appropriateness study (unpublished). Palliat Med.
2017;
10. Earle CC, Neville BA, Landrum MB, Ayanian JZ, Block SD, Weeks JC.
Trends in the aggressiveness of cancer care near the end of life. J Clin
Oncol. 2004;22:315–21.
11. Teno JM, Gozalo PL, Bynum JPW, Leland NE, Miller SC, Morden NE, et
al. Change in End-of-Life Care for Medicare Beneficiaries. JAMA J Am Med
Assoc. 2013;309:470–7.
12. Ho TH, Barbera L, Saskin R, Lu H, Neville BA, Earle CC. Trends in the
aggressiveness of end-of-life cancer care in the universal health care
system of Ontario, Canada. J Clin Oncol. 2011;29:1587–91.
13. Wang SY, Hall J, Pollack CE, Adelson K, Bradley EH, Long JB, et al.
Trends in end-of-life cancer care in the Medicare program. J Geriatr
Oncol [Internet]. 2016; Available from:
http://www.ncbi.nlm.nih.gov/pubmed/26783015

195
14. Pataky RE. Population-based trends in systemic therapy use and cost
for cancer patients in the last year of life. 2016; Available from:
http://www.ncbi.nlm.nih.gov/pmc/articles/PMC4780587/
15. Teno JM, Gozalo PL, Bynum JPW, Leland NE, Miller SC, Morden NE, et
al. Change in End-of-Life Care for Medicare Beneficiaries: Site of
Death, Place of Care, and Health Care Transitions in 2000, 2005, and
2009. JAMA. 2013;309:470–7.
16. Choi Y, Keam B, Kim TM, Lee S-H, Kim D-W, Heo DS. Cancer Treatment
near the End-of-Life Becomes More Aggressive: Changes in Trend during 10
Years at a Single Institute. Cancer Res Treat Off J Korean Cancer Assoc.
2015;47:555–63.
17. Bakitas M, Lyons KD, Hegel MT, Balan S, Brokaw FC, Seville J, et al.
Effects of a palliative care intervention on clinical outcomes in
patients with advanced cancer: the Project ENABLE II randomized
controlled trial. JAMA. 2009;302:741–9.
18. Qaseem A, Snow V, Shekelle P, Casey DE, Cross JT, Owens DK, et al.
Evidence-based interventions to improve the palliative care of pain,
dyspnea, and depression at the end of life: a clinical practice
guideline from the American College of Physicians. Ann Intern Med.
2008;148:141–6.
19. Abedini NC, Hechtman RK, Singh AD, Khateeb R, Mann J, Townsend W, et
al. Interventions to reduce aggressive care at end of life among
patients with cancer: a systematic review. Lancet Oncol. 2019;20:e627–
36.
20. PACE | PACE - Palliative Care for Older People in care and nursing
homes in Europe [Internet]. [cited 2019 Nov 6]. Available from:
http://www.eupace.eu/
21. Scheerens C, Pype P, Cauwenberg JV, Vanbutsele G, Eecloo K, Derom E,
et al. Early-Integrated Palliative home care and standard care for end-
stage COPD (EPIC): A Phase II pilot RCT testing feasibility,
acceptability and effectiveness. J Pain Symptom Manage [Internet]. 2019
[cited 2019 Nov 6];0. Available from:
https://www.jpsmjournal.com/article/S0885-3924(19)30532-9/abstract
22. Kaufmann TL, Kamal AH. Oncology and Palliative Care Integration:
Cocreating Quality and Value in the Era of Health Care Reform. J Oncol
Pract. 2017;13:580–8.
23. Canada H. Palliative care [Internet]. aem. 2016 [cited 2019 Nov 6].
Available from: https://www.canada.ca/en/health-
canada/services/palliative-care.html#s5
24. pallcare. Germany has developed National Guideline on Palliative Care
for Patients with Incurable Cancer [Internet]. EAPC Blog. 2017 [cited
2019 Nov 6]. Available from:
https://eapcnet.wordpress.com/2017/02/01/germany-has-developed-national-
guideline-on-palliative-care-for-patients-with-incurable-cancer/
25. Appropriate care at the end of life [Internet]. [cited 2019 Oct 9].
Available from: /en/appropriate-care-at-the-end-of-life
26. Organisation of palliative care in Belgium [Internet]. [cited 2019
Dec 11]. Available from: /en/organisation-of-palliative-care-in-belgium

196
27. Maetens A, De Schreye R, Faes K, Houttekier D, Deliens L, Gielen B,
et al. Using linked administrative and disease-specific databases to
study end-of-life care on a population level. BMC Palliat Care.
2016;15:86.
28. IMA-AIM [Internet]. [cited 2016 Apr 13]. Available from:
http://www.aim-ima.be/
29. Das C. Death certificates in Germany, England, The Netherlands,
Belgium and the USA. Eur J Health Law. 2005;12:193–211.
30. Cause of death in patients with dementia disorders. - PubMed - NCBI
[Internet]. [cited 2020 Feb 6]. Available from:
https://www.ncbi.nlm.nih.gov/pubmed/19170740
31. The RAND/UCLA Appropriateness Method User’s Manual - MR1269.pdf
[Internet]. [cited 2016 Apr 13]. Available from:
https://www.rand.org/content/dam/rand/pubs/monograph_reports/2011/MR1269
32. Silva LK. Validity of the risk adjustment approach to compare
outcomes. Cad Saúde Pública. 2003;19:287–95.
33. Benchimol EI, Smeeth L, Guttmann A, Harron K, Moher D, Petersen I, et
al. The REporting of studies Conducted using Observational Routinely-
collected health Data (RECORD) Statement. PLoS Med. 2015;12:e1001885.
34. Benchimol EI, Manuel DG, To T, Griffiths AM, Rabeneck L, Guttmann A.
Development and use of reporting guidelines for assessing the quality of
validation studies of health administrative data. J Clin Epidemiol.
2011;64:821–9.
35. Validation of diagnostic codes within medical services claims
[Internet]. [cited 2017 Jan 31]. Available from:
http://www.sciencedirect.com/science/article/pii/S0895435603002464
36. Rosenwax L, Spilsbury K, McNamara BA, Semmens JB. A retrospective
population based cohort study of access to specialist palliative care in
the last year of life: who is still missing out a decade on? BMC Palliat
Care. 2016;15:46.
37. Boland J, Johnson MJ. End-of-life care for non-cancer patients. BMJ
Support Palliat Care. 2013;3:2–3.
38. Causes of Death According to Death Certificates in Individuals with
Dementia: A Cohort from the Swedish Dementia Registry. - PubMed - NCBI
[Internet]. [cited 2020 Mar 14]. Available from:
https://www.ncbi.nlm.nih.gov/pubmed/?term=Garcia-
Ptacek+S%2C+K%C3%A5reholt+I%2C+Cermakova+P%2C+Rizzuto+D%2C+Religa+D%2C+E
riksdotter+M.+Causes+of+Death+According+to+Death+Certificates+in+Individ
uals+with+Dementia
39. Insights on dying, dementia and death certificates. - PubMed - NCBI
[Internet]. [cited 2020 Mar 14]. Available from:
https://www.ncbi.nlm.nih.gov/pubmed/?term=insights+on+dying%2C+dementia+
and+death+certificates
40. Ramanayake RPJC, Dilanka GVA, Premasiri LWSS. Palliative care; role
of family physicians. J Fam Med Prim Care. 2016;5:234–7.

197
41. Lavan AH, Gallagher P, Parsons C, O’Mahony D. STOPPFrail (Screening
Tool of Older Persons Prescriptions in Frail adults with limited life
expectancy): consensus validation. Age Ageing. 2017;46:600–7.
42. Paque K, Vander Stichele R, Elseviers M, Pardon K, Dilles T, Deliens
L, et al. Barriers and enablers to deprescribing in people with a life-
limiting disease: A systematic review. Palliat Med. 2019;33:37–48.
43. Paque K, De Schreye R, Elseviers M, Vander Stichele R, Pardon K,
Dilles T, et al. Discontinuation of medications at the end of life: A
population study in Belgium, based on linked administrative databases.
Br J Clin Pharmacol. 2019;85:827–37.
44. (15) (PDF) EAPC Atlas of Palliative Care in Europe 2019 [Internet].
ResearchGate. [cited 2020 Jan 6]. Available from:
https://www.researchgate.net/publication/333390123_EAPC_Atlas_of_Palliat
ive_Care_in_Europe_2019

198

199
PART III: General Discussion

200

201
Chapter 8: Main findings and
discussion

202
As the final part of this dissertation, part three discusses the
meaning of our findings. We summarize the main results, we discuss the
main strengths and limitations of our research and the consequences
of our findings, and we conclude with implications for practice,
research and policy.
1. Quality indicator development
We developed three sets of quality indicators (QI's) for
appropriateness and inappropriateness of end-of-life care: one set for
people with cancer (26 indicators), one for people with COPD (28
indicators) and one for people with dementia (28 indicators). All
indicators were validated in consensus by multidisciplinary expert
panels. 14 indicators were valid for all three disease groups. All
developed indicators are measurable with available health care data,
routinely collected by Belgian health insurance organizations. The
developed indicator sets enable us to evaluate the appropriateness of
end-of-life care in the Belgian health care system and to compare
countries, regions and health care providers in terms of
appropriateness of end-of-life care.
We substantially expanded on the existing literature with new
indicators for people with cancer to be measured with administrative
data, such as diagnostic testing, tube feeding and the use of
specialist palliative care, while corroborating several existing
quality indicators (QI's) measured previously in the United States and
Canada.1–4 Our development of quality indicator sets for COPD and

203
Alzheimer dementia is a novel contribution in quality indicators for
end-of-life care measurable with administrative data. In accordance
with efforts of policy makers and researchers from international
organizations5,6 to extend palliative care and end-of-life care to non-
cancer populations in need of appropriate end-of-life care, these
indicators may facilitate monitoring and improving end-of-life care
for people dying with COPD and Alzheimer dementia.
2. Using linked administrative databases to study end-of-life
care
We identified several available administrative databases containing
routinely collected data useful for end-of-life care research,
including for quality indicator measurement: health care claims data
from the InterMutualistic Agency (IMA)7, cancer incidence data from
the Belgian Cancer Registry (BCR)8 and death certificate and socio-
economic data from Statistics Belgium (StatBel)9. We obtained approval
to link and use the selected data from two national privacy committees.
Two trusted third parties linked the data on an individual patient
level.10,11 The linking process was not done before in Belgium. Our
study proves it is feasible and expands the possible research use of
the data. This suggests this methodology might be replicated in future
health care research to study health care use on a population level.

204
3. Appropriateness of end-of-life care
3.1 Dying from cancer
We measured all indicators developed for people dying from cancer in
the population of 26,464 people who died from cancer in 2012 in
Belgium. To investigate possible associations between the quality
indicators and various socio-demographic and economic variables, we
reduced the large set of quality indicators to a small selection of
thematically linked principal components. We first selected quality
indicators that we deemed theoretically consistent health care
practices, (for example: tube feeding, surgery, hospital admission and
diagnostic testing, representing a possible dimension of aggressive
hospital care), then performed principal component analysis to
determine their common variance and backwards selected indicators
based on their score on the component. This reduced the set of 26
indicators to four components "curative cancer treatments",
"potentially inappropriate hospital transitions and hospital care",
"potentially appropriate comfort and palliative care" and "potentially
appropriate pain and symptom treatment". We then investigated
associations between various socio-demographic and economic variables
with the resulting components.
Compared with international literature3,4, we found relatively low
percentages of people dying at home (29.5%) or receiving specialist
palliative care (47.1%). Our results also suggest an overuse of
chemotherapy near the end of life (17.2% in the last 30 days). As for
associations between appropriateness of care and population
characteristics, we found people younger than 65 and younger than 84
dying from cancer receiving more curative cancer treatment and more
205
potentially inappropriate hospital transitions and hospital care, as
well as more potentially appropriate pain and symptom treatment.
People dying from cancer in Wallonia and Brussels received more
possibly inappropriate transitions to hospital and hospital care and
less possibly appropriate comfort and palliative care.
3.2 Dying from COPD
We measured all indicators developed for people dying from COPD with
the 4,231 people who died from COPD in 2015 in Belgium. We additionally
examined variation between 14 health care regions, covering Flanders
and Brussels, using a selection of socio-economic and demographic
variables to establish a fair comparison between regions. Based on
this variation, we suggested the best scoring 25% of regions as
performance standards for each indicator.
We found that of those dying from COPD in 2015 in Belgium, 60.0% was
admitted to hospital at least once during the last 30 days of life and
11.8% received specialized palliative care at least once during the
last 2 years of life. Controlling for differences in relevant socio-
economic and demographic variables available in our linked
administrative database, we found large risk-adjusted regional
variation in provision of specialized palliative care (4.0% to 32.0%)
and in being submitted to diagnostic testing at least once within the
last 30 days of life (44.0% to 69.7%). This suggests there is room for
improvement to increase the use of specialized palliative care and
reduce the use of diagnostic testing (among others) in people with
COPD in Flanders and Brussels. As an example, we suggest the relative

206
standard for diagnostic testing at this moment to be at maximum 54.9
percent for all health care regions in Flanders and Brussels. We also
suggest at least 23.3 percent of all people dying from COPD receive
specialist palliative care. These standards are currently achieved by
25% of health care regions and can therefore be regarded as realistic
and attainable performance standards. As practice evolves and
indicators are remeasured, the suggested standards can evolve
accordingly.
3.3 Dying with dementia
We measured all indicators developed for people with dementia in all
10,629 people who died with dementia in Belgium in 2015. On average,
they had 1.83 contacts with a family physician in the last week before
death and 68.4 percent died at home or in the nursing home where they
lived for at least 6 months.
Relatively high percentages of people with dementia underwent
diagnostic testing (36.3 percent) or emergency department (ED)
admissions (25.6 percent) in the last 30 days before they died. 32.4
percent were admitted to hospital at least once in the last 30 days
of their life and 25.1 percent died in the hospital. As with the
indicators for people with COPD, we compared risk adjusted regional
differences between 14 health regions in Flanders and Brussels and
found substantial variation: emergency department visits varied
between 19 and 31 percent, dispensing of gastric protectors between
18 and 42 percent, and anti-hypertensives between 40 and 53 percent
across health care regions. This led us to suggest there are major
opportunities to increase the appropriateness of end-of-life care in
people with dementia, especially by reducing possibly harmful or

207
unnecessary medication use and hospital transitions. For example, we
suggest the percentage of people to receive anti-hypertensives to be
reduced to be below 46 percent of all people with dementia.
4. Trends
We also measured trends in all developed indicators for appropriate
or inappropriate end-of-life care, across all three populations
(people dying from cancer, from COPD or with dementia) from 2010 until
2015. We measured all indicators at 30 days before death, unless they
were only validated for the last 14 days or when timing was irrelevant.
Although six years is a relatively short period to study trends, we
found more fluctuation in indicator scores than expected.
We first compared the difference in all indicators between 2015 and
2010. Four trends occur across all three pathology groups indicating
both trends towards more appropriateness and more inappropriateness:
1) a major increase in the percentage of people who had an increased
contact with a family physician closer towards the end of life, (+32.51
percent in people with dementia), 2) an increase in people who received
specialist palliative care, coupled with 3) a larger proportion of
palliative care initiated only in the last 14 days, and 4) an increase
in the percentage of people who were admitted to an emergency
department in the last 30 days before they died. Several other
important indicators of inappropriate end-of-life care, such as
diagnostic testing, surgery, hospital admission, and hospital death
remained largely unchanged between 2010 and 2015.
208
In addition, for people with cancer specifically, the percentage of
people who in the last 30 days of life had a multidisciplinary oncology
consult (+1.80 percent) and people who received specialist palliative
care (+2.47 percent) increased, while the percentage receiving
chemotherapy decreased (-1.02 percent). Some indicators, especially
those within the hospital setting, suggest appropriateness of end-of-
life care is increasing, however possibly inappropriate care
transitions increased as well.
For people who died from COPD, in addition to the general trends, the
percentage of people receiving continuous (-1.36) or repeated
intubation (-1.23 percent) decreased. More people received opioids
(+2.31 percent), but at the same time a higher percentage of people
with COPD was admitted to the intensive care unit (+1.60 percent).
This suggests that, as in people dying from cancer, appropriateness
of end-of-life COPD care within hospital settings is increasing, but
possibly avoidable transitions towards hospitals are also becoming
more prevalent.
Lastly, in people with dementia specifically, a higher percentage
received possibly inappropriate medication in 2015 than in 2010, such
as Novel Oral Anticoagulants or vitamin-K antagonists, (+3.16
percent), gastric protectors (+5.01 percent) or calcium with vitamin
D (+2.27 percent).

209
5. Methodological strengths and limitations
5.1 Strengths
5.1.1 Using the RAND/UCLA appropriateness method12 to develop new
indicators
To develop the three sets of quality indicators, we supplemented
existing indicators from literature with interviews with relevant
experts and validated these using a RAND/UCLA appropriateness
method of expert consultation. This increases the scope of the
quality indicators developed beyond what is currently known in the
literature. End-of-life care research and palliative care have mainly
been focused on people with cancer so far.13–15 This leaves scientific
research and knowledge on care for other populations, such as people
with COPD or dementia, underdeveloped. However in practice,
pulmonologists, geriatricians, neurologists, palliative care
specialists, family physicians and nurses in all settings, including
nursing homes, provide end-of-life care for these patients groups on
a daily basis and thus have practical knowledge. The interviews and
expert panels with experts from all of the above disciplines, including
doctors and nurses, served to include this practical knowledge. It is
a strength of our study that we tapped into this potential, to fill a
gap in the current state of end-of-life care literature.
5.1.2 Routinely collected data to study vulnerable populations
Linking a selection of administrative databases resulted in a
population-level database with detailed data on end-of-life health

210
care use, as well as necessary demographic, socio-economic and
diagnostic information.16 Using routinely collected data is a non-
invasive method of data collection. We obtained detailed health care
information, without overburdening patients, which is especially
relevant near the end of life.17–19
Using routinely collected data also means we have a dataset covering
(almost) the full Belgian population of decedents in specific years.
Our dataset therefore also includes populations that may be difficult
to reach with other methods, such as people with cognitive impairment
(e.g. people with dementia) or people with a socio-economic and ethnic
background different than the researchers.20–22 Other research might
often suffer from issues adapting data collection methods for these
populations (e.g. translations and cognitive testing of
questionnaires) or selection bias, where our data collection method
includes the Belgian population without discrimination.
5.2 Limitations
5.2.1 Developing indicators with input from current practice
One of the main goals of developing and measuring quality indicators
is that they may reveal discrepancies between health care practice on
a population level and government policy goals.23 They can also uncover
possible inequities in provision of appropriate end-of-life care and
pinpoint underlying factors explaining unwanted differences between
subpopulations.24 However, in our research, the quality indicator
development process relies heavily on the input of experts in
interviews, because literature search yields limited quality indicator

211
results. Evidence on possibly unfavorable effects on patients quality
of life in an end-of-life care context is missing for most treatments.
Expert knowledge is regarded as the lowest level of evidence.25 We
performed no validation of the quality indicator sets outside the
health system, for example by including patients receiving end-of-life
care or their families in the expert panels. One could argue that the
experts can be biased towards a positive evaluation of current end-
of-life care practice. It would not be unthinkable that experts, when
asked to identify indicators for appropriate care, might stay close
to their current standard practice. Their expertise might hinder them
in identifying what could be more appropriate than what is currently
occurring. We partly mitigated this by including experts from a wide
range of specialties, with different perspectives on current practice,
from oncologists and pulmonologists to family physicians and
palliative care specialists.12
We argue that identifying current best and worst practices as
indicators of appropriateness end-of-life care is the best place to
start to move towards more appropriate end-of-life care. As such, it
is essential that the quality indicator sets developed in this research
project are regularly updated to reflect the current state of
appropriateness of end-of-life care.
One could also comment that patient and relative perspectives on
appropriateness of care should be included in the indicator
development process. We opted not to include them for one main reason:
developing indicators to be measured on a population level requires a
broad perspective on appropriateness of end-of-life care. The
indicators do not take patient preferences into account. Treatment
212
measured in a population-level indicator of inappropriate end-of-life
care might be appropriate end-of-life care in a specific patient's
situation and corresponding to patient preferences. Identifying and
evaluating population-level indicators requires making abstraction of
the individual patient's situation and knowledge of current standard
health care. Therefore, we did not include patients or relatives in
the quality indicator development process.
5.2.2 Limitations specific to the selected administrative databases
Administrative data are routinely collected and the databases are
structured to cater to administrative needs, not research purposes.
Additionally, they may lack essential information to answer specific
research questions, e.g. certain socio-demographic or diagnostic data
that may be most relevant in end-of-life care research. In our specific
situation, healthcare data, socio-demographic data and clinical data
are stored in separate databases, owned by different organizations.
Selecting, linking, processing and interpreting available data
correctly to answer research questions they were not designed to answer
can proof a challenge. It is key to identify the strengths and
weaknesses of each database and use them accordingly.
We partly compensate for these individual limitations by linking the
databases and thereby increasing the different types of data
available. Still, some of the database characteristics limited our
research. The Belgian Cancer Registry provides us with excellent data
on every cancer incidence in Belgium, including diagnostic and patient
details otherwise unavailable.8 Its main limitation is that it contains

213
data on people with cancer only, leaving us to other methods to
identify those dying from COPD or with dementia. The Statistics Belgium
databases contain a host of valuable socio-demographic and economic
variables.9 However, some of them date back to 2001 and might therefore
fail to capture upward social mobility of individuals since that time
and some variables, such as net taxable income, are less relevant in
an elderly population and therefore less relevant in the end-of-life
care context. The death certificate data allow us to identify people
who died from cancer, COPD or with dementia. Some causes of death,
such as dementia, are on average underreported, especially in people
suffering from multiple life-limiting diseases or general frailty.26
The IMA health claims data form the core dataset to measure the quality
indicators developed in this research project and provide a detailed
description of reimbursed health care practice in Belgium.7 However,
it does not contain non-reimbursed health care: experimental studies,
such as immunotherapy for people with cancer, other health care not
(yet) reimbursed, such as advance care planning (ACP) consultations,
over the counter medication, which is provided without prescription,
or health care that is not individually reimbursed, such as palliative
care in nursing homes. This has repercussions on the measurements of
several quality indicators or the interpretation of their results. For
example, nursing home palliative care and support by a mobile hospital
palliative care team are not included in the indicator on specialist
palliative care because they are not reimbursed healthcare actions
with a separate registration. This is especially important in people
dying with dementia, as many of them reside in nursing homes.27
Likewise, blood tests are not included in diagnostic testing, because

214
they are not reimbursed separately and therefore not detectable with
IMA health claims data.
Some administrative databases suffer from issues with completeness or
accuracy of the data.28 Long and complicated data collection
procedures, multiple data transfers and insufficient use of feedback
mechanisms may lead to missing data and errors. However, the Belgian
Cancer Registry and the IMA databases have been reported to contain
relatively complete and correct data, due to multiple validation
processes and internal consistency tests, as well as comparison with
databases with different data collection methods.29,30
5.2.3 Data unavailable in the available administrative databases
An important limitation of our studies is that we did not include data
on patient-related outcomes of healthcare services, such as patient's
preferences of care, psycho-social information, patient or family
reported outcomes31 and experiences or information about pain and
symptom management or communication aspects. In Belgium, a common
coding system for PROMs is lacking, so they are not available as
administrative data.32 If they would be available, the patient's
preferences could be taken into account when measuring appropriateness
and inappropriateness of care. Another limitation of using routinely
collected population-level data is that medication, treatment and
services not covered by insurers are not included in the datasets. In
Belgium, compared to other countries, data are relatively complete,
including data on health care in hospital, nursing homes, public
pharmacies and home settings. In other countries, this is rarely the
case.3,33,34 Nevertheless the occurrence some services cannot be measured
because they are not reimbursed as such (e.g. advance care planning
215
consultations, palliative care in a nursing home) or are not reimbursed
on an individual level (e.g. in-hospital mobile palliative care
teams). This limits our scope of quality indicator measurement.
5.2.4 Limitations of a decedent cohort study design
A possible limitation is related to the decedent cohort design of our
studies and the population selection. The target population of our
studies is all people suffering from cancer, COPD or dementia who
approach the end of life and therefore might have shifting care goals,
towards comfort and palliative care. A decedent cohort study does not
necessarily select this population correctly. We look back from the
time of death to include those who died from cancer, from COPD or with
dementia. This means we did not include all patients with cancer, COPD
or dementia: we excluded those who survived. It has been argued that
this is a group that possibly benefited from life-prolonging
treatments.35 Additionally, we included people for whom it may not have
been clear they were approaching the end of life. Caregivers do not
always recognize imminent death, and accurate prognosis might be
difficult to perform.36–38 A prospective design, including all people
at the time of diagnosis of cancer, dementia or COPD and evaluating
the appropriateness of care they received prospectively in a specific
time period after diagnosis, might provide a more correct study
population to evaluate the appropriateness of end-of-life care
provided.35
However, we argue that at time of diagnosis of cancer, COPD or
dementia, the selected population would probably be heterogeneous in
functional status. People with dementia are diagnosed in varying
216
stages of the disease and are often not diagnosed at all.39,40 In people
with cancer, functional status and time between diagnosis and death
vary with cancer type.37,41 A population of deceased sharing the same
cause of death is likely to be more functionally homogenous in the
weeks prior to death than people who receive the same diagnosis. As
such, due to functional homogeneity of the population, indicators of
appropriateness of care would be more generalizable and reliable. We
also argue that efforts made to identify imminent death and
communicating this prognosis to the patient, are signs of appropriate
care. Not identifying or communicating imminent death in a timely
manner, could be an indicator of inappropriate end-of-life care. As
such, when measuring the appropriateness of end-of-life care, we do
not want accurate prognosis to be a selection criterion for the
population, as this would exclude people who are possibly receiving
inappropriate end-of-life care. For these reasons, we believe the
decedent cohort population selection to be appropriate to answer our
current research questions.
5.2.5 Evaluating the health system from within
We used data generated by the health system itself to evaluate its
performance. With these data, it was impossible to measure aspects of
health care that are not registered by the system, but are nonetheless
essential to evaluate appropriateness of end-of-life care. For
example, when measuring the percentage of people receiving specialist
palliative care, we include hospital based palliative care, palliative
day-care centers and palliative home care. Palliative care provided
by a family physician or by nursing home staff are not registered, as

217
they are not reimbursed. This limitation of our study also pinpoints
limitations of the health system itself. Currently family physicians,
nursing homes staff, psychologists and physiotherapists, among others,
have no reimbursement options specifically for palliative care.
However, such reimbursement could be an opportunity for policy to
direct practice. We will discuss this in further detail below.
218
6. Discussion of the findings
6.1 Scientific relevance of the indicators
Our developed indicator set for people with cancer has recently been
included in a systematic review, performing an assessment of
acceptability, evidence base, definition, feasibility, reliability and
validity of population-based indicators for end-of-life care in people
with cancer.42 The authors of the systematic review selected a total
of 15 indicators recommended for use, 13 of which were also included
in this dissertation, (QI of inappropriate care: chemotherapy use,
hospitalization, emergency department admission, intensive care unit
admission, diagnostic testing, tube or intravenous feeding (excluding
people with gastro-intestinal cancer), port-a-cath installment or
surgery close to death; QI of appropriate care: palliative care
provision, GP contact, neuropathic medication provision or opioid use
close to death, dying at home). Some of the selected QIs were with
different wording or other measurement specifics. Several of these
indicators for people with cancer were also measured in other studies
prior to our research, for instance, in the US and Canada.3,4 We also
developed several indicators that are probably not measurable with
data available in most other countries at the moment. (e.g.
multidisciplinary oncological consultations, or government support for
palliative care)
The indicator sets for people with COPD or dementia are entirely new
developments. To our knowledge, similar quality indicator sets have
not been developed up to this point. Research on appropriateness of
end-of-life care in people with dementia or COPD is lacking in general.
However, a Swedish study recently compared end-of-life care in people

219
with dementia with people with cancer, using indicators not measurable
with our current dataset.43 They used an existing questionnaire
developed by the Swedish Register of Palliative Care44, based on the
principles of a good death, proposed by the British Geriatrics
Society45. As such, our development process combining literature
review, expert interviews and expert evaluation is novel and
scientifically rigorous. Further validation of the developed indicator
sets in a national and international context is recommended, through
repeated measurement and testing of acceptance of indicators with
relevant experts.
Based on our own measurements, a few indicators have proven to be less
relevant for future assessments of appropriateness of end-of-life
care, either because they are not measurable with currently available
data or they occur in very low percentages of the population. The
indicator sets were developed with administrative data to measure them
in mind. However, since we had little a priori experience with the
available administrative data at the time of the indicator
development, we misjudged the availability of or possibilities with
the specific data. Therefore, these could not be measured with the
linked dataset: blood tests as part of diagnostic testing, starting a
new chemotherapy treatment line, receiving anti-emetics with
chemotherapy, receiving radiotherapy for patients with bone metastases
and receiving radiotherapy for patients with small cell lung cancer.
Several indicators did not have enough discriminative power: their
results were close to 0 across the population, so they are not
meaningful indicators of appropriateness or inappropriateness of end-
of-life care46,47: receiving tube feeding or intravenous feeding,

220
receiving cisplatin in people age 80 and older, installment of a port-
a-cath, reanimation in people with dementia and a neurologist
consultation.
All other developed indicators were measurable with available data and
had sufficient variation in results. According to literature, quality
indicators should also be clinically relevant, manageable and based
on existing evidence or consensus.47,48 The rigorous indicator
development process, based on evidence when possible, complemented and
validated by relevant clinical expert knowledge, demonstrates our
quality indicator sets meet these requirements.
6.2 Determining standards and setting goals for quality
improvement
The quality indicators developed and measured in this research project
aim to assess the performance of the Belgian health care system in
terms of appropriateness of end-of-life care. They can be used to
answer policy questions and to be a first step towards improvement of
the quality of end-of-life care.49 The second step would be comparing
the results to a standard and setting goals. As explained in the
introduction of this dissertation, interpreting quality indicator
results correctly can only be done through comparison with
standards.3,49,50 Standards represent the preferred value for each
indicator and can be derived from a variety of sources. We have
suggested data-driven relative standards based on the measurement
results. Through comparison between health care regions in Flanders
and Brussels we have determined data-based standards.
221
When comparing regions, or other subpopulations, (e.g. people dying
in different years, as we did in chapter 7) it is important that
differences found between these subpopulations can be attributed to
actual differences in quality or appropriateness of end-of-life
care.51,52 Possible confounding factors might influence the end-of-life
care provided and can vary between subpopulations, but are not
indicators of the appropriateness of care provided.51,53,54 To ensure
correct attribution, we controlled for a number of confounding
variables. We selected age, gender, highest attained level of
education, net taxable income, household composition (e.g. married,
single, with or without children, in a nursing home), being officially
recognized as having high care needs, being entitled to a higher degree
of reimbursement due to lower degree of self-reliance, and degree of
urbanization of the municipality of residence. Supplementary tables
S.11 and S.12 show the logistic regression model used for each quality
indicator, with odds ratios and area under the curve. Other relevant
confounders might be patient preferences, cultural background of the
patient, the involvement of informal caregivers, or others. However,
those are not currently measurable with available administrative data.
Based on previous research16,52,53, we assume the confounders we were
able to use cover the majority of individual differences that may have
an influence on end-of-life care provision. However, in future
research other possible confounders may be added, when available.
When comparing subpopulations on quality indicators scores,
controlling for confounding variables, the population can be divided
into best and worst performers and standards can be set. In our
example, we divided the population in four groups defined by quartiles,
from worst performers (worst 25%: improvement should be a priority),
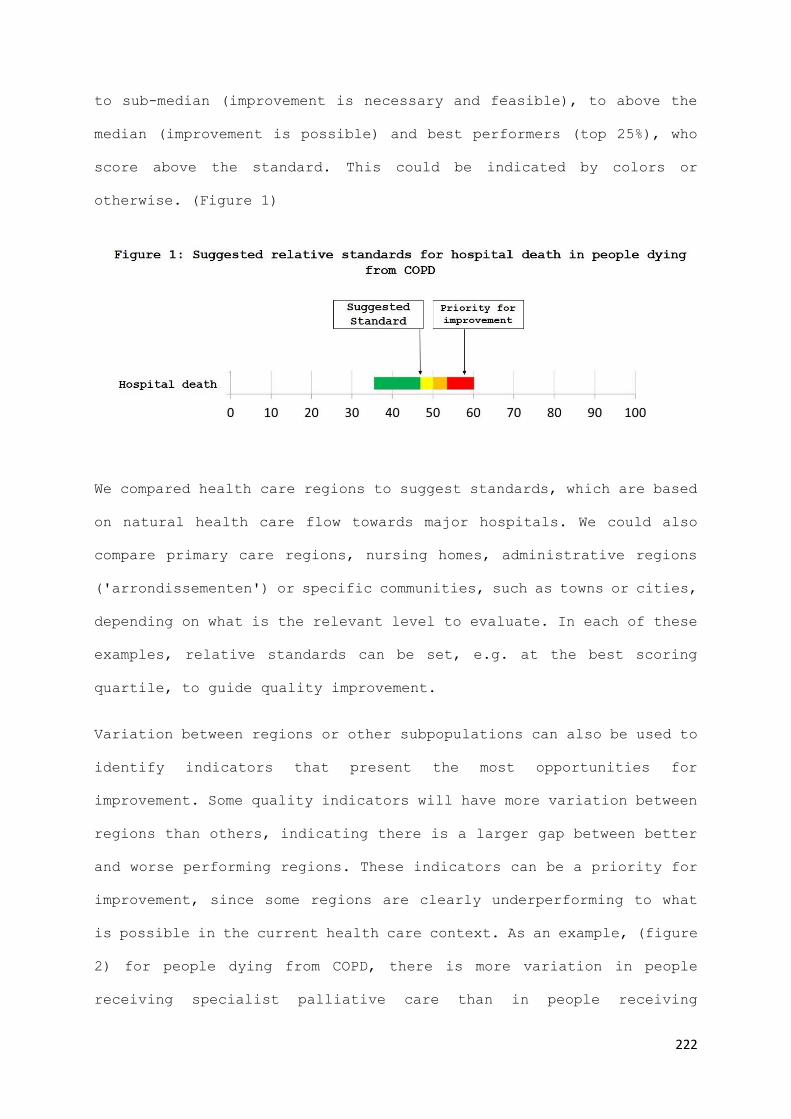
222
to sub-median (improvement is necessary and feasible), to above the
median (improvement is possible) and best performers (top 25%), who
score above the standard. This could be indicated by colors or
otherwise. (Figure 1)
We compared health care regions to suggest standards, which are based
on natural health care flow towards major hospitals. We could also
compare primary care regions, nursing homes, administrative regions
('arrondissementen') or specific communities, such as towns or cities,
depending on what is the relevant level to evaluate. In each of these
examples, relative standards can be set, e.g. at the best scoring
quartile, to guide quality improvement.
Variation between regions or other subpopulations can also be used to
identify indicators that present the most opportunities for
improvement. Some quality indicators will have more variation between
regions than others, indicating there is a larger gap between better
and worse performing regions. These indicators can be a priority for
improvement, since some regions are clearly underperforming to what
is possible in the current health care context. As an example, (figure
2) for people dying from COPD, there is more variation in people
receiving specialist palliative care than in people receiving

223
inhalation therapy between regions. Therefore, specialist palliative
care could be a priority target for improving appropriateness of end-
of-life care for people with COPD.
Another way to use quality indicators for quality improvement, apart
from setting relative standards, is to evaluate the effect of
interventions or policy.55,56 For example, we could perform an
intervention in 7 out of 14 health regions and perform pre- and post-
measurements of an indicator set. Improving indicators scores in
intervention regions more than in non-intervention regions, could
mean, after risk adjustment, that the intervention is successful.
Also, a selection of indicators can be focused on instead of using the
full quality indicator sets.
6.2.1 Goals for improvement of end-of-life care for people dying from
cancer
Earle et al. developed a standard for chemotherapy use in the last
fourteen days of life at 10.0 percent or less of the population dying
from cancer.3 We found percentages lower than this in Belgium (8.6
percent), but we found a higher use of chemotherapy in the last thirty
days compared to results from a study in seven other countries.15 The
224
percentage of people with cancer who had an admission to the emergency
department (ED) in the last thirty days (33.8 percent) is lower than
the percentages reported in Canada (58 percent), the United States (46
percent) and England (48 percent).57 Our results for specialist
palliative care provision in Belgium (47.1 percent) are comparable to
the percentage of people receiving palliative home care in Canada
(47.3 percent)58. In Belgium, 30 percent of people with cancer die at
home. This is comparable to Spain (31.6 percent) and England (26.1
percent), but lower than the Netherlands (46.3 percent) and higher
than France (19.1 percent) and Canada (16.1 percent).59 Our trend
analysis with data from 2010 until 2015 in Belgium suggests the use
of specialist palliative care is rising, as well as GP contacts.
However, the percentage of people being admitted to an emergency
department is also rising, and the rise of specialist palliative care
is mainly limited to the last 14 days of life.
Assessment of the variation of indicators for people dying from cancer
across regions would provide us with valuable information to identify
priorities for improvement. However, based on the information
currently available, we would argue the main challenges for
appropriateness of end-of-life care in Belgium for people with cancer
would be the consolidation of continuity of care, reducing the
percentages of people being admitted to ED, ICU or hospital in the
last weeks of their life, and to prevent hospital death whenever this
is congruent with the patients' wishes.

225
6.2.2 Goals for improvement of end-of-life care for people dying from
COPD
For people with COPD, we found large variations between health care
regions for a large number of indicators, even after controlling for
various possible confounders. This leads us to the assumption that
appropriate end-of-life care for people dying from COPD is far from
established as standard practice in Belgium. It also means that in
some regions, end-of-life care for people with COPD is better
developed, as they are ahead of what is considered standard practice
in other regions.
The main areas of possible improvement identified by the COPD quality
indicator results are1: increasing the use of specialized palliative
care (variation between 4 to 38 percent) and death at home (between 7
and 33 percent), while decreasing diagnostic testing (between 44 and
70 percent), ED admission (between 18 and 42 percent) and hospital
death (between 35 and 60 percent). The main domains represented in
these quality indicators are the provision of palliative care and
continuity of care. In some regions, provision of specialist
palliative care is considerably lower and in some regions transitions
to emergency departments and death at the hospital are much more
frequent. We suggest these to be the main targets for those who seek
to improve appropriateness of end-of-life care for people with COPD.
This is reinforced by the results of our trend analysis, that suggest
that transitions towards hospitals were increasingly prevalent between
2010 and 2015. As some regions are performing better than others, we
1 All indicator percentages mentioned here are measured in the last 30 days
before death, when timing is relevant.

226
suggest strengthening inter-region consultation to share best
practices. This would be a nationwide effort, whereby the regional
Belgian governments take the initiative to include all relevant
stakeholders for each region, including palliative care networks, home
care services, general practitioners, hospital wards treating people
with COPD and universities, to discuss how appropriateness of end-of-
life care for people with COPD can be improved and what can be learned
from practices and improvement initiatives in other regions.60
6.2.3 Goals for improvement of end-of-life care for people dying with
dementia
For people with dementia, we found less variation than for people with
COPD in general and especially little variation in quality indicators
of appropriateness of end-of-life care. This could mean that, based
on our results, there is a well-established standard practice for end-
of-life care for people with dementia in Belgium. Whether this standard
practice is at a desired level of quality of care, requires other non-
data driven standards to evaluate.
The main areas of possible improvement based on variation in the
quality indicator results are2: decreasing diagnostic testing (between
21 and 35 percent), ED admission (between 10 and 25 percent),
dispension of gastric protectors (between 21 and 30 percent), and
anti-hypertensives (between 37 and 49 percent). High variation in ED
admissions can be linked to continuity of care, increased use of
gastric protectors and anti-hypertensives has been associated with the
2 All indicator percentages mentioned here are measured in the last 30 days before death, when timing is relevant.

227
occurrence of polymedication.61 Our results therefore suggest improving
continuity of care and reducing polymedication in people with
dementia. This is reinforced by the results of the trend analysis that
suggest an increasingly high percentage of people dying with dementia
received possibly inappropriate medication, such as gastric protectors
or Novel Oral Anticoagulants or vitamin-K antagonists.
Possible interventions to improve the continuity in end-of-life care
for people with dementia could focus on enhancing palliative care
capabilities of nursing homes (staff training62–64 and equipment65), as
well as increasing advance care planning and the execution of those
plans in cases of emergency66,67. (e.g. discussing with residents
whether they want to be taken to the intensive care unit in case of
severe pneumonia and making sure all caregivers are aware of their
preferences)

228
7. Implications and recommendations
7.1 Implications and recommendations for practice
Using quality indicators
Our indicators identify what is generally considered appropriate or
inappropriate end-of-life care in people dying from cancer, from COPD
or with dementia. As we worked closely together with end-of-life care
practitioners from a variety of medical specialties to develop and
validate the quality indicators in a consensus procedure12, we hope
they find the results both acceptable and inspiring to improve
appropriateness of end-of-life care. As we discussed in the
limitations section, this probably introduced a bias towards current
practice as appropriate care. However, when our quality indicator
results are used to improve practice, they might be more recognizable
and acceptable by health care professionals. For any quality
improvement effort, acceptance and relevance of measurement results
are prerequisites for effective quality improvement.
With repeated quality measurements, goal setting and improvement
efforts, practitioners can integrate the quality indicator sets in a
plan-do-check-act (PDCA) cycle for quality improvement. The PDCA cycle
is a commonly used instrument to work towards organizational
development.68 As the title suggests, it consists of four steps: (1)
Plan, identifying change goals and what is necessary to achieve them,
(2) Do, executing the plan from the first step, (3) Check, to compare
the results with the original goals and lastly, (4) Act, readjustment
of the execution to achieve the goals. The main goals of employing a
PDCA cycle in organizational change is to ensure the continuous

229
engagement of all those involved in the improvement process.69 Quality
indicators can be used to identify improvement priorities in the Plan-
step, as well as evaluate the results in the Check-step. This requires
repeated measurements of the quality indicators. When the cycle is
repeated, new goals can be selected over time, when improvement is
satisfying. As such, the developed indicator sets can directly be used
as a tool for quality improvement on a health care provider level.
Locally available data can be used to measure the quality indicator
sets, or a selection of indicators. For example: a group of nursing
homes could measure several indicators for people with dementia, e.g.
hospital admissions from their nursing home or provision of specific
medication such as gastric protectors. The indicator scores can then
be compared between nursing homes of the same group, to give them
feedback on the appropriateness of end-of-life care provided in their
institution.
Suggestions to improve appropriateness of end-of-life care
Based on our findings, we can also make some specific suggestions for
end-of-life care practitioners.
First, we suggest to make extra efforts to initiate advance care
planning with all patients who approach the end of life. This is
relevant for all practitioners: general practitioners could initiate
care planning conversations with their patients70,71, nursing homes
could have clear procedures to initiate advance care planning with
every resident66, specialists (oncologists, pneumologists,
geriatricians,…) could initiate advance care planning conversations,
or they could take the initiative to inform the general practitioner
when they suspect the end of life is approaching for one of their

230
patients. An increasing number of patients reflecting on and
discussing their preferences for end-of-life care might lower the
percentage of several indicators of inappropriate end-of-life care,
such as admissions to the ED or ICU or diagnostic testing near the end
of life, towards the percentage of people who actually want to be
admitted or submitted to tests. Linked to this recommendation about
more ACP, nursing homes might want to evaluate the training of their
staff and the available equipment they have at their disposal to treat
residents near the end of life. Limited staff knowledge and experience
and lack of equipment (e.g. for adequate in-house pain treatment) have
been reported to be among the greatest barriers to installing advance
care planning in nursing homes.65 Additionally, they might evaluate
their procedures on advance care planning and the execution of their
residents care plans in case of emergency.
Secondly, practitioners caring for people with COPD might consider
referring their patients to palliative care more often and earlier.72
Previous research identified effective triggers for initiating
referral to palliative care to be a clear functional decline, such as
when the patient becomes oxygen-dependent or housebound, or shortly
after recovery from an acute exacerbation.73,74 However, although the
fresh experience of the life-threatening consequences of their disease
and the invasive treatment required to deal with them may lead to more
patients waiving future aggressive treatment, experts interviewed in
our studies reported that exacerbations are extremely distressing, to
the extent that many patients request emergency hospital admission,
despite earlier expressed wishes to avoid it.

231
Lastly, general practitioners might need to become better at
deprescribing unnecessary medication for their patients with dementia,
especially long-term prophylactic medication such as anti-
hypertensives, to avoid polymedication.61,75 We suggest to do this in
consultation with the patient and any involved relatives, to avoid
resistance.
7.2 Implications and recommendations for research
The indicator sets we developed and measured provide several new
research opportunities.
First, we suggest to measure them in other countries. Local researchers
can use them to evaluate their health care system in term of
appropriateness of end-of-life care, as well as set their own relative
standards by comparing care regions or other subpopulations.
Measurement of the indicators in other countries requires a thorough
evaluation of what data are available in the measuring country, as
well as what quality indicators can be measured and how they can be
assessed. Furthermore, parallel national or regional measurements
enable international comparison of health care systems in terms of
appropriateness of end-of-life care. Of course, these efforts may be
coordinated by an international consortium, to facilitate the
construction of common data models, transferability of results and
even direct comparison of data. At the moment, administrative
databases are structured differently in different countries and data
available in one country, might not be available in others. For
example, claims data in Belgium include data from all health insurers
232
and from public pharmacies and hospitals7, while in other European
countries, there is no central agency (like IMA in Belgium) that
collects data from different health insurers. In some countries,
public pharmacy data or hospital data are not routinely collected, or
not linked to other health data. However currently in many countries,
independent researchers and those employed by database administrators
have access to routinely collected health data and are using it to
evaluate end-of-life.76
Secondly, we suggest the indicator sets to be used to evaluate expected
changes in the health system, i.e. policy changes or major socio-
demographic or economic evolutions. If a government anticipates a
change in the health system that may have a direct or indirect effect
on the appropriateness of end-of-life care provided, the developed
indicator sets can be a tool to evaluate the effects. This requires a
thorough investigation of all relevant confounding variables that may
play a role, to single out the effect.53 Controlling for possible
confounders can be completed with a difference-in-difference
methodology77, taking normal changes in the population into account
when studying an expected effect. Similarly, the quality indicator
sets could be used to evaluate the effectiveness of specific
interventions in a trial. If researchers develop an intervention that
is expected to improve the appropriateness of end-of-life care, or
specific quality indicators, measuring the relevant indicators with
routinely collected administrative data can be a cost-effective, non-
invasive and less-biased method17 to perform an experimental (pretest
posttest control group) or quasi-experimental (e.g. nonequivalent
control group, controlled interrupted time series) design to establish
the effect of the intervention. An advantage is that pre-intervention
233
measurements can even be performed after the trial, with
administrative data being routinely collected.
Thirdly, we suggest researchers further validate the developed
indicator sets. Currently some of the developed indicators have not
been measured elsewhere, especially the indicators for people with
COPD or dementia. Some of them are based on expert opinion, validated
by expert consensus.78 We suggest researchers further evaluate the
validity of the indicators, investigating whether they are connected
to other measurements of appropriateness of end-of-life care or to
quality of life related outcomes. This requires experiments or
methodologically sound observational studies that clearly show the
impact of specific types of care (i.e. the individual outcomes on
which the quality indicators are based ) on the quality of care and
quality of life near the end of life. For example: does (a higher
percentage of people being submitted to) diagnostic testing have a
negative impact on patient reported outcome measures31?
Lastly, more research effort should be invested in establishing non-
relative standards for indicators of appropriate or inappropriate end-
of-life care. For some indicators, absolute standards can be
developed. For example: we could use knowledge on preferences in the
general population to develop standards. The percentage of people who
prefer to die at home across the population could be a starting point
for an absolute standard for an indicator measuring the percentage of
people dying at home. Many indicators are directly related to patient
preferences and/or patient reported outcome measures. As such, mapping
these preferences across the population could provide us with an
indication for absolute standards. As end-of-life care practice
234
evolves, so should the indicators of appropriate and inappropriate
care, as well as the standards for these indicators. The method of
relative data-driven standards lends itself to this, as with each
measurement of the quality indicators, new standards can be suggested,
but we suggest these relative standards to be supplemented with
information on patient preferences and patient-reported outcome
measures.
7.3 Implications and recommendations for policy
We believe the methodological groundwork in this study, as well as the
results, could be informative to international and Belgian national
and regional policy makers. The developed quality indicator sets can
be used to evaluate the appropriateness of end-of-life care, or to
describe long term trends in Belgium or any other population, guiding
policy decisions, or to develop and help enforce standards for
appropriateness of end-of-life care. The results can be used to steer
end-of-life care policy, on a disease-specific basis to reduce or
increase certain types of care, but also across the population. Based
on our limited results and tying in with our recommendations for
practice, we suggest investing more in continuity of care and
communication near the end of life, to increase advance care planning
and avoid possibly inappropriate care transitions. We also suggest
supporting nursing homes in training their staff and purchasing the
equipment they need in house to treat residents near the end of life.
This support can be financial, but also informational by connecting
existing meeting platforms (e.g. Zorgnet/Icuro79, VVSG80, Vlozo81) and
stimulating them to spread knowledge, training and best practices in

235
appropriate end-of-life care. Additionally, we suggest to bring
together practitioners caring for people with COPD and palliative care
specialists, to discuss how palliative care can be initiated sooner
and become integrated into standard end-of-life COPD care.73,82 National
and regional governments can play a crucial part in bringing health
care providers together to share best end-of-life care practices.
Lastly, we suggest policy makers to encourage general practitioners
to consider discontinuing unnecessary medication for their patients
with dementia. This can be done by raising awareness about
polymedication and its negative effects, through existing platforms
for general practitioners, such as university faculties for family
medicine, Domus Medica83 or Société Scientifique de Médecine Générale84.
Continued evaluation of the health system
Currently, the website Healthybelgium.be (supported by the Belgian
Federal government) publishes a selection of 4 indicators on end-of-
life care, with regular updates and trend analyses.23 They are limited
to people with cancer and include the provision of palliative care,
timely initiation of palliative care, chemotherapy use near the end
of life and dying in the place of usual residence. The website presents
these results in a comprehensible way, with adequate information to
facilitate interpretation for a broader public. By presenting these
results, the website succeeds in both reporting on the performance of
the health care system and informing on what is currently deemed
appropriate end-of-life care. We recommend to expand these four
indicators with the indicators that we developed, not only for people
with cancer, but also with indicators for people with COPD or dementia.
The indicators could be measured on a yearly basis, with the most
236
recent available administrative data. These results could be presented
on the Healthy Belgium website to inform the public and could be a
starting point for discussions on health care priorities for the coming
years. Presenting the results on the website would also serve to
enhance the public visibility of appropriateness of end-of-life care.
Targeted reimbursement to improve appropriateness of end-of-life care
In most previous efforts to improve appropriateness of end-of-life
care, the focus has been on the provision and improvement of specific
health services, such as developing care pathways, new procedures or
innovative treatments to be implemented.67,85–87 Fortunately, research
on how to improve quality of care on a service level increasing a
specific metric, such as advance care planning, the use of
communication tools or more appropriate pain treatment, is abundant.
However, in Belgium and other countries, where citizens are obliged
to have health insurance, the government has an enormous impact on
what health care is used, through reimbursement.88,89 While ideally
patients and caregivers together decide what care is appropriate in
their specific situation, the government creates the financial
framework for their decisions. The cost of non-reimbursed medication
and treatments is often too high for a majority of patients.89–91
Reimbursements have a large impact on that cost and thereby determine
what care is available and what is considered standard care. Through
reimbursement, the government can promote any type of health care by
making it affordable. When seeking to reduce possibly inappropriate
end-of-life care, (e.g. hospital transitions) policy makers should
analyze what options the health care system offers as alternatives to
possibly inappropriate end-of-life care. Strategic reimbursement, e.g.

237
for advance care planning or nursing home palliative care, can be
employed to improve the appropriateness of end-of-life care.
The 2017 KCE report on palliative care and end-of-life care mentions
a list of determinants and contributing factors that might be directly
or indirectly influencing the occurrence of inappropriate end-of-life
care.92 The report divides these into factors related to the health
care professionals involved, the patients, the patients’ relatives and
societal and health care organizational factors. The long list of
determinants and contributing factors suggests that no single factor
causes appropriate or inappropriate end-of-life care to occur. The
end-of-life care context creates a complex situation that health care
professionals might not be trained for and where they might feel
inexperienced. Patients, relatives and care professionals often suffer
from cultural barriers and taboos to talk about death and dying, or
their wishes and expectations.92–95 In this complex situation, the
health care system determines what care is available and what care is
affordable, and as such defines the boundaries of individuals actions.
If we want to improve the appropriateness of end-of-life care, are
there any feasible alternatives for possibly inappropriate treatment?
For example, if we are to reduce hospital admissions near the end of
life, are home care and nursing home care sufficiently developed to
guarantee high quality end-of-life care? In cases of emergency, do we
have a clear plan of action that avoids unnecessary care transitions?
Who is aware of this plan and can it be enforced by the patient or a
decision maker in emergency situations? These are not questions for
individual patients to solve. Rather, it is the health care system
that defines the options from which patients and all care practitioners
involved can choose.96

238
When developing our quality indicators and performing the subsequent
measurements, we found several important aspects of appropriate end-
of-life care that are not measurable using health claims data, because
they are not individually reimbursed, or not reimbursed at all. The
most impactful examples are palliative care provided in nursing homes
and advance care planning consultations. Specific reimbursement for
advance care planning would be relevant for nearly all patients near
the end of life and their relatives. It would make advance care
planning an official part of standard end-of-life care, as proposed
by many researches and practitioners.66,67,97 Through reimbursement, the
government could directly influence the quality of care provided and
create opportunities for care providers and patients to choose the
more appropriate options.
As a general conclusion, we believe the government has the obligation
to provide a well-performing health care system, providing high
quality and appropriate care for its most vulnerable citizens,
especially those at the end of life.

239
References
1. Earle CC, Park ER, Lai B, Weeks JC, Ayanian JZ, Block S. Identifying
potential indicators of the quality of end-of-life cancer care from
administrative data. J Clin Oncol. 2003;21:1133–8.
2. Grunfeld E, Urquhart R, Mykhalovskiy E, Folkes A, Johnston G, Burge FI,
et al. Toward population-based indicators of quality end-of-life care:
testing stakeholder agreement. Cancer. 2008;112:2301–8.
3. Earle CC, Neville BA, Landrum MB, Souza JM, Weeks JC, Block SD, et al.
Evaluating claims-based indicators of the intensity of end-of-life
cancer care. Int J Qual Health Care. 2005;17:505–9.
4. Ho TH, Barbera L, Saskin R, Lu H, Neville BA, Earle CC. Trends in the
aggressiveness of end-of-life cancer care in the universal health care
system of Ontario, Canada. J Clin Oncol. 2011;29:1587–91.
5. WHO | WHO Definition of Palliative Care [Internet]. WHO. [cited 2020 Jan
21]. Available from:
https://www.who.int/cancer/palliative/definition/en/
6. (15) (PDF) EAPC Atlas of Palliative Care in Europe 2019 [Internet].
ResearchGate. [cited 2020 Jan 6]. Available from:
https://www.researchgate.net/publication/333390123_EAPC_Atlas_of_Palliat
ive_Care_in_Europe_2019
7. IMA-AIM [Internet]. [cited 2016 Apr 13]. Available from: http://www.aim-
ima.be/
8. Belgian Cancer Registry — Get all the facts [Internet]. [cited 2017 Jan
31]. Available from: http://www.kankerregister.org/default.aspx?lang=EN
9. Statbel, the Belgian statistical office | Statbel [Internet]. [cited
2020 Jan 21]. Available from: https://statbel.fgov.be/en
10. Startpagina | eHealth [Internet]. [cited 2020 Feb 4]. Available from:
https://www.ehealth.fgov.be/nl
11. KSZ - Kruispuntbank van de Sociale Zekerheid [Internet]. [cited 2020
Feb 4]. Available from: https://www.ksz-bcss.fgov.be/nl
12. The RAND/UCLA Appropriateness Method User’s Manual - MR1269.pdf
[Internet]. [cited 2016 Apr 13]. Available from:
https://www.rand.org/content/dam/rand/pubs/monograph_reports/2011/MR1269
13. Rosenwax L, Spilsbury K, McNamara BA, Semmens JB. A retrospective
population based cohort study of access to specialist palliative care in
the last year of life: who is still missing out a decade on? BMC Palliat
Care. 2016;15:46.
14. Mounsey L, Ferres M, Eastman P. Palliative care for the patient
without cancer. Aust J Gen Pract. 2018;47:765–9.
15. Boland J, Johnson MJ. End-of-life care for non-cancer patients. BMJ
Support Palliat Care. 2013;3:2–3.

240
16. Chang CM, Wu CC, Yin WY, Juang SY, Yu CH, Lee CC. Low Socioeconomic
Status Is Associated With More Aggressive End-of-Life Care for Working-
Age Terminal Cancer Patients. Oncologist. 2014;19:1241–8.
17. Benchimol EI, Smeeth L, Guttmann A, Harron K, Moher D, Petersen I, et
al. The REporting of studies Conducted using Observational Routinely-
collected health Data (RECORD) Statement. PLoS Med. 2015;12:e1001885.
18. Administrative data linkage as a tool for child maltreatment research
[Internet]. [cited 2017 Jan 31]. Available from:
http://www.sciencedirect.com/science/article/pii/S014521341200213X
19. Billings J. Using Administrative Data to Monitor Access, Identify
Disparities, and Assess Performance of the Safety Net. Tools Monit
Health Care Saf Net [Internet]. 2003 [cited 2020 Jan 22]; Available
from: https://nyuscholars.nyu.edu/en/publications/using-administrative-
data-to-monitor-access-identify-disparities-
20. Fischer DJ, Burgener SC, Kavanaugh K, Ryan C, Keenan G. Conducting
Research with End-of-Life Populations: Overcoming Recruitment Challenges
when Working with Clinical Agencies. Appl Nurs Res ANR. 2012;25:258–63.
21. Addington-Hall J. Research sensitivities to palliative care patients.
Eur J Cancer Care (Engl). 2002;11:220–4.
22. Casarett D. Ethical considerations in end-of-life care and research.
J Palliat Med. 2005;8 Suppl 1:S148-160.
23. End of life - For a Healthy Belgium [Internet]. [cited 2019 Oct 9].
Available from: https://www.healthybelgium.be/en/health-system-
performance-assessment/specific-domains/end-of-life
24. Coory M, Gibberd R. New measures for reporting the magnitude of
small-area variation in rates. Stat Med. 1998;17:2625–34.
25. The periodic health examination. Canadian Task Force on the Periodic
Health Examination. Can Med Assoc J. 1979;121:1193–254.
26. Das C. Death certificates in Germany, England, The Netherlands,
Belgium and the USA. Eur J Health Law. 2005;12:193–211.
27. Kupeli N, Sampson EL, Leavey G, Harrington J, Davis S, Candy B, et
al. Context, mechanisms and outcomes in end-of-life care for people with
advanced dementia: family carers perspective. BMC Palliat Care.
2019;18:87.
28. Tyree PT, Lind BK, Lafferty WE. Challenges of Using Medical Insurance
Claims Data for Utilization Analysis. Am J Med Qual. 2006;21:269–75.
29. Sande SVD, Wachter DD, Swartenbroekx N, Peers J, Debruyne H,
Moldenaers I, et al. Inventaris van databanken gezondheidszorg.
2006;147.
30. Wytsmanstraat J. Achil Phase 1 (2009-2013). Ambulatory Care Health
Information Laboratory. 2013;125.
31. Dudgeon D. The Impact of Measuring Patient-Reported Outcome Measures
on Quality of and Access to Palliative Care. J Palliat Med. 2018;21:S76–
80.

241
32. Francis DO, McPheeters ML, Noud M, Penson DF, Feurer ID. Checklist to
operationalize measurement characteristics of patient-reported outcome
measures. Syst Rev [Internet]. 2016;5. Available from:
https://www.ncbi.nlm.nih.gov/pmc/articles/PMC4971647/
33. Morin L, Wastesson JW, Laroche M-L, Fastbom J, Johnell K. How many
older adults receive drugs of questionable clinical benefit near the end
of life? A cohort study. Palliat Med. 2019;33:1080–90.
34. Grunfeld E, Lethbridge L, Dewar R, Lawson B, Paszat LF, Johnston G,
et al. Towards using administrative databases to measure population-
based indicators of quality of end-of-life care: testing the
methodology. Palliat Med. 2006;20:769–77.
35. Bach PB, Schrag D, Begg CB. Resurrecting treatment histories of dead
patients: a study design that should be laid to rest. JAMA.
2004;292:2765–70.
36. Ambrosino N, Gherardi M, Carpenè N. End stage chronic obstructive
pulmonary disease. Pneumonol Alergol Pol. 2009;77:173–9.
37. Wang S-Y, Hsu SH, Gross CP, Sanft T, Davidoff AJ, Ma X, et al.
Association between Time since Cancer Diagnosis and Health-Related
Quality of Life: A Population-Level Analysis. Value Health J Int Soc
Pharmacoeconomics Outcomes Res. 2016;19:631–8.
38. Mitchell SL, Teno JM, Kiely DK, Shaffer ML, Jones RN, Prigerson HG,
et al. The clinical course of advanced dementia. N Engl J Med.
2009;361:1529–38.
39. Ford E, Rooney P, Oliver S, Hoile R, Hurley P, Banerjee S, et al.
Identifying undetected dementia in UK primary care patients: a
retrospective case-control study comparing machine-learning and standard
epidemiological approaches. BMC Med Inform Decis Mak [Internet].
2019;19. Available from:
https://www.ncbi.nlm.nih.gov/pmc/articles/PMC6889642/
40. Birch D, Draper J. A critical literature review exploring the
challenges of delivering effective palliative care to older people with
dementia. J Clin Nurs. 2008;17:1144–63.
41. Jacobsen MM, Silverstein SC, Quinn M, Waterston LB, Thomas CA,
Benneyan JC, et al. Timeliness of access to lung cancer diagnosis and
treatment: A scoping literature review. Lung Cancer Amst Neth.
2017;112:156–64.
42. Population-Based Quality Indicators for End-of-Life Cancer Care: A
Systematic Review | Oncology | JAMA Oncology | JAMA Network [Internet].
[cited 2019 Nov 4]. Available from:
https://jamanetwork.com/journals/jamaoncology/article-abstract/2753176
43. Martinsson L, Lundström S, Sundelöf J. Quality of end-of-life care in
patients with dementia compared to patients with cancer: A population-
based register study. PloS One. 2018;13:e0201051.
44. Developing a national quality register in end-of-life care: The
Swedish experience - Staffan Lundström, Bertil Axelsson, Per-Anders
Heedman, Greger Fransson, Carl Johan Fürst, 2012 [Internet]. [cited 2020
Mar 8]. Available from:
https://journals.sagepub.com/doi/10.1177/0269216311414758
242
45. End of life care | British Geriatrics Society [Internet]. [cited 2020
Mar 8]. Available from: https://www.bgs.org.uk/topics/end-of-life-care
46. Claessen SJJ, Francke AL, Belarbi HE, Pasman HRW, van der Putten MJA,
Deliens L. A new set of quality indicators for palliative care: process
and results of the development trajectory. J Pain Symptom Manage.
2011;42:169–82.
47. Leemans K, Deliens L, Van den Block L, Vander Stichele R, Francke AL,
Cohen J. Systematic Quality Monitoring For Specialized Palliative Care
Services: Development of a Minimal Set of Quality Indicators for
Palliative Care Study (QPAC). Am J Hosp Palliat Care. 2016;
48. Ostgathe C, Voltz R. Quality indicators in end-of-life care. Curr
Opin Support Palliat Care. 2010;4:170–3.
49. Donabedian A. The quality of care: How can it be assessed? JAMA.
1988;260:1743–8.
50. Donabedian A. Evaluating the quality of medical care. Milbank Mem
Fund Q. 1966;44:Suppl:166-206.
51. Silva LK. Validity of the risk adjustment approach to compare
outcomes. Cad Saude Publica. 2003;19:287–95.
52. Risk Adjustment for Measuring Health Care Outcomes, 3rd edition |
International Journal for Quality in Health Care | Oxford Academic
[Internet]. [cited 2020 Feb 16]. Available from:
https://academic.oup.com/intqhc/article/16/2/181/1819128
53. Brookhart M, Stürmer T, Glynn R, Rassen J, Schneeweiss S. Confounding
control in healthcare database research: challenges and potential
approaches. Med Care. 2010;48:S114–20.
54. Wong J, Xu B, Yeung HN, Roeland EJ, Martinez ME, Le QT, et al. Age
disparity in palliative radiation therapy among patients with advanced
cancer. Int J Radiat Oncol Biol Phys. 2014;90:224–30.
55. Interdisciplinary Research Program (IRP): Research and Social Change
towards Compassionate Communities (RESOCO) | End-of-Life Care Research
Group [Internet]. [cited 2020 Mar 20]. Available from:
http://endoflifecare.be/project/interdisciplinary-research-program-irp-
research-and-social-change-towards-compassionate
56. Development, implementation and evaluation of the Nursing home Care |
End-of-Life Care Research Group [Internet]. [cited 2020 Mar 20].
Available from: http://endoflifecare.be/project/development-
implementation-and-evaluation-nursing-home-care
57. Bekelman JE, Halpern SD, Blankart CR, Bynum JP, Cohen J, Fowler R, et
al. Comparison of Site of Death, Health Care Utilization, and Hospital
Expenditures for Patients Dying With Cancer in 7 Developed Countries.
JAMA. 2016;315:272–83.
58. Barbera L, Seow H, Sutradhar R, Chu A, Burge F, Fassbender K, et al.
Quality of end-of-life cancer care in Canada: a retrospective four-
province study using administrative health care data. Curr Oncol Tor
Ont. 2015;22:341–55.

243
59. Cohen J, Pivodic L, Miccinesi G, Onwuteaka-Philipsen BD, Naylor WA,
Wilson DM, et al. International study of the place of death of people
with cancer: a population-level comparison of 14 countries across 4
continents using death certificate data. Br J Cancer. 2015;113:1397–404.
60. Butt A, Naaranoja M, Savolainen J. Project change stakeholder
communication. Int J Proj Manag. 2016;34:1579–95.
61. Paque K, De Schreye R, Elseviers M, Vander Stichele R, Pardon K,
Dilles T, et al. Discontinuation of medications at the end of life: A
population study in Belgium, based on linked administrative databases.
Br J Clin Pharmacol. 2019;85:827–37.
62. Whittaker E, George Kernohan W, Hasson F, Howard V, McLaughlin D. The
palliative care education needs of nursing home staff. Nurse Educ Today.
2006;26:501–10.
63. Hanson LC, Reynolds KS, Henderson M, Pickard CG. A Quality
Improvement Intervention to Increase Palliative Care in Nursing Homes. J
Palliat Med. 2005;8:576–84.
64. Miller SC, Han B. End-of-Life Care in U.S. Nursing Homes: Nursing
Homes with Special Programs and Trained Staff for Hospice or
Palliative/End-of-Life Care. J Palliat Med. 2008;11:866–77.
65. Brazil K, Bédard M, Krueger P, Taniguchi A, Kelley ML, McAiney C, et
al. Barriers to providing palliative care in long-term care facilities.
Can Fam Physician. 2006;52:472–3.
66. Paque K, Ivanova I, Elseviers M, Stichele RV, Dilles T, Pardon K, et
al. Initiation of advance care planning in newly admitted nursing home
residents in Flanders, Belgium: A prospective cohort study. Geriatr
Gerontol Int. 2019;19:141–6.
67. Goossens B, Sevenants A, Declercq A, Van Audenhove C. Improving
shared decision-making in advance care planning: Implementation of a
cluster randomized staff intervention in dementia care. Patient Educ
Couns. 2019;
68. Deming WE. Critical Evaluations in Business and Management. Vol. 2.
Routledge, 2005; 520 p.
69. PDCA Cycle - What is the Plan-Do-Check-Act Cycle? | ASQ [Internet].
[cited 2020 Mar 20]. Available from: https://asq.org/quality-
resources/pdca-cycle
70. Wichmann AB, van Dam H, Thoonsen B, Boer TA, Engels Y, Groenewoud AS.
Advance care planning conversations with palliative patients: looking
through the GP’s eyes. BMC Fam Pract. 2018;19:184.
71. Scholten G, Bourguignon S, Delanote A, Vermeulen B, Van Boxem G,
Schoenmakers B. Advance directive: does the GP know and address what the
patient wants? Advance directive in primary care. BMC Med Ethics.
2018;19:58.
72. Smallwood N, Currow D, Booth S, Spathis A, Irving L, Philip J.
Attitudes to specialist palliative care and advance care planning in
people with COPD: a multi-national survey of palliative and respiratory
medicine specialists. BMC Palliat Care. 2018;17:115.

244
73. Scheerens C, Pype P, Cauwenberg JV, Vanbutsele G, Eecloo K, Derom E,
et al. Early-Integrated Palliative home care and standard care for end-
stage COPD (EPIC): A Phase II pilot RCT testing feasibility,
acceptability and effectiveness. J Pain Symptom Manage [Internet]. 2019
[cited 2019 Nov 6];0. Available from:
https://www.jpsmjournal.com/article/S0885-3924(19)30532-9/abstract
74. Scheerens C, Deliens L, Van Belle S, Joos G, Pype P, Chambaere K. “A
palliative end-stage COPD patient does not exist”: a qualitative study
of barriers to and facilitators for early integration of palliative home
care for end-stage COPD. NPJ Prim Care Respir Med. 2018;28:23.
75. Paque K, Vander Stichele R, Elseviers M, Pardon K, Dilles T, Deliens
L, et al. Barriers and enablers to deprescribing in people with a life-
limiting disease: A systematic review. Palliat Med. 2019;33:37–48.
76. pallcare. Can big data be useful for palliative and end-of-life care?
Call for papers for a special issue of ‘Palliative Medicine’ [Internet].
EAPC Blog. 2019 [cited 2020 Mar 20]. Available from:
https://eapcnet.wordpress.com/2019/11/27/can-big-data-be-useful-for-
palliative-and-end-of-life-care-call-for-papers-for-a-special-issue-of-
palliative-medicine/
77. Abadie A. Semiparametric Difference-in-Differences Estimators. Rev
Econ Stud. 2005;72:1–19.
78. De Schreye R, Houttekier D, Deliens L, Cohen J. Developing indicators
of appropriate and inappropriate end-of-life care in people with
Alzheimer’s disease, cancer or chronic obstructive pulmonary disease for
population-level administrative databases: A RAND/UCLA appropriateness
study. Palliat Med. 2017;31:932–45.
79. Zorgnet-Icuro | [Internet]. [cited 2020 Mar 20]. Available from:
https://www.zorgneticuro.be/
80. VVSG Kennisnetwerk [Internet]. [cited 2020 Mar 20]. Available from:
https://www.vvsg.be/
81. VLOZO [Internet]. VLOZO. [cited 2020 Mar 20]. Available from:
http://www.vlozo.be/
82. Hardin KA, Meyers F, Louie S. Integrating Palliative Care in Severe
Chronic Obstructive Lung Disease. COPD J Chronic Obstr Pulm Dis.
2008;5:207–20.
83. Home | Domus Medica [Internet]. [cited 2020 Mar 20]. Available from:
https://www.domusmedica.be/
84. Accueil - SSMG [Internet]. [cited 2020 Mar 20]. Available from:
https://www.ssmg.be/
85. Institute of Medicine (voornaam). Dying in America: Improving Quality
and Honoring Individual Preferences Near the End of Life [Internet].
[cited 2016 Dec 1]. Available from:
https://www.nap.edu/read/18748/chapter/1
86. Lorenz KA, Lynn J, Dy SM, Shugarman LR, Wilkinson A, Mularski RA, et
al. Evidence for improving palliative care at the end of life: a
systematic review. Ann Intern Med. 2008;148:147–59.
245
87. Approaching death: improving care at the end of life--a report of the
Institute of Medicine. Health Serv Res. 1998;33:1–3.
88. Onthaal - RIZIV [Internet]. [cited 2016 Jun 6]. Available from:
http://www.riziv.fgov.be/nl/Paginas/default.aspx
89. Financiële toegankelijkheid van uw gezondheidszorg - RIZIV
[Internet]. [cited 2020 Feb 5]. Available from:
https://www.inami.fgov.be/nl/themas/kost-terugbetaling/financiele-
toegankelijkheid/Paginas/default.aspx
90. De geneeskundige verstrekkingen die uw ziekenfonds terugbetaalt -
RIZIV [Internet]. [cited 2020 Feb 5]. Available from:
https://www.riziv.fgov.be/NL/THEMAS/KOST-TERUGBETALING/DOOR-
ZIEKENFONDS/Paginas/default.aspx
91. Vandekerckhove S. Ouders baby Pia: ‘Blijft wrang dat we volle prijs
moesten betalen voor medicijn’ [Internet]. De Morgen. 2019 [cited 2020
Feb 5]. Available from: https://www.demorgen.be/gs-b4128fab
92. Appropriate care at the end of life [Internet]. [cited 2019 Oct 9].
Available from: /en/appropriate-care-at-the-end-of-life
93. Nyatanga B. Is death still a taboo subject in palliative care? Br J
Community Nurs. 2018;23:570.
94. Ngan OMY, Bergstresser SM, Sanip S, Emdadul Haque ATM, Chan HYL, Au
DKS. Cultural considerations in forgoing enteral feeding: A comparison
between the Hong Kong Chinese, North American, and Malaysian Islamic
patients with advanced dementia at the end-of-life. Dev World Bioeth.
2019;
95. Andrew EVW, Cohen J, Evans N, Meñaca A, Harding R, Higginson I, et
al. Social-cultural factors in end-of-life care in Belgium: a scoping of
the research literature. Palliat Med. 2013;27:131–43.
96. Slankamenac K, Rütsche N, Keller DI. Availability of advance
directives in the emergency department. Swiss Med Wkly. 2020;150:w20184.
97. Bakitas M, Lyons KD, Hegel MT, Balan S, Brokaw FC, Seville J, et al.
Effects of a palliative care intervention on clinical outcomes in
patients with advanced cancer: the Project ENABLE II randomized
controlled trial. JAMA. 2009;302:741–9.

246
Samenvatting van de belangrijkste bevindingen
1. Context
1.1 Het belang van gepaste levenseindezorg
De laatste tientallen jaren stijgt de levensverwachting wereldwijd.
Er worden ook relatief minder kinderen geboren, waardoor de gemiddelde
leeftijd van de bevolking stijgt. Dankzij toegenomen medische kennis
en nieuwe medische technologie kunnen veel dodelijke ziekten succesvol
worden behandeld. Hedendaagse hygiënemaatregelen bevorderen het succes
van medische ingrepen en medische noodingrepen zijn erg effectief. Met
die toegenomen effectiviteit, is ook het vertrouwen in de medische
wetenschap gegroeid. Nochtans zijn er nog steeds ziekten die niet
effectief behandeld kunnen worden, zoals kanker, Chronic Obstructive
Pulmonary Disease (COPD) en dementie. Het percentage mensen met een
dergelijke levensverkortende aandoening stijgt, naarmate de gemiddelde
leeftijd stijgt. Daarom wordt het steeds belangrijker onze
gezondheidszorg af te stemmen op mensen met dergelijke
levensbedreigende en ongeneeslijke aandoeningen, zodat ook zij gepaste
zorg krijgen.
1.2 Wat is gepaste levenseindezorg?
Maar wat is gepaste zorg voor mensen met een levensverkortende
aandoening? Om dat te weten, moeten we verwachte voordelen en nadelen
van een behandeling tegen elkaar afwegen. Het gezondheidsvoordeel van
een behandeling kan bijvoorbeeld toegenomen levensverwachting zijn,
of preventie van pijn, of het verhogen van comfort of zelfredzaamheid.

247
Mogelijke negatieve uitkomsten zijn onder andere de kans op sterven,
afname van levenskwaliteit, toegenomen pijn of symptoomlast.
Bij mensen met kanker, COPD of dementie kan in de laatste weken,
maanden of jaren van hun leven gepaste zorg verschuiven van louter
levensverlengende zorg naar meer aandacht voor comfortzorg en
palliatieve zorg. Palliatieve zorg is vooral gericht op
levenskwaliteit, symptoombestrijding en existentiële zorg, in
combinatie met levensverlengende behandelingen. Ook rouwzorg en zorg
voor mantelzorgers maken er deel van uit. Agressieve levensverlengende
behandelingen die de levenskwaliteit sterk verlagen (bijvoorbeeld
plotse ziekenhuisopname, chemotherapie of chirurgie kort voor het
overlijden) kunnen in dat geval ongepast zijn. Om gepaste zorg te
verlenen is het bovendien belangrijk dat palliatieve zorg op tijd
gestart wordt en dat de zorg gepland wordt volgens de wensen van de
patiënt.
Gepaste en ongepaste zorg bij het levenseinde wordt een steeds
belangrijker onderwerp in de Belgische en internationale
gezondheidsliteratuur. In 2017 publiceerde het Federaal Kenniscentrum
voor de Gezondheidszorg een rapport dat een grote bezorgdheid uitdrukt
voor ongepaste levenseindezorg in België. Uit dit rapport bleek dat
mensen met levensverkortende aandoeningen in België vaak behandelingen
en medicatie krijgen waarvan de positieve effecten de negatieve
effecten niet overstijgen. Dit is een bezorgdheid die ook
internationaal weerklank vindt. Meer en meer groeit de consensus dat
er te vaak agressieve of futiele zorg wordt geboden en te weinig
palliatieve zorg aan mensen met levensverkortende aandoeningen.
248
1.3 Gepaste zorg en het gezondheidszorgsysteem
Als we de gepastheid van zorg aan het levenseinde willen bestuderen,
kijken we eerst en vooral naar het gezondheidszorgsysteem in België
en welke zorg door dat systeem wordt aangeboden. De context van het
gezondheidszorgsysteem bepaalt immers welke behandelingen beschikbaar
zijn. In België is een ziekteverzekering verplicht. Terugbetaling door
de ziekteverzekering dekt een groot deel van de medische kosten van
alle Belgen. Op die manier bepaalt het Rijksinstituut voor Ziekte en
Invaliditeitsuitkering (RIZIV) in sterke mate welke zorg aangeboden
wordt door die zorg betaalbaar te maken.
Bovendien registreren de ziekenfondsen alle terugbetalingen die ze
doen en geven ze deze informatie door aan een centraal agentschap: het
Intermutualistisch Agentschap (IMA). Bij elke terugbetaling wordt
bijgehouden door wie ze werd voorgeschreven, wie de patiënt was, hoe
oud de patiënt was, waar die woonde en nog een heel aantal andere
gegevens over de patiënt en de voorschrijver. Als we toegang kunnen
krijgen tot deze data, krijgen we een scherp beeld van welke
levenseindezorg wordt geleverd in België op niveau van de volledige
populatie.
1.4 Kwaliteitsindicatoren
Hoe weten we welke levenseindezorg gepast is voor mensen met kanker,
COPD of dementie? Daarvoor kunnen we gebruik maken van
kwaliteitsindicatoren. Kwaliteitsindicatoren zijn 'goed gedefinieerde
en meetbare aspecten van de zorg'. Ze worden in veel contexten gebruikt
om kwaliteit te meten. Een voorbeeld in onze context is: "Het

249
percentage van de mensen met kanker, die chirurgie ondergingen in de
laatste 30 dagen voor hun overlijden". Zoals blijkt uit het voorbeeld
bestaat een goede kwaliteitsindicator uit (1) een teller: 'het aantal
mensen die chirurgie ondergingen', (2) een noemer: 'alle mensen die
stierven aan kanker' en (3) een specificatie over wanneer te meten,
in dit geval: de laatste 30 dagen voor overlijden. Dit laatste is niet
bij alle indicatoren van toepassing.
Het gaat hier om indicatoren op populatieniveau (bijvoorbeeld geldig
voor alle mensen die stierven aan kanker in België), eerder dan een
indicator van kwaliteitsvolle zorg op individueel niveau (van één
patiënt). Dit betekent ook dat een behandeling voor een individuele
patiënt gepast kan zijn (bijvoorbeeld chirurgie in de laatste 30 dagen
als pijnbestrijding); maar tegelijk een teken van ongepaste
levenseindezorg wanneer het bij te veel mensen voorkomt. Dat werpt
onmiddellijk de volgende vraag op: wat is 'te veel voorkomen'? Hoe
hoog mag een indicator van ongepaste zorg maximum zijn? Het doel is
immers niet 0 procent, want bij sommige mensen is de behandeling nog
steeds gepast.
Om die afweging te maken hebben we een vergelijkingsbasis of standaard
nodig. Een dergelijke standaard kan op verschillende manieren bepaald
worden, bijvoorbeeld vastgelegd door experten en/of beleidsmakers, of
gebaseerd zijn op huidige metingen van de praktijk. In dit onderzoek
kiezen we ervoor om de vastgestelde indicatorscores te vergelijken
tussen verschillende regio's en op basis van die vergelijking een
standaard op te stellen. Dit doen we bijvoorbeeld op het niveau van
de best scorende regio's. Zo komen we uiteindelijk tot een evaluatie
van gepastheid van levenseindezorg in België.

250
1.5 Doelstellingen en onderzoeksvragen
Het hoofddoel van dit onderzoek is het evalueren van het Belgische
gezondheidszorgsysteem in termen van gepastheid van levenseindezorg
bij mensen met dementie, COPD of kanker. Om dat te bereiken hebben we
vier doelen:
1. Indicatoren van gepaste en ongepaste levenseindezorg ontwikkelen
voor mensen met kanker, COPD of dementie.
2. Gegevens identificeren en gebruiken die deze indicatoren kunnen
meten voor de volledige Belgische bevolking.
3. De ontwikkelde indicatoren meten met de beschikbare gegevens.
Daarbij proberen we ook te kijken welke factoren de indicatorscores
beïnvloeden, om daarmee rekening houdend standaarden te ontwikkelen.
4. Trends beschrijven in de gepastheid van levenseindezorg tussen 2010
en 2015 in België.
2. Ontwikkeling van de kwaliteitsindicatoren
We ontwikkelden drie sets kwaliteitsindicatoren: één voor mensen met
kanker, één voor mensen met COPD en één voor mensen met dementie. Het
ontwikkelingsproces kende drie stappen:
1. Bestaande indicatoren identificeren in de literatuur;
2. Interviews met relevante experten om bijkomende indicatoren te
identificeren;
251
3. Expertpanels om alle kandidaat-indicatoren te evalueren en de
finale sets indicatoren samen te stellen.
We betrokken relevante experten van uiteenlopende disciplines, o.a.
huisartsen, pneumologen, neurologen, radiologen, oncologen en
palliatieve zorgspecialisten. Zowel verpleegkundigen als artsen
zetelden in de panels.
De finale beslissing tot het selecteren van een indicator gebeurde
steeds in consensus, volgens de RAND-UCLA Appropriateness Method. We
selecteerden enkel indicatoren die gemeten kunnen worden op
populatieniveau in België met ziekteverzekeringsgegevens, dit betekent
dat we beperkt zijn tot terugbetaalde behandelingen en medicatie. Dit
betekent dat een aantal belangrijke aspecten niet worden opgenomen als
indicator, waaronder communicatie tussen arts en patiënt, palliatieve
zorg door de huisarts of in een woonzorgcentrum en zorgplanning,
aangezien deze niet expliciet worden terugbetaald door de
ziekteverzekering.
Uiteindelijk werden 26 indicatoren geselecteerd voor mensen met
kanker, 28 voor mensen met COPD en 28 voor mensen met dementie. De
indicatoren werden ingedeeld in vijf inhoudelijke domeinen: agressieve
zorg, pijn en symptoom behandeling, palliatieve zorg, plaats van
verzorging en overlijden, en coördinatie en continuïteit van zorg.
Volgende tabel bevat van elke indicatorenset twee voorbeelden.
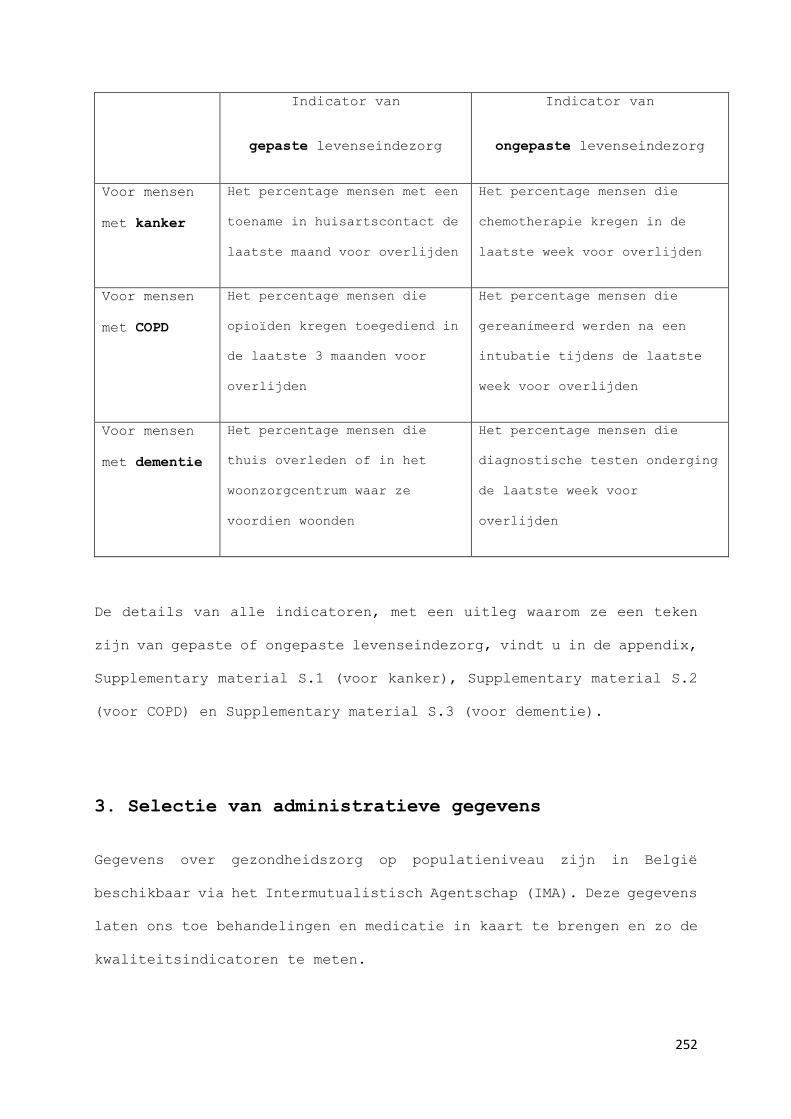
252
Indicator van
gepaste levenseindezorg
Indicator van
ongepaste levenseindezorg
Voor mensen
met kanker
Het percentage mensen met een
toename in huisartscontact de
laatste maand voor overlijden
Het percentage mensen die
chemotherapie kregen in de
laatste week voor overlijden
Voor mensen
met COPD
Het percentage mensen die
opioïden kregen toegediend in
de laatste 3 maanden voor
overlijden
Het percentage mensen die
gereanimeerd werden na een
intubatie tijdens de laatste
week voor overlijden
Voor mensen
met dementie
Het percentage mensen die
thuis overleden of in het
woonzorgcentrum waar ze
voordien woonden
Het percentage mensen die
diagnostische testen onderging
de laatste week voor
overlijden
De details van alle indicatoren, met een uitleg waarom ze een teken
zijn van gepaste of ongepaste levenseindezorg, vindt u in de appendix,
Supplementary material S.1 (voor kanker), Supplementary material S.2
(voor COPD) en Supplementary material S.3 (voor dementie).
3. Selectie van administratieve gegevens
Gegevens over gezondheidszorg op populatieniveau zijn in België
beschikbaar via het Intermutualistisch Agentschap (IMA). Deze gegevens
laten ons toe behandelingen en medicatie in kaart te brengen en zo de
kwaliteitsindicatoren te meten.

253
Bovendien kunnen we de gegevens van het IMA linken aan gegevens van
het Kankerregister en van Statistics Belgium, die beide ook op
nationaal niveau gegevens verzamelen. In ons onderzoek hebben we dit
gedaan en zo beschikken we niet alleen over gegevens over alle
terugbetaalde behandelingen en medicatie, met informatie over waar en
door wie ze verstrekt werden, maar ook over ziekenhuisbezoeken,
kankerdiagnoses, doodsoorzaken en een groot aantal socio-demografische
variabelen, zoals leeftijd, geslacht, gezinssamenstelling,
woonsituatie, opleidingsniveau en belastbaar inkomen; die door het
Kankerregister en Statistics Belgium verzameld worden. Voor het
verbinden van de databanken en het gebruik van de gegevens werd
goedkeuring verkregen van het Nationale Comité ter bescherming van de
Persoonlijke Levenssfeer.
Niettemin ontbreken er nog een aantal soorten gegevens die relevant
kunnen zijn voor gepastheid van levenseindezorg, onder andere gegevens
over voorkeuren van patiënten, informatie over arts-patiënt
communicatie en zorgplanning. We moeten er bij de interpretatie van
onze resultaten rekening mee houden dat we niet over die informatie
beschikken.
4. Indicator metingen
4.1 Gepaste zorg voor mensen met kanker
We maten de kwaliteitsindicatoren voor mensen met kanker bij alle
mensen overleden aan kanker in België in 2012, in totaal 26.464 mensen.
In vergelijking met andere landen vonden we in België minder mensen
die thuis sterven (29.5 procent van alle overledenen met kanker), of

254
gespecialiseerde palliatieve zorg krijgen, (47.1 procent van alle
overledenen met kanker) beide indicatoren van gepaste levenseindezorg.
De resultaten suggereren ook dat relatief veel mensen chemotherapie
wordt gegeven (17.2 procent in de laatste 30 dagen voor overlijden),
een teken van agressieve levenseindezorg. We merken dat leeftijd een
belangrijke rol speelt: jongere mensen scoren hoger op indicatoren van
zowel gepaste als ongepaste zorg: ze krijgen meer zorg in het algemeen.
Het gewest blijkt ook een rol te spelen: mensen in Wallonië en Brussel
krijgen vaker ziekenhuiszorg en minder vaak gepaste comfortzorg en
palliatieve zorg.
4.2 Gepaste zorg voor mensen met COPD
We maten alle indicatoren voor mensen met COPD bij alle mensen
overleden met COPD in België in 2015, in totaal 4.231 mensen. Van hen
werden relatief veel mensen gehospitaliseerd in de laatste 30 dagen
voor overlijden (60.0 procent) en relatief weinig mensen overleden met
COPD kregen gespecialiseerde palliatieve zorg (11.8 procent). Dit
duidt op relatief ongepaste levenseindezorg. We onderzochten ook de
verschillen tussen 14 gezondheidsregio's in Vlaanderen en Brussel en
vonden grote variatie tussen regio's, vooral op vlak van
gespecialiseerde palliatieve zorg (4.0 - 32.0 procent) en het
ondergaan van diagnostische testen (44.0 - 69.7 procent) Dit
suggereert dat er veel ruimte is voor verbetering voor gepaste
levenseindezorg voor mensen met COPD. Op basis van onze resultaten
stellen we voor als doelstelling dat minstens 23.3 procent van de
mensen met COPD gespecialiseerde palliatieve zorg zouden moeten
krijgen.

255
4.3 Gepaste zorg voor mensen met dementie
We maten alle indicatoren voor mensen met dementie bij alle mensen
overleden met dementie in België in 2015, in totaal 10.629 mensen.
68.4 procent van hen stierf thuis of in het woonzorgcentrum waar ze
woonden. Dit wordt gezien als een teken van gepaste levenseindezorg.
Relatief veel mensen werden naar spoed gebracht in de laatste 30 dagen
voor overlijden (25.6 procent). Dat is een teken van ongepaste
levenseindezorg. Er is ook veel variatie in gebruik van mogelijk
ongepaste of futiele medicatie in de laatste maand voor overlijden,
met name maagbeschermers (18 - 42 procent) en bloeddrukverlagende
middelen (40 - 53 procent). Ook hier berekenden we standaarden als
suggestie op basis van deze resultaten.
4.4 Trends 2010-2015
Ook al is 6 jaar een relatief korte periode, toch vonden we enkele
duidelijke evoluties in gepastheid van zorg bij alle drie de
ziektegroepen: (1) een duidelijke toename in huisartsencontact, een
teken van gepaste levenseindezorg, (2) een toename in het gebruik van
gespecialiseerde palliatieve zorg, een teken van gepaste
levenseindezorg. Dit vond evenwel bijna uitsluitend plaats in de
laatste 14 dagen voor overlijden; wat een teken is dat palliatieve
zorg vaak te laat wordt ingezet, en (3) een toename in spoedopnames
in de laatste 30 dagen voor overlijden, wat een teken is van ongepaste
levenseindezorg.

256
Voor mensen met COPD zagen we een toename van voorgeschreven opioïden
en een afname van het percentage mensen met herhaalde of langdurige
intubatie; beide indicatoren van gepaste levenseindezorg. We zagen ook
een toename van mensen opgenomen op een intensive care unit, wat een
teken is van ongepaste levenseindezorg.
Voor mensen met dementie nam het gebruik van een aantal typen medicatie
nog toe: bijvoorbeeld maagbeschermers, die vaak een teken zijn dat
mensen een grote hoeveelheid medicatie gebruiken, waarvan een aantal
mogelijk nutteloos zijn of zelfs gevaarlijke neveneffecten hebben.
5. Interpretatie en bedenkingen
We hebben de bestaande literatuur over gepastheid van levenseindezorg
sterk uitgebreid met de drie ontwikkelde sets kwaliteitsindicatoren.
Voor mensen met kanker waren al enkele kwaliteitsindicatoren
beschikbaar uit voorgaand onderzoek, waarop we ons ook gebaseerd
hebben. Vooral voor mensen met COPD of dementie deden we baanbrekend
werk door het identificeren van indicatoren van gepaste en ongepaste
levenseindezorg die op populatieniveau kunnen worden gemeten. Dit kan
levenseindezorg in het algemeen in België helpen verbeteren. Bij de
ontwikkeling van de indicatoren hebben we praktijk-experten ingezet.
Dat zorgt ervoor dat onze indicatorensets dicht aansluiten bij het
werkveld en in grote mate herkenbaar zijn voor zorgverleners en
beleidsmakers. Bovendien is uit recent onderzoek gebleken dat onze
indicatoren wetenschappelijk relevant zijn en ook in andere contexten
(bijvoorbeeld in andere landen) opnieuw gemeten kunnen worden.

257
Ook op vlak van het linken en gebruiken van administratieve data (van
IMA, Statistics Belgium en het Kankerregister) deden we baanbrekend
werk. We hebben aangetoond dat het linken van databanken mogelijk is
en dat de resulterende data kunnen gebruikt worden om
gezondheidszorggebruik te meten op populatieniveau in België. Een
groot voordeel van het gebruiken van gegevens van de ziekteverzekering
is dat deze dataverzameling bijzonder effectief is: het is niet nodig
kwetsbare mensen aan het levenseinde actief te bevragen. Ook levert
ze gedetailleerde gegevens op over alle mensen, inclusief moeilijk
bereikbare of bevraagbare groepen, bijvoorbeeld door taal- of
culturele barrières. Het gebruik van dergelijke gegevens is uiterst
geschikt voor het onderzoeken van kwetsbare groepen, zoals mensen aan
het levenseinde.
Werken met experten voor de ontwikkeling van indicatoren heeft echter
ook het nadeel dat de experten vertrekken van de huidige praktijk en
dus mogelijk ook minder kritisch staan tegenover hun eigen praktijk
en minder mogelijkheden zien die ze zelf momenteel niet toepassen.
Bovendien werden bij de ontwikkeling van de kwaliteitsindicatoren geen
patiënten en naasten van patiënten betrokken. In vergelijking met
medische experten kennen zij waarschijnlijk het gezondheidszorgsysteem
minder goed en kunnen ze minder op populatieniveau inschatten wat
gepaste of ongepaste levenseindezorg is. Het is echter waarschijnlijk
dat patiënten vanuit hun perspectief interessante nieuwe inzichten
zouden kunnen bieden op gepastheid van levenseindezorg.
Werken met ziekteverzekeringsgegevens en gegevens van Statistics
Belgium en het Kankerregister heeft ook nadelen: elke organisatie
verzamelt gegevens voor de eigen doelstellingen van de organisatie.

258
Welke gegevens verzameld worden en welke niet wordt vooraf bepaald.
We kunnen als onderzoekers niet de dataverzameling mee vormgeven en
de verzamelde gegevens afstemmen op onze onderzoeksvragen. In plaats
daarvan moeten we de te meten kwaliteitsindicatoren selecteren die
meetbaar zijn met de beschikbare data. We hebben a priori geen gegevens
over niet-terugbetaalde zorg.
6. Aanbevelingen voor praktijk, onderzoek en beleid
Wat zijn op basis van onze bevindingen de belangrijkste concrete
aanbevelingen om de kwaliteit van levenseindezorg in België voor
mensen met kanker, COPD of dementie te verbeteren?
6.1 Voor de zorgpraktijk
De hier ontwikkelde indicatoren kunnen worden gebruikt als deel van
een verbetercyclus, waar op basis van de resultaten prioriteiten voor
verandering en verandertrajecten worden gekozen. Daarna kunnen de
indicatoren opnieuw worden gemeten om vooruitgang te meten en nieuwe
prioriteiten te bepalen. We stellen bovendien voor dat
zorginstellingen samenwerken om hun resultaten samen te meten, te
vergelijken en zo verbeterdoelen te stellen. Onze tweede aanbeveling
voor de praktijk luidt: geef meer aandacht aan zorgplanning. Overleg
over de wensen van de patiënt kan helpen onnodige zorgtransities te
vermijden, als alle betrokken zorgverleners op de hoogte zijn van de
planning.
Voor hulpverleners die zorgen voor mensen met COPD is op basis van
onze resultaten een toename van gebruik van en tijdige opstart van
259
palliatieve zorg de belangrijkste aanbeveling. Voor hulpverleners die
zorg verlenen aan mensen met dementie raden we aan te werken aan het
afbouwen van medicatie die niet meer nuttig is. Dit gebeurt natuurlijk
in overleg met de patiënt, zodat voor iedereen duidelijk is waarom het
medicatiegebruik wordt afgebouwd.
6.2 Voor onderzoek
Onderzoekers bevelen we sterk aan onze indicatorensets opnieuw te
meten in andere contexten, internationaal, in andere
gezondheidszorgsystemen en andere populaties. Dit kan onze
indicatorensets alleen meer valide maken en bijsturen waar nodig.
We bevelen ook aan de indicatoren prospectief te gebruiken, om
verwachte veranderingen in het gezondheidszorgsysteem te evalueren.
Sinds kort wordt bijvoorbeeld raadpleging van een psycholoog
terugbetaald in België. Heeft die terugbetaling een effect op de
gepastheid van levenseindezorg?
Ten slotte bevelen we onderzoekers aan om verder standaarden te
ontwikkelen voor onze indicatorensets, op basis van andere bronnen dan
de vergelijking tussen zorgregio's. Voorkeuren van patiënten over hun
plaats van overlijden zou bijvoorbeeld een sterke basis kunnen zijn
voor standaarden voor indicatoren die de plaats van overlijden meten.
(bijvoorbeeld: het percentage mensen die thuis overlijden: hoeveel
procent van de mensen willen effectief zelf thuis overlijden?)
6.3 Voor het beleid
Ook voor Belgische beleidsmakers hebben we enkele aanbevelingen op
basis van onze resultaten:

260
Ten eerste: investeer in continuïteit van zorg. Dit kan op een aantal
manieren, bijvoorbeeld door woonzorgcentra te ondersteunen in het
uitbouwen van een palliatieve zorg beleid en expertise.
Ten tweede: ondersteun meer palliatieve zorg voor mensen met COPD. Dit
kan bijvoorbeeld door overleg op te zetten tussen experten die zorgen
voor mensen met COPD en palliatieve zorg specialisten.
Ten derde: ondersteun huisartsen in het afbouwen van medicatie aan het
levenseinde. Geef aan dat polymedicatie een probleem is, in onze
resultaten bleek dit vooral bij mensen met dementie, en hoe het kan
teruggebracht worden.
We bevelen beleidsmakers ook ten zeerst aan om het
gezondheidszorgsysteem te blijven evalueren met behulp van
kwaliteitsindicatoren en gezondheidszorggegevens, zoals we hier
demonstreerden. Dit gebeurt nu reeds door de onderzoekers van
healthybelgium.be over uiteenlopende thema's en het is een belangrijk
initiatief dat zeker nog kan uitgebreid worden.
Onze laatste aanbeveling aan beleidsmakers is mogelijk de
belangrijkste: gebruik terugbetaling van behandeling en medicatie om
gepaste levenseindezorg aan te moedigen. Momenteel wordt palliatieve
zorg door huisartsen of in woonzorgcentra bijvoorbeeld niet expliciet
terugbetaald. Wanneer dit wel zo zou zijn, zouden beleidsmakers een
meer rechtstreekse positieve impact kunnen hebben op de kwaliteit van
levenseindezorg in België. Het gezondheidszorgsysteem is immers de
context waarbinnen alle zorg plaats vindt en het definieert de
mogelijkheden waaruit artsen en patiënten kiezen voor hun optimale
behandeling. We geloven dat de overheid een verantwoordelijkheid heeft

261
om een performant systeem op te zetten dat gepaste zorg terugbetaalt
en aanmoedigt, en dit vooral voor de meest kwetsbare mensen in de
bevolking, zoals mensen aan het levenseinde.

262
Curriculum vitae and list of
publications

263
Curriculum vitae
Robrecht De Schreye was born on May 9th 1984. He graduated in 2010 as
Master in Philosophy and Master of Science in Psychology at KULeuven.
In 2014 he joined the End-of-Life Care Research Group at VUB, where
he worked as a doctoral researcher on the FWO-project A population-
level evaluation of the quality and cost-effectiveness of end-of-life
care. He was supervised by Prof dr. Joachim Cohen, Prof. dr. Tinne
Smets, Prof. dr. Luc Deliens and Prof. dr. Dirk Houttekier. From 2018
until 2020, he was involved in the research project "Het Vlaams
indicatoren project woonzorgcentra", developing quality indicators for
Flemish nursing homes and collaborated on several other projects
within the End-of-Life Care research group involving the use of
administrative data and quality indicators. He also collaborated as
researcher in an international working group on the use of big data
in end-of-life care research. He presented his research at several
national and international conferences, including the 2017 Health
affairs conference in Washington DC. He is currently working for
Sciensano, at the Health Services research department.

264
List of publications
1) Maetens A, De Schreye R, Faes K, Houttekier D, Deliens L,
Gielen B, et al. Using linked administrative and disease-
specific databases to study end-of-life care on a population
level. BMC Palliat Care. 2016;15:86. IF2018:3.12, Q1
2) De Schreye R, Houttekier D, Deliens L, Cohen J. Developing
indicators of appropriate and inappropriate end-of-life care in
people with Alzheimer’s disease, cancer or chronic obstructive
pulmonary disease for population-level administrative
databases: A RAND/UCLA appropriateness study. Palliat Med.
2017;31:932–45. IF2017:3.29, Q1
3) De Schreye R, Smets T, Deliens L, Annemans L, Gielen B, Cohen
J. Appropriateness of End-of-Life Care in People Dying From
COPD. Applying Quality Indicators on Linked Administrative
Databases. J Pain Symptom Manage. 2018;56:541-550.e6.
IF2018:1.626, Q1
4) De Schreye R, Smets T, Annemans L, Deliens L, Gielen B, De
Gendt C, et al. Applying Quality Indicators For Administrative
Databases To Evaluate End-Of-Life Care For Cancer Patients In
Belgium. Health Aff Proj Hope. 2017;36:1234–43. IF2018: 4.381,
Q1
5) De Schreye R, Smets T, Deliens L, Annemans L, Gielen B, Cohen
J. Appropriateness of End-of-Life Care in People Dying With
Dementia: Applying Quality Indicators on Linked Administrative
Databases. J Am Med Dir Assoc. 2020; IF2018:4.899, Q1
6) De Schreye R, Deliens L, Annemans L, Gielen B, Smets T, Cohen J.
Trends in appropriateness of end-of-life care in people with
cancer, COPD or with dementia measured with population-level
administrative data: do quality indicators improve over time?
Palliative Medicine, Submitted
265
7) Maetens A, Beernaert K, De Schreye R, Faes K, Annemans L, Pardon
K, et al. Impact of palliative home care support on the quality
and costs of care at the end of life: a population-level matched
cohort study. BMJ Open. 2019;9:e025180. IF2018:2.42, Q1
8) Paque K, De Schreye R, Elseviers M, Vander Stichele R, Pardon K,
Dilles T, et al. Discontinuation of medications at the end of
life: A population study in Belgium, based on linked
administrative databases. Br J Clin Pharmacol. 2019;85:827–37.
IF2018:3.867, Q1
266
Appendix
Supplementary material S.1: Indicatoren voor (on)gepaste zorg aan
het levenseinde bij mensen met kanker via administratieve data
Volgende kenmerken vindt men bij elke indicator terug:
- Een inhoudelijke beschrijving van de indicator in de titel
- De bron van de indicator, uit literatuur of uit expertinterview
- De reden waarom de indicator een teken is van gepaste of ongepaste
zorg
- De teller en noemer om de indicator te berekenen
- Exclusie van subpopulaties waarvoor de indicator niet geldt
- De operationalisering van de indicator in de IMA-databank
- Een norm/richtcijfer voor de score op deze indicator (waar
mogelijk)
Terminologie
Een aantal begrippen worden regelmatig herhaald en zijn geen standaard
taalgebruik. Van deze termen geven we hier een korte verklaring. Het
is nuttig om deze vooraf door te nemen.
1. Reden: Wanneer we bij ‘reden’ spreken over de motivatie om een
bepaalde indicator op te nemen als teken van gepaste of ongepaste
zorg, is dat steeds bedoeld op geaggregeerd niveau. Een indicator
geldt dus niet voor elke mens (persoon/patiënt) in elke situatie. De
indicatoren worden op populatieniveau gemeten en zeggen dus iets over
het voorkomen van bepaalde zorgpraktijken in België.
2. De variabele ‘nomenclatuurcode’ is een variabele in de IMA-databank
“gezondheidszorgen”, die alle nomenclatuurcodes van terugbetaalde
medische handelingen bevat. Als zodanig wordt hij vaak gebruikt in de
operationalisering van indicatoren voor gepaste of ongepaste zorg.
3. De variabele ‘productcode’ is een variabele uit de IMA–databank
“farmanet”, die alle productcodes van terugbetaalde medicijnen (op
voorschrift) bevat. Als zodanig wordt hij vaak gebruikt in de
operationalisering van indicatoren voor gepaste of ongepaste zorg.
6. Norm/richtcijfer is veelal niet vastgelegd. Ze kan echter worden
vastgelegd op basis van de waargenomen verdelingen (bijvoorbeeld op
basis van best practice examples, bijvoorbeeld de beste 10%). In de
lijst is dit aangegeven met “nog te bepalen”.

267
A. Thema: Afwezigheid van agressieve zorg voor het
levenseinde
A.1. Indicator “Aantal mensen die één of meerdere chemotherapie-
behandelingen ontvingen binnen een vastgelegde periode kort voor het
levenseinde.”
- Bron: (Earle et al., 2003; Grunfeld et al., 2006);(Prigerson et al.,
2015)
- Reden: Een hoog percentage mensen met een kort interval tussen de
laatste chemotherapie-behandeling en het overlijden is een indicator
voor therapeutische hardnekkigheid en dus voor een lage zorg- en
levenskwaliteit aan het levenseinde. Chemotherapie heeft ernstige
bijwerkingen en is geassocieerd met een gemiddeld lagere
levenskwaliteit. Bovendien duidt dergelijke behandeling kort voor het
overlijden op een tekort aan fysieke en psychologische begeleiding
voor het levenseinde. Dit geldt voor alle vormen van chemotherapie die
momenteel gebruikt worden.
- Teller: Het aantal mensen die een chemotherapiebehandeling krijgen
in de laatste x dagen voor het overlijden. Meetmomenten zullen zijn:
14 dagen, 30 dagen, 90 dagen en 180 dagen voor overlijden.
- Noemer: Het totaal aantal mensen overleden met kanker.
- Exclusie: mensen zonder kanker.
- Operationalisering in IMA data:
1. Voor intraveneuze chemotherapie: Binnen de variabele
‘nomenclatuurcode’ identificeren we de codes die overeenkomen met de
verschillende behandelingen chemotherapie (cytostatica). De variabele
‘nomenclatuurcode’ wordt geordend volgens de variabele ‘datum’. Het
verschil in aantal dagen tussen de laatste behandeling met chemo en
het overlijden vormt een nieuwe variabele. We creëren een nieuwe
binaire variabele, die 1 scoort als het aantal dagen =< x en 0 als het
aantal dagen >x. (waarbij x volgende waarden kan aannemen: 14, 30, 90
en 180)
2. Voor orale chemotherapie: Binnen de variabele ‘nomenclatuurcode’
identificeren we de codes die overeenkomen met de verschillende
behandelingen chemotherapie (cytostatica). De variabele
‘nomenclatuurcode’ wordt geordend volgens de variabele ‘datum’. Het
verschil in aantal dagen tussen de meest recente datum van behandeling
en de datum voor overlijden vormt een nieuwe variabele. We creëren een
nieuwe binaire variabele, die 1 scoort als het aantal dagen =< (x+30)
en 0 als het aantal dagen >(x+30). (waarbij x volgende waarden kan
aannemen: 14, 30, 90 en 180) We tellen 30 dagen bij om het verschil
tussen de datum van overschrijving en de laatste orale behandeling in
rekening te brengen.

268
- Norm/richtcijfer: Nog te bepalen. Earle et al. (2005) leggen het
richtcijfer (in de VS) op <10% die nog chemo krijgt in de laatste 14
dagen.
A.1b. Indicator “Het gemiddelde interval tussen de laatste
chemotherapie-behandeling en het levenseinde (uitgedrukt in aantal
dagen)”
- Bron: (Earle et al., 2003; Grunfeld et al., 2006);
- Reden: Een hoog percentage van mensen met een kort interval tussen
de laatste chemotherapie-behandeling en het overlijden is een
indicator voor therapeutische hardnekkigheid en dus voor een lage
zorg- en levenskwaliteit aan het levenseinde. Chemotherapie heeft
ernstige bijwerkingen en is geassocieerd met een gemiddeld lagere
levenskwaliteit. Bovendien duidt dergelijke behandeling kort voor het
overlijden op een tekort aan fysieke en psychologische begeleiding
voor het levenseinde. Dit geldt voor alle vormen van chemotherapie die
momenteel gebruikt worden.
- Teller: Het aantal dagen tussen de laatste chemotherapiebehandeling
en het overlijden van de mens.
- Noemer: Het totaal aantal mensen overleden met kanker.
- Exclusie: mensen zonder kanker.
- Operationalisering in IMA data:
1. Voor intraveneuze chemotherapie: Binnen de variabele
‘nomenclatuurcode’ identificeren we de codes die overeenkomen met de
behandeling chemotherapie (cytostatica). De variabele
‘nomenclatuurcode’ wordt geordend volgens de variabele ‘datum’. Het
verschil in aantal dagen tussen de meest recente datum van behandeling
en de datum van overlijden vormt een nieuwe variabele. We delen de
waarde van deze variabele door Het totaal aantal mensen overleden met
kanker.
2. Voor orale chemotherapie: Binnen de variabele ‘nomenclatuurcode’
identificeren we de codes die overeenkomen met de verschillende
behandelingen chemotherapie (cytostatica). De variabele
‘nomenclatuurcode’ wordt geordend volgens de variabele ‘datum’. De
meest recente datum van behandeling wordt afgetrokken van de datum van
overlijden. Daarna worden nog 30 dagen extra afgetrokken, om het
verschil tussen de datum van overschrijving en de laatste orale
behandeling in rekening te brengen. De uitkomst vormt een nieuwe
variabele. We delen de waarde van deze variabele door Het totaal aantal
mensen overleden met kanker.

269
- Norm/richtcijfer: Karim et al.: 35,6% van patiënten heeft 60 dagen
of minder in Saudi-Arabië
A. 2. Indicator “Het aantal mensen die een nieuwe chemotherapie-lijn
opgestart krijgen kort voor het levenseinde”
- Bron: (Earle et al., 2003; Grunfeld et al., 2006);
- Reden: Een hoog percentage van mensen met een kort interval tussen
het beginnen van een nieuwe chemotherapie-lijn en het overlijden is
een indicator voor therapeutische hardnekkigheid en dus voor een lage
zorg- en levenskwaliteit aan het levenseinde. Chemotherapie heeft
ernstige bijwerkingen en is geassocieerd met een gemiddeld lagere
levenskwaliteit. Bovendien duidt dergelijke behandeling kort voor het
overlijden op een tekort aan fysieke en psychologische begeleiding
voor het levenseinde.
- Teller: Aantal mensen die een nieuwe chemotherapie-lijn starten, x
dagen of minder voor het overlijden. Meetmomenten zullen zijn: 14
dagen, 30 dagen, 90 dagen en 180 dagen voor overlijden.
- Noemer: Het totaal aantal mensen overleden met kanker.
- Exclusie: mensen zonder kanker.
- Operationalisering in IMA data: Binnen de variabelen
‘nomenclatuurcode’ identificeren we de codes die overeenkomen met de
behandeling chemotherapie (cytostatica). We identificeren op basis van
nomenclatuurcode de opstart van een nieuwe behandeling: dezelfde code
komt in de voorbije twee weken niet voor. Vervolgens vergelijken we
de datum van het eerste voorkomen van die code met de datum van
overlijden. We berekenen het verschil tussen beide en vergelijken dat
met de vastgelegde grens (14 dagen, 30 dagen, 90 dagen en 180 dagen
voor overlijden). Er wordt voor elke vastgelegde grens een nieuwe
binaire variabele aangemaakt. Als het verschil in aantal dagen gelijk
aan of minder is dan x (variërend van 14, 30, 90 tot 180), scoort deze
variabele 1, anders 0.
- Norm/richtcijfer: Earle et al. (2005) leggen het richtcijfer (in de
VS) op <2% die een nieuwe chemotherapie-lijn opgestart krijgt in de
laatste 30 dagen.
A.3. Indicator “Het aantal mensen die sondevoeding of intraveneuze
(parenterale) voeding kregen in de laatste 30 dagen voor overlijden”
- Bron: (Sampson et al., 2009; Teno et al., 2011)

270
- Reden: Sondevoeding en intraveneus voeden zijn ineffectief in het
verlengen van de levensduur bij mensen zonder kanker in het
spijsverteringsstelsel. Bovendien hebben ze een negatief effect op de
levenskwaliteit van de mens, vanwege een aantal complicaties.
(verhoogd risico op longontsteking, bewegingsbelemmering,
misselijkheid, diarree, …) Handmatig voeden is een alternatief dat
leidt tot een hogere levenskwaliteit, maar is niet altijd mogelijk.
Daarom is een relatief hoog percentage mensen die sondevoeding of
intraveneuze voeding krijgen kort voor het overlijden een indicator
van ongepaste zorg aan het levenseinde.
- Teller: (3 verschillende tellers, die elk een variatie van de
indicator zijn)
1. Het aantal mensen dat sondevoeding kreeg in de laatste 30 dagen
voor het overlijden, behalve mensen met kanker in het
spijsverteringsstelsel.
2. Het aantal mensen dat intraveneuze voeding kreeg in de laatste 30
dagen voor het overlijden, behalve mensen met kanker in het
spijsverteringsstelsel.
3. Het aantal mensen dat intraveneuze voeding of sondevoeding kreeg
in de laatste 30 dagen voor het overlijden, behalve mensen met kanker
in het spijsverteringsstelsel.
- Noemer: Het totaal aantal mensen overleden met kanker.
- Exclusie: mensen zonder kanker.
- Operationalisering in IMA data: Binnen de variabele
‘nomenclatuurcode’ identificeren we de codes die overeenkomen met de
behandeling sondevoeding en intraveneuze voeding. Er worden twee
nieuwe variabelen gecreëerd die binair aangeven of we de
respectievelijke nomenclatuurcodes terugvinden. Een derde variabele
geeft weer of een van beide behandelingen voorkwamen. We delen de
waarde van deze variabelen door het totaal aantal mensen overleden met
kanker.
- Norm/richtcijfer: Nog te bepalen.
A.4. Indicator “Het aantal mensen waarbij een derde lijn chemotherapie
werd ingezet”
- Bron: (Earle et al., 2003)
- Reden: Het opstarten van nieuwe lijnen chemotherapie na het niet
aanslaan van voorafgaande behandelingen kan een manier zijn om het
bespreken van een slechte prognose en het plannen van levenseindezorg
te vermijden. Wanneer het in een subpopulatie bij een relatief groot

271
aantal mensen voorkomt, is het dus een teken van ongepaste zorg aan
het levenseinde.
- Teller: Het aantal mensen met kanker dat minstens 3 chemotherapie-
lijnen ondergaat in de laatste 2 jaar voor overlijden (dat is de
maximumperiode met de beschikbare data).
- Noemer: Het totaal aantal mensen overleden met kanker.
- Exclusie: mensen zonder kanker.
- Operationalisering in IMA data: Binnen de variabele
‘nomenclatuurcode’ identificeren we de codes die overeenkomen met de
behandeling chemotherapie. We tellen het aantal episoden waarin
regelmatig wordt behandeld. Wanneer er een niet-behandelingsperiode
is van een maand of langer, veronderstellen we dat een nieuwe lijn
werd gestart. We identificeren alle mensen met 3 of meer afzonderlijke
lijnen chemotherapie.
- Norm/richtcijfer: Het percentage mensen met 3 of meer lijnen mag
maximum 20% bedragen. (Earle, 2003)
A.5. Indicator “Het aantal mensen dat Cisplatine kreeg bij mensen
ouder dan 80 jaar”
- Bron: expertinterview
- Reden: Cisplatine is een chemotherapieproduct dat niet geschikt is
voor personen ouder dan 80+ of voor sterk zorgafhankelijke personen,
omdat het gegeven wordt met 8 liter vocht. Wanneer het in die
subpopulatie toch gegeven wordt is het een sterke indicator van
ongepaste zorg aan het levenseinde.
- Teller: het aantal mensen van 80 jaar of ouder met kanker die
behandeld werden met cisplatine in de laatste 2 jaar voor overlijden.
(dat is de maximumperiode met de beschikbare data)
- Noemer: het totaal aantal mensen van 80 jaar of ouder overleden met
kanker.
- Exclusie: alle mensen zonder kanker, of mensen met kanker jonger dan
80 jaar.
- Operationalisering in IMA: Via de nomenclatuurcodes identificeren
we cisplatine. De leeftijd van overledenen is beschikbaar in het
demografische luik van de IMA-databank.
- Norm/richtcijfer: Nog te bepalen.

272
A.6. Indicator “Het aantal mensen waarbij diagnostische testen
(bloedafname, spirometrie, EKG, dialyse of radiografie) werden
afgenomen tijdens de laatste 30 dagen voor het overlijden”
- Bron: expertinterview
- Reden: Diagnostische testen zijn vaak belastend voor de patiënt.
Bovendien beïnvloeden ze de behandeling of de prognose niet meer,
voorbij een bepaald stadium. Daarom zijn ze een teken van futiele en
ongepaste zorg aan het levenseinde, wanneer ze bij een relatief groot
aantal mensen voorkomen kort voor het overlijden.
- Teller: het aantal mensen die onderworpen werden aan bloedafname,
spirometrie, EKG, dialyse of radiografie in de laatste 30 dagen voor
het overlijden.
- Noemer: Het totaal aantal mensen overleden met kanker.
- Exclusie: alle mensen zonder kanker.
- Operationalisering in IMA: Via de nomenclatuurcodes identificeren
we de verschillende diagnostische testen. We splitsen dit op in een
aantal variabelen, een per test. Voor elke test kan de variabele
verschillende waarden hebben: 0 bij geen diagnostische testen, 1 bij
1 of 2 diagnostische testen, 2 bij 3 of meer diagnostische testen.
- Norm/richtcijfer: Nog te bepalen.
A.7. Indicator “Het aantal mensen waarbij een port-a-cath wordt
geïnstalleerd in de laatste twee weken voor overlijden”
- Bron: expertinterview
- Reden: Het plaatsen van een port-a-cath is een belastende ingreep.
Wanneer hij kort voor het levenseinde wordt geïnstalleerd, is dat
bovendien een futiele ingreep, want de voordelen van een port-a-cath
tonen zich op langere termijn. Daarom stellen we dat het een teken is
van ongepaste zorg voor het levenseinde, als het kort voor het
overlijden bij een voldoende groot aantal mensen voorkomt.
- Teller: het aantal mensen met een port-a-cath installatie in de
laatste twee weken voor het overlijden.
- Noemer: Het totaal aantal mensen overleden met kanker. (per groep
afzonderlijk te berekenen)
- Exclusie: alle mensen zonder kanker.
- Operationalisering in IMA: Via de nomenclatuurcodes identificeren
we de installatie van een port-a-cath tijdens de twee weken voor

273
overlijden. We creëren een nieuwe binaire variabele die weergeeft of
de installatie al dan niet heeft plaatsgevonden.
- Norm/richtcijfer: Nog te bepalen.
A.8. Indicator “Het aantal mensen met langdurig per-oraal gebruik van
corticoïden tijdens het laatste jaar, 6 maanden, 30 dagen en laatste
7 dagen voor overlijden”
- Bron: expertinterview
- Reden: Permanent gebruik van corticoïden geeft een aantal
bijwerkingen, waaronder spierafbraak en suikerziekte. Op korte termijn
is het een effectief middel voor symptoombestrijding. Als corticoïden
gedurende lange tijd worden voorgeschreven en niet worden afgebouwd
kort voor het overlijden, is dat een indicator van ongepaste zorg voor
het levenseinde, als het bij een voldoende groot aantal mensen
voorkomt. We vergelijken dus het gebruik van corticoïden op lange
termijn met dat op korte termijn.
- Teller: het aantal mensen met een voorschrift voor per-oraal gebruik
van corticoïden. We stellen meetmomenten in op 2 jaar, 1 jaar, 6
maanden en 1 week voor het levenseinde.
- Noemer: Het totaal aantal mensen overleden met kanker.
- Exclusie: alle mensen zonder kanker.
- Operationalisering in IMA: Via de nomenclatuurcodes identificeren
we hoeveel perorale corticoïden werden voorgeschreven op verschillende
tijdstippen. Per subpopulatie vergelijken we de verschillende
meetmomenten.
- Norm/richtcijfer: Nog te bepalen.
A.9. Indicator “Het aantal mensen met longmetastasen die een
zuurstofbehandeling krijgen tijdens de laatste 2 jaar voor overlijden”
- Bron: expertinterview
- Reden: Bij mensen met longmetastasen heeft het toedienen van zuurstof
geen effect op levensduur of levenskwaliteit. We kunnen het dus
beschouwen als een indicator van ongepaste zorg, als het bij een
voldoende groot aantal mensen voorkomt.
- Teller: het aantal mensen overleden met longmetastasen die
zuurstofbehandeling krijgen toegediend.
- Noemer: het totaal aantal mensen overleden met longmetastasen.

274
- Exclusie: alle mensen overleden zonder longmetastasen.
- Operationalisering in IMA: Via de nomenclatuurcodes identificeren
we de behandeling zuurstoftoediening. Uit de data van de Stichting
Kankerregister identificeren we kankerpatiënten met longmetastasen.
We creëren een binaire variabele die van elke mens vaststelt of hij/zij
al dan niet zuurstofbehandeling krijgt toegediend.
- Norm/richtcijfer: Nog te bepalen.
A.10. Indicator “Het gemiddeld aantal voorschriften van anxiolytica
en antidepressiva tijdens het laatste jaar voor overlijden”
- Bron: expertinterview
- Reden: Antidepressiva en anxiolythica worden veel voorgeschreven in
België, vermoedelijk te veel. Hoe veel te veel is weten we niet exact,
maar een hoog percentage is een teken van ongepaste zorg. We kunnen
relatief vergelijken tussen zorgverstrekkers of regio’s.
- Teller: Het totaal aantal voorgeschreven antidepressiva en
anxiolythica bij mensen met kanker in een bepaalde zorgregio of bij
een bepaalde instelling tijdens het laatste jaar voor overlijden (dat
is de maximumperiode met de beschikbare data).
- Noemer: Het totaal aantal mensen in die onderzochte regio of
instelling met kanker.
- Exclusie: mensen overleden zonder kanker.
- Operationalisering in IMA data: We zoeken in de farmacologische
gegevens naar antidepressiva en anxiolythica en creëren twee nieuwe
variabelen die per mens weergeven of hij/zij er toegediend kreeg.
- Norm/richtcijfer: Nog te bepalen.
A.11. Indicator “Het aantal mensen dat chirurgie ondergaat 6, 2 of 1
maand(en) voor het overlijden”
- Bron: expertinterview
- Reden: chirurgie is erg belastend en dient indien nodig te worden
vermeden. Veel ingrepen zijn overtollig bij terminale mensen. Daarom
nemen we chirurgie ondergaan kort voor het overlijden als indicator
voor ongepaste zorg, als het bij een voldoende groot aantal mensen
voorkomt.
- Teller: Het aantal mensen met kanker die nog chirurgie ondergingen
in de laatste 6 maanden/2 maanden/1 maand voor overlijden.

275
- Noemer: Het totaal aantal mensen overleden met kanker.
- Exclusie: mensen zonder kanker.
- Operationalisering in IMA data: We zoeken in de gezondheidszorgdata
naar codes voor chirurgie en maken een nieuwe variabele die binair
aangeeft of iemand wel of niet chirurgie ondergaan heeft binnen de
vastgelegde periode voor overlijden. Meer dan 1 chirurgische ingreep
wordt niet expliciet geteld.
- Norm/richtcijfer: Nog te bepalen.
A.12. Indicator “Het aantal mensen met een bloedtransfusie tijdens de
laatste 2 maanden/1maand/2 weken voor overlijden”
- Bron: expertinterview
- Reden: Bloedtransfusie is erg belastend en dient indien nodig te
worden vermeden. Bovendien is het futiel bij mensen die zich in het
terminale stadium van een ziekte bevinden. Daarom nemen we
bloedtransfusie ondergaan kort voor het overlijden als indicator voor
ongepaste zorg, als het bij een voldoende groot aantal mensen voorkomt.
- Teller: Het aantal mensen met kanker die nog bloedtransfusie
ontvingen in de laatste 2, 1 maand(en) of 2 weken voor overlijden en
niet lijden aan een hematologische aandoening.
- Noemer: Het totaal aantal mensen overleden met kanker.
- Exclusie: mensen zonder kanker.
- Operationalisering in IMA data: We zoeken in de gezondheidszorgdata
naar codes voor bloedtransfusie en maken een nieuwe variabele die
binair aangeeft of iemand het wel of niet ontvangen heeft 2 maanden
voor overlijden.
- Norm/richtcijfer: Nog te bepalen.
B. Thema: Behandelen van pijn en fysieke symptomen
B.1. Indicator “Het aantal mensen die opioïden kregen voor
pijnbestrijding”
- Bron: (Bruera et al., 2004)
- Reden: Bij mensen met kanker vormt pijn het belangrijkste symptoom
dat de levenskwaliteit verlaagt. Opioïden vormen een hoofdbestanddeel
van pijnbestrijders. Daarom is een relatief groot percentage mensen
276
waarbij opioïden gebruikt wordt een teken van gepaste zorg aan het
levenseinde.
- Teller: Het aantal mensen met kanker met een voorschrift voor
opioïden in de laatste 3 maanden, 1 maand en 2 weken voor het
levenseinde.
- Noemer: Het totaal aantal mensen overleden met kanker.
- Exclusie: mensen zonder kanker.
- Operationalisering in IMA-data: Binnen de farmanet-databank
identificeren we de codes die overeenkomen met geneesmiddelen uit de
opioïdengroep. Voorbeelden zijn: morfine, codeïne, oxycodone
hydrochloride, fentanyl citraat.
- Norm/richtcijfer: Nog te bepalen.
B.2. Indicator “Het aantal mensen die radiotherapie kregen tegen
botmetastasen kort voor het levenseinde”
- Bron: (Di Staso et al., 2015; Grunfeld et al., 2006)
- Reden: Botmetastasen zijn erg pijnlijk en veel voorkomend bij
kankerpatiënten die het levenseinde naderen. Radiotherapie is een
effectieve methode om ze te bestrijden. Wanneer radiotherapie gebruikt
wordt bij een relatief groot aantal mensen is dat een indicator van
gepaste zorg bij het levenseinde.
- Teller: Het aantal mensen met kanker en botmetastasen dat
radiotherapie krijgt toegediend in de laatste 2 jaar voor overlijden.
- Noemer: Het aantal mensen met kanker en botmetastasen.
- Exclusie: mensen zonder kanker en botmetastasen.
- Operationalisering in IMA data: We creëren een nieuwe variabele die
het al dan niet voorgeschreven zijn van radiotherapie weergeeft,
gebaseerd op de nomenclatuurcodes. De diagnose botmetastasen wordt
geëxtraheerd uit de gekoppelde databank van het Belgisch
Kankerregister.
Norm/richtcijfer: Nog te bepalen.
B.3. Indicator “Het aantal mensen die sterke anti-emetica kregen tegen
misselijkheid en braken, ten gevolge van chemotherapie”
- Bron: (Grunfeld et al., 2006)

277
- Reden: Misselijkheid en braken zijn belangrijke nevenverschijnselen
bij nagenoeg alle vormen van chemotherapie. De bestrijding ervan is
standaard nodig, vooral bij mensen nabij het levenseinde. Wanneer
anti-emetica gebruikt worden bij een relatief groot aantal mensen is
dat een indicator van gepaste zorg bij het levenseinde.
- Teller: Het aantal mensen met kanker dat chemotherapie krijgt dat
anti-emetica krijgt toegediend in de laatste 2 jaar voor overlijden.
(de maximumperiode met de beschikbare gegevens)
- Noemer: Het aantal mensen die chemotherapiebehandelingen krijgen.
- Exclusie: mensen zonder kanker of die geen chemotherapie krijgen.
- Operationalisering in IMA data: We creëren een nieuwe variabele die
binair het al dan niet voorgeschreven zijn van anti-emetica weergeeft,
gebaseerd op de nomenclatuurcodes. Die bekijken we binnen de
subpopulatie die chemotherapie krijgt, gebaseerd op de nomenclatuur-
en productcodes die overeenstemmen met chemotherapie.
Norm/richtcijfer: Nog te bepalen.
B.4 Indicator “Het aantal mensen die behandeld werden met cytostatica
waarbij anti-emetica werden voorgeschreven in de laatste 2 jaar voor
overlijden”
- Bron: expertinterview
- Reden: Cytostatica worden bij een groot aantal mensen gebruikt en
zijn emetogene producten. Ze dienen dan ook standaard bestreden te
worden met anti-emetica om de levenskwaliteit van de betrokken mensen
zo hoog mogelijk te houden. Daarom is het gebruik van anti-emetica een
teken van gepaste zorg voor het levenseinde.
- Teller: Het aantal mensen met kanker die behandeld worden met
cytostatica en een voorschrift voor anti-emetica krijgen in de laatste
2 jaar voor overlijden.
- Noemer: Het totaal aantal mensen die behandeld worden met cytostatica
in de laatste 2 jaar voor overlijden.
- Exclusie: mensen zonder kanker of met kanker, die niet behandeld
worden met cytostatica.
- Operationalisering in IMA-data: eerst identificeren we mensen die
behandeld werden met cytostatica, dankzij de nomenclatuurcodes. Binnen
deze groep onderzoeken we dan wie van hen ook behandeld werd in de
opgegeven periode voor overlijden met anti-emetica.
- Norm/richtcijfer: Nog te bepalen.

278
B.5 Indicator “Het aantal mensen dat antalgische (of palliatieve)
radiotherapie kreeg als pijnstiller” als teken van gepaste zorg voor
mensen met kleincellige longkanker
- Bron: expertinterview
- Reden: Bij mensen met klein-cellige longtumoren wordt preventief
antalgische radiotherapie toegepast, ook palliatieve radiotherapie
genoemd, ter bestrijding van pijn. Daarom nemen we deze behandeling
aan als een teken van gepaste zorg kort voor het levenseinde, indien
ze bij een voldoende groot aantal mensen voorkomt.
- Teller: Het aantal behandelingen van antalgische radiotherapie bij
mensen met kleincellige longkanker.
- Noemer: Het totaal aantal mensen met kleincellige longkanker.
- Exclusie: mensen zonder kanker.
- Operationalisering in IMA-data: Terug te vinden in databank:
éénmalige bestraling of hersenbestraling is altijd pijnbestrijdend.
We vinden het terug in de variabele ‘nomenclatuurcode’ van de IMA
databank.
- Norm/richtcijfer: Nog te bepalen.
B.6 Indicator “Het aantal mensen dat neuropathische middelen in
combinatie met morfine krijgt als pijnstiller”
- Bron: expertinterview
- Reden: Bij een hoge dosis morfine horen altijd neuropathische
middelen om een combinatie te vormen. Als er enkel een hoge dosis
morfine gegeven wordt, is dat een teken van ongepaste zorg. Co-drugs
kunnen eenvoudig zijn, bijvoorbeeld paracetamol. We onderzoeken dus
het aantal mensen dat een combinatie krijgt aangeboden als teken van
gepaste zorg aan het levenseinde voor mensen met kanker.
- Teller: Het aantal mensen met kanker die een combinatie van
neuropathische middelen en morfine krijgt toegediend in de laatste 2
jaar voor overlijden.
- Noemer: Het aantal mensen met kanker die morfine krijgen toegediend.
- Exclusie: mensen zonder kanker en mensen met kanker die geen morfine
krijgen.
- Operationalisering in IMA-data: We creëren twee nieuwe variabelen:
een die binair aangeeft of iemand al dan niet morfine heeft gekregen

279
en een tweede die binair aangeeft of iemand neuropathische middelen
en morfine heeft gekregen.
- Norm/richtcijfer: Nog te bepalen.
B.7 Indicator “het aantal mensen die contact hadden met een psycholoog
in de laatste 2 maanden voor overlijden”
- Bron: expertinterview
- Reden: Psychologische ondersteuning is belangrijk voor mensen met
terminale aandoeningen. Professionele ondersteuning wordt sinds 2013
in sommige vormen terugbetaald. We vergelijken het gebruik 2 jaar voor
overlijden met dat korter voor het overlijden (2 maanden). Contact met
een psycholoog wordt gehanteerd als een teken van gepaste zorg voor
het levenseinde, indien het bij een voldoende groot aantal mensen
voorkomt.
- Teller: Het aantal mensen die contact hadden met een psycholoog in
de laatste 2 maanden voor overlijden en in de laatste 2 jaar voor
overlijden.
- Noemer: Het aantal mensen met kanker.
- Exclusie: mensen zonder kanker.
- Operationalisering in IMA-data: (enkel in data vanaf 2013) We creëren
twee nieuwe variabelen: eentje die binair aangeeft of iemand al dan
niet contact heeft gehad met een psycholoog de laatste 2 maanden voor
overlijden en eentje die hetzelfde aangeeft 2 jaar voor overlijden.
Vervolgens kijken we naar het verschil tussen beiden.
- Norm/richtcijfer: Nog te bepalen.
C. Thema: Het (tijdig) opstarten van palliatieve zorg
C.1 Indicator “Het aantal mensen die gespecialiseerde palliatieve zorg
ontvingen”
- Bron: (Bakitas et al., 2015; Earle et al., 2003)
- Reden: Palliatieve zorg is er expliciet op gericht gepaste zorg rond
het levenseinde te stimuleren. Het ontvangen van gespecialiseerde
palliatieve zorg valt samen met een verminderde kans op het ontvangen
van agressieve zorg kort voor het levenseinde. Wanneer palliatieve
zorg toegepast wordt bij een relatief groot aantal mensen is dat een
indicator van gepaste zorg bij het levenseinde.

280
- Teller: Het aantal mensen dat opgenomen werd op een palliatieve
eenheid van een ziekenhuis of gebruik maakt van een multidisciplinaire
thuisequipe of opgenomen werd in een palliatief dagcentrum
(afzonderlijk te berekenen) in de laatste 2 jaar voor overlijden.
- Noemer: Het totaal aantal mensen in de onderzochte populatie met
kanker.
- Exclusie: mensen zonder kanker.
- Operationalisering in IMA-data: We maken een binaire variabele die
aangeeft of iemand opgenomen werd op een palliatieve eenheid.
Daarnaast wordt een binaire variabele multidisciplinaire thuisequipe
en een binaire variabele palliatief dagcentrum aangemaakt via de
variabele ‘nomenclatuurcode’.
- Norm/richtcijfer: Nog te bepalen.
C.2 Indicator “Het aantal mensen dat gebruik maakt van de
ondersteuningsmaatregel ‘palliatief statuut”
- Bron: (Earle et al., 2003)
- Reden: Het aanvragen van het palliatieve statuut is vaak een teken
van gepaste zorg aan het levenseinde. Mensen die dit aanvragen krijgen
vaak kwaliteitsvolle ondersteuning door palliatieve experten en
huisarts. Daarom nemen we het toegekend krijgen van het palliatief
statuut op als een teken van gepaste zorg voor het levenseinde, indien
het bij een voldoende groot aantal mensen voorkomt.
- Teller: Het aantal mensen die het palliatief statuut krijgen
toegekend met kanker in de laatste 2 jaar voor overlijden.
- Noemer: Alle mensen met kanker.
- Exclusie: mensen zonder kanker.
- Operationalisering in IMA-data: uit de variabele ‘nomenclatuurcode’
van de IMA-databank identificeren we rechtstreeks wie het palliatief
statuut kreeg toegekend.
- Norm/richtcijfer: Nog te bepalen.
C.3 Indicator “Het aantal mensen dat gespecialiseerde palliatieve zorg
ontving of het palliatief statuut kreeg toegewezen minder dan 1 week
voor het overlijden”
- Bron: (Earle et al., 2003; Grunfeld et al., 2006; Magill and Senf,
1987)

281
- Reden: Gespecialiseerde palliatieve zorg is er expliciet op gericht
gepaste zorg rond het levenseinde te stimuleren. Het ontvangen van
gespecialiseerde palliatieve zorg valt samen met een verminderde kans
op het ontvangen van agressieve zorg kort voor het levenseinde. Een
opname kort voor het levenseinde is echter geen indicatie van gepaste
zorg, aangezien palliatieve zorg tijd vergt. Opname minder dan 1 week
voor het levenseinde bij een relatief groot aantal mensen is een
indicator van ongepaste zorg.
- Teller: Het aantal mensen dat opgenomen werd op een palliatieve
eenheid van een ziekenhuis of gebruik maakt van een multidisciplinaire
thuisequipe of opgenomen werd in een palliatief dagcentrum, of het
palliatief statuut krijgt toegekend minder dan 7 dagen voor het
overlijden. (afzonderlijk te berekenen)
- Noemer: Het totaal aantal mensen overleden met kanker.
- Exclusie: mensen zonder kanker.
- Operationalisering in IMA-data: We maken een binaire variabele die
aangeeft of iemand opgenomen werd op een palliatieve eenheid.
Daarnaast wordt een binaire variabele multidisciplinaire thuisequipe
en een binaire variabele palliatief dagcentrum aangemaakt via de
variabele ‘nomenclatuurcode’.
- Norm/richtcijfer: Nog te bepalen.
D. Thema 4: Plaats van overlijden en levenseindezorg
D.1. Indicator “Het aantal mensen met één of meer opnames op de
spoedafdeling van een ziekenhuis tijdens de laatste 6, 3 of 1 maand(en)
voor het overlijden”
- Bron: (Earle et al., 2003; Teno et al., 2011)
- Reden: Ziekenhuisopname in het algemeen en opname op een
spoedafdeling in het bijzonder zijn ingrijpende en belastende
ervaringen voor de mens en vaak ook futiel voor het bevorderen van de
overlevingskansen. Vanwege de negatieve invloed op de levenskwaliteit
kunnen we zeggen dat opname op een spoedafdeling in de laatste 6, 3
of 1 maand(en) voor het overlijden een teken is van ongepaste zorg,
wanneer het bij een relatief groot aantal mensen voorkomt.
- Teller: Het aantal mensen met kanker die minstens eenmaal werden
opgenomen op een spoedafdeling tijdens de laatste 6, 3 of 1 maand(en)
voor het overlijden.
- Noemer: Het totaal aantal mensen overleden met kanker.
- Exclusie: mensen zonder kanker.

282
- Operationalisering in IMA data: Binnen de variabele
‘nomenclatuurcode’ identificeren we de codes die overeenkomen met
opname op een spoedafdeling. Er wordt een nieuwe variabele gecreëerd
die aangeeft hoe vaak we de nomenclatuurcode terugvinden.
- Norm/richtcijfer: Nog te bepalen.
D.2. Indicator “Het aantal mensen met één of meer ziekenhuisopnames
tijdens de laatste 6, 3 of 1 maand(en) voor overlijden”
- Bron: (Earle et al., 2003; Teno et al., 2011)
- Reden: Ziekenhuisopname is een ingrijpende en belastende ervaring
voor de mens en vaak ook futiel voor het bevorderen van de
overlevingskansen. Vanwege de negatieve invloed op de levenskwaliteit
kunnen we zeggen dat ziekenhuisopname in de laatste 6, 3 of 1 maand(en)
voor het overlijden een teken is van ongepaste zorg, wanneer het bij
een relatief groot aantal mensen met kanker voorkomt.
- Teller: Het aantal mensen met kanker die meer dan eenmaal werden
opgenomen in het ziekenhuis tijdens de laatste 3 maanden voor het
overlijden.
- Noemer: Het totaal aantal mensen overleden met kanker.
- Exclusie: mensen zonder kanker.
- Operationalisering in IMA data: Binnen de variabele
‘nomenclatuurcode’ identificeren we de codes die overeenkomen met
ziekenhuisopname. Er wordt een nieuwe variabele gecreëerd die aangeeft
hoe vaak we de nomenclatuurcode terugvinden.
- Norm/richtcijfer: Nog te bepalen
D.3. Indicator “Het aantal mensen die in het ziekenhuis overlijden”
- Bron: (Earle et al., 2003; Grunfeld et al., 2006)
- Reden: Uit onderzoek blijkt dat een groot aantal mensen verkiest
thuis te overlijden. Toch gebeurt dit in de praktijk relatief weinig,
om verschillende redenen. In het ziekenhuis overlijden is dan de
tegenhanger: wie in het ziekenhuis overlijdt, doet dat vaak niet op
de zelf gekozen plaats en loopt bovendien een verhoogd risico op
ongepast agressieve zorg aan het levenseinde. Daarom benoemen we
overlijden in het ziekenhuis als een teken van ongepaste zorg, wanneer
het gebeurt bij een relatief groot aantal mensen.
- Teller: Het aantal mensen die in het ziekenhuis overlijden.

283
- Noemer: Het totaal aantal mensen met of kanker.
- Exclusie: mensen zonder kanker.
- Operationalisering in IMA data: Via de overlijdenscertificaten
identificeren we plaats van overlijden. Ter controle bekijken we of
mensen heel kort voor het overlijden al dan niet opgenomen zijn of
behandeld werden in het ziekenhuis. We vertalen dit naar een variabele
met een binaire variabele die aangeeft of iemand al dan niet in een
ziekenhuis overleden is.
- Norm/richtcijfer: Nog te bepalen
D.4 Indicator “Het aantal mensen die thuis overlijden”
- Bron: (Beccaro et al., 2006; De Roo et al., 2014; Earle et al.,
2003; Grunfeld et al., 2006)
- Reden: Uit onderzoek blijkt dat een groot aantal mensen verkiest
thuis te overlijden. Toch gebeurt dit in de praktijk relatief weinig,
om verschillende redenen. Het is gemiddeld een indicator van
kwaliteitsvolle zorg aan het levenseinde als een patiënt thuis kan
overlijden, in overeenstemming met de eigen wens. We kunnen in dit
onderzoek niet de wens van de individuele mens vaststellen, maar
aangezien een erg groot aantal van de mensen dit verkiest, beschouwen
we het gemiddeld als een positieve indicator voor gepaste zorg.
- Teller: Het aantal mensen die thuis overlijden.
- Noemer: Het totaal aantal mensen overleden met kanker.
- Exclusie: mensen zonder kanker.
- Operationalisering in IMA data: Via de overlijdenscertificaten
identificeren we plaats van overlijden. Ter controle bekijken we of
mensen heel kort voor het overlijden al dan niet opgenomen zijn of
behandeld werden in het ziekenhuis. We vertalen dit naar een variabele
met meerdere waarden die de verschillende mogelijkheden voor plaats
van overlijden aangeeft. Daaruit leiden we dan een binaire variabele
af die aangeeft of iemand al dan niet thuis overleden is.
- Norm/richtcijfer: Nog te bepalen.
D.5 Indicator “Het aantal mensen die thuis of in een WZC van residentie
overlijden”
- Bron: (Beccaro et al., 2006; De Roo et al., 2014; Earle et al.,
2003; Grunfeld et al., 2006)

284
- Reden: Uit onderzoek blijkt dat een groot aantal mensen kiest thuis
te overlijden, of in een woonzorgcentrum (WZC), als dat hun plaats van
residentie is. Het is gemiddeld een indicator van kwaliteitsvolle zorg
aan het levenseinde als een patiënt kan overlijden in overeenstemming
met de eigen wens. We kunnen in dit onderzoek niet de wens van de
individuele mens vaststellen, maar aangezien een erg groot aantal (%
op te zoeken) van de mensen dit verkiest, beschouwen we thuis of in
een WZC overlijden gemiddeld als een positieve indicator voor gepaste
zorg.
- Teller: Het aantal mensen die thuis wonen en thuis overlijden en het
aantal mensen die in een WZC wonen en in een WZC overlijden.
- Noemer: Het totaal aantal mensen overleden met kanker.
- Exclusie: mensen zonder kanker.
- Operationalisering in IMA data: Via de overlijdenscertificaten
identificeren we plaats van overlijden. Ter controle bekijken we of
mensen heel kort voor het overlijden al dan niet opgenomen zijn of
behandeld werden in het ziekenhuis. We vertalen dit naar een variabele
met meerdere waarden die de verschillende mogelijkheden voor plaats
van overlijden aangeeft. Daaruit leiden we dan een binaire variabele
af die aangeeft of iemand al dan niet thuis of in een WZC overleden
is.
- Norm/richtcijfer: Nog te bepalen
E. Thema: Coördinatie en continuïteit van de zorg
E.1 Indicator “Het aantal residenten van een woonzorgcentrum met een
opname in een ICU tijdens de laatste 6 of 3 maanden en 2 weken of 1
week voor overlijden”
- Bron: expertinterview
- Reden: Wanneer mensen van een woonzorgcentrum (WZC) komen en naar
een ICU moeten, is dat vaak een teken van ongepaste zorg. Ze zijn al
erg hulpbehoevend, dus ICU heeft doorgaans geen zin meer. Daarom nemen
we opname op een ICU voor mensen die overgeplaatst worden vanuit een
WZC als teken van ongepaste zorg voor het levenseinde, wanneer het bij
een voldoende groot aantal mensen voorkomt.
- Teller: Het aantal overgangen naar ICU van mensen die in een WZC
verblijven in de laatste 6 maanden, 3 maanden, 1 maand, 2 weken en 1
week voor het overlijden.
- Noemer: Het totaal aantal mensen met kanker die verblijven in een
WZC en die worden opgenomen op een ICU.

285
- Exclusie: mensen zonder kanker, of die niet in een WZC verblijven.
- Operationalisering in IMA data: We zoeken in de nomenclatuurcodes
de code voor ICU opname, we zoeken in de demografische data informatie
over verblijf in een WZC.
- Norm/richtcijfer: Nog te bepalen.
E.2 Indicator “Het aantal mensen met een gemiddelde toename van het
aantal huisartscontacten tijdens de laatste 30 dagen voor het
levenseinde”
- Bron: (Grunfeld et al., 2006)
- Reden: Uit onderzoek blijkt dat de ervaren levenskwaliteit van mensen
met een levensbedreigende ziekte toeneemt wanneer het
huisartsencontact de laatste 2 weken voor het overlijden toeneemt. Dit
kan verschillende oorzaken hebben, waarover we ons niet uitspreken.
We gebruiken dit als een indicator van gepaste zorg: als het contact
met de huisarts in de laatste 2 weken voor het overlijden toeneemt.
- Teller 1: Het gemiddeld aantal huisartscontacten per week over alle
mensen heen in de laatste twee weken voor het overlijden.
- Noemer 1: Het gemiddeld aantal huisartscontacten per week in de 180
dagen voorafgaand aan de twee laatste weken voor het overlijden.
- Teller 2: Het aantal mensen bij wie het gemiddeld aantal
huisartscontacten toenam in de laatste 2 weken voor overlijden.
- Noemer 2: Het totaal aantal mensen met kanker in de populatie.
- Exclusie: mensen zonder kanker.
- Operationalisering in IMA data: We gebruiken de nomenclatuurcodes
voor huisartsencontact. Voor de teller en de noemer tellen we deze
afzonderlijk en delen ze daarna door elkaar. De uitkomst van deze
breuk vormt een nieuwe variabele.
- Norm/richtcijfer: Een positieve indicatie van gepaste zorg
indien >1, een negatieve indien <1.
E.3 Indicator “Het gemiddeld aantal contacten met de huisarts of andere
eerste-lijns-zorgers tijdens de laatste 3 maanden voor overlijden”
- Bron: (Earle et al., 2003; Grunfeld et al., 2006; Magill and Senf,
1987)
- Reden: Uit onderzoek blijkt dat de ervaren levenskwaliteit van mensen
met een levensbedreigende ziekte toeneemt wanneer eerste lijnszorg een
belangrijke rol inneemt in de laatste levensweken. Bovendien wijst

286
contact met de eerstelijnszorg vaak ook op een goed contact tussen
eerstelijnszorg en specialisten. Daarom nemen we dit aan als een teken
van gepaste zorg, wanneer het bij een relatief groot aantal mensen
voorkomt.
- Teller: Het totaal aantal contacten met huisarts of
thuisverpleegkundige voor alle mensen in de 3 maanden voorafgaand
aan het overlijden.
- Noemer: Het totaal aantal overledenen met kanker.
- Exclusie: overledenen zonder kanker.
- Operationalisering in IMA data: We zoeken in de nomenclatuurcodes
de code voor huisartsencontact en voor thuisverpleging. Daarna tellen
we deze allemaal op om tot een totaalsom te komen.
- Norm/richtcijfer: Nog te bepalen.
E.4 Indicator “Het aantal mensen waarvoor een Multidisciplinair
Oncologisch Consult plaatsvond in de laatste twee jaar voor
overlijden”
- Bron: expertinterview
- Reden: Een MOC of POC (palliatief oncologisch consult) is een teken
dat er voldoende overleg is tussen de zorgverstrekkers en duidt zo op
een sterkere zorgkwaliteit. Het MOC kan worden teruggevonden in IMA-
data, het POC niet. Daarom nemen we het MOC op als indicator van
gepaste zorg voor het levenseinde, wanneer het bij een voldoende groot
aantal mensen voorkomt.
- Teller: Het aantal mensen met kanker waarvoor een MOC plaatsvond
tijdens de laatste 2 jaar voor overlijden.
- Noemer: Het totaal aantal mensen overleden met kanker.
- Exclusie: mensen zonder kanker.
- Operationalisering in IMA data: We zoeken in de nomenclatuurcodes
de code voor MOC. We tellen het aantal positieve cases en berekenen
zo hoe vaak het MOC gemiddeld voorkomt.
- Norm/richtcijfer: Nog te bepalen.
287
Referenties
Bakitas, M. A., T. D. Tosteson, Z. Li, K. D. Lyons, J. G. Hull, J. N.
Dionne-Odom, J. Frost, K. H. Dragnev, M. T. Hegel, A. Azuero,
and T. A. Ahles, 2015, Early Versus Delayed Initiation of
Concurrent Palliative Oncology Care: Patient Outcomes in the
ENABLE III Randomized Controlled Trial: J Clin Oncol, v. 33, p.
1438-45.
Beccaro, M., M. Costantini, P. Giorgi Rossi, G. Miccinesi, M. Grimaldi,
P. Bruzzi, and I. S. Group, 2006, Actual and preferred place of
death of cancer patients. Results from the Italian survey of the
dying of cancer (ISDOC): J Epidemiol Community Health, v. 60, p.
412-6.
Bruera, E., J. L. Palmer, S. Bosnjak, M. A. Rico, J. Moyano, C.
Sweeney, F. Strasser, J. Willey, M. Bertolino, C. Mathias, O.
Spruyt, and M. J. Fisch, 2004, Methadone versus morphine as a
first-line strong opioid for cancer pain: a randomized, double-
blind study: J Clin Oncol, v. 22, p. 185-92.
De Roo, M. L., G. Miccinesi, B. D. Onwuteaka-Philipsen, N. Van Den
Noortgate, L. Van den Block, A. Bonacchi, G. A. Donker, J. E.
Lozano Alonso, S. Moreels, L. Deliens, A. L. Francke, and E.
IMPACT, 2014, Actual and preferred place of death of home-
dwelling patients in four European countries: making sense of
quality indicators: PLoS One, v. 9, p. e93762.
Di Staso, M., G. L. Gravina, L. Zugaro, P. Bonfili, L. Gregori, P.
Franzese, F. Marampon, F. Vittorini, R. Moro, V. Tombolini, E.
Di Cesare, and C. Masciocchi, 2015, Treatment of Solitary Painful
Osseous Metastases with Radiotherapy, Cryoablation or Combined
Therapy: Propensity Matching Analysis in 175 Patients: PLoS One,
v. 10, p. e0129021.
Earle, C. C., E. R. Park, B. Lai, J. C. Weeks, J. Z. Ayanian, and S.
Block, 2003, Identifying potential indicators of the quality of
end-of-life cancer care from administrative data: J Clin Oncol,
v. 21, p. 1133-8.
Grunfeld, E., L. Lethbridge, R. Dewar, B. Lawson, L. F. Paszat, G.
Johnston, F. Burge, P. McIntyre, and C. C. Earle, 2006, Towards
using administrative databases to measure population-based
indicators of quality of end-of-life care: testing the
methodology: Palliat Med, v. 20, p. 769-77.
Magill, M. K., and J. Senf, 1987, A new method for measuring continuity
of care in family practice residencies: J Fam Pract, v. 24, p.
165-8.
Prigerson, H. G., Y. Bao, M. A. Shah, M. E. Paulk, T. W. LeBlanc, B.
J. Schneider, M. M. Garrido, M. C. Reid, D. A. Berlin, K. B.
Adelson, A. I. Neugut, and P. K. Maciejewski, 2015, Chemotherapy
Use, Performance Status, and Quality of Life at the End of Life:
JAMA Oncol, v. 1, p. 778-84.
Sampson, E. L., B. Candy, and L. Jones, 2009, Enteral tube feeding for
older people with advanced dementia: Cochrane Database Syst Rev,
p. CD007209.
Teno, J. M., S. L. Mitchell, S. K. Kuo, P. L. Gozalo, R. L. Rhodes,
J. C. Lima, and V. Mor, 2011, Decision-making and outcomes of
feeding tube insertion: a five-state study: J Am Geriatr Soc, v.
59, p. 881-6.

288
Supplementary material S.2: Indicatoren voor (on)gepaste zorg aan
het levenseinde bij mensen met COPD via administratieve data
Volgende kenmerken vindt men bij elke indicator terug:
- Een inhoudelijke beschrijving van de indicator in de titel
- De bron van de indicator, uit literatuur of uit expertinterview
- De reden waarom de indicator een teken is van gepaste of ongepaste
zorg
- De teller en noemer om de indicator te berekenen
- Exclusie van subpopulaties waarvoor de indicator niet geldt
- De operationalisering van de indicator in de IMA-databank
- Een norm/richtcijfer voor de score op deze indicator (waar
mogelijk)
Terminologie
Een aantal begrippen worden regelmatig herhaald en zijn geen standaard
taalgebruik. Van deze termen geven we hier een korte verklaring. Het
is nuttig om deze vooraf door te nemen.
1. Reden: Wanneer we bij ‘reden’ spreken over de motivatie om een
bepaalde indicator op te nemen als teken van gepaste of ongepaste
zorg, is dat steeds bedoeld op geaggregeerd niveau. Een indicator
geldt dus niet voor elke mens (persoon/patiënt) in elke situatie. De
indicatoren worden op populatieniveau gemeten en zeggen dus iets over
het voorkomen van bepaalde zorgpraktijken in België.
2. De variabele ‘nomenclatuurcode’ is een variabele in de IMA-databank
“gezondheidszorgen”, die alle nomenclatuurcodes van terugbetaalde
medische handelingen bevat. Als zodanig wordt hij vaak gebruikt in de
operationalisering van indicatoren voor gepaste of ongepaste zorg.
3. De variabele ‘productcode’ is een variabele uit de IMA–databank
“farmanet”, die alle productcodes van terugbetaalde medicijnen (op
voorschrift) bevat. Als zodanig wordt hij vaak gebruikt in de
operationalisering van indicatoren voor gepaste of ongepaste zorg.
6. Norm/richtcijfer is veelal niet vastgelegd. Ze kan echter worden
vastgelegd op basis van de waargenomen verdelingen (bijvoorbeeld op
basis van best practice examples, bijvoorbeeld de beste 10%). In de
lijst is dit aangegeven met “nog te bepalen”.

289
A. Thema: Afwezigheid van agressieve zorg voor het
levenseinde
A.1 Indicator “Het aantal mensen die Lung Volume Reduction Surgery
ondergingen tijdens de laatste 3 maanden voor het levenseinde”
- Bron: (Naunheim et al., 2006)
- Reden: Hoewel Lung Volume Reduction Surgery (LVRS) positief
curatief resultaat kan hebben voor mensen met gevorderde emfysemen
is het ook geassocieerd met beduidend meer morbiditeit (50%-60%
incidentie van ernstige complicaties) en mortaliteit. (>5% 90-dagen
mortaliteitsratio) Het is een typevoorbeeld van een invasieve
curatieve ingreep die wanneer ze kort voor het overlijden gebeurt
onder de noemer van therapeutische hardnekkigheid valt. Een relatief
hoog percentage van dit soort ingrepen kan dus beschouwd worden als
een indicator van ongepaste zorg.
- Teller: Het aantal mensen bij wie LVRS werd gedaan tijdens de laatste
3 maanden voor het overlijden.
- Noemer: Het totaal aantal mensen met COPD.
- Exclusie: mensen zonder COPD.
- Operationalisering in IMA-data: Binnen de variabele
‘nomenclatuurcode’ identificeren we de codes die overeenkomen met de
behandeling LVRS. We maken een nieuwe binaire variabele die aangeeft
of in het zorggebruik van de mens al dan niet LVRS voorkomt.
- Norm/richtcijfer: Nog te bepalen.
A.2 Indicator “Het aantal mensen die endotracheale intubatie of
tracheotomie kregen tijdens de laatste 12, 6, 3 of 1 maanden voor
overlijden”
- Bron: (Clini and Ambrosino, 2008);
- Reden: Endotracheale intubatie en tracheotomie zijn invasieve
methoden om het ademen te vergemakkelijken of mogelijk te maken. Het
zijn beide noodmaatregelen die kort voor het overlijden en wanneer ze
langere tijd worden toegepast duiden op ongepaste zorg voor het
levenseinde. In deze indicator houden we geen rekening met de duur van
de behandeling, dat doen we wel in een tweede indicator (zie verder).
- Teller:
1. Het aantal mensen waarbij endotracheale intubatie voorkomt tijdens
de laatste 365 dagen, 180 dagen, 90 dagen, 30 dagen voor het
overlijden.

290
2. Het aantal mensen waarbij tracheotomie voorkomt tijdens de laatste
365 dagen, 180 dagen, 90 dagen, 30 dagen voor het overlijden.
- Noemer: Het totaal aantal mensen met COPD.
- Exclusie: mensen zonder COPD.
- Operationalisering in IMA-data: Binnen de variabele
‘nomenclatuurcode’ identificeren we de codes die overeenkomen met
endotracheale intubatie en tracheotomie. We creëren een nieuwe
variabele die de prevalentie telt: het aantal mensen die één van beiden
of allebei ondergaan.
- Norm/richtcijfer: Nog te bepalen.
A.3 Indicator “Het aantal mensen die endotracheale intubatie kregen
gedurende langer dan 5 dagen aansluitend tijdens de laatste 12, 6, 3
of 1 maanden voor overlijden” voor mensen met COPD
- Bron: (Clini and Ambrosino, 2008); bevestigd door expertinterview.
- Reden: Endotracheale intubatie is een invasieve methode om het ademen
te vergemakkelijken of mogelijk te maken. Endotracheale intubatie
wordt bijvoorbeeld gebruikt tijdens operaties om de luchtwegen vrij
te houden. Het is een noodmaatregel die wanneer hij langere tijd
(langer dan 5 dagen) worden toegepast bij een relatief groot aantal
mensen duidt op ongepaste zorg voor het levenseinde.
- Teller: Het aantal mensen die langdurig (>5 dagen) endotracheale
intubatie tijdens de laatste 365 dagen, 180 dagen, 90 dagen, 30 dagen
voor het overlijden voor overlijden.
- Noemer:
1. Het totaal aantal mensen die endotracheale intubatie ondergingen
tijdens de laatste 2 jaar voor overlijden.
2. Het totaal aantal mensen met COPD.
- Exclusie: mensen zonder COPD.
- Operationalisering in IMA-data: Binnen de variabele
‘nomenclatuurcode’ identificeren we de codes die overeenkomen met
endotracheale intubatie. We creëren een nieuwe variabele die het
aantal mensen telt die endotracheale intubatie ondergingen. We maken
een bijkomende variabele die enkel de behandeling telt indien ze meer
dan 5 opeenvolgende dagen duurt.
- Norm/richtcijfer: Nog te bepalen.

291
A.4 Indicator “Het aantal mensen die sondevoeding of intraveneuze
(parenterale) voeding kregen in de laatste maand voor overlijden”
(zie Supplementary material S.1, indicator A.3)
A.5 Indicator “Het aantal mensen die benzodiazepinen kregen voor
angstbestrijding”
- Bron: (Battaglia et al., 2015; Ekström et al., 2014; Hill et al.,
2008)
- Reden: Benzodiazepinen worden onder andere gebruikt voor het
bestrijden van angst. Depressie en angst komen regelmatig voor bij
personen met COPD. Het gebruik van benzodiazepinen verhoogt echter het
risico op een sterke periode van hypercapnie (verhoogd CO2 gehalte in
het bloed). Volgens sommige bronnen is het gebruik van benzodiazepinen
bij een relatief groot percentage mensen met COPD een indicator van
ongepaste zorg.
- Teller: Het aantal mensen met COPD met een voorschrift voor
benzodiazepinen in de laatste 24, 12, 6 en 3 en 1 maand(en) voor het
levenseinde.
- Noemer: Het totaal aantal mensen met COPD.
- Exclusie: mensen zonder COPD.
- Operationalisering in IMA-data: Binnen de variabele ‘productcode’
identificeren we de codes die overeenkomen met geneesmiddelen uit de
benzodiazepinengroep. Voorbeelden zijn: Alprazolam,
Chloradiazepoxide, Clonazepam, diazepam, lorazepam, oxazepam,
prazepam.
- Norm/richtcijfer: Nog te bepalen.
A.6 Indicator “Het aantal mensen met één of meer opnames op de
spoedafdeling van een ziekenhuis tijdens de laatste 6, 3 of 1 maand(en)
voor het overlijden”
(zie Supplementary material S.1, indicator D.1)
A.7 Indicator “Het aantal mensen met één of meer ziekenhuisopnames
tijdens de laatste maand voor overlijden”
(zie Supplementary material S.1, indicator D.2)
292
A.8 Indicator “Het aantal mensen waarbij diagnostische testen
(bloedafname, spirometrie, EKG, dialyse of radiografie) werden
afgenomen tijdens de laatste 30 dagen voor het overlijden
(zie Supplementary material S.1, indicator A.6)
A.9 Indicator “Het aantal mensen waarvoor kinesitherapie wordt
opgestart tijdens de laatste 14 dagen voor het levenseinde”
- Bron: expertinterview
- Reden: Kinesitherapie is vaak belastend voor de mens, vooral bij
vergevorderde patiënten. Bovendien beïnvloedt het de prognose niet.
Bij mensen met COPD kort voor het overlijden is het opstarten van
kinesitherapie kort voor het levenseinde daarom een teken van
ongepaste zorg, wanneer het bij een voldoende groot aantal mensen
voorkomt.
- Teller: het aantal mensen die deelnemen aan kinesitherapie in de
laatste 14 dagen voor het overlijden en die in de periode 15-45 dagen
voor het overlijden niet deelnamen aan kinesitherapie.
- Noemer: het totaal aantal mensen met COPD.
- Exclusie: alle mensen zonder COPD.
- Operationalisering in IMA: Via de nomenclatuurcodes identificeren
we de behandeling kinesitherapie. We gieten ze in een binaire variabele
om aan te geven bij wie wel/niet kinesitherapie opgestart werd tijdens
de laatste 14 dagen en 15-45 dagen voor het overlijden.
- Norm/richtcijfer: Nog te bepalen.
A.10 Indicator “Het aantal mensen waarbij een port-a-cath wordt
geïnstalleerd in de laatste 14 dagen voor overlijden”
(zie Supplementary material S.1, indicator A.7)
A.11 Indicator “Het aantal mensen met langdurig per-oraal gebruik van
corticoïden tijdens het laatste jaar, 6 maanden, 30 dagen en laatste
14 dagen voor overlijden”
(zie Supplementary material S.1, indicator A.8)
A.12 Indicator “Het aantal mensen met herhaaldelijke intubatie tijdens
de laatste 12, 6, 3 en 1 maanden voor het overlijden”

293
- Bron: expertinterview
- Reden: Intubatie kan nuttig zijn voor accute zorg bij mensen met
COPD. Het is echter een belastende ingreep voor de patiënt. Wanneer
her-intuberen op korte termijn nodig is, betekent dat dat de eerste
intubatie niet voldoende effect had. Daarom hanteren we her-intubatie
als teken van ongepaste zorg aan het levenseinde, wanneer het bij een
voldoende groot aantal mensen voorkomt.
- Teller: Het aantal mensen met incidentie van herintubatie (2 of
meerdere keren geïntubeerd) tijdens de laatste 12, 6, 3 en 1 maanden
voor het overlijden.
- Noemer: Het totaal aantal mensen met COPD.
- Exclusie: mensen zonder COPD.
- Operationalisering in IMA-data: Binnen de variabele
‘nomenclatuurcode’ identificeren we de codes die overeenkomen met
intubatie. We creëren een nieuwe variabele die aangeeft of bij de
overledene de intubatie meer dan 1 keer voorkomt binnen de
verschillende meetperioden.
- Norm/richtcijfer: Nog te bepalen.
A.13 Indicator “Het aantal mensen dat een coronaire of abdominale
ingreep kreeg tijdens de laatste 6 maanden, 3 maanden, of 30 dagen
voor het overlijden”
- Bron: expertinterview
- Reden: Coronaire en abdominale operaties zijn enkel effectief op
langer termijn. Bovendien is de weerstand van de ernstige COPD-patiënt
onvoldoende om een dergelijke operatie te verdragen. Daarom beschouwen
we het krijgen van een coronaire of abdominale ingreep als teken van
ongepaste zorg voor het levenseinde, wanneer het bij een voldoende
groot aantal mensen voorkomt.
- Teller: Het aantal mensen met een coronaire of abdominale ingreep
6, 3 of 1 maanden voor het overlijden.
- Noemer: Het totaal aantal mensen met COPD.
- Exclusie: mensen zonder COPD.
- Operationalisering in IMA-data: Binnen de variabele
‘nomenclatuurcode’ identificeren we de codes die overeenkomen met een
coronaire of abdominale ingreep. We creëren een nieuwe variabele die
aangeeft of bij de overledene in de laatste 6, 3 of 1 maanden voor
overlijden een dergelijke ingreep heeft gekregen.

294
- Norm/richtcijfer: Nog te bepalen.
A.14 Indicator “Het aantal mensen met een reanimatie na intubatie
tijdens de laatste 30 dagen voor het overlijden”
- Bron: expertinterview
- Reden: Intubatie kan nuttig zijn voor acute zorg bij mensen met
COPD. Reanimatie na intubatie is echter zinloos. Het betekent immers
dat de eerste intubatie geen effect had en dat men noodingrepen aan
het toepassen is in een chronische setting. Daarom beschouwen we
reanimatie na intubatie als een teken van ongepaste zorg kort bij het
levenseinde, wanneer het bij een voldoende groot aantal mensen
voorkomt.
- Teller: Het aantal mensen met COPD met incidentie van intubatie en
minder dan een week nadien reanimatie tijdens de laatste maand voor
het overlijden.
- Noemer: Het totaal aantal mensen met COPD.
- Exclusie: mensen zonder COPD.
- Operationalisering in IMA-data: Binnen de variabele
‘nomenclatuurcode’ identificeren we de codes die overeenkomen met
intubatie en met reanimatie. We creëren een nieuwe variabele die
aangeeft of bij de overledene in de laatste maand voor overlijden een
reanimatie na intubatie voorkomt.
- Norm/richtcijfer: Nog te bepalen.
A.15 Indicator “Het gemiddeld aantal verstrekkingen per dag van
antibiotica tijdens de laatste 2 jaar voor overlijden”
- Bron: expertinterview
- Reden: Gebruik van antibiotica is vaak nuttig. Frequent gebruik van
antibiotica bij mensen met COPD hangt echter samen met herhaalde
exacerbaties en een verlaagde immuniteit. Daarom is het bij mensen met
COPD een indicator van ongepaste zorg, indien het bij een voldoende
groot aantal mensen voorkomt.
- Teller: Het aantal voorschriften voor antibiotica over alle mensen
heen per dag, bij mensen met COPD, gedurende de laatste 2 jaar voor
overlijden.
- Noemer: Het totaal aantal mensen met COPD.
- Exclusie: mensen zonder COPD.

295
- Operationalisering in IMA-data: Binnen de variabele
‘nomenclatuurcode’ identificeren we de codes die overeenkomen met
antibioticavoorschriften. Per dag tellen we het aantal voorschriften
voor antibiotica dat verstrekt werd. We maken een nieuwe variabele die
deze telling representeert: voor elke dag bevat die variabele het
aantal voorschriften van antibiotica. We brengen zo de evolutie in
kaart naar het levenseinde toe.
- Norm/richtcijfer: hoe lager, hoe positiever voor de kwaliteit van
zorg.
A.16 Indicator “Het gemiddeld aantal voorschriften van anxiolytica en
antidepressiva tijdens het laatste jaar voor overlijden”
(zie Supplementary material S.1, indicator A.10)
A.17 Indicator “Het aantal mensen dat chirurgie ondergaat 6, 2 of 1
maand(en) voor het overlijden”
(zie Supplementary material S.1, indicator A.11)
A.18 Indicator “Het aantal mensen met een bloedtransfusie tijdens de
laatste 2 maanden/1maand/14 dagen voor overlijden” (met uitzondering
van mensen met een hematologische aandoening)
(zie Supplementary material S.1, indicator A.12)
B. Thema: Behandelen van pijn en fysieke symptomen
B.1 Indicator “Het aantal mensen die Noninvasive Positive Pressure
Ventilation kregen bij hospitalisatie”
- Bron: (Ambrosino and Vagheggini, 2008; Ramsay and Hart, 2013; Sinuff
et al., 2008; Williams et al., 2013)
- Reden: NPPV verlicht symptomen van ademnood aan het levenseinde,
verlaagt de nood aan invasieve behandelingen, verlaagt de kans op
complicaties en verkort een mogelijk ICU verblijf bij mensen met COPD.
Als zodanig is het gebruik ervan bij een relatief hoog percentage
mensen een teken van gepaste zorg aan het levenseinde.
- Teller: Het aantal mensen met COPD die NPPV ondergaan. (in de laatste
2 jaar voor het overlijden)

296
- Noemer: Het totaal aantal mensen met COPD.
- Exclusie: mensen zonder COPD.
- Operationalisering in IMA-data: Binnen de variabele
‘nomenclatuurcode’ identificeren we de codes die overeenkomen met de
behandeling NPPV. Behandelingen met de naam ‘continuous positive
airway pressure’ (CPAP) of ‘bilevel positive airway pressure’ vallen
ook onder de naam NPPV. We maken een nieuwe variabele die aangeeft of
in het zorggebruik van de mens al dan niet NPPV voorkomt.
- Norm/richtcijfer: Nog te bepalen.
B.2 Indicator “Het aantal mensen die opioïden kregen voor pijn- en
symptoombestrijding in de laatste maand voor overlijden”
- Bron: (Luce and Luce, 2001), bevestigd door expertinterview.
- Reden: Opioïden bij mensen met COPD verminderen het gevoel van
ademnood en de neiging tot te snel ademen, wat een lagere
luchtcirculatie per minuut tot gevolg heeft. Het verminderen van het
gevoel van ademnood heeft verregaande positieve psychologische en
sociale gevolgen voor de patiënt. Bovendien zijn opioïden ook werkzaam
als pijnbestrijding. Daarom is een relatief groot percentage mensen
waarbij opioïden gebruikt wordt een teken van gepaste zorg aan het
levenseinde.
- Teller: Het aantal mensen met COPD met een voorschrift voor opioïden
in de laatste 6 maanden, de laatste 3 maanden, de laatste maand en de
laatste 14 dagen voor het levenseinde
- Noemer: Het totaal aantal mensen met COPD.
- Exclusie: mensen zonder COPD.
- Operationalisering in IMA-data: Binnen de pharmanet-databank
identificeren we de codes die overeenkomen met geneesmiddelen uit de
opioïdengroep. Voorbeelden zijn: morfine, codeïne, oxycodone
hydrochloride, fentanyl citraat.
- Norm/richtcijfer: Nog te bepalen.
B.3 Indicator “Het aantal mensen dat inhalatietherapie (inhalatie-
corticosteroïden, anticholinergica, Bèta-2 memetica) gebruikte
tijdens de laatste 6, 3 of 1 maand(en) voor het levenseinde”
- Bron: expertinterview

297
- Reden: Inhalatietherapie werkt symptoom-verlichtend voor mensen met
COPD. Als zodanig is het een teken van gepaste zorg aan het
levenseinde, indien bij voldoende mensen voorkomt.
- Teller: Het aantal mensen met COPD die in de laatste 6 maanden, 3
maanden of de laatste maand voor het levenseinde inhalatietherapie
krijgen toegediend.
- Noemer: alle overleden mensen met COPD.
- Exclusie: mensen zonder COPD.
- Operationalisering in IMA-data: we zoeken een nomenclatuurcode voor
de verschillende vormen van inhalatietherapie en gaan de aanwezigheid
ervan na in de laatste 6, 3 of 1 maand(en) voor overlijden.
- Norm/richtcijers: Nog te bepalen.
B.4 Indicator “het aantal mensen dat contact had met een psycholoog
in de laatste 2 maanden voor overlijden”
(zie Supplementary material S.1, indicator B.7)
C. Thema: Het (tijdig) opstarten van palliatieve zorg
C.1 Indicator “Het aantal mensen die gespecialiseerde palliatieve zorg
ontvingen
(zie Supplementary material S.1, indicator C.1)
C.2 Indicator “Het aantal mensen dat gebruik maakt van de
ondersteuningsmaatregel ‘palliatief statuut’”
(zie Supplementary material S.1, indicator C.2)
C.3 Indicator “Het aantal mensen dat gespecialiseerde palliatieve zorg
ontving of het palliatief statuut kreeg toegewezen minder dan 1 week
voor het overlijden”
(zie Supplementary material S.1, indicator C.3)
D. Thema 4: Plaats van overlijden en levenseindezorg
298
D.1 Indicator “Het aantal mensen die thuis overlijden”
(zie Supplementary material S.1, indicator D.4)
D.2 Indicator “Het aantal mensen die thuis of in een WZC van residentie
overlijden”
(zie Supplementary material S.1, indicator D.5)
D.3 Indicator “Het aantal mensen die in het ziekenhuis overlijden”
(zie Supplementary material S.1, indicator D.3)
E. Thema: Coördinatie en continuïteit van de zorg
E.1 Indicator “Aantal mensen met een gemiddelde toename van het aantal
huisartscontacten tijdens de laatste 30 dagen voor het levenseinde”
(zie Supplementary material S.1, indicator E.2)
E.2 Indicator “Het gemiddeld aantal contacten met de huisarts of andere
eerste-lijns-zorgers tijdens de laatste 3 maanden voor overlijden”
(zie Supplementary material S.1, indicator E.3)
E.3 Indicator “Het aantal mensen met een opname op een intensive care
unit kort voor het overlijden”
- Bron: expertinterview
- Reden: Opname op een intensive care unit kort voor het levenseinde
is een teken van futiele zorg. Bovendien is het vaak er belastend voor
wie het ondergaat. Daarom kiezen we het als een teken van ongepaste
zorg voor het levenseinde, indien het bij een voldoende groot aantal
mensen voorkomt.
- Teller: het aantal mensen met COPD dat opgenomen is op een intensive
care unit de laatste 2 maanden, 1 maand en 2 weken voor het
levenseinde.
- Noemer: het totaal aantal mensen met COPD.
- Exclusie: alle mensen zonder COPD.

299
- Operationalisering in IMA: Via de nomenclatuurcodes identificeren
we opname op een intensive care unit. We creëren een binaire variabele
die weergeeft of de opname al dan niet heeft plaatsgevonden tijdens
de laatste twee weken.
- Norm/richtcijfer: Nog te bepalen.
E.4 Indicator “Het aantal residenten van een woonzorgcentrum met een
opname in een ICU tijdens de laatste 6 of 3 maanden en 2 weken of 1
week voor overlijden
(zie Supplementary material S.1, indicator E.1)
300
Referenties
Ambrosino, N., and G. Vagheggini, 2008, Noninvasive positive pressure
ventilation in the acute care setting: where are we?: Eur Respir
J, v. 31, p. 874-86.
Bakitas, M. A., T. D. Tosteson, Z. Li, K. D. Lyons, J. G. Hull, J. N.
Dionne-Odom, J. Frost, K. H. Dragnev, M. T. Hegel, A. Azuero,
and T. A. Ahles, 2015, Early Versus Delayed Initiation of
Concurrent Palliative Oncology Care: Patient Outcomes in the
ENABLE III Randomized Controlled Trial: J Clin Oncol, v. 33, p.
1438-45.
Battaglia, S., M. Bezzi, and G. F. Sferrazza Papa, 2015, Are
benzodiazepines and opioids really safe in patients with severe
COPD?: Minerva Med.
Beccaro, M., M. Costantini, P. Giorgi Rossi, G. Miccinesi, M. Grimaldi,
P. Bruzzi, and I. S. Group, 2006, Actual and preferred place of
death of cancer patients. Results from the Italian survey of the
dying of cancer (ISDOC): J Epidemiol Community Health, v. 60, p.
412-6.
Clini, E. M., and N. Ambrosino, 2008, Nonpharmacological treatment and
relief of symptoms in COPD: Eur Respir J, v. 32, p. 218-28.
De Roo, M. L., G. Miccinesi, B. D. Onwuteaka-Philipsen, N. Van Den
Noortgate, L. Van den Block, A. Bonacchi, G. A. Donker, J. E.
Lozano Alonso, S. Moreels, L. Deliens, A. L. Francke, and E.
IMPACT, 2014, Actual and preferred place of death of home-
dwelling patients in four European countries: making sense of
quality indicators: PLoS One, v. 9, p. e93762.
Earle, C. C., E. R. Park, B. Lai, J. C. Weeks, J. Z. Ayanian, and S.
Block, 2003, Identifying potential indicators of the quality of
end-of-life cancer care from administrative data: J Clin Oncol,
v. 21, p. 1133-8.
Ekström, M. P., A. Bornefalk-Hermansson, A. P. Abernethy, and D. C.
Currow, 2014, Safety of benzodiazepines and opioids in very
severe respiratory disease: national prospective study: BMJ, v.
348, p. g445.
Gozalo, P., J. M. Teno, S. L. Mitchell, J. Skinner, J. Bynum, D. Tyler,
and V. Mor, 2011, End-of-life transitions among nursing home
residents with cognitive issues: N Engl J Med, v. 365, p. 1212-
21.
Grunfeld, E., L. Lethbridge, R. Dewar, B. Lawson, L. F. Paszat, G.
Johnston, F. Burge, P. McIntyre, and C. C. Earle, 2006, Towards
using administrative databases to measure population-based
indicators of quality of end-of-life care: testing the
methodology: Palliat Med, v. 20, p. 769-77.
Hill, K., R. Geist, R. S. Goldstein, and Y. Lacasse, 2008, Anxiety and
depression in end-stage COPD: Eur Respir J, v. 31, p. 667-77.
Lamberg, J. L., C. J. Person, D. K. Kiely, and S. L. Mitchell, 2005,
Decisions to hospitalize nursing home residents dying with
advanced dementia: J Am Geriatr Soc, v. 53, p. 1396-401.
Luce, J. M., and J. A. Luce, 2001, Perspectives on care at the close
of life. Management of dyspnea in patients with far-advanced lung
disease: "once I lose it, it's kind of hard to catch it... ":
JAMA, v. 285, p. 1331-7.

301
Magill, M. K., and J. Senf, 1987, A new method for measuring continuity
of care in family practice residencies: J Fam Pract, v. 24, p.
165-8.
Naunheim, K. S., D. E. Wood, M. J. Krasna, M. M. DeCamp, M. E. Ginsburg,
R. J. McKenna, G. J. Criner, E. A. Hoffman, A. L. Sternberg, C.
Deschamps, and N. E. T. T. R. Group, 2006, Predictors of operative
mortality and cardiopulmonary morbidity in the National Emphysema
Treatment Trial: J Thorac Cardiovasc Surg, v. 131, p. 43-53.
Ramsay, M., and N. Hart, 2013, Current opinions on non-invasive
ventilation as a treatment for chronic obstructive pulmonary
disease: Curr Opin Pulm Med, v. 19, p. 626-30.
Sampson, E. L., B. Candy, and L. Jones, 2009, Enteral tube feeding for
older people with advanced dementia: Cochrane Database Syst Rev,
p. CD007209.
Sinuff, T., D. J. Cook, S. P. Keenan, K. E. Burns, N. K. Adhikari, G.
M. Rocker, S. Mehta, R. Kacmarek, K. Eva, and N. S. Hill, 2008,
Noninvasive ventilation for acute respiratory failure near the
end of life: Crit Care Med, v. 36, p. 789-94.
Teno, J. M., S. L. Mitchell, S. K. Kuo, P. L. Gozalo, R. L. Rhodes,
J. C. Lima, and V. Mor, 2011, Decision-making and outcomes of
feeding tube insertion: a five-state study: J Am Geriatr Soc, v.
59, p. 881-6.
Williams, B., M. Boyle, N. Robertson, and C. Giddings, 2013, When
pressure is positive: a literature review of the prehospital use
of continuous positive airway pressure: Prehosp Disaster Med, v.
28, p. 52-60.
302
Supplementary material S.3: Indicatoren voor (on)gepaste zorg aan
het levenseinde bij mensen met dementie via administratieve data
Volgende kenmerken vindt men bij elke indicator terug:
- Een inhoudelijke beschrijving van de indicator in de titel
- De bron van de indicator, uit literatuur of uit expertinterview
- De reden waarom de indicator een teken is van gepaste of ongepaste
zorg
- De teller en noemer om de indicator te berekenen
- Exclusie van subpopulaties waarvoor de indicator niet geldt
- De operationalisering van de indicator in de IMA-databank
- Een norm/richtcijfer voor de score op deze indicator (waar
mogelijk)
Terminologie
Een aantal begrippen worden regelmatig herhaald en zijn geen standaard
taalgebruik. Van deze termen geven we hier een korte verklaring. Het
is nuttig om deze vooraf door te nemen.
1. Reden: Wanneer we bij ‘reden’ spreken over de motivatie om een
bepaalde indicator op te nemen als teken van gepaste of ongepaste
zorg, is dat steeds bedoeld op geaggregeerd niveau. Een indicator
geldt dus niet voor elke mens (persoon/patiënt) in elke situatie. De
indicatoren worden op populatieniveau gemeten en zeggen dus iets over
het voorkomen van bepaalde zorgpraktijken in België.
2. De variabele ‘nomenclatuurcode’ is een variabele in de IMA-databank
“gezondheidszorgen”, die alle nomenclatuurcodes van terugbetaalde
medische handelingen bevat. Als zodanig wordt hij vaak gebruikt in de
operationalisering van indicatoren voor gepaste of ongepaste zorg.
3. De variabele ‘productcode’ is een variabele uit de IMA–databank
“farmanet”, die alle productcodes van terugbetaalde medicijnen (op
voorschrift) bevat. Als zodanig wordt hij vaak gebruikt in de
operationalisering van indicatoren voor gepaste of ongepaste zorg.
6. Norm/richtcijfer is veelal niet vastgelegd. Ze kan echter worden
vastgelegd op basis van de waargenomen verdelingen (bijvoorbeeld op
basis van best practice examples, bijvoorbeeld de beste 10%). In de
lijst is dit aangegeven met “nog te bepalen”.

303
A. Thema: Afwezigheid van agressieve zorg voor het
levenseinde
A.1. Indicator “Het aantal mensen die sondevoeding of intraveneuze
(parenterale) voeding kregen in de laatste maand voor overlijden”
(zie Supplementary material S.1, indicator A.3)
A.2. Indicator “Het aantal mensen waarbij diagnostische testen
(bloedafname, spirometrie, EKG, dialyse of radiografie) werden
afgenomen tijdens de laatste maand voor het overlijden”
(zie Supplementary material S.1, indicator A.6)
A.3. Indicator “Het aantal mensen waarbij statines niet werden
afgebouwd tijdens het laatste jaar, laatste 6 maanden en laatste 30
dagen voor overlijden”
- Bron: expertinterview
- Reden: Een vaak voorkomend probleem bij mensen met Alzheimer is dat
ze een veelvoud van medicatie innemen. Dit verhoogt het risico tot
sterkere bijwerking en het verminderen van het werkzame effect van
deze medicijnen. Bovendien is het positieve effect van bepaalde
medicijnen slechts op lange termijn (10 jaar of meer) merkbaar. We
hebben het dan bijvoorbeeld over statines. Het niet afbouwen van
dergelijke medicatie is een teken van ongepaste zorg aan het
levenseinde, indien het bij een voldoende groot aantal mensen
voorkomt.
- Teller: het aantal mensen met Alzheimer die onderworpen worden aan
statines in de laatste maanden en jaren voor het overlijden. We stellen
meetmomenten in op 2 jaar, 1 jaar, 6 maanden en 1 maand voor
overlijden.
- Noemer: het totaal aantal mensen overleden met Alzheimer.
- Exclusie: alle mensen zonder Alzheimer.
- Operationalisering in IMA: Via de nomenclatuurcodes identificeren
we de behandeling met statines. We gieten ze in een binaire variabele
om aan te geven wie wel/niet statines kreeg tijdens de laatste maanden
en jaren voor het overlijden. We berekenen een afzonderlijke periode
voor elke tijdsperiode (2 jaar, 1 jaar, 6 maanden en 1 maand voor
overlijden)
- Norm/richtcijfer: Nog te bepalen.
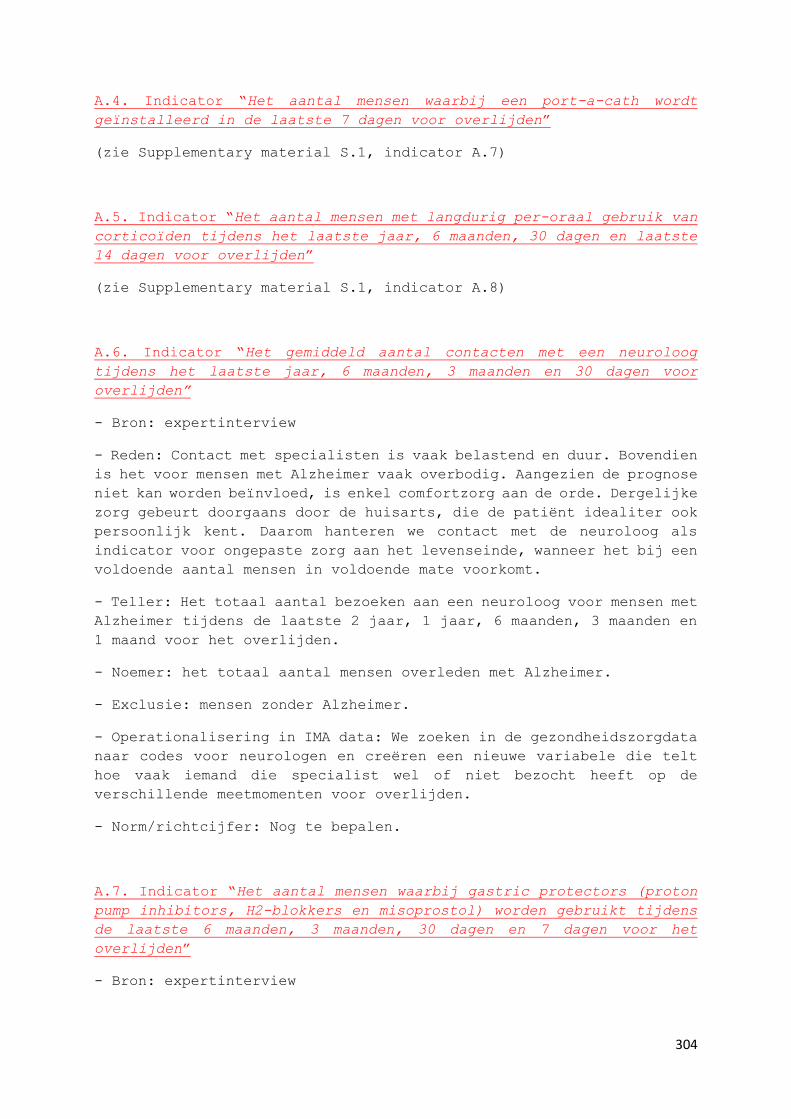
304
A.4. Indicator “Het aantal mensen waarbij een port-a-cath wordt
geïnstalleerd in de laatste 7 dagen voor overlijden”
(zie Supplementary material S.1, indicator A.7)
A.5. Indicator “Het aantal mensen met langdurig per-oraal gebruik van
corticoïden tijdens het laatste jaar, 6 maanden, 30 dagen en laatste
14 dagen voor overlijden”
(zie Supplementary material S.1, indicator A.8)
A.6. Indicator “Het gemiddeld aantal contacten met een neuroloog
tijdens het laatste jaar, 6 maanden, 3 maanden en 30 dagen voor
overlijden”
- Bron: expertinterview
- Reden: Contact met specialisten is vaak belastend en duur. Bovendien
is het voor mensen met Alzheimer vaak overbodig. Aangezien de prognose
niet kan worden beïnvloed, is enkel comfortzorg aan de orde. Dergelijke
zorg gebeurt doorgaans door de huisarts, die de patiënt idealiter ook
persoonlijk kent. Daarom hanteren we contact met de neuroloog als
indicator voor ongepaste zorg aan het levenseinde, wanneer het bij een
voldoende aantal mensen in voldoende mate voorkomt.
- Teller: Het totaal aantal bezoeken aan een neuroloog voor mensen met
Alzheimer tijdens de laatste 2 jaar, 1 jaar, 6 maanden, 3 maanden en
1 maand voor het overlijden.
- Noemer: het totaal aantal mensen overleden met Alzheimer.
- Exclusie: mensen zonder Alzheimer.
- Operationalisering in IMA data: We zoeken in de gezondheidszorgdata
naar codes voor neurologen en creëren een nieuwe variabele die telt
hoe vaak iemand die specialist wel of niet bezocht heeft op de
verschillende meetmomenten voor overlijden.
- Norm/richtcijfer: Nog te bepalen.
A.7. Indicator “Het aantal mensen waarbij gastric protectors (proton
pump inhibitors, H2-blokkers en misoprostol) worden gebruikt tijdens
de laatste 6 maanden, 3 maanden, 30 dagen en 7 dagen voor het
overlijden”
- Bron: expertinterview

305
- Reden: Het gebruik van gastric protectors wordt nuttig geacht bij
het veelvuldig gebruik van medicatie, om de maag te beschermen tegen
maagbloeding of maagzweer. Als zodanig duiden ze vaak op
polymedicatie. Dit is een ernstig probleem bij ouderen, dat een teken
kan zijn van futiele zorg kort voor het levenseinde. Bovendien werken
een aantal gastric protectors enkel op lange termijn, wat hun gebruik
kort voor het levenseinde overbodig maakt. Daarom beschouwen we het
gebruik van gastric protectors als teken van ongepaste zorg voor het
levenseinde, wanneer het bij een voldoende groot aantal mensen
voorkomt.
- Teller: het aantal mensen met Alzheimer die gastric protectors
krijgen voorgeschreven in de laatste 6 maanden, 3 maanden en 30 dagen
en 14 dagen voor het overlijden.
- Noemer: het totaal aantal mensen overleden met Alzheimer.
- Exclusie: alle mensen zonder Alzheimer.
- Operationalisering in IMA: Via de nomenclatuurcodes identificeren
we de behandeling met gastric protectors. We berekenen het aantal
mensen dat ze kreeg tijdens de een vastgelegde periode (6 of 3 maanden,
30 dagen of 14 dagen) voor het overlijden.
- Norm/richtcijfer: Nog te bepalen.
A.8. Indicator “Het aantal mensen waarbij anti-hypertensiva werden
gebruikt in de laatste 6 maanden, 3 maanden, 30 dagen en 14 dagen voor
het overlijden”
- Bron: expertinterview
- Reden: Gebruik van anti-hypertensiva wordt nuttig geacht bij een
grote groep mensen en veelvuldig voorgeschreven in België. Ze zijn
echter enkel effectief in het verlagen van bloeddruk op lange termijn.
Bovendien verwachten we naar het levenseinde toe eerder problemen met
te lage bloeddruk dan met te hoge. Daarom is het gebruik van anti-
hypertensiva kort voor het levenseinde futiel en als zodanig
beschouwen we het als teken van ongepaste zorg voor het levenseinde,
wanneer het bij een voldoende groot aantal mensen voorkomt.
- Teller: het aantal mensen met Alzheimer die onderworpen worden aan
anti-hypertensiva in de laatste 6 maanden, 3 maanden, 30 dagen en 14
dagen voor het overlijden.
- Noemer: het totaal aantal mensen overleden met Alzheimer.
- Exclusie: alle mensen zonder Alzheimer.

306
- Operationalisering in IMA: Via de nomenclatuurcodes identificeren
we de behandeling met anti-hypertensiva. We berekenen het aantal
mensen dat ze kreeg tijdens de een vastgelegde periode (6 of 3 maanden,
1 of 4 weken) voor het overlijden.
- Norm/richtcijfer: Nog te bepalen.
A.9. Indicator “Het aantal mensen dat Calcium vitamine D krijgt kort
in de laatste 6 maanden, 3 maanden, 30 dagen en 14 dagen voor het
overlijden”
- Bron: expertinterview
- Reden: Voedingssupplementen als multivitaminen, ijzerpreparaten en
dergelijke zijn overbodig kort voor het levenseinde. Vaak zijn ze niet
op voorschrift te krijgen, zodat we ze in het kader van deze studie
niet terugvinden in de IMA-databank. Wat wel terug te vinden is in de
IMA-gegevens is het gebruik van Calcium vitamine D. We richten ons dus
specifiek daarop en benoemen het gebruik van Calcium vitamine D als
indicator van ongepaste zorg voor het levenseinde, wanneer het bij een
voldoende groot aantal mensen voorkomt.
- Teller: het aantal mensen met Alzheimer die onderworpen worden aan
calcium vitamine D in de laatste 6 maanden, 3 maanden, 30 dagen en 14
dagen voor het overlijden.
- Noemer: het totaal aantal mensen overleden met Alzheimer.
- Exclusie: alle mensen zonder Alzheimer.
- Operationalisering in IMA: Via de nomenclatuurcodes identificeren
we de behandeling met calcium vitamine D. We berekenen het aantal
mensen dat ze kreeg tijdens de een vastgelegde periode (6 of 3 maanden,
30 of 14 dagen) voor het overlijden.
- Norm/richtcijfer: Nog te bepalen.
A.10. Indicator “Het aantal mensen dat anti-bloedklontering krijgt in
de laatste 3 maanden, 30 dagen en 14 dagen voor het overlijden”
- Bron: expertinterview
- Reden: Gebruik van anti-bloedklontering medicatie (bv.
kinderaspirine 80mg) ter preventie van bloedklontering is kort voor
het overlijden overbodig. Op middellange termijn is deze medicatie
effectief, maar kort voor het overlijden is ze een teken van futiele
zorg. Daarom beschouwen we het gebruik van anti-bloedklontering
medicatie kort voor het levenseinde als teken van ongepaste zorg voor

307
het levenseinde, wanneer het bij een voldoende groot aantal mensen
voorkomt.
- Teller: het aantal mensen met Alzheimer die onderworpen worden aan
anti-bloedklontering medicatie in de laatste 3 maanden, 30 dagen en
14 dagen voor het overlijden.
- Noemer: het totaal aantal mensen overleden met Alzheimer.
- Exclusie: alle mensen zonder Alzheimer.
- Operationalisering in IMA: Via de nomenclatuurcodes identificeren
we de behandeling met anti-bloedklontering medicatie. We berekenen het
aantal mensen dat ze kreeg tijdens de een vastgelegde periode (3
maanden, 30 of 14 dagen) voor het overlijden.
- Norm/richtcijfer: Nog te bepalen.
A.11. Indicator “Het aantal mensen dat Allopurinol krijgt in de laatste
6 maanden, 3 maanden, 30 dagen en 14 dagen voor het overlijden”
- Bron: expertinterview
- Reden: Via kristallisering geeft urinezuur aanleiding tot jicht en
verlaagt de levenskwaliteit. Allopurinol wordt gebruikt om urinezuur
te neutraliseren als preventief geneesmiddel op lange termijn. Kort
voor het overlijden kunnen we het beschouwen als overbodige zorg en
als zodanig aannemen als indicator van ongepaste zorg, als het bij een
voldoende groot aantal mensen voorkomt.
- Teller: het aantal mensen met Alzheimer die onderworpen worden aan
Allopurinol medicatie in de laatste 6 maanden, 3 maanden, 30 dagen en
14 dagen voor het overlijden.
- Noemer: het totaal aantal mensen overleden met Alzheimer.
- Exclusie: alle mensen zonder Alzheimer.
- Operationalisering in IMA: Via de nomenclatuurcodes identificeren
we de behandeling Allopurinol. We berekenen het aantal mensen dat het
kreeg voorgeschreven tijdens de een vastgelegde periode (6 of 3
maanden, 30 of 14 dagen) voor het overlijden.
- Norm/richtcijfer: Nog te bepalen.
A.12. Indicator “Het aantal mensen met een reanimatie tijdens de 90
dagen, 30 dagen, 14 dagen of 1 dag voor het overlijden”
- Bron: expertinterview

308
- Reden: Bij mensen met Alzheimer in een sterke mate van
zorgafhankelijkheid is reanimeren een teken van ongepaste zorg, wegens
te agressief en vaak overbodig. We veronderstellen dat een groot aantal
van de mensen die overlijden met Alzheimer sterk zorgafhankelijk zijn
kort voor het levenseinde. Bij deze subpopulatie beschouwen we
reanimatie kort voor het overlijden als een teken van ongepaste zorg,
wanneer het bij een voldoende groot aantal mensen voorkomt.
- Teller: het aantal mensen met Alzheimer die een reanimatie
ondergingen in de 90 dagen, 30 dagen, 14 dagen of 1 dag voor het
overlijden.
- Noemer: het totaal aantal mensen overleden met Alzheimer.
- Exclusie: alle mensen zonder Alzheimer.
- Operationalisering in IMA: Via de nomenclatuurcodes identificeren
we de behandeling ‘reanimatie’. Het voorkomen ervan tellen we binnen
de vooropgestelde periode (90, 30, 14 of 1 dag voor overlijden).
- Norm/richtcijfer: Nog te bepalen.
A.13. Indicator “Het aantal mensen waarbij gedragsgerichte medicatie
(neuroleptica en benzodiazepinen) worden gebruikt kort voor het
overlijden”
- Bron: expertinterview
- Reden: Gedragsstoornissen zijn typerend voor een tussenstadium van
dementie. Dit stadium ligt doorgaans meer dan 2 jaar voor het
overlijden. (we kunnen dit stellen vanwege het relatief voorspelbare
verloop van Alzheimer) In dat stadium zijn neuroleptica en
benzodiazepinen geschikt om gedragsstoornissen te beperken. In latere
stadia zijn ze echter overbodig. Dit betekent dat we het gebruik van
neuroleptica en benzodiazepinen kunnen beschouwen als een teken van
ongepaste zorg kort bij het levenseinde, wanneer het bij een voldoende
groot aantal mensen voorkomt.
- Teller: het aantal mensen met Alzheimer die neuroleptica of
benzodiazepinen krijgen voorgeschreven tijdens de laatste 2 jaar, 1
jaar, 6 maanden, 3 maanden of 1 maand voor overlijden.
- Noemer: het totaal aantal mensen overleden met Alzheimer.
- Exclusie: alle mensen zonder Alzheimer.
- Operationalisering in IMA: Via de nomenclatuurcodes identificeren
we de behandeling met neuroleptica en benzodiazepinen. We gieten ze
in een binaire variabele om aan te geven wie ze wel/niet kreeg tijdens

309
de genoemde perioden voor het overlijden. We berekenen ze zowel
afzonderlijk als de OF modaliteit (of ze één van voorgaande kregen).
- Norm/richtcijfer: Nog te bepalen.
A.14. Indicator “Het aantal mensen met Alzheimer en kanker die
chemotherapie ondergaan kort voor het overlijden”
- Bron: expertinterview
- Reden: Bij mensen met een ernstige graad van dementie is het
toepassen van chemotherapie een teken van futiele zorg en bovendien
erg belastend. Daarom is het een indicator van ongepaste zorg, indien
het bij een voldoende groot aantal mensen voorkomt.
- Teller: Het aantal mensen met Alzheimer en kanker die een
chemotherapiebehandeling krijgen in de laatste 2 jaar, het laatste
jaar, de laatste 6 maanden en de laatste maand voor het overlijden.
- Noemer: Het totaal aantal mensen met zowel Alzheimer als kanker.
- Exclusie: mensen die niet zowel kanker als Alzheimer hebben.
- Operationalisering in IMA data: Binnen de variabele
‘nomenclatuurcode’ identificeren we de codes die overeenkomen met de
verschillende behandelingen chemotherapie. De variabele
‘nomenclatuurcode’ wordt gekoppeld aan de variabele ‘datum’ en wordt
vervolgens geordend op de variabele ‘datum’. We berekenen voor elk
meetmoment (2 jaar, 1 jaar, 6 maanden, 1 maand voor overlijden) hoe
veel mensen chemotherapiebehandeling kregen.
- Norm/richtcijfer: Nog te bepalen.
A.15. Indicator “Het gemiddeld aantal voorschriften van anxiolytica
en antidepressiva tijdens het laatste jaar voor overlijden”
(zie Supplementary material S.1, indicator A.10)
A.16. Indicator “Het aantal mensen dat chirurgie ondergaat 6, 2 of 1
maand(en) voor het overlijden”
(zie Supplementary material S.1, indicator A.11)

310
A.17. Indicator “Het aantal mensen met een bloedtransfusie tijdens de
laatste 2 maanden/1maand/14 dagen voor overlijden” (met uitzondering
van mensen met een hematologische aandoening)
(zie Supplementary material S.1, indicator A.12)
B. Thema: Behandelen van pijn en fysieke symptomen
B.1. Indicator “Het aantal mensen die een combinatie kregen van morfine
en neuropathische middelen kregen voor pijnbestrijding”
(zie Supplementary material S.1, indicator B.6)
B.2. Indicator “het aantal mensen dat contact had met een psycholoog
in de laatste 2 maanden voor overlijden”
(zie Supplementary material S.1, indicator B.7)
C. Thema: Het (tijdig) opstarten van palliatieve zorg
C.1. Indicator “Het aantal mensen die gespecialiseerde palliatieve
zorg ontvingen”
(zie Supplementary material S.1, indicator C.1)
C.2. Indicator “Het aantal mensen dat gebruik maakt van de
ondersteuningsmaatregel ‘palliatief statuut’”
(zie Supplementary material S.1, indicator C.2)
C.3. Indicator “Het aantal mensen dat gespecialiseerde palliatieve
zorg ontving of het palliatief statuut kreeg toegewezen minder dan 1
week voor het overlijden”
(zie Supplementary material S.1, indicator C.3)
D. Thema 4: Plaats van overlijden en levenseindezorg
D.1. Indicator “Het aantal mensen die thuis overlijden”
(zie Supplementary material S.1, indicator D.4)

311
D.2. Indicator “Het aantal mensen die thuis of in een WZC van
residentie overlijden”
(zie Supplementary material S.1, indicator D.5)
D.3. Indicator “Het aantal mensen met één of meer opnames in een
ziekenhuis tijdens de laatste 6, 3 of 1 maand(en) voor het overlijden”
(zie Supplementary material S.1, indicator D.2)
D.4. Indicator “Het aantal mensen met één of meer opnames op de
spoedafdeling van een ziekenhuis tijdens de laatste 6, 3 of 1 maand(en)
voor het overlijden”
(zie Supplementary material S.1, indicator D.1)
D.5. Indicator “Het aantal mensen die in het ziekenhuis overlijden”
(zie Supplementary material S.1, indicator D.3)
D.6. Indicator “Het aantal mensen met een opname op een intensive care
unit kort voor het overlijden”
(zie Supplementary material S.2, indicator E.3)
E. Thema: Coördinatie en continuïteit van de zorg
E.1. Indicator “Het aantal mensen met een gemiddelde toename van het
aantal huisartscontacten tijdens de laatste maand voor het
levenseinde”
(zie Supplementary material S.1, indicator E.2)
E.2. Indicator “Het gemiddeld aantal contacten met de huisarts of
andere eerste lijnszorgers tijdens de laatste 3 maanden voor
overlijden”
(zie Supplementary material S.1, indicator E.3)

312
E.3. Indicator “Het aantal residenten van een woonzorgcentrum met een
opname in een ICU tijdens de laatste 6 of 3 maanden en 2 weken of 1
week voor overlijden”
(zie Supplementary material S.1, indicator E.1)
Referenties
Bakitas, M. A., T. D. Tosteson, Z. Li, K. D. Lyons, J. G. Hull, J. N.
Dionne-Odom, J. Frost, K. H. Dragnev, M. T. Hegel, A. Azuero,
and T. A. Ahles, 2015, Early Versus Delayed Initiation of
Concurrent Palliative Oncology Care: Patient Outcomes in the
ENABLE III Randomized Controlled Trial: J Clin Oncol, v. 33, p.
1438-45.
Beccaro, M., M. Costantini, P. Giorgi Rossi, G. Miccinesi, M. Grimaldi,
P. Bruzzi, and I. S. Group, 2006, Actual and preferred place of
death of cancer patients. Results from the Italian survey of the
dying of cancer (ISDOC): J Epidemiol Community Health, v. 60, p.
412-6.
De Roo, M. L., G. Miccinesi, B. D. Onwuteaka-Philipsen, N. Van Den
Noortgate, L. Van den Block, A. Bonacchi, G. A. Donker, J. E.
Lozano Alonso, S. Moreels, L. Deliens, A. L. Francke, and E.
IMPACT, 2014, Actual and preferred place of death of home-
dwelling patients in four European countries: making sense of
quality indicators: PLoS One, v. 9, p. e93762.
Earle, C. C., E. R. Park, B. Lai, J. C. Weeks, J. Z. Ayanian, and S.
Block, 2003, Identifying potential indicators of the quality of
end-of-life cancer care from administrative data: J Clin Oncol,
v. 21, p. 1133-8.
Gozalo, P., J. M. Teno, S. L. Mitchell, J. Skinner, J. Bynum, D. Tyler,
and V. Mor, 2011, End-of-life transitions among nursing home
residents with cognitive issues: N Engl J Med, v. 365, p. 1212-
21.
Grunfeld, E., L. Lethbridge, R. Dewar, B. Lawson, L. F. Paszat, G.
Johnston, F. Burge, P. McIntyre, and C. C. Earle, 2006, Towards
using administrative databases to measure population-based
indicators of quality of end-of-life care: testing the
methodology: Palliat Med, v. 20, p. 769-77.
Lamberg, J. L., C. J. Person, D. K. Kiely, and S. L. Mitchell, 2005,
Decisions to hospitalize nursing home residents dying with
advanced dementia: J Am Geriatr Soc, v. 53, p. 1396-401.
Magill, M. K., and J. Senf, 1987, A new method for measuring continuity
of care in family practice residencies: J Fam Pract, v. 24, p.
165-8.
Mitchell, S. L., D. K. Kiely, S. C. Miller, S. R. Connor, C. Spence,
and J. M. Teno, 2007, Hospice care for patients with dementia:
J Pain Symptom Manage, v. 34, p. 7-16.

313
Sampson, E. L., B. Candy, and L. Jones, 2009, Enteral tube feeding for
older people with advanced dementia: Cochrane Database Syst Rev,
p. CD007209.
Teno, J. M., S. L. Mitchell, S. K. Kuo, P. L. Gozalo, R. L. Rhodes,
J. C. Lima, and V. Mor, 2011, Decision-making and outcomes of
feeding tube insertion: a five-state study: J Am Geriatr Soc, v.
59, p. 881-6.

314
Supplementary table S.4: QIs that were rejected by the expert
panel, phase 3b: plenary discussion.
Indicator
(brief description)
Indicator of
appropriate
(A) or
inappropriate
(I) care
Numerator
(Number of people who died with*)
Number of
people who
died with*
Motivation from the experts
for rejection
Chemotherapy
Third line†
I *cancer who received a third line of chemotherapy *cancer Cancer type determines
appropriateness
Prolonged corticoids‡ I *cancer who had prolonged peroral use of
corticoids in the last [12, 6, 1] months prior to
death
*cancer Dosage determines
appropriateness
Oxygen with lung metastases‡ I *cancer with lung metastases who received oxygen
treatment
*cancer Psychologically comforting and
easy to apply
Anti-emetics with cytostatics‡ A *cancer who received cytostatics who received
anti-emetics
*cancer Standard care
Psychologist visit‡ A *cancer who had contact with a psychologist in the
last 2 months prior to death
*cancer, COPD
or Alzheimer’s
disease
Not measurable with current data
Died in hospital† I *cancer who died in hospital *cancer No viable alternatives in some
patients
Benzodiazepines† I *COPD who received benzodiazepines in the last
year prior to death
*COPD No viable alternatives. High use in
general
Corticoids‡ I *COPD who received prolonged corticoid
treatment
*COPD Unclear definition of ‘prolonged’
Antibiotics‡ I Sum of the number of prescriptions for antibiotics
per day for people who died witch COPD
*COPD Standard care for exacerbation
Noninvasive positive pressure
ventilation†
A *COPD who received Noninvasive positive pressure
ventilation while in hospital
*COPD Not suitable in end-of-life
context, uncomfortable
Corticoids‡ I *Alzheimer’s disease who had prolonged peroral
corticoid use in the last 2 months prior to death
*Alzheimer’s
disease
Strong individual variation.
Unclear definition of ‘prolonged’
Neuroleptics or benzodiazepines‡ I *Alzheimer’s disease who received neuroleptics or
benzodiazepines in the last year prior to death
*Alzheimer’s
disease
Appropriateness depends on
intention of carer
†Indicator from literature, ‡Indicator from interviews

315
Supplementary table S.5: Complete list of variables in the linked
dataset (IMA – Statistics Belgium – BCR)
Flag Variable Description
Statistics Belgium: Death certificates database
Immediate cause of death The primary disease/cause prior to death, + up to 3
underlying causes.
Associated causes of death Up to 3 factors that indirectly contributed to death.
Statistics Belgium: data based on demographic datasets
natgr Nationality-group: indicates to which of 16 most common
nationalities in Belgium someone belongs. Less common
nationalities are aggregated. (e.g. EU-other, Europe-other,
other)
liprohht LIPRO-household type: e.g. single parent, married
with/without children, …
Statistics Belgium : Socio-economic survey 2001 and census 2011
q9a/EDU Highest level of education.
q16a_m/SIE Main profession.
Statistics Belgium: Composite variables socio-economic survey 2001
comf Housing comfort level, based on number of types of
different rooms (e.g. kitchen, bathroom…) and heating
system.
Statistics Belgium: IPCAL dataset
Net income Net income in the year prior to death. Provided relative to
the entire population, not in absolute numbers.

316
IMA: Population database
ANON_BASE Recoded PP0010 and SS00010 Unique identification of the rightful claimant (coded)
PP0015 Age (based on year of birth)
AGE05_CAT Age of the rightful claimant in categories of 5 years,
calculated on December 31 of the reference year.
PP0020 Sex
Care region (based on
NIS code)
Recoded PP0025 Care region on the hospital level (in Flanders)
PROVINCE/DISTRICT Based on PP0025 Official place of residence at time of death
URB_CAT Based on PP0025 Degree of urbanisation of the place of residence
PP0030 Social status (e.g. working, retired, …)
PP0040 (A, B, C) Year of death
PP1010 Indicates whether the claimant received enhanced
reimbursement.
PP2001 Indicates whether the claimant received a forfeit class B
nursing care.
PP2002 Indicates whether the claimant received a forfeit class C for
nursing care.
PP2003 Indicates whether the claimant received a forfeit class E for
physiotherapy.
PP2005 Indicates whether the claimant received the allowance for
the integration of disabled persons (category III, IV, V).
PP2006 Indicates whether the claimant received the allowance for
assistance to the elderly (category III, IV, V).

317
PP2007 Indicates whether the claimant received a payment for
assistance of third person carers.
PP2008 Indicates whether the claimant received an increased
allowance for help from third parties. (based on degree of
disability)
PP2009 Indicates whether the claimant received a lump sum benefit
for ‘assistance to others’.
PP2010 Indicates whether the claimant was hospitalised at least
120 days during the last 2 years.
PP2011 Indicates whether the claimant was hospitalised at least 6
times during the last 2 years.
PP3004 Reimbursement category of the family.
PP3005 Reimbursement category of the individual.
PP3006 Date of the first claim entitled for maximum billing
(provided in days prior to death).
PP3011 Indicates whether the claimant received special allowances
for disabled persons.
PP3014 Indicates whether the claimant was entitled for maximum
billing for the chronically diseased.
PP4002 Number of days of unemployment due to disability.
PP4003 Number of days of disability.
PP4004 Evaluation of degree of functional status
CHRONICAL_YN Indicates whether the claimant had at least one chronic
illness in the last year and/or was entitled to an allowance
for disabled persons.
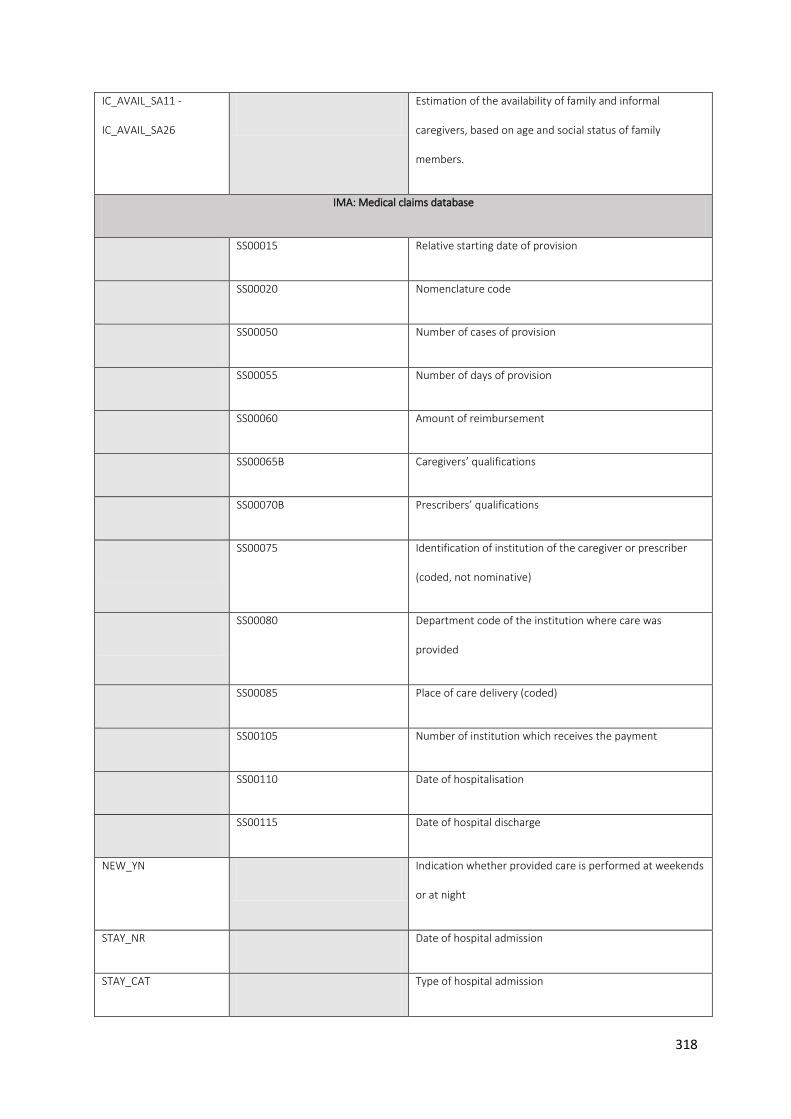
318
IC_AVAIL_SA11 -
IC_AVAIL_SA26
Estimation of the availability of family and informal
caregivers, based on age and social status of family
members.
IMA: Medical claims database
SS00015 Relative starting date of provision
SS00020 Nomenclature code
SS00050 Number of cases of provision
SS00055 Number of days of provision
SS00060 Amount of reimbursement
SS00065B Caregivers’ qualifications
SS00070B Prescribers’ qualifications
SS00075 Identification of institution of the caregiver or prescriber
(coded, not nominative)
SS00080 Department code of the institution where care was
provided
SS00085 Place of care delivery (coded)
SS00105 Number of institution which receives the payment
SS00110 Date of hospitalisation
SS00115 Date of hospital discharge
NEW_YN Indication whether provided care is performed at weekends
or at night
STAY_NR Date of hospital admission
STAY_CAT Type of hospital admission

319
ADMISSION,
ADMISSION_YYYY
The first day that a stay is charged at a residence
DISCHARGE,
DISCHARGE_YYYY
The last day that a stay is charged at a residence
LOS Length of stay
LOS_YYYY The calculated length of stay in a year
SS00120 Invoice type
SS00125 Date of last performance
SS00130 Invoicing performance code
SS00135 Pharmaceutical product code
SS00140 Specification code of provision of care
SS00150 Billed nomenclature code
SS00155 Prescription date
SS00160 Patient co-payment cost
SS00165 Supplement
SS00170 Code implant
SS00175 Third party payer
THIRD_YN Indicates whether a third party payer was involved
HOSP_ADM SS00075, SS00085, SS00105 Identification hospital admission
HOSP_TRANS SS00075, SS00085, SS00135 Identification hospital transfer(s)
IMA: Pharmanet database
SS00015 Delivery date

320
SS00020 Medication reimbursement category
SS00050 Drug quantity
SS00060 National Health and disability insurance contribution 1
SS00070B Profession type of prescriber
SS00075 Type of long-term care
SS00135 Product number
SS00155 Date of prescription (in days before death)
SS00160 Out-of-pocket cost
SS00165 Reduced repayment amount / Contribution of pharmacists
SS00180 Reduced insurance contribution
SS00195 National health and disability insurance contribution 2
SS00200 Fee coding
SS00210 Supplement
PHARMACIST_C,
PHARMACIST_CAT
Pharmacist C is the coded unique identification number of
the supplier of the performance.
Pharmacist_cat indicates the type of the supplier of the
performance
UNIT Indicates the unit to which the quantity is specified
procedure_AH_cat,
procedure_group,
procedure_detail,
procedure_cat
Formats into categories, sub-categories and cost of the
nomenclature code as they are determined by the actuary
of the National Health Care insurer

321
Prescriber_c,
prescriber_cat
Prescriber C is the coded unique identification of the
prescriber's performance. PRESCRIBER_CAT indicates the
type of the prescriber
atc_prod_l The different levels of the ATC code
BCR – Cancer Registry
inc_death_mm Number of complete months between incidence date and
date of death
ICD10_new Tumour localisation (ICD-10 code)

322
Supplementary material S.6: Statistical analysis
For the principal component analysis (PCA), we used the last-30-days-
version of the quality indicator items as a standard where that time
interval was relevant, unless only a shorter time interval was
validated for the indicator (e.g. port-a-cath installment was only
validated as possibly inappropriate in the last 14 days before death).
We only withheld items with a minimum loading of .40 on the component.
We performed an unbalanced ANOVA using the SAS General Linear Model
(GLM) procedure, that uses the method of least squares to fit general
linear models, with the factor scores as dependent variables and as
independent variables gender, age, region, nationality, household
type, housing comfort, level of education, level of urbanization of
residence, net taxable income and type of cancer. We hand-built the
model, starting from all independent variables and gradually excluding
those variables that had no significant influence on the factor. The
alpha level of 0.01 defined statistical significance.

323
Table S.7: Four components identified in the different quality
indicator items using Principal Component Analysis, with component
loadings
Component
loadings of the
QI items
Component 1: Inappropriate curative tumor treatment
Chemotherapy in last 30 days 0.71
Surgery in the last 30 days 0.71
Component 2: Inappropriate hospital transitions and hospital care
ED admissions in last 30 days 0.40
Hospital admission in last 30 days 0.45
Diagnostic testing in last 14 days 0.41
Component 3: Appropriate comfort and palliative care
Official palliative care status 0.67
Received specialized palliative care 0.72
Family physician contact increase in last 30 days
(compared to period before)
0.46
No. of primary caregiver contact in last 30 days 0.70
Death at home or in nursing home of residence 0.65
Component 4: Appropriate pain and symptom treatment
Opioids prescription in last 30 days 0.76
Opioids and neuropathic pain medication prescription
in last 30 days
0.71

324
Supplementary table S.8: Overview of all measured population
characteristics of people dying from cancer in Belgium, from 2010
until 2015.
People who died from cancer in Belgium, 2010-2015 (N = 159,590)
2010
(N =
26,768)
2011
(N =
26,820)
2012
(N =
26,464)
2013
(N =
26,654)
2014
(N =
26,391)
2015
(N =
26,493)
Average age 68.2 71 69.4 73.5 73.7 73.8
Agecategory <65 24.6 24.4 24.4 23.3 22.8 22.9
65-74 23.6 23.5 23.5 24.3 24.8 24.3
75-84 35.6 35.1 34.6 34.7 34.2 34.4
>84 16.2 16.9 17.4 17.8 18.2 18.4
Sex Female 43.6 44.2 43.5 43.9 44.1 44.1
Nationality Belgian 95.0 94.8 95.1 95.1 95.1 94.5
Householdtype Single 29.3 28.9 29.8 30.0 30.2 29.9
Single
parent
5.0 5.0 5.3 5.0 5.3 5.3
Couple with
children
12.1 12.0 11.7 11.9 11.6 11.5
Couple
without
children
44.7 44.8 44.0 44.4 44.1 44.4
Collective
(i.e.
nursing
home)
7.1 7.2 7.1 6.9 7.0 7.2
Other 1.9 2.0 2.1 1.9 1.9 1.7
Housing
Comfort
High 47.2 49.1 49.6 50.4 51.5 51.6
Average 17.1 16.2 16.4 15.7 15.0 14.9
Low 26.9 26.2 25.9 26.5 26.1 26.3
None 8.8 8.5 8.1 7.4 7.3 7.2

325
Highest
attained
educational
level
Higher
education
. 11.4 12.3 12.3 13.0 13.1
Higher
secundary
. 17.2 17.2 18.0 18.4 18.7
Lower
Secundary
. 24.6 24.5 25.2 25.1 25.7
Primary . 28.7 28.4 27.3 27.0 25.8
None . 7.3 6.6 6.6 6.4 6.5
Degree of
urbanization
of residence
Very high 31.5 30.8 30.4 30.6 30.3 30.0
High 28.2 28.7 28.2 28.4 28.4 28.8
Average 26.7 26.2 26.7 26.1 26.6 26.2
Low 13.6 14.1 13.9 14.0 13.8 13.9
missing 0.1 0.1 0.7 1.0 1.0 1.1
Region Flanders 58.9 58.8 58.5 58.6 59.0 58.3
Wallonia 33.1 33.3 33.4 33.7 33.2 34.0
Brussels 8.0 7.9 8.1 7.8 7.9 7.7
Net taxable
income
Quintile 1 2.0 2.0 1.7 1.9 1.8 1.8
Quintile 2 13.0 12.5 12.2 11.3 11.4 12.7
Quintile 3 46.2 45.7 46.2 45.9 45.5 46.1
Quintile 4 27.4 28.0 28.0 29.2 29.3 28.6
Quintile 5 11.4 11.8 11.9 11.8 12.0 10.9
Cancertype Respiratory 27.8 27.4 26.3 26.2 26.3 25.2
Digestive
tract
28.9 29.0 29.1 28.5 28.5 28.4
Urinary
tract
6.4 6.1 6.5 6.3 6.3 6.5
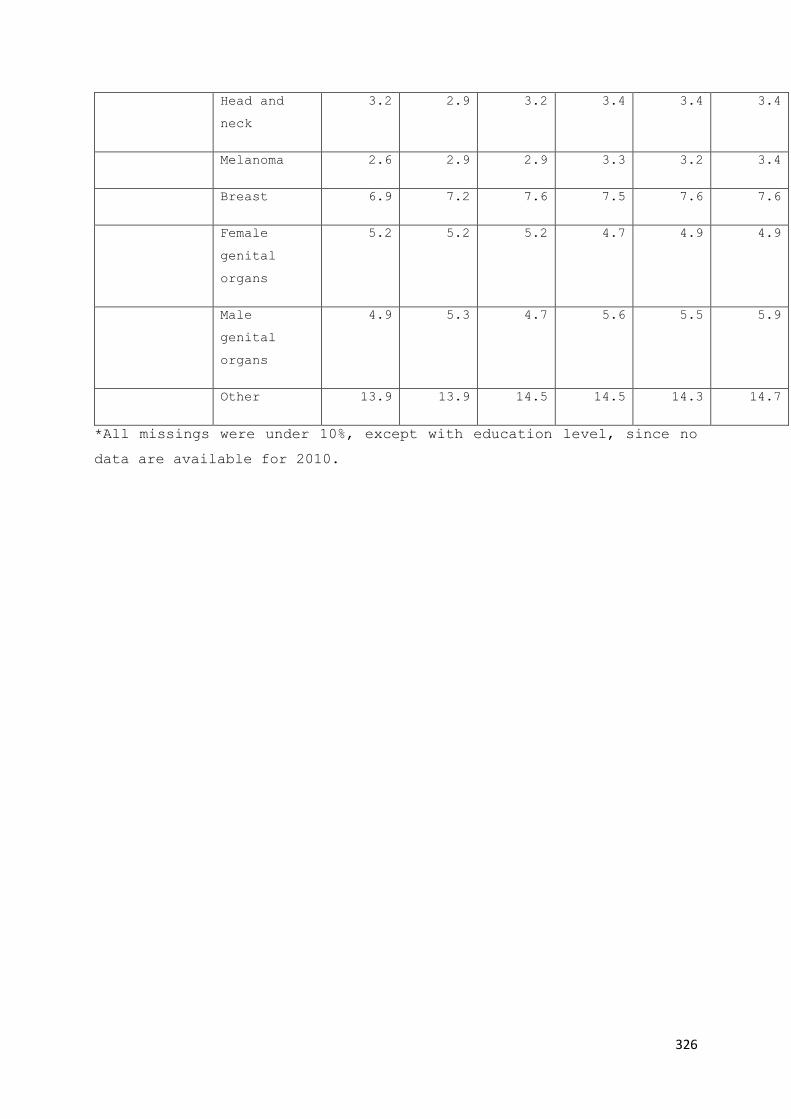
326
Head and
neck
3.2 2.9 3.2 3.4 3.4 3.4
Melanoma 2.6 2.9 2.9 3.3 3.2 3.4
Breast 6.9 7.2 7.6 7.5 7.6 7.6
Female
genital
organs
5.2 5.2 5.2 4.7 4.9 4.9
Male
genital
organs
4.9 5.3 4.7 5.6 5.5 5.9
Other 13.9 13.9 14.5 14.5 14.3 14.7
*All missings were under 10%, except with education level, since no
data are available for 2010.

327
Supplementary table S.9: Overview of all measured population
characteristics of people dying from COPD in Belgium, from 2010 until
2015.
People who died with COPD in Belgium (N = 37,930)
2010
(N =
6,878)
2011
(N =
6,568)
2012
(N =
6,336)
2013
(N =
6,274)
2014
(N =
5,689)
2015
(N =
6,185)
Average age 71.97 75.77 73.63 78.22 78.2 78.21
Agecategory <65 11.72 11.81 11.16 11.44 11.55 11.62
65-74 19.35 21.01 20.01 20.31 20.83 21.24
75-84 44.5 42.43 41.91 41.23 40.73 40.58
>84 24.43 24.74 26.92 27.02 26.89 26.55
Sex Female 32.68 34.61 35.63 35.58 36.23 36.7
Nationality Belgian 93.18 93.61 93.29 93.7 93.65 93.73
Living situation Single 31.63 31.07 32.74 31.42 31.79 31.29
Single
parent 5.22 4.42 4.79 4.71 4.89 4.68
Couple
with
children 7.58 7.91 7.2 7.53 6.74 7.12
Couple
without
children 37.18 37.88 37.34 37.91 37.04 36.5
Collective
(i.e.
nursing
home) 15.91 16.37 15.76 16.22 17.32 18.18
Other 2.48 2.35 2.16 2.19 2.22 2.23
Housing Comfort High 35.77 36.77 37.03 38.83 38.79 39.77
Average 20.61 20.35 20.44 18.6 18.99 18.73
Low 30.51 30.36 31.02 31.39 31.02 31.32
None 13.1 12.52 11.51 11.17 11.2 10.18
Highest attained
educational
level
Higher
education
. 6.06 6.22 5.51 7.05 6.77

328
Higher
secundary . 11.39 11.98 12.86 12.09 12.76
Lower
Secundary . 21.44 22.03 22.68 22.85 23.31
Primary . 35.87 35.87 34.91 34.89 34.54
None . 10.72 9.78 9.99 9.44 9.09
Degree of
urbanization
of residence
Very high
32.6 31.82 31.91 30.3 30.74 30.88
High 26.32 27.41 26.72 27.72 28.92 27.53
Average 25.71 25.03 24.49 23.92 23.13 24.28
Low 15.28 15.67 16.29 16.83 15.77 16.23
Region Flanders 49.64 48.99 46.86 47.15 46.23 48.1
Wallonia 41.68 41.99 45.25 45.07 46.17 44.47
Brussels 8.67 9.02 7.89 7.78 7.6 7.44
Net taxable
income
Quintile 1 2.1 1.7 1.5 1.5 1.8 1.6
Quintile 2 9.5 9.3 8.8 8.7 7.8 9.2
Quintile 3 57.8 56.1 58.2 57.5 55.3 58.9
Quintile 4 25.4 27.6 25.6 27.0 28.8 25.6
Quintile 5 5.2 5.3 5.9 5.4 6.4 4.8
*All missings were under 10%, except with education level, since no
data are available for 2010.

329
Supplementary table S.10: Overview of all measured population
characteristics of people dying with dementia in Belgium, from 2010
until 2015.
People who died with Dementia in Belgium, 2010-2015 (N = 59,967)
2010
(N =
10,017)
2011
(N =
9,891)
2012
(N =
10,137)
2013
(N =
9,411)
2014
(N =
9,882)
2015
(N =
10,629)
Average age 79.48 83.46 83.25 85.99 86.19 86.6
Agecategory <65 1.3 1.01 0.94 0.86 0.67 0.82
65-74 5.06 4.64 4.52 4.47 3.95 3.87
75-84 41.5 40.82 38.27 36.9 37.01 34.26
>84 52.14 53.52 56.26 57.77 58.37 61.05
Sex Female 65.35 65.37 65.95 66.12 66.4 65.82
Nationality Belgian 96.12 95.72 95.67 95.9 95.62 95.61
Householdtype Single 20.44 20.16 20.23 19.77 19.31 18.77
Single
parent 3.76 4.14 4.18 4 3.8 3.65
Couple with
children 4.4 4.34 4.08 3.9 4.03 3.92
Couple
without
children 27.17 26.37 25.73 25.82 25.89 24.91
Collective
(i.e.
nursing
home) 41.87 42.79 43.65 44.23 44.97 46.53
Other 2.36 2.21 2.14 2.29 2.01 2.21
Housing
Comfort
High
34.54 35.13 37.33 39.01 39.62 39.98
Average 27.4 26.9 26.24 24.42 24.61 23.38
Low 25.76 25.27 25.11 25.83 25.72 26.48
None 12.31 12.69 11.32 10.74 10.05 10.16
Highest
attained
Higher
education . 6.76 6.69 7.56 7.43 7.8

330
educational
level
Higher
secundary . 10.48 10.97 11.57 11.5 11.97
Lower
Secundary . 20.62 20.98 21.89 21.51 21.21
Primary . 37.51 38.94 36.82 37.06 37.44
None . 9.17 8.44 8.39 9.14 8.62
Degree of
urbanization
of residence
Very high
33.85 33.39 31.79 31.78 31.28 30.92
High 28.57 29.09 29.63 28.77 28.75 28.78
Average 24.88 24.09 24.67 24.57 24.18 25.42
Low 12.61 13.41 13.16 12.97 14.25 13.2
missing 0.09 0.02 0.76 1.9 1.53 1.67
Region Flanders 57.86 58.5 56.47 58.26 56.18 56.99
Wallonia 32.34 32.39 34.99 33.72 35.67 35.3
Brussels 9.79 9.11 8.54 8.02 8.15 7.71
Net taxable
income
Quintile 1
1.1 1.0 0.7 0.8 1.0 0.8
Quintile 2 11.3 11.4 11.1 10.9 10.8 11.3
Quintile 3 52.8 52.9 52.0 50.0 50.6 53.0
Quintile 4 27.3 28.2 28.3 29.8 28.8 27.1
Quintile 5 7.5 7.7 7.93 8.62 8.8 7.8
*All missings were under 10%, except with education level, since no
data are available for 2010.

331
Supplementary table S.11: All logistic regression models with odds
ratios and area under the curve for each quality indicator for people
with COPD.
Note: The goal of these regression models is not to be the best predictive
models possible, but rather to control for possible non-health care use
population differences between regions.
Inhalation Therapy Endotracheo Continuous intubation Repeated intubation Late physiotherapy Coroabdominal surgery Reanimation after intubation
OR CI min CI max OR CI min CI max OR CI min CI max OR CI min CI max OR CI min CI max OR CI min CI max OR CI min CI maxA ge 1.05 1.00 1.09S ex 1.90 1.42 2.53 2.19 1.29 3.72H igh care needs - handicap
H igh care needs - elderly 2.67 1.41 5.07H igh care needs – hom e care
H igh care needs - hospitalisation 0.55 0.34 0.88 0.26 0.08 0.83 0.08 0.01 1.35 0.26 0.08 0.83D egree of urbanisation of residence 1 vs 99 0.41 0.15 1.12D egree of urbanisation of residence 2 vs 99 0.43 0.16 1.17D egree of urbanisation of residence 3 vs 99 0.28 0.10 0.78D egree of urbanisation of residence 4 vs 99 0.62 0.22 1.76E ducation level 1 vs 0
E ducation level 2 vs 0
E ducation level 3 vs 0
E ducation level 4 vs 0
E ducation level 99 vs 0
N et taxable incom e
H ouseholdtype C ouple w ith children vs S ingle P arent
H ouseholdtype C ouple w ithout children vs S ingle P arent
H ouseholdtype C ollective vs S ingle P arent
H ouseholdtype O ther vs S ingle P arent
H ouseholdtype S ingle vs S ingle P arent
C om fort level of residence 1 vs 4
C om fort level of residence 2 vs 4
C om fort level of residence 3 vs 4 0.06 0.00 0.90B elgian or other natioanlity 0.39 0.22 0.67 0.26 0.07 0.93 0.26 0.07 0.93Lungcancer 0.18 0.02 1.52
AUC 0.64 0.66 0.50 0.66 0.67 0.50 0.72
Starting a new antidepr Specialist palliative care Official palliative status Homedeath Homedeath or nursing home death Increased GP contact
OR CI min CI max OR CI min CI max OR CI min CI max OR CI min CI max OR CI min CI max OR CI min CI maxA ge 0.96 0.93 0.98 0.95 0.92 0.99S ex 2.32 1.32 4.07H igh care needs - handicap
H igh care needs - elderly 2.49 1.29 4.78 0.54 0.41 0.71 0.58 0.44 0.78H igh care needs – hom e care 0.42 0.23 0.77 0.20 0.13 0.29 0.12 0.07 0.19 0.17 0.11 0.26H igh care needs - hospitalisation 4.23 2.44 7.34 2.66 1.68 4.21D egree of urbanisation of residence 1 vs 99 2.06 0.22 19.67D egree of urbanisation of residence 2 vs 99 1.60 0.17 15.34D egree of urbanisation of residence 3 vs 99 1.87 0.20 17.98D egree of urbanisation of residence 4 vs 99 4.17 0.43 40.63E ducation level 1 vs 0
E ducation level 2 vs 0
E ducation level 3 vs 0
E ducation level 4 vs 0
E ducation level 99 vs 0
N et taxable incom e
H ouseholdtype C ouple w ith children vs S ingle P arent 1.24 0.47 3.24 1.23 0.40 3.76 0.80 0.29 2.20 0.88 0.38 2.09 0.38 0.14 1.03H ouseholdtype C ouple w ithout children vs S ingle P arent 0.74 0.33 1.69 0.62 0.23 1.62 0.57 0.25 1.32 0.60 0.29 1.22 0.46 0.19 1.10H ouseholdtype C ollective vs S ingle P arent 0.33 0.14 0.80 0.03 0.00 0.22 0.06 0.02 0.20 3.22 1.55 6.70 0.67 0.27 1.62H ouseholdtype O ther vs S ingle P arent 0.60 0.13 2.71 0.63 0.10 3.81 0.83 0.20 3.45 1.62 0.49 5.41 0.22 0.06 0.78H ouseholdtype S ingle vs S ingle P arent 0.54 0.23 1.29 0.56 0.20 1.58 0.59 0.24 1.41 0.98 0.47 2.05 0.43 0.18 1.05C om fort level of residence 1 vs 4
C om fort level of residence 2 vs 4
C om fort level of residence 3 vs 4 2.68 1.49 4.82B elgian or other natioanlity 1.83 1.05 3.16Lungcancer
AUC 0.67 0.75 0.86 0.82 0.75 0.63

332
Diagnostic Testing Medical Imaging EGC or Spirometry Reanimation Surgery Bloodtransfusion Late start of palliative care Hospital admission
OR CI min CI max OR CI min CI max OR CI min CI max OR CI min CI max OR CI min CI max OR CI min CI max OR CI min CI max OR CI min CI maxA ge 1.53 1.17 2.01 0.89 0.81 0.98S ex 1.73 1.35 2.22 1.34 1.02 1.76 1.48 1.13 1.95H igh care needs - handicap
H igh care needs - elderly 1.79 1.37 2.34 2.02 1.55 2.64 1.75 1.31 2.35 1.87 1.42 2.47H igh care needs – hom e care
H igh care needs - hospitalisation 0.41 0.25 0.66 0.35 0.22 0.57 0.56 0.35 0.89 0.47 0.14 1.64 0.34 0.21 0.55D egree of urbanisation of residence 1 vs 99 0.18 0.06 0.54D egree of urbanisation of residence 2 vs 99 0.18 0.06 0.54D egree of urbanisation of residence 3 vs 99 0.17 0.05 0.52D egree of urbanisation of residence 4 vs 99 0.24 0.07 0.80E ducation level 1 vs 0
E ducation level 2 vs 0
E ducation level 3 vs 0
E ducation level 4 vs 0
E ducation level 99 vs 0
N et taxable incom e 0.91 0.84 0.99 0.89 0.82 0.97 1.99 1.20 3.30 0.91 0.83 0.99H ouseholdtype C ouple w ith children vs S ingle P arent 1.49 0.63 3.51 1.37 0.58 3.23H ouseholdtype C ouple w ithout children vs S ingle P arent 1.27 0.62 2.61 1.21 0.58 2.51H ouseholdtype C ollective vs S ingle P arent 0.78 0.38 1.59 0.69 0.33 1.43H ouseholdtype O ther vs S ingle P arent 1.12 0.35 3.61 0.99 0.30 3.26H ouseholdtype S ingle vs S ingle P arent 1.13 0.54 2.35 0.96 0.46 2.02C om fort level of residence 1 vs 4 <0.001 <0.001 >999.999C om fort level of residence 2 vs 4 0.20 0.02 2.20C om fort level of residence 3 vs 4 0.17 0.02 1.90B elgian or other natioanlity 0.53 0.30 0.92 0.52 0.30 0.90 0.53 0.31 0.92Lungcancer 0.57 0.33 0.99
AUC 0.66 0.66 0.61 0.50 0.50 0.87 0.55 0.67
ED admission Death in hospital ICU admission ICU admission from nursing home PAC installment
OR CI min CI max OR CI min CI max OR CI min CI max OR CI min CI max OR CI min CI maxA ge 0.98 0.96 1.00 0.95 0.90 1.01 0.90 0.83 0.98S ex 1.45 1.11 1.88H igh care needs - handicap
H igh care needs - elderly 1.46 1.10 1.93 1.73 1.29 2.31H igh care needs – hom e care
H igh care needs - hospitalisation 0.57 0.36 0.89 0.23 0.14 0.38 <0.001 <0.001 >999.999D egree of urbanisation of residence 1 vs 99
D egree of urbanisation of residence 2 vs 99
D egree of urbanisation of residence 3 vs 99
D egree of urbanisation of residence 4 vs 99
E ducation level 1 vs 0
E ducation level 2 vs 0
E ducation level 3 vs 0
E ducation level 4 vs 0
E ducation level 99 vs 0
N et taxable incom e
H ouseholdtype C ouple w ith children vs S ingle P arent 1.15 0.48 2.79H ouseholdtype C ouple w ithout children vs S ingle P arent 1.37 0.65 2.89H ouseholdtype C ollective vs S ingle P arent 0.57 0.27 1.21H ouseholdtype O ther vs S ingle P arent 0.81 0.23 2.84H ouseholdtype S ingle vs S ingle P arent 0.74 0.34 1.60C om fort level of residence 1 vs 4
C om fort level of residence 2 vs 4
C om fort level of residence 3 vs 4
B elgian or other natioanlity 0.43 0.25 0.74Lungcancer
AUC 0.59 0.69 0.50 0.70 0.50

333
Supplementary table S.12: All logistic regression models with odds
ratios and area under the curve for each quality indicator for people
with dementia.
Note: The goal of these regression models is not to be the best predictive
models possible, but rather to control for possible non-health care use
population differences between regions.
Morphine and neuropathics Specialist palliative care Official palliative status Homedeath Homedeath or nursing home death Increase in GP contact
OR CI min CI max OR CI min CI max OR CI min CI max OR CI min CI max OR CI min CI max OR CI min CI maxA ge 0.92 0.91 0.94 0.98 0.97 0.99 0.99 0.98 1.00 1.02 1.01 1.03 1.01 1.00 1.02S ex 0.66 0.49 0.89 0.79 0.67 0.93 0.85 0.77 0.94H igh care needs - handicap 0.72 0.66 0.80H igh care needs - elderly 1.26 1.07 1.48 0.83 0.72 0.96 2.04 1.66 2.51H igh care needs – hom e care 0.18 0.15 0.21 0.10 0.09 0.13 0.13 0.11 0.16 1.91 1.14 3.19H igh care needs - hospitalisation 0.43 0.27 0.67 1.80 1.27 2.56 4.19 3.01 5.85D egree of urbanisation of residence 1 vs 99 0.66 0.37 1.19 0.89 0.36 2.25 1.11 0.54 2.28 0.84 0.58 1.23D egree of urbanisation of residence 2 vs 99 0.72 0.40 1.30 1.10 0.44 2.77 1.14 0.56 2.34 1.23 0.84 1.80D egree of urbanisation of residence 3 vs 99 0.81 0.45 1.44 1.18 0.47 2.96 1.27 0.62 2.61 1.10 0.75 1.61D egree of urbanisation of residence 4 vs 99 1.00 0.55 1.82 1.58 0.62 4.00 1.93 0.93 4.00 1.02 0.69 1.51E ducation level 1 vs 0
E ducation level 2 vs 0
E ducation level 3 vs 0
E ducation level 4 vs 0
E ducation level 99 vs 0
N et taxable incom e 0.94 0.89 0.98H ouseholdtype C ouple w ith children vs S ingle P arent 1.23 0.84 1.78 1.12 0.72 1.72 1.31 0.91 1.88 1.01 0.54 1.89 1.11 0.81 1.52H ouseholdtype C ouple w ithout children vs S ingle P arent 0.87 0.64 1.17 0.92 0.66 1.29 0.93 0.70 1.23 1.32 0.82 2.13 1.28 1.00 1.63H ouseholdtype C ollective vs S ingle P arent 0.30 0.22 0.41 0.05 0.03 0.09 0.08 0.05 0.12 1.54 0.99 2.40 1.75 1.38 2.21H ouseholdtype O ther vs S ingle P arent 0.93 0.59 1.46 0.84 0.49 1.43 0.97 0.63 1.51 0.85 0.44 1.64 0.82 0.57 1.17H ouseholdtype S ingle vs S ingle P arent 0.54 0.39 0.74 0.40 0.27 0.60 0.58 0.43 0.79 1.27 0.79 2.03 1.00 0.78 1.27C om fort level of residence 1 vs 4
C om fort level of residence 2 vs 4
C om fort level of residence 3 vs 4
B elgian or other natioanlity 1.87 1.36 2.56 1.45 1.17 1.80
AUC 0.69 0.76 0.88 0.85 0.61 0.62
Diagnostic Testing Medical Imaging ECG or Spirometry Chemotherapy Reanimation Surgery Bloodtransfusion
OR CI min CI max OR CI min CI max OR CI min CI max OR CI min CI max OR CI min CI max OR CI min CI max OR CI min CI maxA ge 0.99 0.98 1.00 0.99 0.98 1.00S ex 1.50 1.36 1.65 1.50 1.36 1.65 1.39 1.25 1.55 2.57 1.61 4.09H igh care needs - handicap
H igh care needs - elderly 1.51 1.38 1.65 1.52 1.38 1.66 1.37 1.23 1.52H igh care needs – hom e care
H igh care needs - hospitalisation 0.47 0.38 0.58 0.49 0.40 0.61 0.66 0.54 0.82 0.27 0.12 0.59 0.27 0.14 0.56D egree of urbanisation of residence 1 vs 99
D egree of urbanisation of residence 2 vs 99
D egree of urbanisation of residence 3 vs 99
D egree of urbanisation of residence 4 vs 99
E ducation level 1 vs 0 0.92 0.78 1.08 0.91 0.78 1.08 0.92 0.77 1.11E ducation level 2 vs 0 0.90 0.76 1.07 0.89 0.75 1.06 0.85 0.70 1.04E ducation level 3 vs 0 0.75 0.62 0.91 0.74 0.61 0.90 0.74 0.59 0.92E ducation level 4 vs 0 0.76 0.61 0.94 0.78 0.63 0.97 0.76 0.60 0.97E ducation level 99 vs 0 1.04 0.85 1.27 1.05 0.86 1.29 0.99 0.79 1.23N et taxable incom e
H ouseholdtype C ouple w ith children vs S ingle P arent 0.91 0.68 1.23 0.90 0.67 1.22 0.79 0.57 1.08H ouseholdtype C ouple w ithout children vs S ingle P arent 0.98 0.78 1.23 0.96 0.76 1.21 0.78 0.61 1.00H ouseholdtype C ollective vs S ingle P arent 0.50 0.40 0.63 0.50 0.40 0.62 0.43 0.34 0.54H ouseholdtype O ther vs S ingle P arent 0.94 0.67 1.33 0.88 0.62 1.24 0.87 0.60 1.26H ouseholdtype S ingle vs S ingle P arent 1.04 0.83 1.31 1.04 0.82 1.31 0.78 0.61 0.99C om fort level of residence 1 vs 4 0.79 0.68 0.92 0.81 0.69 0.94 0.78 0.65 0.92C om fort level of residence 2 vs 4 0.86 0.73 1.01 0.86 0.73 1.01 0.78 0.65 0.93C om fort level of residence 3 vs 4 0.94 0.81 1.10 0.93 0.80 1.09 0.90 0.76 1.08B elgian or other natioanlity 0.58 0.47 0.71 0.56 0.46 0.69 0.71 0.57 0.89
AUC 0.65 0.65 0.63 0.55 0.50 0.62 0.55

334
Late Palliative care Hospital admission ED admission ICU admission ICU admission from nursing home Statines
OR CI min CI max OR CI min CI max OR CI min CI max OR CI min CI max OR CI min CI max OR CI min CI maxA ge 0.98 0.97 0.99 0.99 0.98 1.00 0.99 0.98 1.00 0.96 0.94 0.97 0.94 0.92 0.97 0.96 0.95 0.98S ex 1.51 1.37 1.67 1.41 1.28 1.57 1.50 1.26 1.78H igh care needs - handicap
H igh care needs - elderly 1.46 1.32 1.60 1.33 1.20 1.46 1.46 1.07 1.99 1.22 1.02 1.45H igh care needs – hom e care 0.45 0.35 0.57 1.43 1.08 1.88H igh care needs - hospitalisation 0.46 0.37 0.57 0.68 0.55 0.84D egree of urbanisation of residence 1 vs 99 0.49 0.25 0.97D egree of urbanisation of residence 2 vs 99 0.55 0.28 1.07D egree of urbanisation of residence 3 vs 99 0.61 0.31 1.20D egree of urbanisation of residence 4 vs 99 0.75 0.38 1.50E ducation level 1 vs 0 0.90 0.68 1.20E ducation level 2 vs 0 0.82 0.60 1.11E ducation level 3 vs 0 0.66 0.46 0.93E ducation level 4 vs 0 0.51 0.34 0.76E ducation level 99 vs 0 0.84 0.59 1.21N et taxable incom e 0.95 0.92 0.98H ouseholdtype C ouple w ith children vs S ingle P arent 1.70 0.96 3.02 0.88 0.66 1.19 0.75 0.55 1.03 1.39 0.57 3.37 0.65 0.37 1.14H ouseholdtype C ouple w ithout children vs S ingle P arent 1.46 0.90 2.36 0.91 0.72 1.14 0.75 0.59 0.96 1.03 0.49 2.16 0.97 0.64 1.46H ouseholdtype C ollective vs S ingle P arent 0.64 0.39 1.06 0.45 0.36 0.56 0.47 0.37 0.59 0.64 0.30 1.36 0.55 0.37 0.83H ouseholdtype O ther vs S ingle P arent 1.62 0.83 3.15 0.89 0.63 1.27 0.98 0.68 1.40 0.64 0.17 2.44 0.79 0.40 1.53H ouseholdtype S ingle vs S ingle P arent 0.95 0.57 1.58 0.92 0.73 1.16 0.82 0.64 1.04 1.46 0.69 3.09 0.89 0.59 1.36C om fort level of residence 1 vs 4 0.77 0.66 0.90 0.70 0.60 0.82C om fort level of residence 2 vs 4 0.85 0.72 1.01 0.77 0.65 0.92C om fort level of residence 3 vs 4 0.96 0.82 1.13 0.83 0.71 0.99B elgian or other natioanlity 0.61 0.49 0.75 0.62 0.50 0.77
AUC 0.67 0.66 0.62 0.66 0.63 0.64
Proton Pump Inhibitors Anti-hypertensives Calcium with Vit D NOAC Gout prevention medication SSRI
OR CI min CI max OR CI min CI max OR CI min CI max OR CI min CI max OR CI min CI max OR CI min CI maxA ge 1.02 1.01 1.03 0.97 0.96 0.98S ex 1.20 1.08 1.32 1.39 1.26 1.52 2.21 1.61 3.03 0.81 0.70 0.94H igh care needs - handicap
H igh care needs - elderly 1.19 1.08 1.30 1.17 1.07 1.28 1.25 1.15 1.37H igh care needs – hom e care 1.21 1.05 1.39 1.28 1.01 1.62H igh care needs - hospitalisation 0.39 0.32 0.48 0.61 0.50 0.75 0.46 0.36 0.60 0.50 0.41 0.62D egree of urbanisation of residence 1 vs 99 1.36 0.73 2.55D egree of urbanisation of residence 2 vs 99 0.96 0.51 1.80D egree of urbanisation of residence 3 vs 99 0.94 0.50 1.78D egree of urbanisation of residence 4 vs 99 1.18 0.62 2.24E ducation level 1 vs 0 0.97 0.84 1.13 0.96 0.82 1.13E ducation level 2 vs 0 0.99 0.84 1.16 0.93 0.79 1.10E ducation level 3 vs 0 0.79 0.66 0.95 0.80 0.66 0.97E ducation level 4 vs 0 0.74 0.60 0.91 0.84 0.68 1.04E ducation level 99 vs 0 0.82 0.68 0.99 1.05 0.86 1.27N et taxable incom e 1.09 1.04 1.14H ouseholdtype C ouple w ith children vs S ingle P arent 0.98 0.71 1.34 0.72 0.54 0.96 1.01 0.60 1.68 1.13 0.84 1.51 0.85 0.30 2.39H ouseholdtype C ouple w ithout children vs S ingle P arent 0.85 0.67 1.09 0.70 0.56 0.87 1.23 0.83 1.81 0.99 0.79 1.24 1.04 0.47 2.30H ouseholdtype C ollective vs S ingle P arent 0.76 0.60 0.96 0.56 0.45 0.70 0.68 0.46 1.00 0.71 0.57 0.88 0.62 0.28 1.36H ouseholdtype O ther vs S ingle P arent 0.82 0.56 1.20 0.72 0.51 1.01 1.26 0.72 2.23 0.96 0.68 1.36 0.70 0.18 2.72H ouseholdtype S ingle vs S ingle P arent 0.94 0.74 1.21 0.75 0.60 0.95 1.44 0.97 2.14 1.11 0.88 1.39 1.09 0.49 2.46C om fort level of residence 1 vs 4 0.77 0.66 0.91 0.85 0.74 0.99 0.87 0.74 1.01C om fort level of residence 2 vs 4 0.86 0.73 1.02 0.89 0.76 1.03 0.90 0.77 1.05C om fort level of residence 3 vs 4 0.92 0.78 1.08 0.97 0.84 1.13 1.03 0.88 1.20B elgian or other natioanlity 0.71 0.58 0.88 0.79 0.65 0.97 0.73 0.60 0.90
AUC 0.57 0.57 0.62 0.60 0.61 0.57