population in tower hamlets a profile of the migrant · a profile of the migrant population in...
TRANSCRIPT
A Profile of the Migrant Population in Tower Hamlets
Corporate Research Unit
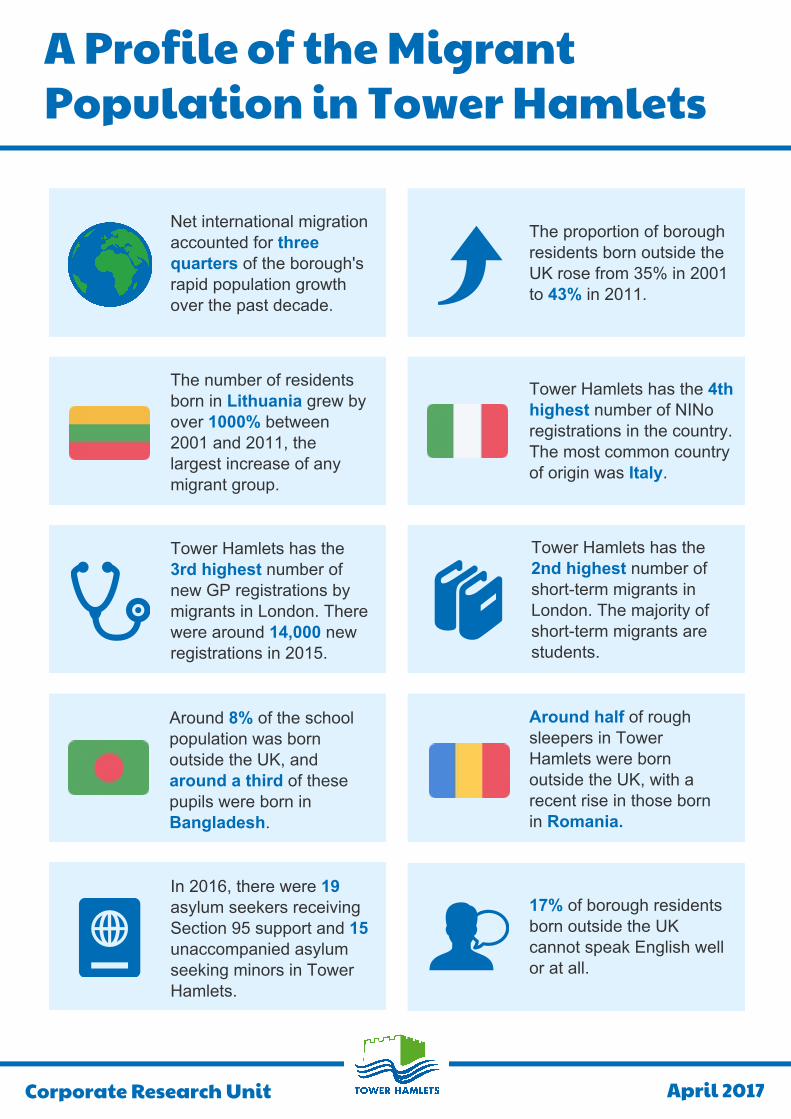
Netinternationalmigrationaccountedforthreequartersoftheborough'srapidpopulationgrowthoverthepastdecade.
TheproportionofboroughresidentsbornoutsidetheUKrosefrom35%in2001to43%in2011.
ThenumberofresidentsborninLithuaniagrewbyover1000%between2001and2011,thelargestincreaseofanymigrantgroup.
TowerHamletshasthe4thhighestnumberofNINoregistrationsinthecountry.ThemostcommoncountryoforiginwasItaly.
TowerHamletshasthe3rdhighestnumberofnewGPregistrationsbymigrantsinLondon.Therewerearound14,000newregistrationsin2015.
TowerHamletshasthe2ndhighestnumberofshort-termmigrantsinLondon.Themajorityofshort-termmigrantsarestudents.
Around8%oftheschoolpopulationwasbornoutsidetheUK,andaroundathirdofthesepupilswereborninBangladesh.
AroundhalfofroughsleepersinTowerHamletswerebornoutsidetheUK,witharecentriseinthoseborninRomania.
In2016,therewere19asylumseekersreceivingSection95supportand15unaccompaniedasylumseekingminorsinTowerHamlets.
17%ofboroughresidentsbornoutsidetheUKcannotspeakEnglishwelloratall.
April 2017
A Profile of the Migrant Population in Tower Hamlets
Corporate Research Unit | 1
Introduction
This briefing provides analysis of a range of data which helps to build a profile of the migrant population in Tower Hamlets. It examines data from a range of sources including: the Census, the mid-year estimates, National Insurance number registrations, ‘Flag 4’ GP registrations, short-term migration, the School Census, asylum seekers, and rough sleeping.
The borough’s diverse population
The most recent estimate of the population of Tower Hamlets stands at 295,200.1 According to the last Census in 2011, 43 per cent of our residents were born outside the UK, and more than two thirds of the population (69 per cent) are from ethnic minority groups.2 The borough has the 9th highest proportion in England of residents born outside the UK3, and is ranked as the 16th most ethnically diverse local authority in England in terms of the mix of different ethnic group populations in the borough4. The borough’s migrant population is hugely diverse and includes older residents who migrated to London decades ago alongside more recent arrivals. Around a quarter of the borough’s residents who were born outside the UK (28 per cent) are long established migrants who arrived in the UK twenty or more years ago (before 1991), 18 per cent arrived between 1991 and 2000, and over half (54 per cent) arrived between 2001 and 2011.5 The majority of the borough’s migrants arrived in the country as young adults (57 per cent) or children (24 per cent).6 Residents born in Bangladesh are, by far, the largest single migrant group in Tower Hamlets, representing 15 per cent of the borough population and over one third of the total migrant population.7 The Census identified a further 20 migrant groups with significant populations of more than 1,000 residents. The largest groups of migrants were from India, China, Italy, France, Somalia, Ireland, Poland, Australia, Germany, the US and Spain.8 The borough’s diverse population enjoys a high level of social cohesion, with 87 per cent of residents agreeing that their local area is a place where people from different backgrounds get on well together.9
Population change
The population of Tower Hamlets has been growing rapidly since the early eighties. According to the ONS mid-year estimates, the population of the borough has more than doubled in the past thirty years, rising from 144,800 in 1985 up to 295,200 in 2015. This has made Tower Hamlets by far the fastest growing local authority in England & Wales. Recent
1 Office for National Statistics, Mid-Year Estimates 2015.
2 ‘Ethnic minority groups’ are defined as all ethnic groups except the White British group.
3 Office for National Statistics, Census 2011 Table QS203.
4 Greater London Authority, 2011 Census Snapshot: Ethnic Diversity Indices, December 2012
5 Office for National Statistics, Census 2011 Table QS801.
6 Office for National Statistics, Census 2011 Table QS802.
7 Office for National Statistics, Census 2011 Table QS203.
8 Office for National Statistics, Census 2011 Table CT0048.
9 Tower Hamlets Annual Residents Survey 2016
A Profile of the Migrant Population in Tower Hamlets
Corporate Research Unit | 2
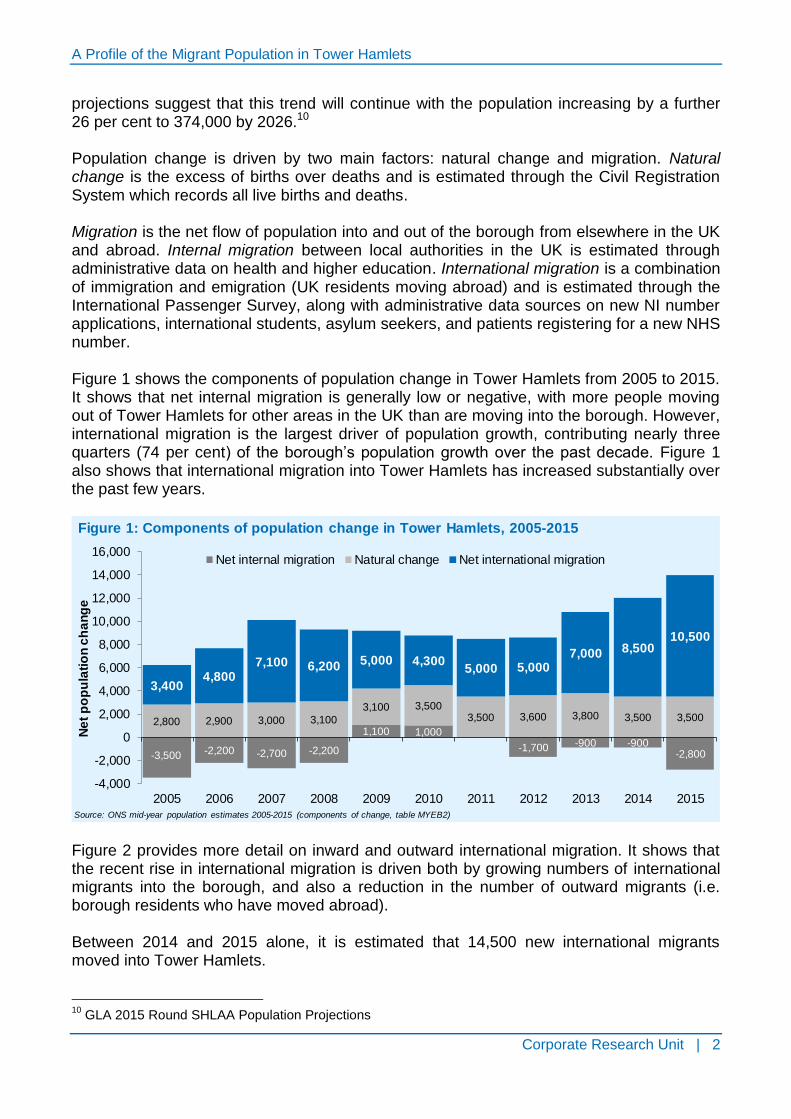
projections suggest that this trend will continue with the population increasing by a further 26 per cent to 374,000 by 2026.10 Population change is driven by two main factors: natural change and migration. Natural change is the excess of births over deaths and is estimated through the Civil Registration System which records all live births and deaths. Migration is the net flow of population into and out of the borough from elsewhere in the UK and abroad. Internal migration between local authorities in the UK is estimated through administrative data on health and higher education. International migration is a combination of immigration and emigration (UK residents moving abroad) and is estimated through the International Passenger Survey, along with administrative data sources on new NI number applications, international students, asylum seekers, and patients registering for a new NHS number. Figure 1 shows the components of population change in Tower Hamlets from 2005 to 2015. It shows that net internal migration is generally low or negative, with more people moving out of Tower Hamlets for other areas in the UK than are moving into the borough. However, international migration is the largest driver of population growth, contributing nearly three quarters (74 per cent) of the borough’s population growth over the past decade. Figure 1 also shows that international migration into Tower Hamlets has increased substantially over the past few years.
Figure 2 provides more detail on inward and outward international migration. It shows that the recent rise in international migration is driven both by growing numbers of international migrants into the borough, and also a reduction in the number of outward migrants (i.e. borough residents who have moved abroad). Between 2014 and 2015 alone, it is estimated that 14,500 new international migrants moved into Tower Hamlets.
10
GLA 2015 Round SHLAA Population Projections
-3,500 -2,200 -2,700 -2,200
1,100 1,000
-1,700 -900 -900-2,800
2,800 2,900 3,000 3,100
3,100 3,5003,500 3,600 3,800 3,500 3,500
3,4004,800
7,100 6,200 5,000 4,3005,000 5,000
7,000 8,50010,500
-4,000
-2,000
0
2,000
4,000
6,000
8,000
10,000
12,000
14,000
16,000
2005 2006 2007 2008 2009 2010 2011 2012 2013 2014 2015
Ne
t p
op
ula
tio
n c
ha
ng
e
Net internal migration Natural change Net international migration
Source: ONS mid-year population estimates 2005-2015 (components of change, table MYEB2)
Figure 1: Components of population change in Tower Hamlets, 2005-2015

A Profile of the Migrant Population in Tower Hamlets
Corporate Research Unit | 3
According to the mid-year estimates, men have made up slightly over half of the borough’s international migrants (53 per cent), and women have made up 47 per cent in the past four years. Nearly half (46 per cent) of migrants arriving in the borough in the past four years were young adults (aged 16-29), 33 per cent were aged between 30-59, 16% were children under the age of 16 and 5 per cent were aged 60 or older.
Country of birth (2001 vs. 2011 Census)
By comparing the 2001 and 2011 Census, we can see how the borough’s migrant population has changed, and which countries recent migrants have come from. Table 1 provides a breakdown of the population by region of birth. It shows that the proportion of Tower Hamlets residents born outside the UK increased from 35 per cent in 2001 to 43 per cent in 2011. The region with largest increase in migrants (in terms of number) was Europe: there were over 19,000 more borough residents who were born in Europe in 2011 than there were in 2001. This meant that European resident went from making up 5 per cent of the total borough population in 2001 to making up 12 per cent of the total borough population in 2011. Table 2 provides a breakdown of the borough’s migrants by their country of birth, ranked by the fastest growing groups between 2001 and 2011. It shows that the number of residents born in Lithuania grew by over 1,000 per cent, rising from 102 residents in 2001 to 1,140 in 2011. This was followed by a 901 per cent increase in residents from Poland and a 585 per cent increase in residents from China. In terms of number, Bangladesh saw the largest increase (3,057 additional residents) followed by China (3,008 additional residents) and India (2,798 additional residents).
7,1008,600
10,500 9,800 9,80011,700
10,300 10,60012,000 13,100
14,500
-3,700 -3,800 -3,500 -3,600 -4,800-7,300
-5,300 -5,600 -5,000 -4,700 -3,900
-8,000
-3,000
2,000
7,000
12,000
17,000
2005 2006 2007 2008 2009 2010 2011 2012 2013 2014 2015
Ne
t p
op
ula
tio
n c
ha
ng
e
International inward migration International outward migration
Source: ONS mid-year population estimates 2005-2015 (components of change, table MYEB2) Note: Totals for a given year may not sum to the 'net' total in Figure 1 due to rounding.
Figure 2: International migration in Tower Hamlets, 2005-2015

A Profile of the Migrant Population in Tower Hamlets
Corporate Research Unit | 4
2001 2011 Increase % change 2001 2011
All usual residents 196,106 254,096 57,990 30 100 100
Born in UK 128,129 144,662 16,533 13 65 57
Born outside UK 67,977 109,434 41,457 61 35 43
Europe* 10,269 29,363 19,094 186 5 12
Africa 7,147 11,342 4,195 59 4 4
Middle East* 560 1,687 1,127 201 <1 1
Asia 42,130 54,819 12,689 30 21 22
- Bangladesh 35,820 38,877 3,057 9 18 15
- Rest of Asia 6,310 15,942 9,632 153 3 6
Americas & Caribbean 4,340 8,257 3,917 90 2 3
Australasia/Oceania/other 3,531 3,966 435 12 2 2
Table 1: Change in population by region of birth, Tower Hamlets, 2001-2011
Change
2001-2011
Population
composition
(% totals)
Born outside UK: by area
Source: ONS 2001 Census (Table UV08); 2011 Census (Table KS204)
* In 2001, ONS included Cyprus under the Middle East, whereas in 2011, it was included as part of Europe. To adjust
for this, 2001 data have been adjusted in this table to include Cyprus under Europe not the Middle East to provide a
better like for like comparison. This means these figures are marginally different from published ONS data.
2001 2011
All born outside UK 67,977 109,434 41,457 61
Lithuania 102 1,140 1,038 1,018
Poland 267 2,674 2,407 901
China 514 3,522 3,008 585
Brazil 216 1,439 1,223 566
Spain 418 2,025 1,607 384
Italy 733 3,047 2,314 316
India 1,091 3,889 2,798 256
France 851 3,014 2,163 254
U.S.A 820 2,143 1,323 161
Germany 1,005 2,318 1,313 131
Turkey 444 1,005 561 126
Somalia 1,353 2,925 1,572 116
Australia 1,568 2,671 1,103 70
Hong Kong 857 1,218 361 42
Pakistan 827 1,141 314 38
South Africa 1,146 1,481 335 29
Nigeria 1,012 1,269 257 25
Bangladesh 35,820 38,877 3,057 9
Ireland 2,692 2,862 170 6
New Zealand 1,213 1,249 36 3
Vietnam 1,147 1,109 -38 -3
Source: Commissioned tables: 2001 Census (C0413); 2011 Census (CT0048)
Table 2: Change in population by country of birth (largest migrant groups), Tower Hamlets,
2001-2011 (ranked by fastest growing)
Population size Population
change
% change
(ranked)
Countries of birth (>1000 residents in 2011):

A Profile of the Migrant Population in Tower Hamlets
Corporate Research Unit | 5
Economic migration (NINo registrations)
Registrations for new National Insurance numbers (NINo) can be used as a proxy for international economic migration, as new migrants require a National Insurance number to take up work in the UK. However, this data does not provide an indication of when the registrant arrived in the country, or whether they are still resident in the local authority area, as this data relates to the local authority where they were resident at the time of application. Tower Hamlets has the fourth highest number of National Insurance number registrations in the country after Newham, Brent and Birmingham, reflecting the large number of job opportunities in the local area. The number of overseas nationals registering for a National Insurance number in the borough has generally been rising over the past decade. Figure 3 shows that in 2005/06, there were 10,459 registrations in the borough which rose to around 17,642 in 2015/16. Over the past five years, the number of NINo registrations has risen by 15 per cent.
Figure 4 shows a breakdown of NINo registrations in the borough by Middle Super Output Area (MSOA). It shows that the areas with the highest number of registrations are around Canary Wharf, Blackwall & Cubitt Town, and the City Fringe.
10,45911,555
13,200 13,110 13,565
15,30114,205 14,815 15,252
18,88217,642
0
2,000
4,000
6,000
8,000
10,000
12,000
14,000
16,000
18,000
20,000
2005/06 2006/07 2007/08 2008/09 2009/10 2010/11 2011/12 2012/13 2013/14 2014/15 2015/16
Nu
mb
er
of
NIN
o r
eg
istr
ati
on
s
Source: DWP, National Insurance Number (NINo) registrations via Stat-Xplore
Figure 3: Number of National Insurance Number registrations in Tower Hamlets, 2006/7-15/16

A Profile of the Migrant Population in Tower Hamlets
Corporate Research Unit | 6
Figure 5 provides a ranking of the number of NINo registrations by country of origin compared with London and England. It shows that the most common country of origin in Tower Hamlets is Italy, while it is Romania in both London and England. Table 3 also provides the number and percentage of the borough’s NINo registrations from the top five countries of origin. It shows that in 2015/16, there were 3,613 new NINo registrations by Italian nationals in Tower Hamlets, making up one in five of the borough’s economic migrants. This also gives Tower Hamlets the highest number of Italian registrants in the country. Anecdotal information from council services and the voluntary sector suggests that this increase could be driven by the arrival of Italians of Bangladeshi origin. The large majority of registrants, 88 per cent, are aged under 35. Around 11 per cent of registrants are aged between 35 and 54, and less than 1 per cent are aged 55 or older. However, the age of registrants varies by country of origin. For example, whilst registrants from Italy come from all age groups, Australian registrants in the borough are mostly in their 20s.
GP registrations (‘Flag 4’)
The NHS generates a ‘flag 4’ record when an individual registers with a GP and they were born outside the UK and are registering with an NHS GP for the first time, or an individual’s previous address was outside the UK and the time spent outside the UK was more than three months. In 2015, Tower Hamlets had 14,089 ‘flag 4’ registrations, giving the borough the third highest number in London after Newham (15,556) and Brent (15,118). Figure 6 also shows that ‘flag 4’ registrations have increased in the borough over the past ten years. The number of ‘flag 4’ registrations more than doubled from 6,186 in 2005 to 14,089 in 2015.
RankTower
HamletsLondon England
Italy Romania Romania
France Italy Poland
Spain Spain Italy
Romania Poland Spain
India France Bulgaria
Figure 5: Top five countries of origin for
NINo registrations in 2015/16
Source: DWP, National Insurance Number (NINo)
registrations via Stat-Xplore
1
2
3
4
5
Country of
birth
Number of
NINo
registrations
% of all NINo
registrations
Italy 3,613 20.5
France 2,032 11.5
Spain 1,921 10.9
Romania 846 4.8
India 693 3.9
Total 17,642 100
Table 3: Top five countries of origin for
NINo registrations in Tower Hamlets,
2015/16
Source: DWP, National Insurance Number (NINo)
registrations via Stat-Xplore
A Profile of the Migrant Population in Tower Hamlets
Corporate Research Unit | 7
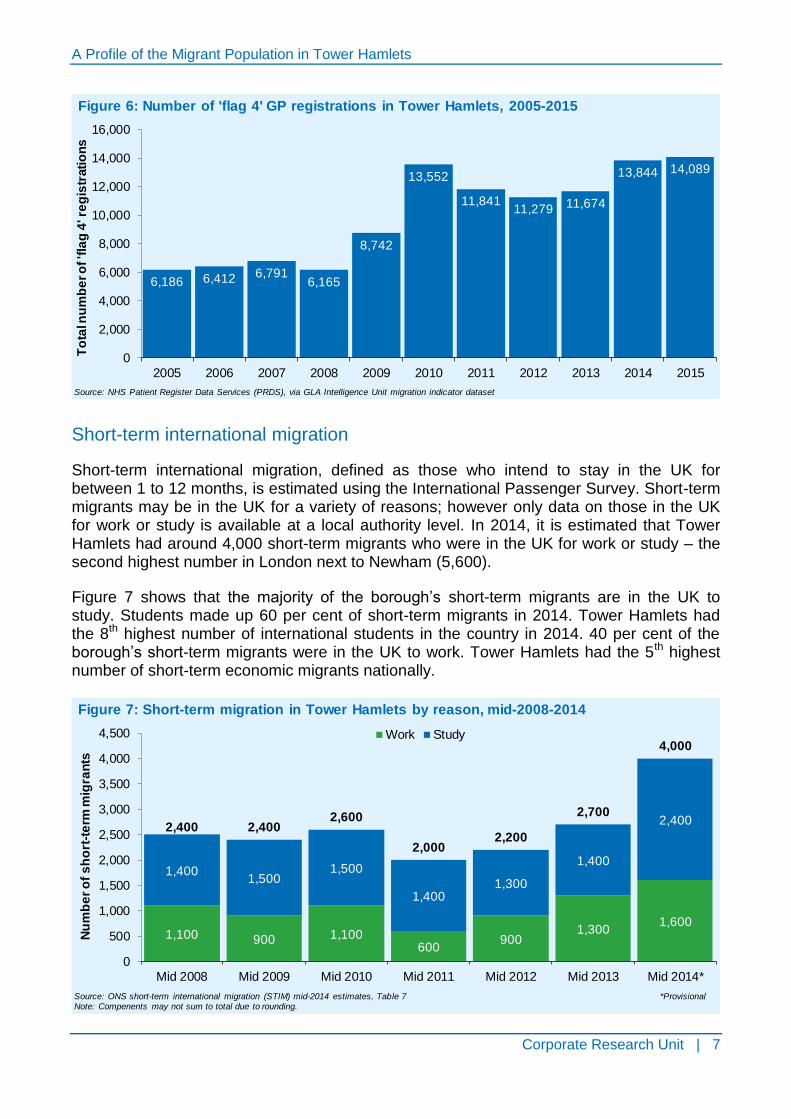
Short-term international migration
Short-term international migration, defined as those who intend to stay in the UK for between 1 to 12 months, is estimated using the International Passenger Survey. Short-term migrants may be in the UK for a variety of reasons; however only data on those in the UK for work or study is available at a local authority level. In 2014, it is estimated that Tower Hamlets had around 4,000 short-term migrants who were in the UK for work or study – the second highest number in London next to Newham (5,600).
Figure 7 shows that the majority of the borough’s short-term migrants are in the UK to study. Students made up 60 per cent of short-term migrants in 2014. Tower Hamlets had the 8th highest number of international students in the country in 2014. 40 per cent of the borough’s short-term migrants were in the UK to work. Tower Hamlets had the 5th highest number of short-term economic migrants nationally.
6,186 6,412 6,7916,165
8,742
13,552
11,84111,279 11,674
13,844 14,089
0
2,000
4,000
6,000
8,000
10,000
12,000
14,000
16,000
2005 2006 2007 2008 2009 2010 2011 2012 2013 2014 2015
To
tal n
um
be
r o
f 'f
lag
4' re
gis
trati
on
s
Source: NHS Patient Register Data Services (PRDS), via GLA Intelligence Unit migration indicator dataset
Figure 6: Number of 'flag 4' GP registrations in Tower Hamlets, 2005-2015
1,100 900 1,100600
9001,300
1,600
1,4001,500
1,500
1,4001,300
1,400
2,4002,400 2,400
2,600
2,0002,200
2,700
4,000
0
500
1,000
1,500
2,000
2,500
3,000
3,500
4,000
4,500
Mid 2008 Mid 2009 Mid 2010 Mid 2011 Mid 2012 Mid 2013 Mid 2014*
Nu
mb
er
of
sh
ort
-te
rm m
igra
nts
Work Study
Source: ONS short-term international migration (STIM) mid-2014 estimates, Table 7 *ProvisionalNote: Compenents may not sum to total due to rounding.
Figure 7: Short-term migration in Tower Hamlets by reason, mid-2008-2014
A Profile of the Migrant Population in Tower Hamlets
Corporate Research Unit | 8
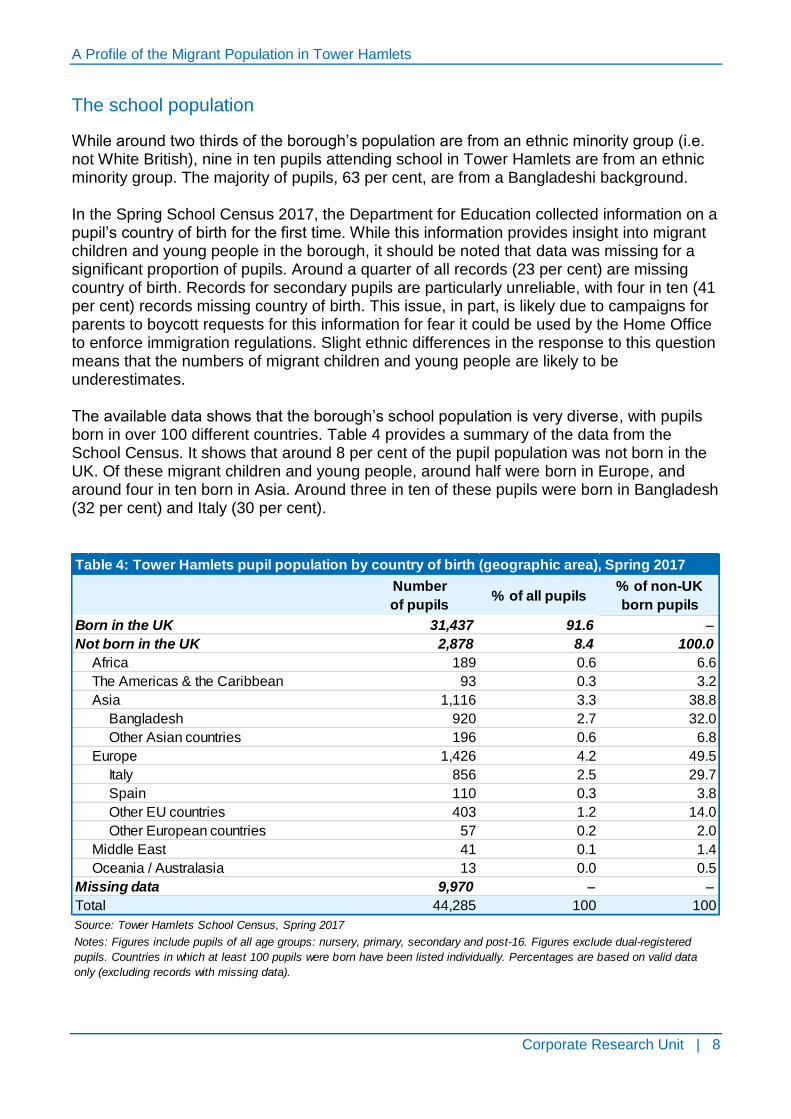
The school population
While around two thirds of the borough’s population are from an ethnic minority group (i.e. not White British), nine in ten pupils attending school in Tower Hamlets are from an ethnic minority group. The majority of pupils, 63 per cent, are from a Bangladeshi background. In the Spring School Census 2017, the Department for Education collected information on a pupil’s country of birth for the first time. While this information provides insight into migrant children and young people in the borough, it should be noted that data was missing for a significant proportion of pupils. Around a quarter of all records (23 per cent) are missing country of birth. Records for secondary pupils are particularly unreliable, with four in ten (41 per cent) records missing country of birth. This issue, in part, is likely due to campaigns for parents to boycott requests for this information for fear it could be used by the Home Office to enforce immigration regulations. Slight ethnic differences in the response to this question means that the numbers of migrant children and young people are likely to be underestimates. The available data shows that the borough’s school population is very diverse, with pupils born in over 100 different countries. Table 4 provides a summary of the data from the School Census. It shows that around 8 per cent of the pupil population was not born in the UK. Of these migrant children and young people, around half were born in Europe, and around four in ten born in Asia. Around three in ten of these pupils were born in Bangladesh (32 per cent) and Italy (30 per cent).
Number
of pupils% of all pupils
% of non-UK
born pupils
Born in the UK 31,437 91.6 -
Not born in the UK 2,878 8.4 100.0
Africa 189 0.6 6.6
The Americas & the Caribbean 93 0.3 3.2
Asia 1,116 3.3 38.8
Bangladesh 920 2.7 32.0
Other Asian countries 196 0.6 6.8
Europe 1,426 4.2 49.5
Italy 856 2.5 29.7
Spain 110 0.3 3.8
Other EU countries 403 1.2 14.0
Other European countries 57 0.2 2.0
Middle East 41 0.1 1.4
Oceania / Australasia 13 0.0 0.5
Missing data 9,970 - -
Total 44,285 100 100
Table 4: Tower Hamlets pupil population by country of birth (geographic area), Spring 2017
Source: Tower Hamlets School Census, Spring 2017
Notes: Figures include pupils of all age groups: nursery, primary, secondary and post-16. Figures exclude dual-registered
pupils. Countries in which at least 100 pupils were born have been listed individually. Percentages are based on valid data
only (excluding records with missing data).
A Profile of the Migrant Population in Tower Hamlets
Corporate Research Unit | 9
Of the 856 pupils the School Census has identified as being born in Italy, 770 of these pupils (90 per cent) are from a Bangladeshi ethnic background. Other information on main language and ethnicity identifies an additional 112 pupils as Italian-Bengali, which together totals 882 Italian-Bengali pupils attending school in Tower Hamlets. This data supports anecdotal information from schools and other services that there has been an increase in the arrival of Italians of Bangladeshi origin in the borough.
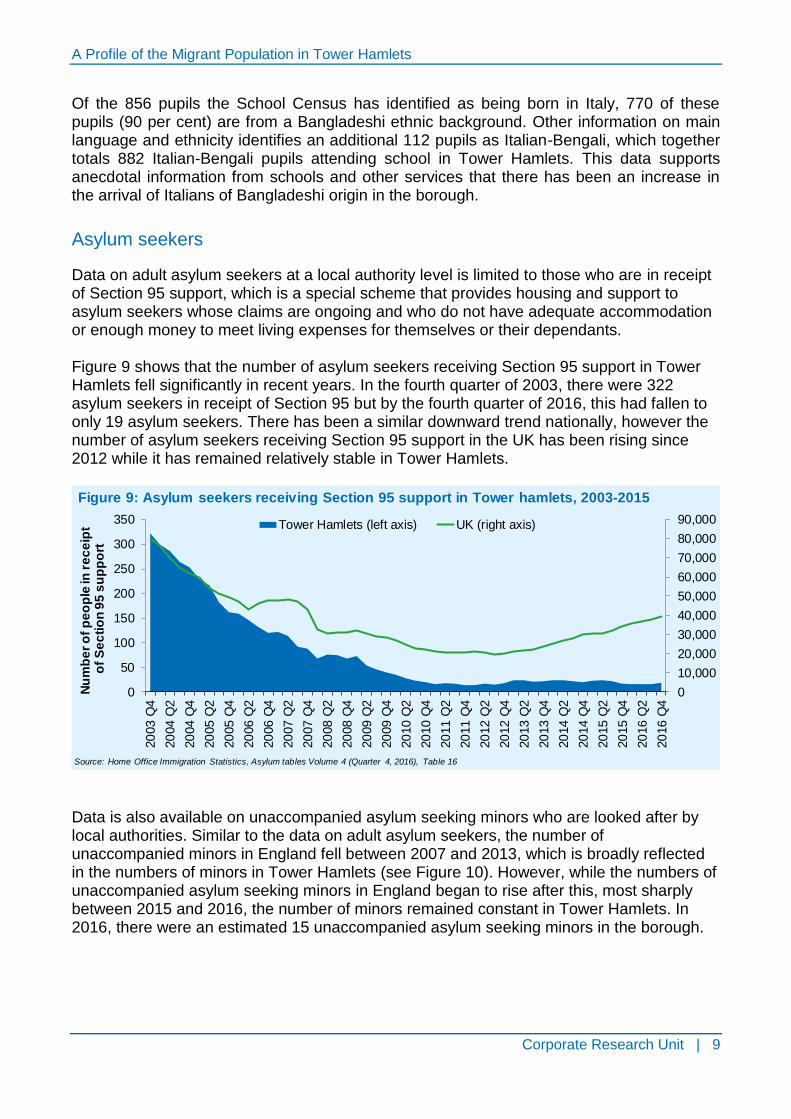
Asylum seekers
Data on adult asylum seekers at a local authority level is limited to those who are in receipt of Section 95 support, which is a special scheme that provides housing and support to asylum seekers whose claims are ongoing and who do not have adequate accommodation or enough money to meet living expenses for themselves or their dependants. Figure 9 shows that the number of asylum seekers receiving Section 95 support in Tower Hamlets fell significantly in recent years. In the fourth quarter of 2003, there were 322 asylum seekers in receipt of Section 95 but by the fourth quarter of 2016, this had fallen to only 19 asylum seekers. There has been a similar downward trend nationally, however the number of asylum seekers receiving Section 95 support in the UK has been rising since 2012 while it has remained relatively stable in Tower Hamlets.
Data is also available on unaccompanied asylum seeking minors who are looked after by local authorities. Similar to the data on adult asylum seekers, the number of unaccompanied minors in England fell between 2007 and 2013, which is broadly reflected in the numbers of minors in Tower Hamlets (see Figure 10). However, while the numbers of unaccompanied asylum seeking minors in England began to rise after this, most sharply between 2015 and 2016, the number of minors remained constant in Tower Hamlets. In 2016, there were an estimated 15 unaccompanied asylum seeking minors in the borough.
0
10,000
20,000
30,000
40,000
50,000
60,000
70,000
80,000
90,000
0
50
100
150
200
250
300
350
20
03
Q4
20
04
Q2
20
04
Q4
20
05
Q2
20
05
Q4
20
06
Q2
20
06
Q4
20
07
Q2
20
07
Q4
20
08
Q2
20
08
Q4
20
09
Q2
20
09
Q4
20
10
Q2
20
10
Q4
20
11
Q2
20
11
Q4
20
12
Q2
20
12
Q4
20
13
Q2
20
13
Q4
20
14
Q2
20
14
Q4
20
15
Q2
20
15
Q4
20
16
Q2
20
16
Q4
Nu
mb
er
of
pe
op
le in
re
ce
ipt
of
Se
cti
on
95
su
pp
ort
Tower Hamlets (left axis) UK (right axis)
Source: Home Office Immigration Statistics, Asylum tables Volume 4 (Quarter 4, 2016), Table 16
Figure 9: Asylum seekers receiving Section 95 support in Tower hamlets, 2003-2015

A Profile of the Migrant Population in Tower Hamlets
Corporate Research Unit | 10
Rough sleepers
Data on rough sleeping is collected by the Combined Homelessness and Information Network (CHAIN) through a multi-agency database. It is the UK’s most detailed and comprehensive source of data on rough sleeping. CHAIN data for Tower Hamlets shows that around half of rough sleepers in the borough are not born in the UK. In 2015/16, 20 per cent of the borough’s rough sleepers were from Central and Eastern Europe, 9 per cent from elsewhere in Europe, 9 per cent from Africa, 7 per cent from Asia, and 1 per cent from the Americas. Table 5 shows that in the past five years, the borough has seen the proportion of rough sleepers from Central and Eastern Europe fall, from 30 per cent in 2011/12 to 20 per cent in 2015/16. This is contrary to the trend in Greater London, which has seen a rise in the proportion of rough sleepers from Central and Eastern Europe, from 27 per cent in 2011/12 to 37 per cent in 2015/16. The decline in the proportion of rough sleepers from Central and Eastern Europe has largely been driven by a fall in the proportion of Polish rough sleepers, from 12 per cent in 2011/12 to 5 per cent in 2015/16. However, the borough saw an increase in the proportion of rough sleepers from Romania, which rose from 2 per cent in 2011/12 to 5 per cent in 2015/16.
0
500
1,000
1,500
2,000
2,500
3,000
3,500
4,000
4,500
0
5
10
15
20
25
30
20
07
20
08
20
09
20
10
20
11
20
12
20
13
20
14
20
15
20
16
Nu
mb
er
of
un
ac
co
mp
an
ied
as
ylu
m
se
ek
ing
ch
ild
ren
loo
ke
d a
fte
r
Tower Hamlets (left axis) England (right axis)
Source: Department for Education, Children looked after in England including adoption: 2010 to 2011, Table LAA4 & Children looked after in England including adoption: 2015 to 2016, Table LAA4
Figure 10: Unaccompanied asylum seeking children who are looked after, 2007-2016

A Profile of the Migrant Population in Tower Hamlets
Corporate Research Unit | 11
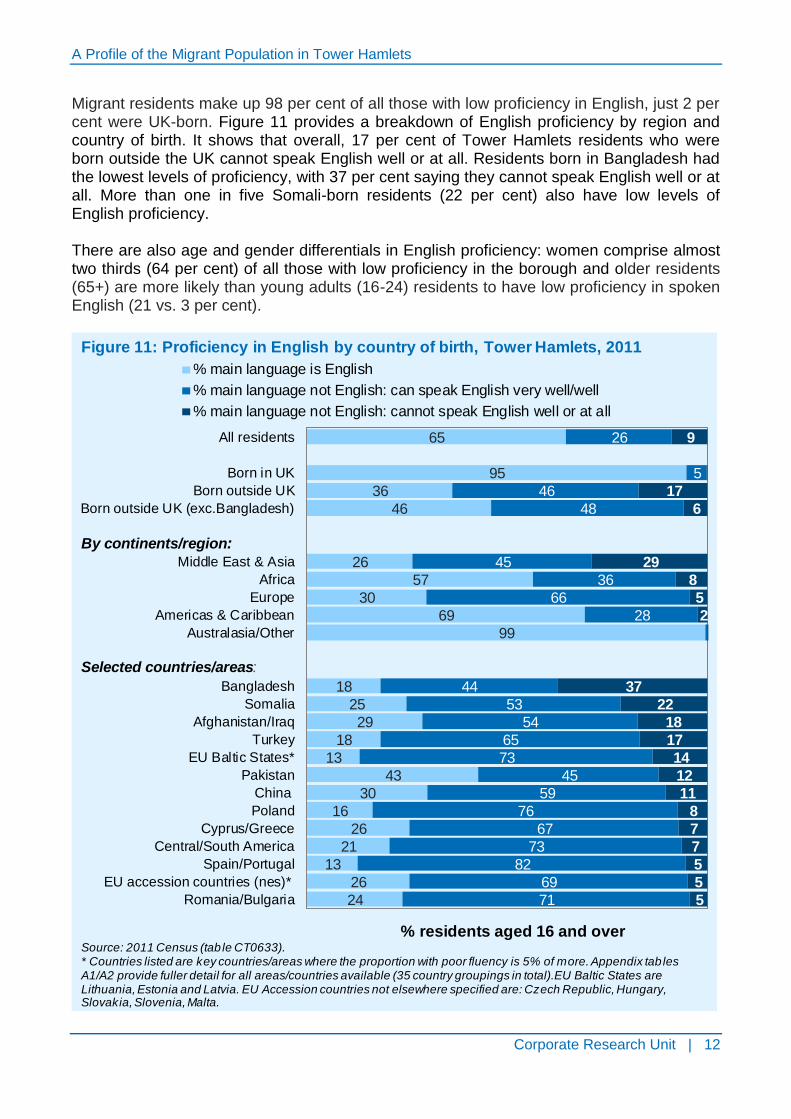
Language and English proficiency
Tower Hamlets is the 4th most linguistically diverse area in England and Wales after Newham, Brent and Ealing.11 The 2011 Census identified at least 90 different languages being used in the borough.12 Around 66 per cent of our residents use English as their main langue and 18 per cent use Bengali (which includes Sylheti and Chatgaya). After Newham and Brent, Tower Hamlets also has the third highest proportion of residents who use a main language other than English, 34 per cent compared to 22 per in London and 8 per cent nationally. The 2011 Census found that 9 per cent of borough residents aged 16+ – a total of 18,311 adults – had low levels of English proficiency. This is the second highest proportion of residents with low levels of English proficiency in England, after Newham. It is also substantially higher than the average across London (4 per cent) and England (2 per cent).
11
Greater London Authority, 2011 Census Snapshot: Main Language, February 2013 12
Tower Hamlets Council, Language in Tower Hamlets, April 2013.
No. % No. % No. % No. % No. %
UK 116 46 152 47 169 53 203 55 200 52
Central & Eastern Europe 75 30 95 29 73 23 79 22 77 20
Bulgaria 3 1 2 1 0 0 1 0 5 1
Czech Republic 4 2 2 1 3 1 0 0 1 0
Estonia 0 0 0 0 1 0 1 0 2 1
Hungary 3 1 3 1 4 1 3 1 5 1
Latvia 7 3 11 3 8 3 12 3 5 1
Lithuania 17 7 24 7 18 6 16 4 16 4
Poland 31 12 37 11 28 9 21 6 19 5
Romania 5 2 15 5 11 3 23 6 21 5
Slovakia 4 2 1 0 0 0 2 1 3 1
Slovenia 1 0 0 0 0 0 0 0 0 0
Other Europe (EEA) 16 6 24 7 26 8 29 8 36 9
Portugal 2 1 4 1 5 2 6 2 6 2
Ireland (Republic of) 4 2 2 1 3 1 3 1 3 1
Italy 4 2 3 1 3 1 7 2 12 3
Spain 2 1 7 2 5 2 7 2 3 1
France 1 0 4 1 3 1 3 1 7 2
Other European (EEA) countries 3 1 4 1 7 2 3 1 5 1
Other Europe (non-EEA) 2 1 4 1 2 1 3 1 1 0
Other Europe (unknown) 0 0 2 1 0 0 1 0 1 0
Africa 24 9 22 7 28 9 29 8 36 9
Asia 16 6 22 7 15 5 20 5 26 7
Americas 4 2 2 1 3 1 3 1 5 1
Australasia 0 0 0 0 0 0 0 0 0 0
Total 253 100 323 100 316 100 367 100 382 100
Source: St. Mungo's, CHAIN data
Table 5: Rough sleepers in Tower Hamlets by nationality, 2011/12 to 2015/16
2011/12 2012/13 2013/14 2014/15 2015/16
A Profile of the Migrant Population in Tower Hamlets
Corporate Research Unit | 12
Migrant residents make up 98 per cent of all those with low proficiency in English, just 2 per cent were UK-born. Figure 11 provides a breakdown of English proficiency by region and country of birth. It shows that overall, 17 per cent of Tower Hamlets residents who were born outside the UK cannot speak English well or at all. Residents born in Bangladesh had the lowest levels of proficiency, with 37 per cent saying they cannot speak English well or at all. More than one in five Somali-born residents (22 per cent) also have low levels of English proficiency. There are also age and gender differentials in English proficiency: women comprise almost two thirds (64 per cent) of all those with low proficiency in the borough and older residents (65+) are more likely than young adults (16-24) residents to have low proficiency in spoken English (21 vs. 3 per cent).
24
26
13
21
26
16
30
43
13
18
29
25
18
99
69
30
57
26
46
36
95
65
71
69
82
73
67
76
59
45
73
65
54
53
44
28
66
36
45
48
46
5
26
5
5
5
7
7
8
11
12
14
17
18
22
37
2
5
8
29
6
17
9
Romania/Bulgaria
EU accession countries (nes)*
Spain/Portugal
Central/South America
Cyprus/Greece
Poland
China
Pakistan
EU Baltic States*
Turkey
Afghanistan/Iraq
Somalia
Bangladesh
Australasia/Other
Americas & Caribbean
Europe
Africa
Middle East & Asia
Born outside UK (exc.Bangladesh)
Born outside UK
Born in UK
All residents
% main language is English
% main language not English: can speak English very well/well
% main language not English: cannot speak English well or at all
Figure 11: Proficiency in English by country of birth, Tower Hamlets, 2011
Source: 2011 Census (tab le CT0633). * Countries listed are key countries/areas where the proportion with poor fluency is 5% of more. Appendix tab les A1/A2 provide fuller detail for all areas/countries available (35 country groupings in total). EU Baltic States are Lithuania, Estonia and Latvia. EU Accession countries not elsewhere specified are: Czech Republic, Hungary, Slovakia, Slovenia, Malta.
Selected countries/areas:
By continents/region:
% residents aged 16 and over
A Profile of the Migrant Population in Tower Hamlets
Corporate Research Unit | 13
Further information
This report was produced by the council’s Corporate Research Unit (CRU). Our research provides timely and in-depth analysis about Tower Hamlets and can be found on the Borough Statistics pages of the council’s website. The data used in this briefing were sourced from:
ONS, Mid-year Estimates, available on GOV.UK
Tower Hamlets, Annual Resident Survey, available on the council’s website
ONS, 2001 & 2011 Census, available on NOMIS
DWP, National Insurance Number Registrations, available on Stat-Xplore
NHS, Patient Register via GLA, available on London Datasore
ONS, Short-term International Migration Estimates, available on GOV.UK
DfE, School Census, not publicly available
Home Office, Immigration Statistics, available on GOV.UK
DfE, Children looked after in England, available on GOV.UK
CHAIN, Rough sleeping in London, available on London Datastore For more information about this report, please contact Lisa Stidle, Research Officer, Corporate Research Unit.