population in brief 2021
TRANSCRIPT

Populationin Brief2021
CONTENTS
OVERVIEW 3
KEY INDICATORS 4
OVERALL POPULATION 5
AGEING 8
MARRIAGE & PARENTHOOD 11
IMMIGRATION & CITIZENS BY DESCENT 17
Population in Brief 2021
1

Overall Population
Table 1: Total population 19
Table 2: Singapore citizens by age group, ethnic group and gender 20
Table 3: Ethnic mix of citizen population 21
Table 4: Overseas Singaporean population 21
Ageing
Table 5: Old-age support ratio 21
Table 6: Median age 22
Immigration
Table 18: Profile of SCs and PRs granted in 2020 28
Marriage & Parenthood
Table 7: Proportion of singles among citizen males / females aged 25 – 49 years by age group 22
Table 8: Proportion of singles among citizens by age group, gender and highest qualification attained 23
Table 9: Number of marriages by residency status of grooms and brides 24
Table 10: General marriage rates 24
Table 11: Median age at first marriage 24
Table 12: Origins of non-citizen spouses married to citizens 25
Table 13: Median age of mothers at first birth by residency status of mothers 26
Table 14: Average number of children born to ever-married females aged 30 – 49 years by residency status of females 26
Table 15: Proportion of ever-married females aged 30 – 49 years who are without children by residency status of females 26
Table 16: Number of births by birth order and residency status 27
Table 17: Resident total fertility rate by ethnic group 27
ANNEX OVERVIEW
The Population in Brief is an annual publication that provides data and key updates on Singapore’s population trends.
The publication covers the various areas that contribute to a sustainable population that has a strong and cohesive society with Singaporeans at its heart, a dynamic and vibrant economy to provide good jobs and opportunities for Singaporeans, and a high quality living environment and home for all Singaporeans.
The key population trends of the past year are as follows:
In 2020, there were 19,430 citizen marriages, 12.3% fewer than the 22,165 citizen marriages in 2019. COVID-19 restrictions on large gatherings could have led couples to defer their marriages.
There were 31,816 citizen births in 2020, a decrease from the 32,844 citizen births in 2019. Over the last five years (2016 to 2020), there were about 32,500 citizen births on average each year, slightly more than the average of 32,400 each year in the preceding five-year period (2011 to 2015). The resident total fertility rate decreased from 1.14 in 2019 to 1.10 in 2020.
The citizen population decreased by 0.7%, to 3.50 million as of June 2021. The citizen population continued to age, with 17.6% aged 65 and above, compared with 16.8% in June 2020. The permanent resident (PR) population also decreased by 6.2%, to 0.49 million as of June 2021. This was mainly because more citizens and PRs remained overseas continuously for 12 months or more due to COVID-19 travel restrictions, and were therefore not counted as part of our population.
Singapore’s total population stood at 5.45 million as of June 2021. Amid the COVID-19 pandemic, the total population decreased by 4.1% from June 2020 to June 2021. This was largely due to the decrease in the non-resident population.
The non-resident population decreased by 10.7%, to 1.47 million as of June 2021. This was largely because of a decrease in foreign employment in Singapore from June 2020 to June 2021 due to travel restrictions and uncertain economic conditions. The decrease was seen across all pass types, with the largest drop in Work Permit Holders in the Construction, Marine Shipyard, and Process sectors.
Population in Brief 2021Population in Brief 2021
32

OVERALL POPULATION (‘000) JUNE 2020 JUNE 2021
Citizen population 3,523.2 3,498.2
Permanent resident (PR) population 521.0 488.7
Resident population 4,044.2 3,986.8
Non-resident population 1,641.6 1,466.7
Total population 5,685.8 5,453.6
AGE PROFILE OF CITIZENS JUNE 2020 JUNE 2021
Proportion aged 65 and above (%) 16.8 17.6
Citizen median age (years) 42.2 42.5
MARRIAGE & PARENTHOOD
2019 2020
Number of marriages involving at least one citizen 22,165 19,430
Citizen births 32,844 31,816
Resident total fertility rate1 1.14 1.10
2011 – 2015 2016 – 2020
Number of marriages involving at least one citizen, five-year average (to nearest hundred) 23,100 22,700
Number of citizen births, five-year average (to nearest hundred) 32,400 32,500
Note: The reference period for all data above is as of June of the year, except for Marriage & Parenthood data which are based on the full calendar year (January to December).
Source: Department of Statistics, Immigration & Checkpoints Authority
KEY INDICATORS
There were 3.50 million Singapore citizens as of June 2021. There were 0.49 million permanent residents (PRs). In total, there were 3.99 million residents2. Non-residents totalled 1.47 million, and include our foreign workforce across all pass types, dependants, and international students. Overall, Singapore’s total population stood at 5.45 million.
Diagram 1: Total population, as of June 20213
Source: Department of Statistics, Ministry of Manpower Numbers may not sum up due to rounding.
2 Singapore residents comprise Singapore Citizens and Permanent Residents.
3 The figures are as of end-June 2021. Work Permit Holders are semi-skilled foreign workers from approved source countries. Some work in Construction, Marine Shipyard and Process (CMP) sectors (e.g. construction workers), and others work in non-CMP sectors (e.g. Services, Manufacturing).S Pass Holders are mid-level skilled staff who need to earn at least $2,500 a month and have the relevant qualifications and work experience. Employment Pass Holders are foreign professionals, managers and executives who need to earn at least $4,500 a month (or $5,000 in the Financial Services sector) and have acceptable qualifications.
1 Total fertility rate refers to the average number of live-births each female would have during her reproductive years (15–49 years old) if she were subject to the prevailing age-specific fertility rates in the population in the given year.
OVERALL POPULATION
Residents3.99M
Singapore Citizens3.50M
PRs0.49M
Non-Residents1.47M
Total Population5.45M
Students 4%
Employment Pass Holders 11%
S Pass Holders 11%
Non-CMP WorkPermit Holders 19%
Migrant Domestic Workers 16%
Dependants of Citizens/PRs/ Work Pass Holders 18%
CMP WorkPermit Holders 20%
Population in Brief 2021Population in Brief 2021
54

The citizen and PR populations decreased by 0.7% (3.52M to 3.50M) and 6.2% (0.52M to 0.49M) respectively between 2020 and 2021 (Chart 1). This was mainly because more citizens and PRs remained overseas continuously for 12 months or more due to COVID-19 travel restrictions4.
The non-resident population stood at 1.47 million as of June 2021, a decrease of 10.7% from June 2020. This was largely due to a reduction in foreign employment in Singapore from June 2020 to June 2021 (Chart 2). The decrease was seen across all pass types, with the largest drop in Work Permit Holders in the Construction, Marine Shipyard, and Process sectors. These trends were largely due to travel restrictions and uncertain economic conditions related to COVID-19.Decrease in Citizen Population and PR Population Size
Chart 1: Total population by residency status, as of JuneDecrease in Foreign Employment from June 2020 to June 2021
Chart 2: Foreign employment growth5, as of June
Source: Department of StatisticsNumbers may not sum up due to rounding.
Source: Ministry of Manpower
Singapore's total population decreased by 4.1% from June 2020 to June 2021, largely due to the decrease in the non-resident population. The total population growth rate over the past five years was slower compared to the previous five-year period (Chart 3)6.
Slower Total Population Growth Rate from 2016 – 2021, Compared to Previous Five-Year Period
Chart 3: Total population growth rate per year, as of June (%)
77K
2011–12 2012–13 2013–14 2014–15 2015–16 2016–17 2017–18 2018–19 2019–20 2020–21
100K
50K
0K
-50K
-100K
-150K
-200K
60K33K 23K 26K 24K
-36K -10K-47K
-147K
2.0%
3.0%
1.0%
0.0%
-1.0%
-2.0%
-3.0%
-4.0%
-5.0%
2011
1.3%0.5%
1.2%
-0.3%
-4.1%
0.1%
2012 2013 2014 2015 2016 2017 2018 2019 2020 2021
2011 – 2016Compound Annual Growth Rate: 1.6%
2016 – 2021Compound Annual Growth Rate: -0.6%
4 The number of citizens and PRs counted in our population excludes persons with a registered foreign address, or who have been away from Singapore for a continuous period of 12 months or longer prior to the reference date (i.e. June each year).
5 Migrant domestic workers are excluded in the figures.
6 Excluding the effects of COVID-19 from June 2020 to June 2021, the compound annual growth rate (CAGR) for the total population between June 2016 and June 2019 was 0.6%. This was already lower than the CAGR of 1.6% between June 2011 and June 2016.
Source: Department of Statistics
6.0M
5.0M
4.0M
3.0M
2.0M
1.0M
0.0M2017 2018 2019 2020 2021
3.44M 3.47M 3.50M 3.52M 3.50M
0.53M 0.52M 0.53M 0.52M 0.49M
1.65M 1.64M 1.68M 1.64M 1.47M
5.61M 5.64M 5.70M 5.69M5.45M
Citizens PRs Non-residents
Population in Brief 2021Population in Brief 2021
76

With increasing life expectancy and low fertility rates, the proportion of our citizen population aged 65 years and above is rising7, and at a faster pace compared to the last decade. Large cohorts of "baby boomers"8 have begun entering the post-65 age range (Chart 4).
Reflecting our ageing population, the median age of the citizen population also rose from 42.2 years to 42.5 years between 2020 and 2021 (Chart 5).
Large Cohorts of Baby Boomers Entering Post-65 Age RangeChart 4: Age profile of citizen population, as of June
Median Age of Citizens IncreasedChart 5: Median age of citizens, as of June (years)
Source: Department of Statistics
7 The benchmark of 65 years is aligned with international statistical definitions.
8 For this publication, “baby boomers” are defined as those born from 1946 to 1964. As such, they would be aged between 47–65 in 2011, and 57–75 in 2021.
9 The 2030 numbers are meant to illustrate the possible change in the population that could occur if certain demographic assumptions prevail over the stated period. These assumptions may or may not be realised.
Source: Department of Statistics
AGEING
Currently, 61.9% of citizens are aged 20 – 64 years. This has decreased from 65.1% in 2011, and is expected to decrease further to about 56.0% in 2030. Conversely, the proportion of citizens aged 65 and above has increased from 10.4% in 2011 to 17.6% in 2021. This proportion is expected to increase to about 23.8% in 2030 (Chart 6).
Fewer Citizens Aged 20 – 64 Years, More Citizens Aged 65 and AboveChart 6: Citizen population by broad age bands, as of June9
Source: Department of Statistics
Males Females
2021
2011
2021
2011
90 & Over
85–89
80–84
75–79
70–74
65–69
60–64
55–59
50–54
45–49
40–44
35–39
30–34
20–24
25–29
15–19
10–14
5–9
0–4
Agegroup
0K 0K50K100K150K 150K100K50K
43
42
41
40
39
38
372011
39.1
2012
39.6
2013
40.0
2014
40.4
2015
40.7
2016
41.0
2017
41.3
2018
41.7
2019
42.0
2020
42.2
2021
42.5
70.0%
60.0%
50.0%
40.0%
30.0%
20.0%
10.0%
0.0%Aged 19 & below Aged between 20–64 Aged 65 & above
24.5%20.4% 20.2%
65.1%61.9%
56.0%
10.4%
17.6%
23.8%
2011 2021 2030
Population in Brief 2021Population in Brief 2021
98

The number of citizens aged 80 and above has also almost doubled since 2011 (Chart 7).
More Citizens Aged 80 and AboveChart 7: Number and % of citizens aged 80 years and above, as of June
Source: Department of StatisticsNumbers may not sum up due to rounding.
There were 19,430 citizen marriages10 in 2020, fewer than the 22,165 citizen marriages in 2019 (Chart 8) (See Box story on Page 15). The median age at first marriage in 2020 was 30.1 years for citizen grooms and 28.4 years for citizen brides. This was the same as in 2019.
Fewer Citizen Marriages in 2020, compared to 2019Chart 8: Citizen marriages
2011 – 2015Average no. of citizenmarriages: 23.1K
2016 – 2020Average no. of citizenmarriages: 22.7K
10 Citizen marriages refer to marriages involving at least one citizen.
MARRIAGE & PARENTHOOD
Source: Department of StatisticsThe figures are based on the full calendar year (January to December).
19.4K20.3K
22.7K 23.2K21.8K
24.0K 23.8K 23.9K 24.4K23.6K
22.2K
10K
15K
20K
25K
2010 2011 2012 2013 2014 2015 2016 2017 2018 2019 2020
Male Female140K
120K
100K
80K
60K
40K
20K
71K(2.2%)
75K(2.3%)
80K(2.4%)
85K(2.5%)
91K(2.7%)
95K(2.8%)
98K(2.9%)
104K(3.0%)
112K(3.2%)
120K(3.4%)
128K(3.7%)
45K 48K
26K 27K 29K 31K 34K 36K 37K 39K 43K 46K 49K
51K 54K57K 59K 61K
64K69K
74K79K
0K2011 2012 2013 2014 2015 2016 2017 2018 2019 2020 2021
Population in Brief 2021Population in Brief 2021
1110

Fewer than 1 in 3 citizen marriages last year involved transnational couples (Chart 9)11 . The decrease in the proportion of transnational marriages in 2020 may have been partly due to COVID-19-related travel restrictions12 .
About 1 in 5 citizen marriages last year were inter-ethnic13 (Chart 10), similar to the proportions in previous years.
Chart 9: Transnational marriages as a proportion of citizen marriages
41% 39% 40% 39% 37% 36% 36% 35% 36% 37%
30%
0%
10%
20%
30%
40%
50%
2010 2011 2012 2013 2014 2015 2016 2017 2018 2019 2020
Chart 10: Inter-ethnic marriages as a proportion of citizen marriages
18%18% 19% 19% 17% 18% 18% 18% 18% 17%19%
0%
10%
20%
30%
40%
50%
2010 2011 2012 2013 2014 2015 2016 2017 2018 2019 2020
Source: Department of StatisticsThe figures are based on the full calendar year (January to December).
Source: Department of StatisticsThe figures are based on the full calendar year (January to December).
There were 31,816 citizen births14 in 2020, fewer than the 32,844 citizen births in 2019 (See Box story on Page 16). In the past five years (2016 to 2020), there were about 32,500 citizen births on average each year, slightly more than the average of about 32,400 each year in the previous five years (2011 to 2015, Chart 11). The median age of citizen mothers at first birth was 30.8 years in 2020. This was similar to the median age of 30.6 years in 2019.
More Citizen Births Each Year on Average Between 2016 – 2020, Compared to the Previous Five-Year Period
Chart 11: Citizen births
Source: Immigration & Checkpoints AuthorityThe figures are based on the full calendar year (January to December).
14 Citizen births refer to babies born to at least one citizen parent.
11 Transnational marriages refer to marriages between a citizen and a non-citizen (i.e. permanent resident or non-resident).
12 From late-March 2020, all non-residents require entry approval to enter Singapore. Video link solemnisations were an option for couples from mid-May 2020 onwards, but both parties need to be physically in Singapore.
13 Inter-ethnic marriages refer to marriages between persons of different ethnicity (e.g. Chinese-Indian, Indian-Malay, Chinese-Others). Data on marriages by ethnic group have been updated in 2021 following the updating of ethnicity data in the Registry of Marriages' and Registry of Muslim Marriages' administrative records to match national registration records.
31.8K30.1K 30.9K
33.2K
31.0K
33.2K 33.7K 33.2K 32.4K 32.4K 32.8K
10K
15K
20K
25K
30K
35K
2010 2011 2012 2013 2014 2015 2016 2017 2018 2019 2020
2011 – 2015Average no. of citizen births: 32.4K
2016 – 2020Average no. of citizen births: 32.5K
Population in Brief 2021Population in Brief 2021
1312

The resident total fertility rate (TFR)15 remained below replacement rate, decreasing from 1.14 in 2019 to 1.10 in 2020 (Chart 12). This is partly due to a general trend of later marriages and subsequent child-bearing.
Overall TFR Decreased to 1.10Chart 12: Resident TFR by ethnic group (per female)
Chart 13: Citizen marriages per quarter, 2019 & 2020
Source: Department of StatisticsNote: 2012 was the Year of the Dragon (Chinese Zodiac). The figures are based on the full calendar year (January to December).
0.82010 2011 2012 2013 2014 2015 2016 2017 2018 2019 2020
1.0
1.2
1.4
1.6
1.8
2.0
2.2
1.151.10
1.24
1.15
1.101.02
1.13
1.14
0.98
0.99
0.94
0.96
1.65
1.79 1.80 1.82
15 Total fertility rate refers to the average number of live-births each female would have during her reproductive years (15–49 years old) if she were subject to the prevailing age-specific fertility rates in the population in the given year.
Overall Chinese Malays Indians
Some Singaporeans postponed their marriages due to the restrictions on large social gatherings16 amid the pandemic, resulting in 12.3% fewer citizen marriages in 2020 than in 2019.
Impact of COVID-19 on Citizen Marriages
Source: Department of Statistics
16 All in-person solemnisations had to be postponed during the Circuit Breaker period (7 April to 1 June 2020), except for exceptional circumstances. Video-link solemnisations were made available from mid-May 2020 onwards. Safe management measures for marriage solemnisations and receptions were eased from June 2020. The cap on the number of attendees for marriage solemnisations was gradually increased from 10 in early-June 2020 to 50 attendees in early-August. In August 2020, marriage receptions—barred since the start of the Circuit Breaker—were also allowed to resume with up to 50 attendees. In September 2020, restrictions were further eased to allow up to 100 attendees.
2019 2020
0.0K
2.0K
4.0K
6.0K
8.0K
10.0K
Q1 Q2 Q3 Q4
5.3K 5.6K4.8K
2.2K
5.1K4.1K
6.9K7.7K
Q3 2020: Even though some COVID-19 restrictions and safe management measures were eased, remaining measures are likely to have led to the continued postponement of marriages.
Q2 2020: Decrease was the largest, when in-person solemnisations had to be postponed during the Circuit Breaker period.
Q4 2020: An uptick in marriages was observed as restrictions were eased to allow for more attendees at wedding solemnisations and receptions.
Population in Brief 2021Population in Brief 2021
1514

200K 150K 100K 50K 0K 50K 100K 150K 200K
0 - 45 - 9
10 - 1415 - 1920 - 2425 - 2930 - 3435 - 3940 - 4445 - 4950 - 5455 - 5960 - 6465 - 6970 - 7475 - 7980 - 8485 - 89
90 & Over
Singapore grants between 15,000 and 25,000 new citizenships annually, to individuals who are committed to making Singapore their home and who can integrate and contribute to Singapore. New citizens either share family ties with Singaporeans (for example, through marriage), or have studied, worked or lived here for some time.
Since the tightening of the immigration framework in late-2009, Singapore has accepted about 30,000 new PRs a year. This keeps the PR population size stable, and provides a pool of candidates who may be suitable for citizenship. The majority of our PRs are aged between 25 – 59 years (Chart 15).
New adult citizens come from our pool of PRs, as individuals have to obtain permanent residence before they may apply for citizenship in Singapore. The small group of new citizens who were not PRs were minors who were either (i) children of citizens, including those born overseas to Singaporean parents, or (ii) children of PRs who were included as dependants in their parents’ citizenship application.
Immigration helps to moderate the impact of ageing and low birth rates in our citizen (SC) population, and keeps it from shrinking over the longer term. The pace of immigration will continue to be kept measured and stable.
Chart 15: Age pyramid of resident population, as of June 2021
Source: Department of Statistics
IMMIGRATION & CITIZENS BY DESCENT
SC PR
Males Females
Chart 14: Citizen births per quarter, 2019 & 2020
There were 3.1% fewer citizen births in 2020 than in 2019.
The decrease in births was also observed in other advanced societies in 2020 (e.g. the United States, Japan, Italy), which could reflect the impact that uncertainties and health concerns arising from COVID-19 had on parenthood decisions.
In Singapore, one of the key measures introduced to mitigate the impact of COVID-19 on birth rates was the Baby Support Grant. This one-off $3,000 cash grant was given to couples with citizen children born from 1 October 2020 to 30 September 2022. Given on top of the existing Baby Bonus Cash Gift, it aimed to reassure and encourage couples to proceed with their parenthood plans despite the pandemic.
Source: Immigration & Checkpoints Authority
2H 2020: Compared to the same periods in 2019, there were fewer citizen births. Comparing the number of citizen births in each quarter, the largest difference from 2019 was that in Q4 2020.
Q4 2020: Many babies born in Q4 would have been conceived around the start of the COVID-19 pandemic in Singapore (Feb 2020). The lower number of citizen births compared to Q4 2019 suggests that some couples may have postponed their parenthood plans due to the pandemic.
0.0K
2.0K
4.0K
6.0K
8.0K
10.0K
Q1 Q2 Q3 Q4
7.8K 7.9K 7.8K 7.9K 8.5K 8.0K8.7K
8.0K
2019 2020
Impact of COVID-19 on Citizen Births
Population in Brief 2021Population in Brief 2021
1716

In 2020, 21,085 individuals were granted citizenship and 27,470 individuals were granted PR. About 6% of the new SCs, or 1,344 of them, were children born overseas to Singaporean parents (“citizens by descent”) (Chart 16). These figures are lower than previous years due to the COVID-19 pandemic17.
Chart 16: Number of SCs and PRs granted
*This is a subset of the total SCs granted each year. It refers to SCs granted to children born overseas to Singaporean parents.
Source: Immigration & Checkpoints AuthorityThe figures are based on the full calendar year (January to December).
Total PRs granted Total SCs granted Granted to SCs by Descent*
59,460
29,26527,521
29,891 29,869 29,854 29,955 31,050 31,849 32,710 32,91527,470
21,085
1,344
19,928 18,75815,777
20,693 20,572 20,348 20,815 22,102 22,076 22,550 22,714
1,298 1,232 1,450 1,307 1,476 1,345 1,579 1,513 1,573 1,576 1,5990K
10K
20K
30K
40K
50K
60K
70K
2009 2010 2011 2012 2013 2014 2015 2016 2017 2018 2019 2020
Total PRs granted Total SCs granted Granted to SCs by Descent*
Tightening of the immigration framework in late-2009
Table 1: Total population, as of June (‘000)
2011 2016 2020 2021
Residents of which:
3,789.3 3,933.6 4,044.2 3,986.8
Citizens 3,257.2 3,408.9 3,523.2 3,498.2
PRs 532.0 524.6 521.0 488.7
Non-residents 1,394.4 1,673.7 1,641.6 1,466.7
Total 5,183.7 5,607.3 5,685.8 5,453.6
Source: Department of Statistics
ANNEX
DETAILED STATISTICAL TABLES
17 The lower grant figures in 2020 were likely to be due to travel restrictions and operational issues arising from COVID-19. For example, safe management measures resulted in limited slots to complete the final steps for PR and citizenship registration, which must be done in-person.
Population in Brief 2021Population in Brief 2021
1918
Tabl
e 2:
Sin
gapo
re c
itize
ns b
y ag
e gr
oup,
eth
nic
grou
p an
d ge
nder
, Jun
e 20
21
Age
G
roup
(Y
ears
)
Tota
lC
hine
seM
alay
sIn
dian
sO
ther
s
Pers
ons
Mal
esFe
mal
esPe
rson
sM
ales
Fem
ales
Pers
ons
Mal
esFe
mal
esPe
rson
sM
ales
Fem
ales
Pers
ons
Mal
esFe
mal
es
Num
ber (
'000
)
Tota
l34
98.2
1733
.817
64.4
2654
.513
08.8
1345
.752
9.7
267.
426
2.3
259.
013
1.0
127.
955
.026
.628
.4
0 –
416
9.3
86.6
82.7
112.
857
.755
.039
.120
.019
.112
.36.
36.
05.
22.
62.
6
5 –
918
0.6
93.0
87.7
129.
366
.862
.532
.916
.916
.013
.26.
76.
55.
22.
62.
6
10 –
14
178.
491
.686
.712
7.5
65.6
61.9
31.2
16.1
15.1
15.0
7.5
7.4
4.7
2.4
2.3
15 –
19
185.
795
.590
.212
9.6
66.7
62.9
35.0
18.0
17.0
17.1
8.6
8.4
4.0
2.1
2.0
20 –
24
220.
711
5.3
105.
415
5.0
80.9
74.2
42.5
22.1
20.4
18.9
9.9
9.0
4.3
2.4
1.9
25 –
29
240.
912
5.0
115.
817
0.8
88.7
82.0
47.0
24.2
22.8
19.4
10.0
9.4
3.7
2.1
1.6
30 –
34
241.
112
3.3
117.
717
3.9
88.9
85.0
45.0
23.1
21.9
18.6
9.6
9.0
3.6
1.7
1.9
35 –
39
221.
411
0.8
110.
716
4.4
81.9
82.5
36.7
18.9
17.9
16.8
8.6
8.1
3.6
1.4
2.2
40 –
44
222.
010
8.4
113.
617
5.1
85.2
89.9
27.7
14.1
13.6
16.1
7.9
8.2
3.1
1.3
1.9
45 –
49
239.
411
6.5
122.
918
9.9
91.6
98.3
28.3
14.3
14.0
17.8
9.1
8.7
3.3
1.5
1.8
50 –
54
242.
411
8.1
124.
218
7.5
90.5
97.1
32.2
15.9
16.3
19.3
10.3
9.0
3.3
1.5
1.9
55 –
59
271.
013
4.5
136.
520
7.0
102.
310
4.7
40.2
20.1
20.1
20.7
10.7
10.1
3.0
1.4
1.6
60 –
64
268.
013
3.0
135.
021
1.5
104.
610
6.9
35.0
17.5
17.5
18.9
9.7
9.2
2.6
1.2
1.4
65 –
69
226.
211
0.6
115.
618
5.2
90.6
94.6
25.1
12.1
12.9
14.1
6.9
7.2
1.9
1.0
0.9
70 –
74
175.
683
.292
.414
7.8
70.2
77.5
16.1
7.5
8.6
10.2
4.7
5.5
1.5
0.8
0.7
75 –
79
87.7
39.3
48.4
76.3
34.3
42.0
6.6
2.9
3.7
4.2
1.8
2.4
0.6
0.3
0.3
80 –
84
69.4
28.9
40.5
60.6
25.3
35.2
5.0
2.1
2.8
3.3
1.2
2.1
0.6
0.2
0.4
85 –
89
36.8
13.6
23.2
31.5
11.6
19.9
3.0
1.1
1.9
1.9
0.8
1.1
0.4
0.2
0.2
90 &
ab
ove
21.7
6.6
15.1
18.9
5.2
13.7
1.2
0.5
0.7
1.3
0.7
0.5
0.3
0.1
0.2
Sour
ce: D
epar
tmen
t of S
tatis
tics
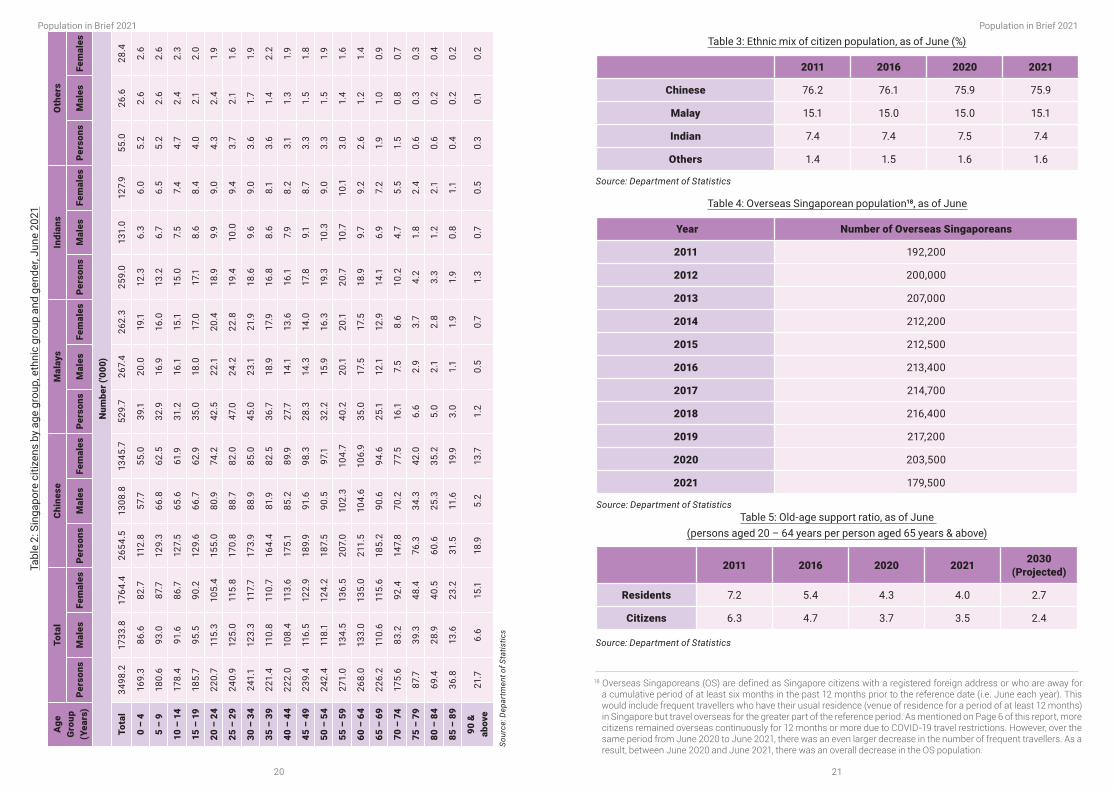
18 Overseas Singaporeans (OS) are defined as Singapore citizens with a registered foreign address or who are away for a cumulative period of at least six months in the past 12 months prior to the reference date (i.e. June each year). This would include frequent travellers who have their usual residence (venue of residence for a period of at least 12 months) in Singapore but travel overseas for the greater part of the reference period. As mentioned on Page 6 of this report, more citizens remained overseas continuously for 12 months or more due to COVID-19 travel restrictions. However, over the same period from June 2020 to June 2021, there was an even larger decrease in the number of frequent travellers. As a result, between June 2020 and June 2021, there was an overall decrease in the OS population.
Table 3: Ethnic mix of citizen population, as of June (%)
2011 2016 2020 2021
Chinese 76.2 76.1 75.9 75.9
Malay 15.1 15.0 15.0 15.1
Indian 7.4 7.4 7.5 7.4
Others 1.4 1.5 1.6 1.6
Source: Department of Statistics
Table 4: Overseas Singaporean population¹8, as of June
Year Number of Overseas Singaporeans
2011 192,200
2012 200,000
2013 207,000
2014 212,200
2015 212,500
2016 213,400
2017 214,700
2018 216,400
2019 217,200
2020 203,500
2021 179,500
Source: Department of StatisticsTable 5: Old-age support ratio, as of June
(persons aged 20 – 64 years per person aged 65 years & above)
2011 2016 2020 2021 2030(Projected)
Residents 7.2 5.4 4.3 4.0 2.7
Citizens 6.3 4.7 3.7 3.5 2.4
Source: Department of Statistics
Population in Brief 2021Population in Brief 2021
2120

19 Data by highest qualification attained pertain to citizens who were not attending educational institutions as full-time students and include those who were upgrading their qualifications through part-time courses.
Table 6: Median age, as of June (years)
2011 2016 2020 2021
Residents 38.0 40.0 41.5 41.8
Citizens 39.1 41.0 42.2 42.5
Source: Department of Statistics
Table 7: Proportion of singles among citizen males / females aged 25 – 49 years by age group, as of June (%)
2010 2015 2019 2020
Proportion of singles among citizens males by age group
25 – 29 years 78.5 82.6 81.6 82.8
30 – 34 years 43.1 43.4 43.6 43.8
35 – 39 years 23.9 25.1 22.5 24.6
40 – 44 years 17.2 18.2 17.5 18.9
45 – 49 years 14.3 14.2 14.0 15.8
Proportion of singles among citizen females by age group
25 – 29 years 62.0 69.0 69.2 71.3
30 – 34 years 30.6 31.4 33.3 35.7
35 – 39 years 20.0 21.5 21.5 22.0
40 – 44 years 15.6 17.9 17.9 18.3
45 – 49 years 13.6 16.1 15.8 16.7
Source: Department of Statistics
Table 8: Proportion of singles among citizens by age group, gender and highest qualification attained, as of June19 (%)
Age group (years) / Highest qualification attained
2010 2015 2020
Males Females Males Females Males Females
Aged 30 – 39 32.9 24.9 34.1 26.3 34.5 28.9
Below Secondary 36.7 15.0 38.9 16.3 42.3 21.2
Secondary 32.3 17.9 38.1 18.1 33.4 19.0
Post-Secondary (Non-Tertiary) 33.0 22.5 31.3 22.9 32.6 22.8
Diploma & Professional Qualification 33.0 26.2 34.6 26.4 35.4 26.8
University 31.9 30.2 32.9 29.9 33.8 32.4
Aged 40 – 49 15.6 14.5 16.2 17.0 17.3 17.5
Below Secondary 21.3 10.1 24.0 11.7 23.9 11.0
Secondary 15.0 12.3 17.2 12.4 19.4 13.0
Post-Secondary (Non-Tertiary) 14.8 15.4 15.8 17.3 19.3 16.1
Diploma & Professional Qualification 12.1 18.7 13.6 17.1 18.2 17.6
University 11.4 23.1 13.5 23.7 14.3 20.9
Source: Department of Statistics
Population in Brief 2021Population in Brief 2021
2322

Table 9: Number of marriages by residency status of grooms and brides
Grooms Brides 2010 2015 2019 2020
Total number of marriages 24,363 28,322 25,434 22,651
Citizen Citizen 12,043 15,243 14,060 13,669
Citizen PR 1,372 1,428 1,310 1,120
PR Citizen 682 684 642 518
Citizen Non-resident 4,963 4,828 4,426 2,802
Non-resident Citizen 1,213 1,622 1,727 1,321
PR PR 854 603 523 485
PR Non-resident 1,082 941 674 547
Non-resident PR 660 671 516 519
Non-resident Non-resident 1,494 2,302 1,556 1,670
Citizen marriages (i.e. marriages involving at least one citizen)
20,273 23,805 22,165 19,430
Source: Department of Statistics
Table 10: General marriage rates (per 1,000 unmarried males / females aged 15 – 49 years)
2010 2015 2019 2020
ResidentsMales 39.3 44.2 40.7 35.7
Females 35.3 41.1 37.9 34.9
CitizensMales 38.0 43.2 40.5 36.1
Females 33.4 39.8 37.7 35.3
Source: Department of Statistics
Table 11: Median age at first marriage (years)
2010 2015 2019 2020
ResidentsMales 30.0 30.2 30.2 30.2
Females 27.7 28.1 28.6 28.6
CitizensMales 30.0 30.1 30.1 30.1
Females 27.6 27.9 28.4 28.4
Source: Department of Statistics
Table 12: Origins of non-citizen spouses married to citizens
2010 2015 2019 2020
Number of marriages 8,230 8,562 8,105 5,761
Non-citizen brides 6,335 6,256 5,736 3,922
Asia 6,078 6,069 5,542 3,777
Non-Asia of which:
257 187 194 145
North America* 22 26 27 41
Europe 47 70 72 51
Oceania* 26 31 33 19
Others 162 60 62 34
Non-citizen grooms 1,895 2,306 2,369 1,839
Asia 1,227 1,491 1,599 1,164
Non-Asia of which:
668 815 770 675
North America* 111 164 118 121
Europe 337 404 385 359
Oceania* 112 134 124 99
Others 108 113 143 96
*“North America” consists of United States of America and Canada. “Oceania” consists of Australia, New Zealand, and Papua New Guinea.
Source: Department of Statistics
Population in Brief 2021Population in Brief 2021
2524

Table 13: Median age of mothers at first birth by residency status of mothers (years)
2010 2015 2019 2020
Residents 30.1 30.7 30.9 31.1
Citizens 29.8 30.3 30.6 30.8
Source: Immigration & Checkpoints Authority
Table 14: Average number of children born to ever-married females aged 30 – 49 years by residency status of females, as of June (per ever-married female)
2010 2015 2019 2020
30 – 39 40 – 49 30 – 39 40 – 49 30 – 39 40 – 49 30 – 39 40 – 49
Residents 1.49 2.02 1.46 1.85 1.41 1.79 1.40 1.76
Citizens 1.55 2.08 1.49 1.91 1.44 1.83 1.44 1.81
Source: Department of Statistics
Table 15: Proportion of ever-married females aged 30 – 49 years who are without children by residency status of females, as of June (%)
2010 2015 2019 2020
30 – 39 40 – 49 30 – 39 40 – 49 30 – 39 40 – 49 30 – 39 40 – 49
Residents 20.1 9.3 20.7 11.6 22.9 12.3 23.8 13.5
Citizens 20.5 8.6 21.9 11.3 24.4 12.5 24.1 13.6
Source: Department of Statistics
Table 16: Number of births20 by birth order and residency status
Birth Order 2010 2015 2019 2020
Total births 37,967 42,185 39,279 38,590
Resident births 35,129 37,861 35,330 34,233
First 16,710 17,915 16,461 15,989
Second 12,390 13,314 12,416 11,810
Third 4,299 4,731 4,401 4,320
Fourth 1,224 1,332 1,323 1,370
Fifth & over 506 569 729 744
Citizen births 30,131 33,725 32,844 31,816
First 14,127 15,887 15,203 14,720
Second 10,444 11,632 11,513 10,978
Third 3,910 4,375 4,131 4,072
Fourth 1,160 1,278 1,278 1,320
Fifth & over 490 553 719 726
Source: Immigration & Checkpoints Authority
Table 17: Resident total fertility rate by ethnic group (per female)
2010 2015 2019 2020
Overall 1.15 1.24 1.14 1.10
Chinese 1.02 1.10 0.99 0.94
Malays 1.65 1.79 1.80 1.82
Indians 1.13 1.15 0.98 0.96
Source: Department of Statistics
20 Citizen births refer to births born to at least one citizen parent. Resident births refer to births born to at least one citizen or PR parent.
Population in Brief 2021Population in Brief 2021
2726

Table 18: Profile of SCs and PRs granted in 2020
New Permanent Residents New Citizens
Total 27,470 21,085
By age group (%)
Above 40 years 9.1 21.5
31 – 40 years 31.2 26.3
21 – 30 years 37.1 15.2
20 years and below 22.7 37.1
By highest qualification attained among those aged 20 & over (%)
Post-secondary 84.3 80.9
Secondary and below 15.7 19.1
By region of origin (%)
Southeast Asian countries 56.2 56.8
Other Asian countries 35.4 37.2
Others 8.4 6.0
Source: Immigration & Checkpoints Authority
List of Relevant Publications:
Singapore Department of Statistics
Population Trends 2021
Census of Population 2020
General Household Survey 2015
Statistics on Marriages & Divorces 2020
Immigration & Checkpoints Authority
Report on Registration of Births & Deaths 2020
Singapore Demographic Bulletin
Ministry of Manpower
Statement on Labour Market Developments in 1H 2021
Manpower Statistics in Brief 2021
For more information, you may visit the following websites:
National Population and Talent Division, Strategy Group, Prime Minister’s Office
www.population.gov.sg
Singapore Department of Statistics www.singstat.gov.sg
Ministry of Home Affairs www.mha.gov.sg
Immigration & Checkpoints Authority www.ica.gov.sg
Ministry of Manpower www.mom.gov.sg
Population in Brief 2021Population in Brief 2021
2928

A JOINT PUBLICATION BY:
National Population and Talent Division, Strategy Group, Prime Minister’s OfficeSingapore Department of StatisticsMinistry of Home AffairsImmigration & Checkpoints AuthorityMinistry of Manpower
September 2021