population genetics: basics and future applications to
TRANSCRIPT

46 SPC Fisheries Newsletter #162 - May–August 2020
Population genetics: Basics and future applications to fisheries science in the Pacific
Giulia Anderson,1 Jed Macdonald,2 Joe Scutt Phillips3 and Simon Nicol4
Quantitative genetics and genomics provide an under-utilised avenue for monitoring capture fisheries. While most fisheries assessment tools use macro-scale observations as a proxy for the health, distribution and delineation of fish stocks, genetics directly measures the in situ molecular footprint of population health and structure. Genetics does not replace other forms of fisheries monitoring, rather it provides clarity and quantification of previously qualitative observations. As the Pacific region increasingly assimilates population genetics into its research toolkit, it is useful to briefly review population genetic analyses and their likely application in the fisheries science undertaken for member countries and territories of the Pacific Community.
of entire segments of the genetic code. Because there are so many different ways for DNA to vary, the overall genetic code is unique per individual. There are also two different genomes contained within a cell, nuclear and mitochon-drial, each with different patterns of variation. Genetic anal-yses take advantage of all of these characteristics. Moreover, the processes that generate and spread new mutations in DNA provide a basis for understanding how species evolve, and how populations develop differing traits and adapt to changing environments and stressors.
At its most conservative, DNA diagnostics can provide an accurate identification of a specimen’s species, which is useful when other taxonomic features are missing (Fig. 1).
1 Fisheries Molecular Geneticist, SPC. Author for correspondence: [email protected] 2 Senior Fisheries Scientist (Tuna Biology and Ecology), SPC3 Senior Fisheries Scientist (Statistical Modelling), SPC4 Principal Fisheries Scientist (Fisheries and Ecosystem Monitoring and Analysis), SPC5 The definition of DNA and other words or acronyms specific to genetics can be found in the glossary at the end of this article.
IntroductionAn individual’s DNA5 serves as inherited genetic instruc-tions for development, functioning, growth and reproduc-tion. DNA very occasionally mutates, creating variation in these instructions. Each instance of variation contributes to genetic diversity at the individual and population scale. In turn, genetic diversity is the basis of most genetic inferences. Some types of variation produce differences in an individu-al’s physical characteristics or fitness, while other types have no measurable consequences. Variations can be as small as the switch of a single nucleotide (the building block unit of DNA) in the genetic code, as complicated as the inversion of a DNA sequence, or involve the duplication (or deletion)
Figure 1. Schematic of fundamental applications of genetics.
Species identification
mt DNA
+Nuclear DNAMicrosatellites
SNP
Provenance
Stock/multi-stock delineation
CKMR
Adaptive potential
Bycatch interaction
Catch verification
Diet
eDNA
=
+ Barcoding = Library =
Spawning biomass
Fishing mortality
Biosecurity
Biodiversity

47
In more complex applications, genetic information can be used to evaluate the differences among individuals of the same species (Fig. 2), with implications for delineating the boundaries and estimating the degree of connectivity among populations. At its most powerful, the theory of population genetics provides an in-depth understanding of the related-ness of individuals and can directly estimate population size and mortality (Fig. 1).
The increased feasibility of incorporating a genetic perspec-tive into fisheries monitoring, stems from the recent devel-opment and commercialisation of “high throughput” DNA sequencing technologies. The resulting increase in DNA processing capacity, reduction in cost, and greater quantities of data output make genetic assessment accessible, conveni-ent and informative. An appealing argument for incorporat-ing molecular approaches in fisheries science is the ability to avoid steps in data collection and analyses associated with other approaches that often introduce bias or weaken infer-ence. However, molecular methods are also only effective if applied accurately and with appropriate expectations of how results can be interpreted.
Here we provide an introduction on genetic applications for fisheries management.
What are the steps in DNA analysis?Studies that wish to incorporate DNA analyses have many protocols available, and these can be broadly classified into one of two methods of collecting information. Traditional methods rely on variations in the length of key fragments of DNA that indicate differences in the underlying genetic code. Sequencing methods (most notably next generation sequencing, or NGS) directly assess the genetic code itself. Some basic steps and details are common to both methods (see also Fig. 3).
8 Common Step 1. Extract a sample of tissue that is not contaminated by foreign DNA. Because genetic analy-ses focus on genetic diversity, and the introduction of foreign DNA also introduces foreign genetic varia-tion, analyses using contaminated samples will be seri-ously compromised. Contamination can easily occur by touching tissue samples taken from one organism with equipment that previously came in contact with other individuals of the same or similar species, or other, non-sterile surfaces.
8 Common Step 2. Extract the DNA. This can be done with commercially available kits and a few specialised pieces of equipment, or can be outsourced to specialised facilities for automated, high-volume sample processing.
Figure 2. Examples of genetic patterns that indicate the presence of population structure (left panel), and how they might be interpreted (right panel). Different coloured fish represent the expression of different alleles. Dotted pink lines indicate proposed stock delineations; pink gradient indicates degree of uncertainty in where the actual divisions lie.
Population genetics: Basics and future applications to fisheries science in the Pacific

48 SPC Fisheries Newsletter #162 - May–August 2020
8 Common Step 3. Fragment DNA. Traditional and NGS protocols use the same techniques to cut DNA into fragments, although for different reasons. Tradi-tional methods directly infer the presence of genetic variation based on fragments produced in this step; next generation technology carries physical limits in the length of DNA strands that can be sequenced, and so requires that DNA be cut to a particular size. Both methods can also use fragmenting strategically to target (to either cut or not cut) particular genetic regions.
8 Optional Step 3b. Select a subset of DNA for fur-ther analysis. This can be done by either targeting key regions of interest (especially in conjunction with tar-geted fragmenting), or filtering DNA fragments based
on arbitrary parameters (e.g. a particular length). Ben-efits of subsetting include discarding low-quality or uninformative DNA fragments that otherwise intro-duce “noise” into the data, and streamlining resources, effort and monetary investments associated with DNA processing.
8 Common Step 4. Amplify the DNA. All protocols use some variation of polymerase chain reaction (PCR) to make many more copies of each DNA fragment. Although this is not an essential step in numerous tra-ditional protocols, it makes it easier to identify genetic bands later. PCR is essential to NGS. In all cases, this amplification also reduces the need for large original volumes of tissue.
Collect DNA samples
Retain target genome regions
Extract DNA
Fragment DNA
Amplify DNA
Retain arbitrary subset
Amplify DNA
Sequence DNA fragments Sequence DNA fragments Electrophoresis Electrophoresis
Amplify DNA
Precise observation of novel SNPs
Precise observation of known microsatellites,
SNPsIndirect observation of
microsatellitesObservation of marker types like
allozymes, R F LPs
Identify genetic variants
Filter data for quality
Inferences of population dynamics through all available computation methods
Inferences of species through database
comparisons
Inferences of population dynamics through basic statistical analyses including F ST ,
differences in observed heterozygosity
Precise observation of mt DNA
Figure 3. Basic steps in genetic analyses. Blue = common stepsYellow = traditional marker types/studies Green = sequencing marker types/studiesPink = NGS de novo sequencing (best method for producing maximum inference with limited existing information/initial investment)Orange = analyses specific to mitochondrial DNA (mtDNA) sequence data.
Population genetics: Basics and future applications to fisheries science in the Pacific

49
Traditional and NGS protocols begin to deviate at this point.
8 Traditional Step 5. Visualise DNA fragments using gel electrophoresis. DNA will separate in isolated bands along the gel based on length and electric charge.
8 Traditional Step 6. Call genotypes (often short-handed by turning “genotype” into a verb: e.g. “submit the raw data for genotyping”). Genetic variation among speci-mens can be inferred from the differences in distribu-tion of DNA fragments across the gel. Each variable DNA fragment on the gel is interpreted as a version of that genetic segment (a variant or allele at that locus). It is also noted if each specimen carries one or two versions per segment, which determines if it is homozygous (one allele) or heterozygous (two alleles) at that locus.
8 Traditional Step 7. Analyse data.
Because marker types associated with traditional methods produce limited data, they can only be analysed with sim-ple statistics that produce low-resolution inferences. If using NGS methods, sequencing, genotyping and interpreting data are all much more involved.
8 NGS Step 5. Sequence selected DNA fragments, nucleotide by nucleotide. This amounts to reading the very building blocks of the genetic code, brick by brick. Currently, the most popular protocol is genotyping-by-sequencing. The technology involved in this step is quintessential to the high-throughput sequencing revo-lution. Conveniently, it is standard to outsource NGS work to industrial laboratories.
8 NGS Step 6. Identify variable genetic regions and call genotypes using automated software. The process requires tremendous computing power and is typically done using a “supercomputering” cluster as part of a sequencing laboratory’s standard services.
8 NGS Step 7. Quality check and filter variant data. Datasets are subjected to a series of tests with thresholds determined by the available data quality and intended analyses.
8 NGS Step 8. Analyse data.
NGS produces large volumes of data that can improve sta-tistical power, and allows for in-depth analyses that capture the complex patterns that exist in DNA variation. Analyses that benefit from or depend on increased computational power include clustering algorithms, principle component analyses, multivariate analyses, analyses of variance tuned to molecular data (AMOVA), migration and bottleneck esti-mations, population assignment, and species identification.
What are the types of markers and analyses?Variation in the genome occurs in multiple dimensions that are measured using different tools or marker types. For example, allozymes mark genetic variation based on the final structure of produced proteins. Microsatellites observe patterns of repeating nucleic sequences for variation in physical length. Single nucleotide polymorphisms (SNPs) identify nucleotide substitutions in the genetic code itself. Each type of variation, and the associated marker type, dif-fers in characteristics such as mutation rate, evolutionary selective pressure, and the number of possible variants per locus. The differences determine what type of marker is useful to a research question. For example, microsatellites have a higher mutation rate than SNPs, making microsatel-lites useful indicators of recent demographic changes, and SNPs more useful for exploring historical patterns. Alter-natively, many loci in mtDNA have such a high mutation rate that when tested in very large populations (typical of tunas), they predictably return an overload of genetic vari-ation that is impossible to parse into meaningful patterns. However, mtDNA’s extreme variability, paired with its stepwise mutation pattern, makes it very useful in devising phylogenetic trees at the species level. Figure 4 describes the practical applications of the most popular traditional and NGS-relevant marker types, along with the relative invest-ment needed and information gained from each.
Cost is almost always the limiting factor in genetic research. The protocols that produce each marker type require spe-cialty equipment, human effort and expertise, which drive the associated expense. The number of loci to be genotyped per specimen, the number of specimens to be processed, and the number of tissue specimens to be collected, all impact the final cost, which also means that limited funding caps the volume of data that can be produced.
Inferential power per locus correlates with the number of possible genetic variants. A single microsatellite with 20 possible variants (alleles) carries roughly as much informa-tion as 10 bi-allelic SNPs. Studies using marker types with low information content can still produce statistical power if enough loci are observed, as is the case with NGS protocols that produce thousands to millions of SNPs. Ultimately, it is the total volume of data a study produces that determines what kind of analyses are appropriate to apply (Fig. 5).
Multiple algorithms are available within each analysis type that might be more or less applicable per species and study design. However, in general, studies using more and more informative marker types have access to more data-demand-ing analyses that also produce higher confidence and precise observations. Heterozygosity assessments are exempt from the trend because, while the nuance provided is very mar-ginal, the information is the basis of almost all other analyses and is the gateway assessment to justify if further data explo-ration is worthwhile.
Population genetics: Basics and future applications to fisheries science in the Pacific

50 SPC Fisheries Newsletter #162 - May–August 2020
Figure 4. Comparative performance of the five most popular marker types across various parameters that commonly drive a researcher’s choice of markers for a given study.
Info per locusCharacteristics
Investment
Info per investmentUse in
Number of loci per studyInfo per study
CostE�ort
Bene�t from having reference genomeWithout reference genome
With reference genomeSpecies/population ID
Genetic healthGenetic structure
Kinship
1 (Bad) 2 3 4 5 6 7 8 9 10 (Good)
1 (Bad) 2 3 4 5 6 7 8 9 10 (Good)
Info per locusCharacteristics
Investment
Info per investmentUse in
Number of loci per studyInfo per study
CostE�ort
Bene�t from having reference genomeWithout reference genome
With reference genomeSpecies/population ID
Genetic healthGenetic structure
Kinship
Info per locusCharacteristics
Investment
Info per investmentUse in
Number of loci per studyInfo per study
CostE�ort
Bene�t from having reference genomeWithout reference genome
With reference genomeSpecies/population ID
Genetic healthGenetic structure
Kinship
Characteristics
Investment
Use in
Info per locusCharacteristics
Investment
Info per investmentUse in
Number of loci per studyInfo per study
CostE�ort
Bene�t from having reference genomeWithout reference genome
With reference genomeSpecies/population ID
Genetic healthGenetic structure
Kinship
Characteristics
Investment
Use in
Info per locusCharacteristics
Investment
Info per investmentUse in
Number of loci per studyInfo per study
CostE�ort
Bene�t from having reference genomeWithout reference genome
With reference genomeSpecies/population ID
Genetic healthGenetic structure
Kinship
Characteristics
Investment
Use in
SNP
Allo
zym
esRF
LPm
tDN
AM
icro
sate
llite
sPopulation genetics: Basics and future applications to fisheries science in the Pacific

51
Figure 5. Information gained versus computational demands for a range of genetic data analyses. Analyses in red assess genetic diversity, those in blue assess population structure, those in orange assess species-level questions. Kinship is a unique bridge between diversity (when considered at the individual level) and structure (when zoomed out to the population level).
Data / computation intensity
Inform
ativen
ess
Data analysis in population genetic assessments has evolved in line with genotyping protocols. Originally, studies observing a handful of allozymes, each with a few alleles, used a simple statistical test to quantify differences in the proportion of each allele and the proportion of heterozy-gotes per marker per population. More informative analyses compared proportions of heterozygotes and homozygotes (statistics like the inbreeding coefficient FIS, and the fixa-tion index FST). As improved DNA sequencing protocols enabled studies to produce orders of magnitude more data-points, it became feasible, if not essential, to synthesise data based on variance among loci, averaged trends, and prob-ability assignments, among others, in order to recognise use-ful patterns.
Although high-volume datasets still pay homage to baseline statistics such as FIS and FST, they invariably take advantage of the improved nuance of more computationally intensive analyses such as clustering algorithms, which trial thousands of iterations of potential specimen groupings in order to rec-ommend the most parsimonious network among observed individuals.
To summarise the generic relationships driving study design, a study’s chosen genetic marker type and analysis type(s) build off one another. Choice in marker type predicts the amount of data that will be produced, which in turn influ-ences the types of analyses that can be performed. Antici-pating the statistical power necessary to capture biological patterns of interest determines the type of analyses that should be applied and the type of markers that can provide the required volume of data. External considerations, such as cost of DNA processing for the various marker types, often dictate that a compromise is reached between the most informative and most economical research methods.
1 Expected and observed heterozygosity2 Inbreeding coefficient3 Effective population size4 Bottleneck analysis5 Pairwise fixation index6 (Hierarchical) analysis of molecular variance (AMOVA)7 Principal component analysis8 Multivariate analysis9 Population assignment10 Migration rate11 Clustering algorithms12 mtDNA haplotype mapping13 Kinship
The unique characteristics of each marker type, which extend beyond the amount of genetic information they commonly generate, influence their utility for particular research questions. In short:
8 mtDNA sequence interpretation is best suited for iden-tifying species;
8 microsatellites are adequate for assessing kinship and recent population structure;
8 SNPs are the king/queen of marker types, and match or out-perform all other marker types in most types of analyses (with the exception of species ID) given a large enough number of markers; and
8 Allozymes and RFLPs remain relevant as options when NGS is not feasible.
Applications to fisheriesGenetic analyses can be applied to a wide range of fisher-ies-related questions (Table 1). Some basic rules can help to navigate how genetics terminology translates to such questions. Concerns related to population sustainability, including overfishing, appropriate fishing quotas, or stock robustness in the face of climate change, can be addressed by studies of population genetic health. Questions related to fish distribution, movement, intermixing, schooling and population dynamics, can be addressed through analyses of population genetic structure.
In reality, the division between genetic health and genetic structure analyses is very fine. Based on the accepted rule that large, highly connected populations tend to be more genetically robust, studies of genetic health can validate
Population genetics: Basics and future applications to fisheries science in the Pacific

52 SPC Fisheries Newsletter #162 - May–August 2020
Table 1. Summary of common fisheries topics and the related information provided by genetic studies.
Fisheries applicable topics Possible inferences Limiting factors
Gene
tic di
versi
ty /h
ealth
Absolute stock abundance Quantitative estimation of the number of adults in a population
Depends on close-kin mark-recapture (CKMR), a new technique that has been tested in a limited number of species with only a moderate number of spawning adults.
Fishery sustainabilityOverfishing and recovery status Need for fishing quota adjustments
Presence of past or current reductions in population size, whether due to overfishing or natural causesPresence and degree of inbreeding and loss of population-wide genetic diversity
Ability to sense historical reduction events varies with type of genetic markerPotential for confounding factors to replicate patterns associated with overfishingNot possible to isolate fishing mortality from natural mortality
Adaptive capacityFuture sustainability
Likelihood of population stability in the face of climate change and other environmental variability
Genomic adaptive capacity is fairly straightforward to quantify, but wholistic adaptive capacity also needs to consider ecological input, behaviour, phenotypic plasticity, etc
Popu
lation
stru
cture
Stock number and boundaries Presence and strength of population structure, with implications for identifying underlying drivers
Depends on effective sampling to capture spatial and temporal differentiation; cannot make confident inferences about locations and times that were not sampled
Stock sub-structuring Presence and strength of more subtle, dynamic, or small-scale population structureDifferent kinds of potential patterns include isolation by distance, metapopulations, temporally variable structure due to migration, etcDrivers could include moderately strong site fidelity, other reductions in mobility, non-random mating, environmental selection, behaviour, etc
Extremely diverse calculations are available, with subtle differences in assumptions; selecting inappropriate equations/models can produce erroneous resultsAs structure gets more subtle, differentiating biologically significant patterns from noise in the data is more challenging and subjective; likewise, isolating drivers with similar patterns becomes more complex.
Mobility, connectivity Degree of reproductive mixing between groupsPotential underestimation of stock separation reported by other genetic tools, based on the disproportionate moderating effects a few migrants can have on genetic structure
Significant diversity exists among algorithms intended to infer migration rates, which often introduce assumptions about stock structure. Inappropriate model selection can significantly impact results
Specimen provenance Extent of admixture between different stocksIndividual mobility when calibrated with catch location
Confidence of population assignment depends on extent of differentiation between populations
Cons
erva
tion/
Man
agem
ent
Species identification Confirmation of species that are difficult to identify morphologicallyHybridisation between species
Requires pre-existing data in global databases for comparison; can be limited for non-model species
Recognising conservation concern
Intensity of necessary response based on reduction of adaptive capacity, presence of inbreeding, low genetic diversity, population fragmentation, etc
Acquiring enough specimens can be difficult in rare species
Recommendation of appropriate action
Best practices to avoid introducing outbreeding depression or other negative consequences through conservation initiatives
Genetic analyses can easily recognise when population differentiation exists or not, but require much greater investment to predict if mixing two differentiated groups will produce maladapted offspring
Effectiveness of ongoing conservation and management policies
Change over time in depth of genetic diversity, heterozygosity, and other measures of adaptive capacity
Depleted populations often violate assumptions that underly genetic assessment algorithms, skewing and introducing subjectivity into results
Beha
viour
Migration patterns Can confirm if fish sampled on and off an expected migration route are from the appropriate stock
Genetics does not provide indicators of previous travel; better assessed using tagging and otolith chemistry and confirmed genetically if appropriate
Spawning locationsSpawning times
Presence and number of distinct migratory spawning sites in species that are known to undertake spawning migrationsPresence of non-random mating in mixed stock spawning grounds
Genetics only provides inferences based on patterns of population structure; spawning locations and times are better assessed using tagging, catch data, etc
Future responses to unprecedented stress (especially climate change)
Extent of genetic adaptive capacityPresence of potentially advantageous genetic variations that would allow individuals to withstand new stress
Inappropriate to rely on genetic features to predict individual behaviour in complex organisms such as teleost fish; better assessed using modelling
Confidence levels:Green High confidence assessment using predominantly genetic toolsYellow Moderate confidence from genetic assessments; high stakes decisions should incorporate external research tools, but genetic inferences are sufficient for basic understandingGrey Marginal confidence from genetic assessments; strongly recommended to incorporate external techniques before drawing conclusions
Population genetics: Basics and future applications to fisheries science in the Pacific

53
results against known population structure. Conversely, observations of unexpectedly low genetic diversity (and con-sequently health) in a large population can indicate the pres-ence of previously unrecognised population substructure. Especially when a research question carries high stakes, such as informing conservation of a vulnerable species or recom-mending management changes to an important fishery, it is common to incorporate as many analytical approaches as possible to maximise confidence in the results.
Trust in inferences based on genetic data is generally high, but still not unequivocal. Genetic health is directly depend-ent on genetic diversity, which in turn is directly quantified using genetics tools; therefore, confidence in these types of analyses can be very high. However, structure analyses are more involved assessments of these same data, and are used to draw conclusions about a broader diversity of topics. For example, it often falls on the data interpreter to determine if heterozygosity in a sample group is lower than expected because of the presence of cryptic population structure, an abrupt isolation event in the distant past, migration pat-terns, or inadvertent biases in sampling of a mixed stock, among other options. Context usually provides clues to ele-vate one explanation over others, but brings its own poten-tial for misinterpretation. In short, structure analyses carry relatively more possibility of inaccurate representation than baseline genetic health assessments, yet it is important to note that all genetic analyses depend on collecting samples that are both representative of the larger population being studied, and free of contamination.
The single greatest determining factor in the success of population-level genetic research is appropriate sample col-lection. Genetic analyses present snapshots of population parameters based on where and when individuals were sam-pled. Even when sample groups are accurate representations of the population, if they are not taken in a pattern that cap-tures the phenomena of interest, results will be inconclusive. This is especially relevant for highly mobile pelagic species. For example, such species might comprise multiple popula-tions that use the same spawning ground asynchronously, each occupying the same location at different times of year. If samples are taken annually but not seasonally, there will be no evidence of sequential habitation. Likewise, inferences made using a specific sample set may not apply to unobserved locations, times, life stages, or parts of the genome. Sample groups of mature adults consist of the tiny fraction of multiple cohorts that survived to that point, whereas juvenile sample groups contain more individuals from only a few cohorts and have not yet experienced the full range of environmental pres-sures. Applying patterns derived for one group to the other will likely produce inappropriate interpretations. The onus lies with the research team to collect samples in a pattern that can produce informative and accurate conclusions regarding the question that they wish to ask.
There are also blind spots in the types of inferences that are safe to derive from genetics. Unlike otolith chemistry
or other biomarkers, DNA remains stable across an indi-vidual’s life and, therefore, carries no information about the behavioural or movement history of the individual. However creative applications are possible. For example, at a group level, the shared spawning location of related individuals can be inferred from DNA. Thus, genetics does have the capacity to verify pre-existing hypotheses concerning behaviour and migration.
When it doesn’t go smoothly…The biggest challenge to the success of genetic studies occurs when there is insufficient capacity or funds to collect the appropriate number and distribution of specimens, and to extract enough genetic data from each to answer questions with confidence. However, other hiccups can also occur that threaten to compromise a study’s integrity and success.
Examples include a study design that fails to sample in a pattern that captures the true pattern of genetic variabil-ity. Even given an appropriate study design, non-random or inadequate collection of specimens will result in sample groups that do not represent the larger population. Further, poor sample collection and storage protocols, and mishan-dling during DNA processing can allow DNA to degrade or be contaminated, leading to information loss or, in the case of unidentified contamination, the risk of interference with biologically relevant trends in the data. Even given success-ful extraction of genetic data, use of inappropriate statistical analyses, or failure to recognise the limits of such analyses, can lead to misinterpretation and inaccurate conclusions.
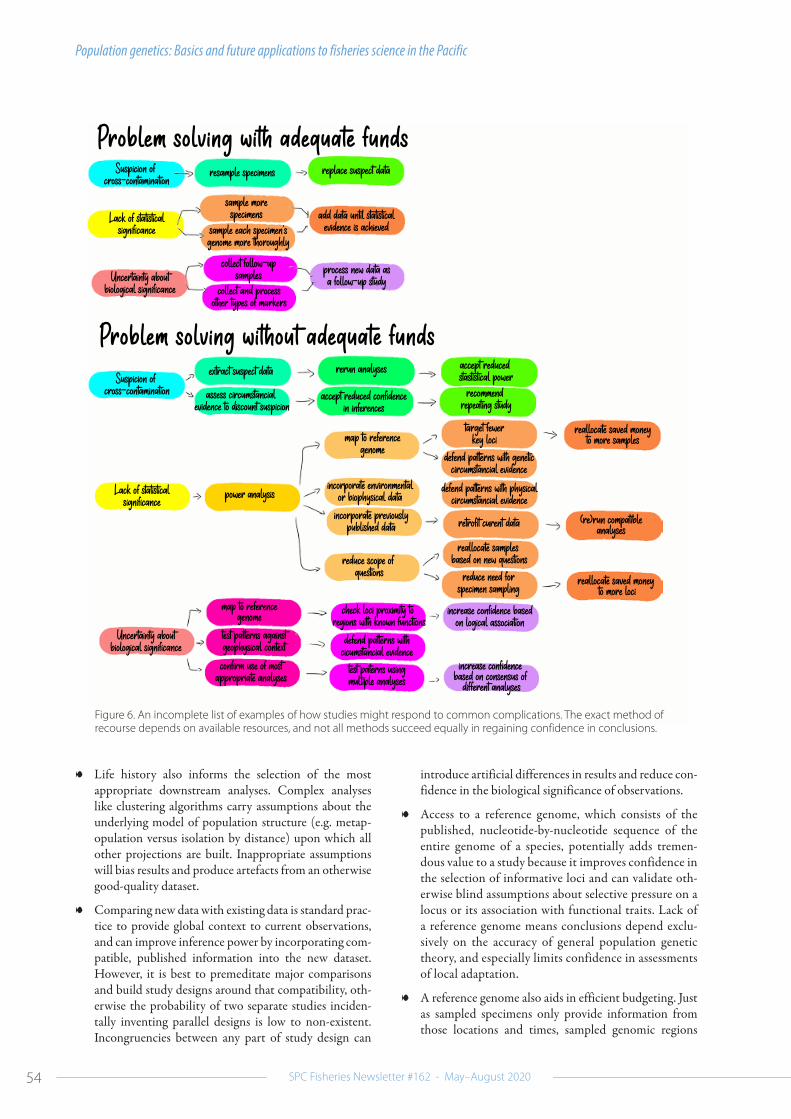
Fortunately, most issues can be avoided or corrected. Figure 6 provides potential avenues around some of the most com-mon complications.
Some basic awareness during the study design and imple-mentation phases can help avoid many obstacles.
8 Knowing a species’ life history first informs expectations of results, allowing researchers to anticipate the statisti-cal power (and, therefore, the number of specimens and amount of genetic data per specimen) needed to gener-ate accurate and conclusive results.
8 Second, life history drives the sample collection strategy. In a classic example of non-random sampling, if a study intends to address broad-scale population dynamics but accidentally samples kin groups or other forms of local population substructure, it will produce inferences that are appropriate to the sample subgroup but distorted when projected onto a larger population. Anticipat-ing the extent to which such substructure exists helps a researcher select an appropriate specimen collec-tion strategy and avoid introducing noise into datasets focused on a specific question.
Population genetics: Basics and future applications to fisheries science in the Pacific
54 SPC Fisheries Newsletter #162 - May–August 2020
Lack of statisticalsignificance
Lack of statisticalsignificance
Uncertainty aboutbiological significance
Uncertainty aboutbiological significance
rerun analyses
accept reduced confidencein inferences
incorporate environmentalor biophysical data
incorporate previouslypublished data
reduce scope of questions
check loci proximity to regions with known functions
defend patterns withcicumstancial evidence
test paterns usingmultiple analyses
accept reduced stastistical power
recommend repeating study
target fewerkey loci
defend patterns with geneticcircumstancial evidence
defend patterns with physicalcircumstancial evidence
retrofit curent data
reallocate samples based on new questions
reduce need forspecimen sampling
increase confidence basedon logical association
increase confidence based on consensus of
different analyses
reallocate saved moneyto more samples
(re)run compatibleanalyses
reallocate saved money to more loci
extract suspect data
assess circumstancial evidence to discount suspicion
power analysis
map to referencegenome
map to referencegenome
test patterns againstgeophysical context
confirm use of mostappropriate analyses
replace suspect data
add data until statisticalevidence is achieved
process new data asa follow-up study
resample specimens
sample morespecimens
sample each specimen’sgenome more thoroughly
collect follow-upsamples
collect and processother types of markers
Problem solving with adequate funds
Problem solving without adequate fundsSuspicion of
cross-contamination
Suspicion of cross-contamination
8 Life history also informs the selection of the most appropriate downstream analyses. Complex analyses like clustering algorithms carry assumptions about the underlying model of population structure (e.g. metap-opulation versus isolation by distance) upon which all other projections are built. Inappropriate assumptions will bias results and produce artefacts from an otherwise good-quality dataset.
8 Comparing new data with existing data is standard prac-tice to provide global context to current observations, and can improve inference power by incorporating com-patible, published information into the new dataset. However, it is best to premeditate major comparisons and build study designs around that compatibility, oth-erwise the probability of two separate studies inciden-tally inventing parallel designs is low to non-existent. Incongruencies between any part of study design can
introduce artificial differences in results and reduce con-fidence in the biological significance of observations.
8 Access to a reference genome, which consists of the published, nucleotide-by-nucleotide sequence of the entire genome of a species, potentially adds tremen-dous value to a study because it improves confidence in the selection of informative loci and can validate oth-erwise blind assumptions about selective pressure on a locus or its association with functional traits. Lack of a reference genome means conclusions depend exclu-sively on the accuracy of general population genetic theory, and especially limits confidence in assessments of local adaptation.
8 A reference genome also aids in efficient budgeting. Just as sampled specimens only provide information from those locations and times, sampled genomic regions
Figure 6. An incomplete list of examples of how studies might respond to common complications. The exact method of recourse depends on available resources, and not all methods succeed equally in regaining confidence in conclusions.
Population genetics: Basics and future applications to fisheries science in the Pacific

55
only demonstrate patterns relevant to those exact loci. Knowing what parts of the genome will be informative to a research question (perhaps a particular gene, or a sex chromosome) allows for targeted genetic sampling, which limits costs from extraneous genetic sampling and reduces noise in the data.
8 Cross-contamination among samples is a perpetual con-cern in genetic analyses and, once it occurs, it is difficult to correct. Vigilance in following sterilisation proto-cols from sample collection to sequencing is an essen-tial point, and minimises the risk of needing to discard hard-earned data later.
Pacific resourcesBecause of the significant bioinformatics focus of mod-ern genetic assessments, the global genetics research com-munity has developed robust support networks that stem from or mirror other computer science-associated fields. Many genetic assessment software programs exist on free platforms like R and Github. Online chatrooms such as Bio-stars, Stacks and ResearchGate have a wealth of discussion fora for troubleshooting specific software and interpret-ing results. Software developers are often very responsive to direct email contact regarding the performance of their published code.
It is also standard practice to outsource next generation DNA sequencing work to specialised, commercial labora-tories. International shipment of tissue and preliminarily processed DNA is, therefore, common.
That said, working within the region generally reduces logistics, and potentially cost. The MOANA Labs at the University of the South Pacific in Suva, Fiji, has in-house capacity for small-scale projects using basic DNA extraction and traditional protocols. New Zealand Genomics Limited, a collaborative effort of several universities with government support, is Illumina-Propel certified to conduct NGS pro-tocols at its University of Otago campus. Diversity Arrays Technology in Australia has developed an independent and highly popular NGS protocol, DArTseq. Many other, simi-larly equipped labs exist across the Pacific region.
The Pacific Community in focusThe Pacific Community (SPC) has supported collabora-tions with other Pacific organisations, including the Univer-sity of the South Pacific and the Commonwealth Scientific and Industrial Research Organisation (CSIRO), to conduct preliminary population genetic structure and genetic health assessments of albacore, bigeye, skipjack and yellowfin tunas. These applications have identified the need for fur-ther research to investigate substructure driven by uneven reproductive success, the presence of kin in schools, and local adaptation. Other collaborations are developing and expanding new bioinformatic applications of genetic data, such as the close-kin mark-recapture concept, which infers absolute population size. Metabarcoding methods have also been applied for identifying tuna and seabird diets (with the University of Canberra and the Institute of Research for Development).
To progress these projects, SPC has recently commenced work on a design study to define the analytical tools, sam-pling coverage and investment required to resolve long-standing ecological questions for tropical tuna species in the western and central Pacific Ocean. To assist with this design study, SPC has also initiated the establishment of an infor-mal advisory panel. While the initial role of this panel is to advise on the question of tuna stock structure, it is expected to evolve in scope to comment on the implementation of molecular genetics studies undertaken by SPC. Panel par-ticipants include experts in the application of molecular genetics and sample collection in the Pacific region. While the advisory panel is informal, SPC is utilising it as a first step in ensuring science quality and appropriate peer-review for molecular genetics applications in the region.
Here, we have aimed to demystify some of the key aspects of genetic analyses in the context of fisheries research. In developing genetics research capacity for the region, includ-ing logistical support for other Pacific research groups and in-house technical expertise for data assessment and inter-pretation, SPC hopes to foster knowledge exchange and encourage the wider application of genetic tools within Pacific fisheries management frameworks.
Population genetics: Basics and future applications to fisheries science in the Pacific

56 SPC Fisheries Newsletter #162 - May–August 2020
Glossary
allele: An allele is a variant form of a given gene, meaning it is one of two or more versions of a known muta-tion at the same place on a chromosome. Source: https://en.wikipedia.org/wiki/Allele
allozyme: Allozymes are variant forms of an enzyme that differ structurally but not functionally from other allozymes coded for by different alleles at the same locus. Source: https://www.genome.gov//genetics-glossary/r#glossary
CKMR: Close-kin mark-recapture (CKMR) is a recently developed method for estimating abundance and demographic parameters (e.g. population trends, survival) from kinship relationships determined from genetic samples. Source: http://afstws2019.org/sessions/
DNA: Deoxyribonucleic acid (DNA), is a complex molecule that contains all the information necessary to build and maintain an organism. All living things have DNA within their cells. In fact, nearly every cell in a multicellular organism possesses the full set of DNA required for that organism. Source: https://www.nature.com/scitable/topicpage/introduction-what-is-dna-6579978/
eDNA: Environmental DNA (eDNA) is DNA obtained from environmental samples (e.g. soil, seawater, air), rather than directly from the organisms themselves. When organisms interact with their environment, DNA from, for example, sloughed tissue or scales (in fish), body mucus, or blood is expelled, accumu-lates and can be measured by sampling that environment. Source(s): https://www.sciencedirect.com/science/article/pii/S0006320714004443?via%3Dihub
https://onlinelibrary.wiley.com/doi/full/10.1002/edn3.132
heterozygosity: Heterozygosity is the condition of having two different alleles at a locus. Fundamental to the study of genetic variation in populations. Source: https://www.oxfordbibliographies.com/view/document/obo-9780199941728/obo-9780199941728-0039.xml
locus (loci): A locus is the specific physical location of a gene or other DNA sequence on a chromosome, like a genetic street address. The plural of locus is “loci”. Source: https://www.genome.gov//genetics-glossary/r#glossary
microsatellite: A microsatellite is a tract of repetitive DNA in which certain DNA motifs (ranging in length from one to six or more base pairs) are repeated, typically 5–50 times. Source: https://en.wikipedia.org/wiki/Microsatellite
mtDNA: Mitochondrial DNA (mtDNA ) is the DNA located in mitochondria, cellular organelles within eukary-otic cells that convert chemical energy from food into a form that cells can use. Source: https://en.wikipedia.org/wiki/Mitochondrial_DNA
NGS: Next generation sequencing (NGS) is any of several high-throughput approaches to DNA sequenc-ing using the concept of massively parallel processing. Source: https://en.wikipedia.org/wiki/Massive_parallel_sequencing
RFLP: Restriction fragment length polymorphism (RFLP) is a type of polymorphism that results from variation in the DNA sequence recognised by restriction enzymes. These are bacterial enzymes used by scientists to cut DNA molecules at known locations. Source: https://www.genome.gov//genetics-glossary/r#glossary
SNP: A single-nucleotide polymorphism (SNP) is a substitution of a single nucleotide at a specific position in the genome, that is present in a sufficiently large fraction of the population (e.g. 1% or more). Source: https://en.wikipedia.org/wiki/Single-nucleotide_polymorphism
Population genetics: Basics and future applications to fisheries science in the Pacific

57
Appendix 1. Some publications related to the use of genetics in fisheries
Fisheries applicable topics Examples
Gene
tic di
versi
ty /h
ealth
Absolute stock abundance
Bravington M., Grewe P. and Davies C. 2016. Absolute abundance of southern bluefin tuna estimated by close-kin mark-recapture. Nature Commununications 7:1–8.
Hillary R. et al. 2018. Genetic relatedness reveals total population size of white sharks in eastern Australia and New Zealand. Scientific Reports 8:1–9.
Fishery sustainability Pinsky M.L. and Palumbi, S.R. 2014. Meta-analysis reveals lower genetic diversity in overfished populations. Molecular Ecology 23:29–39.
Adaptive capacity Future sustainability
Ehlers A., Worm B. and Reusch T.B.H. 2008. Importance of genetic diversity in eelgrass Zostera marina for its resilience to global warming. Marine Ecology Progress Series 355:1–7.
Nicotra A.B., Beever E.A., Robertson A.L., Hofmann G.E. and O’Leary J. 2015. Assessing the components of adaptive capacity to improve conservation and management efforts under global change. Conservation Biology 29:1268–1278.
Foo S.A. and Byrne M. 2016. Acclimatization and adaptive capacity of marine species in a changing ocean. Advances in Marine Biology 74:69-116.
Popu
lation
struc
ture
Stock number and boundaries
Pecoraro C. et al. 2018. The population genomics of yellowfin tuna (Thunnus albacares) at global geographic scale challenges current stock delineation. Scientific Reports 8:13890.
Stock substructuring
Knutsen H. et al. 2011. Are low but statistically significant levels of genetic differentiation in marine fishes ‘biologically meaningful’? A case study of coastal Atlantic cod. Molecular Ecology 20:768–783.
Selkoe K.A. et al. 2010. Taking the chaos out of genetic patchiness: seascape genetics reveals ecological and oceanographic drivers of genetic patterns in three temperate reef species. Molecular Ecology 19:3708–3726.
Liu B.J., Zhang B.D., Xue D.X., Gao T.X. and Liu J.X. 2016. Population structure and adaptive divergence in a high gene flow marine fish: The small yellow croaker (Larimichthys polyactis). PLoS One 11:1–16.
Eldon B., Riquet F., Yearsley J., Jollivet D. and Broquet T. 2016. Current hypotheses to explain genetic chaos under the sea. Current Zoology 62:551–566.
Anderson G., Hampton J., Smith N. and Rico C. 2019. Indications of strong adaptive population genetic structure in albacore tuna (Thunnus alalunga) in the southwest and central Pacific Ocean. Ecology Evolution doi:10.1002/ece3.5554
Hoey J.A. and Pinsky M.L. 2018. Genomic signatures of environmental selection despite near-panmixia in summer flounder. Evolutionary Applications 11: 1732–1747.
Grewe, P. et al. 2015. Evidence of discrete yellowfin tuna (Thunnus albacares) populations demands rethink of management for this glob-ally important resource. Scientific Reports 5:1–9.
Mobility, connectivityHedgecock D., Barber P.H. and Edmands S. 2007. Genetic approaches to measuring connectivity. Oceanography 20:70–79.Manel S. et al. 2007. A new individual-based spatial approach for identifying genetic discontinuities in natural populations. Molecular
Ecology 16:2031–2043.
Specimen provenance
Benestan L. et al. 2015. RAD genotyping reveals fine-scale genetic structuring and provides powerful population assignment in a widely distributed marine species, the American lobster (Homarus americanus). Molecular Ecology 24:3299–3315.
Kerr Q., Fuentes-Pardo A.P., Kho J., McDermid J.L. and Ruzzante D.E. 2019. Temporal stability and assignment power of adaptively divergent genomic regions between herring (Clupea harengus) seasonal spawning aggregations. Ecology Evolution 9: 500–510.
Cons
ervati
on/m
anag
emen
t
Species Identification Amaral C.R.L. et al. 2017. Tuna fish identification using mtDNA markers. Forensic Science International: Genetics Supplement Series6, e471–e473.
Recognising conservation concern
von der Heyden S. 2009. Why do we need to integrate population genetics into South African marine protected area planning? African Journal of Marine Science 31:263–269.
Recommendation for action
Flanagan S. and Jones A.G. 2017. Constraints on the F ST – Heterozygosity Outlier Approach. Journal of Heredity 561–573. doi:10.1093/jhered/esx048
Effectiveness of ongoing policies
Flanagan S. and Jones A.G. 2017. Constraints on the F ST – Heterozygosity Outlier Approach. Journal of Heredity 561–573. doi:10.1093/jhered/esx048
Dann T.H., Habicht C., Baker T.T. and Seeb J.E. 2013. Exploiting genetic diversity to balance conservation and harvest of migratory salmon. Canadian Journal of Fisheries and Aquatic Sciences 793:785–793.
Beha
viour
Migration patternsArai T., Kotake A. and Kayama S. 2005. Movements and life history patterns of the skipjack tuna Katsuwonus pelamis in the western Pacific,
as revealed by otolith Sr: Ca ratios. Journal of the Marine Biological Association of the United Kingdom 1211–1216. doi:10.1017/s0025315405012336
Spawning activity Richardson D.E. et al. 2016. Discovery of a spawning ground reveals diverse migration strategies in Atlantic bluefin tuna (Thunnus thyn-nus). Proceedings of the National Academy of Sciences113:3299–3304.
Future responses to stress
Beever E.A. et al. 2016. Improving Conservation Outcomes with a New Paradigm for Understanding Species’ Fundamental and Realized Adaptive Capacity. Conservation Letters 9:131–137.
Nicotra A.B., Beever E.A., Robertson A.L., Hofmann G.E. and O’Leary J. 2015. Assessing the components of adaptive capacity to improve conservation and management efforts under global change. Conservation Biology 29:1268–1278.
Population genetics: Basics and future applications to fisheries science in the Pacific