population ecology. descriptions and characterizations of populations how can we describe...
TRANSCRIPT

Population Ecology

Descriptions and Characterizations of Populations
How can we describe populations?
1. Occupying niche
2. Distribution pattern
3.Survivorship pattern
4.Life Tables/Life History
5.Pattern of growth (models)
6.Genetic traits/alleles

Niche• More than just the habitat• An organisms place or role in the environment• The conditions, resources and interactions
necessary for survival and reproduction• Everything needed for an organism’s existence:
_______________________________________

Define population:
________________
________________
________________Individuals in a populationa.
b.
c.

• Population ecology
_____________________________
_________________________________
• Populations – increase through __________________
______________________________
- decrease through _______________ and ______________________out of an area.
Population ecology is the study of how and why populations change
© 2012 Pearson Education, Inc.

• Dispersion patterns can be ______, _______, or _______________.– In a ______________
pattern• resources are
often unequally distributed
• individuals are grouped
in patches.
Density and dispersion patterns are important population variables
© 2012 Pearson Education, Inc.

• In a ____________ pattern, individuals are– most likely interacting and– equally spaced in the environment.
Density and dispersion patterns are important population variables
© 2012 Pearson Education, Inc.

• In a ______________ pattern of dispersion, the individuals in a population are spaced in an unpredictable way.
Density and dispersion patterns are important population variables
© 2012 Pearson Education, Inc.

Life tables track survivorship -the chance of an individual surviving to various ages.

Percentage of maximum life span50 1000
0.1
1
10
100
III
II
IP
erce
nta
ge
of
surv
ivo
rs (
log
sca
le)
Survivorship curves plot survivorship as the proportion of individuals from an initial population that are alive at each age.

Idealized models predict patterns of population growth
2 models:
1.__________________________
2. ___________________________

The rate of population increase under ideal conditions is called exponential growth. It can be calculated using the exponential growth model equation, G = r N, in which
• G is the growth rate of the population,
• N is the population size, and
• r is the per capita rate of increase (the average contribution of each individual to population growth).
© 2012 Pearson Education, Inc.

Time (months)
Po
pu
lati
on
siz
e (N
)
0 1 2 3 4 5 6 7 8 9 1011 120
50
100
150
200
250
300
350
400
450
500
Exponential growth of rabbits


Eventually, one or more limiting factors will restrict population growth:

• The logistic growth model is a description of idealized population growth that is slowed by limiting factors as the populatio nsize increases.
• To model logistic growth, the formula for exponential growth, r N, is multiplied by an expression that describes the effect of limiting factors on an increasing population size.
• K stands for carrying capacity, the maximum population size a particular environment can sustain.
G = rN
(K N)
K

Year1915 1925 1935 1945
0
2
4
6
8
10B
ree
din
g m
ale
fu
r s
eals
(th
ou
san
ds)
Growth of a population of fur seals

G rN
K
0Time
Nu
mb
er o
f in
div
idu
als
(N)
G rN (K N)K
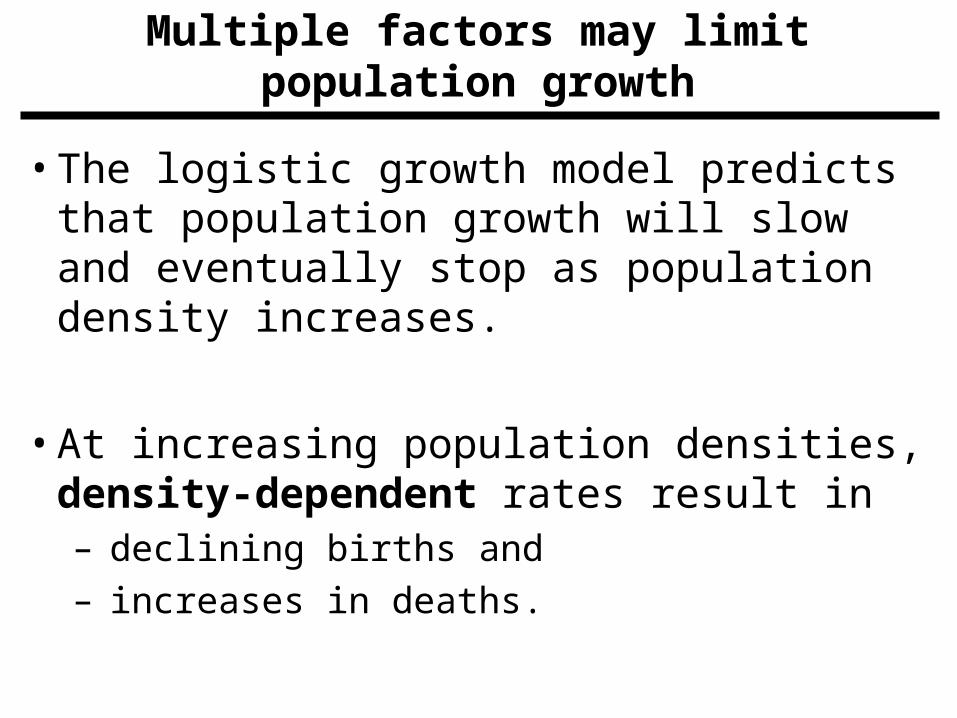
Multiple factors may limit population growth
• The logistic growth model predicts that population growth will slow and eventually stop as population density increases.
• At increasing population densities, density-dependent rates result in– declining births and – increases in deaths.

Number of breeding pairs
Ave
rag
e cl
utc
h s
ize
0 10 20 30 40 50 60 70 80 90
8
9
10
11
12

Density (beetles/0.5 g flour)
Su
rviv
ors
(%
)
0 20
20
40
60
80
100
40 60 80 100 120

• In many natural populations, abiotic factors (examples- ) may affect population size well before density-dependent factors become important.
• These are called Density-independent factors are unrelated to population density. These may include:
• ______________
• ______________
• ______________

Month
Exponentialgrowth
Suddendecline
Apr May Jun Jul Aug Sep Oct Nov Dec
Nu
mb
er o
f ap
hid
s

Some populations have “boom-and-bust” cycles
• Some populations fluctuate in density with regularity.
• Boom-and-bust cycles may be due to– food shortages or– predator-prey interactions.

Snowshoe hare
Lynx
Year1850 1875 1900 1925
0
3
6
9
Lyn
x p
op
ula
tio
n s
ize
(th
ou
san
ds
)
0
40
80
120
160
Har
e p
op
ula
tio
n s
ize
(th
ou
san
ds
)
Predator-Prey Relationship

Evolution shapes life histories
• The traits that affect an organism’s schedule of reproduction and death make up its life history.
• Key life history traits include– age of first reproduction,– frequency of reproduction, – number of offspring, and– amount of parental care.

• Populations with so-called r-selected life history traits– _______________________________________– _______________________________________
• Populations with K-selected traits– _______________________________________– _______________________________________
• Most species fall between these two extremes.
Evolution shapes life histories

• A long-term project in Trinidad– studied guppy populations,– provided direct evidence that life history traits can be
shaped by natural selection, and– demonstrated that questions about evolution can be
tested by field experiments.
Evolution shapes life histories

Pool 1Predator: Killifish;preys onsmallguppies
Guppies:Larger atsexual maturity
Pool 2Predator: Pike-
cichlid;preys on large guppies
Guppies: Smaller atsexual maturity
Hypothesis: Predator feeding preferences caused difference in lifehistory traits of guppy populations.
Pool 3Pools with killifishbut no guppiesprior to transplant
Experiment:Transplantguppies

Control:Guppies from pools withpike-cichlids as predators
Experimental:Guppies transplanted to poolswith killifish as predators
Males Females Males Females
67.5 76.1
161.5185.6
4080
120160200 100
80604020
Ag
e o
f g
up
pie
sa
t m
atu
rity
(d
ays
)
Ma
ss
of
gu
pp
ies
at
ma
turi
ty (
mg
)
48.558.2
85.7 92.3

Principles of population ecology have practical applications
• Sustainable resource management involves:
_______________________
_______________________
• Example:The cod fishery off Newfoundland– was overfished,
– collapsed in 1992, and
– still has not recovered.
• Resource managers use population ecology to determine sustainable yields.

1960 1970 1980 1990 20000
100
200
300
400
500
600
700
800
900Y
ield
(th
ou
san
ds
of
met
ric
ton
s)
Resource managers use population ecology to determine sustainable yields

Random mutations may result in new phenotypes within a population

Founder Effect


Natural selection
is simply the logical result of four features of living systems: variation - individuals in a population vary from one another inheritance - parents pass on their traits to their offspring genetically selection - some variants reproduce more than others time - successful variations accumulate over many generations

THE HUMAN POPULATION

The human population continues to increase, but the growth rate is slowing
• The human population– grew rapidly during the 20th century and– currently stands at about 7 billion.
• The demographic transition– is the shift from high birth and death rates– to low birth and death rates, and– has lowered the rate of growth in developed countries.

Population increase
Total population size
Year1500 1550 1600 1650 1700 1750 1800 1850 1900 1950 2000 2050
0
2
4
6
8
10
To
tal
po
pu
lati
on
(in
bil
lio
ns)
An
nu
al i
ncr
ease
(in
mil
lio
ns)
20
40
60
80
100

1900 1925 1950 1975 2000 2025 2050Year
Rate ofincrease
Birth rateDeath rate
0
10
20
30
40
50B
irth
or
dea
th r
ate
per
1,0
00 p
op
ula
tio
n
Demographic transition in Mexico

• In the developing nations– death rates have dropped,– birth rates are still high, and– these populations are growing rapidly.
The human population continues to increase, but the growth rate is slowing

• The age structure of a population– is the proportion of individuals in different age groups– affects the future growth of the population.
• Population momentum is the continued growth that occurs– despite reduced fertility and – as a result of girls in the 0–14 age group of a
previously expanding population reaching their childbearing years.
36.9 The human population continues to increase, but the growth rate is slowing
© 2012 Pearson Education, Inc.

Age structures reveal social and economic trends
• Age-structure diagrams reveal– a population’s growth trends and– social conditions.
© 2012 Pearson Education, Inc.

Birth years
80–8475–7970–7465–6960–6455–5950–5445–4940–4435–3930–3425–2920–2415–1910–14
5–90–4
Ag
e
85Male Female
1985
before 19011901–19051906–10
1911–151916–20
1921–251926–301931–351936–40
1941–451946–50
1951–551956–601961–65
1971–751976–80
1981–85
1966–70
12 10 8 6 4 2 0 2 4 6 8 10 12Population in millions
Total population size 238,466,283
Birth years Male Female2010
Birth years Male Female2035
12 10 8 6 4 2 0 2 4 6 8 1012Estimated population in millions
Total population size 310,232,863Projected population in millions
Total population size 389,531,156
12 10 8 6 4 2 0 2 4 6 8 1012
before 19261926–30
1931–351936–40
1941–451946–50
1951–551956–60
1961–651966–701971–751976–801981–85
1986–901991–95
1996–20002001–20052006–2010 2031–35
2026–302021–252016–202011–152006–102001–05
1996–20001991–951986–90
1981–851976–801971–751966–701961–65
1956–601951–55
before 1951
Age structures for the United States in 1985, 2010 (estimated), and 2035 (projected)

An ecological footprint is a measure of resource consumption
• The U.S. Census Bureau projects a global population of – 8 billion people within the next 20 years and– 9.5 billion by mid-21st century.
• Do we have sufficient resources to sustain 8 or 9 billion people?
• To accommodate all the people expected to live on our planet by 2025, the world will have to double food production.

• An ecological footprint is an estimate of the amount of land required to provide the raw materials an individual or a nation consumes, including– food,– fuel,– water, – housing, and– waste disposal.
36.11 CONNECTION: An ecological footprint is a measure of resource consumption
© 2012 Pearson Education, Inc.

• The United States– has a very large ecological footprint, much greater
than its own land, and– is running on a large ecological deficit.
• Some researchers estimate that– if everyone on Earth had the same standard of living
as people living in the United States, – we would need the resources of 4.5 planet Earths.

Families in India (left) and the United States (right) display their possessions

Ecology Unit Objectives
1. Define a population and population ecology.2. Define population density and describe different types
of dispersion patterns.3. Explain how life tables are used to track mortality and
survivorship in populations.4. Compare Type I, Type II, and Type III survivorship
curves.5. Describe and compare the exponential and logistic
population growth models, illustrating both with examples.
© 2012 Pearson Education, Inc.

You should now be able to
6. Explain the concept of carrying capacity.7. Describe the factors that regulate growth in natural
populations.8. Define boom-and-bust cycles, explain why they occur,
and provide examples.9. Explain how life history traits vary with
environmental conditions and with population density.10. Compare r-selection and K-selection and indicate
examples of each.
© 2012 Pearson Education, Inc.

You should now be able to
11. Describe the major challenges inherent in managing populations.
12. Explain how the structure of the world’s human population has changed and continues to change.
13. Explain how the age structure of a population can be used to predict changes in population size and social conditions.
14. Explain the concept of an ecological footprint. Describe the uneven use of natural resources in the world.
© 2012 Pearson Education, Inc.