population and settlement chapter 2 - the department of ... · population and settlement chapter 2...
TRANSCRIPT

• 15 •
Population and settlement Chapter 2
This chapter is divided into two distinct parts. The ‘Population’ section uses the newly available 2011 Census data to provide a count of the population growth in Australia’s major cities. It then looks at the age structure of cities to show the recent changes that indicate what may happen in future. This discussion informs Chapter 3 on Productivity, which uses the ‘Three P’ framework: Population, Productivity and Participation.
The second part of the chapter, ‘Settlement’, concentrates on housing, again drawing heavily on data from the 2011 Census augmented by surveys and private sector data. This section explores the relationship between population growth and housing supply.
Summary indicators Dimension Indicators
International urbanisation World levels of urbanisation and major cities 1980 and projected for 2025
National population growth Components of Australia’s population growth 1982–2011
Major city population change Population increase 2001–11
Population growth in major cities 2001–11
Major city and emerging city growth rates 2001–11
Proportion of population living in capitals and non-capitals 1911–2011
Capital city primacy Growth 1971–2011
Age structure Percentage change by age and major city 1996–2011
Dwelling stock growth Major city average annual percentage increase 2006–11
Dwelling composition Proportion of attached dwelling approvals 1985–2011
Proportion of houses and attached dwellings 1996–2011
Occupancy rates National growth in adult population and dwelling stock 1860–2011
National average occupancy rate 1860–2012
Household composition 1996–2011
Sydney population and dwelling approvals 1985–2011
Sydney’s dwelling requirement and occupancy rate 1997–2010
Additional persons per additional dwelling 2006–11
Major city occupancy rates 2006–11
House prices Sydney and Melbourne house prices 1880–2012
Housing finance Commitments 1985–2012
Proportion of mortgaged dwellings 1996–2011
Continued

• 16 •
Department of Infrastructure and Transport • Major Cities Unit
Dimension Indicators
House sizes and construction Average size of new Australian dwellings 1984–2011
Real house prices and construction costs 1960–2011
Land supply Capital city housing lot production 2001–11
Capital city median lot size 2001–11
Capital city housing lot median dollars per square metre 2001–11
Real house prices by distance from CBD, various years to 2009–10
Government housing Percentage change in social housing stock 2006–11
Government housing as a proportion of total dwelling stock 2006–11
Rent Real gross rental income per dwelling 1880–2011
Capital city vacancy rates 2005–11
Percentage of occupied dwellings rented 1996–2011
Distribution of weekly rent 1996–2011
Key findings • By 2025, it is expected that 750 cities of over half a million people and 360 cities over one
million in size will exist in the greater Asian region.
• Melbourne and Sydney between them have absorbed nearly 40 per cent of the population growth since 2001.
• There was a sharp increase in the proportion of the population living in the capital cities of most states and territories between 2001 and 2011.
• The population of major cities continues to age, with declines across the board in the proportion of the population under 25. There has been a small increase in the working age population and a large increase in those 65 and over.
• The gap between population increase and housing supply is now the largest and most sustained in a century.
• In response, housing occupancy rates, which had been falling steadily for nearly a century, began to plateau in the mid-2000s and have begun to rise slightly in recent years. Most of the increase has occurred in households consisting of families with children.
• Since 1996, house prices in Australia have increased faster and for the longest period since at least 1880.
• In 1996, 60 per cent of house owners owned their house outright, compared to 46 per cent in 2011.
• A decline in the number of housing lots produced per capita is occurring across the capitals but is particularly severe in Sydney. Block size has fallen and the price per square metre has risen sharply.
• New houses in Australia are possibly the largest in the world, eclipsing the United States. However, there has been little or no growth for a decade and unit sizes have fallen.
• There has been little change in relative housing construction costs for 40 years.
• Since 1986, there has been a rise in the premium for living near the CBD of cities. In Sydney and Melbourne, a dwelling 50 kilometres from the city centre has doubled in value in real terms since then, while one close to the CBD has increased more than five-fold.

• 17 •
Chapter 2 Population and Settlement • State of Australian Cities 2012
• While there has been a net growth in government-provided dwelling stock since 2006, it has fallen as a proportion of total stock across all major cities, apart from Cairns and Toowoomba
• Real rental income per dwelling has increased virtually without interruption since the major rental controls were lifted in 1949.
• Rental vacancy rates remain very low across all capitals but are particularly severe in Perth, Darwin and Canberra.
Population
Introduction When discussing the population of Australia, it is important to understand the way it is calculated by the ABS. Every five years since 1911, a count of Australia’s population, called the ‘Census of Population and Housing’, has been conducted. Obtaining the most accurate count possible is important both for the administration of government and to ensure equal parliamentary representation. The ABS therefore conducts a Post Enumeration Survey to improve the accuracy of the count by, for example, improving the estimate of how many Australians were overseas on Census night. It then adjusts the Census count accordingly to develop the Estimated Residential Population (ERP) data set. The difference between the Census count and the ERP can be substantial. In Sydney in 2011, for example, there was a difference of 214,318 persons between the Census snapshot and the Post Enumeration Survey.
In the five years between each Census, the ERP is adjusted by the ABS using a variety of data sources to develop the projected ERP for each year. At the next Census, the ERP for that year is reset using Census data and the Post Enumeration Survey and the estimates for the previous years are adjusted accordingly. Although the ABS uses a variety of data sources and sophisticated analyses to calculate the ERP, it is always an estimate. The difference between the projected national ERP in 2011 and the one based on the Post Enumeration Survey was nearly 300,000 people. The population figures used in this section are the ERP based on the 2011 Post Enumeration Survey.
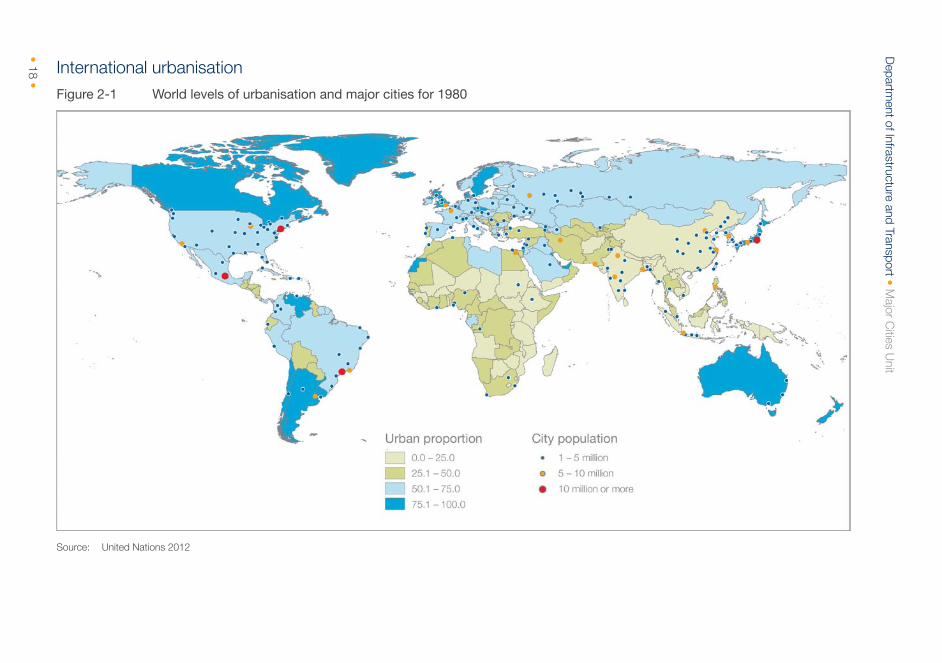
In 1980, much of Asia and Africa had relatively low levels of urbanisation, with the Americas, Europe, Australia and New Zealand being assessed by the United Nations as more highly urbanised. The world at that time had four mega cities of more than 10 million people: New York, Mexico City and São Paulo in the Americas and Tokyo in Asia (Figure 2-1). Since 1980, countries that were once considered to be ‘developing’ have become increasingly urbanised (Figure 2-1). Many cities across greater Asia and Africa in particular have been growing at more than five per cent a year and the UN projects their growth rates will continue at three to five per cent (United Nations 2012). In 2012, there are approximately 280 cities of over one million people in size within our business time zone (70º to 170º). Thirty-eight of these cities are the size of or larger than Sydney and Melbourne. Australia, once a standout as a highly industrialised and urbanised country in the region, is now being joined by many other countries. By 2025, it is expected that 750 cities of over half a million people and 360 cities over one million in size will exist in the greater Asian region (Figure 2-2) (United Nations 2012).
• 18 •
Departm
ent of Infrastructure and Transport • Major C
ities Unit
International urbanisation Figure 2-1 World levels of urbanisation and major cities for 1980
Source: United Nations 2012

• 19 •
Chapter 2 P
opulation and Settlem
ent • State of A
ustralian Cities 2012
Figure 2-2 World levels of urbanisation and major cities projected for 2025
Note: UN predicts Melbourne to be less than five million in 2025. The ABS Series B (medium) projects that Melbourne will have a population over five million in 2026.
Source: United Nations 2012
• 20 •
Department of Infrastructure and Transport • Major Cities Unit
The implications of growth and urbanisation across Asia in the future are significant for Australia as the world population centre of gravity shifts towards our region. This year the Australian Government released the Australia in the Asian Century White Paper (2012). The report states that large cities have 38 per cent of the world’s population and generate 72 per cent of global output. Increasing urbanisation across Asia is predicted to drive strong demand for Australia’s energy and mineral resources (Commonwealth of Australia 2012, p. 66). This also presents considerable opportunities in the services sector.
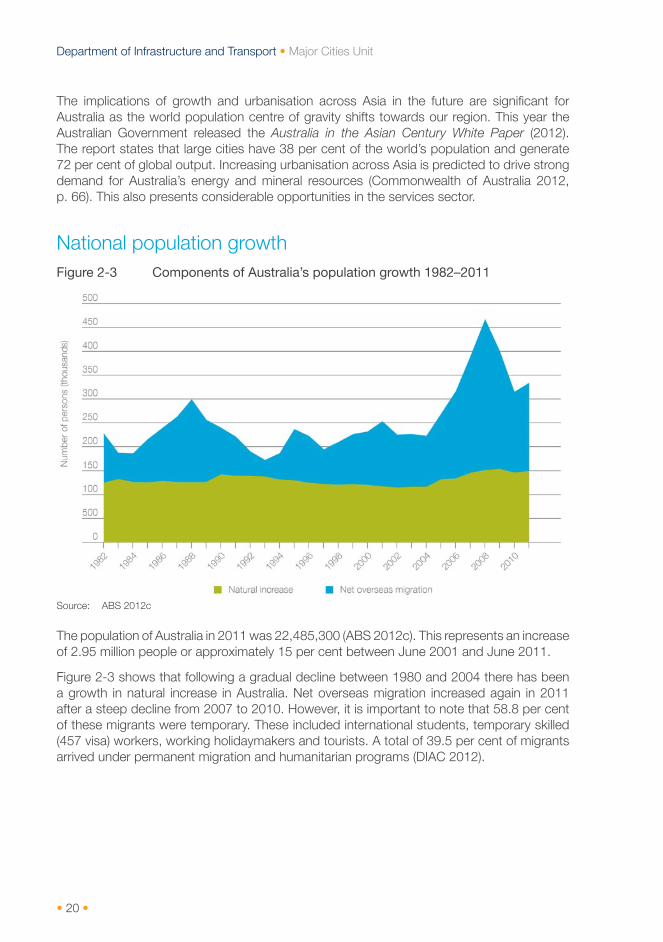
National population growth Figure 2-3 Components of Australia’s population growth 1982–2011
Source: ABS 2012c
The population of Australia in 2011 was 22,485,300 (ABS 2012c). This represents an increase of 2.95 million people or approximately 15 per cent between June 2001 and June 2011.
Figure 2-3 shows that following a gradual decline between 1980 and 2004 there has been a growth in natural increase in Australia. Net overseas migration increased again in 2011 after a steep decline from 2007 to 2010. However, it is important to note that 58.8 per cent of these migrants were temporary. These included international students, temporary skilled (457 visa) workers, working holidaymakers and tourists. A total of 39.5 per cent of migrants arrived under permanent migration and humanitarian programs (DIAC 2012).

• 21 •
Chapter 2 Population and Settlement • State of Australian Cities 2012
Major city population change Figure 2-4 Population increase 2001–11
Source: ABS 2012d
Figure 2-4 shows that Sydney and Melbourne accommodated nearly 40 per cent of Australia’s additional population between 2001 and 2011, while the other 16 major cities combined received nearly the same amount of people.
Aerial view of Darwin.
Image courtesy of Nicholas Parker

• 22 •
Department of Infrastructure and Transport • Major Cities Unit
Figure 2-5 Population growth in major cities 2001–11
Source: ABS 2012d
Over the course of the 20th century, many cities have experienced declines in population numbers at some time – for example, Adelaide and Melbourne in the Great Depression and Darwin after Cyclone Tracy (ABS 2008). Figure 2-5 shows that all Australia’s major cities have grown over the last decade.
• 23 •
Chapter 2 Population and Settlement • State of Australian Cities 2012
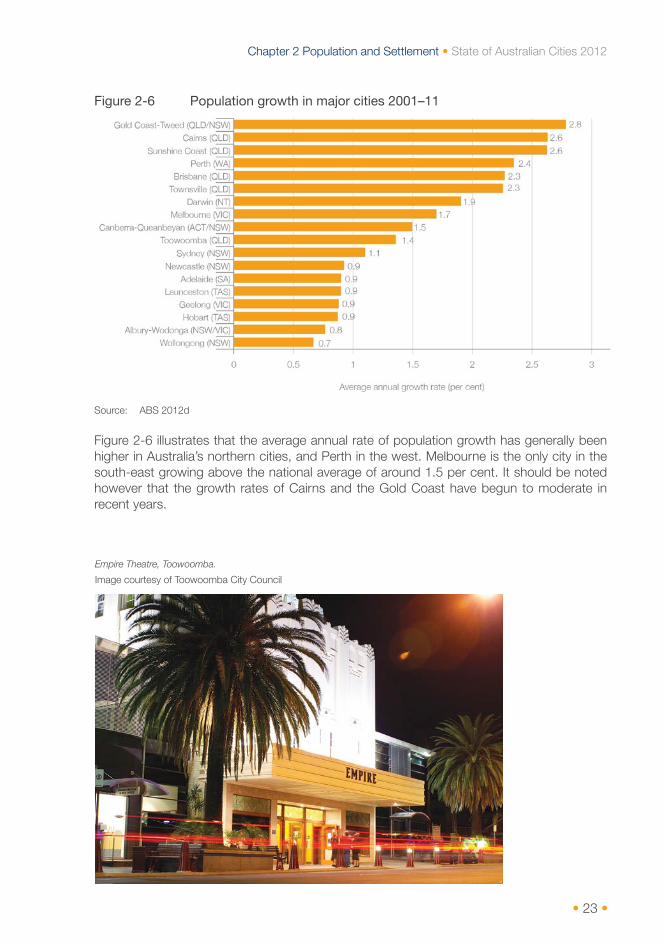
Figure 2-6 Population growth in major cities 2001–11
Source: ABS 2012d
Figure 2-6 illustrates that the average annual rate of population growth has generally been higher in Australia’s northern cities, and Perth in the west. Melbourne is the only city in the south-east growing above the national average of around 1.5 per cent. It should be noted however that the growth rates of Cairns and the Gold Coast have begun to moderate in recent years.
Empire Theatre, Toowoomba.
Image courtesy of Toowoomba City Council
• 24 •
Department of Infrastructure and Transport • Major Cities Unit
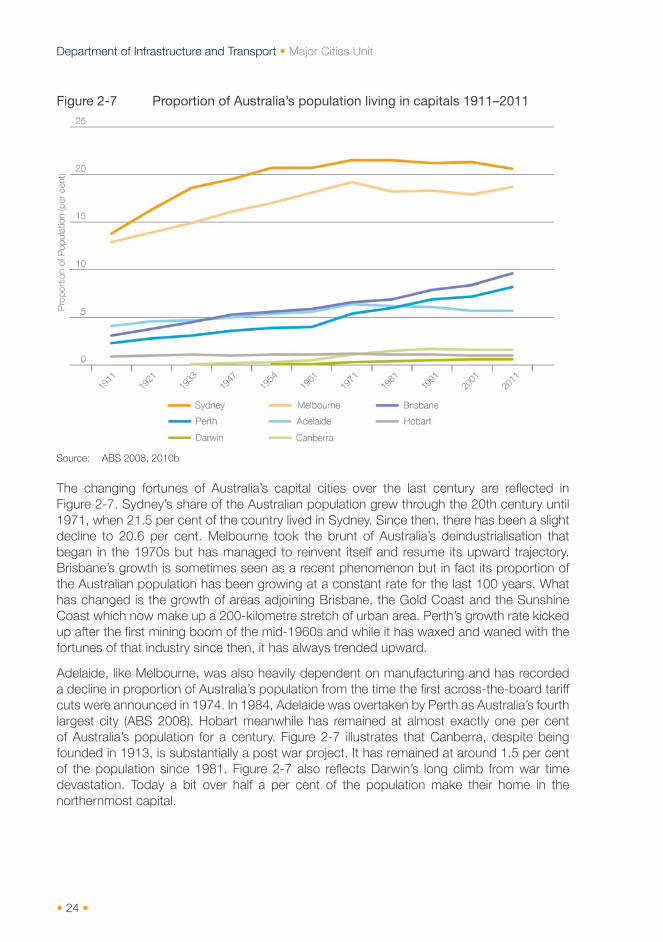
Figure 2-7 Proportion of Australia’s population living in capitals 1911–2011
Source: ABS 2008, 2010b
The changing fortunes of Australia’s capital cities over the last century are reflected in Figure 2-7. Sydney’s share of the Australian population grew through the 20th century until 1971, when 21.5 per cent of the country lived in Sydney. Since then, there has been a slight decline to 20.6 per cent. Melbourne took the brunt of Australia’s deindustrialisation that began in the 1970s but has managed to reinvent itself and resume its upward trajectory. Brisbane’s growth is sometimes seen as a recent phenomenon but in fact its proportion of the Australian population has been growing at a constant rate for the last 100 years. What has changed is the growth of areas adjoining Brisbane, the Gold Coast and the Sunshine Coast which now make up a 200-kilometre stretch of urban area. Perth’s growth rate kicked up after the first mining boom of the mid-1960s and while it has waxed and waned with the fortunes of that industry since then, it has always trended upward.
Adelaide, like Melbourne, was also heavily dependent on manufacturing and has recorded a decline in proportion of Australia’s population from the time the first across-the-board tariff cuts were announced in 1974. In 1984, Adelaide was overtaken by Perth as Australia’s fourth largest city (ABS 2008). Hobart meanwhile has remained at almost exactly one per cent of Australia’s population for a century. Figure 2-7 illustrates that Canberra, despite being founded in 1913, is substantially a post war project. It has remained at around 1.5 per cent of the population since 1981. Figure 2-7 also reflects Darwin’s long climb from war time devastation. Today a bit over half a per cent of the population make their home in the northernmost capital.

• 25 •
Chapter 2 Population and Settlement • State of Australian Cities 2012
Figure 2-8 Proportion of Australia’s population living in non-capital major cities 1911–2011
Note: Population figures for Sunshine Coast 1911, 1961 and Gold Coast 1911, 1961 were compiled by BITRE by summing up the individual towns located within these regions.
Source: ABS2008, 2010b
The non-capital major cities also show a varied experience over the 100-year analysis. Newcastle’s and Wollongong’s economies were heavily reliant on heavy industry throughout much of the 20th century and their progressive deindustrialisation since 1974 is clearly evident in Figure 2-8. Also striking is the rapid growth of first the Gold Coast and then the Sunshine Coast as Australia’s own version of the ‘Sunbelt’ phenomenon that swept much of the developed world in the 1960s and 1970s. Perhaps reflecting this to a degree, Cairns and Townsville have also grown proportionally in the last 40 years. Most other major cities have remained relatively stable over the 100-year period in terms of their proportion of the Australian population.
• 26 •
Department of Infrastructure and Transport • Major Cities Unit
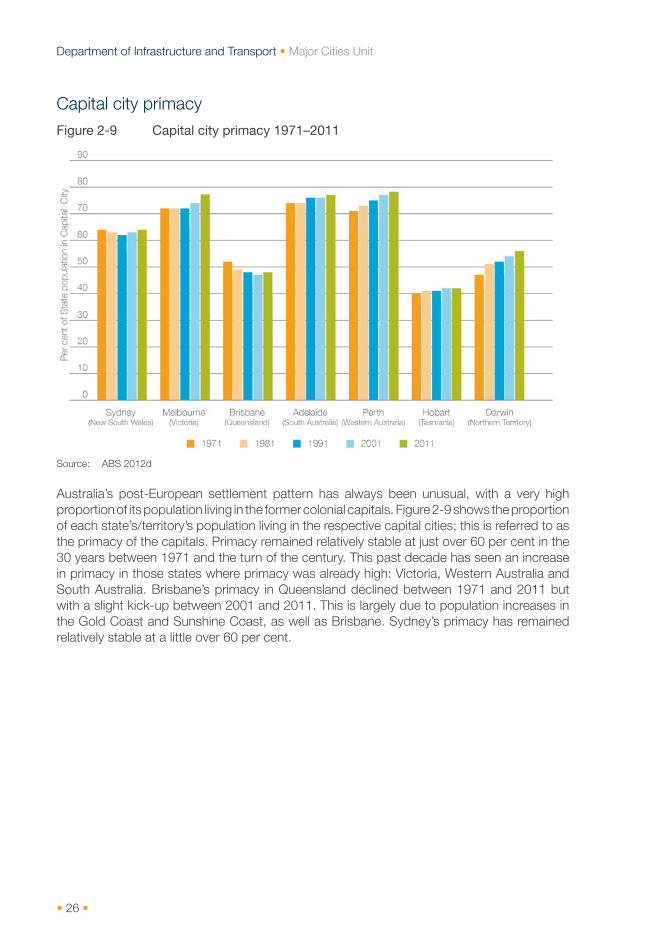
Capital city primacy Figure 2-9 Capital city primacy 1971–2011
Source: ABS 2012d
Australia’s post-European settlement pattern has always been unusual, with a very high proportion of its population living in the former colonial capitals. Figure 2-9 shows the proportion of each state’s/territory’s population living in the respective capital cities; this is referred to as the primacy of the capitals. Primacy remained relatively stable at just over 60 per cent in the 30 years between 1971 and the turn of the century. This past decade has seen an increase in primacy in those states where primacy was already high: Victoria, Western Australia and South Australia. Brisbane’s primacy in Queensland declined between 1971 and 2011 but with a slight kick-up between 2001 and 2011. This is largely due to population increases in the Gold Coast and Sunshine Coast, as well as Brisbane. Sydney’s primacy has remained relatively stable at a little over 60 per cent.

• 27 •
Chapter 2 Population and Settlement • State of Australian Cities 2012
Age structure The following four graphs show the age structure of each major city. By dividing populations into 0–14, 15–24, 25–64 and 65 and over, analysis of a city can show the proportion of the population at retirement age, at working age and those coming through at younger ages.
This section is also essential for a better understanding of workforce participation, to be discussed in the next chapter.
Figure 2-10 Population aged 0–14 by major city, 1996 and 2011
Note: Data unavailable for Toowoomba 1996.
Source: ABS 2000, 2002, 2012b
Figure 2-10 shows a general decline in the proportion of children across Australia’s major cities with the exception of Cairns and the Gold Coast.

• 28 •
Department of Infrastructure and Transport • Major Cities Unit
Figure 2-11 Population aged 15–24 by major city, 1996 and 2011
Note: Data unavailable for Toowoomba 1996.
Source: ABS 2000, 2002, 2012b
All cities, with the exception of the Gold Coast and the Sunshine Coast, have seen a decline in the proportion of young adults. Geelong and Toowoomba have seen the greatest decrease in the percentage of young adults. The trend is of concern because it reflects a relatively small pool of workforce entrants (Figure 2-11) compared to the proportion of people leaving the workforce, as illustrated in Figure 2-13.
Figure 2-12 Population aged 25–64 by major city, 1996 and 2011
Note: Data unavailable for Toowoomba 1996.
Source: ABS 2000, 2002, 2012b

• 29 •
Chapter 2 Population and Settlement • State of Australian Cities 2012
The proportion of the population that is of traditional working age is remarkably similar across cities (Figure 2-12). In contrast to the decline in the proportion of under-25s, the working age population has grown across all cities. This is due partly to the bulge in the number of so-called baby boomers at the top of this age group and partly to the age profile of immigrants. It is important to note that Figure 2-12 represents only the potential workforce, not those actually working. In the next chapter it will be shown that workforce participation rates can vary significantly between cities.
Figure 2-13 Population aged 65 and over by major city, 1996 and 2011
Note: The Gold Coast is the only city where the proportion of the population aged 65 and over has declined. The age structure of this city varies – young families predominate in the north, whereas the oldest population profile in Australia can be seen in the Tweed Shire. A boundary change in the northern part of the city in 2011 is likely to have been responsible for an apparent decrease in the size of the older section of its population. Data unavailable for Toowoomba 1996.
Source: ABS 2000, 2002, 2012b
The growth in the number of people aged 65 and over in cities where the population is already quite old – for example, Newcastle, Wollongong, Launceston and Geelong – is of particular concern because of their very low overall population growth rates (Figure 2-13). This suggests that structural ageing may become progressively more pronounced in these cities over the coming decades.
Conclusion The first Intergenerational Report (Australian Government 2002) brought the issue of an ageing population into the national consciousness. Australia’s ability to make population policy for 30 to 40 years ahead has enabled it to rebalance its population age structure to a degree, mainly through a carefully targeted immigration program. The country is therefore in a relatively good position compared to many comparable countries (Piggott 2012). Nevertheless, an ageing population will be a feature of Australian cities for at least the next four decades, meaning there will need to be a commensurate increase in productivity to prevent living standards from falling.

• 30 •
Department of Infrastructure and Transport • Major Cities Unit
Tourism in major cities
While tourism advertisements often portray Australia’s natural beauty using images of Uluru, the Great Barrier Reef and Kakadu, major cities are where tourists travelling to and within Australia spend most of their time.
The World Tourism Organization defines both international and domestic tourists as people ‘traveling to and staying in places outside their usual environment for not more than one consecutive year for leisure, business and other purposes’ (United Nations World Tourism Organization 1995). Australian tourism statistics follow this convention and include travel to and within Australia for reasons including education, employment, health, business, conferences, conventions, exhibitions and working holidays.
Figure 2-14 International tourists to Australia reasons for travel, year to March 2012
Source: Tourism Research Australia 2012b
Figure 2-15 Australian tourists reason for travel, year to March 2012
Source: Tourism Research Australia 2012c
• 31 •
Chapter 2 Population and Settlement • State of Australian Cities 2012
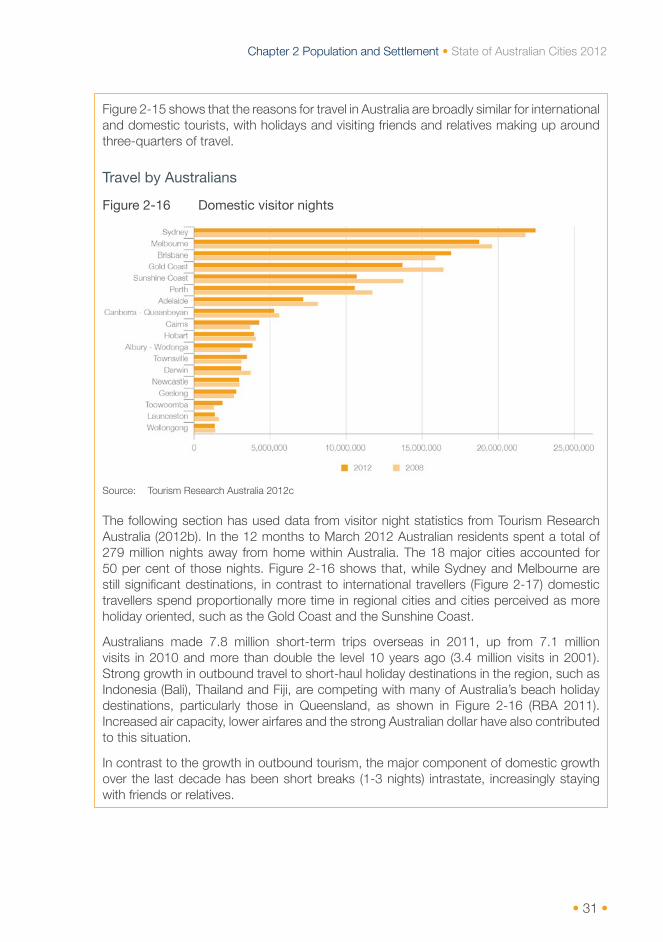
Figure 2-15 shows that the reasons for travel in Australia are broadly similar for international and domestic tourists, with holidays and visiting friends and relatives making up around three-quarters of travel.
Travel by Australians
Figure 2-16 Domestic visitor nights
Source: Tourism Research Australia 2012c
The following section has used data from visitor night statistics from Tourism Research Australia (2012b). In the 12 months to March 2012 Australian residents spent a total of 279 million nights away from home within Australia. The 18 major cities accounted for 50 per cent of those nights. Figure 2-16 shows that, while Sydney and Melbourne are still significant destinations, in contrast to international travellers (Figure 2-17) domestic travellers spend proportionally more time in regional cities and cities perceived as more holiday oriented, such as the Gold Coast and the Sunshine Coast.
Australians made 7.8 million short-term trips overseas in 2011, up from 7.1 million visits in 2010 and more than double the level 10 years ago (3.4 million visits in 2001). Strong growth in outbound travel to short-haul holiday destinations in the region, such as Indonesia (Bali), Thailand and Fiji, are competing with many of Australia’s beach holiday destinations, particularly those in Queensland, as shown in Figure 2-16 (RBA 2011). Increased air capacity, lower airfares and the strong Australian dollar have also contributed to this situation.
In contrast to the growth in outbound tourism, the major component of domestic growth over the last decade has been short breaks (1-3 nights) intrastate, increasingly staying with friends or relatives.

• 32 •
Department of Infrastructure and Transport • Major Cities Unit
International travel to Australia
The number of international travellers to Australia continues to grow, with 5.5 million international tourists coming to Australia in the 12 months to March 2012. This represented a one per cent increase on the corresponding period to March 2011, and a five per cent increase over the corresponding period to March 2008. International tourists to Australia spent 197 million nights here, of which 168.6 million, or 82 per cent, wer e spent in our major cities (Tourism Research Australia 2012b).
Figure 2-17 International visitor nights
Source: Tourism Research Australia 2012b
While there has been a decline in visitor numbers from the UK, Europe, the USA and Japan in the year ending March 2012, the number of Chinese visitors grew by 14 per cent to 530,000 compared to the previous year. This was complemented by strong growth in the number of Indian, Taiwanese and Indonesian visitors. In fact China is now Australia’s largest source market in terms of economic value, worth $3.5 billion.
Sydney, Melbourne, Perth and Brisbane airports are Australia’s major gateways for international travellers, accounting for 94 per cent of international passenger movements and, as Figure 2-17 shows, these cities have benefited from a rising share of overseas visitor nights in contrast to other cities. It is also worth noting that this is reflected in expenditure by international tourists, with Sydney and Melbourne accounting for $9.195 billion of foreign tourist expenditure in 2010-11 – more than the other major cities combined and significantly more than was expended in these two centres by Australian travellers.
This trend also reflects the strong growth in the number of Chinese visitors who demonstrate a strong propensity for travel to capital cities, whether for holidays, business or education and the decline in the number of Japanese tourists. This has had a more pronounced effect on overall tourism demand in some regional destinations, particularly Cairns.

• 33 •
Chapter 2 Population and Settlement • State of Australian Cities 2012
Figure 2-18 Number of international student visa holders in Australia 2010–11
Source: Department of Immigration and Citizenship 2011
Importance of events to tourism in cities
Since the late 1980s all states and territories have created dedicated agencies for securing major events. Major strategies and events play a significant role in attracting tourism in their own right and in generating additional tourist and economic activity in cities, particularly in quieter times of the year for hospitality operators. Precinct planning and transport infrastructure is critical to hosting these events.
Melbourne holds the unofficial status as the events capital of Australia. It hosts a range of business and cultural events, but it is sporting events such as the Spring Racing Carnival, the Australian Tennis Open, the Australian Football League Grand Final, the Boxing Day Cricket Test and the Grand Prix that are big tourist drawcards. The 2011 Spring Racing Carnival, which includes the Melbourne Cup, is estimated to have contributed more than $113.1 million in direct spending from visitors from out of state (IER 2011). Underlining its importance to the economy, it was further estimated that out-of-state visitors spent more than $11.5 million on fashion items and accessories as part of their attendance at the 2011 Spring Racing Carnival (IER 2011).
Major cultural events also play a significant role. It was estimated that the Renaissance exhibition at the National Gallery of Australia and the Handwritten exhibition at the National Library of Australia were largely responsible for the increase in day trips to the ACT to 505,000 people in the 2012 March quarter, up from 390,000 over the same three months the previous year, when there were no significant events (Knaus 2012).
Accommodation supply
The supply of hotel rooms has become a pressing issue in the Australian tourism sector over the last decade. Demand for hotel rooms has strengthened around Australia but the supply of hotel rooms has not grown at the same pace, increasing only 2.8 per cent in the last four years. This will likely see average occupancy rates rise from 65 per cent now to 68 per cent by the end of 2014 - the highest rate since occupancy rate data was first compiled (Deloitte Access Economics 2012).

• 34 •
Department of Infrastructure and Transport • Major Cities Unit
Figure 2-19 Major city occupancy rates and average room rates, December 2011
Source: Tourism and Transport Forum 2012
The undersupply of hotel rooms is most acute in capital city CBDs, where average occupancy rates sit around 80 per cent. Perth and Sydney have average occupancy rates of approximately 85 per cent. By the end of the 2014 they are expected to be 89 per cent and 88 per cent respectively, which equates to average room rates of $249 and $210 respectively. This reflects the reality that those cities’ CBDs are at, or close to, capacity several nights a week (Tourism and Transport Forum 2012).
Surfers Paradise, Gold Coast.
Image courtesy of Hyder Consulting and Kevin Chamberlain Photography

• 35 •
Chapter 2 Population and Settlement • State of Australian Cities 2012
Settlement
Introduction The release of housing data in the first tranche of the Census of Population and Housing 2011 has allowed a detailed examination of housing patterns in Australia’s major cities over the past 15 years. This section will examine dwelling composition, housing finance, land supply, occupancy and social housing provision.
Background
Historical context
Unlike many major cities around the world, Australian cities have typically been characterised by low-density detached housing. For example, despite the population of NSW being only a little over 30,000 in 1830, Sydney’s geographic area was already larger than that of London, then the most populous city in the world (Canon 1985, ABS 2008). By the late 19th Century high personal incomes, relatively evenly distributed throughout the population, allowed Australia to become the world’s first suburban nation (Frost and Dingle 1995, Davidson 1995).
The legacy of two centuries of low-density settlement is both physical and cultural. Culturally, the experience and expectation for generations of Australians has been of detached houses in the suburbs. Physically, the minimum service life of a dwelling is at least 50 years, so turnover of stock is slow. Therefore, the physical structure of our cities will change only incrementally over time. Consequently, Australia’s detached housing heritage will continue to dominate the composition of Australia’s dwelling stock for some time.
Current settlement
Figure 2-20 Total major city private dwelling stock 2011
Source: ABS 2012b

• 36 •
Department of Infrastructure and Transport • Major Cities Unit
In 2011, Australia’s 18 major cities held 75 per cent of the national private dwelling stock, together totalling 6,499,276 private dwellings (Figure 2-20). Sydney and Melbourne alone held 37 per cent of the national dwelling stock.
Figure 2-21 Average annual increases in major city occupied private dwelling stock 2006–11
Source: ABS 2007a, 2012b
Occupied private dwelling stock in major cities increased at an average rate of 2.02 per cent annually between 2006 and 2011 (Figure 2-21). The national unoccupied rate since the 1970s has tended to be around 9 or 10 per cent at any time – see Figure 2-25.
Dwelling composition Dwelling composition refers to the differing proportions of detached houses and various forms of attached dwellings within a given housing stock. There has been much pressure on governments at all levels to assist in alleviating upward pressure on house prices by helping increase dwelling supply. Part of increasing that supply is increasing the efficiency of land use through attached dwellings. Replacing separate houses in redevelopments with higher-density dwellings such as townhouses and units and building higher-density greenfield developments not only contributes to supply but can also improve the viability and utilisation of infrastructure such as public transport. This section examines the rate at which the dwelling composition in Australia’s major cities is shifting towards attached dwellings.

• 37 •
Chapter 2 Population and Settlement • State of Australian Cities 2012
Proportion of attached dwellings
Figure 2-22 Attached dwelling approvals 1985–2011
Source: ABS 2012a
Across Australia’s capital cities, the proportion of new dwelling approvals for attached dwellings has varied over the past three decades (Figure 2-22). Canberra is currently leading the shift towards higher-density housing, with an upward shift of 40 per cent since 1985. Canberra’s dwelling approvals now contain the highest proportion of attached dwellings, approaching 70 per cent. There has also been a proportional majority of attached dwelling approvals in Sydney and Darwin for some years, and Brisbane and Melbourne have recently displayed a rising trend. By contrast, Adelaide, Hobart and Perth have had a low proportion of attached dwellings approved for several decades.

• 38 •
Department of Infrastructure and Transport • Major Cities Unit
Figure 2-23 Proportion of houses and attached dwellings 1996–2011
Note: *Attached dwellings includes semi-detached, terrace/row/townhouses, flats, units and apartments.
Source: ABS 2000, 2002, 2007a, 2012b
• 39 •
Chapter 2 Population and Settlement • State of Australian Cities 2012
Separate houses remain the dominant component of the existing housing stock in Australia’s major cities. Across major cities from 1996 to 2011 there was a 2.6 per cent overall shift towards attached dwellings, from 25.1 to 27.7 per cent (Figure 2-23, ABS 2000, 2002, 2007a, 2012b). Roughly two-thirds of major cities showed some proportional increase in attached dwellings over the period, whereas the Sunshine Coast, Adelaide, and Albury-Wodonga increased their proportion of separate houses. Darwin, Sydney, and the Gold Coast currently contain the highest proportion of attached dwellings.
Overall, the trend towards attached dwellings is unlikely to be strong enough to have significant impact on housing density in the short or medium term. That is, Australia’s major city housing stock still comprises a majority of separate houses and is likely to do so for some time. Considering population growth rates and that many cities are experiencing physical or cost constraints on greenfields lot production, there is unlikely to be an adequate increase in the number of new dwellings to satisfy growing underlying demand without a significant rise in the proportion of attached dwellings in major city housing stock.
Occupancy rates Occupancy rates respond to the relationship between the number of additional dwellings required by population increase and the number of these new dwellings actually built. Small shifts in occupancy rates can significantly alter the number of dwellings required to house a population. As an example, Sydney’s current population of 4.6 million occupies 1.6 million dwellings, resulting in an occupancy rate around 2.8 persons per household. Theoretically, if the occupancy rate rose to 2.9 persons per household then more than 50,000 dwellings would no longer be required. Sydney’s current population growth rate demands roughly 20,000 new dwellings per year, so one impact of a theoretical increase of just 0.1 in Sydney’s occupancy rate would be that no additional dwellings would need to be constructed for two and a half years.
This section will examine the effect of growth in population and dwellings stocks, and changes in household composition.
Sydney.
Image courtesy of Bill Boyd
• 40 •
Department of Infrastructure and Transport • Major Cities Unit
Historical context
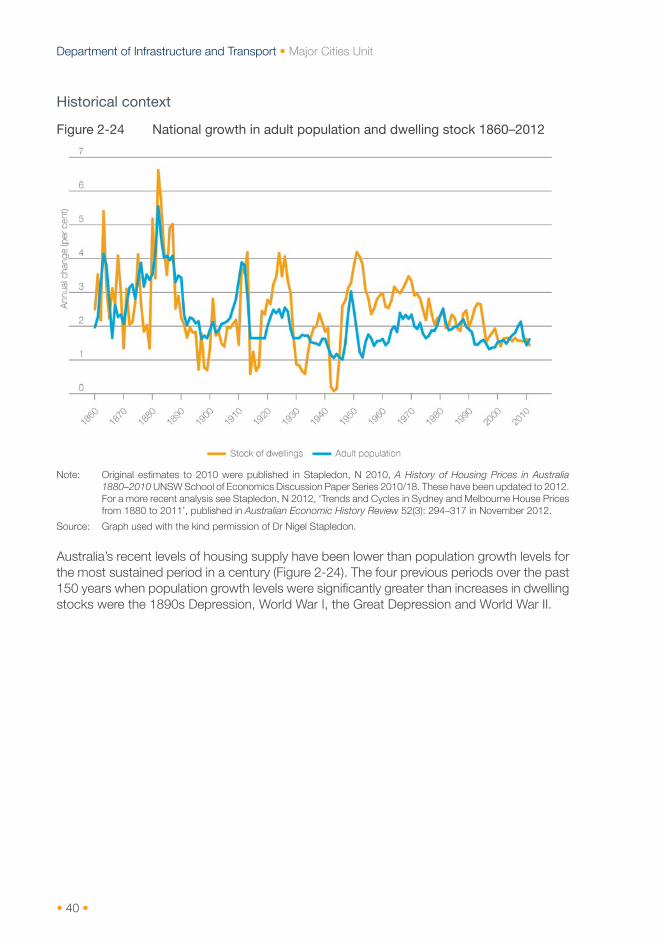
Figure 2-24 National growth in adult population and dwelling stock 1860–2012
Note: Original estimates to 2010 were published in Stapledon, N 2010, A History of Housing Prices in Australia 1880–2010 UNSW School of Economics Discussion Paper Series 2010/18. These have been updated to 2012. For a more recent analysis see Stapledon, N 2012, ‘Trends and Cycles in Sydney and Melbourne House Prices from 1880 to 2011’, published in Australian Economic History Review 52(3): 294–317 in November 2012.
Source: Graph used with the kind permission of Dr Nigel Stapledon.
Australia’s recent levels of housing supply have been lower than population growth levels for the most sustained period in a century (Figure 2-24). The four previous periods over the past 150 years when population growth levels were significantly greater than increases in dwelling stocks were the 1890s Depression, World War I, the Great Depression and World War II.

• 41 •
Chapter 2 Population and Settlement • State of Australian Cities 2012
Figure 2-25 National average occupancy rate 1860–2012
Source: Created from data in Stapledon 2012 and ABS 3105.0.65.001 Australian Historical Population Statistics, 2008
Household occupancy rates rose steeply from 1860 to 1889 as cities struggled to cope with population growth rates up to four times higher than those of today (Frost and Dingle 1995). Occupancy rates fell just as quickly after the 1890 crash before stabilising. There was a further fall during World War I with troops in Europe and the Middle East and a virtual cessation in migration.
From 1920, occupancy rates again started to fall, punctuated only by World War II. They stopped falling in the mid-2000s and have even begun to rise slightly, reflecting the growing gap between population growth and dwelling supply (Figure 2-25).
Somewhat paradoxically, Australia finds itself in a position of also having an increasing number of unoccupied houses. Reasons for this increase are not fully understood, particularly considering the shifting trend in occupancy rates since the mid-2000s.

• 42 •
Department of Infrastructure and Transport • Major Cities Unit
Figure 2-26 Total dwellings unoccupied 2011
Source: ABS 2012e
Australia’s major cities have varied proportions of unoccupied dwellings (Figure 2-26). Capital cities generally appear to have low proportions of unoccupied dwellings while Queensland’s regional coastal major cities generally have the highest proportions. As popular holiday destinations, the proportions of unoccupied dwellings in these cities is probably due to the number of holiday houses.
Household composition
Figure 2-27 Australian household composition 1996–2011
Source: ABS 2000, 2012b
From 1996 to 2011, households with one or two people (couples without children, lone person households) grew as a proportion of households by three per cent. In the same period, the proportion of couple families with children declined by around four per cent, while the proportion of one-parent families grew slightly (Figure 2-27).
If household occupancy rates are increasing at the same time as the proportion of smaller households is rising, the increase in occupancy rates must be occurring in family households.

• 43 •
Chapter 2 Population and Settlement • State of Australian Cities 2012
Case study: Sydney’s housing supply and occupancy rate
For brevity, this case study will focus on Sydney.
Figure 2-28 Sydney annual population increase and dwelling approvals 1985–2011
Source: ABS 2012a
Between the late 1980s and mid-2000s in Sydney, more dwellings were approved than were required to meet the 2011 major city average occupancy rate of 2.7 persons per household (Figure 2-28). This underpinned falling occupancy rates. However, since 2004, housing construction in Sydney has not kept pace with population growth. Consequently, a gap has opened between the rate of dwelling increase and population increase.

• 44 •
Department of Infrastructure and Transport • Major Cities Unit
Figure 2-29 Sydney’s dwelling requirement and occupancy rate 1997–2010
Source: ABS 2011, 2012a
The orange line in Figure 2-29 shows the gap between population increase and dwelling supply. Above the zero line there are more dwellings being built than the population increase based on an occupancy rate of 2.7 persons per household. Below zero less dwellings are being constructed than is required for the population increase. In June 2007 the orange line went below zero. In response, the occupancy rate (the blue line) kicked up. Based on trajectories, this trend appears likely to continue. Counteracting such a trend would require a significant number of extra dwellings to be constructed or a substantial moderation of population growth.
This analysis is backed by similar findings from the National Housing Supply Council’s 2012 report.
• 45 •
Chapter 2 Population and Settlement • State of Australian Cities 2012
Current growth in housing stocks and population
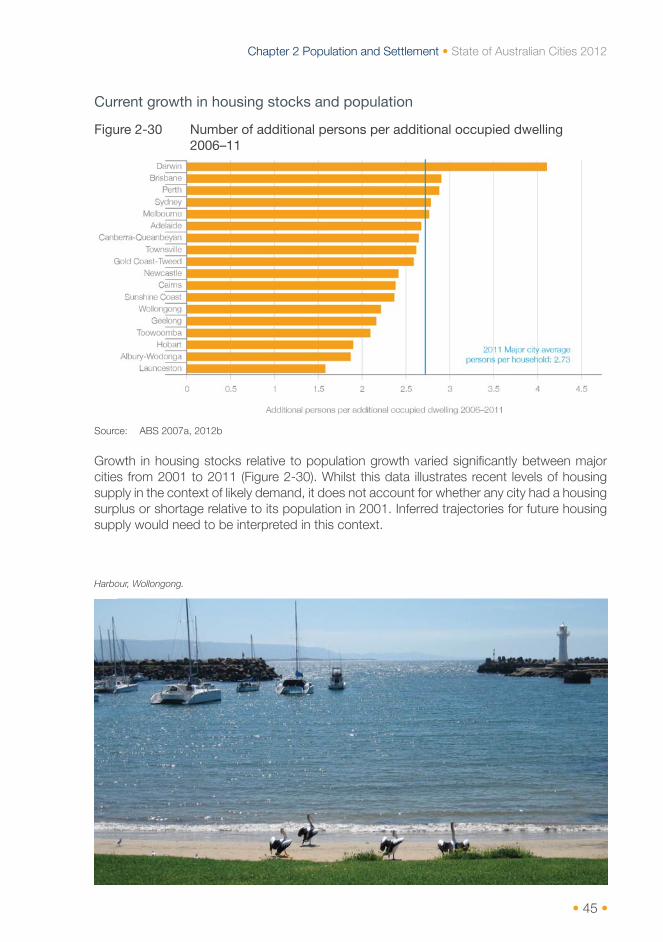
Figure 2-30 Number of additional persons per additional occupied dwelling 2006–11
Source: ABS 2007a, 2012b
Growth in housing stocks relative to population growth varied significantly between major cities from 2001 to 2011 (Figure 2-30). Whilst this data illustrates recent levels of housing supply in the context of likely demand, it does not account for whether any city had a housing surplus or shortage relative to its population in 2001. Inferred trajectories for future housing supply would need to be interpreted in this context.
Harbour, Wollongong.

• 46 •
Department of Infrastructure and Transport • Major Cities Unit
Current occupancy rates
Figure 2-31 Occupancy rates in major cities 2006–11
Source: ABS 2007a, 2012b
Individual occupancy rates also varied significantly within and between major cities from 1996 to 2011 (Figure 2-31). The relatively high occupancy rates in Sydney and Darwin since 2001 and the notable rise in Darwin reflect higher population growth relative to dwelling construction rates.
Occupancy rates also appear to align with age demographics, meaning that cities with higher occupancy rates tend to be those with younger populations. Comparing Figure 2-31 with Figure 2-13, the eight major cities with the highest occupancy rates are also those with the lowest proportion of the population over 65 years of age. Similarly, the cities with lower occupancy rates are largely those with greater proportions of their populations over 65 years of age.
House prices The total value of Australian housing was estimated at $4.85 trillion in July 2012, nearly four times the value of listed domestic equities ($1.23 trillion) (RP Data 2012). Consequently, movement in house prices can have a substantial effect on the national economy.
• 47 •
Chapter 2 Population and Settlement • State of Australian Cities 2012
Historical context
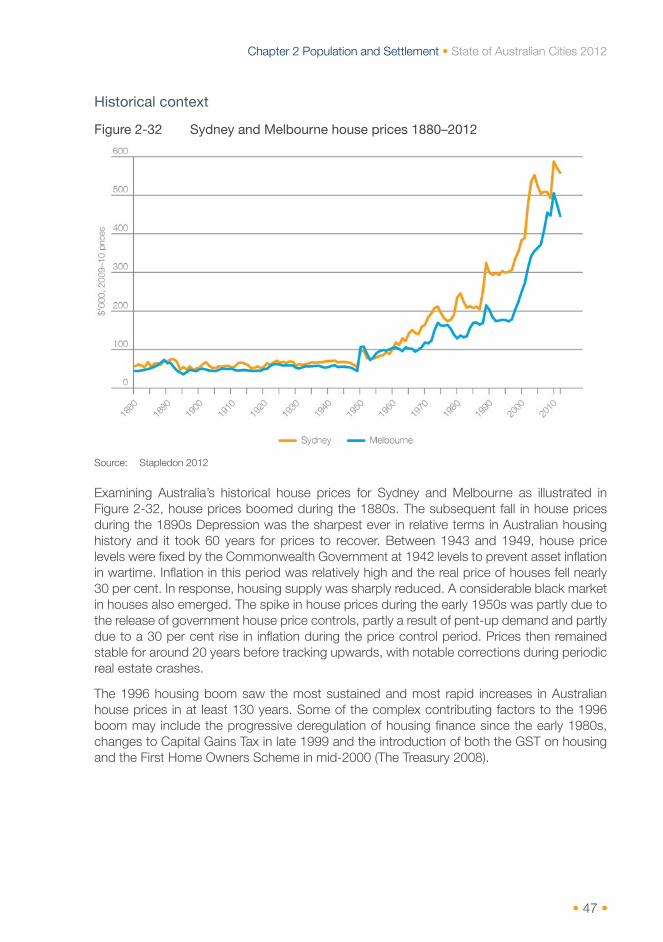
Figure 2-32 Sydney and Melbourne house prices 1880–2012
Source: Stapledon 2012
Examining Australia’s historical house prices for Sydney and Melbourne as illustrated in Figure 2-32, house prices boomed during the 1880s. The subsequent fall in house prices during the 1890s Depression was the sharpest ever in relative terms in Australian housing history and it took 60 years for prices to recover. Between 1943 and 1949, house price levels were fixed by the Commonwealth Government at 1942 levels to prevent asset inflation in wartime. Inflation in this period was relatively high and the real price of houses fell nearly 30 per cent. In response, housing supply was sharply reduced. A considerable black market in houses also emerged. The spike in house prices during the early 1950s was partly due to the release of government house price controls, partly a result of pent-up demand and partly due to a 30 per cent rise in inflation during the price control period. Prices then remained stable for around 20 years before tracking upwards, with notable corrections during periodic real estate crashes.
The 1996 housing boom saw the most sustained and most rapid increases in Australian house prices in at least 130 years. Some of the complex contributing factors to the 1996 boom may include the progressive deregulation of housing finance since the early 1980s, changes to Capital Gains Tax in late 1999 and the introduction of both the GST on housing and the First Home Owners Scheme in mid-2000 (The Treasury 2008).
• 48 •
Department of Infrastructure and Transport • Major Cities Unit
Taxation
As discussed in Australia’s Future Tax System Review (the Henry Review), a wide variety of taxes affect housing in Australia. The objectives of these taxes reflect various revenue-raising and social policy objectives. Due to the complex way in which taxation policy and the housing market interact, it is difficult to determine the ultimate flow of money through the system. Nevertheless, Australia’s Future Tax System Review states that the most significant changes to tax and transfer settings for housing include the changes to Capital Gains Tax in 1999, increased infrastructure charges, the introduction of the GST on housing and the First Home Owners Scheme, as well as changes in rates, land taxes and stamp duty conveyancing (The Treasury 2010). However, the relationship between housing and taxation is more complex than can adequately be explored within the reporting format of the State of Australian Cities reports.
Housing finance House prices are affected by both the proportion of mortgaged dwellings and the amount of investment in housing. This section will explore recent trends in owner occupied and investment mortgages, and the changing proportion of households with mortgages.
Owner occupied and investment mortgages
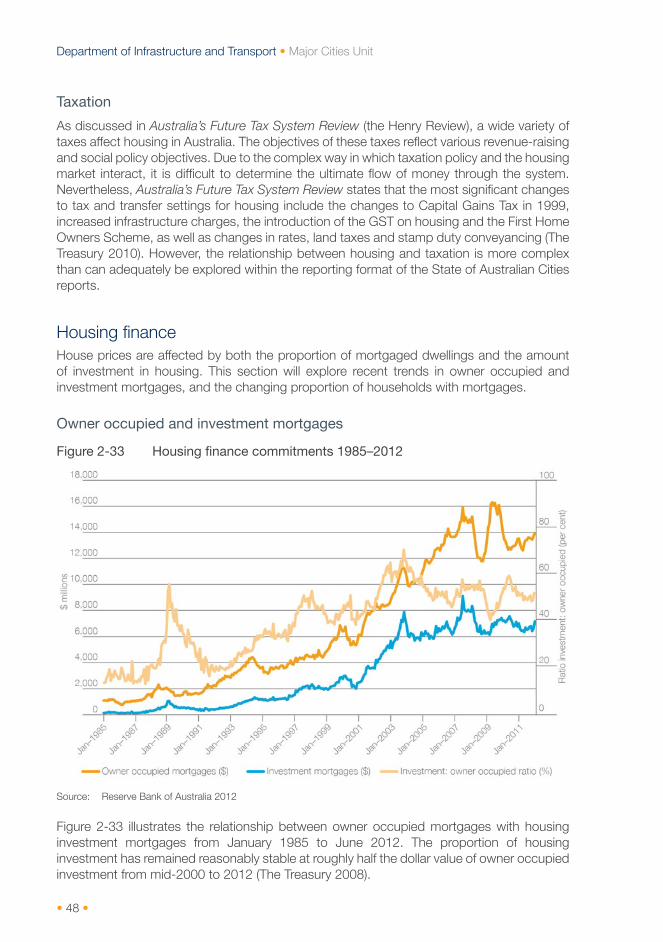
Figure 2-33 Housing finance commitments 1985–2012
Source: Reserve Bank of Australia 2012
Figure 2-33 illustrates the relationship between owner occupied mortgages with housing investment mortgages from January 1985 to June 2012. The proportion of housing investment has remained reasonably stable at roughly half the dollar value of owner occupied investment from mid-2000 to 2012 (The Treasury 2008).

• 49 •
Chapter 2 Population and Settlement • State of Australian Cities 2012
Proportion of owner occupied mortgaged dwellings
Figure 2-34 Proportion of owner occupied mortgaged dwellings 1996–2011
Source: ABS 2000, 2002, 2007a, 2012b
• 50 •
Department of Infrastructure and Transport • Major Cities Unit
The proportion of dwellings owned outright decreased significantly in every Australian major city, both individually and combined from 1996 to 2011 (Figure 2-34). The proportion of total owner occupied major city dwellings owned outright decreased by 14 per cent over this time, from 60 per cent in 1996 to 46 per cent in 2011. The greatest downward shift in ownership occurred on the Gold Coast (19 per cent). In 1996, Canberra and Darwin were the only major cities with a majority owner occupied of mortgaged private dwellings, and in 2001 Darwin was the only major city in this position. By contrast, in 2011 the majority of major cities (13 of 18) contained the bulk of owner occupied private dwellings under finance.
Between 2001 and 2006, there was a notable jump in the proportion of owner occupied dwellings under finance from 42 per cent in 2001 to 52 per cent in 2006 (Figure 2-34). Significantly, the majority of major city owner occupied private dwellings changed from outright ownership to financed at the time of this jump. Causes of this jump may possibly relate to high purchasing activity after changes to Capital Gains Tax arrangements in 1999 (The Treasury 2008).
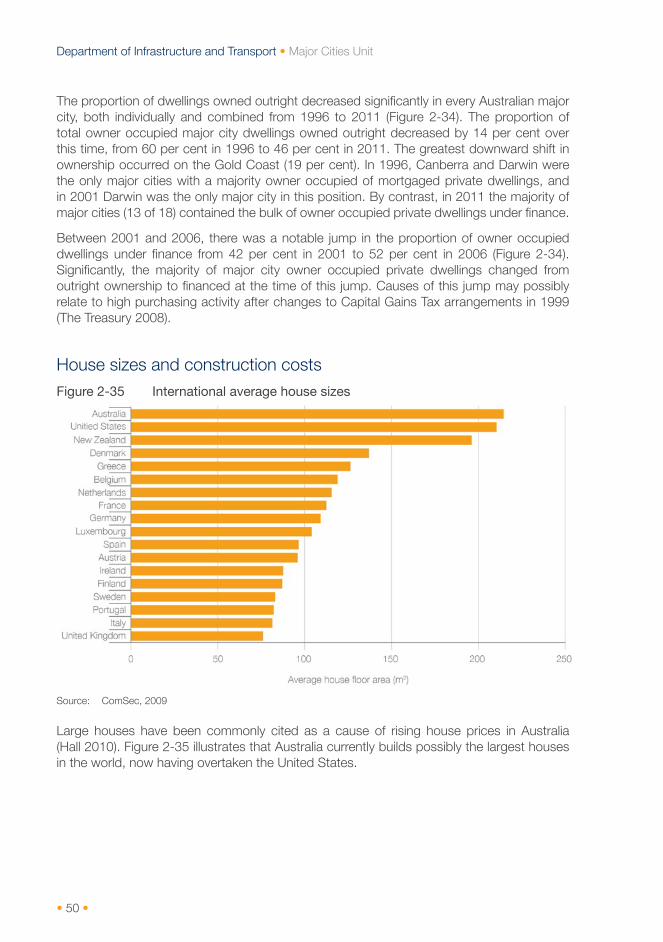
House sizes and construction costs Figure 2-35 International average house sizes
Source: ComSec, 2009
Large houses have been commonly cited as a cause of rising house prices in Australia (Hall 2010). Figure 2-35 illustrates that Australia currently builds possibly the largest houses in the world, now having overtaken the United States.

• 51 •
Chapter 2 Population and Settlement • State of Australian Cities 2012
Figure 2-36 Average size of new Australian dwellings 1984–2011
Source: ABS 2003, 2005, 2010, Switzer Report 2012
Australian dwelling sizes increased significantly between the mid-1980s and 2000s. However, the size of houses and attached dwellings appear to have plateaued (Figure 2-36).
Overlooking Townsville, Queensland.
Image courtesy of Nigel Foster
• 52 •
Department of Infrastructure and Transport • Major Cities Unit
Construction
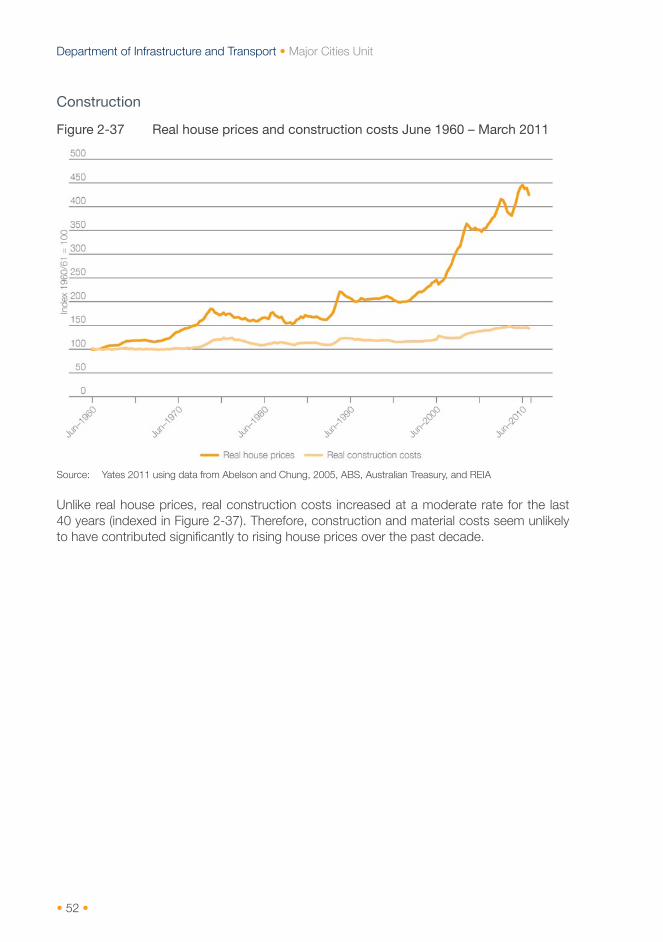
Figure 2-37 Real house prices and construction costs June 1960 – March 2011
Source: Yates 2011 using data from Abelson and Chung, 2005, ABS, Australian Treasury, and REIA
Unlike real house prices, real construction costs increased at a moderate rate for the last 40 years (indexed in Figure 2-37). Therefore, construction and material costs seem unlikely to have contributed significantly to rising house prices over the past decade.

• 53 •
Chapter 2 Population and Settlement • State of Australian Cities 2012
Land and housing supply Land directly influences house prices through factors such as supply, location, block size and price. Land supply is traditionally a driver of house prices in greenfield developments. This section will examine recent lot production, trends in median lot sizes, the consequent median price paid per square metre for land and the influence of proximity to a CBD on land value and supply. This section complements the discussion on housing affordability in Chapter 5.
Lot production
Figure 2-38 Capital city housing lot production 2001–11
Source: UDIA 2012
Lot production varied between and within individual cities over the last decade (Figure 2-38). Where data is available, Sydney’s lot production appears to be notably lower than the other capitals and has been declining.

• 54 •
Department of Infrastructure and Transport • Major Cities Unit
Lot size and land costs
Figure 2-39 Capital city housing median lot size 2001–11
Source: UDIA 2012
Median lot size has been steadily decreasing over the past decade (Figure 2-39). Simultaneously, Australia has been building large houses (see Figure 2-35), so the current trend in Australian major cities appears to be to build large homes on increasingly smaller blocks. However, Darwin is an exception to this trend because its planning regulations require detached houses in certain residential zones to be built on a block size of at least 800 square metres, considered the minimum for tropical living (Northern Territory Department of Lands, Planning and the Environment 2012).
• 55 •
Chapter 2 Population and Settlement • State of Australian Cities 2012
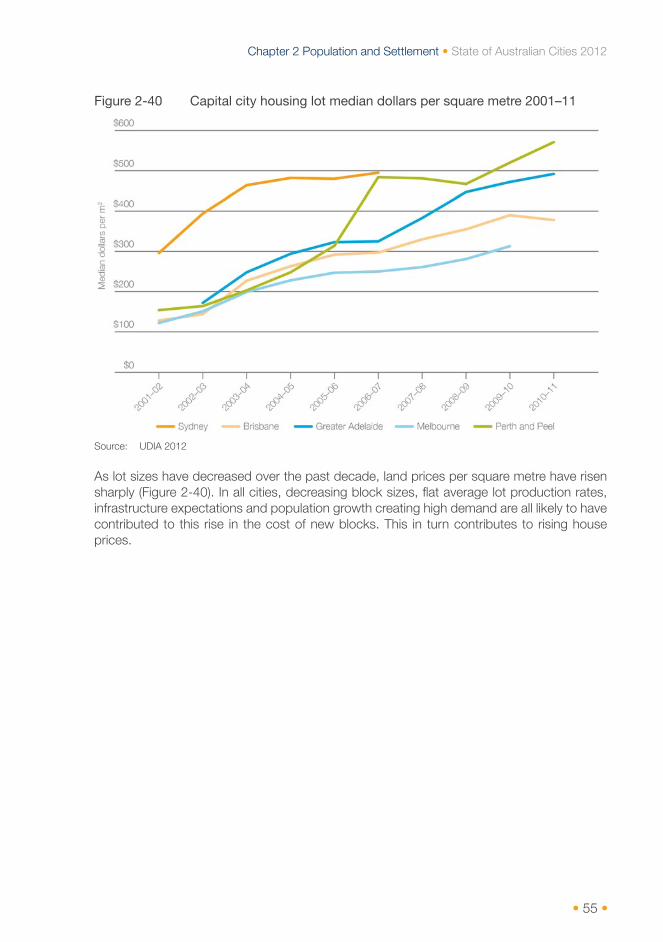
Figure 2-40 Capital city housing lot median dollars per square metre 2001–11
Source: UDIA 2012
As lot sizes have decreased over the past decade, land prices per square metre have risen sharply (Figure 2-40). In all cities, decreasing block sizes, flat average lot production rates, infrastructure expectations and population growth creating high demand are all likely to have contributed to this rise in the cost of new blocks. This in turn contributes to rising house prices.

• 56 •
Department of Infrastructure and Transport • Major Cities Unit
Proximity to a CBD
Figure 2-41 Real house prices by distance from CBD in 2009–10 dollars
Source: Richards, A 2011, reworking data from Kulish, Richards and Gillitzer 2011, published in Yates 2011
House prices in the last two decades have been escalating with increased proximity to a CBD (Figure 2-41). Reasons for this may partly relate to the changing industrial structure of cities, which will be explored in Chapter 3 on Productivity.
• 57 •
Chapter 2 Population and Settlement • State of Australian Cities 2012
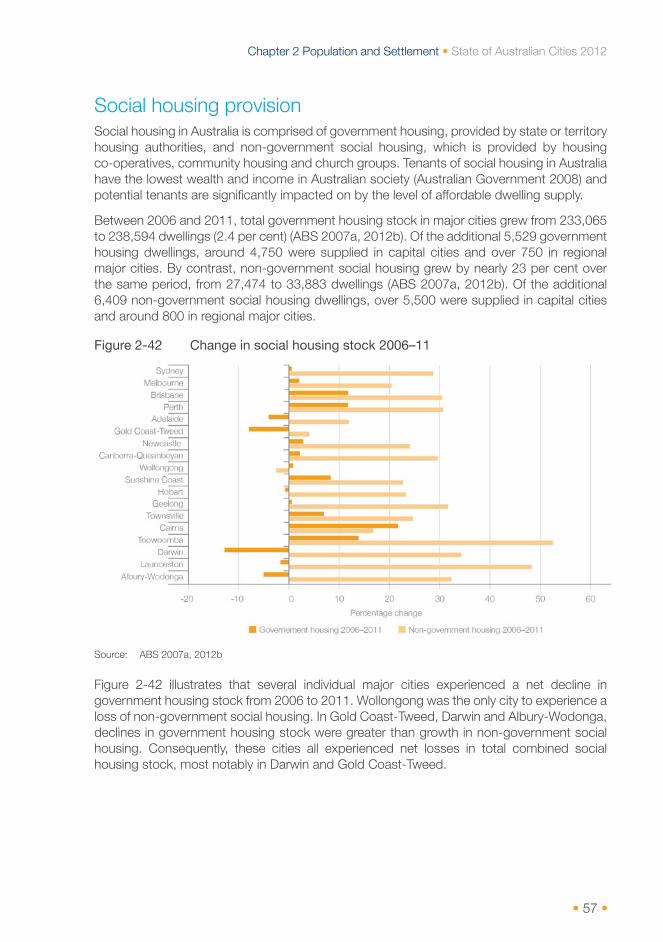
Social housing provision Social housing in Australia is comprised of government housing, provided by state or territory housing authorities, and non-government social housing, which is provided by housing co-operatives, community housing and church groups. Tenants of social housing in Australia have the lowest wealth and income in Australian society (Australian Government 2008) and potential tenants are significantly impacted on by the level of affordable dwelling supply.
Between 2006 and 2011, total government housing stock in major cities grew from 233,065 to 238,594 dwellings (2.4 per cent) (ABS 2007a, 2012b). Of the additional 5,529 government housing dwellings, around 4,750 were supplied in capital cities and over 750 in regional major cities. By contrast, non-government social housing grew by nearly 23 per cent over the same period, from 27,474 to 33,883 dwellings (ABS 2007a, 2012b). Of the additional 6,409 non-government social housing dwellings, over 5,500 were supplied in capital cities and around 800 in regional major cities.
Figure 2-42 Change in social housing stock 2006–11
Source: ABS 2007a, 2012b
Figure 2-42 illustrates that several individual major cities experienced a net decline in government housing stock from 2006 to 2011. Wollongong was the only city to experience a loss of non-government social housing. In Gold Coast-Tweed, Darwin and Albury-Wodonga, declines in government housing stock were greater than growth in non-government social housing. Consequently, these cities all experienced net losses in total combined social housing stock, most notably in Darwin and Gold Coast-Tweed.
• 58 •
Department of Infrastructure and Transport • Major Cities Unit
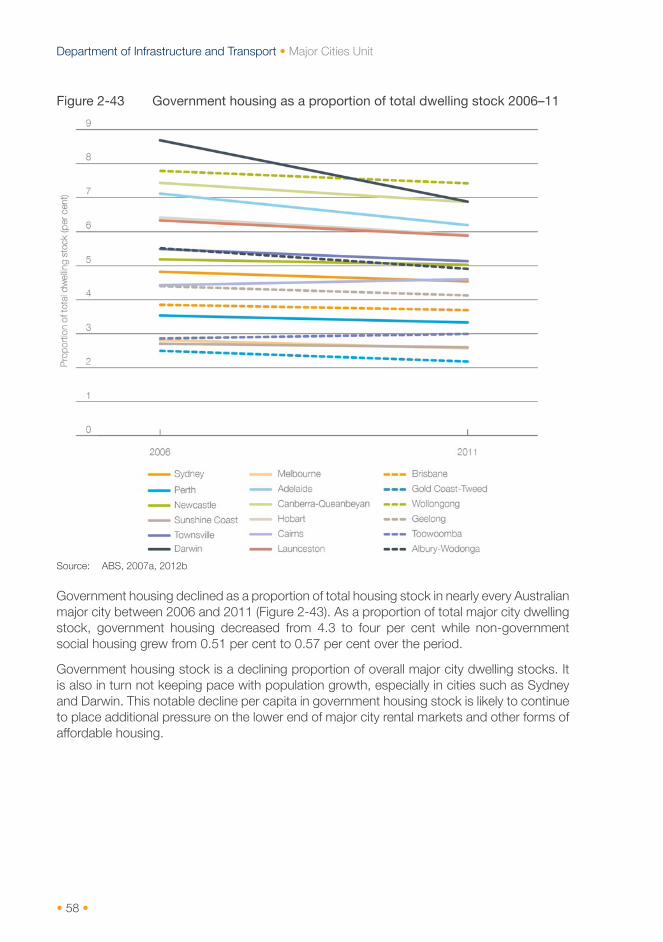
Figure 2-43 Government housing as a proportion of total dwelling stock 2006–11
Source: ABS, 2007a, 2012b
Government housing declined as a proportion of total housing stock in nearly every Australian major city between 2006 and 2011 (Figure 2-43). As a proportion of total major city dwelling stock, government housing decreased from 4.3 to four per cent while non-government social housing grew from 0.51 per cent to 0.57 per cent over the period.
Government housing stock is a declining proportion of overall major city dwelling stocks. It is also in turn not keeping pace with population growth, especially in cities such as Sydney and Darwin. This notable decline per capita in government housing stock is likely to continue to place additional pressure on the lower end of major city rental markets and other forms of affordable housing.

• 59 •
Chapter 2 Population and Settlement • State of Australian Cities 2012
Rent
Historical trend
Figure 2-44 Real gross rental income per dwelling 1880–2012
Source: Stapledon 2012
Although rental income (Figure 2-44) broadly follows housing prices shown earlier (see Figure 2-32), there are some notable differences. In particular, rental income appears to be more sensitive to population pressures than house prices. In both the 1890 and 1930 Depressions and the World Wars many cities experienced either stagnating or in some cases falling populations and rental prices fell. In 1942, the Commonwealth and the state governments instituted price controls on rents, which in some cases were not fully lifted until the 1970s. Gross rental incomes have increased markedly since the 1960s through numerous housing cycles. Since the 1996 housing boom, rental income per dwelling appears to have been increasing even more sharply than before the 1990s recession.

• 60 •
Department of Infrastructure and Transport • Major Cities Unit
Rental supply and demand
Figure 2-45 Capital city vacancy rates 2005–12
Source: SQM research
Capital city rental vacancy has been low overall since 2005 (Figure 2-45). With the exception of Melbourne, vacancy has generally been less than three per cent, often by a significant margin in cities such as Canberra, Perth and Darwin.
These low vacancy rates suggest that the underlying demand for rental properties is significantly greater than supply.

• 61 •
Chapter 2 Population and Settlement • State of Australian Cities 2012
Figure 2-46 Proportion of occupied dwellings rented 1996–2011
Source: ABS 2000, 2002, 2007b, 2007c, 2012e, 2012f
Figure 2-46 illustrates the proportion of occupied dwellings which are rented. There are small difference between Place of Enumeration (PEP) data and Time Series Profile (TSP) data and both are shown here for completeness. The discussion below relates to the PEP data.
For the past decade, the proportion of rented dwellings has been increasing. Although rental properties decreased proportionally during the start of the 1996 housing boom, this reduction has reversed since 2001. Significantly, rented dwellings here include government and non-government social housing, which declined proportionally from 2006 to 2011 (see Figure 2-43). Therefore rented dwellings, excluding social housing, must have experienced an even sharper rate of proportional increase in rents.

• 62 •
Department of Infrastructure and Transport • Major Cities Unit
Distribution of weekly rent
Figure 2-47 National distribution of weekly rent 1996–2011
Source: ABS 2000, 2002, 2007b, 2012e
Overall, demand for rental properties appears to remain high and there are some key trends. Rental income per property has recently risen acutely and rental vacancy has generally been low since 2005. The number of rented dwellings has increased proportionally since 2001. The distribution of rent since 1996 has shifted towards more expensive properties. Over the same period land and dwelling supplies have been declining per capita, house purchase prices have increased markedly and social housing has decreased as a proportion of total dwelling stock, all of which may be contributing to demand for rental properties.

• 63 •
Chapter 2 Population and Settlement • State of Australian Cities 2012
Conclusion The current gap between housing supply and the population increase we are experiencing is the largest and most sustained in a century and this is the only significant period of undersupply relative to population growth that has occurred outside the Depressions or World Wars since at least 1860.
Since 1996, we have seen the most acute and sustained increases in house prices in at least 130 years, although there has been some moderation since the Global Financial Crisis. Outright home ownership has decreased from 60 to 46 per cent, between 1996 and 2011.
Rising house prices appear to be closely related to rising land prices, driven by declining lot production per capita, falling lot sizes and sharply rising costs per square metre. Also associated with price rises is an increasing premium for living near city centres. Dwelling construction costs is not the largest contributor to price increases.
In response to the gap between population growth and housing supply since the mid-2000s, occupancy rates have stopped falling and have begun to rise again, mainly in households comprising families with children. With government housing having declined proportionally, demand for rental properties remains high. Rental income has continued to increase, weekly rents have redistributed towards higher prices and rental vacancy rates have remained low across all capitals.
Housing development, City of Whittlesea, Melbourne.
• 64 •
Department of Infrastructure and Transport • Major Cities Unit
Chapter 2 References Acott, K 2012, ‘Chronic shortage of hotel rooms in Perth’, The West Australian, 22 May. http://au.news.yahoo.com/thewest/a/-/newshome/13753762/chronic-shortage-of-hotelrooms-in-perth/ [Accessed 27.07.2012]
Australian Bureau of Statistics (ABS) 2000, 1996 Census of Housing and Population: Basic Community Profile, cat. no. 2901.0, Canberra.
ABS 2002, 2001 Census of Population and Housing: Basic Community Profile, cat. no. 2001.0, Canberra.
ABS 2003, Building Approvals, Australia, cat. no. 8731.0, Dec 2003, Canberra.
ABS 2005, Year Book Australia 2005, cat. no. 1301.0, Canberra.
ABS 2007a, 2006 Census of Population and Housing: Basic Community Profile, cat. no. 2001.0, Canberra.
ABS 2007b, 2011 Census of Population and Housing: Place of Enumeration Profile, cat. no. 2004.0, Canberra.
ABS 2007c, 2006 Census of Population and Housing: Time Series Profile, cat. no. 2003.0, Canberra.
ABS 2008, Australian Historical Population Statistics 2006, cat. no. 3105.0.65.001, Canberra.
ABS 2010a, Building Approvals, Australia, Feb 2010, cat. no. 8731.0, Canberra.
ABS 2010b, Regional Population Growth, Australia 2008–09, cat. no. 3218.0, Canberra.
ABS 2011, Housing Occupancy and Costs, 2009–10, cat. no. 4130.0, Canberra.
ABS 2012a, Building Approvals, Australia, June 2012, cat. no. 8731.0, Canberra.
ABS, 2012b, 2011 Census of Population and Housing: Basic Community Profile, cat. no. 2001.0, Canberra.
ABS 2012c, Australian Demographic Statistics, Dec 2011, cat. no. 3101.0, Canberra.
ABS 2012d, Regional Population Growth, Australia 2011, cat. no. 3218.0, Canberra.
ABS 2012e, 2011 Census of Population and Housing: Place of Enumeration Profile, cat. no. 2004.0, Canberra.
ABS 2012f, 2011 Census of Population and Housing: Time Series Profile, cat. no. 2003.0, Canberra.
Australian Government, 2002, Australia to 2050: Future challenges (the 2002–03 Intergenerational Report), The Treasury, Canberra. http://archive.treasury.gov.au/igr/ [Accessed 30.10.2012]
Cannon, M 1975, Life in the Cities: Australia in the Victorian Age, Thomas Nelson, Melbourne.
Commonwealth of Australia 2012, Australia in the Asian Century White Paper, Canberra. http://asiancentury.dpmc.gov.au/white-paper [Accessed 05.11.2012]
ComSec 2009, Economic Insights. www.images.comsec.com.au/.../ craigjames3f6189175551497fada1a4769f74d09c.pdf
Davidson, G 1995, ‘Australia: The first suburban nation?’ Journal of Urban History 22(1): 40–74.
Deloitte Access Economics 2012, Tourism and Hotel Market Outlook, Q2 2012, Deloitte Access Economics. http://www.deloitte.com/view/en_AU/au/industries/realestate/493e8fed4 ce57310VgnVCM1000001956f00aRCRD.htm [Accessed 27.02.2012]
• 65 •
Chapter 2 Population and Settlement • State of Australian Cities 2012
Department of Immigration and Citizenship 2012, The Outlook for Net Overseas Migration, March 2012. Canberra. http://www.immi.gov.au/media/publications/statistics/immigrationupdate/nom-mar12.pdf [Accessed 28.02.2012]
Frost, L and Dingle, T 1995, Sustaining suburbia: An historical perspective on Australia’s growth in Troy P (ed), Australia’s cities: Issues, strategies and policy for urban Australia in the 1990s, Cambridge University Press, Cambridge.
Hall, T 2010, The Life and Death of the Australian Backyard [Kindle D00901 E-reader edition], CSIRO Publishing, Collingwood. Locations 123–155, 1721–1729, 3312–3333.
Hooper, K and van Zyl, M 2011, Australia’s Tourism Industry, Bulletin December Quarter 2011. Reserve Bank of Australia. http://www.rba.gov.au/publications/bulletin/2011/dec/index.html [Accessed 03.03.2012]
IER 2011, 2011 Spring Racing Carnival Economic Impact Study, IER Pty Ltd. http://www. racingvictoria.net.au [Accessed 26.07.2012]
Knaus, C 2012, ‘Canberra tourism charm still works’, The Canberra Times, 25 June. http:// www.canberratimes.com.au/act-news/canberra-tourism-charm-still-works-20120624-20wuk. html [Accessed 01.08.2012]
National Housing Supply Council (NHSC) 2012, State of Supply Report: Housing supply and affordability, NHSC, Canberra.
Northern Territory Department of Lands, Planning and the Environment 2012, Building advisory services. http://lands.nt.gov.au/building/legislation2 [Accessed 30.10.2012]
Reserve Bank of Australia (RBA) 2012, Chart D6 Housing – All Lenders – Lending Commitments – All Lenders, Reserve Bank of Australia. http://www.rba.gov.au/statistics/bysubject.html [Accessed 01.10.2012]
Richards, A 2009, ‘Housing Market Developments’, address to CEDA Housing Forum: A National Round-up, Sydney, 29 September 2009, published in Reserve Bank Bulletin – October 2009, Reserve Bank of Australia.
RP Data 2012, Capital markets report, Winter 2012. www.rpdata.com/research/capital_ markets_report.html [Accessed 30.10.2012]
Switzer Report 2012 Business news. http://www.switzer.com.au/business-news/newsstories/australian-homes-are-biggest-in-the-world2/ [Accessed 30.10.2012]
Stapledon, N 2010, A History of Housing Prices in Australia 1880–2010, School of Economics Discussion Paper: 2010/18 ISSN 1873-1035, ISBN 978-0-7334-2956-9, University of NSW, Australian School of Business, School of Economics, Sydney.
Stapledon, N 2012, ‘Trends and Cycles in Sydney and Melbourne House Prices from 1880 to 2011’ published in Australian Economic History Review 52(3): 294–317.
Tourism and Transport Forum 2012, Tourism Industry Update July 2012, Tourism and Transport Forum, Sydney.
Tourism Research Australia 2010, 2020 Tourism Industry Potential … a scenario for growth, Tourism Research Australia, Canberra.
Tourism Research Australia 2011a, International Visitors in Australia – December 2011 Quarterly Results of the International Visitor Survey, Tourism Research Australia, Canberra.
Tourism Research Australia 2011b, National Long-Term Tourism Strategy – Tourism 2020, Tourism Research Australia, Canberra.
Tourism Research Australia 2011c, National Visitor Survey – December 2011 Quarterly Results of the National Visitor Survey, Tourism Research Australia, Canberra.

• 66 •
Department of Infrastructure and Transport • Major Cities Unit
Tourism Research Australia 2011d, 2020 Tourism Industry Potential … The Business Events Sector, Tourism Research Australia, Canberra.
Tourism Research Australia 2012a, China Market Profile May 2012, Tourism Research Australia, Canberra.
Tourism Research Australia 2012b, International Visitors in Australia – March 2012 Quarterly Results of the International Visitor Survey, Tourism Research Australia, Canberra.
Tourism Research Australia 2012c, National Visitor Survey – March 2012 Quarterly Results of the National Visitor Survey, Tourism Research Australia, Canberra.
The Treasury 2008, ‘Section 10: Tax and transfer impacts on housing’, Australia’s Future Tax System – Consultation Paper, The Treasury, Canberra. http://www.taxreview.treasury.gov.au/ content/Content.aspx?doc=html/pubs_reports.htm [Accessed 04.10.2012]
Urban Development Institute of Australia (UDIA) 2012, The 2012 UDIA State of the Land Report, Urban Development Institute of Australia, Canberra. http://www.udia.com.au/reportsand-submissions/reports-submissions [Accessed 28.09.2012]
United Nations 2012, World Urbanization Prospects: The 2012 Revision. United Nations, New York.
United Nations World Tourism Organization 1995, UNWTO Technical Manual: Collection of Tourism expenditure statistics, United Nations World Tourism Organization.
Yates, J 2011, ‘Housing in Australia in the 2000s: On the Agenda Too Late?’ conference paper from RBA 2011, The Australian Economy in the 2000s, Reserve Bank of Australia.