population and poverty: a review of the links, evidence and
TRANSCRIPT

Philippine Journal of DevelopmentNumber 56, Second Semester 2003, Volume XXX, No.2
Popul tion and Poverty: A Reviewof the Links, Evidence and Implicationsfor th Philippines*ANICETO C. ORBETA JR.**
Introduc on
The relati nship between demographic changes and poverty is an oldissue that has gained currency because of the recent focus of govern-ments, m ltilateral agencies, and other development organizations onpoverty al eviation. For the Philippines, all of the post-Martial Law gov-ernments have made poverty alleviation their centerpiece program.Analysts h ve been trying to understand why, in spite of this consistentfocus, gai s in poverty alleviation in the country have been modest.The most accepted explanation, being the most obvious perhaps, isthe uneve economic growth performance. However, it is wellknown,although eavily debated upon, that demographic factors play an im-portant r e not only in poverty alleviation but even in economic growthas well. P oviding a systematic clarification of this role is the objectiveof this pa er. Such clarification may well inform discussion on the roledemogra hic changes play on poverty alleviation efforts in the coun-
try.The ~ aper is organized as follows. The next two sections provide
a status r port on the demographic as well as the poverty front. Toprovide a ackground on the interaction between population and de-
.Prepared for he 2002 Population National Congress, INNOTECH Building, Diliman, a.c., 29 Novem-ber 2002. The very able assistance of Fatima del Prado and Shine Cagas is gratefully acknowledged.This paper ha benefited from the comments of the Steering Committee of the 2009 National PopulationCongress, E. obel de Ayala, M. de Nicolas, and R. Tungpalan. All errors and opinions, however, are thesole responsi lity of the author and not of the institution he is affiliated with.!he author i a Senior Research Fellow at the Philippine Institute for Development Studies. He holds aPh.D. in Econ mics from the University of the Philipines School of Economics. His areas of expertiseinclude demo raphic economics, social sector, applied economics modeling, and information technolo-gies.

196 ~HILIPPINEJOURNAL OF DEVELOPMENT
velop ent, the experience of the Philippines and Thailand in the past40 ye rs is briefly compared in the following section. This is then fol-lowed by a description of the known links between demographicchan es and poverty. Then a section where empirical evidence of thelinks re reviewed follows. The final section draws some implications
for p licy.
Tre in population and povertyPopul tion change and its components
Popul tion change can be divided into changes in size, structure, es-pecia y age structure, and distribution across space. This is easily de-rivabl from the mathematical identity that changes in population sizecan c me from either births, deaths, or net migration. An empiricalregul rity, known as the demographic transition has been long observedby de ographers. This.is characterized as consequent on, and later onalso c using, falling child mortality is followed by falling fertility. Ac-cordi gly, at the first stage, population growth rises because of a de-cline n mortality, which is usually distributed almost evenly across agegrou s, with fertility remaining high. At this stage, the youth depen-den ratio will be high. In the next stage, fertility starts to fall withmor lity starting to settle at a low level so population growth will startto de line. In this stage, the youth dependency ratio will start to godown Finally, both fertility and mortality will be low and remain lowand p pulation growth also low. This will be accompanied by high old-age d pendency ratio. The period where the youth dependency startsto de line, which also means an increasing proportion of economi-cally ctive population, provides a window of opportunity for the so-calle "demographic bonus" that can spur economic growth. This isnow ne of the familiar explanations to the East Asia high economicgrow h phenomenon in the past two decades (e.g., Bloom and
Willi mson 1998).
Demo aPhic trends and imPlicationslPopul tion size and growth
The hilippine population has almost quadrupled in 52 years (from19.2 illion in 1948 to 76.5 million in 2000). The growth rate was about3 per en! in the 1960s slowing down to 2.3 percent in the 1990s (Table1). T is growth rate is still very high compared to the country's ASEAN
1 Largely taken from Orbeta (2002)

c0:0::~"'5C
-OC
-
OQ
)C
II~Q
)...C
o)CQ
)
"50CII
.c~"0C~"0C~Q)-~....c"i0...C
!
~~CC~Q)
C!
~...Q)
>~Q)
N"in"0Q)
UQ)
"0Co
"0C~"OLn
Q)N
-0~N
EJ>
:0::(0C
lIo.W
.-
T-
.Po
.cm..-
.I()N0N
c0-~I()~
~§~,S
-I()<
D0)~
~~I
L!)O
J C
\J0C
\J
~J,
(/)0>cO
>Q
~-L!)E
o>0>~::80>~
.
L()
~C)I
0N0NL()0)0)
60)0)~~0)~6to0)
~(;~
'"
-c0 (])--
OJ
s::
coco0
=
c. -
~
.a '"
(])O
J:JOJc.
C c.
c --
0 (])
--~:I:[J:C
/)r-
/"-LC>
c)(')aj...:
C\I
NO
ll)cciLO
CW
>~
r Q
aic\iLriII)
r-..~C
X>
MN
N
!'-.oa>...:...:c\i
f".C')LC
)cicici
Il)Il)Cl)
c\i<o"':
~
00..-00c\i.,.:..:
ua:D..
C\J
oi~ C')
a)C\i
~ coR'OJ-
.- ~N ~~ C')
d C\J
g~ ~~C\J
"0 E
c: C
tIC
tI c:
=-C
tI O
J
F5
(\1.-
~~ t--ro
CX
>N
lOt--
"""~
8~
Nil)
MN
oq,O,..:(\i
coo0"':
It>r--
~~ roC!>
cxic-i~
C')
o~ ~
(/) Q
) c
<13
"(U
<13~
.c:..!2 "ii)§
-CI
<13
0- -J
:J c
0- ~
0 <
13 U
<
13 °C
C/) ID
.E
D.(/)
LOC
\I~O
ajLri~...:
LOO
>LO
.-v
CO
T-C
OO
Mr..:M
cO~
~~
T-
0000010o,..:,..:(,.j~
IOIO
C\J
C\JM
C\J
~
LOM
MLO
NN
NN
C')O
)vN(\i,..:(\i,..:
Mm
m..r
:";0:";0
~m
mo
""..:cxi~C
OM
C
O-.r
C\lt'-M
L{)...:,.f...:,.faJC
\IC\I
':t~
OR
BE
TA
1::0.S
?;.~~~<
::.<
::.
~Q)
~~-(.)
Q)
~ea.:c:
.S?;
~::1g-o:.~~~~
-;m"'C
~u~"t)c:'"(.)
.~c:0a1:J
'0-c:Q
)
~'".!c:-.0
~
.u;-s0 .-~
aQ.c:
§..g(I)..!2(I)
::1II!
!;l.
E&
::I ..'6
Q)
Q) ~
~
5.(I)
197

1981
neig1ors. Thailand and Indonesia, for instance, reduced their growthrates 0 1.4 and 1.6, respectively, in the 1990s. Consequently, in com-paris n to Thailand that almost had the same population size in 1965,the c untry had about 14 million more people around year 2000.
Fertili yData how what appears to be a fairly rapid decline in fertility in the1970s This was stalled in the 1980s and 1990s and lately even showedsigns f a slight increase. Total fertility rate (TFR) declined from about6 at t e beginning of the 1960s to 3.6 by the middle of 1990s. Thistrend in fertility reduction is slow by East and even Southeast Asianstand rds (Table 2). Starting with about the same TFRs at the start of1960s Thailand and Indonesia had reduced their TFR to 2.1 and 2.6,respe tively, by the middle of 1990s. This means a longer catch-up timeto fer ility levels already achieved by the ASEAN neighbors.
MartaMortaRate,of ad,declir
highpictecWithin thea con:
fant nriod.IMRi
lityty, measured either as Crude Death Rate or Infant Mortality
snowed rapid decline during the early post-war period because'ances in public health and rapid economic development. Thise has slowed down in the recent past as low levels of mortality orevels of life expectancy have been achieved. This is clearly de-by the developments in infant mortality rate (IMR) (Table 2).
:ne uneven economic performance, the slow decline of the IMRPhilippines is to be expected (De Guzman 1998). Thailand withIlstent high economic growth rate, was able to sustain lower in-lortality rates than the Philippines through out the post-war pe-~outh Korea, starting with a low, but not too far below, level of[l 1960-65, achieved an even faster decline.)ased on the above trends in fertility and mortality, the Philip-
pine )opulation growth rate is understandably higher than many ofour nl:ighbors. It is also clear that since our fertility remains high, theonly t.1ing that prevented the full impact of that on population growthis tha our uneven economic performance has prevented us fromachie'ring even lower mortality rates. What is disturbing, and may beunknc)wn to many, is that the continued high fertility rates will alsomean long years of high youth dependency burden, which will rob usof th~window of opportunity for the demographic bonus that allowedother East Asian countries to increase their savings rates, physical andhum capital investments that spur their economic growth in the last

C/)
'-0"CO
u::c;t=>-
~:§()E"Ct=ca>-
~~0)U
-
N0)
.cca~
In.~"E"0Co)
~
0:.
§~It)~
It)
CJ)~CJ)It)~
'"
CJ)!.;..-
CJ)~
gCJ)
8§C)
<;>
""'0>0>""'0>g0>~
g0>""'t';"R0>~C
D~
co co
e? .5
C>
oQ).c
C:~
~U
~ -8.
-~
0
CO
'-",c>
._Q)
LU
c: C
o 0:'
Co
~£~
C75;§
-C')C
')C
')coO>
U;U
;.q'
C)(x)N
(X)N
CO
c\i.,.fc\i
OM
O>
OO
C\lC
O..:.-j..:
Na)Lt)
C\!~
r-:
~o
'"":""';'C?
~lt)
""":~~
-~~
~R
g
/'-.000>~
C')~
OM
U>
~C
\I
Il)~C
O
Va)1t)
-.tr-..,
C\J
~ 0~ 0'X!
§ <0
C\J
It)
!;j:
~ £;)
~Q.
~Iri
~.,.f
L!)L!)N
.~ ~
'" Q
) c
'""'(",
"'~.c:'"
_c-C
>
",.!!1 ~O
J c
.-~0
'" ", '" .0:
C/)m
Ea.cn
0 ~
C
X)
01
~C
X)c\/L()
"':";cO";
~ ~
~ ~
Icoooco'-t"
0 a)
M
01
M-.tN
-.t""",cO
M
~ ~
~ ~
Ioq-M
""",
g~~
~C
':iC':i.nN
CO
l-lX)m
",moo
MN
IriN
Q)r-~
U)
~';!:?~
<O
~~
~~
~~
~~
~m
~r-
mr-oC
\l
0>C
?1l)C?
1'-.1'-.0>('1
1'--"'1'--0"""roN
OR
BE
TA
co:0:~~~g~Q
)
~~-~~eQ.§~:,g-
o:.:g~~I!?-~--=""iij
.gC/)
"0CO
tU
.~gCO
8lij"0'c;:Q
)
.@~Q)
Qco-o:~~isco
.2;
~2-&~0C
/) 199
2001
two d~cades. Herrin and Pernia (2000) describes what we continue tobear ~s "demographic onus" rather than a demographic bonus.
Defini ion and measures of povertyTher are many issues in poverty measurement. This paper will focusonly n the main issues being discussed for the Philippines.2 The offi-cial p verty statistics uses current income as the basis for computingpover y incidence. Balisacan (2001) argues that current consumptionis bet er than current income as the basis for measuring poverty fromboth onceptual and practical grounds. He further argues that incomecan u der- or overestimate living standards through borrowing andsavin. Furthermore, he says that welfare level is determined by "life-cycle" or "permanent" incomes and current consumption is a bettermeas re of this income. Finally, income is much more difficult to ob-tain a d more prone to underreporting. Self-rated poverty, which isdepe dent neither on incomes nor on consumption but on qualita-tive s If-assessment, has also been proposed by Dr. Mahar Mangahas ofthe S cial Weather Stations.
here are also multidimensional measures of well-being. One thathas g ined local official acceptance is the so-called minimum basicneeds indicators. This consists of several indicators3 grouped into three,name y: survival, security and enabling. Reyes (2002) briefly describesits pr venance in her paper. Another multidimensional measure ofwell-b ing that has gained international acceptance is the Human De-velop ent Index (HDI) developed by United Nations DevelopmentProg mme. This is based on four indicators: 1) life expectancy at birth;2) fu ctionalliteracy and the 3) combined elementary and high schoolenrol ment ratio; and 4) real per capita income.
Trend in poverty alleviationThe rogress in poverty alleviation in the country is modest (Reyes2002). In fact the number of the poor has not declined but even in-creas d from 4.6 million in 1985 to 5.14 million in 2000. In addition,the r duction in poverty incidence is only happening in urban areas.Whil the poverty incidence in urban areas declined by 14 percentagepoin between 1985 and 2000. the corresponding number for rural
2 For a!ore complete discussion of poverty measurement issues, especially in the Philippine context,
consult ipton and Ravallion (1995) and Reyes (2002).3 As of I st count, it included 33 indicators (Reyes 2002).

ORBETA 201
areas is nly 4 percentage points (Table 3). There also remains a widedisparity of poverty incidence across geographic areas. For instance,in 2000, it stood at almost 66 percent in the Autonomous Region ofMuslim indanao (ARMM) and 55 percent in the Bicol region asagainst nly 9 percent in the National Capital Region. Variation at theprovinci 1 level is even more pronounced.
Inc me inequality has not improved either. The share of the poor-est quin .le has even declined from 4.8 percent in 1985 to 4.7 percentin 2000 Reyes 2002). The share of the richest quintile, on .the otherhand, in reased from 51.2 percent to 54.8 percent over the same pe-riod. In ddition, the Gini concentration ratio also went up from 0.47in 1985 00.51 in 2000 (Figure 1).
Th Asian crisis experience has also shown that the Philippinepopulati n is vulnerable to shocks as gains in poverty alleviation dur-ing the arlier periods were easily reversed during the crises.
Table 3.
Figure 1. GINI ratios, 1975-2000

PHILIPPINE jOURNAL OF DEVELOPMEN°202
The poverty decomposition analysis of Reyes (2002) reveals thatfor the period 1985-2QOO, the contribution of the growth componentwas larger than the distribution componenL The growth componentcontributed a 16.5 percentage-point reduction in poverty incidencebut the worsening of the distribution increased it by 4.7 percentagepoints, resulting in a net decline of 9.4 percentage points with 2.4 per-centage points classified as residual.
Table 4 shows that our poverty reduction record, compared tothose of our neighboring countries and using the US$l a day povertythreshold, is slower. In addition, most of these countries were able toreduce the number of people living in poverty. In terms of the HD!,our neighbors have also over taken us (Table 5).
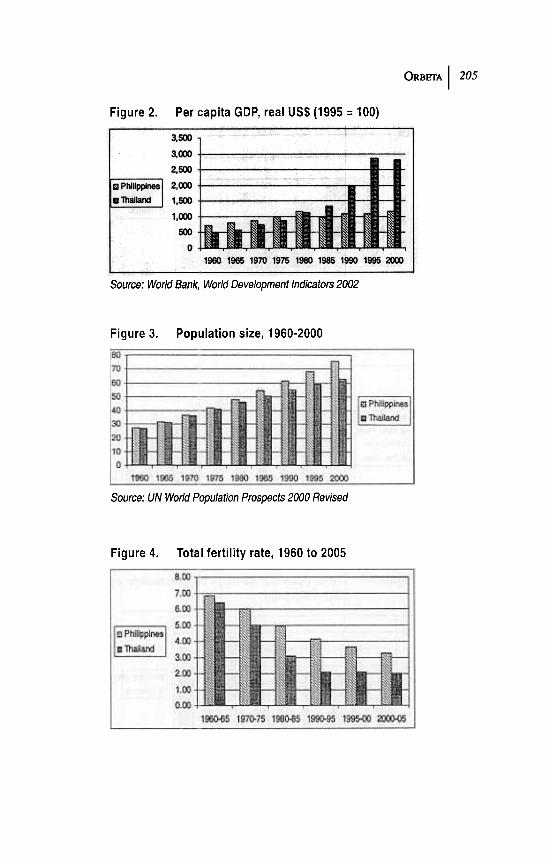
A digression: population and development in the Philippinesand ThailandTo illustrate the role of demographic changes in development, thispaper compares briefly the socioeconomic development of the Philip-pines and Thailand in the last 40 years. Table 1 shows that both hadabout 31 million people in 1965. In terms of per capita income in realUS$, however, the Philippines had $725 while Thailand had only $465(Table 6). Forty years later, the latest estimate of Philippine popula-tion is 76.5 million, nearly 14 million than Thailand's 62.8 million. Interms of per capita income, Table 6 shows that Philippines had 1,167real US$ while Thailand had 2,805 US$ in 2000 or almost 2.5 times.
Table 4. Poverty in selected Asian countries, summary statistics: 1975-95
Peo~e in PO"'rty Head-count Index P~rty Gap
EConOO1Y (million) (percent) (percent)75 85 95 75 85 95 75 85 95
568.gB
8722.1
398.3
528
1.7
269.3
21.90.9
59.Sa
64.3174
379
32.2108
222
11.44.3
7.0
1.7<1.0
na
2375.4
8.525
China
Indonesia
Malaysia
Notes: All numbers in this table are based on the international proverty line of US$1 per person per
day at 1985 prices.na Not available.Data relate to 1978 and apply to rural China only:bin 1984 figures.Source: World Bank (1997)

ORBETA 203
0.7330.76
0.7490.6640.649
0.75410.782
0.76210.684
0.688,
0.6840.6590.645
0.53
0.6880.6930.6760.5820.583
0.7160.7220.7130.6230.605
PhilippinesMalaysiaThailandIndonesiaVietnam
0.6520.6160.6040.469
Sources: Hufan Development Indicators, HDR 2002; Table 24 of Reyes (2002)
The deve opments of these two indicators over the years are shown inFigures 2 and 3. While it would be wrong to attribute all of this differ-ence to emographic changes, comparing the two in this area wouldprovide useful background for the succeeding discussions.
The big difference between the two countries lies in the diver-gence in fertility levels, with Thailand being able to bring down itsTFR to a eplacement level of around 2.1 at the beginning of the 1990scompare to the Philippines' more than 4 at the time and still over 3per wom n today (Figure 4). There is not much divergence in termsof infant ortalityas both countries were able to reduce their mortal-ity levels n a very similar fashion, with Thailand protecting her initialadvantag all throughout the period (Figure 5). The difference in fer-tility leve s spawned not only a divergence in population growth andpopulati n size (as discussed above) but also a glaring deviation inyouth de endency burden, as shown in Figure 6. Given that the fertil-ity rates re hardly closing, this difference in dependency burden issure to ontinue for more years. Among the known impact of highdepende cy burden is that it depresses savings and, consequently, physi-cal as well as human capital investments. Figures 7 and 8 show thatindeed s vings and investments have deviated since mid-80's. Finally,in recen years Thailand has begun to surpass the Philippines even ininvestme ts in human capital, which is evident in part in its enroll-ment'rat os in both secondary and tertiary levels, which have exceededthe latte ' s (Figure 9).
Populati n and poverty: a description of the linksTo descr" e the links between population and poverty, this paper deemsit best to tart with the Population and Sustainable Development Frame-work (PS F), as presented in the 2001-2004 Philippine Population Man-agement Program Directional Plan (Figure 10) and explained in greater

2041
0'U)
::)~~~..-c~"Ii)c0~~-'Q
.~u'-Q
)C
-
o.c~tooS!.
.c~
.qt')!DO
Nt')
.qOa)
,..:ri,..:
oocoO
)~'V
(\10)0
.--C'i.--
~
~
ON
MO
>N
CD
CD
M~
Muo;M
~
~
C'>
t--C'>
~(O
C>
OO
C>
(O<
Xi"'::"'::
O)~
O~
r--Ll)co
00 C
O
NO
MC
\I~C
\I
«)NO
~tD
MN
ON
"'""MO
ON
~N
cISc:c0
cIS-.C
OJo.
-C
Q)Q
).I::oa:oo~
-0.-=
OJ
cIS
cIS
.Q)
IX!
C
~
g'.9--O
O.-cIS
<::I:~
cnf-
roU")co
ON
I'-.
OM
CO
C'i..:ci
-.rt-.mo-.r-.r(O
Lt>C
\I
..;f..:C'i
!'-"'to-vO
ON
O>
N-v
.nN.n
10C\J
0)~CO
)
a;It) -.tN000a:C
l.
C\I
CD0~ 0C\I
~ ro(') co!D
ORBETA I 205
Figure 2. Per capita GDP, real US$ (1995 = 100)
Source: World Bank, World Development Indicators 2002
Figure 3. Population size, 1960-2000
Source: UN World Population Prospects 2000 Revised
Figure 4. Total fertility rate, 1960 to 2005

P~ILIPPINEJOURNAL OF DEVELOPMENT206
Figure 6. Youth and old dependency ratios, 1960 to2005
Figure 7. Gross domestic savings as percentage ofGDP, 1960-2000

ORBETA 207
Figure 8. Gross capital formation as percentage ofGDP, 1960-2000
Figure 9. Gross enrolment rate, secondary and ter-
tiary, 1970-1998
detail in errin (2002). Starting with this framework provides one witha compre ensive view of the relationships between population changeand the d fferent dimensions of development, one of which is poverty.Essentiall , the framework shows that demographic processes (fertil-ity, morta ity, and migration) and outcomes (size, structure and distri-bution) ect productive capacities (natural resource and environ-ment, hu ary resource) and outcomes (goods and services provisionand cons mption), which are translated into measures of wellbeing(health, utrition, education, desired fertility, etc.). In turn, these de-velopment outcomes affect demographic processes and outcomes.
This paper focuses next on the mechanisms through which popu-lation ch nges affect poverty. While not explicitly depicted, it wouldsoon be c ear that this is subsumed in the framework.

IfHILIPPINEjOURNAL OF DEVELOPMENT208
here are three main channels through which population affectpover .4 Following the taxonomy in Eastwood and Lipton (1999,2001),these re: the growth, distribution and conversion channels. The growthchan el refers to the impact of demographic variables on the level orgrowt of attainable welfare per person, usually measured by meanin co e or average consumption, given the distribution of income. Thedistri ution channel refers to the impact that alters the distribution ofinco e, given the attainable welfare per person. The conversion chan-nel r fers to the changes in actual wellbeing or capabilities, given theattain ble welfare per person. In terms of the PSDF, the growth chan-nel r fers to the impact on the middle box; the distribution channel,on th impact on the elements of both the middle and the right boxes;and t e conversion channel, on the right box. Eastwood and Lipton(2001) point out that, among the three, only the, growth channel hasrecei ed considerable attention compared to the other two.
he ,growth channel refers to the impact of demographics onmean income or average consumption. Based on the production func-tion oncept, the discussions on the growth channel focus on the im-pact n the means of generating income or factors of production,
Figur~ 10. Population and sustainable development framework
.This ~nd the subsequent paragraphs in this section draw heavily from Eastwood and Lipton (1999,
2001). I
ORBETA 209
namely, p ysical and human capital as well as technology and produc-tivity. Thi is usually discussed in two levels, the macro or aggregatelevel and he micro or household level. At the aggregate level, theissues rev lve ,around the impact of population changes in the aggre-gate accu ul~tion of physical and human capital. Central to the dis-cussion is he iimpact on savings, because it finances investments. Theimpact on aggregate investments on human capital such as educationand healt ,has also been given ample attention. Finally, on the roleof popula .on changes on the development of technology and pro-ductivity, e ,central question is whether population changes affectthe develo m~nt of technology and thereby affect productivity. At thehousehold level, similar issues are relevant for almost identical rea-sons.
What are the mechanisms in the distribution channel? Even ifrelatively I ttle work has been done in this area this issue has a longhistory. Ea twood and Lipton (1999) trace the origins of the incomedistributio ef:fect of higher fertility to Malthus. He hypothesized thatat the agg egate level, high fertility would raise the price of food andlower the rice of labor. Since the main asset of the poor is his labor,this is exp cted to affect the distribution of income. Eastwood and
Lipton (19 9,2001) identify two groups of ways through which demo-graphics a fect inequality and poverty. These are the dependency effectand the a quisition effect. These two subsume the aforementionedMalthusia effect. The dependency effect refers to the hypothesis thathigher fer ility worsens the distribution of consumption if the extrabirths are n4entrated in the poorer households, raising dependencyratios amo g the poor disproportionately. The acquisition effect, onthe other and, refers to the worsening of consumption distributionvia the abi ity or willingness of nondependents to acquire income orvia their sa .ngs behavior and factor rewards. The key to the distribu-tion effect i differential impact on the poor vis-a-vis the nonpoor house-holds. Thu , the distribution effect can be viewed both at the aggre-gate and h usehold levels.
Dwell ng further on the acquisition effect, this paper expresses itin four wa ,namely: I) child costs, 2) labor supply, 3) savings, or 4)factor rewa dsJ Child costs refers to added costs due to the presence ofan extra c ildj such as the direct or opportunity cost of child care.Additional ependents in a household may induce greater labor sup-ply from n ndtpendents. Fertility may affect household accumulation.While initi lly the effect of an additional child on household labor

210 PHXLIPPINEjOURNAL OF DEVELOPMENT
sup ly is indeterminate due to the opposing negative effect via de-man s for child care and positive effect due to induced labor supply,over time the child enters the labor force and increase household la-bor upply. This may depress real wages for the poor who tend to beuns illed compared to the rich-the Malthusian effect.
Finally, what are the mechanisms in the conversion channel? Asnote earlier, this channel refers to whether demographics affect thecap ity to transform a given income or consumption expenditure levelinto welfare or capabilities such as health and schooling. Necessarily,this ffect will primarily have to be viewed at the household level. Again,like he distribution effect, this is also dependent on differential be-havi r between the poor and the non poor households. The key issuesher include: 1) whether a large family is a rational choice for thepoo ; 2) if the economies of scale in consumption are more importanttha sibling crowding; 3) if children in large households enjoy worseedu ation and health care prospects; 4) whether getting out of pov-erty becomes easier or more difficult by extra births.
Three more concerns have to be mentioned on the relationshipbe een population and poverty. These are differential demographictran ition, mutual causation, and intergenerational transmission. Differ; tial demograPhic transition refers to the observed regularity that thepoo usually experience declining mortality and subsequently fallingfert.lity later, and with a longer lag between them, than the nonpoor.Thi has significant implications on the distribution and conversioneffe ts. Mutual causation refers to the fact that rapid populationgro th-early first births, large families, high child-adult ratios andclos r spacing of siblings-may not only be a cause but also a conse-que ce of poverty due largely to constraints on and even the rationalbeh vior of the poor. This has troubled empirical tests on the relation-shi between demographic changes and poverty. Finally,inte generational transmission of poverty and inequality has been citedas a very important welfare issue. Lam (1987), for instance, is not asstro g on the other of aspects of the impact of demography on in-equ lity but identified this issue as very important. His basis is the well-acc pted negative impact of high fertility on child endowments (in-clu ing human capital). Incidentally, this has also been identifies asthe basis for the intergenerational vicious cycle of poverty argumenttrig ered by high fertility rates among the poor.

ORBETA 211
Review 0 empirical evidenceGrowth efj ects
The relati nship between population change and the level and growthin per ca ita income has been the subject of scrutiny and a long-drawndebate. T e assessment in the 1980s qualified the strong negative im-pact verd ct in the 1970s. For instance, a more calculated assessmentexemplifi d by the statement from the National Research Coun<;il(1986) s tes that "on balance, we reach the qualitative conclusionthat slow population growth would be beneficial to economic devel-opment £ r most developing countries." More recent empirical resultsutilizing c nvergence-pattern or technology gap models such as Kellyand Sch idt (1995, 2001), however, yielded large negative impact ofpopulatio change on growth of per capita income. In particular, astudy by elley and Schmidt (1995), using data covering a 30-year pe-riod (196 1990), finds that a unit decline from recorded median popu-lation gro th rate of 2.54 to 1.54 percent results in an increase of percapita GN growth from its median of 1.36 to 2.00 percent. High crudebirth rate were found to reduce economic growth while decreases incrude dea h rates increase economic growth. A survey and re-estima-tion of ei ht models incorporating several economic-demographicapproach s given in Kelly and Schmidt (2001) validates this earlierresult. Th survey highlights the following results: 1) demographictrends (d clining population growth, fertility, mortality; changing agedistributi n; and rising density and population sizes) have sizeableimpact 0 economic growth; 2) while the overall impact of popula-tion grow h is negative, fertility and mortality effects have offsettingeffects wit increases due to mortality decline stimulating growth whileincreas ue to rise in fertility attenuating growth; 3) increasing den-sities an opulation size contribute a positive but relatively small boostto econo ic growth, with scale effects dominating density; 4) in mostmodels, e impact of demography has declined over time.
It is orth noting that the role of changing age structure accom-panying d mographic change was found to have a considerable ex-planatory ower to rapid economic growth in East Asia in the past twodecades. hus, it is argued that population neutralism of the 1980smaybe w the offshoot of the too much focus on impact of aggregatepopulatio growth to the neglect of the impact of changes in the agestructure Bloom et al. 2001). It is also argued that in the early stages

*HILIPPINEjOURNAI, OF DEVELOPME212
of th demographic transition, per capita income declines because oflarge outh dependency burden and a small proportion of working-age a ult working and saving. As the transition proceeds, per capitain co e increases as the share is reversed with relatively more workersand s verso This constitutes a potential window of opportunity, nowpopu arly known as the "demographic bonus," which will evaporate asthe s are of the elderly rises in the later phase of the transition. Simu-latio s done by Lee et al. (2001), using data from Taiwan, validatedthe h pothesis of increases in savings rates as the proportion of work-ing a e population increases under the assumption of constant inter-est ra e ~nd constant productivity rate. Bloom and Williamson (1998)find a~ population dynamics explain as much as 1.4 to 1.9 percent-age oillits of the GDP per capita growth in East Asia, or as much asone- ird of the average East Asian miracle GDP per capita growthrate 1.9(6.1). In Southeast Asia, the estimated effect ranges from 0.9to 1. points of economic growth or about half (1.8/3..8) of the re-cord d g)rowth in GDP per capita. Finally, Eastwood and Lipton (2001)esti te that had the average country5 reduced its birth rate by fiveper t ousand throughout the 1980s, the average poverty incidencewoul have been declined from 18.9 percent in the mid-1980s to 12.6perc nt between 1990 and 1995. About half of this reduction is attrib-
utabl to increases in economic growth.irnulations using the Population and Development Planning
(PD ) Model, an economic-demographic model estimated using Phil-ippi e data, also show that higher population growth lowers GNP percapit level (Orbeta et al. ~999). Furthermore, this negative effect wasfoun to be much bigger if foreign capital inflows are held fixed.
A l~ok at the growth performance of countries in Asia shows thatthe ilippines had lagged behind Thailand, which had about the samepop lation size and even lower per capita income in 1965. Thailand'spop ladon is growing at less than one percent while that of the Philip-pine is ~till growing at more than 2 percent. As a result, after 35 yearsthe hil~ppines has about 14 million more people and about less than
half fThailand's per capita income.As noted earlier, growth in per capita income is also affected by
phys cal:and human capital investments. At the macrolevel, it was found~
"The d~taset includes 45 less developed and transition countries.

that incre sed human capital expenditures (aggregate expenditureson educa ion and health) spawned by rapid population growth areinsufficie t to maintain per capita levels, which implies negative im-pact on e ucation and health output (Orbeta 1992).
At t e hpusehold level, Herrin (1993) finds that accumulation ofhousehol assets is negatively affected by the number of young chil-dren 0 to and 7 to 12 years old. This result is corroborated by Mason(1992). T e study finds that child bearing negatively affects the savingrate. Alth ugh it does not affect the absolute am~unt of savings, assetper child as found to be greater in lower fertility households.
Distributi effectsAs has be n mentioned earlier, there has not been as much work onthis chan el compared to the growth effects. In an earlier review, Lam(1987) no es that empirical evidence leads to mixed conclusions. Fur-thermore the review emphasizes that the "certainty of negative distri-butional e fects of population growth expressed in the 1974 World Bankreport on population and development. ..seems to be a much stron-ger concl sion than the empirical arid theoretical analysis of the is-sues can c rrently support."
Utili ins newer modeling ideas, recent results such as Eastwoodand Lipt n (1999; 2001), provide more definitive conclusions. Thestudy not onlry found that high fertility retards economic growth (asnoted ab ve) but also skews the distribution of income against thepoor. Th ir estimate revealed that half of the estimated decline inpoverty c uld be attributed to increases in economic growth and halfto chang s in the distribution of income. The results further high-lighted th fact that as fertility decline spreads to poor households,the pover -reducing benefits of fertility decline increase even more.Reinforci g this result are similar findings in Brazil, a country that isin the lat r stages of fertility transition (Paes de Barros et al. 2001).
Dependen effectsIn trying 0 find evidence of the dependency effect, Eastwood andLipton (1 99) used 18 of the 56 World Bank Poverty Assessments ondependen y ratios for the poor and nonpoor. The data show only aslight dep ndency effect as the dilution ratio of the poor was found tobe only sl. htly higher than those for the nonpoor.
2141
Acqui 'tion effectsIn ter s Qf acquisition effect, studies on the impact of additional chil-dren n ~me allocation show that the mother's labor market hoursdecli e 14 months after giving birth, after which they return to thepre us level; the father's labor market hours are not affected, nei-the oes the loss of the labor market hours of the mother inducemore abor market hours for the father; the labor market time of theolder aughter, however, increased (Tiefenthaler 1997). It appears thatthe 01 er' daughter replaces the lost market time of the mother. Ear-lier st dies both support and negate results of this finding. For in-stanc , Quizon-King (1978) finds that the labor market time of bothmoth r and father is not affected and only the mother's home timeincre ses. This is largely corroborated in King and Evenson (1983).Garci (1990), on the other hand, finds that having young childrendecre es the market time of the mother but increases the market timeof the father.
n the labor force participation of older children, a joint school-ing-la or!force participation model for children 10 to 24 years old wasestim ted using a merged Family Income and Expenditure Survey(FIES , Labor Force Survey (LFS) and Functional Literacy Educationand ass Media Survey (FLEMMS) for 1994 in Orbeta (2000). He findsthat £ mily size does not significantly affect school attendance but posi-tively afft:cts labor force participation. Corroborating this result,Villa il (f2002), using the 1995 Child Labor Survey, provides evidencethat t e probability of children 5 to 14 years old not going to schoolbut w rking is positively related to the number of young children (0-9years) but is negatively related to the number of older children (15-17years) in the family.
n the aspect of the impact of rapid population growth on wages,Bloo and Freeman (1988) find that for the period 1965-1985, devel-oping countries were able to shift the labor force from low productiv-ity ag iculture to higher productivity industry and services sectors de-spite he rapid growth of their population. This shows that there maynot b much depressing impact on wages. They caution, however, thatsuch djustments may become increasingly difficult in the future. Inthe c se of the Philippines, studies (e.g., de Dios et. al. 1993) revealslow rowth in employment opportunities. This is further buttressedby th high open unemployment and underemployment rate that didnot s are even educated workers (Orbeta and Pernia 1999). Finally,the c ntinued flow of overseas contract workers is testimony to the

ORBETA 215
lack of e~ PIOyment opportunities domestically. All of these indicatethat the althusian negative impact of rapid population growth onpoverty vi the distribution effect may be operating.
Conversion efftctsWhile pri arily the evidence on conversion effects would come fromhousehold le~l analysis, there are indications that can be gleaned fromthe aggre ate! level. For instance, there are countries where per capitaincomes 0 p~r capita consumption are lower but indicators of well-being are be1Jter than those with higher incomes. Sri Lanka, for in-stance, ha lower per capital income than Indonesia, the Philippines,and Thail nd (Table 6), but it has better infant mortality record andschool att ndance, particularly at the secondary level. We now turn tothe house old-level evidences.
Fertility pr; erencesAn empiri al regularity one finds worldwide is that poverty incidenceis always h gh~r among households with larger family size. The Philip-pines is n e~ception, as shown in Table 7, The question is whetherthe poor ati«)nally choose to have large families, There are indeedconceptua reasons and even empirical evidence that the poor mayprefer to ave large families, These could be any or a combination ofthe follow'ng: they put high value on the perceived benefits of havingmany chil ren; they put low value on the costs of having them; or theyfind small rQbability in enjoying the alternatives,
Amo g the commonly cited reasons are that children add to fam-ily incom , provide old-age security, and that fewer and better-edu-cated chil ren with better earning prospects may be just a remote'op-tion for th poor, The reasons could include requiring what to themcould be naffordable savings, delayed (or heavily discounted) andrisky retur s, ~nd very high opportunity cost from foregone child la-borincom,
How ver, Birdsall et aI, (2001) challenge the belief that the poorrationally hopse to have large families and require proofs on the fol-lowing wh ch,! which have been highlighted by recent studies: 1) thatthe choice off the poor are not limited; 2) that the poor have the re-quired inp ts to make an informed choice; 3) that men do not domi-nate the c oice over the number of children while not fully sharingthe costs; (d) that there is no higher prevalence of unwanted pregnan-cies amon the poor compared to the nonpoor; and 5) that fertility
216 fHILIPPINE JOURNAL OF DEVELOPMENT
has i creased among the very poor who have good access to healthand £: mily planning information and services. It would require inten-sive t sts to know the answers to these questions. However, the answersmay e g~eaned from available data on the Philippines.
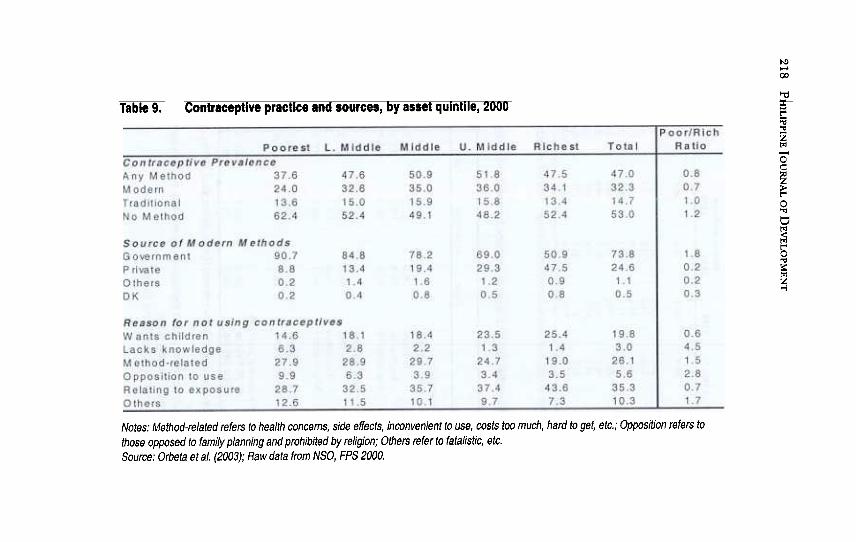
able 8 shows the differential contraceptive practice of the poorand t e monpoor. It must be noted that the classification, due to datalimi tions, may be a bit loose. But if contraceptive practice is an indi-catio Ofi the extent of control over fertility, the table shows that, fromeithe thie actual contraceptive practice or access to family planningservi es, ,the poor may have less control over their fertility than thenonp or, Using a finer disaggregation of households, Table 9 showsthat he disparity in the use of modern contraceptives by poor andnonp 011 households is even more pronounced. If access and contra-cepti e practice were even for both the poor and the nonpoor, thenthe p or, as shown in Table 6, could have large family size by choice.Final y, tpe evidence on unwanted fertility and unmet need for familyplan ing points to the disparity between the poor and the nonpoor.Pam 111 and Ramosjimenez (2000), using the 1993 National Demo-grap ic Survey (NDS), the 1998 National Demographic and HealthSurv y (NDHS) and a wealth index, show that women in the poorest20 pe ce~t of households are 27 percent more likely to have unwantedfertil ty and 122 to 154 percent more likely to have un met need6 forfamil pl!inning compared to women in the richest 20 percent of house-hold .T~ble 10 shows a similar story using data from the recent 2002roun of the Family Planning Survey. The table shows that women fromthe p orest households have almost twice as much prevalence of unmetneed for family planning as do women from the richest households.
Econ mitis of scale in consumptionOn t e aspect of economies of scale in consumption, evidence on bothsides of the argument exists. It has been shown that the negative im-pact n consumption of large family size will not hold under someplaus'bl~ assumptions about economies of scale in consumption (e.g.Lanj w ctnd Ravallion 1995 for Pakistan; Anand and Morduch 1996 forBang ad~sh). But there are also pieces of evidence on the congestioneffec .King (1987), for instance, notes crowding in the poor's smalldwel ings.
.Total 9f spacing and limiting unmet need

218
PhILIP
PIN
E
T O
UR
NA
L OF
DE
VE
LOP
ME
NT
i..Co
~f..-c0at.!!.a~
.9~~~c::.0~00
8-.E<!)
~.9"E~.c'u=0
E0.9~.E
'" <
!)0u
.u',.;::
<!) .'"
",==o~
.9~-0c::-.91
'-c::~~
~8 ~.S
£",,0
c::;U
"c:'o
~.o
0'"'"
6, C
\j<
!)"'=C
/)
~~
P..
'ii; ~
LJ.:.Q
0,
",' -0E
<!)C
/)<
!)"="<
:u~
Ec::.J:::0
e e
u 00'"'"
£-(13-~
-(13C
::~<
!) (13
~
.J:::O)~
O.C
:: (13
-c;a:~
c::
"<
!)~c;')'
""'000~
0
-o~C
\j<
!)E"-'-
--:
~~
(13~
O"'Q
)
-g::o~<
!) <
!)
£"'.Q<
!) 0
0.;;
~
&0
.0".,;
<!)
<!)
<!)
~
-"'=0
~oo
~£C
/)

ORBETA 219
Table 10. Unmet need for family planning by asset class, 2002
A~t Class Poor/RichRatio
_I~orest
L. Middle-MidC!I~~.iddle Richest Total
Total 26.9 22.2 17.2 18.0 15.6 20.0 1.7
Spacing 13.6 10.8 7.9 9.6 8.7 10.1 1.6
Limiting 13.4 11.4 9.3 8.3 6.9 9.9 1.9
Source: Autjr'S calculationBasic data: PS 2002. Methodology used to compute the asset classes is described in Orbeta etal. 2003.
Investmen s in human caPitalEmpirica evidence that high fertility is associated with decreasing in-vestmen in education and health abounds. King (1987) provides areview 0 studies on the effect of population change on householdwelfare. he conclusions include the followmg: 1) children in largefamilies erform worse in school; 2) children in large families havepoorer haIth, lower survival probabilities, are less developed physi-cally; 3) i pact on parental welfare is not as clear. These conclusionsare subst ntially echoed in a more recent review of studies with someadded di ensions (Lloyd 1994). In particular, the study found thatthe adver e impact on children born into large families can be groupedinto: 1) r source dilution, with each child getting a smaller share offamily re ources, including income, time, and maternal nutrition; 2)the "opp rtunity effect" through diminished access to public resources,such as h alth care and education; 3) the "equity effect," which meansunequal distribution of resources among siblings; and 4) the"intergen rational effect," with the adherence to the traditional roleaffecting e transmission of opportunities to the next generation.
Orb ta (2002) reviews several more studies showing similar re-sults in th Philippines. High fertility does not affect school participa-tion of yo nger children (7-12 years old) but negatively affects schoolparticipa on and attainment of older 13-17 years old children (Herrinet al. 199 ). Bauer and Racelis (1991) corroborate this result on olderchildren. eGraff et al. (1993) particularly emphasized the large nega-tive impa t on boys. In addition, it affects not only the school comple-

220 I P~ILIPPINEJOURNAL OF DEVELOPMENT
tion r~tes of children but also the expenditure per child (Bankostaand E~en$on 1978).
Vulner bil,tyFinall , there is growing evidence that larger family size makes it diffi-cult f, r poor families to get out of poverty and for the currentlynonp or ~o be more prone to slide below the poverty threshold. Glewweand H II !(1998), for instance, using panel data from Peru, find thatfamili s that have more children are more vulnerable to macroeco-nomic sh~cks. Vulnerability is defined as changes in the one's socio-econo ic status, Using the 1997 FIES, and the 1998 and 1999 AnnualPover Indicator Survey (APIS), Reyes (200'2) shows very revealingpover dynamics. Tracing the movement of families in and out of pov-erty 0 er this three-year period, she finds that 46 percent of the fami-lies ar not affected and remain nonpoor throughout while 22 per-cent r main poor. Table 32 in her paper is quite revealing. It clearlyshows thalt as one goes from being poor to being nonpoor, the familysize d clipes. It clearly implies that getting out of poverty becomesharde wi,th larger family size.
Impli ations for policySever I themes can be gleaned from the foregoing discussions to guide
policy namely:ne, while it would be wrong to attribute solely to high fertility
the hi h incidence of poverty in the country, recent research provideseven s ronger evidence showing the important roles that demographicchang s play in development in general, and poverty alleviation in par-ticula .At the aggregate level, it retards the growth in per capita in-come it lowers savings rates and investments in physical and humancapita. An even more overwhelming evidence of the depressing im-pact 0 high fertility, particularly on savings and human capital invest-ments e~ists at the household level. The impact through the distribu-tion c aQnel has also been found to be equally potent by recent re-searc ,showing that it skews the distribution of income against thepoor. inally, household level studies continue to reveal the deleteri-ous e ect of high fertility on the attainment of wellbeing of the poorgiven their incomes. These results should further strengthen the re-solve f concerned sectors like the government to include, as part ofthe p verty alleviation package, programs to improve fertility manage-ment f poor couples.

ORBETA 221
Tw , while it has been argued that the observed pattern of thepoor ba ing a larger family size is the result of their rational choice, acloser I ok at the data reveals that this can only be partially true in thecase of t e Philippines. National survey data reveals that while wantedfertility th,e closest indicator of fertility preferences-of women frompoorer ouseholds is higher compared to those from richer house-holds, it alsp shows that the poor also have higher unwanted fertility.The hig er unwanted fertility of the poor is explained by limited ac-cess to f mily planning and allied services, lower contraceptive preva-lence ra es, and higher un met need for family planning. An effectivefamily p anming program is thus needed to improve the poor's controlover the rfertility and enable them to realize their fertility goals.
Th ee, current fertility choices not only have contemporary butalso int generational impact. There is overwhelming evidence, evenduring t e ,1980s, when analysts doubted the importance of fertilityregulati n in development, that high fertility leads to decreased in-vestmen s in human capital. This has been identified as the main en-gine of i tergenerational transmission of poverty. It migh t too late towait for hei poor to reduce their fertility to solve this problem. Thisrequires prcl>active subsidy and better targeting of public services toimprove human capital investments (e.g., education and health) ofthe poo It lis worth noting that this has both short and long-term ef-fects. In the short term, it shields the poor from deprivation due totheir cu rent economic status. Over the long term, it helps stop theintergen rational transmission of poverty. These interventions havegood so ioeconomic returns apart from dealing with the externalitiesof fertili decisions.
Fo r, it has been shown by decomposition analysis that in thePhilippi es, growth is the primary contributor to the decline in pov-erty inci ence while crosscountry analysis considers the lowering in-equality s playing a secondary role. Sustained economic growth shouldtherefor remain the primary strategy of development in the immedi-ate term with lowering inequality as the secondary strategy. On therole of d mographics, even those who believe in the important role itplays in evelopment are quick to add that these are mostly potentialbenefits. more conducive economic environment is required to trans-late thes into reality. This is clearly demonstrated by the difference inimpact 0 similar demographic transitions unfolding in East Asian andLatin erican countries. In East Asia, the demographic transition

222 ~HILIPPINEJO\JRNAL OF DEVELOPMENT
facilit ted rapid economic growth. In Latin America, on the other hand,a mo modest economic growth had been achieved.
ive, globalization introduces at least two elements that have im-porta t implications, as enumerated by the foregoing discussions: 1)it cre tes opportunity, and 2) it means rapid changes in the economicenvir nment. At the aggregate economy level, to benefit from oppor-tuniti s created by globalization, the economy must be able to shiftresou ces to sectors where demand is expanding from sectors wheredema d is contracting. To the extent that high population growth de-ters i vestments in both physical and human capital, it means it canhinde these needed shifts. Similarly, at the household level, those whohave ewer (and by all indications well endowed) children, will havebette chances of benefiting from globalization. This will clearly con-tribut to worsening inequality. Finally, recall that increases in familysize i creases the vulnerability of households to changes in economiccondi ions as well as to slippage into poverty. To the extent that glo-baliza ion implies more rapid changes in the economic environment,this eans increasing vulnerability for those who have large families.
ix, all of the foregoing point to the important role demographicchang s play in development in general, and poverty in particular. Theyprovi e more than enough justification for government to help couplesachie e their desired fertility and promote small family size.
ORBETA 223
References
Ahlburg, D., A. Kelley and K. Oppenheim Mason (eds.). 1996. Popula-tion growth and poverty. The impact of population growth on wel-beingin developing countries. Berlin: Springer-Verlag.
Anand i .andJ. Morduch.1996. Poverty and the population problem:
evi ence from Bangladesh. HIID Development Discussion Paper
No. 559. Massachusetts: Harvard Institute for International Devel-op ent.
Balisacan, A. 2001. Poverty comparison in the Philippines: is what weknow about the poor robust? Paper delivered at the Asia and Pa-cific Forum on Poverty: Reforming Policies and Institutions forPoverty Reduction, 5-9 February 2001, Asian Development Bank,
Pasig City, Philippines.Bankosfu, K. and R. Evenson. 1978. Fertility, schooling and home tech-
nology. Philippine Economicjournal 17(1,2): 32-61.Bauer,J. and R. Racelis. 1991. Household compositionand the activity
status of Filipino youth. Paper prepared for the Annual Meetingof the Population Association of America, March 21-23, Washing-ton p.C.
Birdsallj N., A. Kelley and S. Sinding. 2001. Population matters: demo-grap~ic change, economic growth, and poverty in the developing world.Oxf~rd, England: Oxford University Press.
-.~001. How and why population matters: new findings, new is-suesl In Population matters: demograPhic change, economic growth, andpoverty in the develoPing world edited by N. Birdsall, A. Kelley and S.Sinding. Oxford, England: Oxford University Press.
Bloom, D. and R. Freeman. 1988. Economic development and the tim-ing and components of population growth. journal of Policy Model-ingl0(1): 57-81.
Bloom, p. and J.G. 'Williamson. 1998. Demographic transitions andeconomic miracles in emerging Asia. World Bank Economic Review12(3): 419-55.
Bloom, D., D. Canning andJ. Sevilla. 2001. Economic growth and thedemlographic transition. NBER Working Paper No. 8685. Massa-chu&etts, USA: National Bureau of Economic Research, Inc.
De DiOSt E. and Associates. 1993. Poverty, growth and the fiscal crisis.Mak ti City: Philippine Institute for Development Studies and In-tern tional Development Research Centre.

P~ILIPPINE JOURNAL OF DEVELOPMENT224
DeGr f, D.,R. Bilsborrow and A. Herrin. 1993. Children's educationin he Philippines: does high fertility matter? Processed.
De Gu man, E. 1998. Declining mortality among Filipinos: the yearsaft r Population,Resources, Environment and the Philippine Fu-tu es (PREPF). Paper presented at the National Social Science Con-gr ss IV, Philippine Social Science Center, Quezon City.
Eastw od, R. and M. Lipton. 2001. Demographic transition and pov-er : effects via economic growth, distribution and conversion. InPo ulation matters: demograPhic change, economic growth, and povertyin he developing world edited by N. Birdsall, A. Kelley and S. Sin ding.0 ford, England: Oxford University Press.
-.1999. Impact of changes in human fertility on poverty. Journalof evelopment Studies 36(1): 1-30.
Garci , M. 1990. Resource allocation and household welfare: study ofth impact of personal sources of income and food consumption,nutrition and health in the Philippines. J;>h.D. dissertation. Insti-tu e of Social Studies, The Hague, The Netherlands.
Gleww , P. and G. Hall. 1998. Are some groups more vulnerable tom croeconomic shocks than others? hypothesis test based on panelda e from Peru. Journal of Development Economics 56:181-206.
Herri , A. 1993. Studies on consequences of population change in Asia:P ilippines, Asian Population Studies Series No.121, United Na-ti ns Economic and Social Commission for Asia and the Pacific,N w York: United Nations.
-.20()1. Population policy in the Philippines: 1969-2000. Paperpr pared for the Policy Evaluation Research for the PhilippineP pulation Management Program project sponsored by the Popu-la .on Commission and the Philippine Institute for DevelopmentSt dies.
_.2002. Population, poverty and development: a framework. Pa-pe prepared for the Population Commission.
Herri , A. and E. Pernia. 2000. Population growth, human resourcesand employment in the Philippines. Paper prepared for the Aus-tr ian National University-University of the Philippines conference0 the Philippine economy, 2-3 November, Canberra, Australia.
Kelley A. and R. Schmidt. 1995. Aggregate population and economicgr wth correlations: the rule of the components of demographic
change. Demography 32(4).Kelley A. and R. Schmidt. 2001. Economic and demographic change:
a ynthesis of models, findings and perspectives. In Population mat-~

ORBETA 225
ters: d mograPhic change, economic growth, and poverty in the developingworld edited by N. Birdsall, A. Kelley and S. Sin ding. Oxford,Engla d: Oxford University Press.
King, E. 1 87. The effect of family size on family welfare: what do weknow? In Population growth and economic development, issues and evi-dence dited by D.G. Johnson and R.D. Lee. Madison, Wisconsin:The niversity of Wisconsin Press.
King, E. a d R. Evenson. 1983. Time allocation and home productionin Phi ippine rural households. In M. Buvinic, M. Lycette and W.McGr evey (eds.) Women and poverty in the third world. Baltimore:John opkins University Press.
Lam, D. 1 87. Distribution issues in the relationship between popula-tion growth and economic development. In Population growth andecono ic development, issues and evidence edited by D .G. Johnson andR.D. ee. Madison, Wisconsin: University of Wisconsin Press.
Lanjow, P. and M. Ravallion. 1995. Are larger households really poorer?Econo ic]ournal105.
Lee, R., A Mason, and T. Miller. 2001. Saving, wealth, and population.In P; lation matters: demograPhic change, economic growth, and pov-erty in the developing world edited by N. Birdsall, A. Kelley and S.Sindi1g. Oxford, England: Oxford University Press.
Lipton, Mi. and M. Ravallion. 1995. Poverty and policy. In Handbook ofdevelopment economics Volume 3 edited by J. Behrman and T.N.Sriniv san.
Lloyd, C. 994. Investing in the next generation: the implications ofhigh rtility at the level of the family. In Population and develop-ment: ld debates, new conclusions, edited by R. Cassen. New Brunswickand 0 ford: Transaction Publishers.
Mason, A. 1992. Savings in the Philippines. In Family size and familywelfar in the Philippines by J. Bauer, D. Canlas, M. T. Fernandezand A Mason. Paper prepared for the Regional Conference onPover ,Health and Population Issues, Asian Development Bankand P pulation Institute, East-West Center.
McNicoll, G. 1997. Population and poverty: a review and restatement.Popul tion Council Policy Research Division Working Paper 105.New rk: Population Council.
Merrick, .2002. Population and poverty: new views on an old contro-versy. nternational Family Planning Perspectives 28 (1) .
--' 20 1. Popul~tion and poverty in households: a review of re-views. n Population matters: demograPhic change, economic growth, and
rHILIPPINEjOVRNAL OF DEVELOPMENT226
p~verty in the developing world edited by N. Birdsall, A. Kelley and S.S~nding. Oxford, England: Oxford University Press.
Natiqnal Research Council. 1986. Population growth and economic devel-opment: policy questions. Washington D.C.: National Academy Press.
Orbeita, A. 1992. Population growth, human capital expenditures andj onomiC growth: a macroeconometric analysis. Philippine Review
0 Economics and Business 29(2): 179-230..2000. Macroeconomic policy change and joint schooling and
l~bor force participation decision of children 10-24 years old.~IMAP Research Paper No. 46. Manila: Micro Impacts of Macro-ek:onomic Adjustment Policies.
Orb~ta, A. 2002. A review of research on population-related issues:1~80-2002. paper prepared for the Policy Evaluation Research fort~e Philippine Population Management Program (PPMP). PIDSdiscussion Paper Series No. 2002-17. Makati City, Philippines: Phil-ippine Institute for Development Studies.
Orbdta, A.C. and E.M. Pernia. 1999. Population growth and economic~evellopment in the philippines: what has been the experience and"ofhat must be done? PIDS Discussion Paper Series No. 1999-22.¥akati City, Philippines: Philippine Institute for Development Stud-
i~s.Orb ta, ~., M. Belisario and E. Lavina. 1999.. Population and develop-
en~ planning (PDP) model: 1998 update.. PIDS Discussion Papereri~s No. 1999-28. Makati City, Philippines: Philippine Institute
£ r li>evelopment Studies.Orb ta, ~.., I. Acejo,].. Cuenca and F.. del Prado. 2003. Family planning
~d ~aternal and child health outcomes, utilization and access tos rvices by asset quintile. PIDS Discussion Paper Series No. 2003-~4. Makati City, Philippines: Philippine Institute for Development
~tudies.Paeslde Barros, R., S. Firpo, R. Barreto and P. Leite. 2001. Demographic
qhanges and poverty in Brazil. In Population matters: demograPhic~hange, economic growth, and poverty in the developing world edited byttI. rrirdsall, A. Kelley and S. Sin ding. Oxford, England: O'J{ford~nitersity Press.
Pamfra~, N. and P. Ramos-jimenez. 2000. Wanted fertility and unmetqeed for family planning among young adults in the Philippines.~ocial Science Information Volume 20 (1) .
Qui~on-King, E. 1978. Time allocation and home production. Philip-~ine Economicfournal17(l,2): 185-2002.

ORBETA 227
Reyes, C. 2002. The poverty fight: have we made an impact? PillS Dis-cussi n Paper Series No. 2002-20. Makati City, Philippines: Philip-pine nstitute for Development Studies.
Tiefenth ler, I. 1997. Fertility and family time allocation in the Philip-pine. Population and Development Review 23(2).
United N tions. 2000. UN World Population Prospects 2000 Revision. NewYork: UN Population Division.
Villamil, .2002. Strengthening the role of international labor stan-dard in selected developing member countries: country reporton c ild labor in the Philippines. Paper prepared for the AsianDeve opment Bank/International Labour Organization/RegionalTech ical Assistance (ILO/ ADB/RETA) project, Manila, Philip-
pine.World B nk. 2002. World Indicators. Washington D.C.: World Bank.