population aging and the savings-investment balance in … · saving s-investment balance ... the...
TRANSCRIPT

This PDF is a selection from an out-of-print volume from the National Bureauof Economic Research
Volume Title: The Economic Effects of Aging in the United States and Japan
Volume Author/Editor: Michael D. Hurd and Naohiro Yashiro, editors
Volume Publisher: University of Chicago Press
Volume ISBN: 0-226-36100-4
Volume URL: http://www.nber.org/books/hurd96-1
Publication Date: January 1996
Chapter Title: Population Aging and the Savings-Investment Balance in Japan
Chapter Author: Naohiro Yashiro, Akiko Sato Oishi
Chapter URL: http://www.nber.org/chapters/c8461
Chapter pages in book: (p. 59 - 87)
3 Population Aging and the Saving s-Investment Balance in Japan Naohiro Yashiro and Akiko Sato Oishi
The main purpose of this paper is to analyze the major effects of population aging on the macroeconomic savings and investment balance in Japan and to discuss their major policy implications. Although population aging is a phe- nomenon common to many OECD countries, Japan’s case is striking because of the high rate at which it is progressing. The rapid aging process in Japan is a product of the high rate of economic growth and associated changes in family and social structures in the postwar period, which has resulted in a large de- cline in the fertility rate and a marked lengthening of the average life expec- tancy.
The rapid aging of the population has important macroeconomic effects. The first effect is the impact on the labor market through a shrinking labor force and an increasing share of older workers in the labor force. The second is the impact on the capital market due to falling household and national sav- ings ratios, coupled with the rising ratio of retired people to working-age people. In addition, a shrinking labor force will affect investment and thus the financing of capital. The third effect is the fiscal impact, with an increasing share of the elderly causing substantial transfers of income from the working to the retired generation through the tax and social security systems. These impacts eventually affect both investment and savings, and thus the current external account.
In this paper, we focus on the impact of population aging on macroeconomic savings and investment balances mainly through the labor market. While Ja-
Naohiro Yashiro is professor of economics at the Institute of International Relations, Sophia University. Akiko Sat0 Oishi is an economist at the Japan Center for Economic Research.
The authors are grateful to the Japan Foundation Center for Global Partnership for financial support. They appreciate comments on the preliminary paper by Yutaka Kosai, Yukio Noguchi, and other conference participants. They would also like to thank Katsuhisa Uchiyama for his valu- able assistance.
59
60 Naohiro Yashiro and Akiko Sat0 Oishi
pan’s huge trade surplus is the cause of various economic frictions, a trade deficit could bring about another problem, adversely affecting not only Japan but the world economy as well through the curtailment of Japan’s capital ex- ports. In the sections that follow, we look at the development of the population structure and the labor force in the coming decades. This overview is followed by a review of previous empirical studies of the economic impacts of popula- tion aging, most of which have reached pessimistic conclusions, and an attempt to identify the major factors behind these conclusions. We also explore various alternative conclusions under different assumptions. Finally, we discuss the policy implications of population aging.
3.1 Aging of the Population and Labor Force
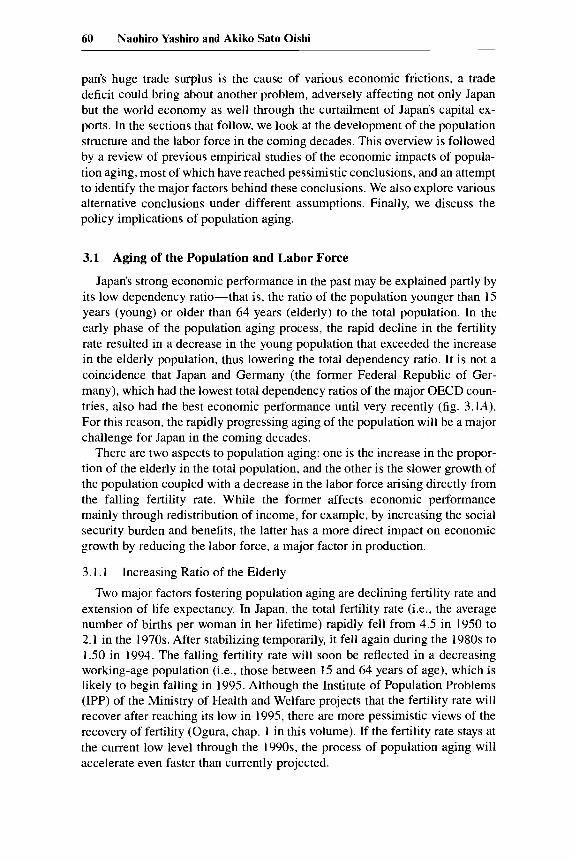
Japan’s strong economic performance in the past may be explained partly by its low dependency ratio-that is, the ratio of the population younger than 15 years (young) or older than 64 years (elderly) to the total population. In the early phase of the population aging process, the rapid decline in the fertility rate resulted in a decrease in the young population that exceeded the increase in the elderly population, thus lowering the total dependency ratio. It is not a coincidence that Japan and Germany (the former Federal Republic of Ger- many), which had the lowest total dependency ratios of the major OECD coun- tries, also had the best economic performance until very recently (fig. 3.1A). For this reason, the rapidly progressing aging of the population will be a major challenge for Japan in the coming decades.
There are two aspects to population aging: one is the increase in the propor- tion of the elderly in the total population, and the other is the slower growth of the population coupled with a decrease in the labor force arising directly from the falling fertility rate. While the former affects economic performance mainly through redistribution of income, for example, by increasing the social security burden and benefits, the latter has a more direct impact on economic growth by reducing the labor force, a major factor in production.
3.1.1 Increasing Ratio of the Elderly Two major factors fostering population aging are declining fertility rate and
extension of life expectancy. In Japan, the total fertility rate (i.e., the average number of births per woman in her lifetime) rapidly fell from 4.5 in 1950 to 2.1 in the 1970s. After stabilizing temporarily, it fell again during the 1980s to 1.50 in 1994. The falling fertility rate will soon be reflected in a decreasing working-age population (i.e., those between 15 and 64 years of age), which is likely to begin falling in 1995. Although the Institute of Population Problems (IPP) of the Ministry of Health and Welfare projects that the fertility rate will recover after reaching its low in 1995, there are more pessimistic views of the recovery of fertility (Ogura, chap. 1 in this volume). If the fertility rate stays at the current low level through the 1990s, the process of population aging will accelerate even faster than currently projected.
61 Population Aging and the Savings-Investment Balance in Japan
A %
75 r 70
65
60
55
50
45 1 , I , , I
1965 1970 1975 1980 1985 1990 1995 2000 2005 2010 2015 2020 2025
B '/o
_ _ _ _ _ - - - - -
35
30 _ _ - - _.--- 20 15 _ _ _ _ - - - - -
Aged dependency ratio
1965 1970 1975 1980 1985 1990 1995 2000 2005 2010 2015 2020 2025
Fig. 3.1 A, International comparison of dependency ratios, 1965-2025; I?, Japanese dependency ratios by age group, 1965-2025 Sources: A, Bos et al. (1992); B, Ministry of Health and Welfare (1992).
Life expectancy for 65-year-olds has risen by 4.51 years for males and 6.37 years for females over the past four decades.' Japan's life expectancy growth and the level attained in 1994 were the highest in the world. Improvement in medical services and in the incomes of the elderly contributed to the longer lives of the Japanese. This extension in life expectancy for 65-year-olds since 1955 raised the proportion of the elderly (defined as those aged 65 years and over) in the total population in 1990 by over 2 percent and accounts for approx- imately one-fifth of the increase in the ratio projected for 2025.'
With falling fertility and rising life expectancy, the ratio of the elderly to the working-age population is expected to double from the current level by the year 2025 (fig. 3.1B). The extent to which population aging will have negative impacts on the economy is a matter of great concern.
1. The extension of life expectancy at birth during the same period is more significant because of a large fall in infant mortality: 14.35 years for males and 16.81 years for females.
2. If we assume that the life expectancy for 65-year-olds is unchanged-is., that the probability of survival in each age cohort has been unchanged since 1955-the old-age dependency ratio would have been 10.1 percent instead of 12.1 percent in 1990, and it would be 20.6 percent instead of 25.8 percent in 2025.
62 Naohiro Yashiro and Akiko Sat0 Oishi
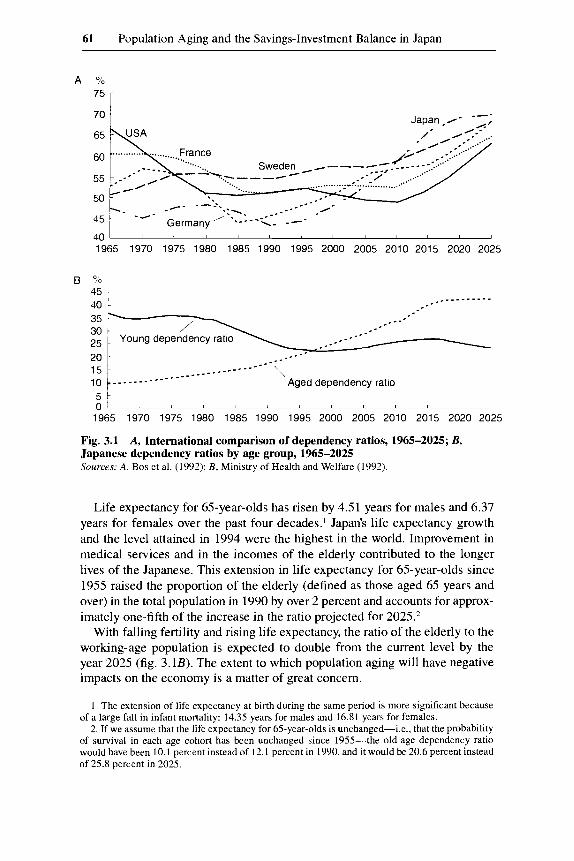
Table 3.1 Projection of the Labor Force (million)
Growth Rate per Annum (%)
Population 1970 1980 1990 2000 2010 1970-1990 1990-2000 2000-2010
Total 51.7 56.7 63.8 67.4 66.0 1.06 0.55 -0.21
Male 31.4 34.8 37.9 39.8 38.5 0.95 0.49 -0.33 Female 20.3 21.9 25.9 27.6 27.5 1.23 0.64 -0.04 Aged 15-24 11.6 7.3 8.3 7.4 5.9 -1.66 -1.14 -2.24 Aged55-64 5.6 6.5 9.3 10.4 11.6 2.57 1.12 1.10
Source; Economic Planning Agency (1991a) Note: Projections beyond the year 1990 are made assuming an increase in the female labor force participation rate.
3.1.2 Decreasing Labor Force The effects of a decrease in the working-age population in Japan will be
partly offset by higher female labor force participation. Japan’s female labor force participation rate was 50.0 percent in 1995, low by international stan- dards. A major characteristic of the female participation rate in Japan is its M- shaped pattern, produced by a sharp decline in women’s participation during their childbearing years, between the ages of 25 and 40. However, the ratio of those who wish to work to those who do not work is highest in this age group, indicating that this will be a large source of labor in the near future. Toward the year 2025, this potential labor force is likely to find work under tightening labor market conditions and will raise the working-age female participation rate.
According to the projection of the Economic Planning Agency (1991a), however, even accounting for higher female labor force participation, the growth rate of the labor force will decline from 1.1 percent per annum in 1970-80 to 0.6 percent on average in the 1990s and will turn negative in the following decade. Beyond the year 2000, the decrease in the male labor force will be more significant, particularly in the younger generation, indicating a rapid change in the structure of the labor force (table 3.1).
3.2 Review of Previous Studies on the Savings-Investment Balance
Several long-term projections of macroeconomic developments in Japan have been made. Some major methods used to project the economic effects of population aging are the Multi-Country Macroeconomic Model, the Neoclassi- cal Model, the Overlapping Generations Model, and the Turnpike Model.3 Al- though the techniques of these models differ widely, how they deal with the
3. For a detailed survey on the impact of demographic changes on long-term trends in the sav- ings rate, see Horioka (1992).
63 Population Aging and the Savings-Investment Balance in Japan
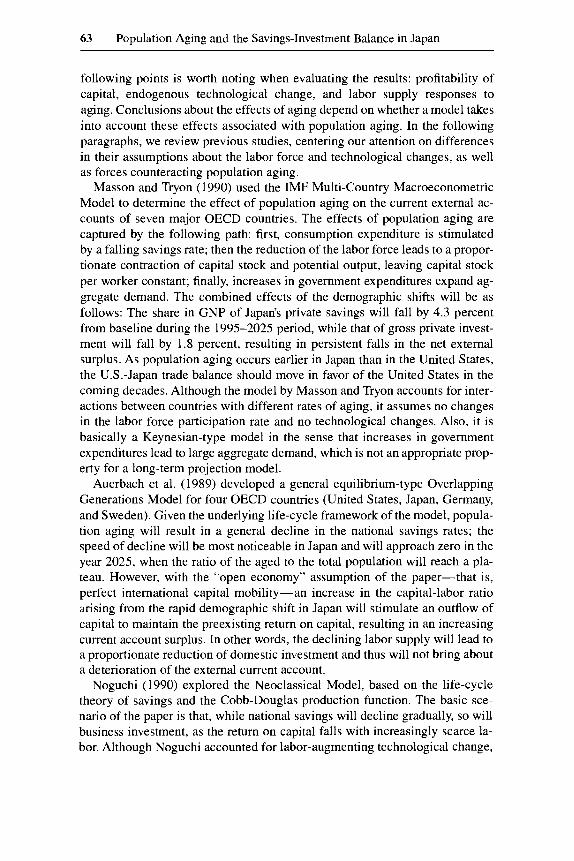
following points is worth noting when evaluating the results: profitability of capital, endogenous technological change, and labor supply responses to aging. Conclusions about the effects of aging depend on whether a model takes into account these effects associated with population aging. In the following paragraphs, we review previous studies, centering our attention on differences in their assumptions about the labor force and technological changes, as well as forces counteracting population aging.
Masson and Tryon (1990) used the IMF Multi-Country Macroeconometric Model to determine the effect of population aging on the current external ac- counts of seven major OECD countries. The effects of population aging are captured by the following path: first, consumption expenditure is stimulated by a falling savings rate; then the reduction of the labor force leads to a propor- tionate contraction of capital stock and potential output, leaving capital stock per worker constant; finally, increases in government expenditures expand ag- gregate demand. The combined effects of the demographic shifts will be as follows: The share in GNP of Japan’s private savings will fall by 4.3 percent from baseline during the 1995-2025 period, while that of gross private invest- ment will fall by 1.8 percent, resulting in persistent falls in the net external surplus. As population aging occurs earlier in Japan than in the United States, the U.S.-Japan trade balance should move in favor of the United States in the coming decades. Although the model by Masson and Tiyon accounts for inter- actions between countries with different rates of aging, it assumes no changes in the labor force participation rate and no technological changes. Also, it is basically a Keynesian-type model in the sense that increases in government expenditures lead to large aggregate demand, which is not an appropriate prop- erty for a long-term projection model.
Auerbach et al. (1989) developed a general equilibrium-type Overlapping Generations Model for four OECD countries (United States, Japan, Germany, and Sweden). Given the underlying life-cycle framework of the model, popula- tion aging will result in a general decline in the national savings rates; the speed of decline will be most noticeable in Japan and will approach zero in the year 2025, when the ratio of the aged to the total population will reach a pla- teau. However, with the “open economy” assumption of the paper-that is, perfect international capital mobility-an increase in the capital-labor ratio arising from the rapid demographic shift in Japan will stimulate an outflow of capital to maintain the preexisting return on capital, resulting in an increasing current account surplus. In other words, the declining labor supply will lead to a proportionate reduction of domestic investment and thus will not bring about a deterioration of the external current account.
Noguchi ( 1990) explored the Neoclassical Model, based on the life-cycle theory of savings and the Cobb-Douglas production function. The basic sce- nario of the paper is that, while national savings will decline gradually, so will business investment, as the return on capital falls with increasingly scarce la- bor. Although Noguchi accounted for labor-augmenting technological change,
64 Naohiro Yashiro and Akiko Sato Oishi
he assumed that the rate will remain unchanged despite the decrease in the labor force. In addition, he did not account for labor supply responses to popu- lation aging in the model. Based on this model, the current external surplus in Japan is expected to remain unchanged through the 1990s, to increase in the 2000-2010 period, and to decline only after the year 2010.
Horioka (1991, 1992) made a single-equation analysis of Japan’s savings rate in conjunction with the age structure of the population and used the estimated regression coefficients to project its future trends. Explanatory variables are the old-age dependency ratio (AGE) and the young-age dependency ratio (DEP), which are the ratios of the population aged 65 years and over and the population aged 19 years and under to the population aged 20-64 years, re- spectively. A major conclusion of Horioka’s projection is that Japan’s private savings ratio (both household and corporate sector) will become negative after the year 2007 with rapid population aging.
The Economic Planning Agency (1991b) published a long-term projection of the Japanese economy based on a Turnpike “optimal growth” ModeL4 The national savings rate will decline gradually, with changes in time preferences due to the demographic shift. Aggregate investment also will decline in the 1990s but will stay at the same level during the 2000-2010 period. These re- sults arise mainly because, based on the assumption of free mobility of labor across industries, the efficiency of labor will improve with increasing labor scarcity, particularly in the service sector, where relative labor productivity is particularly low. As a result, the current external balance will remain a surplus in the 1990s but will sustain a deficit from the year 2000. Given the projected stable growth in labor productivity, the decrease in the labor force will lead directly to a falling rate of economic growth; GDP growth is projected to fall from 4.2 percent in the 1980s to 3.75 percent in the 1990s and 2.75 percent in the period 2000-2010 (Yoshitomi and Yashiro 1992).
Many previous studies agree that both savings and investment ratios to GNP are likely to fall as the population ages and that the relative speed is critical in determining the future path of the current external balance. Although the struc- tures and assumptions of the models discussed above differ significantly, the differences in the projections of savings, investment, and GNP depend on the extent to which these models account for feedback effects of the demo- graphic shifts.
3.3 Feedback Effects of Population Aging
The extent to which key macroeconomic variables, such as labor productiv- ity, savings, and investment, are affected by an aging population and the associ- ated decline in the growth rate of the labor force is crucial in forecasting eco-
4. This is the Multi-Industry Linear Programming Model, which maximizes long-run household consumption subject to labor supply and technological constraints. Capital-labor ratios and input- output coefficients of respective industries are given exogenously, but they change over time, re- flecting technological progress. See Economic Planning Agency (1991b) for details of the model.
65 Population Aging and the Savings-Investment Balance in Japan
nomic performance in the coming decades. Pessimistic views that population aging will greatly discourage the currently high savings and investment rates in Japan are often founded on the historical relationship between savings and investment, on one hand, and demographic changes, on the other. Those studies implicitly assume that both labor force participation and technological change are independent of population aging.
However, past Japanese experiences with oil price hikes in the 1970s and the substantial yen appreciation in the 1980s indicate that the economy readily adapts to external shocks. In this sense, whether or not mechanisms counter- acting external shocks are incorporated in the model will result in an entirely different picture of the coming “aged society” in Japan. As the labor supply becomes scarce with a declining fertility rate, more rapid technological change might be induced, partly offsetting the negative impact of population aging on savings and investment. Thus, treating the labor supply and technological change factors as endogenous rather than exogenous will alter the projections of savings and investment trends.
3.3.1 Alternative Definition of the Elderly The projections for an economy under population aging are often pessimis-
tic because with a decreasing labor force, the old-age dependency ratio will double between 1990 and 2025. However, this pessimistic picture is partly based on the conventional definition of the elderly-those who are 65 years of age or older. The implicit assumption is that the labor force participation rates of older men and women will remain unchanged throughout the aging of soci- ety. This assumption may not be appropriate for Japan’s economy in the com- ing decades.
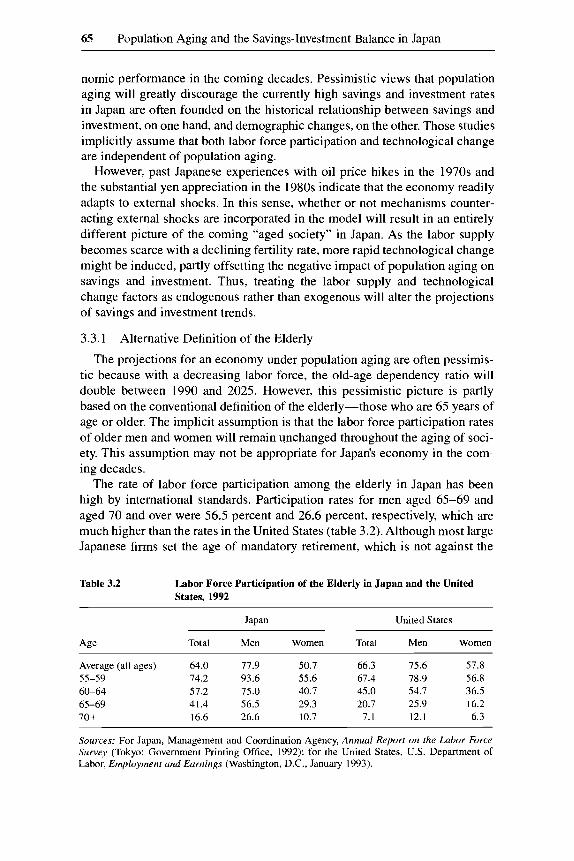
The rate of labor force participation among the elderly in Japan has been high by international standards. Participation rates for men aged 65-69 and aged 70 and over were 56.5 percent and 26.6 percent, respectively, which are much higher than the rates in the United States (table 3.2). Although most large Japanese firms set the age of mandatory retirement, which is not against the
Table 3.2 Labor Force Participation of the Elderly in Japan and the United States, 1992
Japan United States
Total Men Women Total Men Women
Average (all ages) 64.0 77.9 50.7 66.3 75.6 57.8
60-64 57.2 75.0 40.7 45.0 54.7 36.5 65-69 41.4 56.5 29.3 20.7 25.9 16.2 70+ 16.6 26.6 10.7 7.1 12.1 6.3
55-59 74.2 93.6 55.6 67.4 78.9 56.8
Sources: For Japan, Management and Coordination Agency, Annual Report on the Labor Force Survey (Tokyo: Government Printing Office, 1992); for the United States, U.S. Department of Labor, Employmenr und Earnings (Washington, D.C., January 1993).
66 Naohiro Yashiro and Akiko Sato Oishi
- - - - _ _ _ * - - . - - - - - - - - - -- -_ , '*. Male 1992 g o b - --- 80
70
60
50
40
30
Male 1988 ' -- -
-\
~ ~ ~ 1 1 1 , 1 1 , , / , 1 1 , ,
0 55 56 57 58 59 60 61 62 63 64 65 66 67 68 69
Age
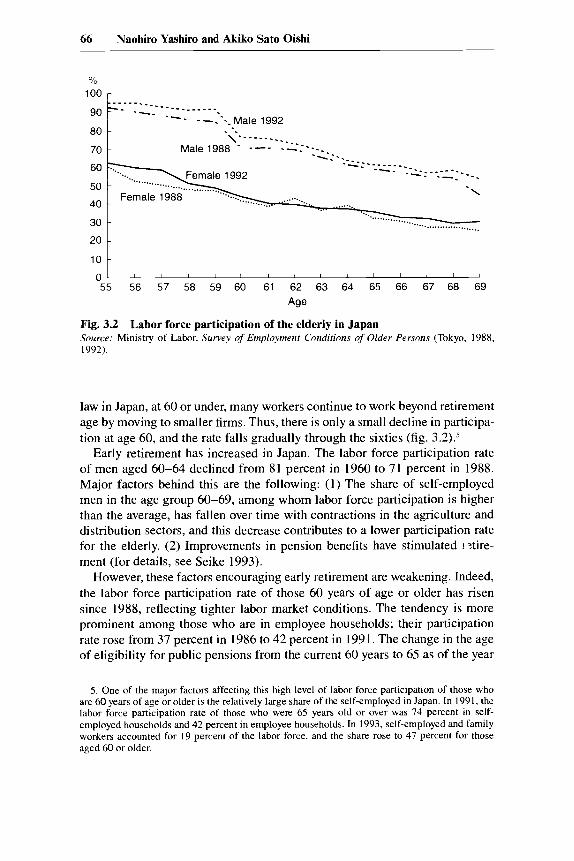
Fig. 3.2 Labor force participation of the elderly in Japan Source: Ministry of Labor, Survey of Employment Conditions of Older Persons (Tokyo, 1988, 1992).
law in Japan, at 60 or under, many workers continue to work beyond retirement age by moving to smaller firms. Thus, there is only a small decline in participa- tion at age 60, and the rate falls gradually through the sixties (fig. 3.2).5
Early retirement has increased in Japan. The labor force participation rate of men aged 60-64 declined from 81 percent in 1960 to 71 percent in 1988. Major factors behind this are the following: (1) The share of self-employed men in the age group 60-69, among whom labor force participation is higher than the average, has fallen over time with contractions in the agriculture and distribution sectors, and this decrease contributes to a lower participation rate for the elderly. (2) Improvements in pension benefits have stimulated I :tire- ment (for details, see Seike 1993).
However, these factors encouraging early retirement are weakening. Indeed, the labor force participation rate of those 60 years of age or older has risen since 1988, reflecting tighter labor market conditions. The tendency is more prominent among those who are in employee households; their participation rate rose from 37 percent in 1986 to 42 percent in 1991. The change in the age of eligibility for public pensions from the current 60 years to 65 as of the year
5. One of the major factors affecting this high level of labor force participation of those who are 60 years of age or older is the relatively large share of the self-employed in Japan. In 1991, the labor force participation rate of those who were 65 years old or over was 74 percent in self- employed households and 42 percent in employee households. In 1993, self-employed and family workers accounted for 19 percent of the labor force, and the share rose to 47 percent for those aged 60 or older.
67 Population Aging and the Savings-Investment Balance in Japan
2000 should aggravate this tendency.6 This is, in a sense, a rational reaction by Japanese employees to their increased life expectancy and is likely to continue during the 1990s.
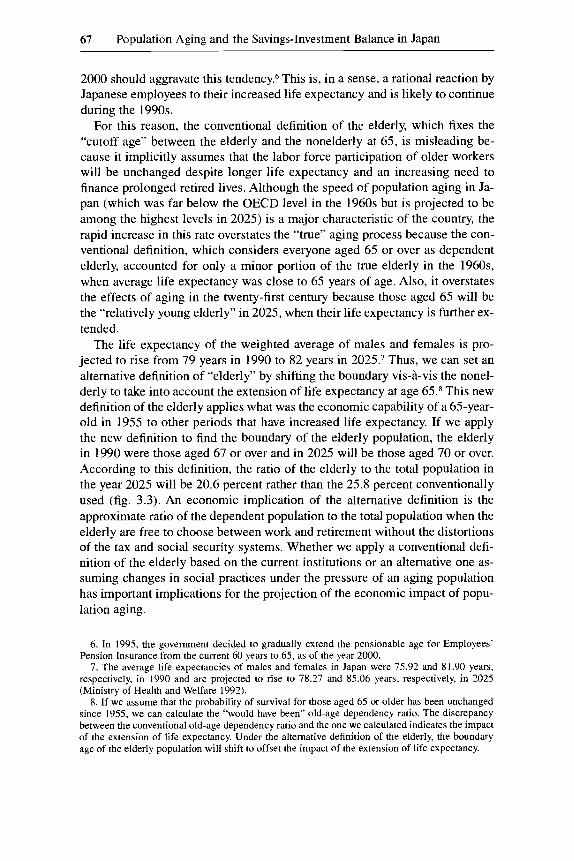
For this reason, the conventional definition of the elderly, which fixes the “cutoff age” between the elderly and the nonelderly at 65, is misleading be- cause it implicitly assumes that the labor force participation of older workers will be unchanged despite longer life expectancy and an increasing need to finance prolonged retired lives. Although the speed of population aging in Ja- pan (which was far below the OECD level in the 1960s but is projected to be among the highest levels in 2025) is a major characteristic of the country, the rapid increase in this rate overstates the “true” aging process because the con- ventional definition, which considers everyone aged 65 or over as dependent elderly, accounted for only a minor portion of the true elderly in the 1960s, when average life expectancy was close to 65 years of age. Also, it overstates the effects of aging in the twenty-first century because those aged 65 will be the “relatively young elderly” in 2025, when their life expectancy is further ex- tended.
The life expectancy of the weighted average of males and females is pro- jected to rise from 79 years in 1990 to 82 years in 2025.7 Thus, we can set an alternative definition of “elderly” by shifting the boundary vis-8-vis the nonel- derly to take into account the extension of life expectancy at age 65.8 This new definition of the elderly applies what was the economic capability of a 65-year- old in 1955 to other periods that have increased life expectancy. If we apply the new definition to find the boundary of the elderly population, the elderly in 1990 were those aged 67 or over and in 2025 will be those aged 70 or over. According to this definition, the ratio of the elderly to the total population in the year 2025 will be 20.6 percent rather than the 25.8 percent conventionally used (fig. 3.3). An economic implication of the alternative definition is the approximate ratio of the dependent population to the total population when the elderly are free to choose between work and retirement without the distortions of the tax and social security systems. Whether we apply a conventional defi- nition of the elderly based on the current institutions or an alternative one as- suming changes in social practices under the pressure of an aging population has important implications for the projection of the economic impact of popu- lation aging.
6. In 1995, the government decided to gradually extend the pensionable age for Employees’ Pension Insurance from the current 60 years to 65, as of the year 2000.
7. The average life expectancies of males and females in Japan were 75.92 and 81.90 years, respectively, in 1990 and are projected to rise to 78.27 and 85.06 years, respectively, in 2025 (Ministry of Health and Welfare 1992).
8. If we assume that the probability of survival for those aged 65 or older has been unchanged since 1955, we can calculate the “would have been” old-age dependency ratio. The discrepancy between the conventional old-age dependency ratio and the one we calculated indicates the impact of the extension of life expectancy. Under the alternative definition of the elderly, the boundary age of the elderly population will shift to offset the impact of the extension of life expectancy.
68 Naohiro Yashiro and Akiko Sat0 Oishi
25
20
15
10
5 -
%
30 I -
- Conventional definition
-
- Alternative definition
. - - - - - - - - - - . 20.6
25.8
01 " " " l l i i , I I I I I 1 1 I I , l l l i l l i , 1 , ( 1 1 1 1 1 1 1 1 1 1 , 1 1 1 1 1 1 1 1 1 1 1 1 1 1 1 1 1 1 1 1 l u l l l j
1955 1965 1975 1985 1995 2005 2015 2025
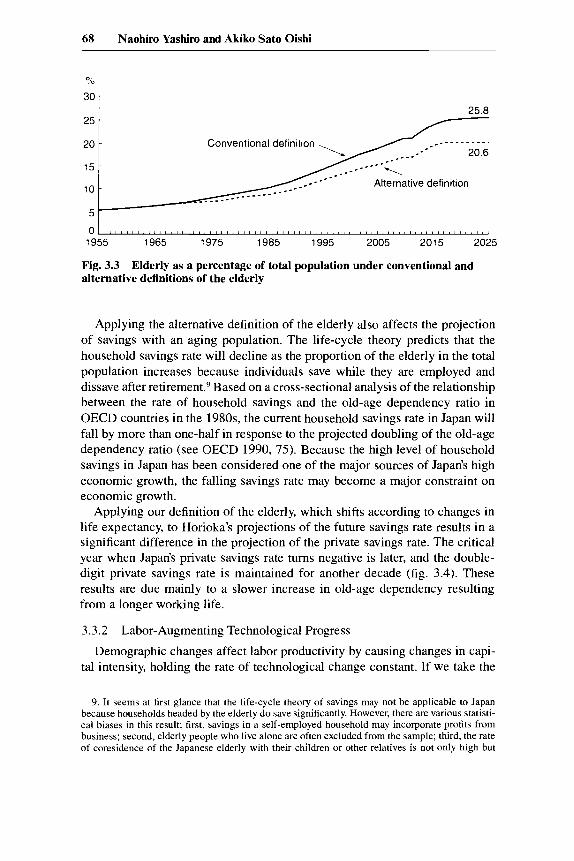
Fig. 3.3 Elderly as a percentage of total population under conventional and alternative definitions of the elderly
Applying the alternative definition of the elderly also affects the projection of savings with an aging population. The life-cycle theory predicts that the household savings rate will decline as the proportion of the elderly in the total population increases because individuals save while they are employed and dissave after retirement.9 Based on a cross-sectional analysis of the relationship between the rate of household savings and the old-age dependency ratio in OECD countries in the 1980s, the current household savings rate in Japan will fall by more than one-half in response to the projected doubling of the old-age dependency ratio (see OECD 1990,75). Because the high level of household savings in Japan has been considered one of the major sources of Japan's high economic growth, the falling savings rate may become a major constraint on economic growth.
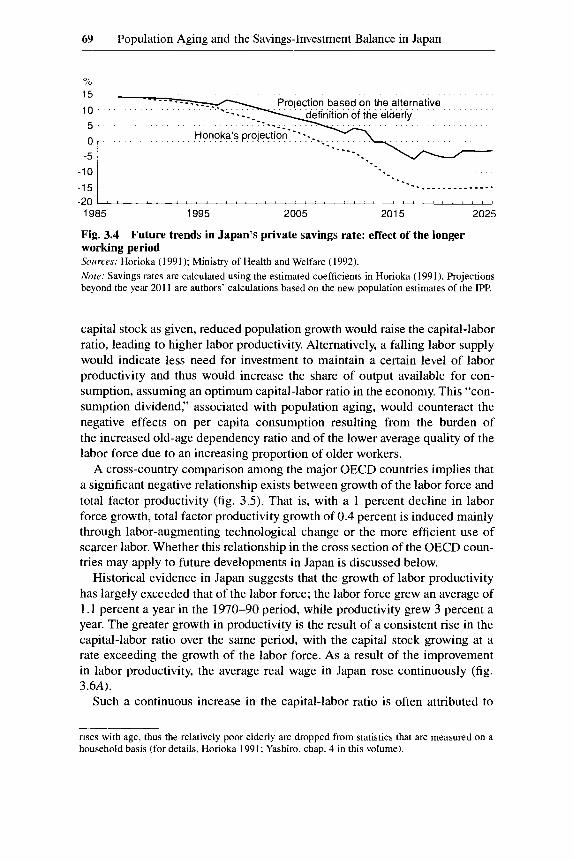
Applying our definition of the elderly, which shifts according to changes in life expectancy, to Horioka's projections of the future savings rate results in a significant difference in the projection of the private savings rate. The critical year when Japan's private savings rate turns negative is later, and the double- digit private savings rate is maintained for another decade (fig. 3.4). These results are due mainly to a slower increase in old-age dependency resulting from a longer working life.
3.3.2 Labor-Augmenting Technological Progress Demographic changes affect labor productivity by causing changes in capi-
tal intensity, holding the rate of technological change constant. If we take the
9. It seems at first glance that the life-cycle theory of savings may not be applicable to Japan because households headed by the elderly do save significantly. However, there are various statisti- cal biases in this result: first, savings in a self-employed household may incorporate profits from business; second, elderly people who live alone are often excluded from the sample; third, the rate of coresidence of the Japanese elderly with their children or other relatives is not only high but
69 Population Aging and the Savings-Investment Balance in Japan
15
10
5 -
0 -
-5
-10
-1 5 -20
Projection based on the alternative
.-------_-----. -. --. " ' ' ' ' ' ' ~ ' 1 ' 1 1 1 ' 1 8 ' 1 1 I t 1 8 I ' ' ' " ~ ' ' I ' " ' 1
capital stock as given, reduced population growth would raise the capital-labor ratio, leading to higher labor productivity. Alternatively, a falling labor supply would indicate less need for investment to maintain a certain level of labor productivity and thus would increase the share of output available for con- sumption, assuming an optimum capital-labor ratio in the economy. This "con- sumption dividend," associated with population aging, would counteract the negative effects on per capita consumption resulting from the burden of the increased old-age dependency ratio and of the lower average quality of the labor force due to an increasing proportion of older workers.
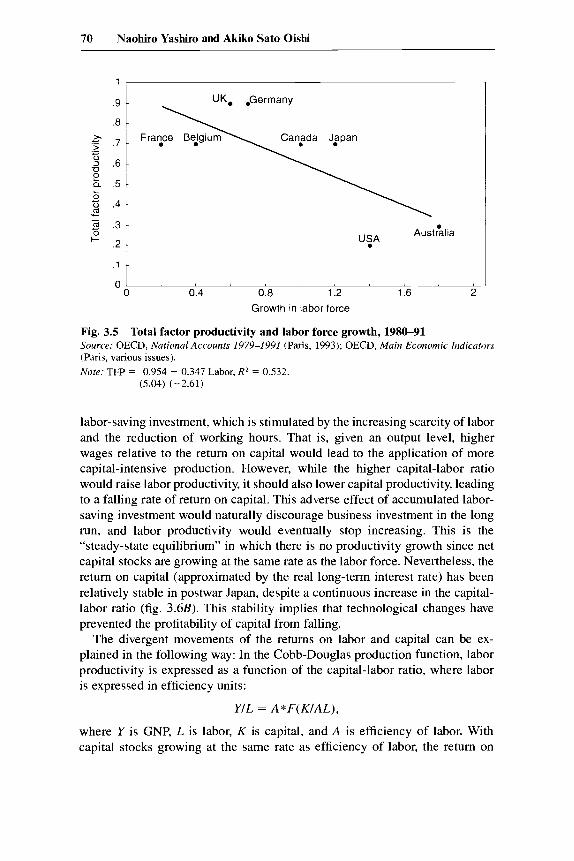
A cross-country comparison among the major OECD countries implies that a significant negative relationship exists between growth of the labor force and total factor productivity (fig. 3.5). That is, with a 1 percent decline in labor force growth, total factor productivity growth of 0.4 percent is induced mainly through labor-augmenting technological change or the more efficient use of scarcer labor. Whether this relationship in the cross section of the OECD coun- tries may apply to future developments in Japan is discussed below.
Historical evidence in Japan suggests that the growth of labor productivity has largely exceeded that of the labor force; the labor force grew an average of 1.1 percent a year in the 1970-90 period, while productivity grew 3 percent a year. The greater growth in productivity is the result of a consistent rise in the capital-labor ratio over the same period, with the capital stock growing at a rate exceeding the growth of the labor force. As a result of the improvement in labor productivity, the average real wage in Japan rose continuously (fig. 3.6A).
Such a continuous increase in the capital-labor ratio is often attributed to
rises with age, thus the relatively poor elderly are dropped from statistics that are measured on a household basis (for details, Horioka 1991; Yashiro, chap. 4 in this volume).
70 Naohiro Yashiro and Akiko Sato Oishi
x f .7 ._ c 0
u 0
3 .6
h .5 ?5 t; .4
- m .3 m c -
. 2 .
.1
0
-
-
-
- -
USA AustGlia
-
Fig. 3.5 Total factor productivity and labor force growth, 1980-91 Source: OECD, National Accounts 1979-1 991 (Paris, 1993); OECD, Main Economic Iiidicntors (Paris, various issues). Note: TFP = 0.954 - 0.347 Labor, R’ = 0.532.
(5.04) (-2.61)
labor-saving investment, which is stimulated by the increasing scarcity of labor and the reduction of working hours. That is, given an output level, higher wages relative to the return on capital would lead to the application of more capital-intensive production. However, while the higher capital-labor ratio would raise labor productivity, it should also lower capital productivity, leading to a falling rate of return on capital. This adverse effect of accumulated labor- saving investment would naturally discourage business investment in the long run, and labor productivity would eventually stop increasing. This is the “steady-state equilibrium” in which there is no productivity growth since net capital stocks are growing at the same rate as the labor force. Nevertheless, the return on capital (approximated by the real long-term interest rate) has been relatively stable in postwar Japan, despite a continuous increase in the capital- labor ratio (fig. 3.6B). This stability implies that technological changes have prevented the profitability of capital from falling.
The divergent movements of the returns on labor and capital can be ex- plained in the following way: In the Cobb-Douglas production function, labor productivity is expressed as a function of the capital-labor ratio, where labor is expressed in efficiency units:
YIL = A * F ( K / A L ) ,
where Y is GNP, L is labor, K is capital, and A is efficiency of labor. With capital stocks growing at the same rate as efficiency of labor, the return on

71 Population Aging and the Savings-Investment Balance in Japan
A 350
300
250
200
150
100
50
n
(1 960=100) 150
140
130
120
110
100
90
80 1951 53 55 57 59 61 63 65 67 69 71 73 75 77 79 81 83 85 87 89 91
Year
B
1952 54 56 58 60 62 64 66 68 70 72 74 76 78 80 82 84 86 88 90 92 Year
Fig. 3.6 A, Change of real wage in Japan and the United States; B, Return on capital in Japan and the United States Source: Shimpo (1991, 160-61).
72 Naohiro Yashiro and Akiko Sat0 Oishi
capital would be at the steady-state level. Whereas labor productivity in effi- ciency units would be stable, the return on labor would increase at a rate equiv- alent to changes in labor efficiency. Thus, the historical movements of real wages and profitability of capital in Japan can be fully explained by the intro- duction of labor-augmenting technological progress.
The existence of labor-augmenting technological change does not necessar- ily indicate causality vis-a-vis changes in the labor supply associated with demographic shifts. On the one hand, given technological change, the labor supply may be adjusted to maintain the rate of real wage increase at the histori- cal average, The fact that working hours fell most dramatically in the period when wage growth was high with tightening labor market conditions may sup- port this view. On the other hand, labor-augmenting technological change may be induced by a decline in the labor supply. The relative importance of these mechanisms can only be assessed empirically.
There are contradicting views regarding the effects of the demographic shift on technological change in the coming decades. The pessimistic school holds that the growth of business investment is likely to slow as the population ages because a society with a larger proportion of older people loses some of its dynamism, and the slower population growth and the lackluster consumption market will discourage innovation (see Cutler et al. 1990). By contrast, the optimistic school argues that an increasing labor shortage accompanying the aging process will stimulate incentives to use more efficiently existing human resources, particularly older and female workers, who have been assigned somewhat peripheral roles under current Japanese employment practices.
3.4 Empirical Studies
3.4.1 Structure of the Model
The model consists of equations for savings, investment, labor productivity, and the long-term interest rate, which are estimated by ordinary least squares and are based on annual data from 1958-92. The exogenous variables are pop- ulation and its age composition. The rate of inflation during the simulation period is assumed to be 1.7 percent a year, which is the average for the period
The ratio of savings to GNP is a function of the young-age and old-age dependency ratios and of real per capita GNP growth, which is based on Horio- ka’s (1991) formulation (see below for details). The ratio of business invest- ment to GNP is a Solow-type formulation based on the growth of the working- age population (20-64 years of age) and the interest rate, which is a proxy for the return on capital. Labor productivity is expressed as a function of the capital-labor ratio. The long-term interest rate is determined by changes in the savings-investment balance. A detailed explanation of each equation follows.
1980-92.
73 Population Aging and the Savings-Investment Balance in Japan
Savings
The savings function is based on a modified life-cycle model, explaining the national savings rate by old-age and young-age dependency ratios and per cap- ita economic growth. Also, the life cycle model is applied to the national sav- ings rate, instead of the household savings rate. This is based on the assumption that households consider their savings substitutable for those of the corporate and government sectors, which is an awkward assumption in the short run but less so in long-term projections. Higher income growth raises the savings rate mainly because savings for future consumption are considered a “luxury good” and the capacity to save increases with income level. Savings are in gross terms, including depreciation of corporate and housing stocks. This may not be appropriate for examining the international comparison of savings rates per se, as already pointed out by Horioka (1991), but our major interest here is to focus on the savings-investment balance in the conventional definition, which is consistent with the current external balance.
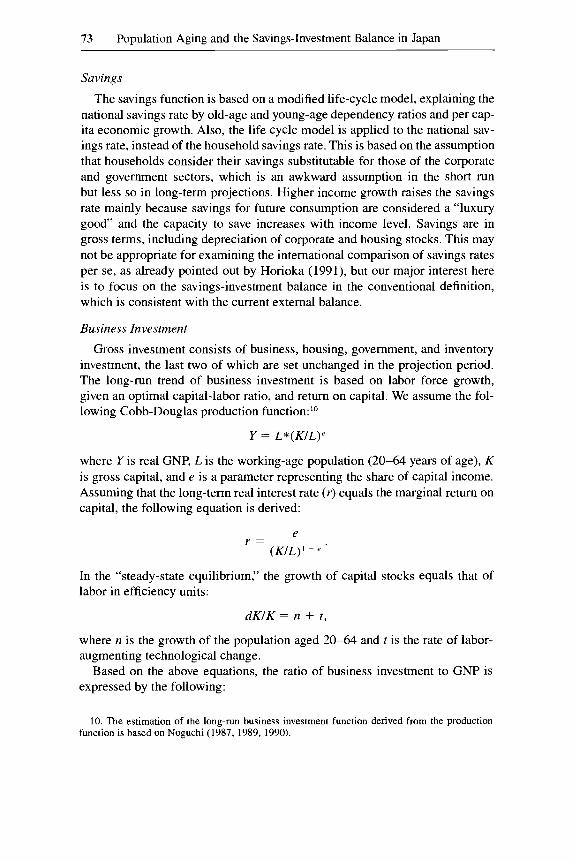
Business Investment
Gross investment consists of business, housing, government, and inventory investment, the last two of which are set unchanged in the projection period. The long-run trend of business investment is based on labor force growth, given an optimal capital-labor ratio, and return on capital. We assume the fol- lowing Cobb-Douglas production function:1°
Y = L*(K/L)‘
where Y is real GNP, L is the working-age population (20-64 years of age), K is gross capital, and e is a parameter representing the share of capital income. Assuming that the long-term real interest rate (r) equals the marginal return on capital, the following equation is derived:
e ( K / L ) ’ ~
r =
In the “steady-state equilibrium,” the growth of capital stocks equals that of labor in efficiency units:
dKIK = n + t ,
where n is the growth of the population aged 20-64 and t is the rate of labor- augmenting technological change.
Based on the above equations, the ratio of business investment to GNP is expressed by the following:
10. The estimation of the long-run business investment function derived from the production function is based on Noguchi (1987. 1989, 1990).
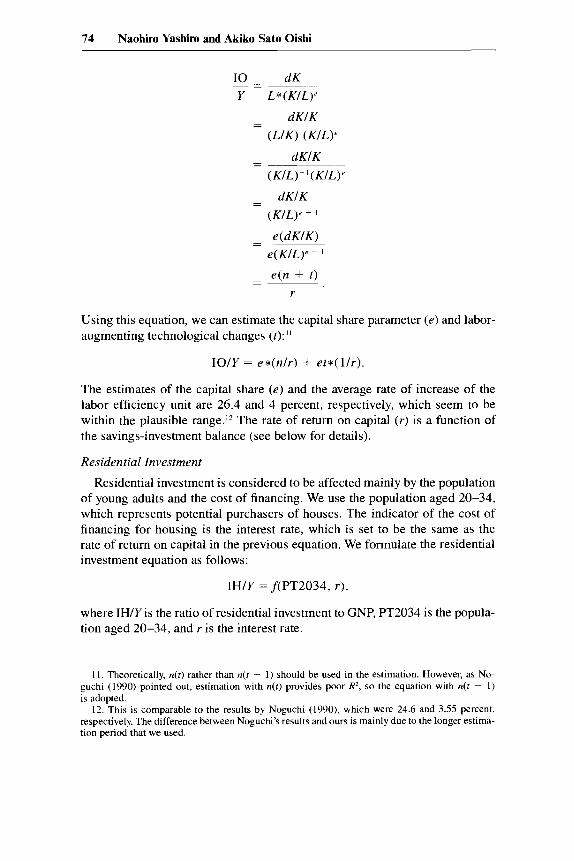
74 Naohiro Yashiro and Akiko Sat0 Oishi
- dKIK - (LIK) (KIL)'
dKIK
(KIL) ~ I ( KIL)'
(KIL)' - I
- e(dKIK)
e(K/L)' - I
- - ~~~~~~
- dKIK -
- -
- e (n + t ) -
r
Using this equation, we can estimate the capital share parameter ( e ) and labor- augmenting technological changes ( t ) : II
IOIY = e a ( n / r ) + e t* ( l / r ) .
The estimates of the capital share ( e ) and the average rate of increase of the labor efficiency unit are 26.4 and 4 percent, respectively, which seem to be within the plausible range.12 The rate of return on capital ( r ) is a function of the savings-investment balance (see below for details).
Residential Investment
Residential investment is considered to be affected mainly by the population of young adults and the cost of financing. We use the population aged 20-34, which represents potential purchasers of houses. The indicator of the cost of financing for housing is the interest rate, which is set to be the same as the rate of return on capital in the previous equation. We formulate the residential investment equation as follows:
IHIY = f(PT2034, r ) ,
where IHIY is the ratio of residential investment to GNP, PT2034 is the popula- tion aged 20-34, and r is the interest rate.
11. Theoretically, n(r) rather than n( t - 1) should be used in the estimation. However, as No- guchi (1990) pointed out, estimation with n(r) provides poor R', so the equation with n(r - 1) is adopted.
12. This is comparable to the results by Noguchi (1990), which were 24.6 and 3.55 percent, respectively. The difference between Noguchi's results and ours is mainly due to the longer estima- tion period that we used.
75 Population Aging and the Savings-Investment Balance in Japan
Interest Rate
Many previous studies assumed that interest rates are exogenous in long- term projections based on the “small country” model. However, Japan is no longer a small country, particularly in international financial markets, and the decline in Japan’s net capital exports should affect both domestic and world interest rates. In our model, the interest rate is set as a function of net external surplus in Japan; thus, the excess savings over investment (i.e., the current ex- ternal surplus) tends to lower the interest rate. Historical evidence implies that an increase in the net external surplus of 1 percent of GNP translates into a 0.55 percent decline in the long-term interest rate. This interest rate function constitutes one of the feedback mechanisms in our model, where excess invest- ment over savings raises the interest rate to discourage domestic investment, thereby restoring the equilibrium.
3.4.2 Simulation Results The major results of the estimated equations and their explanations are sum-
marized in the appendix. These equations do not necessarily track the fluctua- tions in the actual variables, reflected in low Durbin-Watson statistics, mainly because these are very simple equations neglecting several important variables explaining cyclical fluctuations. However, a major aim of this model is to ex- plain the long-run trends of savings and investment and to see the net effects of changes in the assumptions or in exogenous variables, rather than pin- pointing the economic growth rates or savings rates in a particular year, as we would do in short-term projections. In addition, including many economic variables would require projections of their long-term changes, which causes various difficulties. Using population variables, estimates of which are avail- able up to the year 2025 and are on average more reliable than long-term pro- jections of other economic variables, avoids this problem to some extent. For the projection of the population and its age structure, we use the medium esti- mates by the IPP, mainly to compare the results of our simulation with those in earlier studies.
These equations are solved simultaneously to maintain consistency between the interactions of the variables. When we use these estimated equations for long-term projections, several procedures concerning the labor supply and labor-augmenting technological change are included. Many previous studies took these economic variables to be unchanged despite the rapid pace of popu- lation aging. However, treating these key variables as exogenous often leads to “extreme results,” mainly due to the lack of adjustment mechanisms in the projection period. In the following sections, major simulation results based on the above model are shown (table 3.3) . Care must be taken in interpreting the results because the “baseline case” here is not the most plausible one, as in most other macroeconomic simulations. On the contrary, here “baseline” indi-
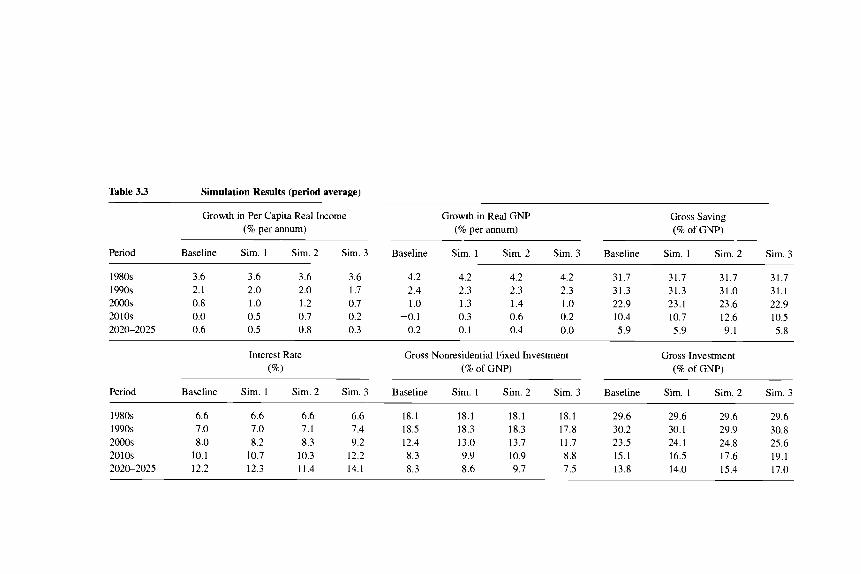
Table 3.3 Simulation Results (period average)
Growth in Per Capita Real Income Growth in Real GNP Gross Saving (% per annum) (% per annum) (% of GNP)
Period Baseline Sim. 1 Sim. 2 Sim. 3 Baseline Sim. 1 Sim. 2 Sim. 3 Baseline Sim. 1 Sim. 2 Sim. 3
1980s 3.6 3.6 3.6 3.6 4.2 4.2 4.2 4.2 31.7 31.7 31.7 31.7 1990s 2.1 2.0 2.0 1.7 2.4 2.3 2.3 2.3 31.3 31.3 31.0 31.1 2000s 0.8 1 .o 1.2 0.7 1 .o 1.3 1.4 1 .O 22.9 23.1 23.6 22.9 2010s 0.0 0.5 0.7 0.2 -0.1 0.3 0.6 0.2 10.4 10.7 12.6 10.5 2020-2025 0.6 0.5 0.8 0.3 0.2 0.1 0.4 0.0 5.9 5.9 9.1 5.8
Interest Rate Gross Nonresidential Fixed Investment Gross Investment (%) (% of GNP) (% of GNP)
Period Baseline Sim. 1 Sim. 2 Sim. 3 Baseline Sim. 1 Sim. 2 Sim. 3 Baseline Sim. 1 Sim. 2 Sim. 3
1980s 6.6 6.6 6.6 6.6 18.1 18.1 18.1 18.1 29.6 29.6 29.6 29.6 1990s 7.0 7.0 7.1 7.4 18.5 18.3 18.3 17.8 30.2 30.1 29.9 30.8 2000s 8.0 8.2 8.3 9.2 12.4 13.0 13.7 11.7 23.5 24.1 24.8 25.6 2010s 10.1 10.7 10.3 12.2 8.3 9.9 10.9 8.8 15.1 16.5 17.6 19.1 2020-2025 12.2 12.3 11.4 14.1 8.3 8.6 9.7 7.5 13.8 14.0 15.4 17.0
Saving-Investment Balance Growth in Working Population (8 of GNP) (8 of GNP) RetireWorking Population
Period Baseline Sim. 1 Sim. 2 Sim. 3 Baseline Sim. I Sim. 2 Sim. 3 Baseline Sim. 1 Sim. 2 Sim. 3 ~~ ~ ~~ ~
1980s 2.2 2.2 2.2 2.2 0.8 0.8 0.9 0.9 0.168 0.168 0.168 0.168 1990s 1.1 1.2 1 . 1 0.2 0.4 0.4 0.6 0.6 0.230 0.230 0.185 0.221 2000s -0.6 -1.0 -1.2 -2.8 -0.5 -0.5 -0.4 -0.4 0.317 0.317 0.243 0.299 2010s -4.7 -5.8 -5.0 -8.6 -0.9 -0.9 -0.7 -0.7 0.428 0.428 0.317 0.395 2020-2025 -7.9 -8.1 -6.4 -11.2 -0.2 -0.2 0.0 0.0 0.479 0.479 0.346 0.436
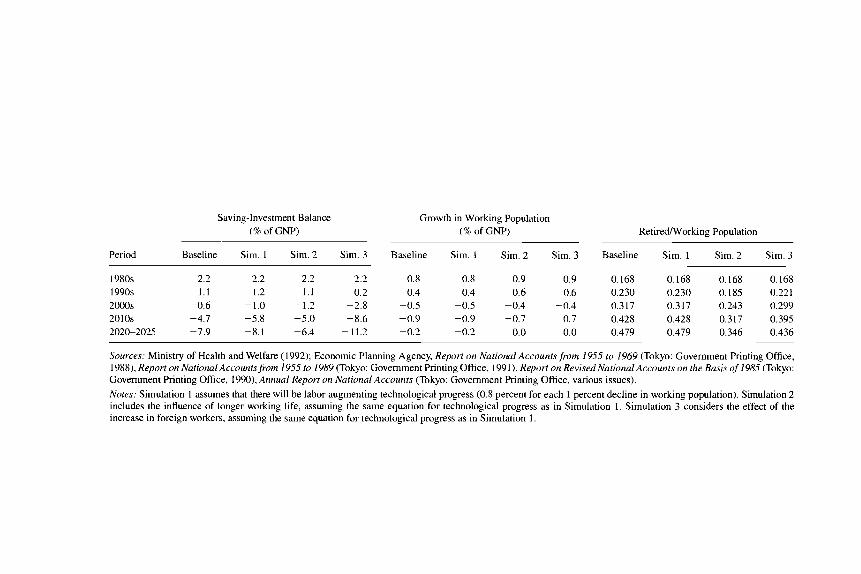
Sources: Ministry of Health and Welfare (1992); Economic Planning Agency, Report on National Accountsfrom 1955 to 1969 (Tokyo: Government Printing Office, 19881, Report on National Accountsfrom 1955 to 1989 (Tokyo: Government Printing Office, 1991), Report on Revised National Accounts on the Basis of 1985 (Tokyo: Government Printing Office, 1990), Annual Report on National Accounts (Tokyo: Government Printing Office, various issues). Notes; Simulation 1 assumes that there will be labor-augmenting technological progress (0.8 percent for each 1 percent decline in working population). Simulation 2 includes the influence of longer working life, assuming the same equation for technological progress as in Simulation 1. Simulation 3 considers the effect of the increase in foreign workers, assuming the same equation for technological progress as in Simulation 1.
78 Naohiro Yashiro and Akiko Sat0 Oishi
cates conventional cases applied in previous studies, which often report ex- treme results for their projections. We consider simulation case 2 to show the most plausible picture because it takes into account various counteracting ef- fects that would be induced as a result of population aging.
Baseline Projection
The major characteristics of the baseline projection using conventional methods are as follows: First, the projected national savings ratio will fall with a sharply increasing dependency ratio and slower economic growth. While the savings ratio will decline only slightly during the 1990s (from an average of 3 1.7 percent in the 1980s to 3 1.3 percent in the 1990s), it will start to decline rapidly after the year 2000 and reach a historical low after the year 2020 (the baseline case in table 3.3). This baseline projection of the national savings ratio is basically consistent with that of Horioka because both are based on the conventional definition of the elderly (65 years of age and over).'?
Second, the fall in the ratios of business investment and national savings to GNP in the baseline projection is due to the following factor: the decline in the labor supply beyond the year 2000 with no offsetting movements in techno- logical change should lower the amount of capital needed to maintain the opti- mum capital-labor ratio. Because the decline in the investment rate will be less rapid than that in the savings rate, the external account will show a deficit beyond the year 2000, and the deficit will continue to widen, mainly as a result of the sharp decline in the savings rate.
Third, the widening current external deficit will boost interest rates to absorb foreign capital so that it can be financed. Even if we assume that these huge inflows of foreign capital are sustainable, GNP in real terms will begin declin- ing after the year 2010. This rather unrealistic situation often leads to the pessi- mistic view that the current excellent macroeconomic performance in Japan cannot be sustained under population aging.
Alternative Simulation5
The above picture of population aging will be modified by introducing en- dogenous labor-augmenting technological progress and increases in the elderly labor supply. First, accounting for labor-augmenting technological change in simulation 1 would stimulate investment. We assume that the past relationship in Japanese industries, in which a 1 percent decline in labor supply has induced a 0.8 percent increase in labor prod~ctivity, '~ after accounting for an increase
13. Care must be taken when comparing the results of our baseline projection with those of Horioka's in the following two points: First, our baseline projection is on the national savings rate, while Horioka's published one is on the private savings rate, excluding government savings. Sec- ond, our results are based on simultaneous equations of savings, investment, labor productivity, and so on, while Horioka's are based on a single equation.
14. This is based on the following equation using cross-sectional data for 21 industries on the average labor productivity growth between 1961 and 1990 for six periods:
79 Population Aging and the Savings-Investment Balance in Japan
in capital stocks and initial productivity level, will basically hold in coming decades.Is As the increase in capital stocks and initial differences in productiv- ity levels by industry are accounted for, this increase in labor productivity is approximated as labor-augmenting technological change, which is induced by the scarcity of labor. With the assumption of endogenous technological change, the investment ratio will fall more moderately through the 1990s and beyond, with higher growth in labor productivity and GNP.
Second, the sharp fall in the national savings ratio in the baseline projection depends critically on how the elderly population, a key explanatory variable for the savings equation, is defined. In other words, this baseline projection is limited to the case in which the elderly’s working years remain unchanged despite the extension of their life expectancy. In simulation 2, we apply an alternative definition of the elderly in which the cutoff age between work- ing population and elderly shifts upward as life expectancy increases. In this case, it is assumed that people will adjust their working years in anticipation of longer life expectancy. Thus, the old-age dependency ratio will rise more slowly (see fig. 3.3), and the decline in the working population will be offset by about 26 percent due to this increase in the labor force throughout the pro- jection period. With the additional labor supply and the smaller size of the retired population, the national savings ratio will fall more gradually, resulting in a national savings rate of 9.1 percent rather than 5.9 percent for the period 2020-25. This result is more reasonable than the baseline projection in the sense that the effects from tightening labor market conditions and improve- ments in the health, educational attainment, and skills of the elderly are ac- counted for.lh Also, the projected deficit in the current external account will be less drastic, and the interest rate levels needed to finance the external deficit will be lower than in the baseline projection.
Third, we simulate the effects of an increase in the labor supply through the importation of foreign workers, which is often suggested as an alternative means to offset the negative impacts of population aging. In simulation 3, the
In(Y/L) = -2.150 - 0.817 InL + 0.056 In(Y*/L*) + 0.420 InK,
R = 0.583, (-9.246)(-9.078! (4.042) (3.839)
where Y is real GNP, K is capital, and L is labor. An asterisk indicates the initial period. 15. The ratio of induced labor-augmenting technological change may well be overestimated, as
it includes the autonomous improvement in quality of labor and capital in the past. Also, the possibility of an increase in foreign direct investment induced by a labor shortage is not accounted for. However, the rationale behind this assumption of continuous labor-augmenting technological change toward the year 2025 is that there is still plenty of room for improving labor productivity in Japanese industries, particularly in the service sector; thus, the reduction in the labor supply is likely to improve average labor productivity, as we see in the cases of major European countries.
16. The rate of college enrollment, including junior colleges, has been at a plateau of 40 percent since the late 1970s. Assuming a constant enrollment rate at the present level in the coming de- cades, the share of college graduates in the total population will nse from the current 20 percent to 40 percent.
80 Naohiro Yashiro and Akiko Sat0 Oishi
number of foreign workers is assumed to be equivalent to the number of addi- tional older workers in simulation 2, simply to compare the result^.'^ In this case, although the additional supply of workers is the same as in simulation 2, the ratio of the retired population to the working population will be higher because older workers will have to compete for job opportunities with foreign workers and some of them will be driven out of the labor market. In addition, foreign workers are assumed to transfer their savings to their home country, resulting in a lower national savings rate than in simulation 2. This effect is measured by not counting additional foreign workers in the savings equation. Major implications from this simulation are that, although importing foreign workers will partly relieve the labor shortage, a higher old-age dependency ratio will reduce national savings, leading to a rise in the interest rate.
Finally, if we modify the model by fixing the real interest rate for the projec- tion period at 5 percent, the net external deficit beyond the year 2015 will expand to unrealistically high levels. This result indicates the importance of the feedback channel, which prevents the widening of savings-investment im- balances arising from decreasing national savings.
3.5 Policy Implications
Although major challenges to the Japanese economy will result from the shrinking labor force and the increasing share of the elderly in the total popula- tion in the coming decades, they can be overcome with appropriate policies. The major policy implications of the above simulations follow.
First, the key to overcoming the increasing labor shortage in the coming “aged society” is to stimulate labor-augmenting technological change. Average labor productivity in Japanese industry (GDP per person employed), measured at purchasing power parity in 1990, is still lower than that of the United States by 26 percent and lower than that of France and Germany by 28 and 12 percent, respectively. Accounting for differences in working hours further increases the gap between Japan and other countries (Japan Productivity Center 1992). With the low level of average labor productivity in Japan, there is much room to improve the efficiency of the existing labor force, particularly in the service sector. In addition, the quality of the labor force will continuously improve through the 2010s as long as the current high level of college enrollment is maintained. Relaxing regulations that keep excess labor in less efficient sectors of the economy would be an effective policy to stimulate labor-augmenting technological change.18 In this respect, the further opening of the domestic
17. The accumulated increase in the working-age population from the baseline case in 2025 would be 6.9 million (5 percent of the total population).
18. An example of restricting competition in the distribution sector is the Large Scale Retailer Law, which de facto requires supermarkets and department stores to obtain the agreement of small retailers in the neighborhood in order to open or to extend operating hours. The law effectively deters new entries, and rescinding it should improve the efficiency of the distribution sector.
81 Population Aging and the Savings-Investment Balance in Japan
market to foreign firms, raising the ratio of manufactured imports to GNP, is an important way to stimulate competition with Japanese firms, as well as import foreign labor in the form of foreign manufactured products. I y
Second, the higher labor force participation and longer working life of the elderly will be important factors in determining the growth of the labor force and savings rate in the coming decades. Current labor market institutions and practices have important implications in this respect. In Japan, most large firms set the mandatory retirement age at 60 years, although reemployment is pos- sible for a few additional years. “Retirement” in Japan does not necessarily mean withdrawal from the labor market; it often means a move to a different firm at lower wages and with less favorable working conditions. Indeed, the rate of unemployment is particularly high in the 55-64 age group.2”
There are two ways to cope with the problem of unemployment in this age group. One is by extending the mandatory retirement age, particularly since the pensionable age for Employees’ Public Insurance is to be raised to 65 years. However, with a continuously rising share of older workers in the labor market, an increase in wage costs under the seniority-based wage structure will be inevitable, leading to the letting go of older workers even before the current mandatory retirement age.21 Another solution is to modify Japanese employ- ment practices so that they accommodate increasing mobility across firms. Be- cause mandatory retirement is an inevitable consequence of rigid employment security and the seniority-based wage structure, measures to mobilize the ex- isting labor force would increase efficiency in Japanese labor markets, particu- larly for older workers.
In summary, although the rapidly proceeding aging of the Japanese popu- lation is a major challenge to the Japanese economy, its negative impacts on savings and investment can be largely reduced by stimulating labor- augmenting technological change and extending the working life of the elderly. Projections of the Japanese economy differ largely depending on whether these forces offsetting population aging are accounted for. Many previous stud- ies neglecting these counteracting effects produced a pessimistic picture of Japan’s economy under population aging, but if appropriate policies are imple- mented the future need not be dark.
19. Assuming that capital-labor ratios in the 13 Japanese manufacturing industries were fixed at their 1960 levels, the increase in the import ratio (manufactured imports to value-added imports) in the respective industries between 1960 and 1990 should have reduced the demand for labor by 1.26 million workers (9.6 percent of total manufacturing employment) through an increase in imports from labor-intensive industries and a relative decline in the share of those industries in total manufacturing.
20. While the average rate of unemployment in Japan was 2.1 percent in 1992, that in the elderly group was particularly high; the rate of unemployment for men in the 55-64 age group was 3.2 percent. Unemployment rates of the elderly are higher than those of youth, which is a cause of friction in Japan.
21. One way to let go of employees before the mandatory retirement age is to transfer them to subsidiary companies by order of the parent company. Another is to encourage them to quite volun- tarily by offering large lump-sum severance payments (for details, see Seike 1993).
82 Naohiro Yashiro and Akiko Sat0 Oishi
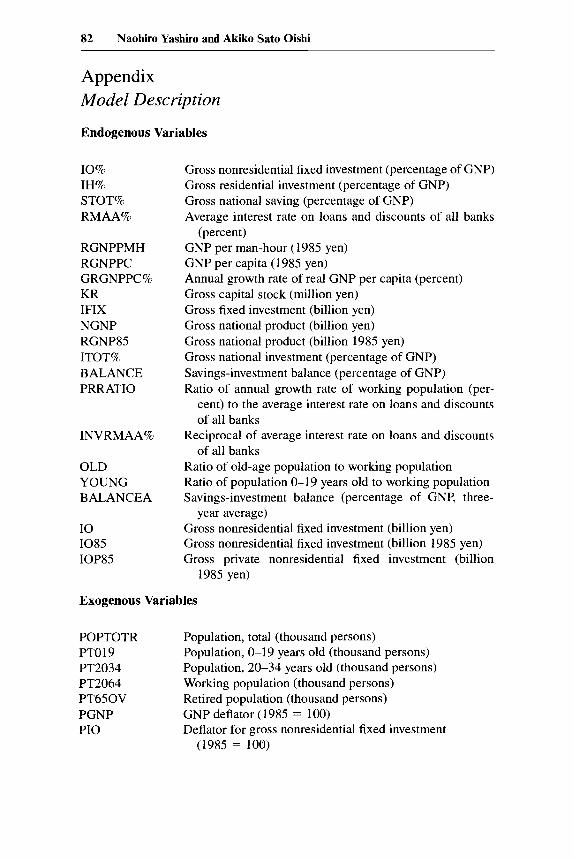
Appendix Model Description
Endogenous Variables
10% IH% STOT% RMAA%
RGNPPMH RGNPPC GRGNPPC% KR IFIX NGNP RGNP85 ITOT% BALANCE PRRATIO
INVRMAA%
OLD YOUNG BALANCEA
I 0 I085 IOP85
Gross nonresidential fixed investment (percentage of GNP) Gross residential investment (percentage of GNP) Gross national saving (percentage of GNP) Average interest rate on loans and discounts of all banks
GNP per man-hour (1985 yen) GNP per capita (1 985 yen) Annual growth rate of real GNP per capita (percent) Gross capital stock (million yen) Gross fixed investment (billion yen) Gross national product (billion yen) Gross national product (billion 1985 yen) Gross national investment (percentage of GNP) Savings-investment balance (percentage of GNP) Ratio of annual growth rate of working population (per-
cent) to the average interest rate on loans and discounts of all banks
Reciprocal of average interest rate on loans and discounts of all banks
Ratio of old-age population to working population Ratio of population 0-19 years old to working population Savings-investment balance (percentage of GNP, three-
Gross nonresidential fixed investment (billion yen) Gross nonresidential fixed investment (billion 1985 yen) Gross private nonresidential fixed investment (billion
(percent)
year average)
1985 yen)
Exogenous Variables
POPTOTR Population, total (thousand persons) PTO 19 PT2034 PT2064 Working population (thousand persons) PT650V Retired population (thousand persons) PGNP P I 0
Population, 0-19 years old (thousand persons) Population, 20-34 years old (thousand persons)
GNP deflator (1985 = 100) Deflator for gross nonresidential fixed investment
(1985 = 100)
83 Population Aging and the Savings-Investment Balance in Japan
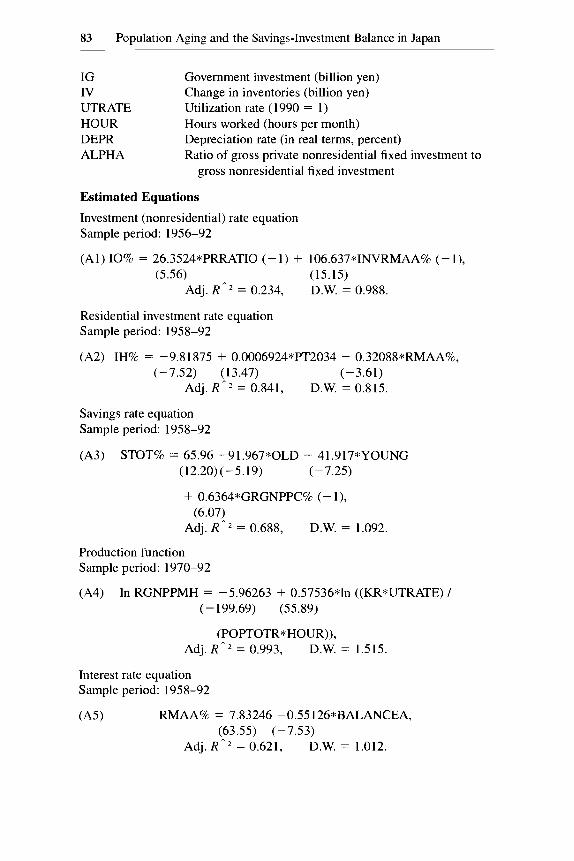
IG Government investment (billion yen) IV UTRATE HOUR DEPR ALPHA
Change in inventories (billion yen) Utilization rate (1990 = 1) Hours worked (hours per month) Depreciation rate (in real terms, percent) Ratio of gross private nonresidential fixed investment to
gross nonresidential
Estimated Equations
Investment (nonresidential) rate equation Sample period: 1956-92
(Al) 10% = 26.3524*PRRATIO (-1) + (5.56)
Adj. R A 2 = 0.234,
Residential investment rate equation Sample period: 1958-92
fixed investment
106.637*INVRMAA% (- l), (15.15) D.W. = 0.988.
(A2) IH% = -9.81875 + 0.0006924uPT2034 - 0.32088*RMAA%, (-7.52) (1 3.47) (-3.61)
Adj. R A 2 = 0.841, D.W. = 0.815.
Savings rate equation Sample period: 1958-92
(A3) STOT% = 65.96 -91.967*OLD - 41.917"YOUNG (12.20)(-5.19) (-7.25)
+ 0.6364*GRGNPPC% (- l), (6.07)
Adj. R A 2 = 0.688, D.W. = 1.092.
Production function Sample period: 1970-92
(A4) In RGNPPMH = -5.96263 + 0.57536*1n ((KR*UTRATE) / (- 199.69) (55.89)
(POPTOTR*HOUR)), Adj. R A 2 = 0.993, D.W. = 1.515.
Interest rate equation Sample period: 1958-92
(A51 RMAA% = 7.83246 -0.55126*BALANCEA, (63.55) (-7.53)
Adj. R A 2 = 0.621, D.W. = 1.012.
84 Naohiro Yashiro and Akiko Sato Oishi
Investment (nonresidential) rate equation for simulation 2 Sample period: 1956-92
(A6) 10% = 20.9038*PRRATIO (- 1) + 11 1.61 1 *INVRMAA% (- l), (4.22) (14.09)
Adj. R f i 2 = 0.125,
Savings rate equation for simulation 2 Sample period: 1958-92
D.W. = 1.125.
(A7) STOT% = 65.444 - 126.83*OLD - 36.781"YOUNG (10.47) (-4.46) (-6.41)
+ 0.73 158*GRGNPPC% (- l),
Adj. R A 2 = 0.637, (6.50)
D.W. = 1.244.
lo 5 i O I " " " " ' ~ " ~ ~ " ~ " " " " " ~ " " " " ' 1955 1960 1965 1970 1975 1980 1985 1990
- Actual _ _ - - - Estimate
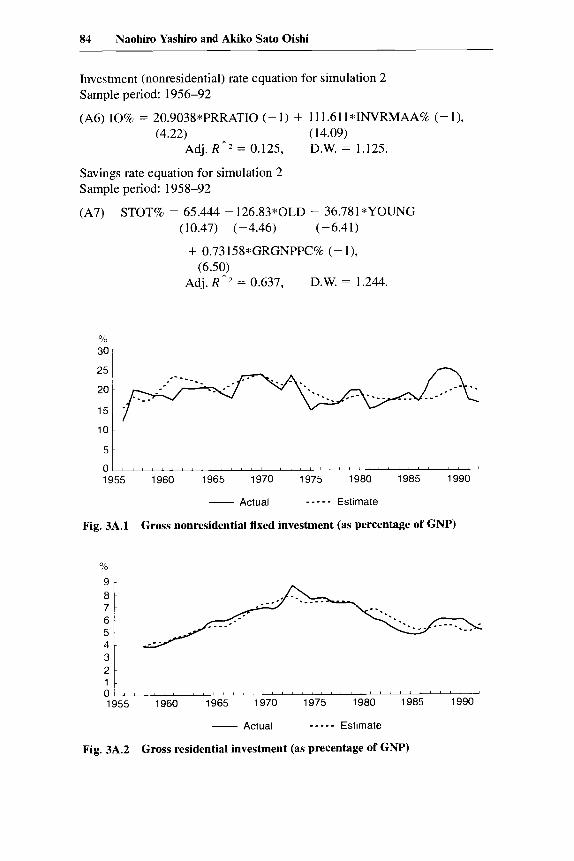
Fig. 3A.l Gross nonresidential fixed investment (as percentage of GNP)
0 ;; 1
1955 1960 1965 1970 1975 1980 1985 1990
- Actual _ _ - - - Estimate
Fig. 3A.2 Gross residential investment (as precentage of GNP)
85 Population Aging and the Savings-Investment Balance in Japan
O/O
45 I
::I, , , , , , , , , , , , , , , , , , , , , , , , , , , , , , , , , , , , , 5 0 1955 1960 1965 1970 1975 1980 1985 1990
- Actual _ _ _ _ _ Estimate
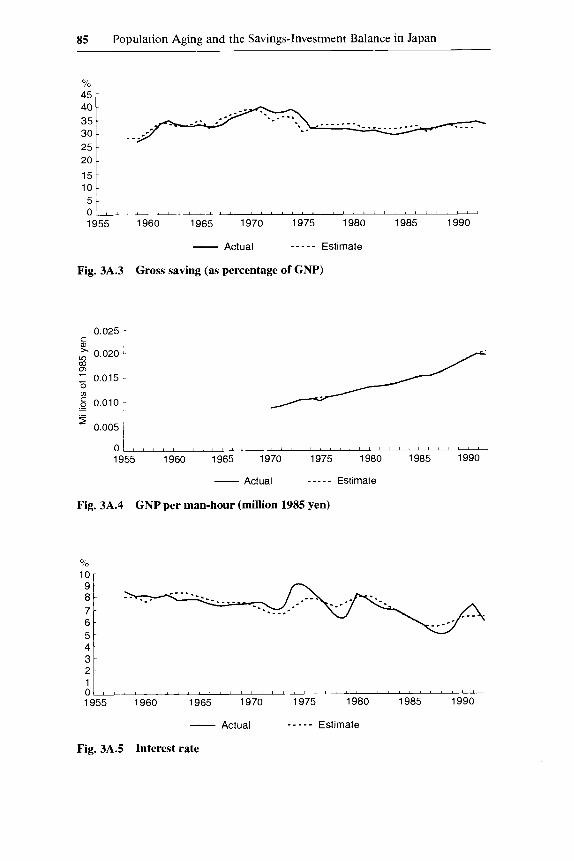
Fig. 3A.3 Gross saving (as percentage of GNP)
0.025 ~
," 0.020 m m
0.015 1 ._ s 0.010 ._
0.005 I
0 1 ~ ~ ~ ~ ~ ~ ~ ~ ~ ~ ~ " " ~ ~ ' ~ ~ ~ " " " " " " " ' 1955 1960 1965 1970 1975 1980 1985 1990
- Actual - - - - - Estimate
Fig. 3A.4 GNP per man-hour (million 1985 yen)
010 10r
:I1,, 1
0 1955 1960 1965 1970 1975 1980 1985 1990
Estimate _ _ _ - _ - Actual
Fig. 3A.5 Interest rate
86 Naohiro Yashiro and Akiko Sato Oishi
Identities
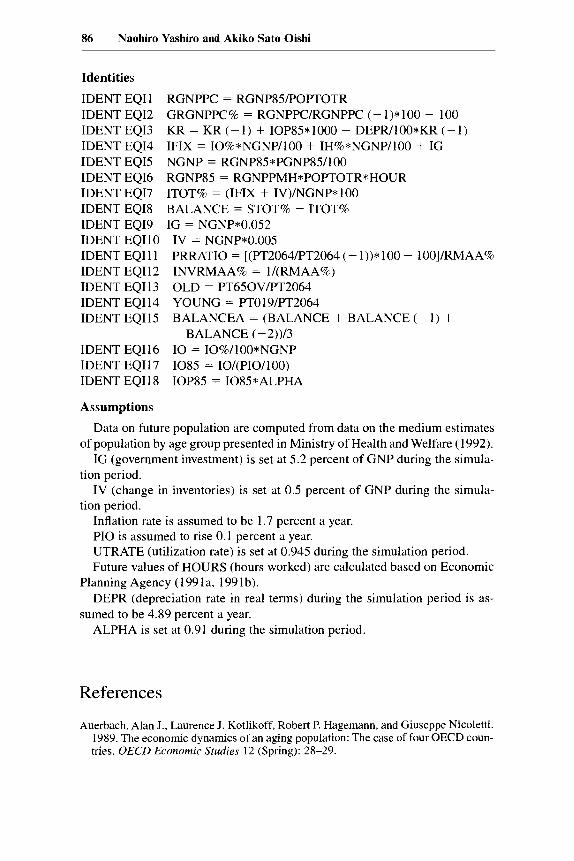
IDENT EQI 1 IDENT EQ12 IDENT EQ13 IDENT EQ14 IDENT EQI5 NGNP = RGNP85*PGNP85/100 IDENT EQ16 RGNP85 = RGNPPMH*POPTOTR*HOUR IDENT EQ17 IDENT EQI8 IDENT EQ19 IG = NGNP*0.052 IDENT EQI10 IV = NGNP*0.005 IDENT EQIl 1 IDENT EQI12 INVRMAA% = l/(RMAA%) IDENT EQI 13 IDENT EQI 14 IDENT EQIl5
RGNPPC = RGNP85POPTOTR GRGNPPC% = RGNPPCRGNPPC (- 1)* 100 - 100 KR = KR (- 1 ) + IOP85*1000 - DEPR/100*KR ( - 1 ) IFIX = IO%*NGNP/100 + IH%*NGNP/100 + IG
ITOT% = (IFIX + IV)/NGNP* 100 BALANCE = STOT% - ITOT%
PRRATIO = [(PT2064/PT2064 (- 1))* 100 - 100]/RMAA%
OLD = PT650V/PT2064 YOUNG = PTO 19PT2064 BALANCEA = (BALANCE + BALANCE (- 1 ) +
BALANCE (-2))/3 IDENT EQI16 I 0 = I0%/100*NGNP IDENT EQI17 I085 = IO/(PIO/100) IDENT EQI18 IOP85 = 1085*ALPHA
Assumptions
Data on future population are computed from data on the medium estimates of population by age group presented in Ministry of Health and Welfare (1992).
IG (government investment) is set at 5.2 percent of GNP during the simula- tion period.
IV (change in inventories) is set at 0.5 percent of GNP during the simula- tion period.
Inflation rate is assumed to be 1.7 percent a year. PI0 is assumed to rise 0.1 percent a year. UTRATE (utilization rate) is set at 0.945 during the simulation period. Future values of HOURS (hours worked) are calculated based on Economic
DEPR (depreciation rate in real terms) during the simulation period is as-
ALPHA is set at 0.91 during the simulation period.
Planning Agency (1991a, 1991b).
sumed to be 4.89 percent a year.
References
Auerbach, Alan J., Laurence J. Kotlikoff, Robert P. Hagemann, and Giuseppe Nicoletti. 1989. The economic dynamics of an aging population: The case of four OECD coun- tries. UECD Economic Studies 12 (Spring): 28-29.
87 Population Aging and the Savings-Investment Balance in Japan
Bos, Eduard, My T. Vu, Ann Levin, and Rodolfo Bulatao. 1992. Worldpopulation pro- jections, 1992-93 edition. Baltimore: Johns Hopkins University Press.
Cutler, David M., James M. Poterba, Louise M. Sheiner, and Lawrence H. Summers. 1990. An aging society: Opportunity or challenge? Brookings Papers on Economic Activity 1 : 1-73.
Economic Planning Agency. 1991a. 2010 Nen heno Sentaku (Japan in the year 2010). Tokyo: Government Printing Office.
. 1991b. 2010 Nen no Sangyo Keizai (Simulation of the industry and economy in 2010). Tokyo: Government Printing Office.
Horioka, Charles Yuji. 1991. The determinants of Japan’s saving rate: The impact of the age structure of the population and other factors. Economic Studies Quarterly 42
. 1992. Future trends in Japan’s saving rate, and the implications thereof for Japan’s external imbalance. Japan and the World Economy 3 (4): 307-30.
Japan Productivity Center. 1992. Roudouseisansei no Kokusaihikaku (A cross-national comparison of labor productivity). Tokyo: Japan Productivity Center.
Masson, Paul R., and Ralph W. Tryon. 1990. Macroeconomic effects of projected popu- lation aging in industrial countries. International Monetary Fund Staff Papers 37
Ministry of Health and Welfare. Institute of Population Problems. 1992. Population projections for Japan: 1990-2090. Tokyo: Ministry of Health and Welfare.
Noguchi, Yukio. 1987. Koteki Nenkin no Shorai to Nihon Keizai no Taigai Pafomansu (The future of public pensions and the external performance of the Japanese econ- omy). Financial Review (Institute of Fiscal and Monetary Policy, Ministry of Fi- nance) 5 (June): 9-19.
. 1989. Macroeconomic implications of population aging. Paper presented at the Conference on the Economics of Aging jointly sponsored by Japan Center for Economic Research and the National Bureau of Economic Research, Tokyo, 8-9 September.
. 1990. Jinko Kozo to Chochiku/Toshi: Kakkoku Hikaku ni yoru Bunseki (The age structure of the population and saving/investment: An analysis based on cross- country comparisons). Financial Review (Institute of Fiscal and Monetary Policy, Ministry of Finance) 17 (August): 39-50.
OECD (Organisation for Economic Cooperation and Development). 1990. The eco- nomic survey on Japan 1989/1990. Paris: Organisation for Economic Cooperation and Development.
Seike, Atsushi. 1993. Koreika Shakui no Rodo Shijo (The labor market in the aging society). Tokyo: Toyokeizai Shimposha.
Shimpo, Seiji, ed. 1991. Zeminaru Makuro Keizaigaku Nyumon (Introduction to macro- economics). Tokyo: Nihon Keizai Shimbun.
Yoshitomi, Masaru, and Naohiro Yashiro. 1992. Long-term economic issues in Japan and Asia Pacific region. In The long-term prospects for the world economy. Paris: Organisation for Economic Cooperation and Development.
(3): 237-53.
(3): 453-85.