population ageing and fertility and the challenges that ... · population ageing and fertility and...
TRANSCRIPT

Population ageing and fertility and the challenges that demographic ageing pose for Singapore & the East Asian
region Angelique Chan
Duke-NUS Graduate Medical School, NUS
Department of Sociology, NUS
Outline
• Demographic changes in Singapore and the East Asian region
• Implications
• Priority areas for research and policy • Long-term care
• Caregiver burden
• Social isolation
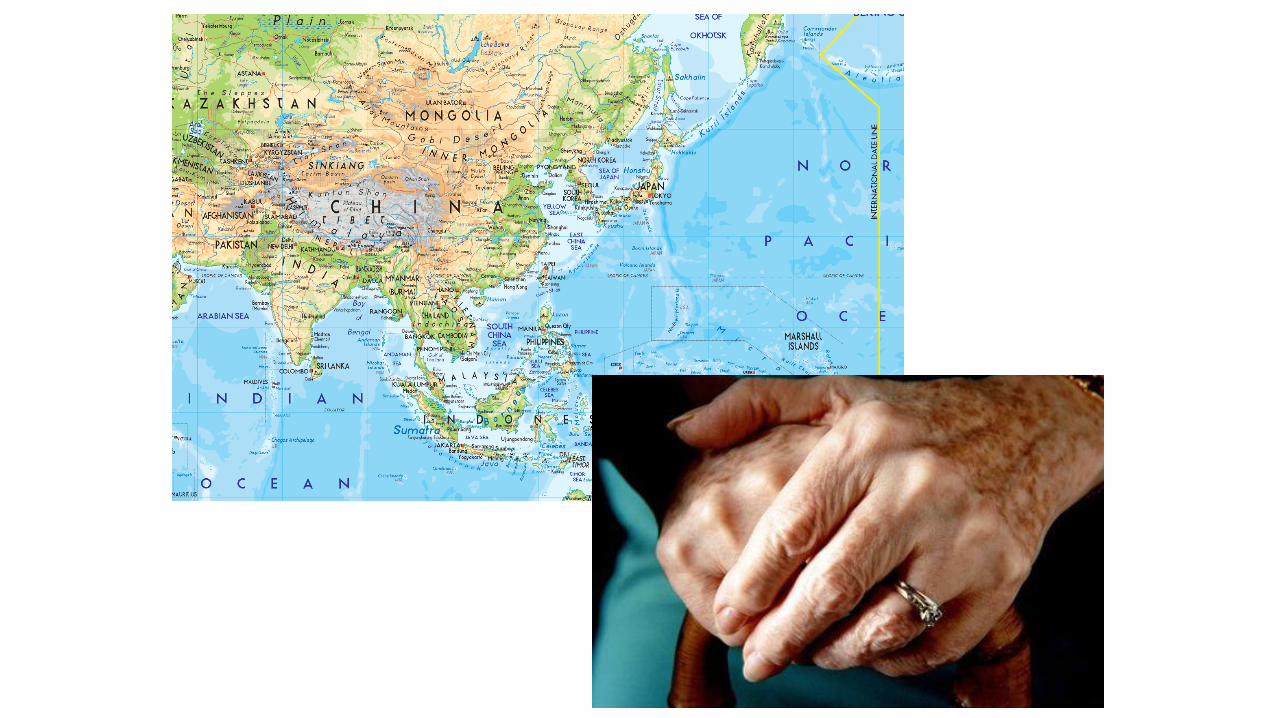

Demographic changes in Singapore and East Asia
• Lower fertility
• Higher rate of non-marriage
• Increasing divorce rate
• Later marriage
• Increased longevity
0
5
10
15
20
25
30
35
40
45
1950 1960 1970 1980 1990 2000 2010 2020 2030 2040 2050
Pe
rce
nta
ge o
f P
op
ula
tio
n (
%)
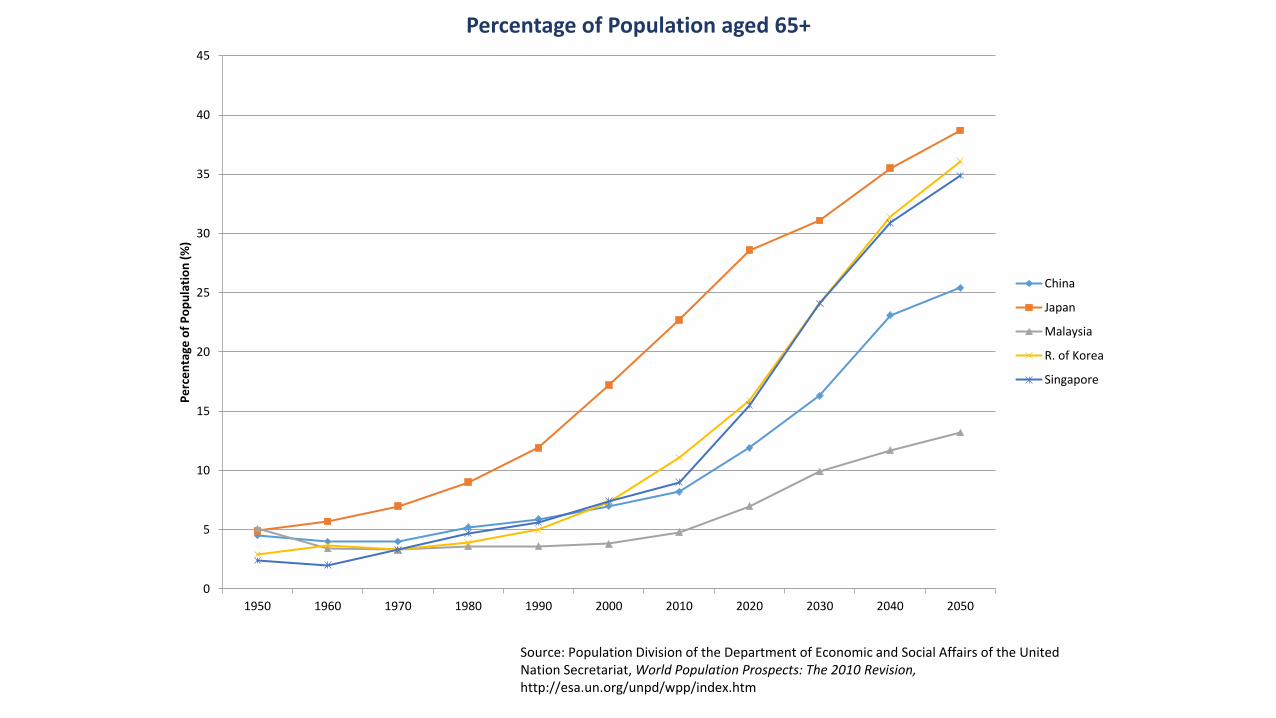
Percentage of Population aged 65+
China
Japan
Malaysia
R. of Korea
Singapore
Source: Population Division of the Department of Economic and Social Affairs of the United Nation Secretariat, World Population Prospects: The 2010 Revision, http://esa.un.org/unpd/wpp/index.htm

Source: Population Division of the Department of Economic and Social Affairs of the United Nation Secretariat, World Population Prospects: The 2010 Revision, http://esa.un.org/unpd/wpp/index.htm
0
2
4
6
8
10
12
14
16
18
1950 1960 1970 1980 1990 2000 2010 2020 2030 2040 2050
Pe
rce
nta
ge o
f P
op
ula
tio
n (
%)
Percentage of Population aged 80+
China
Japan
Malaysia
R. of Korea
Singapore

Implications of Demographic Trends
• Fewer family members available to support older adults
• Sandwich generation caring for children below 12 and members aged 65+ simultaneously
• Longer period of caregiving increased financial and emotional burden

Other implications of population aging
• Increased dialogue on:
• Burden of chronic disease
• Caregiving
• Role of family versus the State in providing care
• Sustainable health system
• NEED FOR EVIDENCE-BASED POLICY FORMULATION

Priorities for Older Persons in East and Southeast Asia
• Maximize family care
• Aging in place
• Strengthen community based health care services
• Minimize hospitalizations and institutionalization
•HOW?
Rethink social policies
• Reconsider traditional assumptions
• Account for changing cohort characteristics
• Not one size fits all: need targeted policies
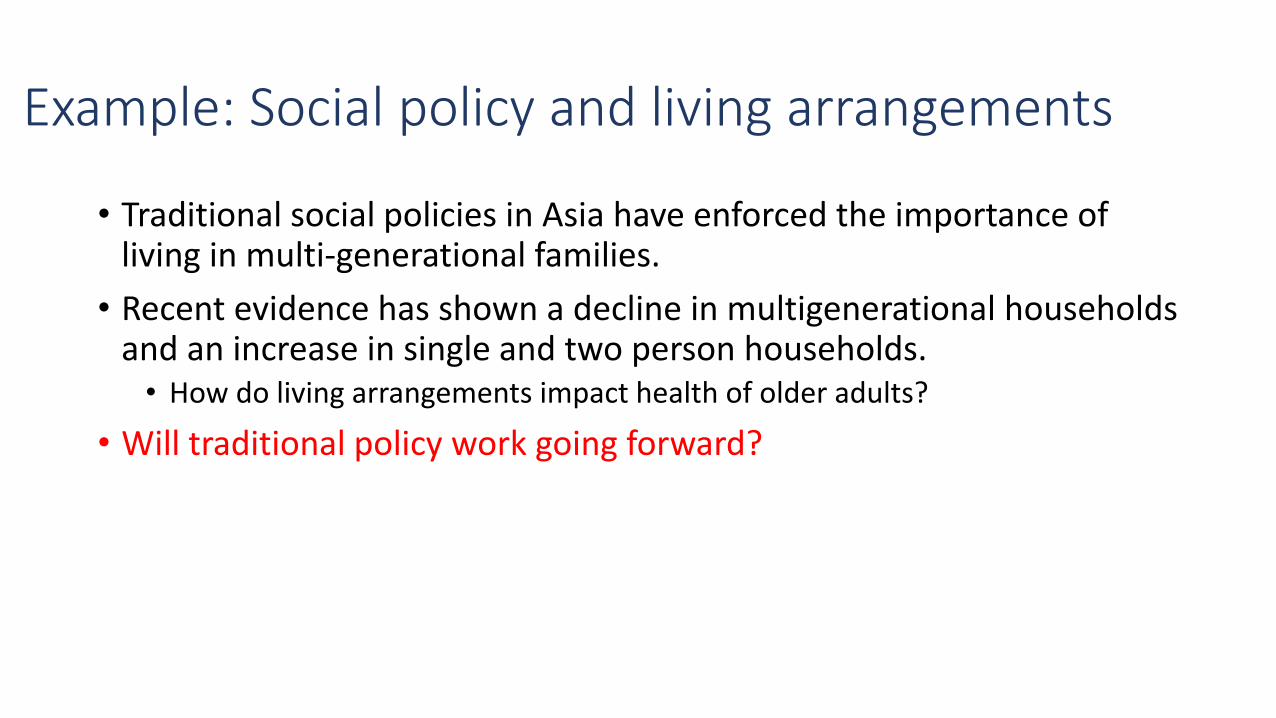
Example: Social policy and living arrangements
• Traditional social policies in Asia have enforced the importance of living in multi-generational families.
• Recent evidence has shown a decline in multigenerational households and an increase in single and two person households. • How do living arrangements impact health of older adults?
• Will traditional policy work going forward?

0%
10%
20%
30%
40%
50%
60%
70%
80%
90%
100%
Singapore (2000) Singapore (2010) South Korea (2005) South Korea (2010) Japan (2000) Japan (2000)
Household Types in Asia 1-person 2-person 3 or more
Trends in living arrangements in Singapore, South Korea, and Japan
Source: UN Demographic Yearbook

Loneliness and Mortality: Results from a Longitudinal Survey of Social Isolation, Health, and Lifestyles
Angelique Chan Prassanna Raman Rahul Malhotra

Why is loneliness important?
Social relationships, or the relative lack thereof, constitute a major risk factor for health - rivaling the effect of well-established health risk factors such as cigarette smoking, blood pressure, blood lipids,
obesity, and physical activity. (House, Landis, and Umberson; Science,
1988)

How does loneliness affect mortality?
Loneliness Mortality
Main effects model: Social relationships directly encourage protective health behavior, and loneliness can alter human physiology (increased vascular resistance, higher systolic blood pressure)
Buffering model. Social relationships help dampen responses to stressors.
Pathways
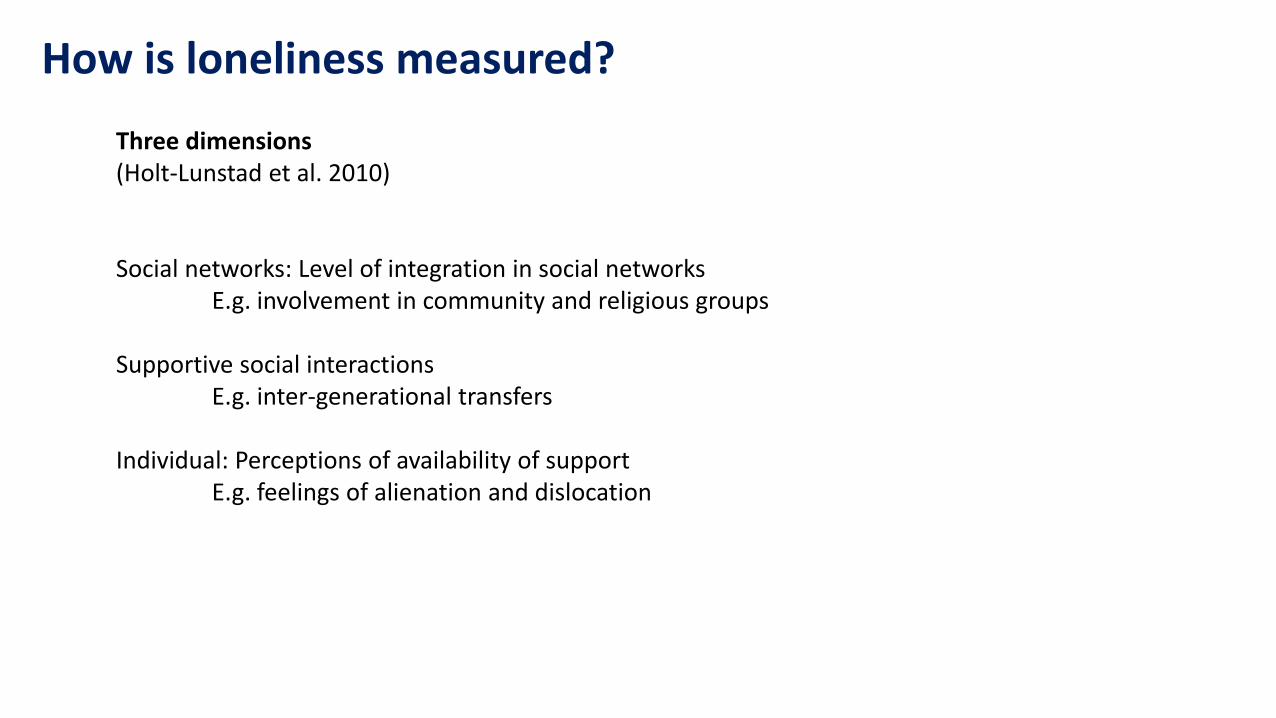
How is loneliness measured?
Three dimensions (Holt-Lunstad et al. 2010) Social networks: Level of integration in social networks E.g. involvement in community and religious groups Supportive social interactions E.g. inter-generational transfers Individual: Perceptions of availability of support E.g. feelings of alienation and dislocation
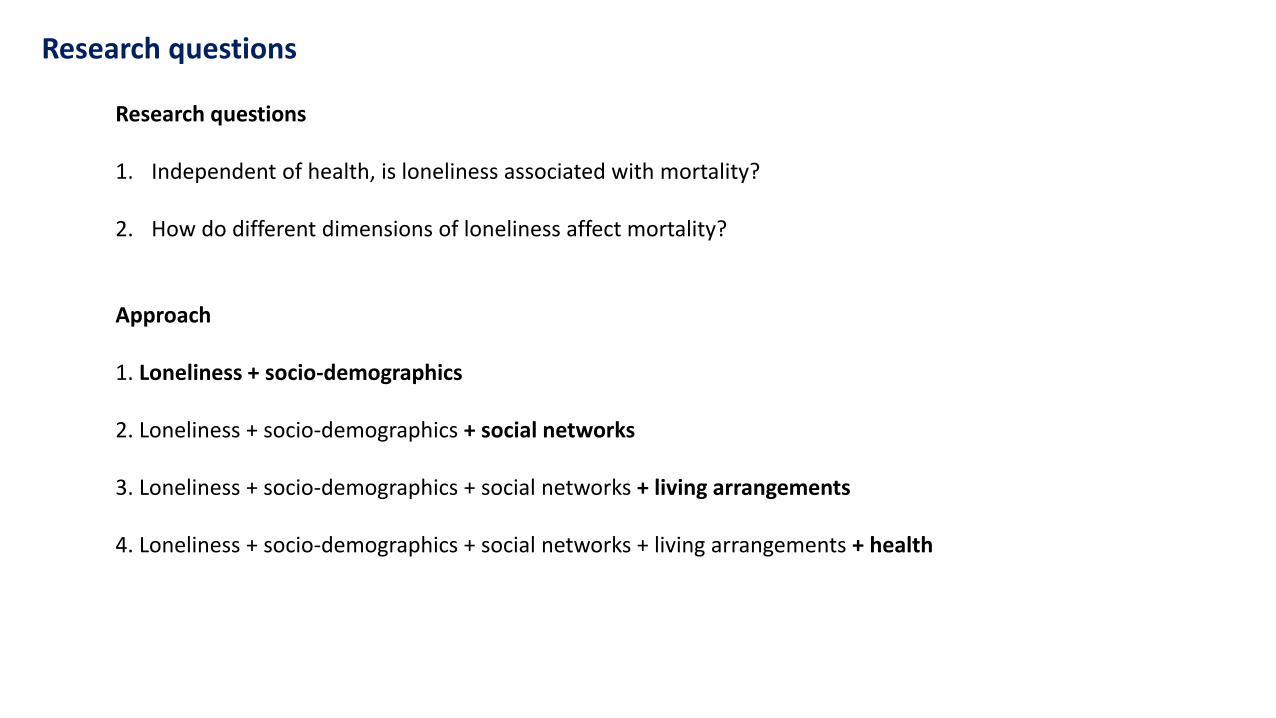
Research questions
Research questions 1. Independent of health, is loneliness associated with mortality? 2. How do different dimensions of loneliness affect mortality?
Approach 1. Loneliness + socio-demographics 2. Loneliness + socio-demographics + social networks 3. Loneliness + socio-demographics + social networks + living arrangements 4. Loneliness + socio-demographics + social networks + living arrangements + health
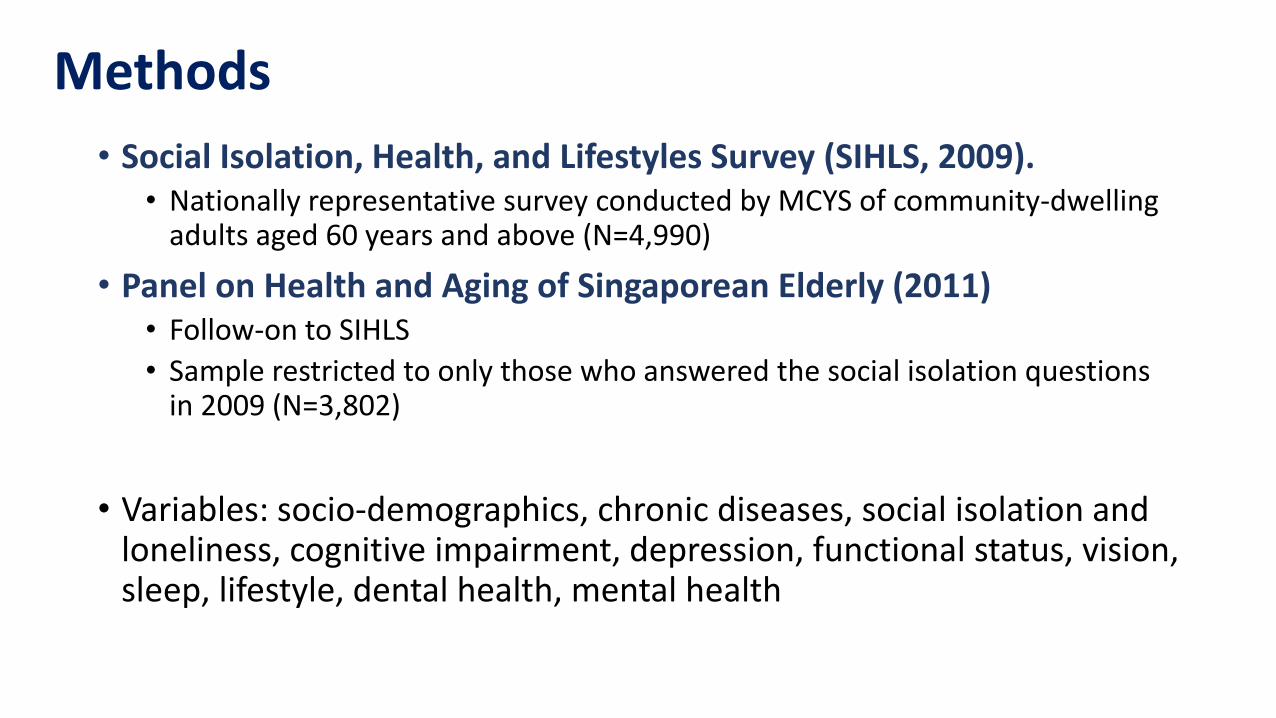
Methods
• Social Isolation, Health, and Lifestyles Survey (SIHLS, 2009). • Nationally representative survey conducted by MCYS of community-dwelling
adults aged 60 years and above (N=4,990)
• Panel on Health and Aging of Singaporean Elderly (2011) • Follow-on to SIHLS
• Sample restricted to only those who answered the social isolation questions in 2009 (N=3,802)
• Variables: socio-demographics, chronic diseases, social isolation and loneliness, cognitive impairment, depression, functional status, vision, sleep, lifestyle, dental health, mental health
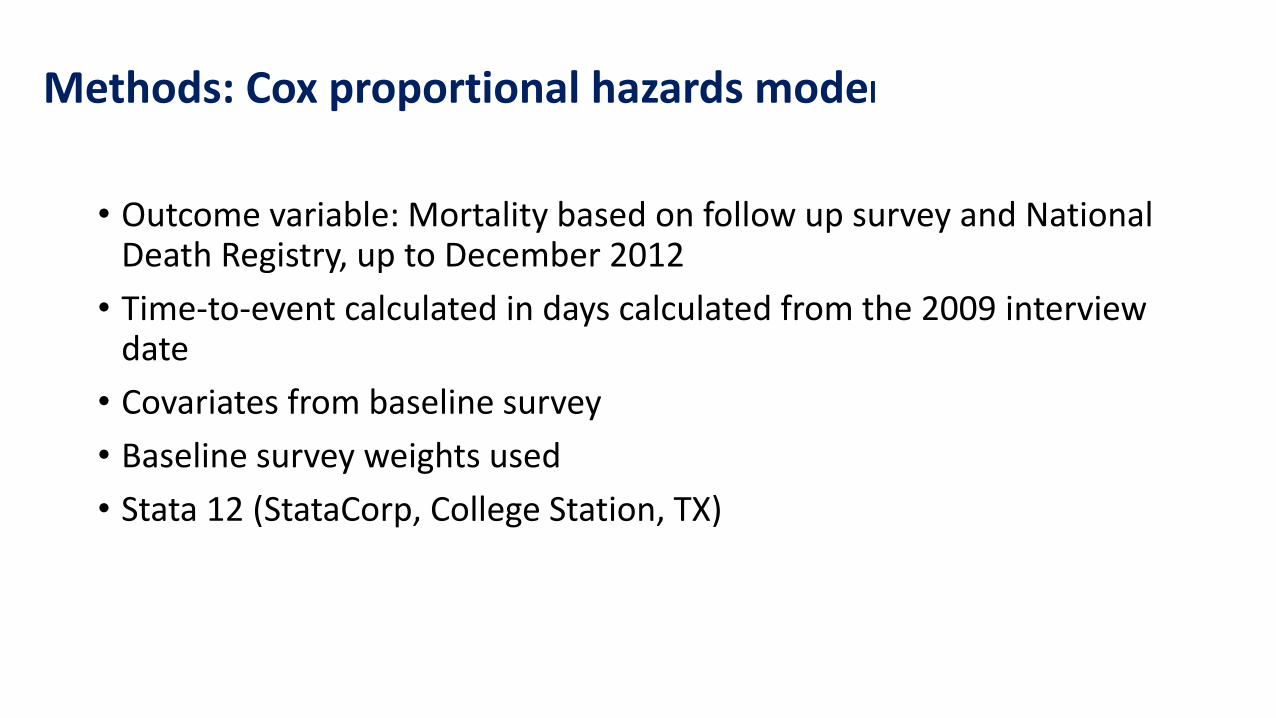
Methods: Cox proportional hazards model
• Outcome variable: Mortality based on follow up survey and National Death Registry, up to December 2012
• Time-to-event calculated in days calculated from the 2009 interview date
• Covariates from baseline survey
• Baseline survey weights used
• Stata 12 (StataCorp, College Station, TX)
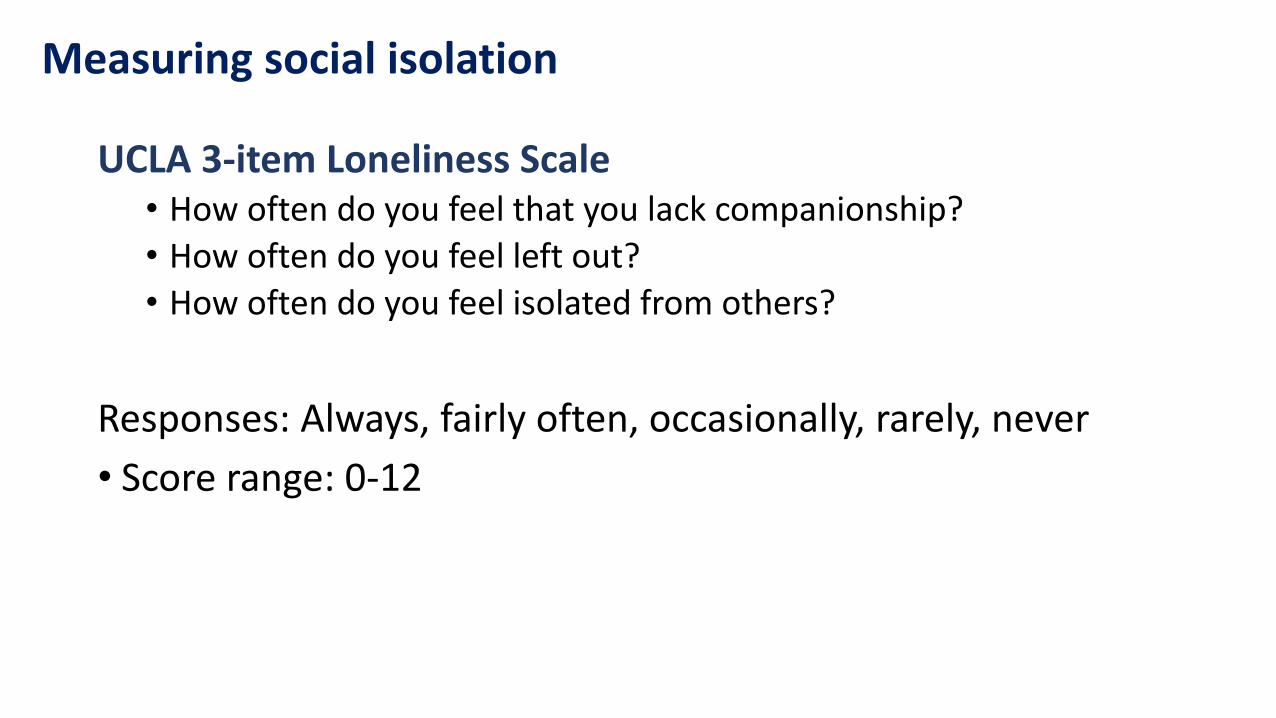
Measuring social isolation
UCLA 3-item Loneliness Scale • How often do you feel that you lack companionship?
• How often do you feel left out?
• How often do you feel isolated from others?
Responses: Always, fairly often, occasionally, rarely, never
• Score range: 0-12

Independent variables
Lubben Social Network Scale (12 questions)
• How many relatives/friends/neighbors … • do you see or hear from at least every month? • are close enough to ask for help or discuss private
matters?
• How often do relatives/friends/neighbors… • consult you before making an important decision? • available to talk when you have an important decision to
make?

Living arrangements (categorical)
• Living… • alone • only with spouse • only with child(ren), • with spouse AND child(ren) • only with others
Independent variables

• Socio-demographic: Age, gender, ethnicity, marital status, housing type, and education
• Health: Number of comorbidities, ADL limitations, IADL limitations, smoking status, depression, cognition
Independent variables
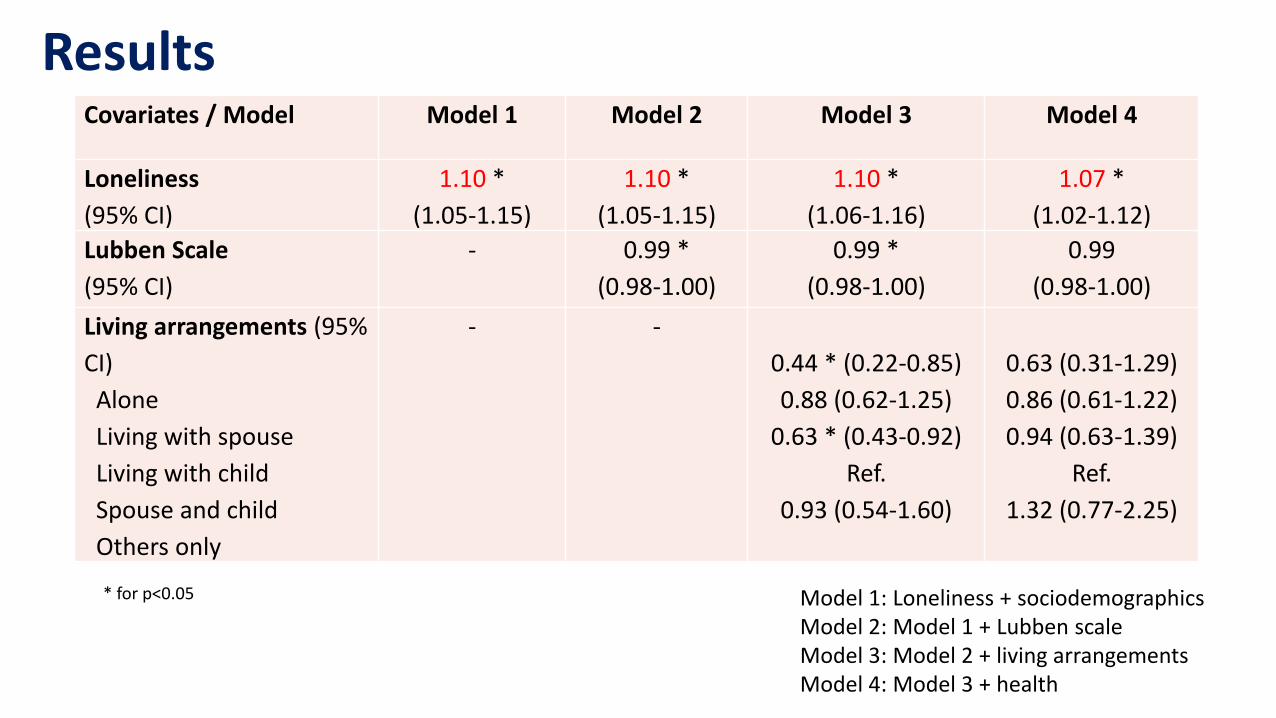
Results Covariates / Model Model 1 Model 2 Model 3 Model 4
Loneliness
(95% CI)
1.10 *
(1.05-1.15)
1.10 *
(1.05-1.15)
1.10 *
(1.06-1.16)
1.07 *
(1.02-1.12)
Lubben Scale
(95% CI)
- 0.99 *
(0.98-1.00)
0.99 *
(0.98-1.00)
0.99
(0.98-1.00)
Living arrangements (95%
CI)
Alone
Living with spouse
Living with child
Spouse and child
Others only
- -
0.44 * (0.22-0.85)
0.88 (0.62-1.25)
0.63 * (0.43-0.92)
Ref.
0.93 (0.54-1.60)
0.63 (0.31-1.29)
0.86 (0.61-1.22)
0.94 (0.63-1.39)
Ref.
1.32 (0.77-2.25)
* for p<0.05 Model 1: Loneliness + sociodemographics Model 2: Model 1 + Lubben scale Model 3: Model 2 + living arrangements Model 4: Model 3 + health

Insight
• Perceived loneliness is associated with a greater risk of death in Singapore • It is more predictive of mortality than living
arrangements and social networks

How can we apply what we learned to policy?
• Multi-generational housing may be valuable, but it is not sufficient • Policy should address perceived loneliness
• Psychosocial services • Promote awareness by community and health care providers