poole opinion panel summer 2006 nhs dentists draft heather kitching consultation manager strategic...
TRANSCRIPT

Poole Opinion PanelSummer 2006NHS Dentists
DRAFTHeather Kitching
Consultation Manager
Strategic Planning Services

• The Poole Opinion Panel is one of the Council’s core corporate consultation tools
• Survey fieldwork managed by the Market Research Group (Bournemouth University) July-August 2006
• Reminder postcard sent to boost response rates
• 1,061 out of 1,796 questionnaires returned (59%)
• The data has been weighted by mosaic groups to make them representative of Poole.
NB: 2004 results have been re-weighted to enable comparisons.
Summer 2006 Poole Opinion Panel


• The following questions were included in the Summer 2006 Poole Opinion Panel:
Q. Are you registered with a Dentist?Yes, with an NHS dentist Yes, with a private dentist No
Q. How often do you visit a dentist?Every 1-6 months Every 7 to 9 monthsabout once a year less often
Q. Have you been able to see a NHS dentist since April 2006?Yes Yes, only as an urgent patientNo, I have a private dentist I haven’t triedNo
Q.Did you know about the changes to the way NHS Contracts are managed?Yes No
Q.Do you know how to contact a NHS dentist during the day?Yes No
Q.Do you know how to contact a NHS dentist during the evening / night?Yes No
Q.If you were experiencing a lot of dental pain would you:Contact your dentist? Contact NHS direct?Go to the hospital? Telephone the dental helpline?Contact your doctor? Other?
NHS Dentists

• The questions regarding Local NHS Dentists were commissioned by Poole PCT to review if they are getting the message and information about access to NHS dentists to residents.
• The findings will be reported to the Dorset and Somerset Strategic Health Authority, who will report in turn to the Department of Health.
• The questions will also inform the PCT whether:
• they are providing enough access to the out of hours service and
• patients go directly to the correct source of help rather than being passed from pillar to post.
NHS Dentists

• The results are significant by age, area and mosaic group.
• There are no significant differences when looking at the results by gender.
Are you registered with a Dentist?
50.5%
37.0%
12.5%
0%
10%
20%
30%
40%
50%
60%
Yes, I have a regularNHS dentist
Yes, I have a regularprivate dentist
No
Registered with a dentist
Base = all respondents
• 50.5% of respondents have a regular NHS Dentist.
• 37% have a private Dentist.
• 12.5% have no dentist.

Chi-Square Tests
20.252a 10 .027
20.755 10 .023
1037
Pearson Chi-Square
Likelihood Ratio
N of Valid Cases
Value dfAsymp. Sig.
(2-sided)
0 cells (.0%) have expected count less than 5. Theminimum expected count is 9.21.
a.
Crosstab
48 116 175 57 86 42 524
37.4 114.2 175.3 60.6 90.4 46.0 524.0
64.9% 51.3% 50.4% 47.5% 48.0% 46.2% 50.5%
16 91 137 42 64 34 384
27.4 83.7 128.5 44.4 66.3 33.7 384.0
21.6% 40.3% 39.5% 35.0% 35.8% 37.4% 37.0%
10 19 35 21 29 15 129
9.2 28.1 43.2 14.9 22.3 11.3 129.0
13.5% 8.4% 10.1% 17.5% 16.2% 16.5% 12.4%
74 226 347 120 179 91 1037
74.0 226.0 347.0 120.0 179.0 91.0 1037.0
100.0% 100.0% 100.0% 100.0% 100.0% 100.0% 100.0%
Count
Expected Count
% within Age_groups
Count
Expected Count
% within Age_groups
Count
Expected Count
% within Age_groups
Count
Expected Count
% within Age_groups
Yes, I have a regularNHS dentist
Yes, I have a regularprivate dentist
No
Do you visit aregular deAreyou registeredwith a Dentis...
Total
18-29 30-44 45-59 60-64 65-74 75+
Age_groups
Total
Registered with a dentist – by age
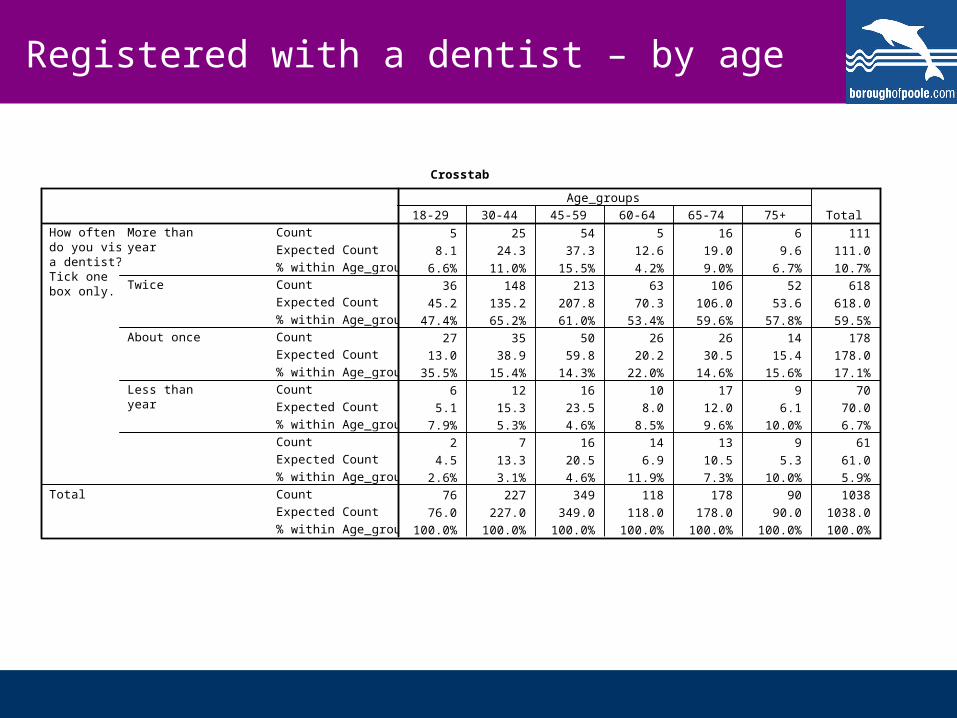
•65% of those people aged 18-29 have an NHS Dentist.
•The number of people who have an NHS Dentist falls with age – particularly over the age of 60.

Chi-Square Tests
43.408a 10 .000
42.581 10 .000
1038
Pearson Chi-Square
Likelihood Ratio
N of Valid Cases
Value dfAsymp. Sig.
(2-sided)
0 cells (.0%) have expected count less than 5. Theminimum expected count is 17.29.
a.
Crosstab
79 81 49 130 94 91 524
72.7 95.4 69.2 115.6 94.4 76.7 524.0
54.9% 42.9% 35.8% 56.8% 50.3% 59.9% 50.5%
41 86 76 69 64 47 383
53.1 69.7 50.6 84.5 69.0 56.1 383.0
28.5% 45.5% 55.5% 30.1% 34.2% 30.9% 36.9%
24 22 12 30 29 14 131
18.2 23.9 17.3 28.9 23.6 19.2 131.0
16.7% 11.6% 8.8% 13.1% 15.5% 9.2% 12.6%
144 189 137 229 187 152 1038
144.0 189.0 137.0 229.0 187.0 152.0 1038.0
100.0% 100.0% 100.0% 100.0% 100.0% 100.0% 100.0%
Count
Expected Count
% within Area
Count
Expected Count
% within Area
Count
Expected Count
% within Area
Count
Expected Count
% within Area
Yes, I have a regularNHS dentist
Yes, I have a regularprivate dentist
No
Do you visit aregular deAreyou registeredwith a Dentis...
Total
Alderney,Branksome
East andWest
Broadstone,Merley andBearwood
Canford Cliffsand Penn Hill
CanfordHeath East &
West,Creekmoor
and Oakdale
HamworthyEast & Westand Poole
TownNewtown and
Parkstone
Area
Total
Registered with a dentist – by area
• More respondents in ‘Alderney, Branksome East & West’, ‘Canford Heath East & West, Creekmoor and Oakdale’ and ‘Newtown and Parkstone’ have an NHS Dentist, with those in ‘Broadstone, Merley & Bearwood’ and ‘Canford Cliffs and Penn Hill’ are more likely to have a private dentist.
Chi-Square Tests
35.228a 12 .000
33.610 12 .001
1.225 1 .268
1029
Pearson Chi-Square
Likelihood Ratio
Linear-by-LinearAssociation
N of Valid Cases
Value dfAsymp. Sig.
(2-sided)
0 cells (.0%) have expected count less than 5. Theminimum expected count is 6.19.
a.
Registered with a dentist – by Mosaic
Crosstab
48 91 90 98 25 51 114 517
60.3 79.4 88.4 94.0 24.6 47.7 122.6 517.0
40.0% 57.6% 51.1% 52.4% 51.0% 53.7% 46.7% 50.2%
62 51 64 67 15 21 102 382
44.5 58.7 65.3 69.4 18.2 35.3 90.6 382.0
51.7% 32.3% 36.4% 35.8% 30.6% 22.1% 41.8% 37.1%
10 16 22 22 9 23 28 130
15.2 20.0 22.2 23.6 6.2 12.0 30.8 130.0
8.3% 10.1% 12.5% 11.8% 18.4% 24.2% 11.5% 12.6%
120 158 176 187 49 95 244 1029
120.0 158.0 176.0 187.0 49.0 95.0 244.0 1029.0
100.0% 100.0% 100.0% 100.0% 100.0% 100.0% 100.0% 100.0%
Count
Expected Count
% within MosaicGroups (Poole)
Count
Expected Count
% within MosaicGroups (Poole)
Count
Expected Count
% within MosaicGroups (Poole)
Count
Expected Count
% within MosaicGroups (Poole)
Yes, I have a regularNHS dentist
Yes, I have a regularprivate dentist
No
Do you visit aregular deAreyou registeredwith a Dentis...
Total
1 2 3 4 6 8 10
Mosaic Groups (Poole)
Total
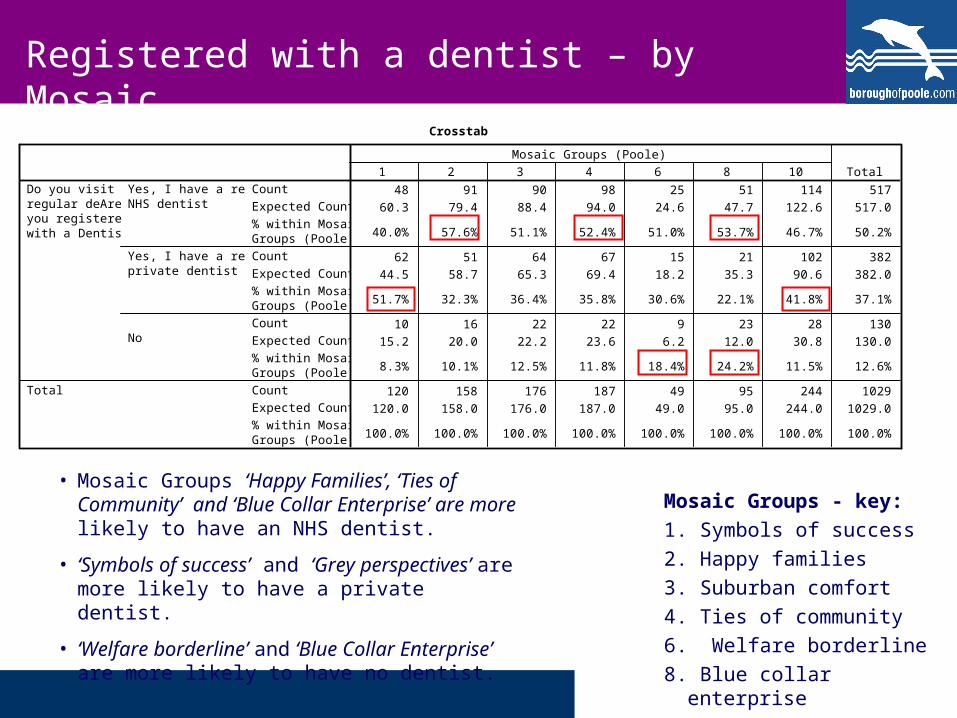
Mosaic Groups - key:
1. Symbols of success
2. Happy families
3. Suburban comfort
4. Ties of community
6. Welfare borderline
8. Blue collar enterprise
10. Grey perspectives.
• Mosaic Groups ‘Happy Families’, ‘Ties of Community’ and ‘Blue Collar Enterprise’ are more likely to have an NHS dentist.
• ‘Symbols of success’ and ‘Grey perspectives’ are more likely to have a private dentist.
• ‘Welfare borderline’ and ‘Blue Collar Enterprise’ are more likely to have no dentist.

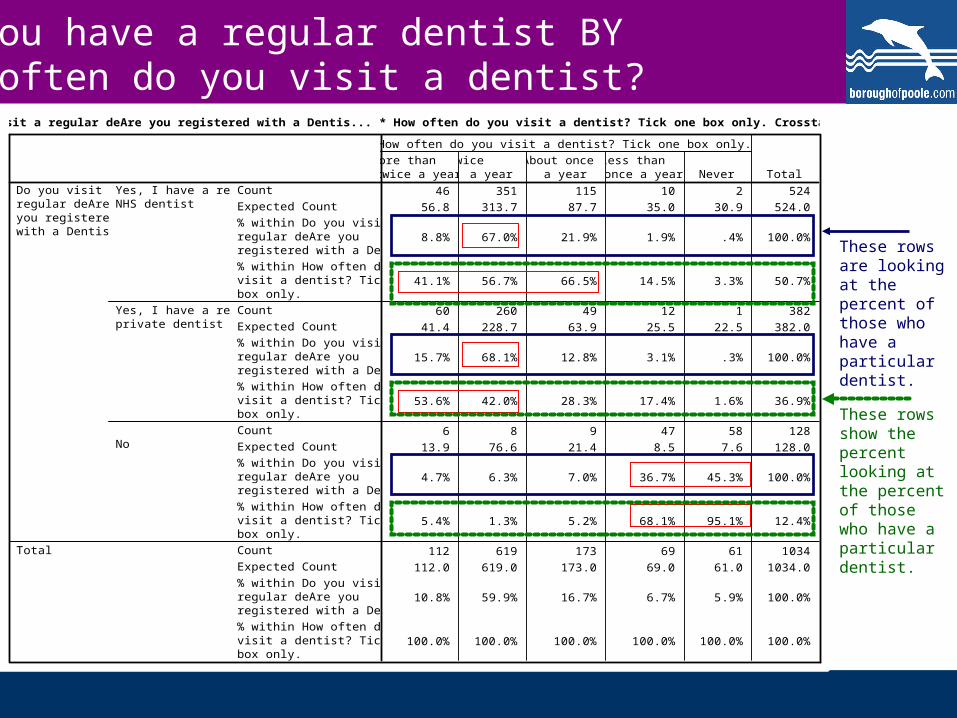
• 71% of respondents see a dentist at least twice a year.
• 6% never see a dentist.
• The results differ according to age and what kind of dentist respondents see (and of course whether they have one).
• The majority of those people who do have a dentist, see them twice a year (67-68%).
• There are no differences when looking at the result by area, gender or mosaic group.
How often do you visit a Dentist?
11%
60%
17%
7% 6%
0%
10%
20%
30%
40%
50%
60%
70%
More than twice a
year
Twice ayear
About oncea year
Less thanonce a year
Never
How often visit dentists
Base = all respondents
Chi-Square Tests
687.055a 8 .000
481.931 8 .000
221.351 1 .000
1034
Pearson Chi-Square
Likelihood Ratio
Linear-by-LinearAssociation
N of Valid Cases
Value dfAsymp. Sig.
(2-sided)
0 cells (.0%) have expected count less than 5. Theminimum expected count is 7.55.
a.
Do you have a regular dentist BY How often do you visit a dentist?
Do you visit a regular deAre you registered with a Dentis... * How often do you visit a dentist? Tick one box only. Crosstabulation
46 351 115 10 2 524
56.8 313.7 87.7 35.0 30.9 524.0
8.8% 67.0% 21.9% 1.9% .4% 100.0%
41.1% 56.7% 66.5% 14.5% 3.3% 50.7%
60 260 49 12 1 382
41.4 228.7 63.9 25.5 22.5 382.0
15.7% 68.1% 12.8% 3.1% .3% 100.0%
53.6% 42.0% 28.3% 17.4% 1.6% 36.9%
6 8 9 47 58 128
13.9 76.6 21.4 8.5 7.6 128.0
4.7% 6.3% 7.0% 36.7% 45.3% 100.0%
5.4% 1.3% 5.2% 68.1% 95.1% 12.4%
112 619 173 69 61 1034
112.0 619.0 173.0 69.0 61.0 1034.0
10.8% 59.9% 16.7% 6.7% 5.9% 100.0%
100.0% 100.0% 100.0% 100.0% 100.0% 100.0%
Count
Expected Count
% within Do you visit aregular deAre youregistered with a Dentis...
% within How often do youvisit a dentist? Tick onebox only.
Count
Expected Count
% within Do you visit aregular deAre youregistered with a Dentis...
% within How often do youvisit a dentist? Tick onebox only.
Count
Expected Count
% within Do you visit aregular deAre youregistered with a Dentis...
% within How often do youvisit a dentist? Tick onebox only.
Count
Expected Count
% within Do you visit aregular deAre youregistered with a Dentis...
% within How often do youvisit a dentist? Tick onebox only.
Yes, I have a regularNHS dentist
Yes, I have a regularprivate dentist
No
Do you visit aregular deAreyou registeredwith a Dentis...
Total
More than twice a year
Twice a year
About once a year
Less than once a year
Never
How often do you visit a dentist? Tick one box only.
Total
These rows are looking at the percent of those who have a particular dentist.
These rows show the percent looking at the percent of those who have a particular dentist.
Chi-Square Tests
61.679a 20 .000
57.968 20 .000
1038
Pearson Chi-Square
Likelihood Ratio
N of Valid Cases
Value dfAsymp. Sig.
(2-sided)
1 cells (3.3%) have expected count less than 5. Theminimum expected count is 4.47.
a.
Crosstab
5 25 54 5 16 6 111
8.1 24.3 37.3 12.6 19.0 9.6 111.0
6.6% 11.0% 15.5% 4.2% 9.0% 6.7% 10.7%
36 148 213 63 106 52 618
45.2 135.2 207.8 70.3 106.0 53.6 618.0
47.4% 65.2% 61.0% 53.4% 59.6% 57.8% 59.5%
27 35 50 26 26 14 178
13.0 38.9 59.8 20.2 30.5 15.4 178.0
35.5% 15.4% 14.3% 22.0% 14.6% 15.6% 17.1%
6 12 16 10 17 9 70
5.1 15.3 23.5 8.0 12.0 6.1 70.0
7.9% 5.3% 4.6% 8.5% 9.6% 10.0% 6.7%
2 7 16 14 13 9 61
4.5 13.3 20.5 6.9 10.5 5.3 61.0
2.6% 3.1% 4.6% 11.9% 7.3% 10.0% 5.9%
76 227 349 118 178 90 1038
76.0 227.0 349.0 118.0 178.0 90.0 1038.0
100.0% 100.0% 100.0% 100.0% 100.0% 100.0% 100.0%
Count
Expected Count
% within Age_groups
Count
Expected Count
% within Age_groups
Count
Expected Count
% within Age_groups
Count
Expected Count
% within Age_groups
Count
Expected Count
% within Age_groups
Count
Expected Count
% within Age_groups
More than twice ayear
Twice a year
About once a year
Less than once ayear
Never
How oftendo you visita dentist?Tick onebox only.
Total
18-29 30-44 45-59 60-64 65-74 75+
Age_groups
Total
Registered with a dentist – by age

• 39% of respondents have been able to see an NHS Dentist since 2006.
• 21% haven’t tried.
• Of those who haven’t tried, 71% have another dentist – 29% do not have a dentist.
• 12% haven’t been able to.
• 44% of those who have not been able to have no dentist and 11.5% have an NHS Dentist.
Have you been able to see an NHS dentist since April 2006?
39%
1%
27%21%
12%
0%5%
10%15%20%25%30%35%40%45%50%
Yes Yes, only asan urgent
patient
No, I have aprivatedentist
I haven’ttried
No, I haven'tbeen able
to
NHS Dentist since April 2006
Base = all respondents

Chi-Square Tests
983.369a 8 .000
1093.791 8 .000
447.716 1 .000
1024
Pearson Chi-Square
Likelihood Ratio
Linear-by-LinearAssociation
N of Valid Cases
Value dfAsymp. Sig.
(2-sided)
2 cells (13.3%) have expected count less than 5. Theminimum expected count is 1.23.
a.
Crosstab
391 8 4 98 14 515
202.2 5.0 139.8 106.6 61.4 515.0
97.3% 80.0% 1.4% 46.2% 11.5% 50.3%
7 0 270 52 54 383
150.4 3.7 104.0 79.3 45.6 383.0
1.7% .0% 97.1% 24.5% 44.3% 37.4%
4 2 4 62 54 126
49.5 1.2 34.2 26.1 15.0 126.0
1.0% 20.0% 1.4% 29.2% 44.3% 12.3%
402 10 278 212 122 1024
402.0 10.0 278.0 212.0 122.0 1024.0
100.0% 100.0% 100.0% 100.0% 100.0% 100.0%
Count
Expected Count
% within Have you beenable to see an NHSdentist since April 2006...
Count
Expected Count
% within Have you beenable to see an NHSdentist since April 2006...
Count
Expected Count
% within Have you beenable to see an NHSdentist since April 2006...
Count
Expected Count
% within Have you beenable to see an NHSdentist since April 2006...
Yes, I have a regularNHS dentist
Yes, I have a regularprivate dentist
No
Do you visit aregular deAreyou registeredwith a Dentis...
Total
Yes
Yes, only asan urgent
patientNo, I have a
private dentist I haven’t triedNo, I haven'tbeen able to
Have you been able to see an NHS dentist since April 2006...
Total
Do you visit a regular dentist? By Have you been able to see an NHS dentist since April 2006?

Chi-Square Tests
54.661a 20 .000
58.151 20 .000
1030
Pearson Chi-Square
Likelihood Ratio
N of Valid Cases
Value dfAsymp. Sig.
(2-sided)
6 cells (20.0%) have expected count less than 5. Theminimum expected count is 1.45.
a.
Have you seen an NHS Dentist since April 2006 – by area
Crosstab
61 65 34 102 72 68 402
56.6 73.8 53.1 87.0 73.0 58.5 402.0
42.1% 34.4% 25.0% 45.7% 38.5% 45.3% 39.0%
0 4 3 2 0 2 11
1.5 2.0 1.5 2.4 2.0 1.6 11.0
.0% 2.1% 2.2% .9% .0% 1.3% 1.1%
28 71 51 47 48 34 279
39.3 51.2 36.8 60.4 50.7 40.6 279.0
19.3% 37.6% 37.5% 21.1% 25.7% 22.7% 27.1%
33 27 34 47 37 36 214
30.1 39.3 28.3 46.3 38.9 31.2 214.0
22.8% 14.3% 25.0% 21.1% 19.8% 24.0% 20.8%
23 22 14 25 30 10 124
17.5 22.8 16.4 26.8 22.5 18.1 124.0
15.9% 11.6% 10.3% 11.2% 16.0% 6.7% 12.0%
145 189 136 223 187 150 1030
145.0 189.0 136.0 223.0 187.0 150.0 1030.0
100.0% 100.0% 100.0% 100.0% 100.0% 100.0% 100.0%
Count
Expected Count
% within Area
Count
Expected Count
% within Area
Count
Expected Count
% within Area
Count
Expected Count
% within Area
Count
Expected Count
% within Area
Count
Expected Count
% within Area
Yes
Yes, only as an urgentpatient
No, I have a privatedentist
I haven’t tried
No, I haven't been able to
Have youbeen able tosee an NHSdentist sinceApril 2006...
Total
Alderney,Branksome
East andWest
Broadstone,Merley andBearwood
Canford Cliffsand Penn Hill
CanfordHeath East &
West,Creekmoor
and Oakdale
HamworthyEast & Westand Poole
TownNewtown and
Parkstone
Area
Total
• People in ‘Alderney, Branksome East & West’, ‘Canford Heath East & West, Creekmoor and Oakdale’ and ‘Newtown and Parkstone’ have been able to see an NHS Dentist – these are the wards that are more likely to have an NHS Dentist.

Did you know about the changes to the way NHS Contracts are managed?
Yes40%
No60%
Awareness of changes to NHS dentist contracts
Base = all respondents
• 40% were aware of the changes to how NHS Contracts are managed.
• 93% of those who were aware of the changes have a dentist –64% have an NHS Dentist and 29% a private one.

Chi-Square Tests
55.835a 2 .000
57.153 2 .000
53.567 1 .000
1030
Pearson Chi-Square
Likelihood Ratio
Linear-by-LinearAssociation
N of Valid Cases
Value dfAsymp. Sig.
(2-sided)
0 cells (.0%) have expected count less than 5. Theminimum expected count is 51.35.
a.
Do you visit a regular dentist? By Did you know about the changes to NHS Contracts?
• 93% of those who were aware of the changes (40% of respondents) have a dentist – 64% have an NHS Dentist and 29% a private one.
• 51% of those who have an NHS Dentist were aware of the changes and 31% of those who have a private dentist were aware.
• 22% of those who do not have a dentist were aware.
Do you visit a regular deAre you registered with a Dentis... * Did you know about the changes to the wayNHS Contracts a... Crosstabulation
263 255 518
206.2 311.8 518.0
50.8% 49.2% 100.0%
64.1% 41.1% 50.3%
119 264 383
152.5 230.5 383.0
31.1% 68.9% 100.0%
29.0% 42.6% 37.2%
28 101 129
51.3 77.7 129.0
21.7% 78.3% 100.0%
6.8% 16.3% 12.5%
410 620 1030
410.0 620.0 1030.0
39.8% 60.2% 100.0%
100.0% 100.0% 100.0%
Count
Expected Count
% within Do you visit aregular deAre youregistered with a Dentis...
% within Did you knowabout the changes to theway NHS Contracts a...
Count
Expected Count
% within Do you visit aregular deAre youregistered with a Dentis...
% within Did you knowabout the changes to theway NHS Contracts a...
Count
Expected Count
% within Do you visit aregular deAre youregistered with a Dentis...
% within Did you knowabout the changes to theway NHS Contracts a...
Count
Expected Count
% within Do you visit aregular deAre youregistered with a Dentis...
% within Did you knowabout the changes to theway NHS Contracts a...
Yes, I have a regularNHS dentist
Yes, I have a regularprivate dentist
No
Do you visit aregular deAreyou registeredwith a Dentis...
Total
Yes No
Did you know about thechanges to the wayNHS Contracts a...
Total
These rows are looking at the percent of those who have a particular dentist.
These rows are looking at the percent of those who did or didn’t know about the changes.
Chi-Square Tests
13.364a 5 .020
13.377 5 .020
1037
Pearson Chi-Square
Likelihood Ratio
N of Valid Cases
Value dfAsymp. Sig.
(2-sided)
0 cells (.0%) have expected count less than 5. Theminimum expected count is 53.77.
a.
Crosstab
62 89 44 80 66 69 410
56.9 75.5 53.8 89.4 74.7 59.7 410.0
43.1% 46.6% 32.4% 35.4% 34.9% 45.7% 39.5%
82 102 92 146 123 82 627
87.1 115.5 82.2 136.6 114.3 91.3 627.0
56.9% 53.4% 67.6% 64.6% 65.1% 54.3% 60.5%
144 191 136 226 189 151 1037
144.0 191.0 136.0 226.0 189.0 151.0 1037.0
100.0% 100.0% 100.0% 100.0% 100.0% 100.0% 100.0%
Count
Expected Count
% within Area
Count
Expected Count
% within Area
Count
Expected Count
% within Area
Yes
No
Did you know about thechanges to the wayNHS Contracts a...
Total
Alderney,BranksomeEast and
West
Broadstone,Merley andBearwood
Canford Cliffsand Penn Hill
CanfordHeath East &
West,Creekmoor
and Oakdale
HamworthyEast & West
and PooleTown
Newtown andParkstone
Area
Total
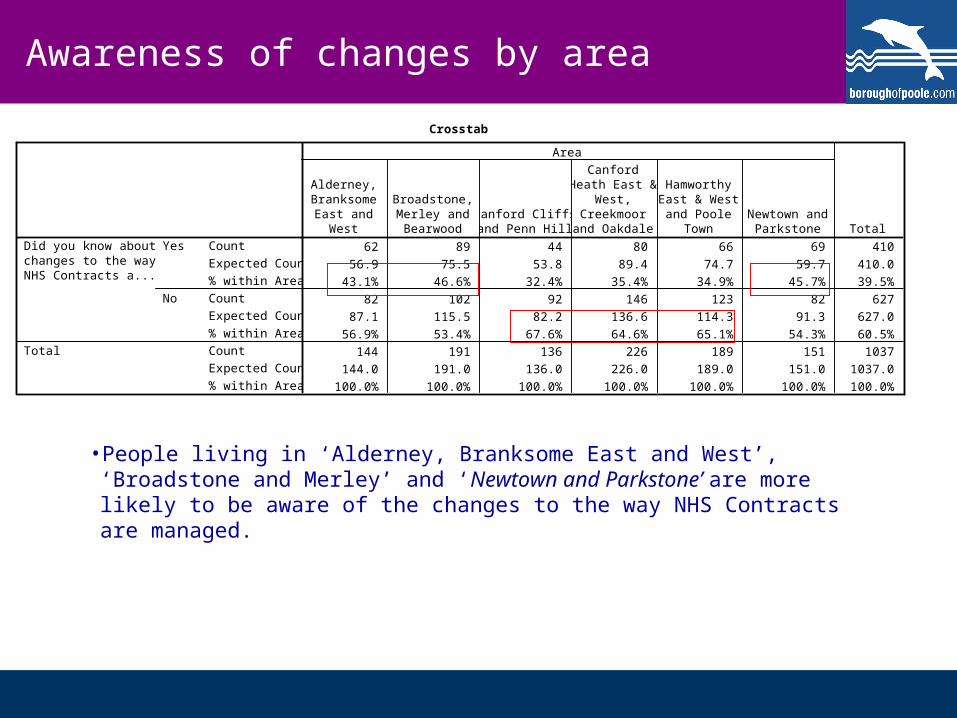
Awareness of changes by area
• People living in ‘Alderney, Branksome East and West’, ‘Broadstone and Merley’ and ‘Newtown and Parkstone’ are more likely to be aware of the changes to the way NHS Contracts are managed.

Chi-Square Tests
21.342a 5 .001
22.227 5 .000
1035
Pearson Chi-Square
Likelihood Ratio
N of Valid Cases
Value dfAsymp. Sig.
(2-sided)
0 cells (.0%) have expected count less than 5. Theminimum expected count is 30.03.
a.
Crosstab
18 86 157 47 77 24 409
30.0 89.7 137.9 46.6 68.4 36.4 409.0
23.7% 37.9% 45.0% 39.8% 44.5% 26.1% 39.5%
58 141 192 71 96 68 626
46.0 137.3 211.1 71.4 104.6 55.6 626.0
76.3% 62.1% 55.0% 60.2% 55.5% 73.9% 60.5%
76 227 349 118 173 92 1035
76.0 227.0 349.0 118.0 173.0 92.0 1035.0
100.0% 100.0% 100.0% 100.0% 100.0% 100.0% 100.0%
Count
Expected Count
% within Age_groups
Count
Expected Count
% within Age_groups
Count
Expected Count
% within Age_groups
Yes
No
Did you know about thechanges to the wayNHS Contracts a...
Total
18-29 30-44 45-59 60-64 65-74 75+
Age_groups
Total
Awareness of changes by age
• Those people aged 30-74 are more likely to be aware of the changes to the way NHS Contracts are managed.

Do you know how to contact an NHS dentist during the day?
Yes54%
No46%
Contacting an NHS Dentist
Do you know how to contact an NHS dentist out of hours?
Yes29%
No71%
Base = all respondents
Base = all respondents
• 54% of respondents said that they know how to contact an NHS Dentist during the day.
• This decreases to 29% who said that they would know how to contact an NHS Dentist out of hours.
• Those who have an NHS Dentist are more likely to know how to contact an NHS Dentist both during the day and out of hours.
• 84% of those who do not have a dentist would not know how to contact an NHS Dentist out of hours.
• Women (57%) are more likely than men (50%) to know who to contact during the day.
• Those people who live in ‘Alderney, Branksome East & West’’ and ‘Newtown and Parkstone’ are more likely to know how to contact an NHS Dentist during the day.
• People who live in ‘Alderney, Branksome East & West’, ‘Canford Heath East & West, Creekmoor and Oakdale’ and ‘Newtown and Parkstone’ are more likely to have an NHS Dentist.

Chi-Square Tests
4.348b 1 .037
4.090 1 .043
4.349 1 .037
.039 .022
1031
Pearson Chi-Square
Continuity Correctiona
Likelihood Ratio
Fisher's Exact Test
N of Valid Cases
Value dfAsymp. Sig.
(2-sided)Exact Sig.(2-sided)
Exact Sig.(1-sided)
Computed only for a 2x2 tablea.
0 cells (.0%) have expected count less than 5. The minimum expected count is 218.37.
b.
Crosstab
317 236 553
300.4 252.6 553.0
56.6% 50.1% 53.6%
243 235 478
259.6 218.4 478.0
43.4% 49.9% 46.4%
560 471 1031
560.0 471.0 1031.0
100.0% 100.0% 100.0%
Count
Expected Count
% within Gender
Count
Expected Count
% within Gender
Count
Expected Count
% within Gender
Yes
No
Do you know how tocontact an NHS dentistduring the day?
Total
Female Male
Gender
Total
Contacting an NHS Dentist by gender
•Women (57%) are more likely than men (50%) to know who to contact during the day.

Chi-Square Tests
25.115a 5 .000
25.394 5 .000
1030
Pearson Chi-Square
Likelihood Ratio
N of Valid Cases
Value dfAsymp. Sig.
(2-sided)
0 cells (.0%) have expected count less than 5. Theminimum expected count is 62.98.
a.
Crosstab
88 91 57 123 94 100 553
76.2 101.5 73.0 120.8 100.9 80.5 553.0
62.0% 48.1% 41.9% 54.7% 50.0% 66.7% 53.7%
54 98 79 102 94 50 477
65.8 87.5 63.0 104.2 87.1 69.5 477.0
38.0% 51.9% 58.1% 45.3% 50.0% 33.3% 46.3%
142 189 136 225 188 150 1030
142.0 189.0 136.0 225.0 188.0 150.0 1030.0
100.0% 100.0% 100.0% 100.0% 100.0% 100.0% 100.0%
Count
Expected Count
% within Area
Count
Expected Count
% within Area
Count
Expected Count
% within Area
Yes
No
Do you know how tocontact an NHS dentistduring the day?
Total
Alderney,BranksomeEast and
West
Broadstone,Merley andBearwood
Canford Cliffsand Penn Hill
CanfordHeath East &
West,Creekmoor
and Oakdale
HamworthyEast & West
and PooleTown
Newtown andParkstone
Area
Total
Contacting an NHS Dentist by area
• Those people who live in ‘Alderney, Branksome East & West’’ and ‘Newtown and Parkstone’ are more likely to know how to contact an NHS Dentist during the day.
• People who live in ‘Alderney, Branksome East & West’, ‘Canford Heath East & West, Creekmoor and Oakdale’ and ‘Newtown and Parkstone’ are more likely to have an NHS Dentist.

Chi-Square Tests
104.928a 2 .000
109.239 2 .000
79.032 1 .000
1025
Pearson Chi-Square
Likelihood Ratio
Linear-by-LinearAssociation
N of Valid Cases
Value dfAsymp. Sig.
(2-sided)
0 cells (.0%) have expected count less than 5. Theminimum expected count is 36.88.
a.
Chi-Square Tests
496.964a 2 .000
549.752 2 .000
374.541 1 .000
1025
Pearson Chi-Square
Likelihood Ratio
Linear-by-LinearAssociation
N of Valid Cases
Value dfAsymp. Sig.
(2-sided)
0 cells (.0%) have expected count less than 5. Theminimum expected count is 59.19.
a.
Do you visit a regular dentist? BYDo you know how to contact an NHS Dentist during the day?
Do you visit a regular dentist? BYDo you know how to contact an NHS Dentist at night?
Crosstab
456 62 518
278.5 239.5 518.0
88.0% 12.0% 100.0%
82.8% 13.1% 50.5%
64 315 379
203.7 175.3 379.0
16.9% 83.1% 100.0%
11.6% 66.5% 37.0%
31 97 128
68.8 59.2 128.0
24.2% 75.8% 100.0%
5.6% 20.5% 12.5%
551 474 1025
551.0 474.0 1025.0
53.8% 46.2% 100.0%
100.0% 100.0% 100.0%
Count
Expected Count
% within Do you visit aregular deAre youregistered with a Dentis...
% within Do you knowhow to contact an NHSdentist during the day?
Count
Expected Count
% within Do you visit aregular deAre youregistered with a Dentis...
% within Do you knowhow to contact an NHSdentist during the day?
Count
Expected Count
% within Do you visit aregular deAre youregistered with a Dentis...
% within Do you knowhow to contact an NHSdentist during the day?
Count
Expected Count
% within Do you visit aregular deAre youregistered with a Dentis...
% within Do you knowhow to contact an NHSdentist during the day?
Yes, I have a regularNHS dentist
Yes, I have a regularprivate dentist
No
Do you visit aregular deAreyou registeredwith a Dentis...
Total
Yes No
Do you know how tocontact an NHS dentist
during the day?
Total
Crosstab
222 296 518
148.1 369.9 518.0
42.9% 57.1% 100.0%
75.8% 40.4% 50.5%
50 328 378
108.1 269.9 378.0
13.2% 86.8% 100.0%
17.1% 44.8% 36.9%
21 108 129
36.9 92.1 129.0
16.3% 83.7% 100.0%
7.2% 14.8% 12.6%
293 732 1025
293.0 732.0 1025.0
28.6% 71.4% 100.0%
100.0% 100.0% 100.0%
Count
Expected Count
% within Do you visit aregular deAre youregistered with a Dentis...
% within Do you knowhow to contact an NHSdentist out of hours?
Count
Expected Count
% within Do you visit aregular deAre youregistered with a Dentis...
% within Do you knowhow to contact an NHSdentist out of hours?
Count
Expected Count
% within Do you visit aregular deAre youregistered with a Dentis...
% within Do you knowhow to contact an NHSdentist out of hours?
Count
Expected Count
% within Do you visit aregular deAre youregistered with a Dentis...
% within Do you knowhow to contact an NHSdentist out of hours?
Yes, I have a regularNHS dentist
Yes, I have a regularprivate dentist
No
Do you visit aregular deAreyou registeredwith a Dentis...
Total
Yes No
Do you know how tocontact an NHS dentist
out of hours?
Total
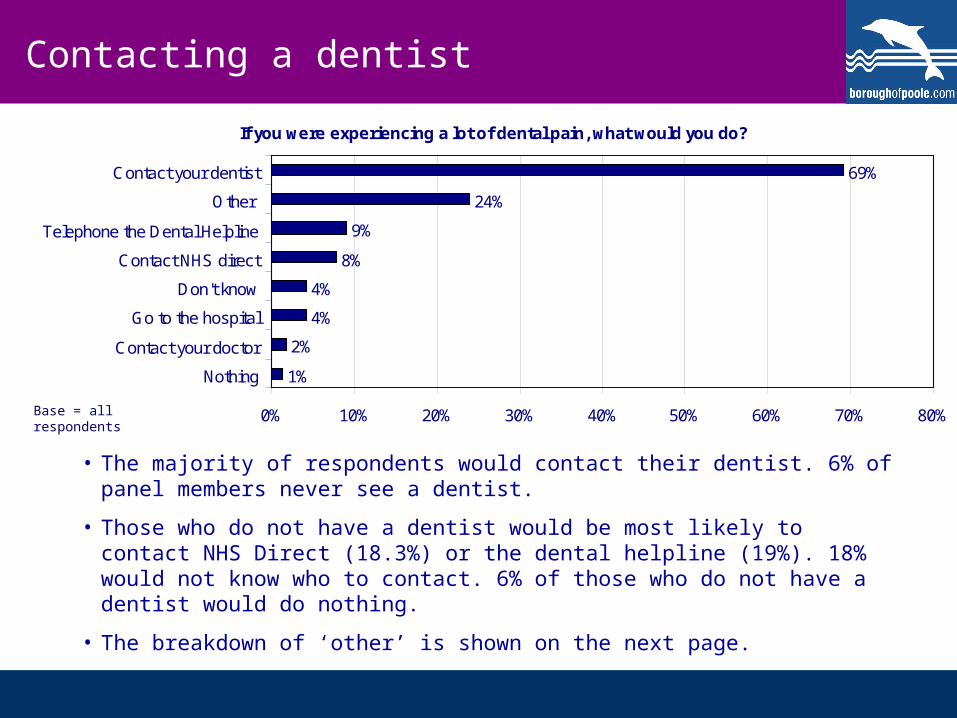
• The majority of respondents would contact their dentist. 6% of panel members never see a dentist.
• Those who do not have a dentist would be most likely to contact NHS Direct (18.3%) or the dental helpline (19%). 18% would not know who to contact. 6% of those who do not have a dentist would do nothing.
• The breakdown of ‘other’ is shown on the next page.
If you were experiencing a lot of dental pain, what would you do?
1%
2%
4%
4%
8%
9%
24%
69%
0% 10% 20% 30% 40% 50% 60% 70% 80%
Nothing
Contact your doctor
Go to the hospital
Don't know
Contact NHS direct
Telephone the Dental Helpline
Other
Contact your dentist
Contacting a dentist
Base = all respondents

Contacting a dentist – other reasons
Private dentist 12
False teeth 8
Take tablets 5
Not aw are of helpline 4
NHS dentist 3
Phone Book 2
NHS Direct 2
Contact a dentist 2
PCT 1
Don't know 1
Dental helpline 1
Cope until they're open 1
Contact Urgent Care Services 1
Contact Health Authority 1

Chi-Square Tests
281.009a 14 .000
249.819 14 .000
112.810 1 .000
1032
Pearson Chi-Square
Likelihood Ratio
Linear-by-LinearAssociation
N of Valid Cases
Value dfAsymp. Sig.
(2-sided)
4 cells (16.7%) have expected count less than 5. Theminimum expected count is 1.59.
a.
Do you visit a regular dentist? BYWhat would you do if experiencing a lot of dental pain?
Do you visit a regular deAre you registered with a Dentis... * If you were experiencing a lot of dental pain, what would... Crosstabulation
393 36 18 47 6 3 17 3 523
363.9 39.5 22.3 47.6 9.1 6.6 21.3 12.7 523.0
75.1% 6.9% 3.4% 9.0% 1.1% .6% 3.3% .6% 100.0%
54.7% 46.2% 40.9% 50.0% 33.3% 23.1% 40.5% 12.0% 50.7%
309 19 16 23 2 3 2 9 383
266.5 28.9 16.3 34.9 6.7 4.8 15.6 9.3 383.0
80.7% 5.0% 4.2% 6.0% .5% .8% .5% 2.3% 100.0%
43.0% 24.4% 36.4% 24.5% 11.1% 23.1% 4.8% 36.0% 37.1%
16 23 10 24 10 7 23 13 126
87.7 9.5 5.4 11.5 2.2 1.6 5.1 3.1 126.0
12.7% 18.3% 7.9% 19.0% 7.9% 5.6% 18.3% 10.3% 100.0%
2.2% 29.5% 22.7% 25.5% 55.6% 53.8% 54.8% 52.0% 12.2%
718 78 44 94 18 13 42 25 1032
718.0 78.0 44.0 94.0 18.0 13.0 42.0 25.0 1032.0
69.6% 7.6% 4.3% 9.1% 1.7% 1.3% 4.1% 2.4% 100.0%
100.0% 100.0% 100.0% 100.0% 100.0% 100.0% 100.0% 100.0% 100.0%
Count
Expected Count
% within Do you visit aregular deAre youregistered with a Dentis...
% within If you wereexperiencing a lot ofdental pain, what would...
Count
Expected Count
% within Do you visit aregular deAre youregistered with a Dentis...
% within If you wereexperiencing a lot ofdental pain, what would...
Count
Expected Count
% within Do you visit aregular deAre youregistered with a Dentis...
% within If you wereexperiencing a lot ofdental pain, what would...
Count
Expected Count
% within Do you visit aregular deAre youregistered with a Dentis...
% within If you wereexperiencing a lot ofdental pain, what would...
Yes, I have a regularNHS dentist
Yes, I have a regularprivate dentist
No
Do you visit aregular deAreyou registeredwith a Dentis...
Total
Contact yourdentist
ContactNHS direct
Go to thehospital
Telephonethe DentalHelpline
Contactyour doctor Nothing Don't know
Other (pleasewrite in)
If you were experiencing a lot of dental pain, what would...
Total
These rows are looking at the percent of those who have a particular dentist.
These rows are looking at whether those people who opt for different methods have a dentist or not.

For more information contact:
Heather Kitching
Consultation Manager
Strategic Planning Services
Ext 3354
More survey results can be found on the
Consultation Portal on the Loop
or on boroughofpoole.com/opinions.