pomme de terre river, muddy creek to marsh lake, …pomme de terre river, muddy creek ... martys...
TRANSCRIPT

Pomme de Terre River, Muddy Creek to Marsh Lake, Fecal Coliform TMDL
For Submission to:
U.S. Environmental Protection Agency
Region 5 Chicago, Illinois
Submitted by:
Minnesota Pollution Control Agency
Muriel Runholt Christopher Zadak Regional Division
and Marilyn Bayerl
Bayerl Water Resources
June 2007
Wq-iw7-08e

Pomme de Terre Watershed Project i Fecal Coliform TMDL
Table of Contents
Executive Summary…………………………………...………………………………1 1.0 Introduction...................................................................................................2
2.0 Watershed Characteristics...........................................................................4
2.1 Land Use ....................................................................................................7
3.0 Description of Applicable Water Quality Standards and Assessment Procedures ..........................................................................................................8
3.1 Applicable Minnesota Water Quality Standards .....................................8
3.2 MPCA Non-degradation Policy...............................................................12
4.0 Description of Fecal Coliform Bacteria and Its Sources .........................13
5.0 Load Allocations (LA), Wasteload Allocations (WLA), and Margins of Safety (MOS) .....................................................................................................20 5.1 Approaches to Allocations Needed to Satisfy the TMDL………………20
5.2 TMDL Allocations for the Impaired Reach ............................................22 5.3 Impacts of Growth on Allocations………………………………………….26
6.0 Margin of Safety ..........................................................................................27
7.0 Seasonal Variation......................................................................................28
8.0 Monitoring Plan...........................................................................................29
9.0 Implementations .........................................................................................29
9.1 Implementation through Source Reduction Strategies........................29
9.2 Locally Targeted Implementation ..........................................................30
10.0 Reasonable Assurance ............................................................................32
10.1 Evidence of BMP Implementability ......................................................32
10.2 Non-regulatory, Regulatory, and Incentive-Based Approaches........33
11.0 Public Participation ..................................................................................33
12.0 References.................................................................................................34
Appendix ...........................................................................................................36
A: Methodology for TMDL Equations and Load Duration Curve ...…………36 B: Flow Duration Curve Power Point for the PdT River Watershed………...38
Figures
2.01 Pomme de Terre (PdT) River Counties and Sub-watersheds...…………5 3.21 PdT River Impaired Reach and Sampling Site……………………………10 3.22 Lower PdT River Sub-watershed 1971-2004 Fecal Coliform Sampling Data by Month………………………………….……………………………….12 4.01 Storm Event Effect on Fecal Coliform Concentrations at Site………...14 4.02 Registered Feedlots in the Pomme de Terre Watershed….……………18 5.21 PdT River Load Duration Curve .……………………………………………26 7.01 Seasonal Variation of Fecal Coliform & Flow at site 1.………………….28
Tables
1.01 Pomme de Terre River (PdT) Watershed Impaired Reach Description...3 1.02 Conversion Equation.…………………………………………………………...4 2.01 Streams in the PdT Watershed..…………….…………………………………6 2.11 Land Use in the PdT Watershed.………………………………………………7 2.12 PdT Sub-watershed Land Uses..…………….………………………………..7 3.21 PdT River Sampling Data for Site 1 (S000-195)..………………………....11 4.01 Wastewater Treatment Facilities in the PdT Watershed..……………....15 4.03 PdT River CAFO and Non-CAFO Animal Units by Sub-watershed.......17 4.04 Inventory of Fecal Coliform Producers in the PdT Watershed ………..19 5.21A Allocations for Wastewater Treatment Facilities……………………….24 5.21B Allocations for MS4 Communities…………………………………………24 5.21C Livestock Facilities with NPDES Permits………………………………...24 5.21D Daily Fecal Coliform Loading Capacity and Allocations ..……………25 7.01 Flow Duration Curve Loadings by Month...…………………………….….29 9.01 Implementation Opportunities for the Different Flow Regimes…….….30
Pomme de Terre Watershed Project ii Fecal Coliform TMDL

TMDL Summary Table Fecal Coliform 07020002-501 Waterbody ID Pomme de Terre River, Muddy Creek to
Marsh Lake
TMDL Page #
Location The Pomme de Terre River Watershed is located in the upper Minnesota River Basin in southwestern Minnesota. The river starts in southern Otter Tail County, flows through Grant, Stevens, and Swift Counties. Parts of Douglas and Big Stone Counties include the watershed also.
4,5
303(d) Listing Information
The impaired reach of the Pomme de Terre River from Muddy Creek to Marsh Lake was listed in 1994 for failure to meet the swimming designated beneficial use due to excessive fecal coliform concentrations. The MPCA’s projected schedule for TMDL completions, as indicated on Minnesota’s 303(d) impaired waters list, implicitly reflects Minnesota’s priority ranking of this TMDL. This TMDL was prioritized to begin in 2006 and be completed in 2010.
3
Impairment / TMDL Pollutant(s) of
Concern Fecal coliform
3
Impaired Beneficial Use(s)
The applicable water body classifications and water quality standards are specified in Minnesota Rules Chapter 7050. Minnesota Rules Chapter 7050.0407 lists water body classifications and Chapter 7050.0200 lists the beneficial uses. This water body is classified as impaired for Aquatic Life and Aquatic Recreation.
8
Applicable Water Quality Standards/ Numeric Targets
The Minn R. ch. 7050.0222 subp. 4 and 5 sets the water quality standard for Class 2B waters, which is the classification of the impaired reach in the Pomme de Terre River. The numeric target for fecal coliform for Class 2B waters is not to exceed 200 organisms per 100 milliliters as a geometric mean of no less than five samples in any calendar month, nor shall more than ten percent of all samples taken during any calendar month individually exceed 2,000 organisms per 100 milliliters. A proposed change to the water quality standard is to shift from fecal coliform to Escherichia coli (E. coli) which will be set at an equivalent level. To apply this TMDL to E. coli allocations, multiply fecal coliform by 0.63.
8, 9
The daily number of fecal coliform organisms was calculated for each of a series of five flow zones ranging from low flow to high flow including dry, mid, and moist zones. Partitioning the daily fecal coliform loads between five flow regimes is referred to as the duration curve approach in this report. The EPA requires that TMDLs take into account “critical conditions for stream flow, loading, and water quality parameters.” This requirement is fulfilled through the analysis and discussion of seasonality, and effects of weather and streamflow, contained in sections 3.2, 4.0, and Figure 5.21 of this report. Critical periods when the standard is exceeded include storm events, and the months of July and August.
Zone Load Capacity (Billion Organisms per Day) High 2984 Moist 886 Mid 401 Dry 166
Loading Capacity (expressed as daily
load)
Low 21
20, 23, 24, 27
Pomme de Terre Watershed Project iii Fecal Coliform TMDL

Source Permit # Individual Daily
WLA CAFOs
New Horizon Dairy LLP 051-62611 0 James Disselkamp Farm 149-70223 0 Deterre Farms 149-70213 0 Farmco Supply LLP 149-50003 0 Martys Swine Systems Inc 149-70172 0 Bruce/Mary Zierke Farm 149-70249 0 Fairfield Genetics Inc 149-70183 0 Leonard Wulf & Sons Inc 149-50005 0 Loren Schmidgall Farm 149-50001 0 Riverview Dairy Inc 149-50007 0 Farmco Supply 151-84043 0 Jennie-O Turkey Store-Jennings Farm 151-50004 0 Jennie-O Turkey Store-Pedersen Brood 151-93689 0 Outback Five Inc 151-50001 0
TOTAL 0 Source Permit # Individual Daily
WLA WWTF
Alberta MNG580002 2.0 Appleton MN0021890 3.3 Ashby MNG580087 5.9 Barrett MN0022713 6.9 Chokio MNG580007 5.9 Morris MN0021318 61.7
TOTAL 85.7 Source Permit # Individual Daily
WLA Straight-Pipe Septics
Illegal Discharges NA 0
Wasteload Allocation
TOTAL 0
23, 24
Source Individual LA High 1788 Moist 462 Mid 193 Dry * Low *
Load Allocation
*Note - Allocation for all "*" = (flow contribution from source) x (200 orgs./100 ml); see Sect 5.1
24
Pomme de Terre Watershed Project iv Fecal Coliform TMDL

Margin of Safety
The MOS is based on the difference between the loading capacity as calculated at the mid-point of each of the five flow ranges, and the loading capacity calculated at the minimum flow in each zone. Given that the loading capacity is typically much less at the minimum flow of a zone as compared to the mid-point, a substantial MOS is provided. This TMDL uses an implicit MOS because no rate of decay was used. Pathogen organisms ordinarily have a limited capability of surviving outside of their hosts and a rate of decay could be developed. However, applying a rate of decay could result in an allocation that would be greater than the WQS, thus no rate of decay is applied to provide for a greater protection of water quality.
26, 27
Seasonal Variation
Summer is the peak season of cattle grazing and agriculture. Soil applications of manure are limited in summer and the soil is presumably at peak seasonal load for fecal coliform by mid summer and is most sensitive to rainfall driven transport mechanisms. Site 1 in the Lower sub-watershed illustrates the variation in fecal coliform concentrations and flows by season (Table and Figure 7.01).
27, 28
Reasonable Assurance
The source reduction strategies listed in this study are shown to be successful in reducing pathogen transport and survival and to be capable of widespread adoption by land owners and local resource managers. Counties will apply for available grants and loans to implement BMPs. The lead for implementation will be sponsored by the Pomme de Terre River Joint Powers Board while the technical work group will monitor and evaluate the implementation strategies, and will advise and make recommendations on the progress of the strategies to the PdT Joint Powers Board.
31, 32
Monitoring There are current monitoring efforts and these efforts will continue in the watershed. Implementation activities at the sub-watershed level will be re-evaluated after monitoring and BMPs can be modified as needed. Annual results will be included in the yearly Pomme de Terre River Watershed Monitoring Summary.
28
Implementation This TMDL identifies locally targeted implementation to be executed by each county included in the watershed. A more detailed plan will be developed within a year of EPA's final approval of this TMDL.
28, 29, 30
Public Participation
The Soil and Water Conservation Districts in the counties in the watershed mailed newsletters updating citizens on the progress of the TMDL. One public meeting was held on May 10, 2007 in Morris, to inform citizens of the impact of the fecal coliform TMDL on the Pomme de Terre River. Over 300 invitations were mailed or emailed to citizens and interested parties in the watershed, and notices of the meetings were put in the local newspapers. A public notice was posted in the State Register and the public comment period extended from August 20, 2007 to September 20, 2007. A total of three written comments were received and are in Appendix C.
32, 46-58
Pomme de Terre Watershed Project v Fecal Coliform TMDL
Pomme de Terre Watershed Project 1 Fecal Coliform TMDL
Minnesota Pollution Control Agency Regional Division
June 2007
Total Maximum Daily Load Report for Fecal Coliform for the
Muddy Creek to Marsh Lake reach of the Pomme de Terre River, Minnesota
Executive Summary The Minnesota Pollution Control Agency (MPCA) listed one stream reach in the Pomme de Terre River Watershed (HUC: 07020002-501) as impaired for swimming designated use (primary contact recreation) under Section 303(d) of the Clean Water Act. The main cause contributing to impairment is excessive fecal coliform bacteria load. This Total Maximum Daily Load (TMDL) report (report) describes the magnitude of the problem and provides direction for improving water quality for the listed reach. The Pomme de Terre River Watershed is located in the upper Minnesota River Basin. The Pomme de Terre (PdT) River originates in southern Otter Tail County and flows about 106 miles south, and discharges into Marsh Lake on the Minnesota River. Monitoring data shows that the lower portion of the PdT River from Muddy Creek to Marsh Lake is impaired for fecal coliform. Land-use is dominated by agricultural cropping and animal production. Beef and swine production represent nearly half of the approximately 64,000 animal units (AUs) in the watershed. This report used a flow duration curve approach to determine the fecal coliform loading capacity at the impaired reach under varying flow regimes. The report focuses on fecal coliform loading capacity and general allocations necessary to meet water quality standards at the impaired reach, rather than on precise loading reductions that may be required from specific sources. Fecal coliform loading capacities were calculated for the impaired reach, and those capacities are allocated among point sources (wasteload allocation), nonpoint sources (load allocation), and a margin of safety. A loading capacity is the product of stream flow at the impaired reach and the fecal coliform water quality standard. Five flow zones, ranging from low flow to high flow are utilized, so that the entire range of conditions are accounted for in the report. A description of the duration curve approach is in Appendix A.

1.0 Introduction Section 303(d) of the Clean Water Act (CWA) provides authority for completing Total Maximum Daily Loads (TMDLs) to achieve state water quality standards and/or their designated uses. The TMDL process establishes the allowable loadings of pollutants for a water body based on the relationship between pollution sources and in-stream water quality conditions. TMDLs provide states a basis for determining the pollutant reductions necessary from both point and nonpoint sources to restore and maintain the quality of their water resources. A TMDL or Total Maximum Daily Load (TMDL) is a calculation of the maximum amount of a pollutant that a water body can receive and still meet water quality standards, and an allocation of that amount to the pollutant's sources. Section 303(d) of the Clean Water Act (CWA) and its implementing regulations (40 C.F.R. § 130.7) require states to identify waters that do not or will not meet applicable water quality standards and to establish TMDLs for pollutants that are causing non-attainment of water quality standards. Water quality standards are set by States, Territories, and Tribes. They identify the uses for each water body, for example, drinking water supply, contact recreation (swimming), and aquatic life support (fishing), and the scientific criteria to support that use. A TMDL needs to account for seasonal variation and must include a margin of safety (MOS). The MOS is a safety factor that accounts for any lack of knowledge concerning the relationship between effluent limitations and water quality. Also, a TMDL must specify pollutant load allocations among sources. The total of all allocations, including wasteload allocations (WLA) for point sources, load allocations (LA) for nonpoint sources (including natural background), and the MOS (if explicitly defined) cannot exceed the maximum allowable pollutant load:
TMDL = sumWLAs + sumLAs + MOS + RC* * The MPCA also requires that “Reserve Capacity” (RC) which is an allocation for future growth be addressed in the TMDL. A TMDL study identifies all sources of the pollutant and determines how much each source must reduce its contribution in order to meet the quality standard. The sum of all contributions must be less than the maximum daily load. Sources that are part of the waste load allocation, with the exception of “straight-pipe” septic systems, are largely controlled through National Pollutant Discharge Elimination System (NPDES) permits. Load allocation sources are controlled through a variety of regulatory and non-regulatory efforts at the local, state, and federal level.
Pomme de Terre Watershed Project 2 Fecal Coliform TMDL

The 1994 Minnesota TMDL Clean Water Act Section 303(d) list identified one impaired reach for the Pomme de Terre River Watershed. The reach was listed as impaired for failure to meet the swimming designated beneficial use due to excessive fecal coliform concentrations. The MPCA’s projected schedule for TMDL completions, as indicated on Minnesota’s 303(d) impaired waters list, implicitly reflects Minnesota’s priority ranking of this TMDL. The project was scheduled to begin in 2006 and be completed in 2010. A willing local group allowed an earlier completion of the TMDL. Ranking criteria for scheduling TMDL projects include, but are not limited to: impairment impacts on public health and aquatic life; public value of the impaired water resource; likelihood of completing the TMDL in an expedient manner, including a strong base of existing data and restorability of the waterbody; technical capability and willingness locally to assist with the TMDL; and appropriate sequencing of TMDLs within a watershed or basin. This document provides the information used to develop a TMDL report for the impaired reach in the Pomme de Terre River Watershed which is located within the Minnesota River Basin in Minnesota (Table 1.01). Table 1.01: Pomme de Terre River Watershed Impaired Reach Description
and Assessment Summary
Reach Description Year listed
River Assessment
Unit ID
# months with >5 Obs.
# months geomean >
200cfu/100ml
Years of Data
Pomme de Terre River
Muddy Creek to Minnesota River
(Marsh Lake Dam) 94 07020002-
501 7 2 71-04
The protocol for this assessment is outlined in MPCA “Listing Methodology” publications found at: http://www.pca.state.mn.us/water/tmdl/index.html#support. The applicable water body classifications and water quality standards are specified in Minnesota Rules Chapter 7050. Minn. R. ch. 7050.0222, subp. 5 lists applicable water quality standards for the impaired reach and Minn. R. ch. 7050.0407 lists water body classifications. Assessment summary information for the impaired reach is listed in Table 1.01. The assessment protocol includes pooling of data by month over a 10-year period. The reach had more than two months with at least five fecal coliform samples that violated the geometric mean water quality standard of 200 colony forming units (cfu) /100ml. The reach is partially supporting if the standard is violated two or less months, and non-supporting if violated greater than two months. The Pomme de Terre Watershed has been studied since May 1964 when it was included in the West Central Minnesota Resource Conservation and Development Area (currently WesMin RC & D) plan. In 1981 the Pomme de Terre River (PdT) Association was organized and a Joint Powers Board (JPB) was created and signed by the six Counties and Soil and Water Conservation
Pomme de Terre Watershed Project 3 Fecal Coliform TMDL

Districts (SWCDs) in the watershed. The MPCA gave funding of $50,000 to the PdT Watershed Project at the end of June 2000, to compile all of the data that has been studied in the Pomme de Terre River Watershed. The PdT River Association was awarded a grant in 2002 by the MPCA to investigate the water quality in the Watershed. The PdT Association and WesMin RC&D have ongoing monitoring efforts in the watershed, results from which are used throughout this report. Table 1.02 shows the conversion of flow from cubic feet per second (cfs) to million gallons per day (MGD), and loads from colony forming units (cfu)/ 100ml to organisms per day and vice versa. This report states flow in MGD, and loads in cfu/100ml and organisms per day. Table 1.02: Conversion equations Flow: cubic feet/second (cfs) and Million gallons per day (MGD); 1 cfs = 0.646 MGD
To change cfu*/100ml to organisms*/day using flow in cfs or MGD
Flow in cfs Cfu/100ml x ft3/second x 28,317 ml/ ft3 x 86,400 seconds/day = orgs./day
Flow in MGD Cfu/100ml x 3,785 ml/gallon x 1E+6 gal./1MG x MGD = orgs./day
To change organisms*/day to cfu*/100ml using flow in cfs or MGD
Flow in cfs Orgs/day x 1/cfs x 1/28,317ml/ft3 x 1/86,400sec/day x 100 = cfu/100ml
Flow in MGD Orgs/day x 1/MGD x 1MG/1E+6 gal. x gal./3,785 ml x 100 = cfu/100ml
*cfu (colony forming units) is equivalent to organisms
2.0 Watershed Characteristics The Pomme de Terre River Watershed (Watershed) is located in the upper Minnesota River Basin. It comprises nearly 559,966 acres or about 905 square miles. The majority of the Watershed is in the Northern Glaciated Plains ecoregion, with the northern tip in the Red River Valley ecoregion. The counties and sub-watersheds are shown in Figure 2.01. The total human population in the watershed is estimated to be about 18,400 (2002 Census, and 2006 League of Minnesota Cities). Of this, nearly 9,700 are urban and 8,700 are rural, 53% and 47% respectively. The urban population is served by centralized sewage treatment. It is estimated that 50% of the rural households have out of compliance septic systems. Of these, 25% or 435 households, have septic systems which directly discharge to tile.
Pomme de Terre Watershed Project 4 Fecal Coliform TMDL
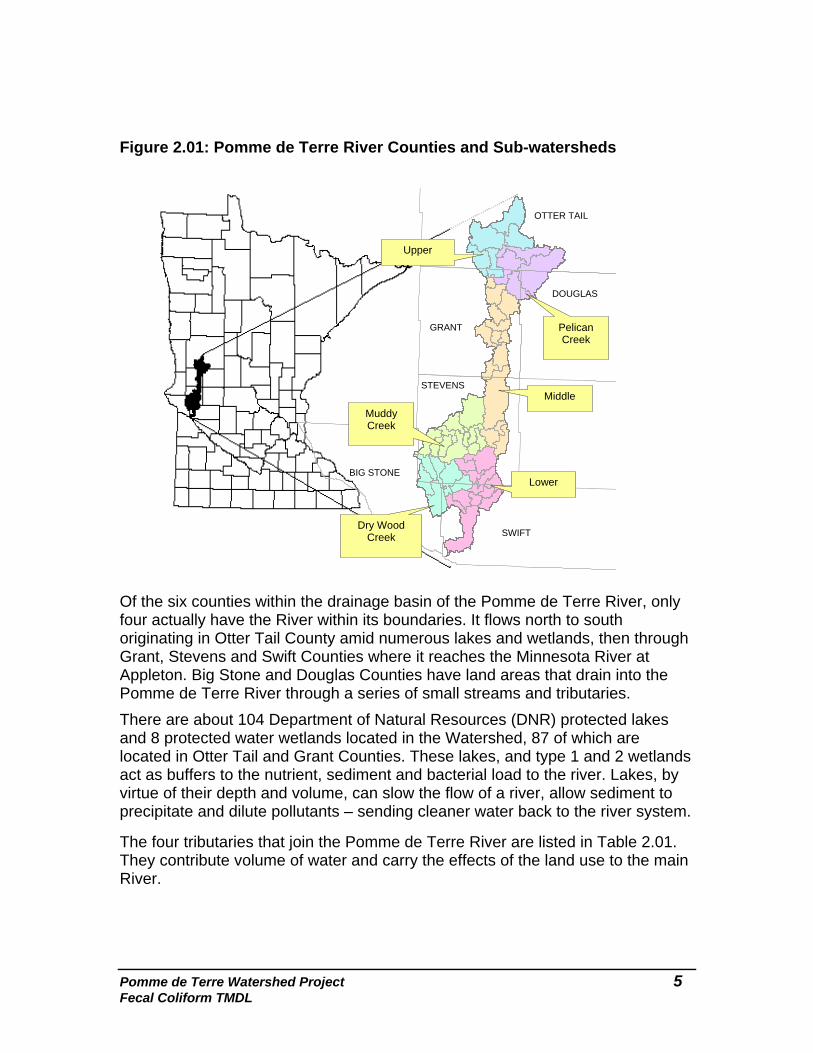
Figure 2.01: Pomme de Terre River Counties and Sub-watersheds
Of the six counties within the drainage basin of the Pomme de Terre River, only four actually have the River within its boundaries. It flows north to south originating in Otter Tail County amid numerous lakes and wetlands, then through Grant, Stevens and Swift Counties where it reaches the Minnesota River at Appleton. Big Stone and Douglas Counties have land areas that drain into the Pomme de Terre River through a series of small streams and tributaries.
Lower
Dry Wood Creek
Muddy Creek
Middle
Pelican Creek
Upper
BIG STONE
SWIFT
STEVENS
OTTER TAIL
DOUGLAS
GRANT
There are about 104 Department of Natural Resources (DNR) protected lakes and 8 protected water wetlands located in the Watershed, 87 of which are located in Otter Tail and Grant Counties. These lakes, and type 1 and 2 wetlands act as buffers to the nutrient, sediment and bacterial load to the river. Lakes, by virtue of their depth and volume, can slow the flow of a river, allow sediment to precipitate and dilute pollutants – sending cleaner water back to the river system. The four tributaries that join the Pomme de Terre River are listed in Table 2.01. They contribute volume of water and carry the effects of the land use to the main River.
Pomme de Terre Watershed Project 5 Fecal Coliform TMDL

Table 2.01: Streams in the Pomme de Terre River Watershed
STREAM NAME TOTAL
STREAM MILES
TOTAL PERENNIAL
STREAM MILES
TOTAL INTERMITTENT STREAM MILES
Artichoke Creek 2.7 0.0 2.7 Dry Wood Creek 10.1 3.2 6.9 Muddy Creek 31.5 11.1 20.4 Pelican Creek 12.4 12.4 0.0 Pomme de Terre River 105.9 105.9 0.0 Total Named Streams 162.6 132.6 30 Total Major Watershed Streams 750.7 134.6 616.7
Minnesota River Basin Data Center, Minnesota State University, Mankato. The 52 minor watersheds within the Pomme de Terre River Watershed can be combined by drainage areas as shown in Figure 2.01, into the following six sub-watersheds:
Upper Pomme de Terre River, Pelican Creek, Middle Pomme de Terre River, Muddy Creek, Dry Wood Creek, and Lower Pomme de Terre River.
A USGS flow gage, number 0529400, is located in the Lower Pomme de Terre River sub-watershed on the Pomme de Terre River in Appleton. This is shown in figure 3.21 as site 1. Data has been collected from this flow gage since 1931 and is in current operation as a real-time site. Information about this USGS flow gage and available data can be found on the internet at http://waterdata.usgs.gov/mn/nwis/nwisman/?site_no=05294000&agency_cd=USGS.
Pomme de Terre Watershed Project 6 Fecal Coliform TMDL

2.1 Land Use The Pomme de Terre Watershed is largely rural. Cultivated and grassland make up about 76% of the watershed, and urban land makes up nearly 2%. Cultivated includes Confined Animal Feeding Operations (CAFOs). Corn and soybeans make up about 50% of the crops grown in the Watershed. The other 50% is made up mostly by smaller grains such as hay, and grasslands enrolled in the Conservation Reserve Program Table 2.11 shows the land use in the watershed. Table 2.21 shows the drainage area of the impaired reach and its sub-watershed land use. Table 2.11: Land Use in the Pomme de Terre River Watershed LAND USE NUMBER OF ACRES % OF WATERSHED Cultivated 386,362 65.9 Grassland 47,694 8.1 Forest 38,031 6.5 Water and Wetland 63,580 11.7 Urban/Residential 9,013 1.5 Other 15,328 2.6 TOTAL 586,128
1999 Land Use Inventory , Land Management Information Center Table 2.12: Pomme de Terre River Sub-watershed Land Uses
Land Use Percent of sub-watersheds
Sub-watershed Acres Cultivated Grassland Forest Water/ Wetland
Urban/ Residential Other
Dry Wood Creek 61,778 81.4 5.2 2.2 8.0 0.1 2.0Lower PdT 97,832 84.5 6.4 3.0 1.9 3.8 2.3Middle PdT 137,733 72.4 9.4 3.9 9.3 2.3 2.5Muddy Creek 92,350 86.0 4.2 1.6 5.1 1.3 3.4Pelican Creek 84,939 42.2 15.4 14.7 22.7 1.4 3.5Upper PdT 85,496 44.7 9.5 16.6 23.2 1.4 4.5
NRCS GIS database
Pomme de Terre Watershed Project 7 Fecal Coliform TMDL

3.0 Description of Applicable Water Quality Standards and
Assessment Procedures The TMDL evaluation is a method of addressing and assessing the fecal coliform bacteria exceedences of the state standard. All waters of Minnesota are assigned classes, based on their suitability for the following beneficial uses (Minn. Rules part 7050.0200):
Class 1 – Domestic consumption Class 2 – Aquatic life and recreation Class 3 – Industrial consumption Class 4 – Agriculture and wildlife Class 5 – Aesthetic enjoyment and navigation Class 6 – Other uses Class 7 – Limited resource value
According to MN Rules ch. 7050.0470, the impaired reach covered in this TMDL Report is classified as Class 2B, 3B, 4A, 4B, 5 and 6 waters. The designated beneficial use for 2B waters is as follows:
Aquatic life support refers to cool or warm water sport and commercial fish and associated aquatic life. Recreation support refers to aquatic recreation of all kinds, including bathing.
3.1 Applicable Minnesota Water Quality Standards Minn. R. ch. 7050.0222 subp. 4 and 5, fecal coliform water quality standard for Class 2B waters states that fecal coliform shall not exceed 200 organisms per 100 milliliters as a geometric mean of not less than five samples in any calendar month, nor shall more than ten percent of all samples taken during any calendar month individually exceed 2,000 organisms per 100 milliliters. The standard applies only between April 1 and October 31.
This report focuses on the 200 organisms per 100 ml monthly geometric mean as an environmental endpoint for impaired reaches. Establishing TMDLs to meet the geometric mean of 200 organisms/100ml rather than the no exceedance of the 2,000 organisms per 100 ml in more than 10% of single samples is consistent with EPAs recent promulgation of water quality criteria for coastal recreational waters. The preamble of the coastal recreational water rule states: “the geometric mean is the more relevant value for ensuring that appropriate actions are taken to protect and improve water quality because it is a more reliable measure, being less subject to random variation” (EPA, 2004). The same source-reduction measures that are required to attain compliance with the ‘chronic” standard also will lead to attainment of compliance with the “acute” standard of 2,000 organisms/100ml cited above. This report requires compliance with both parts of the standard.
Pomme de Terre Watershed Project 8 Fecal Coliform TMDL

Changes to some water quality standards in Minn R. ch. 7050 are being proposed. One change is to shift from a fecal coliform standard to an Escherichia coli standard, which will be set at an equivalent level to provide an equivalent level of protection. Specifically, the change takes into account water analysis studies that show an average of 63 percent of fecal coliform are E. coli. E. coli will be set as the standard for most situations as a percentage of the current fecal coliform standard (i.e., monthly geometric mean of 126 E. coli bacteria/100ml). To adapt the fecal coliform TMDL allocations to future E. coli allocations, multiply fecal coliform by 0.63.
Impaired Assessment Impairment assessment is based on the procedures found at: http://www.pca.state.mn.us/water/tmdl/index.html#support
For support of swimming and recreation, the fecal coliform methodology (303(d) listing) is as follows: Data are aggregated over a ten-year period by month and by reach. If the geometric mean in at least five samples for each appropriate month (all years combined) exceeded 200 organisms per 100ml, that reach was placed on the 1998 303(d) list. In addition, if at least 10 percent of the entire data set for a reach during the ten-year period exceeded 2,000 organisms per 100ml then that reach was also placed on the list. The methodology focuses on monthly analysis of 200 organisms/ 100ml standard and brings in the aspect that stream reaches showing a minimum threshold number of high individual values have impaired use and are included on the list.
The MPCA monitored the Pomme de Terre River for fecal coliform at Site 1 (S000-195) identified in Figure 3.21. Table 1.01 provides summary information of the data used to determine the impairment status of the impaired reach included in this report.
Pomme de Terre Watershed Project 9 Fecal Coliform TMDL

Pomme de Terre Watershed Project 10
Figure 3.21: Pomme de Terre River Impaired Reach and Sampling Site
UpperSub-watershed
Pelican CreekSub-watershed
Muddy CreekSub-watershed Middle
Sub-watershed
Dry Wood CreekSub-watershed Lower
Sub-watershed
±Created in 2006 by MPCA
10 5 10 15 202.5
Miles
Fecal coliform sampling data from 1971 to 2004 for the Lower Sub-watershed is listed in Table 3.21. Site 1 in Figure 3.21 corresponds to site S000-195. The sub-watershed exceeded the chronic and acute standards at least once during the sampling period used in this report. Figure 3.22 shows the sampling data by month for the Lower Sub-watershed.
Fecal Coliform TMDL

rshed Project 11 Fecal Coliform TMDL
Table 3.21: Pomme de Terre River Sampling Data for Site 1 (S000-195) Date cfu/100ml Date cfu/100ml Date cfu/100ml Date cfu/100ml Date cfu/100ml Date cfu/100ml Date cfu/100ml
4/14/72 1700 5/31/73 80 6/1/72 130 7/28/72 7900 8/11/71 310 9/3/71 80 10/14/71 80
4/20/73 3300 5/7/74 330 6/28/72 7000 7/27/73 790 8/25/72 490 9/28/72 130 10/26/72 4800
4/10/74 20 5/20/75 330 6/29/73 170 7/30/74 1700 8/31/73 170 9/19/73 270 10/23/73 50
4/16/75 490 5/25/76 70 6/26/74 1100 7/15/75 790 8/20/74 1700 9/17/74 2300 10/16/74 2300
4/27/76 20 5/17/77 80 6/17/75 2300 7/21/76 1100 8/26/75 3300 9/23/75 230 10/21/75 20
4/19/77 20 5/9/79 20 6/22/76 50 7/19/77 50 8/17/76 40 9/28/76 20 10/26/76 20
4/4/79 20 5/5/80 20 6/21/77 50 7/9/79 230 8/16/77 80 9/20/77 80 10/2/78 20
4/7/80 20 5/6/81 20 6/4/79 220 7/7/80 790 8/6/79 700 9/4/79 330 10/1/79 80
4/8/81 20 5/3/82 20 6/3/80 790 7/8/81 490 8/4/80 330 9/8/80 140 10/1/80 50
4/5/82 490 5/4/83 20 6/11/81 20 7/6/82 1800 8/5/81 1500 9/1/81 460 10/7/81 130
4/6/83 20 5/10/84 50 6/1/82 60 7/7/83 330 8/2/82 270 9/22/82 80 10/7/82 790
4/11/84 20 5/9/85 12 6/8/83 50 7/11/84 490 8/1/83 80 9/6/83 330 10/5/83 50
4/11/85 8 5/6/87 4 6/6/84 790 7/11/85 130 8/8/84 1300 9/12/84 330 10/9/85 12
4/30/87 40 5/26/88 60 6/6/85 220 7/9/86 280 8/8/85 140 9/5/85 240 10/8/86 100
4/7/88 20 5/3/89 12 6/3/87 120 7/8/87 120 8/6/86 99 9/11/86 150 10/8/87 8
4/5/89 4 5/9/90 16 6/9/88 220 7/6/88 520 8/5/87 90 9/10/87 28 10/5/88 4
4/26/90 28 5/21/91 36 6/7/89 110 7/12/89 180 8/11/88 45 9/6/88 28 10/5/89 12
4/8/91 24 5/20/92 76 6/11/90 500 7/11/90 2900 8/3/89 60 9/7/89 150 10/22/90 9
4/13/92 16 5/12/93 24 6/10/91 360 7/23/91 860 8/1/90 4200 9/6/90 860 10/8/91 800
4/7/93 12 5/1/94 620 6/28/93 220 7/1/92 540 8/12/91 180 9/24/91 680 10/12/92 72
4/25/01 110 5/22/94 18 6/27/94 210 7/27/92 460 8/24/92 6300 9/14/92 400 10/26/93 81
4/27/04 60 5/15/01 73 6/6/01 170 7/29/93 140 8/16/93 360 9/27/93 120 10/24/00 18
Geomean 43 5/24/04 120 6/28/04 260 7/11/94 440 8/31/94 410 9/19/94 260 10/22/03 20
Geomean 42 6/28/04 4 7/11/01 200 8/28/01 120 9/19/01 420 10/22/03 4
Geomean 193 7/21/04 210 8/25/04 310 9/8/04 160 Geomean 53
Geomean 474 Geomean 319 Geomean 190
Pomme de Terre Wate

Pomme de Terre Watershed Project 12 Fecal Coliform TMDL
Figure 3.22: Lower Pomme de Terre River Sub-watershed 1971-2004 Fecal
Coliform Sampling Data by Month
0
50
100
150
200
250
April May June July August Sept
Months
300
350
400
450
500
ember October
Feca
l Col
iform
(cfu
/100
ml)
Standard
3.2 MPCA Non-degradation Policy Non-degradation is an important component of water quality standards in Minnesota. MPCA policy distinguishes non-degradation for all waters from non-degradation for Outstanding Resource Value Waters (ORVW), as follows: Minn. R. ch 7050.0185, subp. 1. Non-degradation for All Waters. The potential capacity of the water to assimilate additional wastes and the beneficial uses inherent in water resources are valuable public resources. It is the policy of the state of Minnesota to protect all waters from significant degradation from point and nonpoint sources and wetland alterations, and to maintain existing water uses, aquatic and wetland habitats, and the level of water quality necessary to protect these uses.

4.0 Description of Fecal Coliform Bacteria and Its Sources Fecal coliform bacteria represent a group of several genera found in the intestines of warm-blood animals and is always associated with fecal matter. Certain strains of the fecal coliform bacteria group e.g. Escherichia coli are extremely pathogenic. Public health uses fecal coliform as an indicator of the presence of pathogens, due to the similarity between their habitats and the characteristics of pathogenic organisms. Excessive fecal coliform concentrations in water bodies e.g. lakes, rivers and streams can pose a public health threat when humans come in contact with the water. The assessment of fecal coliform sources within a watershed and establishing the cause-effect relationship between the sources, the transport mechanisms, and the subsequent stream loading is complex and difficult to quantify. The survival rate of fecal coliform in terrestrial and aquatic environments is poorly understood and further exacerbates efforts to track sources. Data shows a strong positive correlation between precipitation, and fecal coliform bacteria concentrations (Figure 4.01). When storms occur, weather-driven sources, e.g. feedlot runoff, overgrazed pasture runoff, manured fields, and urban stormwater overshadow continuous sources. In drought or low-flow conditions continuous sources, e.g. cattle in streams, failing individual sewage treatment systems, unsewered communities, and wastewater treatment facilities dominate. Besides precipitation and flow, factors such as temperature, livestock management practices, wildlife activities, fecal deposit age, and channel and bank storage also affect bacterial concentrations in runoff (Baxter-Potter and Gilliland, 1988). Sites close to rain gages indicated differences between wet and dry periods. Comparing rain events at the National Weather Service station at site 1 and sampling data, the data indicates that the standard is not breached in rain events less than 0.5 inches. If there are two or more rain events of 0.5 inches or greater within a day of each other, the standard may be breached in three or four days. If the rain event is 2-3 inches in magnitude or more, the standard is breached immediately. This suggests that readily available fecal coliform sources are storm event driven, and runoff from rain events is the primary delivery mechanism in wet periods. Figure 4.01 compares storm events and non storm event data at different time periods at site 1.
Pomme de Terre Watershed Project 13 Fecal Coliform TMDL
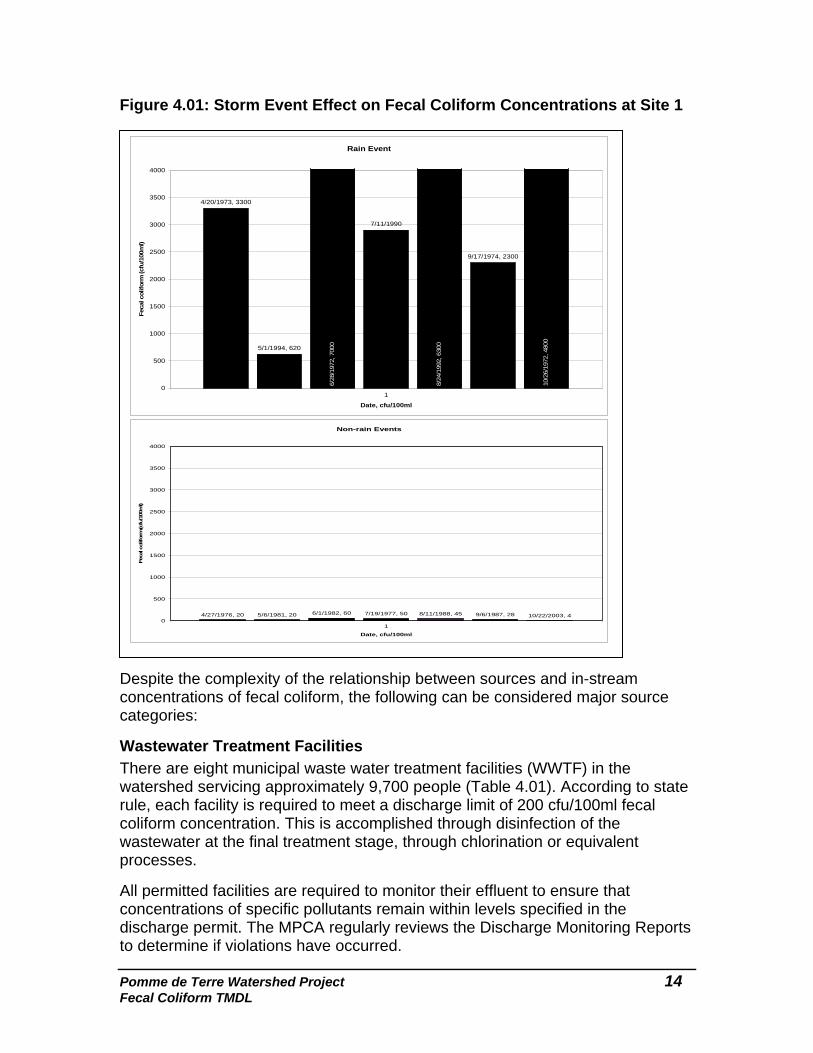
Figure 4.01: Storm Event Effect on Fecal Coliform Concentrations at Site 1
Rain Event
5/1/1994, 620
6/28
/197
2, 7
000
7/11/1990
9/17/1974, 2300
10/2
6/19
72, 4
800
4/20/1973, 3300
8/24
/199
2, 6
300
0
500
1000
1500
2000
2500
3000
3500
4000
1
Date, cfu/100ml
Feca
l col
iform
(cfu
/100
ml)
Non-rain Events
5/6/1981, 20 6/1/1982, 60 7/19/1977, 50 8/11/1988, 45 9/6/1987, 28 10/22/2003, 44/27/1976, 200
500
1000
1500
2000
2500
3000
3500
4000
1
Date, cfu/100ml
Feca
l col
iform
(cfu
/100
ml)
Despite the complexity of the relationship between sources and in-stream concentrations of fecal coliform, the following can be considered major source categories: Wastewater Treatment Facilities There are eight municipal waste water treatment facilities (WWTF) in the watershed servicing approximately 9,700 people (Table 4.01). According to state rule, each facility is required to meet a discharge limit of 200 cfu/100ml fecal coliform concentration. This is accomplished through disinfection of the wastewater at the final treatment stage, through chlorination or equivalent processes. All permitted facilities are required to monitor their effluent to ensure that concentrations of specific pollutants remain within levels specified in the discharge permit. The MPCA regularly reviews the Discharge Monitoring Reports to determine if violations have occurred.
Pomme de Terre Watershed Project 14 Fecal Coliform TMDL

Table 4.01: Waste Water Treatment Facilities in the Pomme de Terre River
Watershed
WWTF Permit # County
2000-2006 Mean FC
cfu.100ml1
2000-2006 Mean MGD1
2000-2006 Mean FC
Discharge orgs/day
Load at Standard Population2
Alberta MNG580002 Stevens 21 0.270 2.14E+8 2.04E+9 130Appleton MN0021890 Swift 61 0.315 7.27E+8 2.38E+9 2,680Ashby MNG580087 Grant 183 0.39 2.7E+9 2.95E+9 460Barrett MN0022713 Grant 166 0.783 4.92E+9 5.93E+9 332Chokio MNG580007 Stevens 161 0.679 4.14E+9 5.14E+9 418Dalton3 MN0023141 Otter Tail 0 0 -- 252Morris MN0021318 Stevens 73 0.809 2.24E+9 6.12E+9 5,085Underwood3 MN0025071 Otter Tail 0 0 -- 34412000-2006 MPCA Daily Monitoring Reports TOTAL 1.50E +10 2.46E+10 9,7012League of MN Cities, 2006 3No discharge to surface water Six of the eight municipalities with WWTFs discharge to surface water, while two WWTFs, Dalton and Underwood, do not discharge to surface water, but discharge by spray irrigation and groundwater infiltration respectively. Alberta, Ashby, Barrett, Chokio, and Morris are all pond systems. Appleton is the only community with a mechanical system. The seven year average discharge for the six WWTFs is 1.51E+10 organisms per day. The seven year load equivalent to the standard is 2.46E+10 organisms per day. Of the six that discharge to surface water, three WWTFs, Appleton, NPDES Permit # MN0021890, Ashby, NPDES Permit # MNG580087, and Chokio, NPDES Permit # MNG580007, discharged above the chronic standard. Appleton, Ashby, and Chokio each violated the standard one time…Appleton in 2004, Ashby and Chokio in 2001. The Appleton, Ashby, and Chokio, WWTFs are currently in compliance. Unsewered Communities There are no unsewered communities in the Pomme de Terre Watershed Individual Sewage Treatment Systems The number of failing Individual Septic Treatment Systems (ISTS) was extrapolated from a survey done in the Hawk Creek Watershed in 1999 as part of the Clean Water Partnership study (Gillingham, 2003). Dye studies showed that 50% of the septic systems in the study area were nonconforming and of these 25% had a direct-to-tile discharge and were identified as failing. There are approximately 8,700 rural residents in the Pomme de Terre Watershed, using the 2002 census figure of nearly 2.5 residents per household, there are approximately 3,480 rural households in the Watershed. If 50% of the septic systems in rural households are noncompliant and 25% of these are discharging directly to tile, it is assumed that there are approximately 435 rural households,
Pomme de Terre Watershed Project 15 Fecal Coliform TMDL

representing 1,085 people, with failing septic systems in the Watershed. County staff verified these assumptions. Urban and Rural Stormwater The City of Morris is designated for permit coverage because their population exceeds 5000 and they are within ½ mile of an impaired water body (HUC: 07020002-502, biotic impairment for fish). The City of Morris currently covers about 0.79 percent of the watershed and is therefore assumed to contribute less than 1 percent of the total fecal coliform load to the Pomme de Terre River. Consequently, the WLA for NPDES permitted stormwater is de minimus. Untreated stormwater from cities, small towns, and rural residential or commercial areas can be a source for many pollutants including fecal coliform bacteria and associated pathogens. Fecal coliform concentrations in urban runoff can be as great as or greater than those found in cropland runoff, and feedlot runoff (USEPA 2001). Sources of fecal coliform in urban and residential stormwater include pet and wildlife waste that can be directly conveyed to streams and rivers via impervious surfaces and storm sewer systems. Newer urban development often includes stormwater treatment, such as, sedimentation basins, infiltration areas, and vegetated filter strips. Livestock facilities with NPDES Permits A Confined Animal Feeding Operation (CAFO) is a feedlot having 1,000 or more animal units, or a smaller feedlot with a direct man-made conveyance to surface water. A feedlot designated as a CAFO is required to operate in accordance with a National Pollutant Discharge Elimination System (NPDES) permit. According to the 2003 MPCA Feedlot database there are fourteen CAFOs in the watershed. Two CAFOs are located in the Dry Wood Creek sub-watershed with a total of 1,826 swine AUs. Seven are in the Lower PdT representing 3,938 dairy AUs, 2,950 beef AUs, 3,440 swine AUs and 4,018 turkey AUs. Two are in Muddy Creek with 2,310 swine AUs, and three CAFOs are located in the Middle PdT sub-watershed representing 980 dairy AUs and 1969 swine AUs (Table 4.03). NonCAFO Livestock Facilities and Manure Runoff from livestock feedlots, pastures, and land application areas has the potential to be a significant source of fecal coliform bacteria and other pollutants. There is considerable spatial variation in the type and density of livestock across the watershed.
The 2003 MPCA registered feedlot data base lists nearly 64,000 AUs in the watershed mainly representing dairy, beef, swine, and turkey. Other animals can include horses, goats, bulls and mink. The type and number of AUs in each sub-watershed is listed in Table 4.03. Figure 4.02 is the watershed map showing the location of feedlots and pastures in the sub-watersheds. County personnel in the seven counties in the watershed verified that the 2003 feedlot database gave an accurate accounting of animals in their jurisdictions.
Pomme de Terre Watershed Project 16 Fecal Coliform TMDL

The Lower PdT sub-watershed has the highest number of AUs with 25,447, followed by the Middle PdT, Muddy Creek, and Dry Wood Creek sub-watersheds with 12,137, 9,441 and 6,185 AUs respectively. The lowest number of AUs is in the Upper PdT and Pelican Creek sub-watersheds with 4,542 and 4,550 AUs respectively. For the entire watershed, beef AUs and swine AUs are nearly equal and twice the AUs of dairy. Turkey AUs are less than half of the dairy AUs. Table 4.03: Pomme de Terre River Watershed CAFO and Non-CAFO
Animal Units by type and Sub-watershed1 Sub-watershed Source CAFO AU Non-CAFO AU Total AULower Pomme de Terre Dairy 3938 -- 3938 Beef 2950 7553 10503 Swine 3440 4477 7917 Poultry 4018 -- 4018 Other* -- 71 71 Dry Wood Creek Dairy -- -- -- Beef -- 727 727 Swine 1826 3600 5426 Poultry -- -- -- Other* -- 2 2 Muddy Creek Dairy -- 346 346 Beef -- 3190 3190 Swine 2310 3988 6298 Poultry -- 31 31 Other* -- 76 76 Middle Pomme de Terre Dairy 980 1498 2478 Beef -- 3494 3494 Swine 1969 4196 6165 Poultry -- -- -- Other* -- 125 125 Pelican Creek Dairy -- 1604 1604 Beef -- 2592 2592 Swine -- 238 238 Poultry -- 3 3 Other* -- 113 113 Upper Pomme de Terre Dairy -- 2455 2455 Beef -- 1444 1444 Swine -- 46 46 Poultry -- 553 553 Other* -- 44 44 Total 21434 42466 63897
*Other: can include horses, sheep, goats, bulls, & mink 1MPCA 2003 Feedlot Database
Pomme de Terre Watershed Project 17 Fecal Coliform TMDL

Pomme de Terre Watershed Project 18
D DDD
DD
D
D
D
DD
DD
D
D
D
D
D
DD
D
D
D
D
D
D
D
D
D
D
D
D
DD
D
D
D
D
D
D
DD
D
D
D D
D
D
DDD
D
DD
D
D
D
D DD
D
D
D
D
D
D
D
D
D
D
D
DD
D
D
DDD
D
D
DD
D
D
D
D D
D
D
D
D
DD
D
D
D
D
DDD
D
D
D
D
DD
D
D
D
D
D
D
D
D
D
D
D
D
DD
D
D
(
( (((
(
(
(
(
(
((
(((
(
(
((
(
(
(
(
(
(
(
(
(
(
(
(
((
(
(
(
(
(
(
(
(
(
(
( (
(
(((
(
((
(
(
(
(
(
( (
(
((
(
(
(
(
(
((
(
(
(
(
(
(
(
(
(((
(
(
(
(
(
(
(
(
(
(
(
((
(
(
(
(
( (
((
(((
(
(
(
(
(
(
((
(
(
(
(
(
(
(
(
(
(
(
((
(
(
(((
(
(
(
(
(
( (
(
(
(
(
(
(
(
(
(
(
(
(
!!
! !!!
!
!
!
!
!
!
!
!
!
!!
!
!
!
!
!
!
!
!
!
!!
!
!
!
!
!
!
!
!
!
!
!
!
!
!
!
!
!
!
!
!!
!
!
!
!
!
!
!
!
!
!
! !
!
!
!!!
!
!!
!!
!
!
!
!
! !
!!
!!
!
!
!
!
!
!
!
!
!
!
!
!
!
!
!
!
!
! !
!
!
!
!
!
!
!
!
!
!
!
!
!
!
!
!
!
!
!
!
!
! !
!
!
!
!
!
!!
!
!
!
!
!
!
!
!
!
!!
!
!
!
!
!
!
!!
!
!!
!
!
!
!
!
!
!
!
!
!!
!
!
!
!
!
!
!
!
!
!
!
!
!
!
!
!
!
!
!
!
!
!
!
!
!
!!
!
!
!
!
!
!!
!
!
!
!
!
!
! !
!
!
!
!
!
!
!
!
!
!
!
!
!
!
!
!
!
!
!
!
!
!
!
Big Stone
Swift
Stevens
Grant
Douglas
Otter Tail
Legend! Registered Feedlots
( Feedlots within 1000' surface water
D Feedlots with pastures±Created in 2006 from MPCA
2003 Feedlot Data Base0 5 10 15 202.5
Miles
LowerSub-watershed
Middle Sub-watershed
Dry Wood CreekSub-watershed
Muddy CreekSub-watershed
Pelican CreekSub-watershed
UpperSub-watershed
Registered Feedlots in the Pomme de Terre River Watershed
Figure 4.02: 2003 Registered Feedlots in the Pomme de Terre
Fecal Coliform TMDL

Pomme de Terre Watershed Project 19 Fecal Coliform TMDL
Natural and Background Fecal Coliform Pollutant Loads Natural background loads for fecal coliform bacteria can be attributed to wildlife (primarily deer and geese). Deer populations, estimated by modeling, range from 2.6 to 9.4 deer per square mile in the spring 2001 with an average density of 5.1 deer per square mile, for a total of nearly 4,500 deer in the watershed (Osborn, 2003). The goose population, determined from the 1996-2000 DNR Goose Management Blocks, ranged from 3.78 to 6.74 geese per square mile in the lower watershed, and 9.97 to 10.90 geese per square mile in the upper watershed (Maxson, 2003). The average goose population in the entire watershed is 7.8 geese per square mile, or approximately 7,000 geese. The DNR population indices for pheasants, Hungarian partridge, cottontails and jackrabbits are 100 mile averages and are too crude to use in determining their background contribution, as are the DNR skunk, raccoon, coyote, and red fox scent station surveys (Giudice, 2003). Other wildlife, and rural cats and dogs in the watershed can be roughly accounted for by doubling the deer population to 9,000 animals. Table 4.04 summarizes the inventory of fecal coliform producers in the watershed. Table 4.04: Inventory of Fecal Coliform Producers in the Pomme de Terre
River Watershed Animal Units or individuals
Category Source
Within 1000’ surface water
Not within 1000’ surface
water Total Dairy 5487 AU 416 AU 5903 AU Beef 14192 AU 4807 AU 19000 AU Swine 12575 AU 7840 AU 19545 AU Turkeys 587 AU -- 587 AU
Non-CAFO Livestock1
Other 192 AU 239 AU 431 AU Population with inadequate septic systems
1085 People -- 1085
People
Population in unsewered communities
-- -- --Human2
WWTP Facilities which discharge above 200 cfu/100ml Deer 9000 Deer 9000 DeerGeese 7000 Geese -- 7000 Geese
Wildlife3 Other wildlife including rural cats & dogs
-- -- Accounted for in deer population
Urban Stormwater4
Dogs and cats - urban -- 3794
Individuals 3794
Individuals 1MPCA registered feedlot database, 2003 2League of MN Cities, 2006; W. Gillingham, 2003 3MnDNR, 2003 4AVMA, 2002

5.0 Load Allocations (LA), Wasteload Allocations (WLA), and Margins of Safety (MOS)
5.1 Approach to Allocations Needed to Satisfy the TMDLs The TMDL developed for the reach in this report consists of three main components: WLA, LA, and MOS as defined in section 1.0. The WLA includes four sub-categories: Permitted wastewater treatment facilities; communities’ subject to Stormwater MS4 NPDES permit requirements; livestock facilities requiring NPDES permits, and “straight pipe” septic systems. The LA, reported as a single category includes manure runoff from farm fields, pastures, and smaller non-NPDES permitted feedlots, runoff from smaller non-MS4 communities, and fecal coliform contributions from wildlife. The LA includes land-applied manure from livestock facilities requiring NPDES permits, provided the manure is applied in accordance with the permit. The third component, MOS, is the part of the allocation that accounts for uncertainty that the allocations will result in attainment of water quality standards. The three components (WLA, LA, and MOS) were calculated as average total daily load of fecal organisms (with the average being met over a calendar month). The daily number of fecal coliform organisms was calculated for each of a series of five flow zones ranging from low flow to high flow. Partitioning the daily fecal coliform loads between five flow regimes is referred to as the duration curve approach in this report and is the methodology created by Bruce Cleland (Cleland, 2002; MPCA, 2006) Allocations in the duration curve approach for the impaired stream reach are developed for the full range of flows experienced during the April 1 – October 31 period of the fecal coliform standard. By adjusting the wasteload allocation, load allocation, and margin of safety to a range of five discrete flow intervals for the reach, a closer correspondence is obtained between the (flow-specific) loading capacity and the TMDL components (WLA + LA + MOS), at the range of flow conditions experienced historically at the site. This approach also makes it possible to relate fecal coliform sources to allocations more specifically. For example, continuous discharges such as failing ISTS will be more prominent at lower flows, and manure runoff will be more prominent at higher flows. For each impaired reach and flow condition, the total loading capacity (TMDL) was divided into its component wasteload allocation, load allocation, and margin of safety. The process was as follows:
Pomme de Terre Watershed Project 20 Fecal Coliform TMDL

Wasteload Allocation
• Wastewater treatment facility (WWTF) allocations were calculated by multiplying wet-weather design flows for all facilities in the watershed by the permitted discharge limit (200 organisms per 100ml) that applies to all WWTFs. As long as WWTFs discharge at or below this permit limit, they will not cause violations of the fecal coliform water quality standard regardless of their fecal coliform load.
• A number of smaller NPDES-permitted WWTFs are stabilization ponds systems. Unlike the mechanical treatment systems which have continuous discharges, pond systems typically discharge over a 1-2 week period in the spring and in the fall. In the event they need to discharge outside of the spring or fall window, the WWTF wasteload allocation assumed that these facilities could discharge for an entire month under any flow conditions.
• Since wet-weather design flows represent a “maximum” flow for a mechanical treatment (continuous discharge) facility, the WWTF allocations are conservative in that they are substantially greater than what is actually required.
• Straight-pipe septic systems are illegal and un-permitted, and as such are assigned a zero wasteload allocation.
• The City of Morris is designated for permit coverage and therefore requires a wasteload allocation. Currently, the City of Morris covers about 0.79 percent of the watershed and for simplicity will be allocated 1 percent of the total fecal coliform load to the Pomme de Terre River.
• The WWTF allocation and MOS were subtracted from the total loading capacity. The remaining capacity was divided between municipal separate storm sewer system (MS4) permits (wasteload allocation) and all nonpoint sources (load allocation) based on the percentage of land in an impaired reach watershed covered by MS4 permits.
• The total daily loading capacities in the dry and low flow zone are very small due to the occurrence of very low flows in the long-term records. Consequently, the permitted wastewater treatment facility design flows exceed the stream flow at the low flow zone. Of course actual WWTF flow can never exceed stream flow as it is a component of stream flow. For the dry and low flow zone the calculated MOS would take up all of the remaining allocation capacity. To account for these situations only, the wasteload allocations and load allocations are expressed as an equation rather than an absolute number. That equation is simply:
Allocation = (flow contribution from a given source) x (200 cfu/100 ml)
In essence, this amounts to assigning a concentration-based limit to the nonpoint source load allocation sources for the dry and low flow zone. WLAs for straight-pipe septic systems and NPDES-permitted livestock operations remain at zero. (This is the same procedure employed for three reaches with similar situations in the “Revised Regional Total Maximum
Pomme de Terre Watershed Project 21 Fecal Coliform TMDL

Daily Load Evaluation of Fecal Coliform Bacteria Impairments in the Lower Mississippi River Basin in Minnesota“(2006)).
• Livestock facilities that have been issued NPDES permits are assigned a zero wasteload allocation. This is consistent with the conditions of the permits, which allow no pollutant discharge from the livestock housing facilities and associated sties. Discharge of fecal coliform from fields where manure has been land applied may occur at times. Such discharges are covered under the load allocation portion of the TMDLs, provided the manure is applied in accordance with the permit.
Margin of Safety
• The purpose of the margins of safety (MOS) is to account for uncertainty that the allocations will result in attainment of water quality standards. Because the allocations are a direct function of daily flows, accounting for potential flow variability is an appropriate way to address the MOS. This is done within each of the five flow zones. Basically, the MOS was calculated as the difference between the median flow and minimum flow in each zone. For the low flow zone, this reflects the lowest daily flow observed over the period of record at the flow gage site used to develop allocations for the impaired reach.
Load Allocations
• Once the WLA and MOS were determined for a given reach and flow zone, the remaining loading capacity was considered load allocation. The load allocation includes nonpoint pollution sources that are not subject to NPDES permit requirements, as well as “natural background” sources such as wildlife. The nonpoint pollution sources are largely related to livestock production, and inadequate human wastewater treatment. (non-straight pipe).
5.2 TMDL Allocations for the Impaired Reach In the section below TMDL allocations are provided for the impaired reach. Calculations for the TMDL, LA, WLA and MOS consider the total drainage area represented by the end of the listed reach. Individual WLAs for permitted point sources are listed by sub-watershed.
5.21 Pomme de Terre River; Muddy Creek to Marsh Lake (AUID: 07020002-501) This reach of the Pomme de Terre River from Muddy Creek to Marsh Lake on the Minnesota River was added to the Section 303(d) Clean Water Act impaired waters list in 1994. The primary source of data that led to this listing was the MPCA long-term monitoring program. The sampling site is S000-195 (Site1 in Figure 3.21).
Pomme de Terre Watershed Project 22 Fecal Coliform TMDL

The drainage area to the downstream end of this impaired reach is 905 square miles. This represents 100% of the Pomme de Terre River Watershed area. Land use in the sub-watershed upstream of the impairment is dominated by cultivated land, but exhibits a relatively high percentage of water and wetlands. The communities in the Pomme de Terre watershed served by permitted wastewater treatment facilities (Table 5.21A) are Alberta, Appleton, Ashby, Barrett, Chokio, Dalton, Morris and Underwood. The Dalton and Underwood WWTFs discharge by spray irritation and groundwater infiltration respectively, and do not discharge to surface water. Alberta, Ashby, Barrett, Chokio, and Morris are all pond systems while Appleton is the only community with a mechanical system. An urban population of nearly 10,000 is serviced by WWTFs, and the rural population, serviced by ISTSs, is approximately 8,700 or 3,500 homes. Of these about 435 homes are straight-pipe septic systems. The City of Morris is designated for MS4 permit coverage because their population exceeds 5000 and they are within ½ mile of an impaired reach (HUC: 07020002-502, biotic impairment for fish) (Table 5.21B). There are 14 NPDES permitted confinement animal feeding operations (CAFOs) in the entire watershed (Table 5.21C). The number of non-CAFO animal units for dairy, beef, swine, poultry, and other animals for each sub-watershed are listed in Table 4.03. Table 5.21D describes the average daily fecal coliform loading capacities for this reach to achieve water quality standards, as well as the component wasteload allocations, load allocations, and margins of safety. The loading capacities for five flow zones were developed using flow data from the USGS gage site on the Pomme de Terre River at Appleton. Substantial reductions in fecal coliform loading from straight-pipe septic systems, and a variety of nonpoint sources will likely be required to meet the allocations. The load duration curve is in Figure 5.21. The standard of 200 cfu/100ml was exceeded only during the summer period (July, August). The summer fecal coliform mean was 329 cfu/100ml. The overall load reduction required to meet the standard is: [(329 – 200) / 329] X 100 = 39% This reduction percentage is only intended as a rough approximation, as it does not account for flow, and is not a required element of a TMDL. It serves to provide a starting point based on available water quality data for assessing the magnitude of the effort needed in the watershed to achieve the standard.
Pomme de Terre Watershed Project 23 Fecal Coliform TMDL
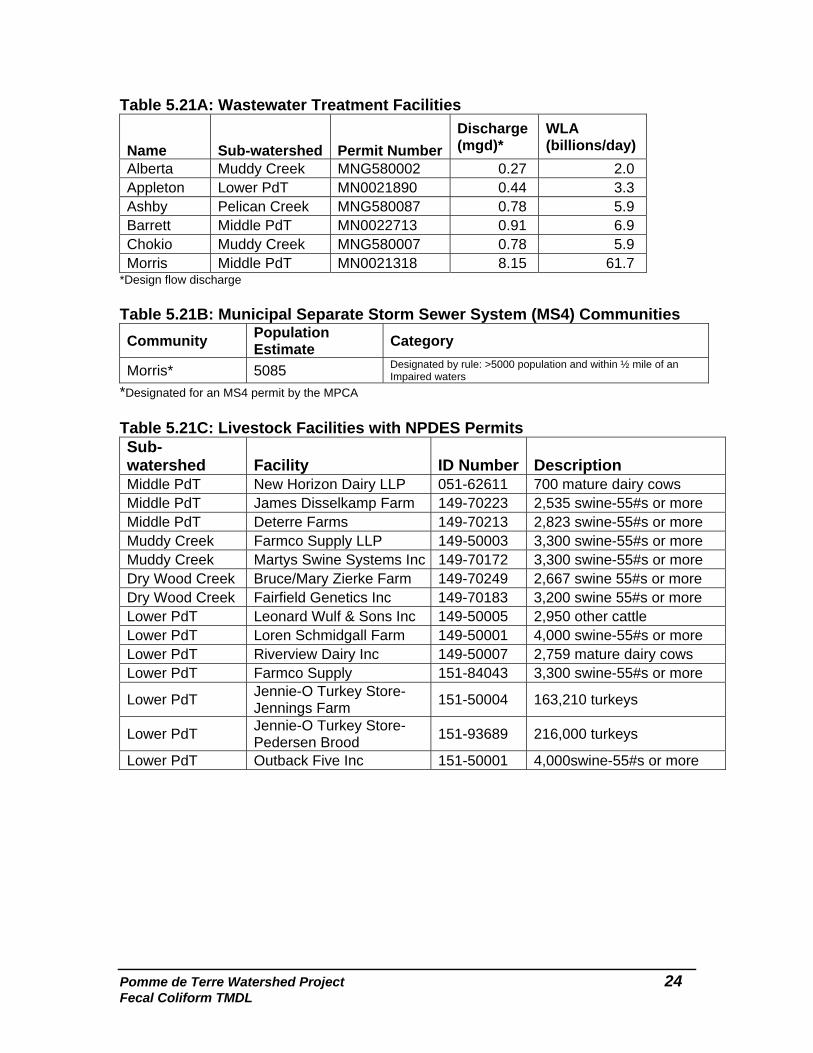
Table 5.21A: Wastewater Treatment Facilities
Name Sub-watershed Permit NumberDischarge (mgd)*
WLA (billions/day)
Alberta Muddy Creek MNG580002 0.27 2.0 Appleton Lower PdT MN0021890 0.44 3.3 Ashby Pelican Creek MNG580087 0.78 5.9 Barrett Middle PdT MN0022713 0.91 6.9 Chokio Muddy Creek MNG580007 0.78 5.9 Morris Middle PdT MN0021318 8.15 61.7
*Design flow discharge Table 5.21B: Municipal Separate Storm Sewer System (MS4) Communities Community Population
Estimate Category
Morris* 5085 Designated by rule: >5000 population and within ½ mile of an Impaired waters
*Designated for an MS4 permit by the MPCA Table 5.21C: Livestock Facilities with NPDES Permits Sub-watershed Facility ID Number Description Middle PdT New Horizon Dairy LLP 051-62611 700 mature dairy cows Middle PdT James Disselkamp Farm 149-70223 2,535 swine-55#s or more Middle PdT Deterre Farms 149-70213 2,823 swine-55#s or more Muddy Creek Farmco Supply LLP 149-50003 3,300 swine-55#s or more Muddy Creek Martys Swine Systems Inc 149-70172 3,300 swine-55#s or more Dry Wood Creek Bruce/Mary Zierke Farm 149-70249 2,667 swine 55#s or more Dry Wood Creek Fairfield Genetics Inc 149-70183 3,200 swine 55#s or more Lower PdT Leonard Wulf & Sons Inc 149-50005 2,950 other cattle Lower PdT Loren Schmidgall Farm 149-50001 4,000 swine-55#s or more Lower PdT Riverview Dairy Inc 149-50007 2,759 mature dairy cows Lower PdT Farmco Supply 151-84043 3,300 swine-55#s or more
Lower PdT Jennie-O Turkey Store-Jennings Farm 151-50004 163,210 turkeys
Lower PdT Jennie-O Turkey Store-Pedersen Brood 151-93689 216,000 turkeys
Lower PdT Outback Five Inc 151-50001 4,000swine-55#s or more
Pomme de Terre Watershed Project 24 Fecal Coliform TMDL

Table 5.21D: Daily Fecal Coliform Loading Capacities and Allocations –
Pomme de Terre River, Muddy Creek to Minnesota River (AUID: 07020002-501)
Drainage area for listed reach (mi2): 905.0 Flow gage used: Pomme de Terre River at Appleton, Minnesota Land Area MS4 Urban (%): 0.79 Flow Zone Total WWTF Flow (MGD): 11.33 High Moist Mid Dry Low Billion organisms per day TOTAL DAILY L0ADING CAPACITY 2985 886 401 166 21Wasteload Allocation Permitted Wastewater Treatment Facilities 86 86 86 * * Communities Subject to MS4 NPDES Requirements 18 5 2 * * Livestock Facilities Requiring NPDES Permits 0 0 0 0 0 "Straight Pipe" Septic Systems 0 0 0 0 0Load Allocation 1770 457 191 * *Margin of Safety 1111 338 122 NA NA
Percent of total daily loading capacity
TOTAL DAILY L0ADING CAPACITY 100% 100% 100% 100% 100%Wasteload Allocation Permitted Wastewater Treatment Facilities 3% 10% 21% * * Communities Subject to MS4 NPDES Requirements 1% 1% 1% * * Livestock Facilities Requiring NPDES Permits 0% 0% 0% 0% 0% "Straight Pipe" Septic Systems 0% 0% 0% 0% 0%Load Allocation 60% 52% 48% * *Margin of Safety 37% 38% 30% NA NA*Note - Allocation for all "*" = (flow contribution from source) x (200 orgs./100 ml); see Sect 5.1
Pomme de Terre Watershed Project 25 Fecal Coliform TMDL

Figure 5.21: Pomme de Terre River Load Duration Curve
0.1
1
10
100
1000
10000
100000
1000000
10000000
0 10 20 30 40 50 60 70 80 90 100
Flow Duration Interval (%)
Feca
l Colifor
m (bi
llion
s/da
y)
Target
All Data
Jul-Aug
>50% SF*
90th
Median
Pomme de Terre RiverLoad Duration Curve (Bacteria: ‘71 – ‘05 Monitoring Data)
Site: S000-195
DryConditions
LowFlows
HighFlows
Mid-rangeFlows
MoistConditions
905 square milesMPCA Data & USGS Gage Duration Interval
*SF is Storm Flow
5.3 Impacts of Growth on Allocations The overall projected population growth for the next 15 years in the watershed is estimated to be 2% with Douglas, Otter Tail, and Stevens increasing in population while Big Stone, Grant, and Swift will decrease in population. This growth will occur with adequate WWTF and/or good septic systems such that fecal coliform will not increase. Municipal WWTF currently represent a small proportion of the watershed loads and are regulated through NPDES permits. Under these permits, WWTFs must discharge below the standard of 200 cfu/100ml. New septic systems that are functioning properly will not discharge fecal coliform to surface waters. Changes in the human population should not change the load allocations provided in this report. Straight Pipe Septic Systems The number of straight pipe septic systems will decrease over time, as a result of the implementation of state and local rules, ordinances, and programs. Because these systems constitute illegal discharges, they are not provided a wasteload allocation for the impaired reaches in this report. As such, other elements of the TMDL allocation will not change as these systems are eliminated.
Pomme de Terre Watershed Project 26 Fecal Coliform TMDL

Wastewater Treatment Facilities Flows at some wastewater treatment facilities are likely to increase over time with increases in the populations they serve. As long as current fecal coliform discharge limits are met at these facilities, the increased flows will not impact the allocation given to other sources. This is because an increased flow from WWTFs adds to the overall loading capacity by increasing river flows. Municipal Separate Storm Sewer Systems The City of Morris is designated for permit coverage. Currently the contribution of fecal coliform to the PdT River by the City is less than 1 percent of the total load, and is expected not to increase in the future. Livestock The other major source of fecal coliform in the watershed, besides human, is livestock. While there have been changes in the sizes and types of facilities, there do not appear to be clear trends in overall livestock numbers. With changes in facility size and type, a continuing shift in focus from the facilities themselves to land application practices may be warranted in the future. If growth in livestock numbers does occur, newer regulations for facility location and construction, manure storage design, and land application practices should help mitigate potential increases in fecal coliform loading to the streams and rivers in the watershed. For the above reasons, no explicit adjustments were made to the wasteload or load allocations to account for human or livestock population growth. The MPCA will monitor population growth, urban expansion, and changes in agriculture, and reopen the TMDL covered in this report if and when adjustments to allocations may be required.
6.0 Margin of Safety Under section 303(d) of the Clean Water Act, a “margin of safety” (MOS) is required as part of a TMDL report. The purpose of the MOS is to account for uncertainty that the allocations will result in attainment of water quality standards. An explicit margin of safety is provided for each of the flow periods in the impaired reach. As described in section 5 and Appendix A of this document, the MOS is based on the difference between the loading capacity as calculated at the mid-point of each of the five flow ranges, and the loading capacity calculated at the minimum flow in each zone. Given that the loading capacity is typically much less at the minimum flow of a zone as compared to the mid-point, a substantial MOS is provided. The MOS ensures that allocations will not exceed the load associated with the minimum flow in each zone. Because the allocations are a direct function of daily flow, accounting for potential flow variability is the appropriate way to address the MOS. The minimum daily flows over long periods of record define the MOS for the low flow zone. This TMDL uses an implicit MOS because no rate of decay was used. Pathogen organisms ordinarily have a limited capability of surviving outside of their hosts and a rate of decay could be
Pomme de Terre Watershed Project 27 Fecal Coliform TMDL
developed. However, applying a rate of decay could result in an allocation that would be greater than the WQS, thus no rate of decay is applied to provide for a greater protection of water quality.
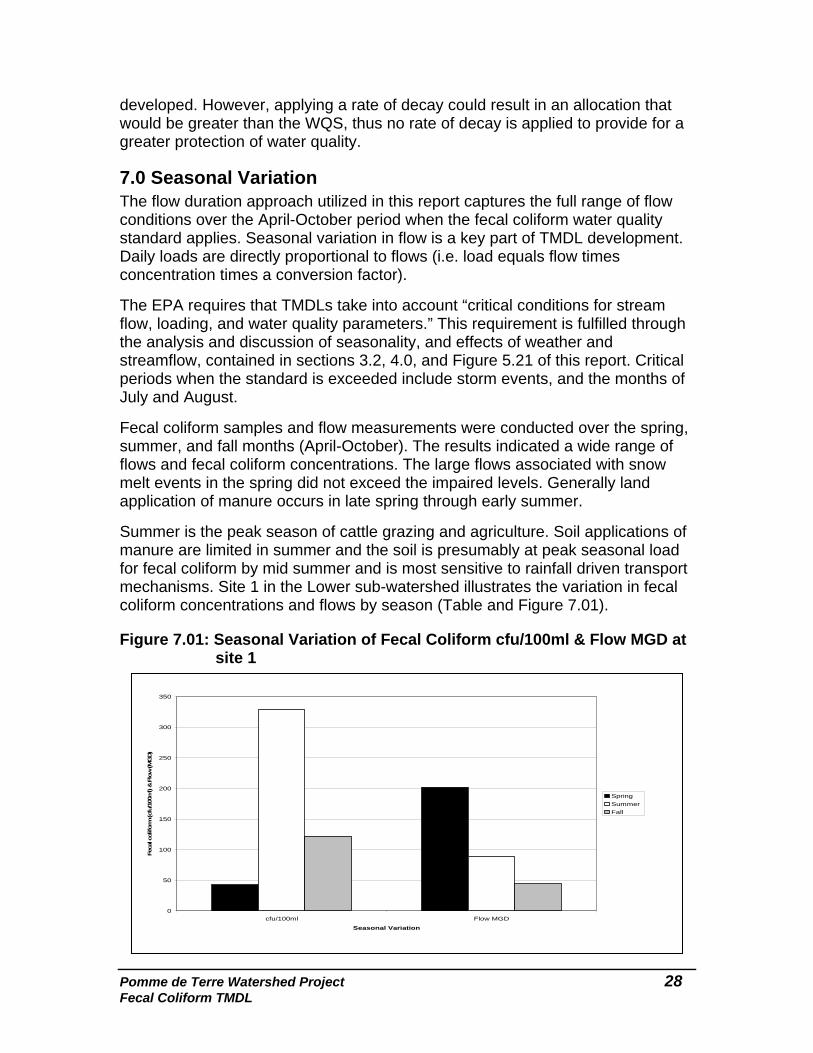
7.0 Seasonal Variation The flow duration approach utilized in this report captures the full range of flow conditions over the April-October period when the fecal coliform water quality standard applies. Seasonal variation in flow is a key part of TMDL development. Daily loads are directly proportional to flows (i.e. load equals flow times concentration times a conversion factor). The EPA requires that TMDLs take into account “critical conditions for stream flow, loading, and water quality parameters.” This requirement is fulfilled through the analysis and discussion of seasonality, and effects of weather and streamflow, contained in sections 3.2, 4.0, and Figure 5.21 of this report. Critical periods when the standard is exceeded include storm events, and the months of July and August. Fecal coliform samples and flow measurements were conducted over the spring, summer, and fall months (April-October). The results indicated a wide range of flows and fecal coliform concentrations. The large flows associated with snow melt events in the spring did not exceed the impaired levels. Generally land application of manure occurs in late spring through early summer. Summer is the peak season of cattle grazing and agriculture. Soil applications of manure are limited in summer and the soil is presumably at peak seasonal load for fecal coliform by mid summer and is most sensitive to rainfall driven transport mechanisms. Site 1 in the Lower sub-watershed illustrates the variation in fecal coliform concentrations and flows by season (Table and Figure 7.01).
Figure 7.01: Seasonal Variation of Fecal Coliform cfu/100ml & Flow MGD at site 1
0
50
100
150
200
250
300
350
cfu/100ml Flow MGD
Seasonal Variation
Feca
l col
iform
(cfu
/100
ml)
& F
low
(MG
D)
SpringSummer Fall
Pomme de Terre Watershed Project 28 Fecal Coliform TMDL

Duration curve zones can be used to reflect seasonal variation. Table 7.01 uses duration curve zones to identify loading capacity information. Loading capacities are organized in a way that reflects actual flow conditions for any given month. Table 7.01: Flow Duration Curve Loading by Months
Duration Curve Zone (Loading Capacity expressed as Billion organisms per day)
High Moist Mid Dry Low Pomme de Terre River from Muddy Creek to Minnesota River
2,984 886 401 166 21
Seasonal Considerations
[most likely zone(s) by month]
April May June
July August September
October
8.0 Monitoring Plan The goal of the monitoring plan is to assess if the reduction strategies are effective in attaining water quality standards and designated uses. The impaired reaches will remain listed until water quality standards for fecal coliform are met. Monitoring efforts will continue in the watershed. Further monitoring sites may be added upon the implementation of the BMPs. Implementation activities at the sub-watershed level will be re-evaluated after monitoring and BMPs can be modified as needed. Annual results will be included in the yearly Pomme de Terre River Watershed Monitoring Summary.
9.0 Implementation This section provides an overview of implementation options and considerations to address the fecal coliform bacteria TMDL. A more detailed implementation plan will be developed following approval of this TMDL study. Fecal coliform bacteria have several sources and delivery pathways and a variety of BMPs are available to address these.
9.1 Implementation through Source Reduction Strategies A watershed-wide approach is embraced to achieve water quality standards for fecal coliform bacteria within ten years. The final implementation plan will be developed within a year of the final approval of the report by the EPA. The implementation plan will spell out what and where BMPs will be applied in the sub-watersheds, and identifies the cost and funding sources for their application.
Pomme de Terre Watershed Project 29 Fecal Coliform TMDL

Table 9.01 below brings the main potential sources (municipal wastewater, septic systems, grazing livestock, urban stormwater, feedlots, and field-applied manure) into the analysis. In this table these sources are portrayed in terms of “implementation opportunities” and are associated with the likely flow zones in which they would be effective. Using this table in conjunction with the load duration curve, local stakeholder knowledge and other information a project team can start to rule in or out some sources and potentially rank them from most significant to least significant as well as point towards some implementation strategies. Table 9.01: Implementation Opportunities for the Different Flows Regimes
Duration Curve Zone
High Moist Mid Dry Low Long-term CSO
plans WWTFs
On-site wastewater management Pasture management & riparian protection
Urban stormwater management
Open lot agreements
Implementation Opportunities
Manure management
Adapted from Revised SE Regional Fecal Coliform TMDL, Appendix A.
9.2 Locally Targeted Implementation Change does not happen without good information and education, but once that is delivered people need instructions and options for making changes. The plan for achieving clean water has been broken down into several phases. Based on water quality data the watershed was divided into six priority sub-watersheds. Additional dollars are sought for each priority sub-watershed and specialized implementation practices are targeted. Each person has the ability to choose to implement BMPs for water quality in their daily life. The goal is to help make these changes happen through education, training, and monetary incentives.
• STEVENS COUNTY: The NRCS has 16 Wetlands Reserve Program (WRP) easements, totaling 1,672.4 acres. There are 52 Conservation Reserve Enhancement Program (CREP)/Reinvest in Minnesota (RIM) easements covering 1,635.2 acres.
o The Muddy Creek Sub-watershed, located in Stevens County, has been identified as a high priority in the Local Water Management Plan (LWMP). It is listed as a priority for Continuous Conservation Reserve Program (CCRP) filter/buffer strips and wetland restoration. Removing Muddy Creek from the impaired waters list is identified as a priority action item in the Plan. Fencing/livestock exclusion practices are targeted for this sub-
Pomme de Terre Watershed Project 30 Fecal Coliform TMDL

watershed, along with $500 incentives, and low-interest loans for replacing their failed ISTS.
• SWIFT COUNTY: Focus in Swift County has been on CRP wetland restoration and buffers to decrease the flash flows on the Pomme de Terre River. The Farmed Wetland Program has been successful for low areas in fields.
o The Dry Wood Creek Sub-watershed, Dry Wood Creek itself lies mostly within the Swift County boundaries, but the watershed is split between Swift, Stevens and Big Stone Counties. Monitoring has placed this sub-watershed in the high priority category.
• GRANT COUNTY: Grant County has utilized accelerated state cost-share programs to enroll buffers along waterways through a BWSR Challenge Grant. Buffers and wetland restorations remain a top priority in the Grant County LWMP.
• OTTER TAIL COUNTY: At the top of the watershed, Ottertail County has focused their annual state cost-share dollars on sediment basins, funding six within the Pomme de Terre.
• DOUGLAS COUNTY: Over 400 acres have been set-aside in CRP grass easement within this watershed. A very small part of the watershed is located in Douglas County and Lake Christina covers about one-fourth of it. A large portion of the remaining land is grassed due to wetness and poor cropping use.
• BIG STONE COUNTY: Even though a minimal amount of the watershed is in this county they have four CREP easements totaling 205 acres, 40 acres in RIM, and a 133 acre WRP easement. The LWMP provides a $500 incentive, along with low-interest Ag BMP loans for ISTS upgrade.
• Waste Water Treatment Facilities – Counties, Regional Development
Commissions and MPCA staff will work with WWTFs to ensure continued compliance.
• Individual Septic Treatment Systems – Three percent low interest loan
dollars are available to aid landowners in upgrading their ISTS.
Pomme de Terre Watershed Project 31 Fecal Coliform TMDL

10.0 Reasonable Assurance
10.1 Evidence of BMP Feasibility The source reduction strategies listed are shown to be successful in reducing pathogen transport and survival and to be capable of widespread adoption by land owners and local resource managers. Counties will apply for available grants and loans to implement BMPs.
• Feedlot runoff controls – these are evaluated by professional engineers through the Feedlot Evaluation Model referenced in Minn. R. ch. 7020. These rules are implemented by the MPCA staff and by local staff of counties via a delegation agreement with the Agency.
• Individual Sewage Treatment Systems –ISTS with proper drain fields provide virtually complete treatment of fecal coliform bacteria. Acceptable designs are described in Minn. R. ch. 7080. All counties in the watershed are delegated to implement these rules, which require conformance with state standards for new construction and disclosure of the state of the system when property transfers ownership.
• Municipal Wastewater Disinfection – Disinfection with chlorine or ultraviolet radiation is required of all NPDES permitted facilities.
• Land Application of Manure – Buffer strips, immediate incorporation, and maintenance of surface residue have been demonstrated to reduce manure and pathogen runoff (EQB, 1999). The state feedlot rules (Minn. Rules part 7020) require manure application record-keeping and manure management planning, with requirements differing according to operation size, and manure application pollution risk based on method, time and place of application.
• Erosion Control and Sediment Reduction – Conservation tillage and riparian buffer strips have been shown to be effective in reducing sediment delivery to streams. Since embedded sediment can serve as a substrate for fecal coliform survival, reduction of sediment sources is considered an effective measure for controlling fecal coliform bacteria in streams.
• Planned Rotational Grazing – Sovell, et.al. 2000, demonstrated that rotational grazing, in contrast to conventional grazing, significantly reduces both sedimentation and fecal coliform concentrations in water downstream of study sites in southeastern Minnesota.
• Urban Stormwater Management – Practices such as runoff detention, infiltration, and street sweeping have been shown to be effective in reducing urban runoff and associated pollutant.
Pomme de Terre Watershed Project 32 Fecal Coliform TMDL

10.2 Non-regulatory, Regulatory, and Incentive-Based
Approaches The lead for implementation will be sponsored by the Pomme de Terre River Joint Powers Board. The technical work group of the PdT is composed of PdT technical staff, County representatives and personnel from Soil and Water Conservation Districts, Board of Soil and Water Resources, Department of Natural Resources, Minnesota Pollution Control Agency, and the Natural Resources and Conservation Services. The technical work group will monitor and evaluate the implementation strategies, and will advise and make recommendations on the progress of the strategies to the PdT Joint Powers Board.
11.0 Public Participation The Soil and Water Conservation Districts in the counties in the watershed mailed newsletters updating citizens on the progress of the TMDL. One public meeting was held on May 10, 2007 in Morris, to inform citizens of the impact of the fecal coliform TMDL on the Pomme de Terre River. Over 300 invitations were mailed or emailed to citizens and interested parties in the watershed, and notice of the meeting was put in the local newspapers. Comments submitted in writing are in the Appendix. The draft TMDL report is available to the public via the MPCA web site at http://www.pca.mn.us/water/tmdl.html. A public notice was posted in the State Register and the public comment period extended from August 20, 2007 to September 20, 2007. Written comments are in the Appendix.
Pomme de Terre Watershed Project 33 Fecal Coliform TMDL

12.0 References Aldersisio, K. A. and N. DeLuca. 1999. Seasonal enumeration of fecal coliform bacteria from the feces of ring-billed gulls (Larus delawarensis) and canada geese (Branta canadensis). Applied and Environmental Microbiology, December, p.5628-5630 American Veterinary Medical Association (AVMA). 2002. Pet ownership and demographics source book. AVMA, Schaumberg, IL Baxter-Potter, W., and M. Gilliland.1988. Bacterial pollution in runoff form agricultural lands. J. Environmental Quality. 17(1):27-34 Cleland, B, R. 2002. Tmdl development from the “bottom up” – part II: using duration curves to connect the pieces. National TMDL Science and Policy 2002 -- WEF Specialty Conference. Phoenix, AZ Gillingham, W. 2003. Minnesota Pollution Control Agency. Personal communication Guidice, John. 2003. DNR Farmland Wildlife Research Group. Personal communication League of Minnesota Cities. 2006. Directory of Minnesota city officials. League of MN Cities. 296 p. Maxson, Steve, DNR Goose Specialist. 2003. Personal Communication. Minnesota Department of Natural Resources (MnDNR). 2003. Personal Communication. Minnesota Environmental Quality Board (EQB). 1999. Generic environmental impact statement on animal agriculture. EQB, St, Paul MN. 142p Minnesota Pollution Control Agency. 2006. Revised regional total maximum daily load evaluation of fecal coliform bacteria impairments in the lower Mississippi river basin in Minnesota. MPCA, St. Paul. 123p Minnesota River Basin Data Center (MRBDC). 2006. Mankato State University. Mankato, MN Mulla, D. J., A. S. Birr, G. Randall, J. Moncrief, M. Schmitt, A. Sekely, and E. Kerre, 2001, Technical work paper, impacts of animal agriculture on water quality. EQP and Citizen Advisory Comm., 125 p.
Pomme de Terre Watershed Project 34 Fecal Coliform TMDL

Osborn, Robert. 2003. DNR Farmland Research Group. Personal Communication Sovell, Laurie, et. al., 2000. Impacts of rotational grazing and riparian buffers on physiochemical and biological characteristics of southeastern Minnesota, USA, streams. Environmental Management, 26(6) pp629-641 USEPA. 2001. Protocol for developing pathogen tmdls, 1st Edition. EPA 841-R-00-002. Office of Water, USEPA, Washington, DC. 132 pp.
Pomme de Terre Watershed Project 35 Fecal Coliform TMDL

Appendix Appendix A: Methodology for TMDL Equations and Load Duration
Curves The loading capacity determination used for this report is based on the process developed for the “Revised Regional Total Maximum Daily Load Evaluation of Fecal Coliform Bacteria Impairments in the Lower Mississippi River Basin in Minnesota” (Jan 2006). This process is known as the “Duration Curve” method. Loading capacities for specific pollutants are related directly to flow volume. As flows increase, the loading capacity of the stream will also increase. Thus, it is necessary to determine loading capacities for a variety of flow zones. For this approach daily flow values for each site are sorted by flow volume, from highest to lowest and a percentile scale is then created (where a flow at the Xth percentile means X% of all measured flows equal or exceed that flow). Five flow zones are used in this approach: “high” (0-10th percentile), “moist” (10th- 40th percentile), “mid-range” (40th-60th percentile), “dry” (60th-90th percentile) and “low” (90th-100th percentile). The flows at the mid-points of each of these zones (i.e., 5th, 25th, 50th, 75th and 95th percentiles) are multiplied by the water quality standard concentration and a conversion factor to yield the allowable loading capacity or TMDL. For example, if the “mid-range” (50th percentile) flow is 82 cubic feet/sec the loading capacity for fecal coliform bacteria would be:
82 cu ft/sec x 200 organisms/100 mL x 28,312 mL/cu ft x 86,400 sec/day ÷ 1 billion = 401 billion fecal coliform bacteria per day
The flow monitoring data used in this project was from 1970-2005 at the U.S. Geological Survey gage station #05294000. (The flow data record at this station actually begins in 1931. We selected the more recent portion of the dataset, which we assume represents more “current” land use and hydrology. Also, this time period also corresponds to MPCA WQ monitoring record. No flow records exist from Oct 1999 to June 2003.) The flow record used contains 11,707 average daily flow values. TMDLs were calculated for all the flow zones for each listed reach of the project. The TMDLs were then divided into a Margin of Safety (MOS), Wasteload Allocations (WLAs) and a Load Allocation (LA). The MOS accounts for uncertainty in the TMDL allocation process. The MOS was established not to exceed the load associated with the minimum flow for each zone. Each zone MOS is the difference between the central and lowest flow value for each zone. For example, to determine the MOS for the high flow
Pomme de Terre Watershed Project 36 Fecal Coliform TMDL

zone, the 10th percentile flow value was subtracted from the 5th percentile flow value. The resulting value was converted to a load and used as the MOS. The next step in the process was determining the WLAs for point sources with specific discharge limits. The wastewater facilities with specific discharge limits in this watershed consist of one mechanical facility and five facilities utilizing pond systems. For the mechanical plant the average wet weather design flow was as the maximum daily flow in WLA calculations. For facilities with pond systems the maximum daily flow was calculated based on six inches per day drawdown from their secondary pond(s). The resulting daily volumes of effluent were converted to daily loads using the permitted concentration limits and a conversion factor. Example calculations for the WLA for a wastewater treatment facility discharging 3,000,000 gallons of effluent per day with a 200 organisms/100 mL limit is as follows:
3,000,000 gallons/day x 200 organisms/100 mL x 3785 mL/gallon ÷ 1 billion = 23 billion fecal coliform bacteria per day
The WLA for a given wastewater treatment facility will be the same under all flow zones since its allocation is based on the volume it is permitted to discharge. The WLAs for these dischargers with specific discharge limits and the MOS were subtracted from the total available loading capacity. The remaining capacity was then given to all nonpoint sources, i.e., the LA category. The load duration curve shown in the report displays the allowable load across the range of flows in the timeframe selected. The loads represented by grab samples were calculated and plotted. The samples representing greater than 50 percent storm flow were calculated using the methodology described in “HYSEP: A Computer Program for Streamflow Hydrograph Separation and Analysis,” US Geological Survey, Water-Resources Investigations Report 96-4040.
Pomme de Terre Watershed Project 37 Fecal Coliform TMDL

Pomme de Terre Watershed Project 38 Fecal Coliform TMDL
Appendix B: Flow Duration Curve Power Point for the PdT River Watershed
Purpose
• Explain TMDL methodology• Show how it can help to make sense of the
water quality data• Suggest connections between water quality,
sources of fecal and implementation options• Cautions:
– Bacteria in the environment are very complex– Gets a bit technical…
Total Maximum Daily LoadTMDL = The maximum amount of pollution a river / lake can take on and still maintain a healthy state (i.e., not exceed water quality standards)
Point sources•Wastewater—cities •Stormwater—large cities•Large feedlots•Septic systems
+
Nonpoint sources•Cropland runoff•Pasture runoff•Small feedlots•Stormwater—small cities•Wildlife
+Uncertainty, lack of knowledge
Waste Load Allocation Load Allocation Margin Of Safety

Pomme de Terre Watershed Project 39 Fecal Coliform TMDL
The Duration Curve Method
• Uses long-term river flow data• Provides allowable loads for all flow
conditions• Good tool for data interpretation• First step: Graph out the flow data
Selecting a TMDL method
• Acceptable to EPA• No more complicated than it needs to be• Within project budget• Functional: helps to understand the
problem
Duration Curve Method

0.1
1
10
100
1000
10000
100000
0 10 20 30 40 50 60 70 80 90 100
Flow Duration Interval (%)
Flow
(cf
s)
Flow
Pomme de Terre RiverFlow Duration Curve
USGS gage station at Appleton MN
Flood Drought
0.1
1
10
100
1000
10000
100000
0 10 20 30 40 50 60 70 80 90 100
Flow Duration Interval (%)
Flow
(cf
s)
Flow
Pomme de Terre RiverFlow Duration Curve
USGS gage station at Appleton MN
Flood Drought
60% of all measured flows equalsor exceeds 57cfs
Pomme de Terre Watershed Project 40 Fecal Coliform TMDL

0.1
1
10
100
1000
10000
100000
0 10 20 30 40 50 60 70 80 90 100
Flow Duration Interval (%)
Flow
(cf
s)
Flow
Pomme de Terre RiverFlow Duration Curve
USGS gage station at Appleton MN
DryConditions
LowFlows
HighFlows
Mid-rangeFlows
MoistConditions
Flood Drought
382 cfs112 cfs
57 cfs15 cfs
0.1
1
10
100
1000
10000
100000
0 10 20 30 40 50 60 70 80 90 100
Flow Duration Interval (%)
Flow
(cf
s)
Flow
Pomme de Terre RiverFlow Duration Curve
USGS gage station at Appleton MN
DryConditions
LowFlows
HighFlows
Mid-rangeFlows
MoistConditions
Flood Drought
610 cfs
181 cfs82 cfs
34 cfs
4 cfs
Pomme de Terre Watershed Project 41 Fecal Coliform TMDL

Pomme de Terre Watershed Project 42 Fecal Coliform TMDL
Next Step: Create a Load Duration Curve
A curve that shows the allowable load of fecal bacteria over all flow conditions.
Allowable load equals…Flow x Fecal Standard (200 orgs/100 ml) x Conv Factor
= ___ Billion Organisms/Day
ExampleLoading Capacity from
Mid Range Flow
82 cfs x 200 cfu/100ml x 28,312 ml/ft3 x 86,400 sec/day =
4.01E+11 bacteria per day
4.01E+11 ÷ 1 billion=
401 billion fecal coliform bacteria per day[Bacteria is equivalent to cfu (colony forming units)]
Flow Standard Conversion Factors

Pomme de Terre Watershed Project 43 Fecal Coliform TMDL
0.1
1
10
100
1000
10000
100000
1000000
10000000
0 10 20 30 40 50 60 70 80 90 100
Flow Duration Interval (%)
Feca
l Colif
orm (bi
llion
s/da
y)
Target
Pomme de Terre RiverLoad Duration Curve (Bacteria: ‘71 – ‘05 Monitoring Data)
Site: S000-195
DryConditions
LowFlows
HighFlows
Mid-rangeFlows
MoistConditions
905 square milesMPCA Data & USGS Gage Duration Interval
2984886 401
166
21
TMDLs for the flow zones
} 122
Margin ofSafety
TMDL equation wrap-up
Example: ‘Mid Range’ Flow Zone
TMDL = Wasteload Allocation
Load Allocation +
Margin of
Safety +
Total permitted discharge load for upstream wastewater treatment plants
401 122 86 193

0.1
1
10
100
1000
10000
100000
1000000
10000000
0 10 20 30 40 50 60 70 80 90 100
Flow Duration Interval (%)
Feca
l Colif
orm (bi
llion
s/da
y)
Target
Pomme de Terre RiverLoad Duration Curve (Bacteria: ‘71 – ‘05 Monitoring Data)
Site: S000-195
DryConditions
LowFlows
HighFlows
Mid-rangeFlows
MoistConditions
905 square milesMPCA Data & USGS Gage Duration Interval
0.1
1
10
100
1000
10000
100000
1000000
10000000
0 10 20 30 40 50 60 70 80 90 100
Flow Duration Interval (%)
Feca
l Colif
orm (bi
llion
s/da
y)
Target
All Data
Pomme de Terre RiverLoad Duration Curve (Bacteria: ‘71 – ‘05 Monitoring Data)
Site: S000-195
DryConditions
LowFlows
HighFlows
Mid-rangeFlows
MoistConditions
905 square milesMPCA Data & USGS Gage Duration Interval
Pomme de Terre Watershed Project 44 Fecal Coliform TMDL

0.1
1
10
100
1000
10000
100000
1000000
10000000
0 10 20 30 40 50 60 70 80 90 100
Flow Duration Interval (%)
Feca
l Colif
orm (bi
llion
s/da
y)
Target
All data
Jul-Aug
Pomme de Terre RiverLoad Duration Curve (Bacteria: ‘71 – ‘05 Monitoring Data)
Site: S000-195
DryConditions
LowFlows
HighFlows
Mid-rangeFlows
MoistConditions
905 square milesMPCA Data & USGS Gage Duration Interval
0.1
1
10
100
1000
10000
100000
1000000
10000000
0 10 20 30 40 50 60 70 80 90 100
Flow Duration Interval (%)
Feca
l Colif
orm (bi
llion
s/da
y)
Target
All data
Jul-Aug
>50% SF*
Pomme de Terre RiverLoad Duration Curve (Bacteria: ‘71 – ‘05 Monitoring Data)
Site: S000-195
DryConditions
LowFlows
HighFlows
Mid-rangeFlows
MoistConditions
905 square milesMPCA Data & USGS Gage Duration Interval
*SF is Storm Flow
Pomme de Terre Watershed Project 45 Fecal Coliform TMDL
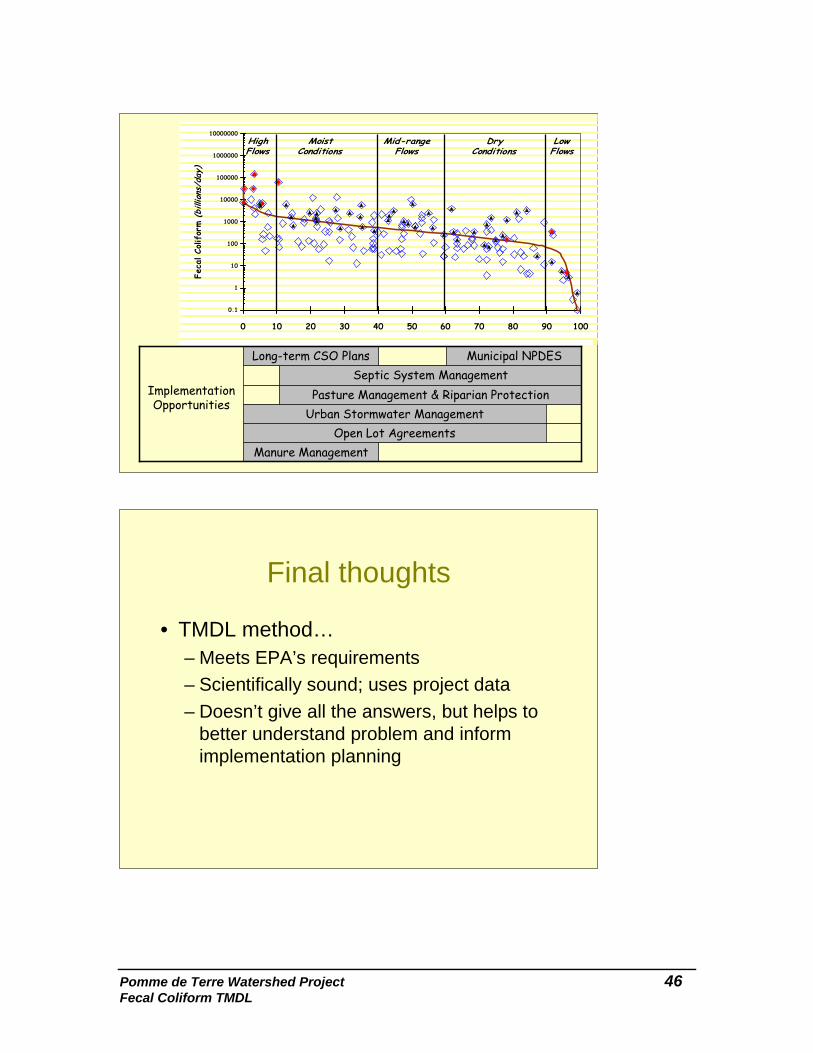
Pomme de Terre Watershed Project 46
Manure ManagementOpen Lot Agreements
Urban Stormwater ManagementPasture Management & Riparian Protection
Septic System ManagementMunicipal NPDESLong-term CSO Plans
Implementation Opportunities
0.1
1
10
100
1000
10000
100000
1000000
10000000
0 10 20 30 40 50 60 70 80 90 100
Feca
l Colifor
m (bi
llion
s/da
y)
DryConditions
LowFlows
HighFlows
Mid-rangeFlows
MoistConditions
Final thoughts
• TMDL method…– Meets EPA’s requirements– Scientifically sound; uses project data– Doesn’t give all the answers, but helps to
better understand problem and inform implementation planning
Fecal Coliform TMDL