polyvinyl alcohol from china, japan, and korea · polyvinyl alcohol from china, japan, and korea...
TRANSCRIPT

U.S. International Trade CommissionPublication 4533 May 2015
Washington, DC 20436
Polyvinyl Alcohol from China, Japan, and Korea
Investigation Nos. 731-TA-1014, 1015, and 1017 (Second Review)

U.S. International Trade Commission
COMMISSIONERS
Meredith M. Broadbent, Chairman Dean A. Pinkert, Vice Chairman
Irving A. Williamson David S. Johanson
F. Scott Kieff Rhonda K. Schmidtlein
Catherine DeFilippo
Staff assigned
Address all communications to Secretary to the Commission
United States International Trade Commission Washington, DC 20436
Director of Operations
Mary Messer, Investigator Jennifer Catalano, Industry Analyst
Samantha Day, Economist Charles Yost, Accountant
Lita David-Harris, Statistician Darlene Smith, Statistical Assistant
Mary Jane Alves, Attorney Douglas Corkran, Supervisory Investigator
U.S. International Trade CommissionWashington, DC 20436
www.usitc.gov
Publication 4533 May 2015
Polyvinyl Alcohol from China, Japan, and Korea
Investigation Nos. 731-TA-1014, 1015, and 1017 (Second Review)


CONTENTS Page
i
Determinations ....................................................................................................................... 1 Views of the Commission ........................................................................................................ 3 Part I: Introduction and overview .......................................................................................... I‐1 Background ................................................................................................................................ I‐1 The original investigations ........................................................................................................ I‐2 The Commission’s investigations .......................................................................................... I‐2 Subsequent proceedings ....................................................................................................... I‐3
Summary data ........................................................................................................................... I‐4 Related investigations ............................................................................................................... I‐8 The Commission’s related investigations and reviews ......................................................... I‐8 Litigation in related investigations ........................................................................................ I‐9
Statutory criteria and organization of the report ................................................................... I‐10 Statutory criteria ................................................................................................................. I‐10 Organization of report ......................................................................................................... I‐12
Commerce’s reviews ............................................................................................................... I‐13 Administrative reviews ........................................................................................................ I‐13 Five‐year reviews ................................................................................................................. I‐14
The subject merchandise ........................................................................................................ I‐15 Commerce’s scope .............................................................................................................. I‐15 Tariff treatment ................................................................................................................... I‐16
The domestic like product ....................................................................................................... I‐16 Description and applications ............................................................................................... I‐16 Manufacturing processes .................................................................................................... I‐18
Domestic like product issues ................................................................................................... I‐18 U.S. market participants .......................................................................................................... I‐19 U.S. producers ..................................................................................................................... I‐19 U.S. importers ...................................................................................................................... I‐21 U.S. purchasers .................................................................................................................... I‐23
Apparent U.S. consumption and market shares ..................................................................... I‐23 Apparent U.S. consumption ................................................................................................ I‐23 Market shares ...................................................................................................................... I‐25
Part II: Conditions of competition in the U.S. market ............................................................ II‐1 U.S. market characteristics ....................................................................................................... II‐1 Channels of distribution ........................................................................................................... II‐1 Geographic distribution ........................................................................................................... II‐2 Supply and demand considerations ......................................................................................... II‐2 U.S. supply ............................................................................................................................ II‐2 U.S. demand ......................................................................................................................... II‐7

CONTENTS Page
ii
Substitutability issues ............................................................................................................. II‐11 Lead times .......................................................................................................................... II‐11 Knowledge of country sources ........................................................................................... II‐11 Factors affecting purchasing decisions............................................................................... II‐12 Comparisons of domestic products, subject imports, and nonsubject imports ................ II‐15 Comparison of U.S.‐produced and imported PVA .............................................................. II‐19
Elasticity estimates ................................................................................................................. II‐23 U.S. supply elasticity ........................................................................................................... II‐23 U.S. demand elasticity ........................................................................................................ II‐23 Substitution elasticity ......................................................................................................... II‐23
Part III: Condition of the U.S. industry ................................................................................. III‐1 Overview ................................................................................................................................. III‐1 Background .......................................................................................................................... III‐1 Changes experienced by the industry ................................................................................. III‐1 Anticipated changes in operations ...................................................................................... III‐2
U.S. production, capacity, and capacity utilization ................................................................. III‐2 Constraints on capacity ....................................................................................................... III‐2 Alternative products ............................................................................................................ III‐2 Toll production .................................................................................................................... III‐3 Foreign trade zone............................................................................................................... III‐3
U.S. producers’ U.S. shipments and exports ........................................................................... III‐3 End use applications ............................................................................................................ III‐4 Hydrolysis levels .................................................................................................................. III‐4
U.S. producers’ inventories ..................................................................................................... III‐4 U.S. producers’ imports and purchases .................................................................................. III‐5 U.S. employment, wages, and productivity ............................................................................ III‐5 Financial experience of U.S. producers ................................................................................... III‐6 Background .......................................................................................................................... III‐6 Operations on PVA .............................................................................................................. III‐6 Variance analysis ............................................................................................................... III‐10 Capital expenditures and research and development expenses ...................................... III‐10 Assets and return on investment ...................................................................................... III‐11
Part IV: U.S. imports and the foreign industries ................................................................... IV‐1 U.S. imports ............................................................................................................................. IV‐1 Overview .............................................................................................................................. IV‐1 Imports from subject and nonsubject countries ................................................................. IV‐2 U.S. importers’ imports subsequent to September 30, 2014 ............................................. IV‐5 Excluded forms of PVA ........................................................................................................ IV‐5

CONTENTS Page
iii
Cumulation considerations ..................................................................................................... IV‐5 Fungibility ............................................................................................................................ IV‐5 Presence in the market ....................................................................................................... IV‐7 Geographical markets ......................................................................................................... IV‐7
U.S. importers’ inventories ..................................................................................................... IV‐7 The industry in China ............................................................................................................... IV‐9 Overview .............................................................................................................................. IV‐9 PVA operations .................................................................................................................. IV‐10 Alternative products .......................................................................................................... IV‐14
The industry in Japan ............................................................................................................ IV‐14 Overview ............................................................................................................................ IV‐14 Changes experienced by the industry ............................................................................... IV‐15 Anticipated changes in operations .................................................................................... IV‐15 Operations on PVA ............................................................................................................ IV‐15 End‐use applications .......................................................................................................... IV‐19 Hydrolysis levels ................................................................................................................ IV‐19 Alternative products .......................................................................................................... IV‐19
The industry in Korea ............................................................................................................ IV‐21 Subject country producers .................................................................................................... IV‐23 Antidumping or countervailing duty orders in third‐country markets ................................. IV‐23 Global market ........................................................................................................................ IV‐24 Capacity, production, imports, exports, and consumption .............................................. IV‐26 Foreign demand ................................................................................................................. IV‐28 Prices ................................................................................................................................. IV‐52
Part V: Pricing data ............................................................................................................... V‐1 Factors affecting prices ............................................................................................................ V‐1 Raw material costs ............................................................................................................... V‐1 Transportation costs to the U.S. market .............................................................................. V‐2 U.S. inland transportation costs ........................................................................................... V‐3
Pricing practices ....................................................................................................................... V‐3 Pricing methods .................................................................................................................... V‐3 Sales terms and discounts .................................................................................................... V‐4 Price leadership .................................................................................................................... V‐4
Price data .................................................................................................................................. V‐5 Price trends ........................................................................................................................... V‐8 Price comparisons ................................................................................................................ V‐9 Purchasers’ perceptions of relative price trends ............................................................... V‐10

CONTENTS Page
iv
Appendixes
A. Federal Register notices ................................................................................................. A‐1
B. The domestic interested parties’ request to cancel the Commission’s hearing ............ B‐1
C. Summary data ................................................................................................................ C‐1 D. Comments by U.S. producers, importers, purchasers, and foreign producers
regarding the effects of the orders and the likely effects of revocation ....................... D‐1 Note.–Information that would reveal confidential operations of individual concerns may not be published and therefore has been deleted from this report. Such deletions are indicated by asterisks.

UNITED STATES INTERNATIONAL TRADE COMMISSION
Investigation Nos. 731‐TA‐1014, 1016, and 1017 (Second Review)
Polyvinyl Alcohol from China, Japan, and Korea DETERMINATIONS
On the basis of the record1 developed in the subject five‐year reviews, the United States International Trade Commission (“Commission”) determines, pursuant to the Tariff Act of 1930, that revocation of the antidumping duty orders on polyvinyl alcohol from China and Japan would be likely to lead to continuation or recurrence of material injury to an industry in the United States within a reasonably foreseeable time and that revocation of the antidumping duty order on polyvinyl alcohol from Korea would not be likely to lead to continuation or recurrence of material injury to an industry in the United States within a reasonably foreseeable time.
BACKGROUND
The Commission, pursuant to section 751(c) of the Tariff Act of 1930 (19 U.S.C. §
1675(c)), instituted these reviews on March 3, 2014 (79 FR 11821) and determined on June 6, 2014 that it would conduct full reviews (79 FR 69127, November 20, 2014). Notice of the scheduling of the Commission’s reviews and of a public hearing to be held in connection therewith was given by posting copies of the notice in the Office of the Secretary, U.S. International Trade Commission, Washington, DC, and by publishing the notice in the Federal Register on November 20, 2014 (79 FR 69127) (schedule revision published on February 5, 2015 (80 FR 6546)). The hearing, which was scheduled by the Commission to be held in Washington, DC, on March 10, 2015, was cancelled by the Commission at the request of the domestic interested parties (80 FR 13024, March 12, 2015).
1 The record is defined in sec. 207.2(f) of the Commission’s Rules of Practice and Procedure
(19 CFR § 207.2(f)).


3
Views of the Commission
Based on the record in these five‐year reviews, we determine under section 751(c) of the Tariff Act of 1930, as amended (“the Tariff Act”), that revocation of the antidumping duty orders on polyvinyl alcohol (“PVA”) from China and Japan would be likely to lead to continuation or recurrence of material injury to an industry in the United States within a reasonably foreseeable time. We further determine that revocation of the antidumping duty order on PVA from Korea would not be likely to lead to continuation or recurrence of material injury to an industry in the United States within a reasonably foreseeable time.
I. Background
Original Investigations: On September 5, 2002, domestic producers Celanese Chemicals, Ltd. (“Celanese”) and E.I. du Pont de Nemours and Company (“DuPont”) filed antidumping duty petitions regarding imports of PVA from China, Germany, Japan, Korea, and Singapore.1 The Commission determined in June 2003 that a domestic industry was threatened with material injury by reason of less than fair value (“LTFV”) imports of PVA from Japan,2 and in September 2003 that a domestic industry was materially injured by reason of LTFV imports of PVA from China and Korea.3 Commerce published antidumping duty orders on imports of PVA from Japan on July 2, 2003, and on imports of PVA from China and Korea on October 1, 2003.4 The Commission’s determinations in the original investigations were not litigated,5 and all parties agreed to dismiss an appeal of Commerce’s final antidumping duty determination with
1 The only other domestic producer at that time, Solutia Inc. (“Solutia”), opposed the petitions. In the preliminary phase of the original investigations, the Commission determined that imports of PVA from Singapore were negligible and terminated the investigation of those imports. Confidential Report, Memorandum INV‐NN‐019 (Apr. 14, 2015) (“CR”) at I‐3; Public Report, Polyvinyl Alcohol from China, Japan, and Korea, Inv. Nos. 731‐TA‐1014, 1016, and 1017 (Second Review), USITC Pub. 4533 (May 2015) (“PR”) at I‐2; Polyvinyl Alcohol from China, Germany, Japan, Korea, and Singapore, Inv. Nos. 731‐TA‐1014 to 1018 (Preliminary), USITC Pub. 3553 (Oct. 2002).
2 Polyvinyl Alcohol from Germany and Japan, Inv. Nos. 731‐TA‐1015 to 1016 (Final), USITC Pub. 3604 at 1 (June 2003) (also making a negative final determination with respect to imports of PVA from Germany).
3 Polyvinyl Alcohol from China and Korea, Inv. Nos. 731‐TA‐1014 and 1017 (Final), USITC Pub. 3634 at 1 (Sept. 2003).
4 68 Fed. Reg. 39518 (Jul. 2, 2003) (Japan); 68 Fed. Reg. 56621 (Oct. 1, 2003) (Korea); 68 Fed. Reg. 56620 (Oct. 1, 2003) (China); 68 Fed. Reg. 58169 (Oct. 8, 2003) (China corrected).
5 Sinopec Sichuan Vinylon Works (“SVW”), a producer of PVA in China, filed a summons with the U.S. Court of International Trade (“CIT”) to contest the Commission’s final affirmative material injury determination but did not perfect the appeal by filing a complaint.

4
respect to imports from China while it was pending before the U.S. Court of Appeals for the Federal Circuit (“Federal Circuit”).6
First reviews: The Commission conducted full five‐year reviews and determined that revoking the orders on imports from China, Japan, and Korea would be likely to lead to continuation or recurrence of material injury to a domestic industry within a reasonably foreseeable time.7 Effective April 13, 2009, Commerce issued notices continuing the orders.8 The Commission’s affirmative first‐review determinations were not litigated.9
Second reviews: The Commission instituted these second five‐year reviews on March 3, 2014 and received a joint response to the notice of institution from DuPont and Sekisui Specialty Chemical America, LLC (“Sekisui”),10 domestic producers of PVA.11 On June 6, 2014, the Commission determined to conduct full reviews.12
Other investigations involving similar merchandise: The Commission has conducted two other investigations of PVA, but the United States does not currently maintain any other orders on imports of the product. In April 2001, Commerce revoked antidumping duty orders on PVA from China, Japan, and Taiwan due to a lack of domestic interested party participation in the first reviews of those orders.13 In 2004, a new antidumping duty investigation was instituted on
6 Sinopec Sichuan Vinylon Works v. United States, 29 ITRD 1257 (Ct. Int’l Trade Dec. 28, 2006); 29 ITRD 1985 (Ct. Int’l Trade May 30, 2007). By June 2006 and October 2006, SVW had obtained de minimis and zero antidumping duty margins, respectively, in Commerce’s first two administrative reviews. 71 Fed. Reg. 27991 (May 15, 2006), as amended by 71 Fed. Reg. 35616 (Jun. 21, 2006); 71 Fed. Reg. 62086 (Oct. 23, 2006). Under the terms of ***. Confidential Version of the Commission’s Opinion in the First Five‐Year Reviews, EDIS Doc. No. 532351, File ID No. 912662 (“Confidential First Reviews Opinion”) at 16 at n.60; Polyvinyl Alcohol from China, Japan, and Korea, Inv. Nos. 731‐TA‐1014, 1016, and 1017 (Review), USITC Pub. 4067 at 11 (Mar. 2009). According to domestic interested parties, ***. Domestic interested parties’ responses to Commission’s questions at 1‐2.
7 USITC Pub. 4067 at 3. 8 74 Fed. Reg. 16894 (Apr. 13, 2009). 9 Domestic producer Solutia, which had responded to the notice of institution and submitted
briefs supporting revocation of the orders in the first reviews, filed a summons to contest the Commission’s affirmative five‐year review determinations, but withdrew its appeal. CIT Ct. No. 09‐184.
10 On July 1, 2009, Sekisui acquired what was previously an integrated PVA business unit from Celanese. CR at I‐25; PR at I‐19; Domestic interested parties’ Prehearing Brief at 6.
11 The Commission found that the individual responses of domestic producers DuPont and Sekisui were adequate and that the domestic interested party group response was adequate. No respondent interested party responded. The Commission found the respondent interested party group response to be inadequate. CR at I‐1 at n.5; PR at I‐1 at n.5.
12 Chairman Broadbent and Commissioners Johanson and Kieff voted to conduct full reviews of all three orders in light of reported changes in the composition of the domestic industry. Vice Chairman Pinkert and Commissioners Williamson and Schmidtlein voted to conduct expedited reviews of all three orders. CR at I‐1 at n.5; PR at I‐1 at n.5.
13 Commerce had originally imposed those orders in May 1996. 61 Fed. Reg. 24286 (May 14, 1996); Polyvinyl Alcohol from China, Japan, and Taiwan, Inv. Nos. 731‐TA‐726, 727, and 729 (Final), USITC Pub. 2960 (May 1996) (affirmative threat determinations). Those investigations originated from (Continued…)

5
imports of PVA from Taiwan. After extensive litigation of the Commission’s preliminary determination,14 and Commerce’s final determination, Commerce revoked the antidumping duty order on imports of PVA from Taiwan on January 28, 2014.15
II. Domestic Like Product
A. Legal Standard and Product Description
In making its determination under section 751(c) of the Tariff Act, the Commission defines the “domestic like product” and the “industry.”16 The Tariff Act defines “domestic like product” as “a product which is like, or in the absence of like, most similar in characteristics and uses with, the article subject to an investigation under this subtitle.”17 The Commission’s practice in five‐year reviews is to examine the domestic like product definition from the original investigation and consider whether the record indicates any reason to revisit the prior findings.18
(…Continued) March 9, 1995 petitions filed by Air Products and Chemicals, Inc. (“Air Products”). Celanese acquired the PVA business from Air Products in September 2000. USITC Pub. 4067 at I‐16.
14 See, e.g., Polyvinyl Alcohol from Taiwan, Inv. No. 731‐TA‐1088 (Preliminary), USITC Pub. 3732 (Oct. 2004) (negative preliminary determination); Celanese Chems. Ltd. v. United States, 31 CIT 279 (2007); Polyvinyl Alcohol from Taiwan, Inv. No. 731‐TA‐1088 (Preliminary) (Remand), USITC Pub. 3920 (Apr. 2007) (affirmative preliminary determination on remand); Celanese Chems. Ltd. v. United States, 32 CIT 1250 (2008); Celanese Chems. Ltd. v. United States, 358 Fed. Appx. 174 (Fed. Cir. 2009) (summarily affirming CIT’s affirmance of affirmative preliminary determination on remand); 75 Fed. Reg. 15726 (Mar. 10, 2010) (publication of Commission’s affirmative determination on remand and resumption of investigation).
15 See, e.g., 76 Fed. Reg. 5562 (Feb. 1, 2011) (affirmative final antidumping duty determination); Polyvinyl Alcohol from Taiwan, Inv. No. 731‐TA‐1088 (Final), USITC Pub. 4218 (Mar. 2011) (affirmative final injury determination); 76 Fed. Reg. 13982 (Mar. 15, 2011) (antidumping duty order); Chang Chun Petrochemical Co. Ltd. v. United States, 906 F. Supp. 2d 1369 (Ct. Int’l Trade 2013); Chang Chun Petrochemical Co. Ltd. v. United States, 953 F. Supp. 2d 1300 (Ct. Int’l Trade 2013) (affirming revised weighted‐average dumping margin for the only mandatory respondent (Chang Chun Petrochemical (“CCPC”)) of 0.00 percent for the period July 1, 2003 through June 30, 2004); 79 Fed. Reg. 4442 (Jan. 28, 2014) (revoking order).
16 19 U.S.C. § 1677(4)(A). 17 19 U.S.C. § 1677(10); see, e.g., Cleo Inc. v. United States, 501 F.3d 1291, 1299 (Fed. Cir. 2007);
NEC Corp. v. Department of Commerce, 36 F. Supp. 2d 380, 383 (Ct. Int’l Trade 1998); Nippon Steel Corp. v. United States, 19 CIT 450, 455 (1995); Timken Co. v. United States, 913 F. Supp. 580, 584 (Ct. Int’l Trade 1996); Torrington Co. v. United States, 747 F. Supp. 744, 748‐49 (Ct. Int’l Trade 1990), aff’d, 938 F.2d 1278 (Fed. Cir. 1991); see also S. Rep. No. 249, 96th Cong., 1st Sess. 90‐91 (1979).
18 See, e.g., Internal Combustion Industrial Forklift Trucks from Japan, Inv. No. 731‐TA‐377 (Second Review), USITC Pub. 3831 at 8‐9 (Dec. 2005); Crawfish Tail Meat from China, Inv. No. 731‐TA‐752 (Review), USITC Pub. 3614 at 4 (July 2003); Steel Concrete Reinforcing Bar from Turkey, Inv. No. 731‐TA‐745 (Review), USITC Pub. 3577 at 4 (Feb. 2003).

6
Commerce defined the scope of the antidumping duty orders in these five‐year reviews as “all PVA hydrolyzed in excess of 80 percent, whether or not mixed or diluted with commercial levels of defoamer or boric acid,” and it expressly excluded fifteen forms of PVA from the scope.19 In the original investigations, the domestic industry did not produce any of the fifteen PVA products specifically excluded from the scope, and in the first and current reviews, the domestic industry reported that it did not produce commercially significant quantities of the excluded forms of PVA.20
PVA is a water‐soluble synthetic polymer, usually sold as a white granular solid or in powdered form.21 PVA can be categorized on the basis of the degree of hydrolysis,22 the
19 The products excluded from the scope of the reviews are as follows: (1) PVA in fiber form; (2) PVA with hydrolysis less than 83 mole percent and certified not for use in the production of textiles; (3) PVA with hydrolysis greater than 85 percent and viscosity greater than or equal to 90 centipois (“cPs”) (4) PVA with a hydrolysis greater than 85 percent, viscosity greater than or equal to 80 cPs but less than 90 cPs, certified for use in ink jet applications; (5) PVA for use in the manufacture of an excipient or as an excipient in the manufacture of film coating systems which are components of a drug or dietary supplement, and accompanied by an end‐use certification; (6) PVA covalently bonded with cationic monomer uniformly present on all polymer chains in a concentration equal to or greater than one mole percent; (7) PVA covalently bonded with carboxylic acid uniformly present on all polymer chains in a concentration equal to or greater than two mole percent, certified for use in a paper application; (8) PVA covalently bonded with thiol uniformly present on all polymer chains, certified for use in emulsion polymerization of non‐vinyl acetic material; (9) PVA covalently bonded with paraffin uniformly present on all polymer chains in a concentration equal to or greater than one mole percent; (10) PVA covalently bonded with silan uniformly present on all polymer chains certified for use in paper coating applications; (11) PVA covalently bonded with sulfonic acid uniformly present on all polymer chains in a concentration level equal to or greater than one mole percent; (12) PVA covalently bonded with acetoacetylate uniformly present on all polymer chains in a concentration level equal to or greater than one mole percent; (13) PVA covalently bonded with polyethylene oxide uniformly present on all polymer chains in a concentration level equal to or greater than one mole percent; (14) PVA covalently bonded with quaternary amine uniformly present on all polymer chains in a concentration level equal to or greater than one mole percent; (15) PVA covalently bonded with diacetoneacrylamide uniformly present on all polymer chains in a concentration level greater than three mole percent, certified for use in a paper application. The merchandise subject to these reviews is currently classifiable under subheading 3905.30.00 of the HTSUS, but Commerce explained that it provided this information for convenience and customs purposes because the written description of the scope of the orders is dispositive. 79 Fed. Reg. 38278 (Jul. 7, 2014); CR at I‐18 to I‐19; PR at I‐15 to I‐16.
20 USITC Pub. 3604 at 6 & n.20; USITC Pub. 4067 at 6 n.29; Confidential First Reviews Views at 9 n.29 (indicating that *** produced *** pounds of excluded forms of PVA ***, and that ***). In the current reviews, *** reported manufacturing limited quantities of excluded forms of PVA, equivalent to *** percent of total domestic production. CR/PR at Table III‐3.
21 CR at I‐20; PR at I‐16. 22 The percentage of acetate groups in the polyvinyl acetate feedstock that are replaced by
hydroxyl groups in the finished PVA determines the degree of hydrolysis. For example, fully hydrolyzed PVA has a replacement percentage in excess of 98 percent. CR at I‐20; PR at I‐16. The degree of hydrolysis is commonly denoted as “super” (more than 99 percent hydrolyzed), “fully” (98 to 99 percent (Continued…)

7
viscosity of an aqueous solution,23 and the average molecular weight of the finished product.24 For most applications, PVA is dissolved in an aqueous solution. Its solubility behavior in water depends on several factors including degree of polymerization, degree of hydrolysis, drying temperature, particle size, and molecular weight.25
Producers generally manufacture PVA by polymerizing vinyl acetate monomer (“VAM”) into polyvinyl acetate and then hydrolyzing the acetate groups with methanol in the presence of anhydrous sodium methylate or aqueous sodium hydroxide at moderate temperature and pressure.26 This continuous process yields PVA hydrolyzed in excess of 80 percent.27
PVA is sold in a variety of standard and specialty grades that vary according to molecular weight, hydrolysis, and viscosity.28 More than one grade of PVA may be sold to specific end‐use markets.29 The same grade of PVA is frequently sold for different commercial uses, and many end users are able to use a wide range of grades.30 Many applications, however, have evolved using particular grades such that substitution, although possible, could involve some cost and time to reformulate.31
In the United States, producers captively consume PVA or sell it to end users primarily as an intermediate in the production of polyvinyl butyral (“PVB”), which is a plastic laminate used
(…Continued) hydrolyzed), “intermediate” (90 to 98 percent hydrolyzed), and “partial” (85‐89 percent hydrolyzed), but these definitions can vary somewhat within the industry. CR at I‐22; PR at I‐17.
23 The viscosity (resistance to shear stress or flow) of an aqueous solution of PVA increases as the molecular weight of the PVA increases. CR at I‐20 to I‐21; PR at I‐16.
24 CR at I‐20 to I‐21; PR at I‐16. The average length in monomer units of the polymer chain in the finished product determines the molecular weight. Low‐viscosity grades tend to have PVA chain lengths as low as 300 monomer units, with average molecular weights around 45,000 to 55,000 unified atomic mass units (u), whereas high‐viscosity, fully hydrolyzed grades have PVA chain lengths up to 3,500 monomer units and average molecular weights around 200,000 to 225,000 u. CR at I‐21; PR at I‐16.
25 All other product characteristics being equal, the higher the hydrolysis, the lower the solubility. Solubility, however, can be changed by altering certain product characteristics. All standard grades of PVA, regardless of hydrolysis, must be put through a “saponification” process (in which an ester is heated with aqueous alkali to form an alcohol and the sodium salt of the acid corresponding to the ester) to achieve complete solubility. After saponification, PVA is a hard solid suitable for grinding into granular or powdered form. CR at I‐21 to I‐22; PR at I‐17.
26 CR at I‐23; PR at I‐18. Acetic acid generated as a byproduct of the process can either be recycled to produce VAM or sold in the acetic acid market. Given the need for a high volume of acetic acid in the production of VAM, producers generally return the byproduct to their own production process rather than sell it on the market. CR at I‐23 to I‐24; PR at I‐18.
27 CR at I‐23; PR at I‐18. 28 CR at I‐22; PR at I‐17. 29 For example, fully hydrolyzed PVA can be used in many of the same end uses in which
intermediate or partially hydrolyzed PVA can be used, such as textiles, paper, and adhesives. CR at I‐23; PR at I‐18.
30 CR at I‐23; PR at I‐18. 31 End users tend to avoid changing the grade of PVA that they use in their applications because
their formulas and process parameters might have to be adjusted. CR at I‐23; PR at I‐18.

8
as an adhesive between panes of automotive safety glass or load‐resistant architectural glass.32 They also sell PVA to end users (and occasionally to distributors) for use in manufacturing a variety of other products including adhesives, building products, ceramic proppant for drilling, emulsion polymers, paper products, PVA film, PVB film, PVC, specialty resin, textiles, vinyl acetate ethylene, automotive paint, water soluble film, cosmetics, and joint compounds.33
B. Analysis and Conclusion
In the original investigations, the Commission rejected an argument that PVA formulated for use in the production of PVB (“PVB‐grade PVA”) should be defined as a separate domestic like product. It defined one domestic like product, encompassing all domestically produced PVA meeting the specifications stated in Commerce’s scope definition.34 In the first reviews, domestic producers Celanese and DuPont agreed with the Commission’s domestic like product definition in the original investigations. No party argued for a different definition, and the Commission determined that the pertinent facts had not materially changed from the original investigations. Consequently, it defined the domestic like product to consist of all PVA described in the scope, regardless of the grade.35
In these reviews, domestic interested parties agree with the Commission’s definition of the domestic like product in the original investigations and first reviews.36 No party argues for a different definition, and the record does not indicate any material changes in pertinent facts from the original investigations and prior reviews.37 Consequently, we define the domestic like
32 CR at I‐21, II‐1; PR at I‐18, II‐1; CR/PR at Table II‐1, Table III‐4, Table III‐5. 33 CR at I‐21, II‐1, II‐11 to II‐12; PR at I‐17, II‐1, II‐7; CR/PR at Table II‐1, Table III‐5, Table IV‐4; IHS
Chemical, Chemical Economics Handbook: Polyvinyl Alcohols (June 2013), EDIS Doc. 551345, file 988892 at 7, 14, 36, 46, 51, 53, 61‐62; Confidential First Reviews Opinion at 30, 32‐33; USITC Pub. 4067 at 20, 21; USITC Pub. 3604 at 15‐16; USITC Pub. 3634 at 10.
34 As the Commission explained, all PVA has a similar chemical composition. Whereas PVB‐grade PVA may have tighter and more specific parameters than other types of PVA, other PVA grades must also meet specialized end‐user requirements, including quality and safety requirements. While all PVA grades are not completely interchangeable with other grades, more than one grade may be sold for a specific application. While PVB‐grade PVA is used primarily for optical applications such as windshields and architectural glass, it is also used for applications in which other types of PVA are used (although only PVB‐grade PVA can be used to make PVB). In terms of channels of distribution, both PVB‐grade PVA and other types of PVA are sold in the merchant market directly to end users. The Commission also found that production processes, equipment, and employees were similar for PVB‐grade PVA and other types of PVA. The Commission concluded that the differences between PVB‐grade PVA and other grades of PVA did not warrant treating PVB‐grade PVA as a separate domestic like product. USITC Pub. 3604 at 5‐6; USITC Pub. 3634 at 6.
35 USITC Pub. 4067 at 6‐9. 36 Domestic interested parties’ Prehearing Brief at 1 n.2; Domestic interested parties’ Response
to the Notice of Institution at 3‐4. 37 CR at I‐20 to I‐25; PR at I‐16 to I‐19; CR/PR at Table II‐1, Table III‐5.

9
product to consist of all domestically produced PVA meeting the specifications of the scope definition, regardless of the grade.
III. Domestic Industry
Section 771(4)(A) of the Tariff Act defines the relevant industry as the domestic “producers as a whole of a domestic like product, or those producers whose collective output of a domestic like product constitutes a major proportion of the total domestic production of the product.”38
During the original investigations and first reviews, the Commission found that the domestic industry consisted of the three firms that accounted for all U.S. production of PVA: Celanese, Solutia, and DuPont.39 These same entities currently produce PVA in the United States, although ownership of all three firms has changed since the prior reviews. In addition to Sekisui’s July 1, 2009, acquisition of Celanese’s integrated PVA business unit mentioned above, Eastman Chemical Co. (“Eastman”) completed its acquisition of Solutia on July 2, 2012, and Kuraray America acquired the Elvanol® PVA and related businesses from DuPont on June 1, 2014.40
We must determine whether any producer of the domestic like product should be excluded from the domestic industry pursuant to section 771(4)(B) of the Tariff Act. This provision allows the Commission, if appropriate circumstances exist, to exclude from the domestic industry producers that are related to an exporter or importer of subject merchandise or which are themselves importers.41
38 19 U.S.C. § 1677(4)(A). The definitions in 19 U.S.C. § 1677 apply to the entire subtitle containing the antidumping and countervailing duty laws, including 19 U.S.C. §§ 1675 and 1675a. See 19 U.S.C. § 1677. In defining the domestic industry, the Commission’s general practice has been to include in the industry producers of all domestic production of the like product, whether toll‐produced, captively consumed, or sold in the domestic merchant market.
39 USITC Pub. 3604 at 6‐8; USITC Pub. 3634 at 6; USITC Pub. 4067 at 9. 40 CR at I‐25; PR at I‐19; Domestic interested parties’ Prehearing Brief at 6. 41 See Torrington Co v. United States, 790 F. Supp. 1161, 1168 (Ct. Int’l Trade 1992), aff’d mem.,
991 F.2d 809 (Fed. Cir. 1993); Sandvik AB v. United States, 721 F. Supp. 1322, 1331‐32 (Ct. Int’l Trade 1989), aff’d mem., 904 F.2d 46 (Fed. Cir. 1990); Empire Plow Co. v. United States, 675 F. Supp. 1348, 1352 (Ct. Int’l Trade 1987). Exclusion of such a producer is within the Commission’s discretion based upon the facts presented in each investigation. The primary factors the Commission has examined in deciding whether appropriate circumstances exist to exclude a related party include the following: (1) the percentage of domestic production attributable to the importing producer; (2) the reason the U.S. producer has decided to import the product subject to investigation, i.e., whether the firm benefits from the LTFV sales or subsidies or whether the firm must import in order to enable it to continue production and compete in the U.S. market; and (3) the position of the related producer vis‐à‐vis the rest of the industry, i.e., whether inclusion or exclusion of the related party will skew the data for the rest of the industry. See, e.g., Torrington, 790 F. Supp. at 1168.
10
In the prior proceedings, the Commission did not exclude any related parties from the domestic PVA industry.42 In these reviews, no party raises any arguments concerning related party issues. We find that appropriate circumstances do not exist to exclude any producer from the domestic industry as a related party.43 Sekisui is not a related party by virtue of its *** or corporate affiliations. Sekisui ***.44 With respect to whether Sekisui qualifies as a related party by virtue of any corporate relationships, the only other feasible statutory basis for treating Sekisui as a related party – a third party that directly or indirectly controls a domestic producer and an exporter or importer of subject merchandise – is not met in these reviews.45
Domestic producer Kuraray America is a related party as an importer of subject merchandise from ***,46 as a domestic producer indirectly controlled by an exporter of subject merchandise (Kuraray Co., Ltd. (“Kuraray Japan”)),47 and because a third party (Kuraray Japan) indirectly controls Kuraray America and an importer of subject merchandise (MonoSol LLC (“MonoSol”)).48 We find, however, that appropriate circumstances do not exist to exclude
42 In its original determinations, the Commission determined that Solutia was a related party but found that appropriate circumstances did not exist to exclude Solutia given the minuscule size of its imports and purchases of subject merchandise relative to its domestic production. USITC Pub. 3604 at 7; USITC Pub. 3634 at 6 & n.24. In the first reviews, no domestic producer was a related party. Confidential First Reviews Opinion at 13 n.50; USITC Pub. 4067 at 9 n.50.
43 Eastman reported ***. CR at I‐29; PR at I‐21. 44 A domestic producer that does not import subject merchandise may nonetheless be deemed
a related party if it controls large volumes of subject imports. The Commission has found such control to exist when the domestic producer was responsible for a predominant proportion of an importer’s purchases and those purchases were substantial. See, e.g., Certain Cut‐to‐Length Steel Plate from the Czech Republic, France, India, Indonesia, Italy, Japan, Korea, and Macedonia, Inv. Nos. 701‐TA‐387 to 392 and 731‐TA‐815 to 822 (Preliminary), USITC Pub. 3181 at 12 (Apr. 1999); Certain Brake Drums and Rotors from China, Inv. No. 731‐TA‐744 (Final), USITC Pub. 3035 at 10 n.50 (Apr. 1997). Sekisui ***. These purchases were not substantial because they were equivalent to less than ***. CR at III‐1, III‐15 to III‐17; PR at III‐1, III‐5; CR/PR at Table III‐8.
45 Sekisui is wholly owned by Sekisui America Corp. (“Sekisui America”), which in turn is wholly owned by Sekisui Chemical Company (“Sekisui Japan”). Sekisui Japan does not produce PVA and owns a minority interest (*** percent) in DS Poval Co. Ltd. (“DS Poval”), a producer of PVA in Japan. Sekisui Japan ***. ***. CR at I‐26, III‐15 to III‐17; PR at I‐20, III‐5; CR/PR at Table I‐6, Table III‐8; Domestic interested parties’ Prehearing Brief at 6; Sekisui’s U.S. Producer Questionnaire at I‐4, I‐7; ***’s Foreign Producer Questionnaire at I‐3; ***’s U.S. Importer Questionnaire at I‐3, I‐4.
46 CR/PR at Table III‐8. 47 See generally 19 U.S.C. § 1677(4)(B)(ii)(II). Kuraray America is wholly owned by Kuraray
Holdings U.S.A., Inc. (“Kuraray Holdings U.S.A.”), which in turn is wholly owned by a foreign producer/exporter of PVA in Japan, Kuraray Japan. Kuraray America’s U.S. Importer Questionnaire at I‐3; CR at I‐26 to I‐27; PR at I‐20.
48 See generally 19 U.S.C. § 1677(4)(B)(ii)(III). Kuraray America’s owner (Kuraray Holdings U.S.A.) also wholly owns MonoSol Holdings Inc., which in turn wholly owns MonoSol, an importer of subject merchandise from ***. Kuraray America’s U.S. Importer Questionnaire at I‐3, I‐4; CR at I‐26 to I‐27; PR at I‐20.
11
Kuraray America from the domestic industry as a related party. Kuraray America only became a domestic producer in June 2014 through its acquisition of DuPont’s existing U.S. PVA production facilities.49 ***.50 These combined imports were ***, equivalent to *** percent or less of the acquired facility’s production.51 Given the small volume of imports, we find that Kuraray America’s primary interest is in domestic production rather than importation. In addition, Kuraray America supports continuation of the orders.52 Furthermore, given the timing of Kuraray America’s acquisition and the limited imports involved, there is no indication that subject imports or corporate affiliations materially affected the domestic producer’s performance between January 2008 and September 2014 (the period of review or “POR”).
Accordingly, and based on our domestic like product definition, we define the domestic industry as all U.S. producers of PVA, whether captively consumed or produced for the commercial market (i.e., Sekisui, Eastman, and Kuraray America).
IV. Cumulation
A. Legal Standard and Background
With respect to five‐year reviews, section 752(a) of the Tariff Act provides as follows: the Commission may cumulatively assess the volume and effect of imports of the subject merchandise from all countries with respect to which reviews under section 1675(b) or (c) of this title were initiated on the same day, if such imports would be likely to compete with each other and with domestic like products in the United States market. The Commission shall not cumulatively assess the volume and effects of imports of the subject merchandise in a case in which it determines that such imports are likely to have no discernible adverse impact on the domestic industry.53
49 Kuraray America began constructing a new U.S. facility in La Porte, Texas in ***. CR at III‐4; PR at III‐2.
50 CR at III‐1, III‐15; PR at III‐1, III‐5; CR/PR at Table III‐8. ***. CR at I‐27 at n.56; PR at I‐20 at n.56.
51 Kuraray America’s U.S. imports from *** were *** pounds in 2008, *** pounds in 2009, *** pounds in 2010, *** pounds in 2011, and *** pounds in 2012. MonoSol’s U.S. imports from *** were *** pounds in 2012, *** pounds in 2013, *** pounds in the first nine months of 2013 (“interim 2013”), and *** pounds in the first nine months of 2014 (“interim 2014”). DuPont’s U.S. PVA facility that Kuraray America acquired produced *** pounds in 2008, *** pounds in 2009, *** pounds in 2010, *** pounds in 2011, *** pounds in 2012, *** pounds in 2013, *** pounds in interim 2013, and *** pounds in interim 2014. CR/PR at Table III‐8.
52 CR/PR at Table I‐5. 53 19 U.S.C. § 1675a(a)(7).

12
Cumulation therefore is discretionary in five‐year reviews.54 The Commission may exercise its discretion to cumulate, however, only if the reviews are initiated on the same day, the Commission determines that the subject imports are likely to compete with each other and the domestic like product in the U.S. market, and imports from each such subject country are not likely to have no discernible adverse impact on the domestic industry in the event of revocation. Our focus in five‐year reviews is not only on present conditions of competition, but also on likely conditions of competition in the reasonably foreseeable future.
Two events affected the Commission’s cumulation analysis in the original investigations. First, the schedules became staggered at Commerce, so the Commission made its final determination regarding imports from Japan earlier than its final determinations regarding imports from China and Korea. Second, imports of PVA from China that were manufactured or exported by SVW were not eligible for cumulation for purposes of the Commission’s final determination regarding imports from Japan, but they were eligible for cumulation by the time of its final determinations regarding subject imports from China and Korea.55 In June 2003, the Commission exercised its discretion to cumulate imports from Japan and Korea in its final affirmative threat determination regarding imports from Japan,56 and in September 2003, the Commission cumulated imports from China, Japan, and Korea in its final present material injury determinations regarding imports from China and Korea.57
In the first five‐year reviews, the Commission exercised its discretion to cumulate subject imports from China, Japan, and Korea.58 In these reviews, the parties disagree about whether the Commission should exercise its discretion to cumulate imports from all three subject countries. Domestic interested parties ask the Commission to cumulate all subject
54 19 U.S.C. § 1677(7)(G)(i); see also, e.g., Nucor Corp. v. United States, 601 F.3d 1291, 1293 (Fed. Cir. 2010) (Commission may reasonably consider likely differing conditions of competition in deciding whether to cumulate subject imports in five‐year reviews); Allegheny Ludlum Corp. v. United States, 475 F. Supp. 2d 1370, 1378 (Ct. Int’l Trade 2006) (recognizing the wide latitude the Commission has in selecting the types of factors it considers relevant in deciding whether to exercise discretion to cumulate subject imports in five‐year reviews); Nucor Corp. v. United States, 569 F. Supp. 2d 1328, 1337‐38 (Ct. Int’l Trade 2008).
55 At the time of the Commission’s final determinations regarding imports from Japan, imports from Chinese producer SVW were ineligible for cumulation, being subject to a negative preliminary antidumping duty determination by Commerce. See 19 U.S.C. § 1677(7)(G)(ii)(I). By the time of the Commission’s final determinations regarding subject imports from China and Korea, imports from China from SVW were eligible for cumulation, because in its final determination Commerce found that SVW’s products were sold at less than fair value. USITC Pub. 3604 at 8‐13, 31‐32; USITC Pub. 3634.
56 In its negative material injury determination regarding imports from Japan, the Commission cumulated imports from Japan with imports from Korea, but it did not cumulate these imports with any imports from China because imports from SVW were not eligible for cumulation and there was insufficient evidence of a reasonable overlap of competition with the other (very limited) imports from China. USITC Pub. 3604 at 8‐13, 31‐32.
57 USITC Pub. 3634 at 6‐8. 58 USITC Pub. 4067 at 13.

13
imports.59 In contrast, respondent DKK argues that ***.60 Moreover, DKK argues that the Commission should not cumulate subject imports from China and Japan for its analysis in these reviews, due to differences in how they are likely to compete in the U.S. market.61
B. Likelihood of No Discernible Adverse Impact
The statute precludes cumulation if the Commission finds that subject imports from a country are likely to have no discernible adverse impact on the domestic industry.62 Neither the statute nor the Uruguay Round Agreements Act Statement of Administrative Action (“SAA”) provides specific guidance on what factors the Commission is to consider in determining that imports “are likely to have no discernible adverse impact” on the domestic industry.63 With respect to this provision, the Commission generally considers the likely volume of subject imports and the likely impact of those imports on the domestic industry within a reasonably foreseeable time if the orders are revoked. Our analysis for each of the subject countries takes
59 Domestic interested parties argue that imports from Korea are likely to have a discernible adverse impact on the domestic industry because revoking the order would make resumption of PVA production in Korea likely. They assert that there is likely to be a reasonable overlap of competition among PVA made in China, Japan, Korea, and the United States based on the Commission’s findings in the original investigations and prior reviews, questionnaire responses, internal company documents, and (where available) pricing data. Domestic interested parties’ Prehearing Brief at 2, 10, 16‐25, Exhibit 1, Exhibit 2; domestic interested parties’ responses to Commission’s questions at 7, 14‐17. Even if the Commission concludes that imports from Korea are likely to have no discernible adverse impact on the domestic industry if that order were revoked, domestic interested parties ask the Commission to exercise its discretion to cumulate imports from China and Japan based on likely similarities in how those imports would compete in the U.S. market upon revocation. They argue that both industries are large, have increased capacity, have substantial excess capacity, face the same incentive to maximize capacity utilization, are exporters of PVA, maintain a presence in the U.S. market despite the orders, and manufacture similar PVA products. They also assert that all producers in China and producers accounting for a large portion of PVA production in Japan have no corporate relationship to U.S. producers and that those with an affiliation ***. Domestic interested parties’ responses to Commission’s questions at 7‐17.
60 DKK’s responses to Commission’s questions at 5. 61 Specifically, DKK argues that the industry in China *** its PVA production capacity by (***
percent) between 2002 and 2012, *** the industry in Japan (*** percent), with the *** in production capacity in China equivalent to *** the total PVA production capacity in Japan in 2012 and *** capacity in China in 2012 *** capacity in Japan. It argues that the average unit value of exports from China are substantially lower than those from Japan due to the latter’s focus on exports of high‐value niche products. Moreover, DKK argues that the domestic industry is *** by producers in Japan, whereas the industry in China has no similar investment in the U.S. industry. DKK’s responses to Commission’s questions at 3‐4.
62 19 U.S.C. § 1675a(a)(7). 63 SAA, H.R. Rep. No. 103‐316, vol. I at 887 (1994).

14
into account, among other things, the nature of the product and the behavior of subject imports in the original investigations.
Based on the record in these reviews, we find that imports from China and Japan each would not likely have no discernible adverse impact on the domestic industry in the event of revocation. We find that imports from Korea would likely have no discernible adverse impact on the domestic industry if the antidumping duty order on PVA from Korea is revoked.
China: During the original investigations, U.S. imports of subject merchandise from China (*** of which were produced by SVW) dropped from a high of 19.6 million pounds in 2000 to 13.3 million pounds in 2001 and then rose to 13.4 million pounds in 2002. After the order was imposed, Commerce conducted two successive administrative reviews and found imports from SVW were at fair market value, but the firm otherwise remained subject to the order. During the first five‐year reviews, subject imports from China increased from 5.9 million pounds in 2003 to a peak of 6.7 million pounds in 2006 and then fell to 4.5 million pounds in 2007.64 In the current reviews, U.S. imports of PVA from China were 1.4 million pounds in 2008, 5.8 million pounds in 2009, 7.9 million pounds in 2010, 6.5 million pounds in 2011, 11.4 million pounds in 2012, 12.4 million pounds in 2013, 9.4 million pounds in interim 2013, and 10.9 million pounds in interim 2014.65
In the original investigations and first reviews, the Commission received a questionnaire response from only one producer of PVA in China, SVW.66 SVW accounted for *** exports of subject merchandise from China to the United States during the original investigations.67 In the current reviews, the Commission issued questionnaires to 19 firms identified as possible producers/exporters of PVA in China, and only one firm submitted a questionnaire response.68 The one responding firm, Alanchem Corp., does not produce PVA in China, accounted for *** percent of PVA exports from China to the United States during the POR, and ***.69 Accordingly, for our determinations, we rely as appropriate on facts available from the original investigations and first reviews and other available information, including chemical industry publications.70 According to available information, at least fifteen firms currently manufacture
64 Confidential First Reviews Opinion at 17 n.65; USITC Pub. 4067 at 12 n.65. 65 CR/PR at Table IV‐1. 66 Confidential First Reviews Opinion at 17 n.63; USITC Pub. 4067 at 12 n.63. 67 At the time of the first reviews, SVW accounted for approximately *** of PVA production in
China, and it was one of approximately fourteen PVA producers in China. The four major producers in China reportedly were ***. Confidential First Reviews Opinion at 17 n.63; USITC Pub. 4067 at 12 n.63.
68 CR at IV‐14; PR at IV‐9. 69 CR at IV‐15, IV‐21; PR at IV‐9, IV‐13. The firm’s exports of PVA to the United States, all of
which consisted of PVA within the scope of the order, decreased from *** pounds in 2008 to *** pounds in 2009, *** pounds in 2010, *** pounds in 2011, *** pounds in 2012, and *** pounds in 2013 and interim 2014. CR/PR at Table IV‐11.
70 For example, in assessing the subject industries, we rely on chemical industry source information converted from metric data from IHS Chemical, Chemical Economics Handbook: Polyvinyl Alcohols (June 2013) and SRI Consulting, Polyvinyl Alcohols, Chemical Economics Handbook (Mar. 2007). These data reflect both subject and excluded forms of PVA. According to available information, there (Continued…)
15
PVA in China, of which the *** largest collectively account for approximately *** percent of total PVA production capacity in China.71 SVW, believed to be the *** PVA producer in China in 2013, accounted for approximately *** percent of PVA production capacity in China that year.72
The available information indicates that the PVA industry in China is large, has substantial unused production capacity, and has continued to increase capacity,73 production,74 and exports of PVA.75 The PVA industry in China has maintained an interest in the U.S. market throughout the pendency of the order, and imports of PVA from China increased during the current reviews. Accordingly, we find that subject imports from China are not likely to have no discernible adverse impact upon revocation.
Japan: During the original investigations, the volume of subject imports from Japan increased rapidly from *** pounds in 2000 to *** pounds in 2002.76 After imposition of the antidumping duty order, imports from Japan continued to supply the U.S. market in the first and second periods of review, with importers either paying large antidumping duties or importing products that were specifically excluded from the scope of the orders. Imports of subject merchandise from Japan declined irregularly from *** pounds in 2003 to *** pounds in 2007.77 During the current reviews, U.S. imports of subject PVA from Japan were *** pounds in
(…Continued) were no imports of excluded forms of PVA from China into the United States. CR at IV‐23, IV‐24 to IV‐25, IV‐35 to IV‐38, IV‐42; PR at IV‐14, IV‐19 to IV‐21, IV‐23.
71 CR at IV‐15; PR at IV‐9; CR/PR at Table IV‐8. ***. CR at IV‐14 at n.7; PR at IV‐9 n.7. 72 According to projections, ***. In addition, new PVA facilities in China (e.g., ***) were
approved or under construction as of 2013, although some of these have since been canceled. CR at IV‐15; PR at IV‐19.
73 In 2006 (the most recent year for which estimates were available during the first reviews), the industry in China had a PVA production capacity of *** pounds. Confidential First Reviews Opinion at 17 n.63; USITC Pub. 4067 at 12 n.63. The PVA industry in China increased capacity from *** pounds in 2007 to *** pounds in 2012. CR/PR at Table IV‐9.
74 In 2006 (the most recent year for which estimates were available during the first reviews), the industry in China produced *** pounds of PVA. Confidential First Reviews Opinion at 17 n.63; USITC Pub. 4067 at 12 n.63. The PVA industry in China increased production from *** pounds in 2007 to *** pounds in 2012. CR/PR at Table IV‐9. Thus, available information indicates that production of PVA in China is considerably lower than production capacity.
75 Industry publications indicated that China became a net exporter of PVA during the first reviews, although its status as a net importer/exporter of PVA varied according to demand for imports of PVB‐grade PVA in China. Confidential First Reviews Opinion at 17 n.64; USITC Pub. 4067 at 12 n.64. During the current reviews, the PVA industry in China increased exports from *** pounds in 2007 to *** pounds in 2012. CR/PR at Table IV‐9. Its top three export markets were the Netherlands, India, and Pakistan, although exports of PVA from China to the United States have grown at a rate that has surpassed the growth to almost all other export markets between 2008 and 2014. CR at IV‐18 to IV‐19; PR at IV‐10 to IV‐11; CR/PR at Table IV‐10.
76 Confidential First Reviews Opinion at 18; USITC Pub. 4067 at 12. 77 Confidential First Reviews Opinion at 18 & nn.68, 72; USITC Pub. 4067 at 12‐13 & nn.68, 72.
16
2008, *** pounds in 2009, *** pounds in 2010, *** pounds in 2011, *** pounds in 2012, *** pounds in 2013, *** pounds in interim 2013, and *** pounds in interim 2014.78
In the original investigations, three producers of PVA in Japan submitted questionnaire responses (DKK, Japan VAM & Poval Co., Ltd. (“JVP”), and Kuraray Japan), whereas only JVP responded to the questionnaire in the first reviews.79 A fourth producer, The Nippon Synthetic Chemical Industry Co., Ltd. (“Nippon”), provided only limited data in the original investigations.80 In the current reviews, the Commission issued questionnaires to four firms identified as possible producers/exporters of PVA in Japan, and all four submitted questionnaire responses.81
Production of PVA in Japan fluctuated over the current period of review, but remained high.82 The industry in Japan has a large and increasing capacity,83 has substantial unused production capacity, and has continued to export substantial volumes of PVA.84 U.S. imports of
78 CR/PR at Table IV‐1. 79 Confidential First Reviews Opinion at 36 & n.161; USITC Pub. 4067 at 23 & n.161. 80 CR at IV‐24; PR at IV‐14. 81 CR at IV‐24; PR at IV‐14; CR/PR at Table IV‐14 (indicating that the largest producer of PVA in
Japan in 2013 was ***, followed by ***). 82 In the current reviews, the industry in Japan reported subject PVA production of 425.2 million
pounds in 2008, 384.0 million pounds in 2009, 435.2 million pounds in 2010, 435.0 million pounds in 2011, 384.3 million pounds in 2012, 416.7 million pounds in 2013, 308.8 million pounds in interim 2013, and 303.4 million pounds in interim 2014. CR/PR at Table IV‐16. Even though the Commission received questionnaires accounting for all current production of PVA in Japan, we also considered information from chemical industry publications for this and prior periods, because questionnaire coverage of the industry in Japan diverged widely among the original investigations, first reviews, and second reviews. CR at IV‐24; PR at IV‐14. The data in these chemical industry sources reflect both subject and excluded forms of PVA. Available information indicates that there was production in Japan and U.S. imports of excluded forms of PVA from Japan during the POR. CR at IV‐24 to IV‐25, IV‐35 to IV‐38, IV‐42; PR at IV‐14 to IV‐15, IV‐19 to IV‐21, IV‐23. According to these chemical industry publications, production of all forms of PVA in Japan increased from *** pounds in 2003 to *** pounds in 2006 but declined from *** pounds in 2007 to *** pounds in 2012. CR/PR at Table IV‐13; Confidential First Reviews Opinion at 18 & n.70; USITC Pub. 4067 at 13 & n.70.
83 The industry in Japan reported PVA production capacity of 530.6 million pounds in 2008, 542.8 million pounds in 2009, 529.9 million pounds in 2010, 553.6 million pounds in 2011, 543.5 million pounds in 2012, 569.9 million pounds in 2013, 426.5 million pounds in interim 2013, and 428.4 million pounds in interim 2014. CR/PR at Table IV‐16. According to industry publications, the PVA industry in Japan had production capacity of *** pounds in 2006 at the end of the first reviews, and increased capacity from *** pounds in 2007 to *** pounds in 2012. CR/PR at Table IV‐13; Confidential First Reviews Opinion at 42; USITC Pub. 4067 at 26.
84 The industry in Japan reported PVA exports of 119.3 million pounds in 2008, 148.1 million pounds in 2009, 146.4 million pounds in 2010, 144.1 million pounds in 2011, 136.0 million pounds in 2012, 169.1 million pounds in 2013, 121.3 million pounds in interim 2013, and 121.5 million pounds in interim 2014. As a share of the industry’s total PVA shipments, exports generally increased over the review period; the share was 29.1 percent in 2008, 38.0 percent in 2009, (Continued…)

17
subject PVA from Japan were present throughout the current reviews, and the industry in Japan continued to export excluded forms of PVA to the U.S. market.85 As discussed above, since the first reviews, two producers in Japan have become indirectly related to producers in the United States. Nevertheless, DKK and Kuraray Japan collectively accounted for only *** percent of production of PVA in Japan in 2013, meaning that *** of the production in Japan is manufactured by producers in Japan without any ties to the U.S. market.86 Moreover, record information indicates that DKK and Kuraray Japan each make decisions about exporting activities independently of their U.S. affiliates.87 In light of the foregoing considerations, we find that subject imports from Japan are not likely to have no discernible adverse impact upon revocation.
Korea: The volume of subject imports from Korea rose during the original investigations from 2.6 million pounds in 2000 to 3.8 million pounds in 2001 and 4.1 million pounds in 2002.88 After the antidumping duty order was imposed in October 2003, however, U.S. imports of PVA from Korea declined and then disappeared from the U.S. market during the remainder of the first reviews.89 Similarly, there are believed to have been no U.S. imports of PVA manufactured in Korea during the current reviews.90
There is currently no production of PVA in Korea. During the original investigations and first reviews, only one firm was known to produce PVA in Korea, DC Chemical Co. Ltd. (“DC
(…Continued) 34.2 percent in 2010, 34.4 percent in 2011, 35.9 percent in 2012, 40.8 percent in 2013, 40.2 percent in interim 2013, and 39.0 percent in interim 2014. Asia and the European Union accounted for the largest share of the exports by the PVA industry in Japan. CR/PR at Table IV‐16. Industry publications indicate that exports of PVA from Japan increased from a low of *** pounds in 2005 to *** pounds in 2007 and *** pounds in 2012. CR/PR at Table IV‐13; Confidential First Reviews Opinion at 45 n.201; USITC Pub. 4067 at 28 at n.201.
85 CR/PR at IV‐1. Exports by the industry in Japan of excluded forms of PVA to the United States were *** pounds in 2008, *** pounds in 2009, *** pounds in 2010, *** pounds in 2011, *** pounds in 2012, *** pounds in 2013, *** pounds in interim 2013, and *** pounds in interim 2014. CR at IV‐37 to IV‐38; PR at IV‐20 to IV‐21; CR/PR at Table IV‐21.
86 CR/PR at Table IV‐14. 87 CR at I‐26 to I‐29, IV‐26; PR at I‐20 to I‐21, IV‐15; see also CR at D‐21; PR at D‐3 (indicating that
***). 88 Confidential First Reviews Opinion at 19‐20; USITC Pub. 4067 at 13. 89 Confidential First Reviews Opinion at 19‐20; USITC Pub. 4067 at 13. In the first reviews, DC
Chemical reported exporting *** pounds of PVA to the United States in ***, and it reported zero U.S. exports thereafter. Confidential First Reviews Opinion at 19‐20; USITC Pub. 4067 at 13.
90 Proprietary U.S. Customs data identified a single firm as having imported “dutied” PVA from Korea between January 2008 and September 2014, but this firm (***) confirmed that these imports of *** in 2013 involved subject PVA manufactured in ***. The only other imports from Korea under the pertinent HTSUS statistical reporting numbers appear to involve misclassifications, as they all involved “non‐dutied” products. Of the four firms identified in proprietary U.S. Customs data as having imported “non‐dutied” products, the ***, whereas the other three non‐dutied import transactions were isolated to individual years and involved *** pounds and no more than $*** each. CR at I‐30 at n.60; PR at I‐21 at n.60.

18
Chemical”).91 On April 1, 2009, DC Chemical adopted a new corporate identity as OCI Co. Ltd. (“OCI”).92 In early 2009, OCI exited from several businesses, including its PVA business, citing limited growth potential.93 During the remainder of 2009, its plant in Gunsan, where the firm previously produced PVA and micronized silica, instead produced polysilicon, toluene di‐isocyanate, fumed silica, and caustic soda.94 A review of the firm’s annual reports from 2009 to 2013 indicates that the firm has not produced PVA in Korea since it exited the business in early 2009.95 A company executive, the manager of OCI’s Sales Development Team, confirmed that OCI stopped producing PVA in April 2009, ***, and has no capability or plans to resume PVA production in Korea.96 Likewise, chemical industry publisher IHS Chemical reports that there has been no production of PVA in Korea since OCI ceased production in 2009.97 Although ***.98 OCI does not maintain any inventory of PVA manufactured in Korea.99
We find it unlikely that OCI or any other firm would manufacture PVA in Korea in the reasonably foreseeable future. OCI retained only a few of the workers that previously manufactured PVA, and they are employed in other OCI departments that are unrelated to PVA production.100 The record does not indicate that there is any other firm in Korea that produces PVA or is in the process of becoming a new PVA producer.101 The cost that a new entrant would incur is substantial, and even domestic interested parties acknowledge that construction of a new facility would take ***.102 Based on these considerations, we find that subject imports
91 Confidential First Reviews Opinion at 19‐20; USITC Pub. 4067 at 13. DC Chemical’s production capacity *** during the prior reviews at *** pounds, and its capacity utilization fluctuated from a period low of *** percent in 2005 to a period high of *** percent in the first nine months of 2008. Confidential First Reviews Opinion at 19‐20; USITC Pub. 4067 at 13. In the final full year of the first reviews (2007), DC Chemical produced *** pounds of PVA in Korea, of which *** percent were exports. CR at IV‐39; PR at IV‐22. Commerce conducted expedited second five‐year reviews of the order on PVA from Korea and found likely antidumping duty margins of 38.74 percent for DC Chemical Co., Ltd. and 32.08 percent for all other producers/exporters in Korea. 79 Fed. Reg. 38278 (Jul. 7, 2014); CR/PR at Table I‐4.
92 CR at IV‐39; PR at IV‐22. 93 CR at IV‐39; PR at IV‐22. 94 CR at IV‐39; PR at IV‐22. 95 CR at IV‐39 to IV‐40; PR at IV‐22. 96 CR at IV‐40; PR at IV‐22. 97 CR at IV‐40 to IV‐41; PR at IV‐22. Moreover, ***. CR at IV‐40; PR at IV‐22. 98 CR at IV‐40; PR at IV‐22. 99 CR at IV‐40; PR at IV‐22. 100 CR at IV‐40; PR at IV‐22. 101 CR at IV‐40; PR at IV‐22. 102 Domestic interested parties report that construction of a new PVA production facility is highly
capital intensive and requires significant, complex operations. They estimate that it would take *** and cost $*** to design and construct a PVA production facility and related equipment and infrastructure (e.g., steam, air, cooling water, wastewater treatment). According to DKK, a minimum investment for a new state‐of‐the art facility that includes all processes such as a solvent recovery system and *** MT/year capacity would involve approximately *** years and $***. This is ***. CR at III‐4; PR at III‐2; (Continued…)
19
from Korea are likely to have no discernible adverse impact on the domestic industry in the reasonably foreseeable future if the antidumping duty order on PVA from Korea were to be revoked. Accordingly, the statute precludes us from cumulating subject imports from Korea with other subject imports for purposes of our analysis in these reviews.103
C. Likelihood of a Reasonable Overlap of Competition
The Commission generally has considered four factors intended to provide a framework for determining whether subject imports compete with each other and with the domestic like product.104 Only a “reasonable overlap” of competition is required.105 In five‐year reviews, the relevant inquiry is whether there likely would be competition even if none currently exists because the subject imports are absent from the U.S. market.106
In the original investigations, the Commission found a reasonable overlap of competition among subject imports from China, Japan, and Korea and between these imports and the domestic like product for purposes of its final determinations concerning subject imports from China and Korea.107 In the first reviews, the Commission found that there would
(…Continued) Domestic interested parties’ Prehearing Brief at 6; Domestic interested parties’ responses to Commission’s questions at 18‐19; DKK’s responses to Commission’s questions at 5.
103 19 U.S.C. § 1675a(a)(7). 104 The four factors generally considered by the Commission in assessing whether imports
compete with each other and with the domestic like product are as follows: (1) the degree of fungibility between subject imports from different countries and between subject imports and the domestic like product, including consideration of specific customer requirements and other quality‐related questions; (2) the presence of sales or offers to sell in the same geographical markets of imports from different countries and the domestic like product; (3) the existence of common or similar channels of distribution for subject imports from different countries and the domestic like product; and (4) whether subject imports are simultaneously present in the market with one another and the domestic like product. See, e.g., Wieland Werke, AG v. United States, 718 F. Supp. 50 (Ct. Int’l Trade 1989).
105 See Mukand Ltd. v. United States, 937 F. Supp. 910, 916 (Ct. Int’l Trade 1996); Wieland Werke, 718 F. Supp. at 52 (“Completely overlapping markets are not required.”); United States Steel Group v. United States, 873 F. Supp. 673, 685 (Ct. Int’l Trade 1994), aff’d, 96 F.3d 1352 (Fed. Cir. 1996). We note, however, that there have been investigations where the Commission has found an insufficient overlap in competition and has declined to cumulate subject imports. See, e.g., Live Cattle from Canada and Mexico, Inv. Nos. 701‐TA‐386 and 731‐TA‐812‐13 (Preliminary), USITC Pub. 3155 at 15 (Feb. 1999), aff’d sub nom, Ranchers‐Cattlemen Action Legal Foundation v. United States, 74 F. Supp. 2d 1353 (Ct. Int’l Trade 1999); Static Random Access Memory Semiconductors from the Republic of Korea and Taiwan, Inv. Nos. 731‐TA‐761‐62 (Final), USITC Pub. 3098 at 13‐15 (Apr. 1998).
106 The orders under review may have affected the marketing and distribution patterns of subject merchandise. See generally Chefline Corp. v. United States, 219 F. Supp. 2d 1313, 1314 (Ct. Int’l Trade 2002).
107 In its original final determinations regarding subject imports from Japan, the Commission found a reasonable overlap of competition among PVA made in the United States, Japan, and Korea. Due to Commerce’s preliminary determination that imports from SVW were not sold at less than fair (Continued…)
20
likely be a reasonable overlap in competition among subject imports from China, Japan, and Korea and between these imports and the domestic like product if the orders were revoked.108
Fungibility. In the original investigations and first reviews, the Commission found that end use was an important consideration when analyzing competition in the U.S. PVA market and that the industries in the United States, China, Japan, and Korea manufactured PVA for a variety of end uses.109 Questionnaire respondents generally reported that PVA made in the United States, China, Japan, and Korea was interchangeable with one another.110 In the current reviews, questionnaire respondents generally reported PVA made in the United States, China, and Japan to be comparable with respect to various purchasing factors.111 Questionnaire respondents also generally reported that PVA made in the United States, China, and Japan was interchangeable with one another.112 Moreover, the industries in China, Japan, and the United States produce PVA for overlapping end uses.113
(…Continued) value, imports from SVW (which accounted for the bulk of imports from China during the original investigations) were not eligible for cumulation at the time of the Commission’s determination concerning imports from Japan, and the Commission concluded that the record did not demonstrate a reasonable overlap of competition between non‐SVW imports from China and PVA made in the United States, Japan, and Korea. In its threat analysis, the Commission exercised its discretion to cumulate imports from Japan and Korea on the basis of similar increasing volume trends, similar price levels for pricing products for which there were substantial import quantities from both sources, and predominant underselling of the domestic like product by imports from both subject countries. USITC Pub. 3634 at 6‐8; USITC Pub. 3604 at 8‐13, 31‐32.
108 Confidential First Reviews Opinion at 20‐25; USITC Pub. 4067 at 14‐16. 109 In the original investigations, there was considerable overlap in the end uses of products
made in the United States, China, Japan, and Korea, particularly for textile and adhesive end uses. In the first reviews, the domestic industry reported manufacturing PVA for *** end uses; although subject imports from China were sold for *** end uses, the record indicated that producers in China, Japan, and Korea manufactured a wide variety of PVA products for sale to their home and global markets during the first reviews. There was also overlap in terms of the hydrolysis levels of PVA manufactured by each of the industries during the original investigations and first reviews. Confidential First Reviews Opinion at 21‐23; USITC Pub. 4067 at 14‐15; USITC Pub. 3634 at 8‐9; USITC Pub. 3604 at 10.
110 In the original investigations, a majority of producers and importers found that PVA made in the United States was at least sometimes interchangeable with subject imports from China, Japan, and Korea and that PVA imported from each of these countries was at least sometimes interchangeable with one another. In the first reviews, two domestic producers reported that PVA from all four sources is always interchangeable, but the third domestic producer (***) reported that PVA from these sources is never interchangeable. U.S. importers generally reported PVA from all four sources could be used interchangeably; purchasers’ responses were more mixed but generally reported imports from all sources as being at least sometimes interchangeable with one another. Moreover, producers in all four sources had become qualified for a large range of PVA products. Confidential First Reviews Opinion at 21‐23; USITC Pub. 4067 at 14‐15; USITC Pub. 3634 at 8‐9; USITC Pub. 3604 at 9‐10.
111 CR/PR at Table II‐8. 112 Most U.S. producers and importers reported that PVA made in the United States and China is
always or frequently interchangeable, while most purchasers reported them to be frequently or sometimes interchangeable. Domestic producers reported mixed responses about interchangeability of (Continued…)

21
Channels of Distribution. In the original investigations, subject imports from China, Japan, and Korea were generally sold directly to end users; a large majority of PVA made in the United States also was sold to end users, although *** percent of PVA made in the United States was transferred for internal consumption.114 During the first reviews, *** imports of subject merchandise from China and *** of the domestic industry’s U.S. commercial shipments of PVA were to end users, as were all or nearly all U.S. imports of PVA from Japan by 2005.115 During the current reviews, *** of the U.S. importers’ U.S. commercial shipments from Japan, *** of U.S. commercial shipments from China, and *** of the domestic industry’s U.S. commercial shipments were to end users.116
Geographic Overlap. In the original investigations, imports from China and Korea entered the U.S. market principally through eastern and western ports, imports from Japan entered through ports in all geographic areas, and the domestic industry made nationwide sales.117 During the first reviews, the domestic industry continued to make nationwide sales, and subject imports entered through ports in the South and Southwest, when present in the market.118 During the current reviews, the domestic industry continued to make sales throughout the U.S. market, whereas importers of PVA from China reported serving primarily the Midwest and Southeast, and importers of PVA from Japan reported serving the Northeast, Midwest, and Southeast.119
(…Continued) PVA made in the United States and Japan, most importers reported them to be always or frequently interchangeable, and most purchasers reported them to be frequently or sometimes interchangeable. CR at II‐29 to II‐30; PR at II‐19 to II‐20; CR/PR at Table II‐9.
113 CR/PR at Table III‐5 (end‐uses for domestic industry), Table IV‐12 (end uses for PVA manufactured in China), Table IV‐18 (end uses for PVA manufactured in Japan); see also CR/PR at Table IV‐4 (showing overlapping end uses in the U.S. market for ***). Available information also shows overlap in the U.S. market in terms of the hydrolysis levels for PVA from China, Japan, and the United States. CR/PR at Table III‐6 (hydrolysis levels for the domestic industry), Table IV‐19 (hydrolysis levels for the industry in Japan), Table IV‐5 (overlap in the U.S. market in terms of hydrolysis).
114 Confidential First Reviews Opinion at 24; USITC Pub. 4067 at 16; USITC Pub. 3634 at 10; USITC Pub. 3604 at 11.
115 Confidential First Reviews Opinion at 24; USITC Pub. 4067 at 16; USITC Pub. 3634 at 10; USITC Pub. 3604 at 11.
116 CR/PR at Table II‐1. The domestic industry’s internal consumption of PVA accounted for a declining share of its total shipments (*** percent in 2013 compared to *** percent in 2008). CR/PR at Table III‐4.
117 Confidential First Reviews Opinion at 23‐24; USITC Pub. 4067 at 16; USITC Pub. 3634 at 9; USITC Pub. 3604 at 11.
118 Imports from China principally entered through Charleston, South Carolina; imports from Japan were concentrated in Houston‐Galveston, Texas; and imports from Korea entered through Los Angeles, California, Charleston, South Carolina, and Savannah, Georgia. Confidential First Reviews Opinion at 23‐24; USITC Pub. 4067 at 16.
119 CR at II‐2 to II‐3; PR at II‐2; CR/PR at Table II‐2. More than half of U.S. imports of PVA from China entered the United States through Charleston, South Carolina, and one‐fifth entered through New York, New York, whereas primary entry districts for dutied U.S. imports from Japan during the current (Continued…)
22
Simultaneous Presence in Market. The domestic like product and imports from China, Japan, and Korea were sold in the U.S. market throughout the original investigations.120 After imposition of the orders, imports of subject forms of PVA from Japan were limited, imports from China were present in the U.S. market during 66 of the 69 months covered by the first reviews, and the domestic industry was present throughout that period.121 During the 81 months of the current reviews, imports from China entered the U.S. market in 78 months, imports from Japan of subject forms of PVA entered in 50 months in limited quantities, and the domestic industry sold PVA in the U.S. market throughout this period.122
Conclusion. The record continues to indicate that U.S.‐produced PVA and subject imports from China and Japan are fungible, are primarily shipped through the same channels of distribution, and overlap geographically to some degree. Imports from Japan were not simultaneously present in the U.S. market during portions of the current reviews. In view of our conclusion on no discernible adverse impact, however, we find on revocation that subject imports from Japan would likely have a continued presence in the U.S. market, as they did during the original investigations and as subject imports from China and the domestic like product have continued to have between January 2008 and September 2014. Given the evidence on the record in these reviews and the fact that imports from China and Japan and the domestic like product were sold in similar channels of distribution for overlapping end uses during the original investigations, the record indicates that upon revocation, subject imports from China and Japan and the domestic like product likely would again be sold in similar channels of distribution for overlapping end uses. Consequently, we find that there would likely be a reasonable overlap in competition among subject imports from China and Japan and the domestic like product should the orders be revoked.
D. Likely Conditions of Competition
In the first reviews, no party asserted and the Commission did not find any significant differences in likely conditions of competition among imports from China, Japan, and Korea. Accordingly, the Commission exercised its discretion to cumulate subject imports from China, Japan, and Korea in those reviews.123
In these reviews, we do not find any significant differences in how PVA imports from China and Japan are likely to compete in the U.S. market. Upon revocation, we instead find a number of likely similarities between these two subject industries. As discussed above, both industries are large. As of 2012, the PVA industry in China was the world’s largest, and the
(…Continued) reviews were Chicago, Illinois; New Orleans, Louisiana; and Los Angeles, California. CR at IV‐11; PR at IV‐7; CR/PR at Table IV‐6.
120 Confidential First Reviews Opinion at 24; USITC Pub. 4067 at 16; USITC Pub. 3634 at 10; USITC Pub. 3604 at 11.
121 Confidential First Reviews Opinion at 24‐25; USITC Pub. 4067 at 16. 122 CR at IV‐10; PR at IV‐7; CR/PR at Tables V‐4 to V‐9. 123 Confidential First Reviews Opinion at 25‐26; USITC Pub. 4067 at 17.
23
industry in Japan was the second largest.124 Even though the industry in China ***, both industries increased capacity during the current reviews, and both have substantial excess capacity.125 Both face the same incentive to maximize capacity utilization, and both are significant exporters (the first and third largest in the world as of 2013).126 Both industries maintained a presence in the U.S. market during the first and second reviews despite the orders, albeit at different levels.127
We note DKK’s argument that the average unit value of exports from China is substantially lower than that from Japan due to the latter’s focus on exports of high‐value niche products.128 Global Trade Atlas data do suggest that the average unit value of exports of PVA from China is substantially lower than that for Japan, but variances in product mix associated with differences in hydrolysis, viscosity, grade, and other such factors limit the utility of comparing these average unit value data.129 Even if the PVA industry in Japan produces some specialty PVA products and U.S. imports from Japan of subject merchandise have been concentrated in such products with the order in place, this concentration is not likely to persist upon revocation. The industry in Japan produces a wide variety of PVA products, as does the industry in China, and prior to imposition of the order the industry in Japan sold these products in the U.S. market, sometimes at lower prices than those for the comparable domestically manufactured product.130
We also do not agree with DKK’s assertion that the domestic industry is *** by producers in Japan, whereas the industry in China has no similar investment in the U.S. industry.131 Record information indicates that DKK and Kuraray Japan each make decisions about exports independently of their U.S. affiliates.132 Moreover, as explained above, DKK and Kuraray Japan collectively account for only *** percent of production of PVA in Japan in 2013, meaning that *** of the production in Japan is manufactured by producers in Japan without any ties to the U.S. market.133 Consequently, we do not find that subject imports from China
124 CR/PR at Table IV‐23; see also CR/PR at Table IV‐24 (indicating the many of the largest global manufacturers of PVA are located in China or Japan).
125 CR/PR at Table IV‐9, Table IV‐13, Table IV‐14, Table IV‐16. 126 CR/PR at Table IV‐10, Table IV‐13, Table IV‐14, Table IV‐16, Table IV‐25. 127 Domestic interested parties’ responses to Commission’s questions at 10‐12. 128 DKK’s responses to Commission’s questions at 3‐4. 129 CR/PR at Table IV‐25. 130 USITC Pub. 3634 at 6‐8; USITC Pub. 3604 at 8‐13, 31‐32; Confidential First Reviews Opinion at
20‐25; UISTC Pub. 4067 at 14‐16; CR/PR at Table II‐8, Table III‐5, Table III‐6, Table IV‐4, Table IV‐5, Table IV‐12, Table IV‐18.
131 DKK’s responses to Commission’s questions at 3‐4. 132 CR at I‐26 to I‐29, IV‐26; PR at I‐20 to I‐21, IV‐15; see also CR at D‐21; PR at D‐3 (indicating
that ***). 133 CR/PR at Table IV‐14. Domestic producer Eastman, which accounted for *** percent of
domestic production in 2013, has no direct or indirect corporate relationships with any producer in China or Japan. CR at I‐29, III‐1; PR at I‐20 to I‐21, III‐1.

24
are likely to compete differently in the U.S. market than subject imports from Japan in the event of revocation so as to warrant declining to exercise our discretion to cumulate.
E. Conclusion
For the reasons discussed above, we determine to exercise our discretion to cumulate subject imports from China and Japan for purposes of our analysis in these reviews. Subject imports of PVA from Korea are not eligible for cumulation in these reviews because they will likely have no discernible adverse impact upon revocation.
V. Whether Revocation of the Antidumping Duty Orders Would Likely Lead to Continuation or Recurrence of Material Injury Within a Reasonably Foreseeable Time
A. Legal Standards
In a five‐year review conducted under section 751(c) of the Tariff Act, Commerce will revoke an antidumping or countervailing duty order unless: (1) it makes a determination that dumping or subsidization is likely to continue or recur and (2) the Commission makes a determination that revocation of the antidumping or countervailing duty order “would be likely to lead to continuation or recurrence of material injury within a reasonably foreseeable time.”134 The SAA states that “under the likelihood standard, the Commission will engage in a counterfactual analysis; it must decide the likely impact in the reasonably foreseeable future of an important change in the status quo – the revocation or termination of a proceeding and the elimination of its restraining effects on volumes and prices of imports.”135 Thus, the likelihood standard is prospective in nature.136 The U.S. Court of International Trade has found that “likely,” as used in the five‐year review provisions of the Tariff Act, means “probable,” and the Commission applies that standard in five‐year reviews.137
134 19 U.S.C. § 1675a(a). 135 SAA at 883‐84. The SAA states that “{t}he likelihood of injury standard applies regardless of
the nature of the Commission’s original determination (material injury, threat of material injury, or material retardation of an industry). Likewise, the standard applies to suspended investigations that were never completed.” Id. at 883.
136 While the SAA states that “a separate determination regarding current material injury is not necessary,” it indicates that “the Commission may consider relevant factors such as current and likely continued depressed shipment levels and current and likely continued {sic} prices for the domestic like product in the U.S. market in making its determination of the likelihood of continuation or recurrence of material injury if the order is revoked.” SAA at 884.
137 See NMB Singapore Ltd. v. United States, 288 F. Supp. 2d 1306, 1352 (Ct. Int’l Trade 2003) (“‘likely’ means probable within the context of 19 U.S.C. § 1675(c) and 19 U.S.C. § 1675a(a)”), aff’d mem., 140 Fed. Appx. 268 (Fed. Cir. 2005); Nippon Steel Corp. v. United States, 26 CIT 1416, 1419 (2002) (same); Usinor Industeel, S.A. v. United States, 26 CIT 1402, 1404 nn.3, 6 (2002) (“more likely than not” (Continued…)
25
The statute states that “the Commission shall consider that the effects of revocation or termination may not be imminent, but may manifest themselves only over a longer period of time.”138 According to the SAA, a “‘reasonably foreseeable time’ will vary from case‐to‐case, but normally will exceed the ‘imminent’ timeframe applicable in a threat of injury analysis in original investigations.”139
Although the standard in a five‐year review is not the same as the standard applied in an original investigation, it contains some of the same fundamental elements. The statute provides that the Commission is to “consider the likely volume, price effect, and impact of imports of the subject merchandise on the industry if the orders are revoked or the suspended investigation is terminated.”140 It directs the Commission to take into account its prior injury determination, whether any improvement in the state of the industry is related to the order or the suspension agreement under review, whether the industry is vulnerable to material injury if an order is revoked or a suspension agreement is terminated, and any findings by Commerce regarding duty absorption pursuant to 19 U.S.C. § 1675(a)(4).141 The statute further provides that the presence or absence of any factor that the Commission is required to consider shall not necessarily give decisive guidance with respect to the Commission’s determination.142
In evaluating the likely volume of imports of subject merchandise if an order under review is revoked and/or a suspended investigation is terminated, the Commission is directed to consider whether the likely volume of imports would be significant either in absolute terms or relative to production or consumption in the United States.143 In doing so, the Commission must consider “all relevant economic factors,” including four enumerated factors: (1) any likely increase in production capacity or existing unused production capacity in the exporting country; (2) existing inventories of the subject merchandise, or likely increases in inventories; (3) the existence of barriers to the importation of the subject merchandise into countries other than
(…Continued) standard is “consistent with the court’s opinion”; “the court has not interpreted ‘likely’ to imply any particular degree of ‘certainty’”); Indorama Chemicals (Thailand) Ltd. v. United States, 26 CIT 1059, 1070 (2002) (“standard is based on a likelihood of continuation or recurrence of injury, not a certainty”); Usinor v. United States, 26 CIT 767, 794 (2002) (“‘likely’ is tantamount to ‘probable,’ not merely ‘possible’”).
138 19 U.S.C. § 1675a(a)(5). 139 SAA at 887. Among the factors that the Commission should consider in this regard are “the
fungibility or differentiation within the product in question, the level of substitutability between the imported and domestic products, the channels of distribution used, the methods of contracting (such as spot sales or long‐term contracts), and lead times for delivery of goods, as well as other factors that may only manifest themselves in the longer term, such as planned investment and the shifting of production facilities.” Id.
140 19 U.S.C. § 1675a(a)(1). 141 19 U.S.C. § 1675a(a)(1). Commerce has not made any duty absorption findings concerning
PVA from China, Japan, or Korea. CR at I‐16 at n.42; PR at I‐13 n.42. 142 19 U.S.C. § 1675a(a)(5). Although the Commission must consider all factors, no one factor is
necessarily dispositive. SAA at 886. 143 19 U.S.C. § 1675a(a)(2).

26
the United States; and (4) the potential for product shifting if production facilities in the foreign country, which can be used to produce the subject merchandise, are currently being used to produce other products.144
In evaluating the likely price effects of subject imports if an order under review is revoked and/or a suspended investigation is terminated, the Commission is directed to consider whether there is likely to be significant underselling by the subject imports as compared to the domestic like product and whether the subject imports are likely to enter the United States at prices that otherwise would have a significant depressing or suppressing effect on the price of the domestic like product.145
In evaluating the likely impact of imports of subject merchandise if an order under review is revoked and/or a suspended investigation is terminated, the Commission is directed to consider all relevant economic factors that are likely to have a bearing on the state of the industry in the United States, including but not limited to the following: (1) likely declines in output, sales, market share, profits, productivity, return on investments, and utilization of capacity; (2) likely negative effects on cash flow, inventories, employment, wages, growth, ability to raise capital, and investment; and (3) likely negative effects on the existing development and production efforts of the industry, including efforts to develop a derivative or more advanced version of the domestic like product.146 All relevant economic factors are to be considered within the context of the business cycle and the conditions of competition that are distinctive to the industry. As instructed by the statute, we have considered the extent to which any improvement in the state of the domestic industry is related to the orders under review and whether the industry is vulnerable to material injury upon revocation.147
B. Conditions of Competition and the Business Cycle
In evaluating the likely impact of the subject imports on the domestic industry if an order is revoked, the statute directs the Commission to consider all relevant economic factors “within the context of the business cycle and conditions of competition that are distinctive to the affected industry.”148 The following conditions of competition, many of which also existed during the original investigations and first reviews, inform our determinations in these reviews.
144 19 U.S.C. § 1675a(a)(2)(A‐D). 145 See 19 U.S.C. § 1675a(a)(3). The SAA states that “{c}onsistent with its practice in
investigations, in considering the likely price effects of imports in the event of revocation and termination, the Commission may rely on circumstantial, as well as direct, evidence of the adverse effects of unfairly traded imports on domestic prices.” SAA at 886.
146 19 U.S.C. § 1675a(a)(4). 147 The SAA states that in assessing whether the domestic industry is vulnerable to injury if the
order is revoked, the Commission “considers, in addition to imports, other factors that may be contributing to overall injury. While these factors, in some cases, may account for the injury to the domestic industry, they may also demonstrate that an industry is facing difficulties from a variety of sources and is vulnerable to dumped or subsidized imports.” SAA at 885.
148 19 U.S.C. § 1675a(a)(4).
27
1. Demand Conditions
PVA continues to be used in a wide variety of applications, and market participants commonly view the PVA market by reference to the applications for which it is sold.149 PVB is still the largest end use for PVA in the United States, although there are few firms that use PVB‐grade PVA, and they are supplied primarily by captive consumption.150 Purchases in the rest of the U.S. PVA market are more fragmented.151 PVA is also used in manufacturing a variety of other products including adhesives, building products, ceramic proppant for drilling, emulsion polymers, paper products, PVA film, PVB film, PVC, specialty resin, textiles, vinyl acetate ethylene, automotive paint, water soluble film, cosmetics, and joint compounds.152 Additionally, the parties have identified some potential new uses for PVA in the U.S. market, including ***.153
PVA accounts for a small to moderate share of the total cost of some of the end‐use products in which it is an input (e.g., adhesives, building products, emulsion polymers, paper products, PVC, vinyl acetate ethylene, and automotive paint) and a moderate to large share of others (e.g., PVA film, PVB, PVB film, specialty resins, textiles, and water soluble film).154 There are no substitutes for PVA for several of its end uses, and for those end uses for which there are
149 CR at I‐21, II‐1; PR at I‐17, II‐1; Confidential First Reviews Opinion at 30, 32‐33; USITC Pub. 4067 at 20, 21; USITC Pub. 3604 at 15; USITC Pub. 3634 at 10; Domestic interested parties’ Prehearing Brief at 30‐31.
150 In the current reviews, *** of all domestic PVA production was internally consumed by the three domestic producers, principally for manufacturing PVB products. In the U.S. commercial market, ***. CR at I‐21, I‐32 to I‐33, II‐1, II‐11 to II‐12; PR at I‐17, I‐23, II‐1, II‐7; CR/PR at Table III‐4, Table IV‐4; ***’s U.S. purchaser questionnaire response at question III‐1; Confidential First Reviews Opinion at 30, 32, 33; USITC Pub. 4067 at 20, 21; USITC Pub. 3604 at 15; USITC Pub. 3634 at 10.
151 In the current reviews, ***. CR at I‐32 to I‐33; PR at I‐23; ***’s U.S. purchaser questionnaire response at question III‐1; ***’s U.S. purchaser questionnaire response at question III‐1. During the first reviews, *** was the largest responding purchaser of PVA, accounting for *** percent of total reported purchases in 2007, whereas most other purchasers bought on average between 200,000 to 300,000 pounds. Other purchasers in the first reviews accounted for the following share of reported purchases: *** (*** percent), *** (*** percent), *** (*** percent), and *** (*** percent). Confidential First Reviews Opinion at 33; USITC Pub. 4067 at 21.
152 CR at I‐21, II‐1, II‐11 to II‐12; PR at I‐17, II‐1, II‐7; CR/PR at Table III‐5, Table IV‐4; IHS Chemical, Chemical Economics Handbook: Polyvinyl Alcohols (June 2013), EDIS Doc. 551345, file 988892 at 7, 14, 36, 46, 51, 53, 61‐62; Confidential First Reviews Opinion at 30, 32‐33; USITC Pub. 4067 at 20, 21; USITC Pub. 3604 at 15‐16; USITC Pub. 3634 at 10.
153 CR at II‐12; PR at II‐7; Domestic interested parties’ responses to Commission’s questions at 6; DKK’s responses to Commission’s questions at 2, 3. ***. CR at II‐12 at n.28; PR at II‐7 at n.28.
154 CR at II‐12 to II‐13; PR at II‐7 to II‐8; Confidential First Reviews Opinion at 33; USITC Pub. 4067 at 21.

28
substitutes, questionnaire respondents reported that prices of most of those substitutes did not affect PVA prices.155
Demand for PVA is driven by demand for its primary end uses.156 During the original investigations, apparent U.S. consumption of PVA declined overall, and the Commission observed that demand for PVA for use in textiles declined due to a contracting U.S. textile industry but that demand for PVB‐grade PVA remained strong.157 In the first reviews, apparent U.S. consumption increased irregularly,158 and based on questionnaire responses, the Commission found that demand for PVA in the United States was likely to slow or decline in light of then‐prevailing economic conditions and slowing or declining demand for specific end uses.159 In the current reviews, apparent U.S. consumption of PVA has not returned to the levels reached in the original investigations but did increase irregularly,160 which is consistent with information reported by market participants.161 Most questionnaire respondents anticipate increases in demand for PVA in the future.162 Likewise, the Chemical Economics Handbook anticipates that demand for PVA will increase by *** percent annually between 2012 and 2017, forecasting annual PVA demand growth of *** percent for PVB applications, ***
155 CR at II‐16 to II‐17; PR at II‐10. Confidential First Reviews Opinion at 33; USITC Pub. 4067 at 21.
156 CR at II‐13; PR at II‐8. 157 Confidential First Reviews Opinion at 30‐31; USITC Pub. 4067 at 20; USITC Pub. 3604 at 16;
USITC Pub. 3634 at 10. 158 Apparent U.S. consumption of PVA increased from *** pounds in 2003 to *** pounds in 2004
and *** pounds in 2005 but then declined to *** pounds in 2006 before increasing to *** pounds in 2007; it was *** pounds in interim 2007 and *** pounds in interim 2008. Confidential First Reviews Opinion at 34; USITC Pub. 4067 at 22.
159 During the first reviews, Solutia argued that use of PVB film in manufacturing photovoltaic panels was a new and fast‐growing application that would help offset prevailing declines in PVB demand for automotive and architectural applications. The record in the first reviews reflected shrinking demand for PVA for use in textiles, automotive, and construction, and *** for adhesives and paper applications. Confidential First Reviews Opinion at 34‐35; USITC Pub. 4067 at 22‐23.
160 Apparent U.S. consumption of PVA declined from *** pounds in 2008 to *** pounds in 2009, then increased to *** pounds in 2010, *** pounds in 2011, and *** pounds in 2012 before declining somewhat to *** pounds in 2013; apparent U.S. consumption was *** pounds in interim 2013 and *** pounds in interim 2014. CR/PR at Table I‐7.
161 Most firms reported that demand increased overall or did not change since January 1, 2008, and that they expected these trends to continue. They reported that demand tends to keep pace with trends in gross domestic product, which decreased in 2009 and has since been slowly recovering. One firm reported that demand for PVA used in manufacturing PVB has risen due to increased use of safety glass, and one firm attributed increased demand to overall growth in manufacturing. CR at II‐14; PR at II‐8; CR/PR at Figure II‐1 (real U.S. gross domestic product growth), Table II‐3 (questionnaire respondents’ responses regarding demand for PVA in the United States).
162 CR at II‐14; PR at II‐8; CR/PR at Table II‐3.

29
percent for adhesives, and *** percent for polymerization, but forecasting declining annual PVA demand for textile (*** percent) and paper applications (*** percent).163
2. Supply Conditions
The U.S. market continues to be supplied by the domestic industry and imports from subject and nonsubject sources.164 The domestic industry has been the predominant supplier to the U.S. market since the original investigations.165
Domestic industry: As discussed above, all three domestic producers now operate under different ownership than during the original investigations and prior reviews. Sekisui acquired Celanese’s PVA production facility on July 1, 2009, Eastman acquired Solutia’s PVA production facility on July 2, 2012, and Kuraray acquired DuPont’s Elvanol® PVA production assets on June 1, 2014.166 Additionally, Kuraray broke ground on April 11, 2013 on a new facility in La Porte, Texas that is expected in *** of 2015 to begin producing *** pounds of subject PVA products and *** pounds of excluded PVA products.167 The domestic industry’s PVA production capacity has been *** greater than apparent U.S. consumption since 2002, even before the addition of Kuraray’s new facility.168
The domestic industry has exported ***, some of which were commercial sales, and some to related firms.169 Since the original investigations, only two of the three domestic
163 Chemical Economics Handbook forecasts *** percent annual growth for all other PVA applications between 2012 and 2017. CR at I‐35, II‐15; PR at I‐25, II‐10.
164 CR/PR at Table I‐1; USITC Pub. 3604 at 14‐17; USITC Pub. 3634 at 10; USITC Pub. 4067 at 21‐25.
165 In 2002, the domestic industry accounted for *** percent of total apparent U.S. consumption as measured by quantity. During the first reviews, its share was *** percent in 2003, *** percent in 2005, and *** percent in 2007. In the current reviews, the domestic industry’s share of total U.S. apparent PVA consumption was *** percent in 2008 and *** percent in 2013. CR/PR at Table I‐8; Confidential First Reviews Opinion at 32, 35‐36, 41; USITC Pub. 4067 at 21, 23, 25; USITC Pub. 3604 at 17; USITC Pub. 3634 at 10.
166 CR at I‐25, III‐1, III‐19 at n.5; PR at I‐19, III‐1, III‐6 at n.5; CR/PR at Table III‐1; Domestic interested parties’ Prehearing Brief at 6. As discussed above, however, affiliations between producers in Japan and the United States do not account for all production in Japan or the United States.
167 CR at III‐4; PR at III‐2; CR/PR at Table III‐1; Domestic interested parties’ Prehearing Brief at 6. 168 Compare, e.g., CR/PR at Table I‐7 (apparent U.S. consumption of *** pounds in 2013) with,
e.g., CR/PR at Table III‐2 (domestic industry capacity of *** pounds in 2013). Confidential First Reviews Opinion at 32; USITC Pub. 4067 at 21; USITC Pub. 3604 at n.83; USITC Pub. 3634 at 10.
169 The domestic industry’s exports as a share of total PVA shipments were *** percent in 2002, *** percent in 2007, and *** percent in 2013. Derived from CR/PR at Table I‐1. The domestic industry’s commercial exports were *** pounds in 2008, *** pounds in 2009, *** pounds in 2010, *** pounds in 2011, *** pounds in 2012, *** pounds in 2013, *** pounds in interim 2013, and *** pounds in interim 2014; its exports to related firms were *** pounds in 2008, *** pounds in 2009, *** pounds in 2010, *** pounds in 2011, *** pounds in 2012, *** pounds in 2013, *** pounds in interim 2013, and *** pounds in interim 2014). CR/PR at Table III‐4 ; see also CR at III‐10; PR at III‐8 (indicating that during the (Continued…)

30
producers have manufactured PVA for the commercial market in the United States.170 Internal consumption, however, has accounted for an irregularly declining share of the domestic industry’s total shipments since the original investigations.171 In the original investigations, where all elements of the statutory captive production provision (19 U.S.C. § 1677(7)(C)(iv)) were met, the Commission focused primarily on the commercial PVA market in determining market share and the factors affecting financial performance, although it also analyzed these factors with respect to the whole market.172 Consistent with our determinations in the first reviews, in these reviews we consider significant captive production to be a pertinent condition of competition but focus our analysis on the market as a whole.173
Subject imports: In the original investigations and first reviews, the record indicated the existence of a number of PVA producers in China, and that SVW accounted for *** exports of subject merchandise from China to the United States.174 As discussed above, at least fifteen firms manufactured PVA in China during the current reviews.175 SVW, believed to be the *** PVA producer in China in 2013, accounted for approximately *** percent of PVA production capacity in China that year.176 Since the original investigations, the PVA industry in Japan has consisted of four producers.177 Two of these producers that collectively accounted for *** percent of PVA production in Japan and *** percent of exports of PVA to the United States in
(…Continued) current reviews, Sekisui, which has related PVA facilities in Spain and Japan reported *** exports *** to ***, whereas Kuraray reported *** exports to ***); Confidential First Reviews Opinion at 37 (observing that *** percent of the domestic industry’s production during the first reviews was sold in the U.S. commercial market); USITC Pub. 4067 at 23‐24; USITC Pub. 3604 at 17 (noting that the domestic industry reported that its increasing exports were somewhat related to the relocation of the U.S. textile industry outside the United States and somewhat related to demand by multinational customers to supply PVA to their facilities throughout the world).
170 CR/PR at Table III‐11; USITC Pub. 3604 at 16; USITC Pub. 3634 at 10; Confidential First Reviews Opinion at 31, 36‐37. The domestic industry produces a variety of PVA for a wide range of end uses, and ***. CR/PR at Table III‐5, Table III‐6; CR at II‐22 at n.39; PR at II‐14 at n.39.
171 Internal transfers accounted for *** percent of the domestic industry’s domestic shipments of PVA in 2002 but only *** percent by interim 2008. During the first reviews, internal consumption accounted for between *** percent and *** percent of the domestic industry’s total shipments, and during the current reviews, internal consumption accounted for between *** percent and *** percent of the domestic industry’s total shipments by quantity. CR/PR at Table III‐4; Confidential First Reviews Opinion at 31, 36‐37; USITC Pub. 4067 at 23‐24; Domestic interested parties’ Prehearing Brief at 31‐32.
172 USITC Pub. 3604 at 14‐16; USITC Pub. 3634 at 10. 173 Confidential First Reviews Opinion at 31, 36‐37; USITC Pub. 4067 at 23‐24. 174 Confidential First Reviews Opinion at 17 n.63, 35‐36; USITC Pub. 4067 at 12 n.63, 23; USITC
Pub. 3604 at 11; USITC Pub. 3634 at 7‐8. 175 CR at IV‐15; PR at IV‐9; CR/PR at Table IV‐8. 176 According to projections, Inner Mongolia Shuangxin Chemical, Co., Ltd., which began
production of PVA in 2011, will have ***. In addition, new PVA facilities in China (e.g., ***) were approved or under construction as of 2013, although some of these have since been canceled. CR at IV‐15; PR at IV‐9.
177 CR/PR at Table IV‐14; Confidential First Reviews Opinion at 41; USITC Pub. 4067 at 23.

31
2013 (DKK and Kuraray Japan) are indirectly affiliated with domestic producers as discussed above.178
Imports from nonsubject countries: As was the case during the original investigations and first reviews, imports from nonsubject countries were the second largest supply source to the U.S. market after the domestic industry. These imports principally originated in Taiwan, with imports from Germany and Singapore accounting for considerably smaller shares of the U.S. market.179 The volume of imports of PVA from Taiwan fluctuated but was generally steady between January 2008 and September 2014; imports of PVA from Taiwan were the subject of an extended investigation and related litigation during this period, as discussed above.180
3. Substitutability and Other Conditions
Subject imports from China and Japan continue to be at least moderately substitutable for the domestic like product.181 Price remains an important factor in purchasing decisions, particularly given the prevalence in this industry of spot sales and short‐term contracts and the use of “meet‐or‐release clauses.”182
The continuous PVA manufacturing process remains a capital‐intensive, high fixed cost business. As a result, producers must maintain relatively high production rates and achieve profit margins sufficient to cover the substantial cost of maintaining plants and equipment.183
178 CR/PR at Table IV‐14. 179 CR at I‐30 to I‐32; PR at I‐21 to I‐23; CR/PR Table I‐6, Table I‐8 (indicating that nonsubject
imports’ share of apparent U.S. consumption was *** percent in 2008, *** percent in 2009, *** percent in 2010, *** percent in 2011, *** percent in 2012, *** percent in 2013, *** percent in interim 2013, and *** percent in interim 2014, whereas the market share of PVA from Taiwan was *** percent in 2008, *** percent in 2009, *** percent in 2010, *** percent in 2011, *** percent in 2012, *** percent in 2013, *** percent in interim 2013, and *** percent in interim 2014); USITC Pub. 3604 at 17; USITC Pub. 3634 at 10.
180 As discussed above, imports of PVA from Taiwan became subject to an affirmative preliminary injury determination on remand in April 2007 that was affirmed by the CIT in November 2008 and by the Federal Circuit in December 2009. After Commerce and the Commission resumed their respective investigations in March 2010, they reached affirmative final determinations of dumping and material injury. After additional litigation, Commerce revoked the antidumping duty order on imports of PVA from Taiwan on January 28, 2014.
181 CR at II‐17, II‐29 to II‐30; PR at II‐11, II‐19 to II‐20; CR/PR at Table II‐8, Table II‐9, Table III‐5, Table III‐6, Table IV‐4, Table IV‐5, Table IV‐12, Table IV‐18, Table IV‐19; Confidential First Reviews Opinion at 21‐23, 49; USITC Pub. 4067 at 14‐15, 29‐30; USITC Pub. 3634 at 8‐9, 22; USITC Pub. 3604 at 9‐10.
182 CR at V‐4 to V‐6; PR at V‐3 to V‐4; (prevalence of spot sales and short‐term contracts, use of “meet‐or‐release clauses”); CR/PR at Table II‐6 (importance of price), Table II‐11 (significance of factors other than price), Table V‐3 (types of sales in U.S. market); Confidential First Reviews Opinion at 47, 49; USITC Pub. 4067 at 29, 30; USITC Pub. 3634 at 20‐21.
183 CR at I‐23 to I‐24 (continuous process), III‐6 (***), III‐35 to III‐37 (capital expenditures); PR at I‐18, III‐2, III‐10 to III‐11; CR/PR at Table III‐15, Table III‐16; Domestic interested parties’ responses to (Continued…)
32
C. Revocation of the Antidumping Duty Orders on Subject Imports from China and Japan is Likely to Lead to the Continuation or Recurrence of Material Injury to the Domestic Industry Within a Reasonably Foreseeable Time
1. Likely Volume of Cumulated Subject Imports from China and Japan
In its final determinations concerning subject imports from China and Korea, the Commission found that, even absent an overall increase, cumulated subject imports from China, Korea, and Japan maintained a significant share of the U.S. market, including during the period after demand declined. It found the volume of cumulated subject imports both absolutely and relative to production and consumption in the United States to be significant.184
In its determinations in the first reviews, the Commission observed that cumulated subject imports from China, Japan, and Korea declined significantly after the orders were imposed,185 but it found that the subject industries would likely increase PVA exports to the United States if the orders were revoked. As support for this finding, the Commission pointed to the following: (1) even though the orders had a restraining effect, PVA producers in China and Japan maintained a presence in the U.S. market;186 (2) the subject industries collectively (…Continued) Commission’s questions at 19; Domestic interested parties’ Prehearing Brief at 7‐8; Confidential First Reviews Opinion at 38‐39; USITC Pub. 4067 at 24; USITC Pub. 3604 at 16; USITC Pub. 3634 at 10.
184 USITC Pub. 3634 at 11‐12. In its final determinations concerning subject imports from Japan, the Commission found that the absolute volume of cumulated subject imports from Japan and Korea increased rapidly between 2000 and 2001 and between 2001 and 2002 as did their share of the U.S. market. Notwithstanding this rapid growth, it found that their U.S. market presence was small and it did not deem their volume relative to production and consumption in the United States to be significant. The Commission, however, made an affirmative threat determination concerning imports from Japan, based on cumulated subject imports from Japan and Korea. USITC Pub. 3604 at 20, 32‐34.
185 During the original investigations, the volume of cumulated subject imports from China, Japan, and Korea declined from *** pounds in 2000 to *** pounds in 2001 and then increased to *** pounds in 2002. After the orders were imposed in July 2003 (Japan) and October 2003 (China and Korea), the volume of cumulated subject imports initially declined and then increased somewhat. The volume of cumulated subject imports fell dramatically to *** pounds in 2003 and *** pounds in 2004 before rising somewhat to *** pounds in 2005 and *** pounds in 2006 and then declining to *** pounds in 2007; cumulated subject imports in the first nine months of 2007 (*** pounds) were higher than in the first nine months of 2008 (*** pounds). Confidential First Reviews Opinion at 40; USITC Pub. 4067 at 25.
186 From a period high of *** percent in 2000, cumulated subject imports’ share of total apparent U.S. consumption dropped to *** percent in 2003 and was never higher than *** percent during the first reviews. In terms of the U.S. commercial market, cumulated subject imports held a period high share of *** percent in 2003, and their share of the U.S. commercial market was never higher than *** percent during the first reviews. Confidential First Reviews Opinion at 40‐41 & n.180; USITC Pub. 4067 at 25‐26 & n.180. Imports from Korea largely disappeared from the U.S. market after the orders were imposed. By contrast, the Commission observed that Chinese producer SVW continued to export and through its strong relationship with ***. Likewise, imports of PVA from Japan continued either despite the antidumping duties or via products that were specifically excluded from the orders, so (Continued…)

33
had substantial and unused production capacity187 and *** end‐of‐period inventories;188 (3) subject imports and the domestic like product were likely to compete for sales if the orders were revoked given that the industries in the subject countries had the capacity to manufacture products accounting for a significant percentage of purchases in the U.S. commercial market for PVA;189 (4) consistent with their need to maintain high levels of capacity utilization, the subject industries were significant worldwide exporters of PVA;190 (5) the U.S. PVA market was relatively large compared to other regional markets and its prices were at least comparable with other global markets;191 and (6) questionnaire respondents representing a wide range of PVA end users had reported their intention to seek imports from the subject countries in the event the orders were revoked.192
In the current reviews, we find that the subject industries in China and Japan have the ability to export substantial volumes because both are large and have substantial unused
(…Continued) producers in Japan also had a ready U.S. distribution network through which to increase exports in the event of revocation. Confidential First Reviews Opinion at 43; USITC Pub. 4067 at 26‐27.
187 The record indicated capacity of nearly *** pounds in 2006 and PVA production of *** pounds in China; of the reportedly 14 PVA producers in China, the only responding firm (SVW) reported capacity of *** pounds, and production of ***. Production of PVA in Japan increased from *** pounds in 2003 to *** pounds in 2006, whereas total production capacity was even higher (*** pounds in 2006). The only responding producer of PVA in Japan (JVP) reported *** its capacity from *** pounds in 2003 to *** pounds in 2007, although it also reported *** its capacity utilization from *** percent in 2003 to *** percent in 2007. Additionally, the producer in Korea (DC Chemical) ***. Confidential First Reviews Opinion at 41‐42; USITC Pub. 4067 at 26.
188 The Commission noted that *** reported end‐of‐period inventories that individually exceeded *** pounds throughout the first reviews, a level that substantially exceeded inventory levels of U.S. producers. Confidential First Reviews Opinion at 43; USITC Pub. 4067 at 26.
189 The Commission explained that subject producers manufactured and sold a wide variety of PVA products during the first reviews, and the domestic industry manufactured PVA for *** end uses. In 2007, the domestic industry and producers in the subject countries reported producing PVA of a hydrolysis level ***. Acknowledging that the domestic industry’s sales of PVB‐grade PVA might have been largely sheltered from import competition in the original investigations, the Commission did not find that would likely be the case in the reasonably foreseeable future (***). Confidential First Reviews Opinion at 44‐46; USITC Pub. 4067 at 27‐28.
190 During the first reviews, SVW’s exports as a share of its total shipments ranged from *** percent in interim 2008 to *** percent in 2004, and exports from China ranged from a low of *** pounds in 2003 to a high of *** pounds in 2006; JVP’s exports as a share of its total shipments ranged from a low of *** percent in 2005 to *** percent in interim 2007, and exports from Japan ranged from a low of *** pounds in 2005 to a high of *** pounds in 2007. Confidential First Reviews Opinion at 45; USITC Pub. 4067 at 28.
191 Confidential First Reviews Opinion at 45‐46; USITC Pub. 4067 at 28 (expressing reservations about using average unit values for exports, particularly where there might be differences in product mix, but finding that these data suggested that U.S. prices are at least comparable to those in other markets).
192 Confidential First Reviews Opinion at 39‐47; USITC Pub. 4067 at 24‐28.

34
capacity.193 Additionally, the industry in China is forecast to substantially increase capacity, and the industry in Japan has available inventories of PVA.194 The industries in China and Japan manufacture many of the same PVA products made by the domestic industry and that account for a significant portion of purchases in the U.S. market.195
Based on our findings in the original investigations and first reviews as well as available information in the current reviews, we find that the cumulated volume of subject imports from China and Japan is likely to be significant in the event of revocation both absolutely and relative to apparent U.S. consumption. Indeed, the industries in China and Japan have both demonstrated an increased interest in the U.S. market since 2008. Notwithstanding the restraining effects of the orders, imports from China and Japan not only maintained a presence
193 The record suggests the existence of at least 15 PVA producers in China, none of which submitted questionnaire responses in these reviews. Available information indicates that annual capacity to produce PVA in China has increased from *** pounds in 2007 to *** pounds as of ***, and that capacity utilization fell from *** percent in 2007 to *** percent by ***. CR/PR at Table IV‐8 and Table IV‐9. According to questionnaire responses of all four PVA producers in Japan, their combined PVA production capacity increased from 530.6 million pounds in 2008 to 569.9 million pounds in 2013, and their capacity utilization fell from 80.1 percent in 2008 to 73.1 percent in 2013. CR/PR at Table IV‐16. Furthermore, at least some of the subject producers are able to switch production and/or capacity between excluded forms of PVA and the PVA within the scope of these reviews using the same equipment and labor. CR at IV‐35; PR at IV‐19 to IV‐20; CR/PR at Table IV‐20; DKK’s responses to Commission’s questions at 6. The record does not indicate the current existence of any third‐country barriers to PVA manufactured in China and Japan. CR at IV‐43; PR at IV‐23.
194 In 2013 the excess capacity of the industry in China was *** the size of apparent U.S. consumption of PVA; the industry in China, however, is forecast to increase to its capacity to *** pounds by 2017. CR/PR at Table IV‐8 and Table IV‐9. Producers in Japan reported that they did not anticipate capacity changes. CR at IV‐27; PR at IV‐15.
End‐of‐period inventories in Japan increased irregularly since 2008 and were 76.9 million pounds in 2008, 67.7 million pounds in 2009, 73.4 million pounds in 2010, 86.5 million pounds in 2011, 88.1 million pounds in 2012, 86.7 million pounds in 2013, 89.8 million pounds in interim 2013, and 74.8 million pounds in interim 2014, or equivalent to 20.9 percent of total shipments by the industry in Japan by 2013. CR/PR at Table IV‐16. The record does not contain information about inventories of subject merchandise in China. End‐of‐period inventories of subject PVA in the United States (***) increased overall from *** pounds in 2008 to *** pounds in 2013 and were *** pounds in interim 2013 and *** pounds in interim 2014. CR/PR at Table IV‐7.
195 Between January 2008 and September 2014, with the orders in place, the domestic industry sold PVA in the U.S. market for a much greater range of end uses than PVA made in China and Japan. CR/PR at Table III‐5, Table IV‐4. At the same time, the industries in China and Japan each produce PVA for a wide range of end uses. CR/PR at Table IV‐12 (end uses in China) and Table IV‐18 (end uses in Japan). Additionally, both industries produce PVA for PVB applications, the largest end use in the U.S. market. CR/PR at Table IV‐12 and Table IV‐18. The industries manufacture PVA in overlapping hydrolysis levels, as reflected in their sales in the U.S. market during the POR and/or their production during this period. CR/PR at Table IV‐5 (sales in U.S. market), Table III‐6 (domestic industry), Table IV‐19 (industry in Japan).
35
in the U.S. market but they increased absolutely196 and relative to apparent U.S. consumption since 2008.197 Absent the restraining effects of the orders, there are incentives for subject producers in China and Japan to increase their presence in the U.S. market. Producers in China and Japan have maintained contacts in the United States, giving them a ready U.S. distribution network through which to increase exports in the event of revocation.198 Furthermore, questionnaire respondents reported their intention to seek imports from the subject countries in the event the orders were revoked.199 Producers in China and Japan already export substantial volumes of PVA worldwide,200 which is consistent with their need to maintain high levels of capacity utilization.201 Outside the Asia Pacific region, the U.S. PVA market is relatively large compared to other regional markets,202 and its prices are at least comparable with other global markets.203 We consequently conclude that the cumulated volume of subject imports
196 The volume of cumulated subject imports from China and Japan increased irregularly since 2008 and was *** pounds in 2008, *** pounds in 2009, *** pounds in 2010, *** pounds in 2011, *** pounds in 2012, *** pounds in 2013, *** pounds in interim 2013, and *** pounds in interim 2014. CR/PR at Table I‐7.
197 Cumulated subject imports from China and Japan irregularly increased their share of apparent U.S. consumption since 2008, and their share of the U.S. market was *** percent in 2008, *** percent in 2009, *** percent in 2010, *** percent in 2011, *** percent in 2012, *** percent in 2013, *** percent in interim 2013, and *** percent in interim 2014. CR/PR at Table I‐8.
198 ***. CR/PR at Table I‐6. Furthermore, the indirect relationships between two producers in Japan and two producers in the United States discussed above would not impede a likely significant volume of cumulated subject imports of PVA in the event of revocation.
199 For example, ***. Importer ***. Purchaser ***, and purchaser ***. Indeed, *** in the event of revocation. CR at D‐9 to D‐10, D‐17 to D‐19, D‐21; PR at D‐3. Furthermore, ***. CR at II‐22 & n.39, II‐31 & n.42; PR at II‐14 & n.39, II‐21 & n.42; DKK’s responses to Commission’s Questions at 3.
200 During the current reviews, exports of PVA from China increased overall from a low of 65.2 million pounds in 2009 to a high of 173.5 million pounds in 2014, and these exports were directed to a wide range of markets, including in Europe, Asia, the United States, the Middle East, and South America. CR/PR at Table IV‐10. Exports of PVA from Japan also increased overall between January 2008 and September 2014, from a low of 119.3 million pounds in 2008 to a high of 169.1 million pounds in 2013. Producers in Japan reported a variety of export markets for their PVA, including in Asia, Europe, Africa, the Middle East, and South America. CR/PR at Table IV‐16.
201 CR at I‐23 to I‐24 (continuous process), III‐6 (***), III‐35 to III‐37 (capital expenditures); PR at I‐18, III‐2, III‐10 to III‐11; CR/PR at Table III‐15, Table III‐16; Domestic interested parties’ responses to Commission’s questions at 19; Domestic interested parties’ Prehearing Brief at 7‐8; Confidential First Reviews Opinion at 38‐39; USITC Pub. 4067 at 24; USITC Pub. 3604 at 16; USITC Pub. 3634 at 10.
202 CR/PR at Table IV‐23 (indicating that the Asia Pacific region consumed the greatest volume of PVA (*** pounds in 2012, followed by Western Europe (*** pounds), the United States (*** pounds), Central and South America (*** pounds), Middle East (*** pounds), Central and Eastern Europe (*** pounds), and other smaller regional markets).
203 See CR at IV‐52; PR at IV‐28. We acknowledge that product mix issues and differences in estimation methods limit the utility of comparing these data. According to purchaser ***, prices in the U.S. market are ***, due to the existence of the antidumping duty orders. ***’s statement at 3.

36
from China and Japan is likely to be significant in the event of revocation both absolutely and relative to apparent U.S. consumption.
2. Likely Price Effects
Subject imports from China and Japan continue to be at least moderately substitutable for the domestic like product.204 Price remains an important factor in purchasing decisions, particularly given the prevalence of spot sales and short‐term contracts and the use of “meet‐or‐release clauses.”205
In the original investigations, the Commission found widespread underselling of the domestic like product by cumulated subject imports at significant margins for the four pricing products for which there was an overlap in competition among PVA made in the United States, China, Japan, and Korea; these products encompassed three main end uses (paper, textiles, and adhesives).206 The domestic industry’s prices for all four of these products declined.207 The Commission acknowledged that declining apparent U.S. consumption put downward pressure on prices and that declining unit costs permitted some pricing flexibility,208 but it found that significant underselling by subject imports depressed domestic like product prices significantly towards the end of the original investigations.209
Despite the discipline of the orders, cumulated subject imports continued to undersell the domestic like product occasionally in the first reviews and in the current reviews.210
204 CR at II‐17, II‐29 to II‐30; PR at II‐11, II‐19 to II‐20; CR/PR at Table II‐8, Table II‐9, Table III‐5, Table III‐6, Table IV‐4, Table IV‐5, Table IV‐12, Table IV‐18, Table IV‐19; Confidential First Reviews Opinion at 21‐23, 49; USITC Pub. 4067 at 14‐15, 29‐30; USITC Pub. 3634 at 8‐9, 22; USITC Pub. 3604 at 9‐10.
205 CR at V‐4 to V‐6; PR at V‐3 to V‐4; (prevalence of spot sales and short‐term contracts, use of “meet‐or‐release clauses”); CR/PR at Table II‐6 (importance of price), Table II‐11 (significance of factors other than price), Table V‐3 (types of sales in U.S. market); Confidential First Reviews Opinion at 47, 49; USITC Pub. 4067 at 29, 30; USITC Pub. 3634 at 20‐21.
206 USITC Pub. 3634 at 14‐15. 207 USITC Pub. 3634 at 15. 208 The Commission acknowledged that nonsubject imports from Germany and Taiwan may have
had an effect on domestic prices, but it found that nonsubject imports undersold the domestic like product less frequently and at smaller margins than subject imports. Moreover, in 2002, when prices of the domestic like product were declining, cumulated subject imports increased absolutely and relative to commercial and total apparent U.S. consumption, but nonsubject imports declined. USITC Pub. 3634 at 16.
209 It based this finding on confirmed lost sales and revenue allegations, the domestic industry’s ability to increase sales for a product for which there was no subject import competition, and the fact that low‐priced subject imports occurred during a period when the domestic industry was competing for a share of a diminished U.S. market. USITC Pub. 3634 at 15‐17.
210 In the first reviews, subject imports undersold the domestic like product in *** of *** possible comparisons at margins of *** to *** percent. Confidential First Reviews Opinion at 50; USITC Pub. 4067 at 30 (noting that the pricing data accounted for *** percent of total reported U.S. (Continued…)
37
Questionnaire respondents continue to report their expectation that revocation of the orders will lead to aggressive price competition in the U.S. market and that as a consequence subject imports would be priced lower than the domestic like product.211 In light of this and the underselling observed in the original investigations, if the orders were revoked, we find it likely that subject imports will significantly undersell the domestic like product to enable subject producers to increase their share of the U.S. market. During the first reviews, the domestic industry succeeded in increasing prices of the domestic like product as its production costs increased, and during the current reviews, the domestic industry’s unit cost of goods sold (“COGS”) was considerably lower than its unit net sales value.212 If the orders are revoked, the significant volume of low‐priced cumulated subject imports would likely have significant adverse price effects including a depressing or suppressing effect on domestic prices as subject producers compete with the domestic industry for sales in the U.S. market.
3. Likely Impact213
In the original investigations, the Commission concluded for purposes of its final determinations concerning imports from China and Korea, which it cumulated with imports from Japan, that subject imports had a significant adverse impact on the domestic industry. It based this conclusion on its findings of a significant volume of cumulated subject imports both
(…Continued) commercial PVA shipments and a high degree of coverage of the limited subject imports between January 2004 and September 2008). In the current reviews, cumulated subject imports from China and Japan undersold the domestic like product in 67 of 125 possible comparisons, ***, at margins of *** to *** percent. CR/PR at Tables V‐4 to V‐9 (indicating underselling of the domestic like product was associated with observations involving *** pounds of cumulated subject imports and overselling of the domestic like product was associated with observations involving *** pounds of cumulated subject imports); CR/PR at Table V‐11, Figures V‐2 to V‐7. Pricing data reported in these reviews accounted for approximately *** percent of the domestic industry’s U.S. shipments of PVA, *** percent of subject imports from China, and *** percent of subject imports from Japan between January 2008 and September 2014. CR at V‐8; PR at V‐5.
211 CR at D‐3, D‐5; PR at D‐3 (***”; see also Confidential First Reviews Opinion at 51‐52; USITC Pub. 4067 at 31.
212 CR/PR at Table III‐10 (indicating that the domestic industry’s COGS to net sales ratio ranged from *** percent to *** percent between January 2008 and September 2014); Confidential First Reviews Opinion at 51; USITC Pub. 4067 at 30.
213 Under the statute, “the Commission may consider the magnitude of the margin of dumping” in making its determination in a five‐year review. 19 U.S.C. § 1675a(a)(6). The statute defines the “magnitude of the margin of dumping” to be used by the Commission in five‐year reviews as “the dumping margin or margins determined by the administering authority under section 1675a(c)(3) of this title.” 19 U.S.C. § 1677(35)(C)(iv); see also SAA at 887. Commerce conducted expedited second five‐year reviews of both orders, and it found these likely antidumping duty margins: SVW (3.45 percent); all other producers/exporters in China (97.86 percent); DKK (144.16 percent); JVP (144.16 percent); Kuraray Japan (144.16 percent); Nippon (144.16 percent); all other producers/exporters in Japan (76.78 percent). 79 Fed. Reg. 38278 (Jul. 7, 2014); CR/PR at Table I‐4.
38
absolutely and as a share of apparent domestic consumption and production, evidence of significant underselling and price depression by subject imports, and corresponding declines in many of the domestic industry's performance indicators, especially in 2001 and 2002.214 In its determinations in the first reviews, the Commission found that the orders had restrained the volume of subject imports from China, Japan, and Korea, enabling the domestic industry to raise prices, reduce its inventories, increase or maintain its market share, and increase its production capacity, production, U.S. shipments, and productivity notwithstanding certain production disruptions.215 The domestic industry’s financial performance, while still weak, had improved from losses at the end of the original investigations to limited profitability by the close of the first reviews.216 If the orders were revoked, the Commission found that low‐priced cumulated subject imports would likely increase absolutely and take market share from the domestic industry, significantly undersell the domestic like product, and depress and suppress prices of domestically produced PVA.217 Given then‐prevailing demand conditions and the likelihood that subject imports would compete with the domestic industry for an even broader range of applications than in the original investigations, the Commission concluded that revoking the orders would materially impact the domestic industry, adversely affecting its output, sales, market share, employment, profitability, and return on investment.218
In the current reviews, the domestic industry’s performance factors were mixed. It held substantial end‐of‐period inventories219 and experienced declining employment levels,220
214 USITC Pub. 3604 at 17‐20. For purposes of its final determination concerning imports from Japan, which it cumulated with subject imports from Korea, the Commission did not find that cumulated subject imports had a significant adverse impact on the domestic industry, and it consequently made a negative present material injury determination regarding imports from Japan. USITC Pub. 3604 at 23‐27. The Commission reached an affirmative threat determination concerning subject imports from Japan on the basis of cumulated subject imports from Japan and Korea. USITC Pub. 3604 at 32‐34.
215 Confidential First Reviews Opinion at 54‐57; USITC Pub. 4067 at 32‐34. During the first reviews, Solutia asserted that it needed alternate supply sources ***; Solutia reported that it and other major purchasers had difficulty obtaining adequate supply of PVA from the domestic industry. Domestic producers Celanese and DuPont countered that they had produced all the PVA they could during the periods in which they experienced unusual prolonged shutdowns and/or production curtailments. Confidential First Reviews Opinion at 38; USITC Pub. 4067 at 24 (noting that Celanese ***, and a force majeure from *** and that DuPont experienced a force majeure when Hurricane Ike forced it to idle its La Porte, Texas facility for three weeks in 2008).
216 Confidential First Reviews Opinion at 54, 56‐57; USITC Pub. 4067 at 32‐34. 217 Confidential First Reviews Opinion at 58; USITC Pub. 4067 at 34. 218 Confidential First Reviews Opinion at 58; USITC Pub. 4067 at 34. 219 The domestic industry’s end‐of‐period inventories fluctuated between January 2008 and
September 2014. End‐of‐period inventories were *** pounds in 2008, *** pounds in 2009, *** pounds in 2010, *** pounds in 2011, *** pounds in 2012, *** pounds in 2013, *** pounds in interim 2013, and *** pounds in interim 2014. As a ratio to domestic production, end‐of‐period inventories at their peak were equivalent to *** percent in 2011, and at their lowest point were equivalent to *** percent in 2010. CR/PR at Table III‐7.

39
declining market share,221 and mediocre financial performance.222 The domestic industry’s total COGS rose between January 2008 and September 2014, mostly due to overall increased raw material costs.223 By contrast, the domestic industry’s performance was stable or improved overall in terms of production capacity,224 production,225 capacity utilization,226 and U.S.
(…Continued)
220 The domestic industry’s employment level fell overall from *** production and related workers (“PRWs”) in 2008 to *** PRWs in 2013, and was *** PRWs in interim 2013 and *** PRWs in interim 2014. Total hours worked declined from *** hours in 2008 to *** hours in 2013 and were *** hours in interim 2013 and *** hours in interim 2014. Hours worked per PRW were relative constant during this period. Hourly wages rose overall from $*** per hour in 2008 to $*** per hour in 2013 and were $*** per hour in interim 2013 and $*** per hour in interim 2014. Productivity also rose overall from *** pounds per hour in 2008 to *** pounds per hour in 2013, and it was *** pounds per hour in interim 2013 and *** pounds per hour in interim 2014. CR/PR at Table III‐9.
221 The domestic industry’s market share declined overall and was *** percent in 2008, *** percent in 2009, *** percent in 2010, *** percent in 2011, *** in 2012, *** percent in 2013, *** percent in interim 2013, and *** percent in interim 2014. CR/PR at Table I‐8.
222 The domestic industry’s operating income increased annually beginning in 2008 to a high point in 2011 and declined thereafter; its operating income was $*** in 2008, $*** in 2009, $*** in 2010, $*** in 2011, $*** in 2012, $*** in 2013, $*** in interim 2013, and $*** in interim 2014. Its operating income to net sales ratio followed a similar trend; it was *** percent in 2008, *** percent in 2009, *** percent in 2010, *** percent in 2011, *** percent in 2012, *** percent in 2013, *** percent in interim 2013, and *** percent in interim 2014. CR/PR at Table III‐10. The domestic industry’s capital expenditures and research and development (“R&D”) expenses fluctuated without dramatic annual variations during this period. Its capital expenditures were $*** in 2008, $*** in 2009, $*** in 2010, $*** in 2011, $*** in 2012, $*** in 2013, $*** in interim 2013, and $*** in interim 2014. In terms of R&D, it invested $*** in 2008, $*** in 2009, $*** in 2010, $*** in 2011, $*** in 2012, $*** in 2013, $*** in interim 2013, and $*** in interim 2014. CR/PR at Table III‐15. The total value of the domestic industry’s net assets increased from 2009 through 2013, largely due to the ***, but its ratio of operating income to total assets declined in 2012 and 2013 after reaching a high point in 2011. CR at III‐36; PR at III‐11; CR/PR at Table III‐16.
223 The domestic industry’s COGS rose irregularly and was $*** in 2008, $*** in 2009, $*** in 2010, $*** in 2011, $*** in 2012, $*** in 2013, $*** in interim 2013, and $*** in interim 2014. Raw materials accounted for between *** percent and *** percent of total COGS during this period. CR/PR at Table III‐12. As discussed above, VAM is the main raw material input for manufacturing PVA, and periodic shortages have led to price increases for this material. CR at III‐27 to III‐28 & n.10; PR at III‐8 & n.10. Natural gas, or its derivative ethane, is the primary feedstock used to manufacture VAM. Natural gas and ethane prices were volatile between January 2008 and September 2014, but are projected to be more stable into 2017. CR at V‐1 to V‐2; PR at V‐1 to V‐2; CR/PR at Figure V‐1.
224 The domestic industry’s average total PVA production capacity was *** pounds between 2008 and 2011 and then declined to *** pounds in 2012 and 2013; it was *** pounds in interim 2013 and interim 2014. CR/PR at Table III‐3.
225 The domestic industry’s production increased overall, and was *** pounds in 2008, *** pounds in 2009, *** pounds in 2010, *** pounds in 2011, *** pounds in 2012, *** pounds in 2013, *** pounds in interim 2013, and *** pounds in interim 2014. CR/PR at Table III‐2.
40
shipments.227 In a further positive development, Kuraray broke ground on April 11, 2013 on a new facility in La Porte, Texas that is expected in *** of 2015 to begin producing *** pounds of the domestic like product and *** pounds of excluded PVA products, and ***.228 As discussed above, demand for PVA in the U.S. market is expected to be stable or increase in the reasonably foreseeable future,229 and some new end uses for PVA are being developed.230 On balance, we conclude that the domestic industry is not vulnerable.
As discussed above, we find that the likely significant volume of cumulated subject imports from China and Japan would likely significantly undersell the domestic like product, take market share from the domestic industry, and cause significant adverse price effects, including price depression or suppression. Consequently, revocation of the orders on subject imports from China and Japan would likely have a significant impact on the domestic industry, adversely affecting its output, sales, market share, employment, profitability, and return on investment.
We have considered factors other than subject imports so as not to attribute likely injury from other factors to the subject imports. In the first reviews, the Commission rejected Solutia’s assertion that any increased subject imports after revocation would merely replace nonsubject imports, especially from Taiwan.231 In the current reviews, the domestic industry has experienced some declines and some improvements despite a relatively steady presence of nonsubject imports in the U.S. market.232 Consequently, any likely effects of nonsubject imports are distinguishable from those that we have attributed to the subject imports.
(…Continued)
226 Between January 2008 and September 2014, the domestic industry’s capacity utilization ranged from a period low of *** percent in 2009 to a period high of *** percent in 2011. CR/PR at Table III‐3.
227 The domestic industry’s U.S. shipments of PVA increased overall and were *** pounds in 2008, *** pounds in 2009, *** pounds in 2010, *** pounds in 2011, *** pounds in 2012, *** pounds in 2013, *** pounds in interim 2013, and *** pounds in interim 2014. Its exports also increased overall during this period, increasing irregularly from *** pounds in 2008 to *** pounds in 2013. CR/PR at Table III‐4. The domestic industry’s net sales values also increased overall and were $*** in 2008, $*** in 2009, $*** in 2010, $*** in 2011, $*** in 2012, $*** in 2013, $*** in interim 2013, and $*** in interim 2014. CR/PR at Table III‐10.
228 CR at III‐4; PR at III‐2; CR/PR at Table III‐1; Domestic interested parties’ Prehearing Brief at 6; Domestic interested parties’ responses to Commission’s questions at 18.
229 CR at I‐35, II‐14 to II‐15; PR at I‐25, II‐8 to II‐9; CR/PR at Table II‐3. 230 ***. CR at II‐12, II‐22 & n.39, II‐31 & n.42; PR at II‐7, II‐21 & n.39, II‐14 & n.42; Domestic
interested parties’ responses to Commission’s questions at 6; DKK’s responses to Commission’s questions at 2, 3.
231 The Commission explained that nonsubject imports from Taiwan ***, and there was no indication that these firms would switch their purchases to subject imports if the orders were revoked. Moreover, nonsubject imports had held a meaningful share of the U.S. market during the original investigations, but that had not prevented subject imports from entering in injurious volumes and prices. Confidential First Reviews Opinion at 57‐58; USITC Pub. 4067 at 34.
232 CR/PR at Table I‐8 (indicating that nonsubject imports’ share of the U.S. market was *** percent in 2008, *** percent in 2009, *** percent in 2010, *** percent in 2011, *** percent in (Continued…)

41
We consequently find that cumulated subject imports would likely have a significant adverse impact on the domestic industry upon revocation. Accordingly, we have determined that revocation of the antidumping duty orders on PVA from China and Japan would be likely to lead to continuation or recurrence of material injury to an industry in the United States within a reasonably foreseeable time.
D. Revocation of the Antidumping Order on Subject Imports from Korea Is Not
Likely to Lead to the Continuation or Recurrence of Material Injury to the Domestic Industry within a Reasonably Foreseeable Time
1. Likely Volume of Subject Imports
As discussed in section IV.B above, U.S. imports of PVA from Korea declined after the antidumping duty order was imposed on these products and disappeared from the U.S. market thereafter. There is no current production of PVA in Korea, and we find it unlikely that production of PVA will resume in Korea within a reasonably foreseeable time. Therefore, we find that revocation of the order on PVA from Korea is not likely to result in a significant volume of subject imports from Korea within the reasonably foreseeable future.
2. Likely Price Effects
Based on our conclusion that revocation of the antidumping duty order on PVA from Korea would not likely result in a significant volume of subject imports from Korea, we find that subject imports from Korea are unlikely to undersell the domestic like product significantly, or to depress or suppress prices of the domestic like product to a significant degree, within a reasonably foreseeable time after revocation.
3. Likely Impact
Having found that revocation of the antidumping duty order on PVA from Korea is unlikely to result in a significant volume of subject imports from Korea or significant adverse price effects on the domestic industry after revocation, we further find that subject imports from Korea would not likely have a significant adverse impact on the domestic PVA industry after revocation. Consequently, we conclude that if the order were revoked, subject imports from Korea would not likely lead to the continuation or recurrence of material injury to the domestic industry within a reasonably foreseeable time.
(…Continued) 2012, *** percent in 2013, *** percent in interim 2013, and *** percent in interim 2014). Moreover, ***, which is consistent with the Commission’s observations in the prior reviews. CR/PR at Table I‐6.

42
VI. Conclusion
For the foregoing reasons, we determine that revocation of the antidumping duty orders on PVA from China and Japan would be likely to lead to continuation or recurrence of material injury to an industry in the United States within a reasonably foreseeable time. We further determine that revocation of the antidumping duty order on PVA from Korea would not be likely to lead to continuation or recurrence of material injury to an industry in the United States within a reasonably foreseeable time.

I‐1
PART I: INTRODUCTION AND OVERVIEW
BACKGROUND
On March 3, 2014, the U.S. International Trade Commission (“Commission” or “USITC”) gave notice, pursuant to section 751(c) of the Tariff Act of 1930, as amended (“the Act”),1 that it had instituted reviews to determine whether revocation of the antidumping duty orders on polyvinyl alcohol (“PVA”)2 from China, Japan, and Korea would likely lead to the continuation or recurrence of material injury to a domestic industry.3 4 On June 6, 2014, the Commission determined that it would conduct full reviews pursuant to section 751(c)(5) of the Act.5 The following tabulation presents information relating to the background and schedule of this proceeding:6
1 19 U.S.C. § 1675(c). 2 Polyvinyl alcohol, or PVA, is described in the section of this reported entitled “Descriptions and
applications.” Commerce’s scope language defines the product more narrowly, with specific scope exclusions.
3 Polyvinyl Alcohol From China, Japan, and Korea; Institution of Five‐Year Reviews Concerning the Antidumping Duty Orders on Polyvinyl Alcohol From China, Japan, and Korea, 79 FR 11821, March 3, 2014. All interested parties were requested to respond to this notice by submitting the information requested by the Commission.
4 In accordance with section 751(c) of the Act, the U.S. Department of Commerce (“Commerce”) published a notice of initiation of five‐year reviews of the subject antidumping duty orders concurrently with the Commission’s notice of institution. Initiation of Five‐Year (‘‘Sunset’’) Review, 79 FR 11762, March 3, 2014.
5 Polyvinyl Alcohol From China, Japan, and Korea; Notice of Commission Determination To Conduct Full Five‐Year Reviews and Scheduling of Full Five‐Year Reviews, 79 FR 69127, November 20, 2014. The Commission received a joint response to the notice of institution on April 2, 2014, from domestic interested parties E.I. du Pont de Nemours and Company (“DuPont”) and Sekisui Specialty Chemical America, LLC (“Sekisui”). The Commission did not receive a response to the notice of institution from any respondent interested party. The Commission found the domestic interested party response to be adequate and found the respondent interested party group response to be inadequate. Chairman Broadbent and Commissioners Johanson and Kieff voted to conduct full reviews of all three orders in light of reported changes in the composition of the domestic industry. Commissioners Williamson, Pinkert, and Schmidtlein voted to conduct expedited reviews of all three orders, finding that there were no circumstances that would warrant conducting full reviews.
6 The Commission’s notice of institution, notice to conduct full reviews, scheduling notices, and statement on adequacy are referenced in appendix A and may also be found at the Commission’s web site (internet address www.usitc.gov). Commissioners’ votes on whether to conduct expedited or full reviews may also be found at the web site. Appendix B presents the domestic interested party’s request for consideration of cancellation of the Commission’s hearing. At the request of the domestic interested parties, the hearing scheduled for this proceeding was cancelled. In lieu of a hearing (and, therefore, posthearing briefs), the Commission asked parties to respond to written questions that were due on the
(continued...)

I‐2
Effective date Action
July 2, 2003 Commerce’s antidumping duty order on PVA from Japan (68 FR 39518)
October 1, 2003 Commerce’s antidumping duty orders on PVA from China and Korea (68 FR 56620 and 56621)
April 13, 2009 Commerce’s continuation of antidumping duty orders on PVA from China, Japan, and Korea (74 FR 16834)
March 3, 2014 Commerce’s initiation of second five‐year reviews (79 FR 11762)
March 3, 2014 Commission’s institution of second five‐year reviews (79 FR 11821)
July 7, 2014 Commerce’s final results of expedited second five‐year reviews of the antidumping duty orders (79 FR 38278)
November 13, 2014 Commission’s determinations to conduct full five‐year reviews and scheduling notice (79 FR 69127, November 20, 2014)
January 28, 2015 Commission’s revised scheduling notice (80 FR 6546, February 5, 2015)
March 5, 2015 Date of the Commission’s hearing (hearing cancelled at the request of the domestic interested parties, 80 FR 13024, March 12, 2015)
April 28, 2015 Date of the Commission’s vote
May 12, 2015 Date of the Commission’s determinations and views
THE ORIGINAL INVESTIGATIONS
The Commission’s investigations
The original investigations resulted from petitions filed by domestic PVA producers Celanese Chemicals, Ltd. (“Celanese”) (Dallas, Texas)7 and DuPont (Wilmington, Delaware)8 on September 5, 2002, alleging that an industry in the United States was materially injured and threatened with material injury by reason of less‐than‐fair‐value (“LTFV”) imports of PVA from China, Germany, Japan, Korea, and Singapore.9 In the preliminary phase of the original investigations, the Commission made affirmative determinations with respect to imports of
(…continued) same day as the previously scheduled deadline for posthearing briefs. The domestic interested parties and Japanese producer Denki Kagaku Kogyo Kabushiki Kaisha (“DKK”) and importer Denka Corp. (“Denka”) provided written responses to the Commission’s questions but respondent interested party importer Wego Chemical & Mineral Corp. did not respond.
7 On July 1, 2009, Sekisui America acquired the assets of Celanese’s PVA business, creating Sekisui Specialty Chemicals America, LLC. Polyvinyl Alcohol from Taiwan, Inv. No. 731‐TA‐1088 (Final), USITC Publication 4218, March 2011, p. I‐1.
8 On June 5, 2014, Kuraray America acquired DuPont’s PVA operations. 9 The only other U.S. producer at that time, Solutia, Inc. (“Solutia”), opposed the petitions.

I‐3
PVA from China, Germany, Japan, and Korea, but found imports of PVA from Singapore to be negligible (thereby terminating the investigation on the latter country).10
Following notification of staggered final determinations by Commerce that imports of PVA from China, Germany, Japan, and Korea were being sold at LTFV, the Commission determined that a domestic industry was threatened with material injury by reason of LTFV imports of PVA from Japan in June 2003 and was materially injured by reason of LTFV imports of PVA from China and Korea in September 2003.11 Commerce published the antidumping duty order on subject imports of PVA from Japan on July 2, 2003.12 Commerce published the antidumping duty orders on PVA from China and Korea on October 1, 2003.13
Subsequent proceedings
Litigation
Chinese producer Sinopec Sichuan Vinylon Works (“SVW”) filed a summons with the U.S. Court of International Trade (“CIT”) to appeal the Commission’s final affirmative injury determination regarding imports from China but did not perfect the appeal by filing a complaint, so the CIT summarily dismissed the appeal. No other party appealed the Commission’s final original injury determinations.14
Chinese producer SVW also appealed Commerce’s final determination in the original investigation of imports from China to the CIT and, as a result of that appeal, SVW’s antidumping margin was recalculated from an amended final determination rate of 6.91 percent ad valorem to 5.51 percent ad valorem.15 SVW then appealed the CIT’s judgment to the U.S. Court of Appeals for the Federal Circuit (“Federal Circuit”), but the parties ultimately
10 Polyvinyl Alcohol from China, Germany, Japan, Korea, and Singapore: Determinations, 67 FR 65597, October 25, 2002; and Polyvinyl Alcohol From China and Korea, Inv. Nos. 731‐TA‐1014 and 1017 (Final), USITC Publication 3634, September 2003, p. I‐1, fn. 2.
11 In June 2003, the Commission also made a negative final determination with respect to imports from Germany. Polyvinyl Alcohol From Germany and Japan, Inv. Nos. 731 ‐TA‐1015‐1016 (Final), USITC Publication 3604, June 2003, p. 1; and Polyvinyl Alcohol From China and Korea, Inv. Nos. 731‐TA‐1014 and 1017 (Final), USITC Publication 3634, September 2003, p. 1.
12 Antidumping Duty Order: Polyvinyl Alcohol from Japan, 68 FR 39518, July 2, 2003. 13 Antidumping Duty Order: Polyvinyl Alcohol from the People’s Republic of China,68 FR 56620,
October 1, 2003; Antidumping Duty Order: Polyvinyl Alcohol from the Republic of Korea, 68 FR 56621, October 1, 2003; and Antidumping Duty Order: Polyvinyl Alcohol from the People’s Republic of China: Correction, 68 FR 58169, October 8, 2003.
14 Polyvinyl Alcohol from China, Japan, and Korea, Inv. Nos. 731‐TA‐1014, 1016, and 1017 (Review), USITC Publication 4067, March 2009, p. I‐2.
15 Polyvinyl Alcohol from the People’s Republic of China: Notice of Court Decision Not In Harmony with Final Determination, 72 FR 36960, July 6, 2007; Sinopec Sichuan Vinylon Works v. United States, 29 ITRD 1985, Slip Op. 07‐88 (Ct. Int'l Trade May 30, 2007); Sinopec Sichuan Vinylon Works v. United States, 29 ITRD 1257, Slip Op. 06‐191 (Ct. Int'l Trade December 28, 2006).

I‐4
agreed to dismiss the appeal.16 As discussed below, Commerce subsequently conducted administrative reviews of SVW’s imports for the 2003/2004 and 2004/2005 periods, and calculated de minimis and zero antidumping duty margins, respectively.
First five‐year reviews
In March 2009, the Commission completed full first five‐year reviews of the subject orders and determined that revocation of the antidumping duty orders on PVA from China, Japan, and Korea would be likely to lead to continuation or recurrence of material injury to an industry in the United States within a reasonably foreseeable time.17 Following affirmative determinations in the first five‐year reviews by Commerce and the Commission,18 Commerce issued a continuation of the antidumping duty orders on imports of PVA from China, Japan, and Korea, effective April 13, 2009.19 The Commission’s five‐year review determinations were not litigated.20
SUMMARY DATA
Table I‐1 presents a summary of data from the original investigations (2002), the full first five‐year reviews (2007), and the current full second five‐year reviews (2013).21 As shown, the shares of imports of PVA from Japan and Korea diminished to below *** percent of the total U.S. market after imposition of the orders. There have been virtually no U.S. imports of PVA produced in Korea since the imposition of the antidumping duty order.22 The share of imports from China declined from *** percent in 2002 to *** percent in 2007, but recovered to *** percent in 2013. The increased U.S. imports from China after 2007 might be related to Commerce’s final results of administrative reviews published in 2006 concerning imports from
16 Polyvinyl Alcohol from China, Japan, and Korea, Inv. Nos. 731‐TA‐1014, 1016, and 1017 (Review), USITC Publication 4067, March 2009, pp. I‐2 – I‐3.
17 Vice Chairman Pearson dissented with respect to Korea. Polyvinyl Alcohol from China, Japan, and Korea, Inv. Nos. 731‐TA‐1014, 1016, and 1017 (Review), USITC Publication 4067, March 2009, p. 1.
18 Polyvinyl Alcohol From Japan, the Republic of Korea, and the People’s Republic of China: Final Results of the Expedited Sunset Reviews of the Antidumping Duty Orders, 73 FR 57596, October 3, 2008; and Polyvinyl Alcohol From China, Japan, and Korea; Determination, 74 FR 14999, April 2, 2009.
19 Polyvinyl Alcohol from Japan, the Republic of Korea and the People’s Republic of China: Continuation of Antidumping Duty Orders, 74 FR 16834, April 13, 2009.
20 Solutia filed a summons but withdrew its appeal on May 29, 2009. CIT Ct. No. 09‐184. 21 A more detailed presentation of data from the original investigations and subsequent reviews
appears in Appendix C. 22 Polyvinyl Alcohol from China, Japan, and Korea Investigation Nos. 731‐TA‐1014, 1016, and 1017
(Review), USITC Publication 4067, March 2009, pp. I‐16 – I‐17; and Chemical Economics Handbook: Polyvinyl Alcohols, IHS Chemical, June 2013, p. 67.

I‐5
China, in which it calculated 0.03 percent (de minimis) and 0.00 percent dumping margins for Chinese producer SVW.23
The largest source of U.S. imports from nonsubject sources is Taiwan. The share of imports from Taiwan increased from *** percent in 2002 to *** percent in 2007, and increased further to *** percent in 2013. As discussed below, Commerce recently revoked an antidumping duty order on PVA from Taiwan following years of litigation proceedings. The antidumping duty order on PVA from Taiwan, which resulted from a petition filed on September 7, 2004, was published by Commerce in the Federal Register on March 15, 2011.24 On January 28, 2014, Commerce published in the Federal Register a notice revoking the antidumping duty order on imports of PVA from Taiwan pursuant to the Court’s decision affirming its remand redetermination.25
Table I-1 PVA: Comparative data from the original investigations, full first five-year reviews, and current full second five-year reviews, 2002, 2007, and 2013
* * * * * * *
Table continued on following page.
23 Polyvinyl Alcohol From the People’s Republic of China: Final Results of Antidumping Duty Administrative Review, 71 FR 27991, May 15, 2006 (as amended, Polyvinyl Alcohol from the People’s Republic of China: Amended Final Results of Administrative Review, 71 FR 35616, June 21, 2006) and Polyvinyl Alcohol from the People’s Republic of China; Final Results of Antidumping Duty Administrative Review, 71 FR 62086, October 23, 2006.
24 Commerce calculated a weighted‐average antidumping duty margin of 3.08 percent for Chang Chun Petrochemical Co., Ltd. and all other producers/exporters in Taiwan. Antidumping Duty Order: Polyvinyl Alcohol From Taiwan, 76 FR 13982, March 15, 2011.
25 Polyvinyl Alcohol From Taiwan: Notice of Court Decision Not in Harmony With Final Determination of Sales at Less Than Fair Value and Revocation of Antidumping Duty Order, 79 FR 4442, January 28, 2014.

I‐6
Table I-1--Continued PVA: Comparative data from the original investigations, full first five-year reviews, and current full second five-year reviews, 2002, 2007, and 2013
(Quantity=1,000 pounds; value=1,000 dollars; unit values, unit labor costs, and unit financial data are per pound)
Item 2002 2007 2013 U.S. imports from China: Quantity *** 4,539 12,399
Value *** 3,813 12,496Unit value *** $0.84 $1.01Ending inventory quantity *** *** ***
Japan: Quantity *** *** ***
Value *** *** ***Unit value *** *** ***Ending inventory quantity *** *** ***
Korea: Quantity *** 0 0
Value *** 0 0Unit value *** (1) (1) Ending inventory quantity *** 0 0
Subject sources: Quantity *** *** ***
Value *** *** ***Unit value *** *** ***Ending inventory quantity *** *** ***
Taiwan: Quantity *** 26,127 ***
Value *** 24,012 ***Unit value *** $0.92 ***Ending inventory quantity *** *** ***
All other sources: Quantity *** 11,346 ***
Value *** 11,807 ***Unit value *** $1.04 ***Ending inventory quantity *** *** ***
All countries: Quantity *** *** ***
Value *** *** ***Unit value *** *** ***Ending inventory quantity *** *** ***
U.S. industry: Capacity (quantity) *** *** ***
Production (quantity) *** *** ***Capacity utilization (percent) *** *** ***U.S. shipments:
Quantity *** *** ***Value *** *** ***Unit value *** *** ***
Table continued on following page.
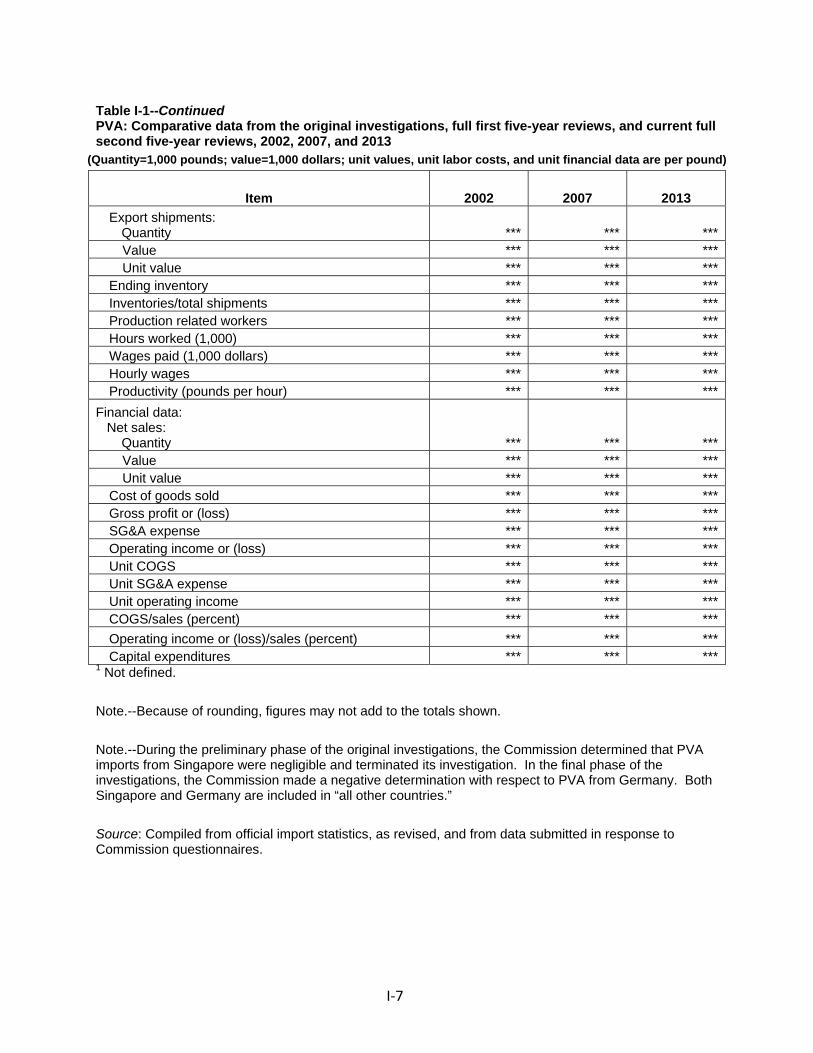
I‐7
Table I-1--Continued PVA: Comparative data from the original investigations, full first five-year reviews, and current full second five-year reviews, 2002, 2007, and 2013
(Quantity=1,000 pounds; value=1,000 dollars; unit values, unit labor costs, and unit financial data are per pound)
Item 2002 2007 2013
Export shipments: Quantity *** *** ***
Value *** *** ***Unit value *** *** ***
Ending inventory *** *** ***Inventories/total shipments *** *** ***Production related workers *** *** ***Hours worked (1,000) *** *** ***Wages paid (1,000 dollars) *** *** ***Hourly wages *** *** ***Productivity (pounds per hour) *** *** ***
Financial data: Net sales: Quantity *** *** ***
Value *** *** ***Unit value *** *** ***
Cost of goods sold *** *** ***Gross profit or (loss) *** *** ***SG&A expense *** *** ***Operating income or (loss) *** *** ***Unit COGS *** *** ***Unit SG&A expense *** *** ***Unit operating income *** *** ***COGS/sales (percent) *** *** ***
Operating income or (loss)/sales (percent) *** *** ***Capital expenditures *** *** ***
1 Not defined.
Note.--Because of rounding, figures may not add to the totals shown.
Note.--During the preliminary phase of the original investigations, the Commission determined that PVA imports from Singapore were negligible and terminated its investigation. In the final phase of the investigations, the Commission made a negative determination with respect to PVA from Germany. Both Singapore and Germany are included in “all other countries.”
Source: Compiled from official import statistics, as revised, and from data submitted in response to Commission questionnaires.
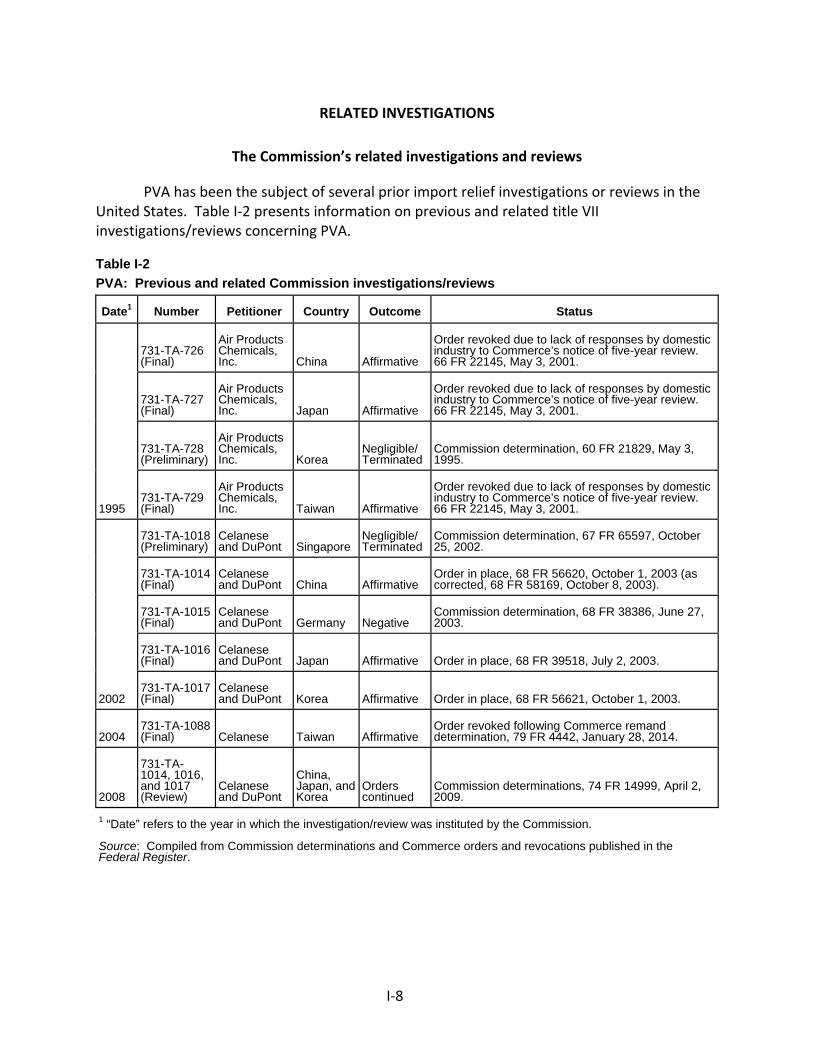
I‐8
RELATED INVESTIGATIONS
The Commission’s related investigations and reviews
PVA has been the subject of several prior import relief investigations or reviews in the United States. Table I‐2 presents information on previous and related title VII investigations/reviews concerning PVA.
Table I-2
PVA: Previous and related Commission investigations/reviews
Date1
Number
Petitioner
Country Outcome
Status
1995
731-TA-726 (Final)
Air Products Chemicals, Inc.
China
Affirmative
Order revoked due to lack of responses by domestic industry to Commerce’s notice of five-year review. 66 FR 22145, May 3, 2001.
731-TA-727 (Final)
Air Products Chemicals, Inc.
Japan
Affirmative
Order revoked due to lack of responses by domestic industry to Commerce’s notice of five-year review. 66 FR 22145, May 3, 2001.
731-TA-728 (Preliminary)
Air Products Chemicals, Inc.
Korea
Negligible/ Terminated
Commission determination, 60 FR 21829, May 3, 1995.
731-TA-729 (Final)
Air Products Chemicals, Inc.
Taiwan
Affirmative
Order revoked due to lack of responses by domestic industry to Commerce’s notice of five-year review. 66 FR 22145, May 3, 2001.
2002
731-TA-1018 (Preliminary)
Celanese and DuPont
Singapore
Negligible/ Terminated
Commission determination, 67 FR 65597, October 25, 2002.
731-TA-1014 (Final)
Celanese and DuPont
China
Affirmative
Order in place, 68 FR 56620, October 1, 2003 (as corrected, 68 FR 58169, October 8, 2003).
731-TA-1015 (Final)
Celanese and DuPont
Germany
Negative
Commission determination, 68 FR 38386, June 27, 2003.
731-TA-1016 (Final)
Celanese and DuPont
Japan
Affirmative
Order in place, 68 FR 39518, July 2, 2003.
731-TA-1017 (Final)
Celanese and DuPont
Korea
Affirmative
Order in place, 68 FR 56621, October 1, 2003.
2004
731-TA-1088 (Final)
Celanese
Taiwan Affirmative
Order revoked following Commerce remand determination, 79 FR 4442, January 28, 2014.
2008
731-TA-1014, 1016, and 1017 (Review)
Celanese and DuPont
China, Japan, and Korea
Orders continued
Commission determinations, 74 FR 14999, April 2, 2009.
1 “Date” refers to the year in which the investigation/review was instituted by the Commission. Source: Compiled from Commission determinations and Commerce orders and revocations published in the Federal Register.

I‐9
Litigation in related investigations
The Commission has conducted two other PVA investigations, but no U.S. orders currently are in effect regarding PVA from other sources. In April 2001, Commerce revoked prior antidumping duty orders regarding PVA from China, Japan, and Taiwan due to a lack of domestic interested party participation in the first reviews of those orders.26
Commerce and the Commission also conducted investigations of PVA imports from Taiwan in response to a September 7, 2004 antidumping duty petition filed by domestic producer Celanese. The Commission initially made a negative preliminary determination,27 but after the case was remanded by the CIT,28 the Commission issued an affirmative preliminary determination on remand.29 Commerce and the Commission resumed their investigations of PVA from Taiwan after the Federal Circuit affirmed the Commission’s affirmative preliminary determination on remand.30 Commerce initially made an affirmative antidumping duty
26 Commerce had originally imposed those orders in May 1996. Notice of Antidumping Orders: Polyvinyl Alcohol From Japan, the People’s Republic of China, and Taiwan, 61 FR 24286, May 14, 1996; see also Polyvinyl Alcohol from China, Japan, and Taiwan, Inv. Nos. 731‐TA‐726, 727, and 729 (Final), USITC Publication 2960, May 1996. A companion investigation of PVA from Korea had been terminated after the Commission found imports from Korea to be negligible. Polyvinyl Alcohol from China, Japan, Korea, and Taiwan, Inv. Nos. 731‐TA‐726‐729 (Preliminary), USITC Publication 2883, April 1995.
27 The Commission determined on October 21, 2004, that there was no reasonable indication that an industry in the United States was materially injured or threatened with material injury by reason of subject imports from Taiwan. Polyvinyl Alcohol from Taiwan, Inv. No. 731‐TA‐1088 (Preliminary), USITC Publication 3732, October 2004 (reflecting the views of Commissioners Okun, Lane, and Pearson) (Commissioners Koplan and Miller dissenting and Commissioner Hillman not participating).
28 On November 24, 2004, Celanese appealed the negative preliminary determination to the CIT. On January 29, 2007, the Court issued a decision affirming the Commission’s determination in part and remanding it in part. Celanese Chems. Ltd. v. United States, 31 CIT 279 (2007).
29 In a remand determination issued on April 30, 2007, Commissioners Aranoff, Williamson, and Pinkert who had not participated in the original investigations reviewed the record de novo and formed a new Commission majority that found a reasonable indication that an industry in the United States was materially injured by reason of subject imports from Taiwan. Commissioners Okun, Lane, and Pearson, who had participated in the original investigations, issued dissenting remand views in which they again reached a negative preliminary determination. Polyvinyl Alcohol from Taiwan, Inv. No. 731‐TA‐1088 (Preliminary) (Remand), USITC Publication 3920, April 2007.
30 On November 19, 2008, the CIT affirmed the affirmative preliminary injury determination on remand. Celanese Chems. Ltd. v. United States, 32 CIT 1250 (2008). On January 16, 2009, domestic producer DuPont and Taiwan producer Chang Chun appealed the CIT’s judgment to the Federal Circuit. On December 23, 2009, the Federal Circuit affirmed, without opinion, the CIT’s November 19, 2008 decision. Celanese Chems. Ltd. v. United States, 358 Fed. Appx. 174 (Fed. Cir. 2009). Once the judicial proceedings had ended, on March 30, 2010, the Commission published notice of its preliminary determination on remand. Polyvinyl Alcohol From Taiwan; Determination, 75 FR 15726, March 30, 2010.
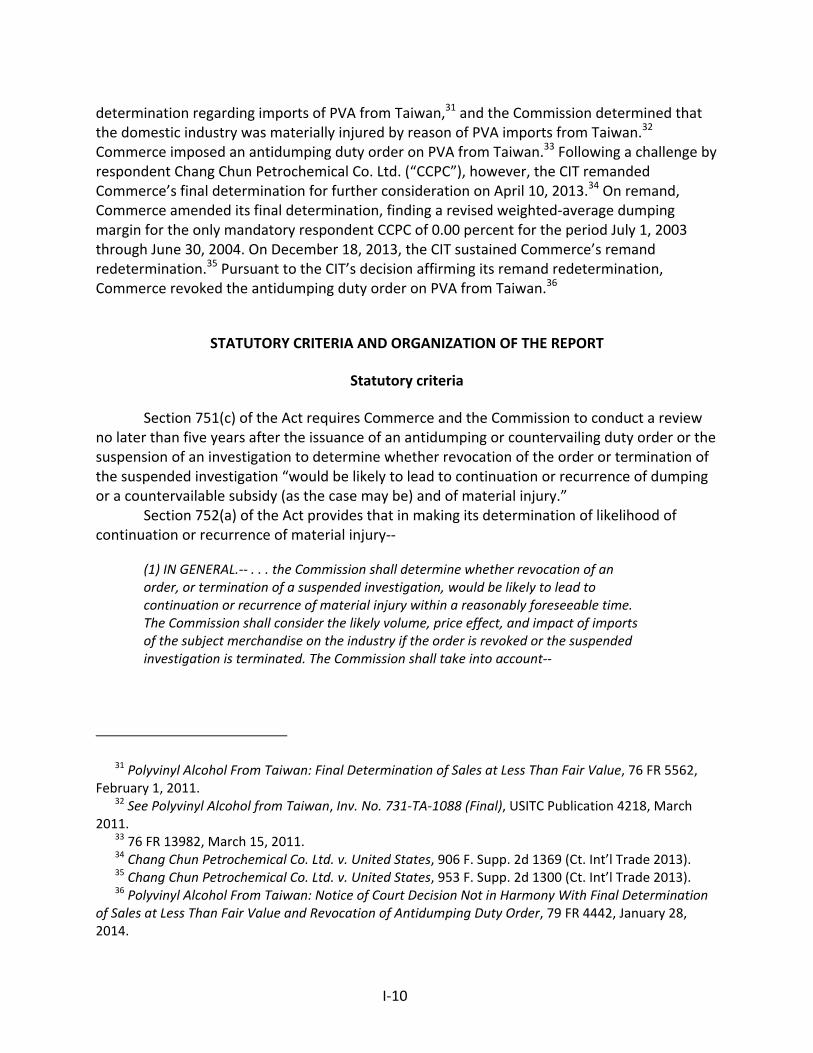
I‐10
determination regarding imports of PVA from Taiwan,31 and the Commission determined that the domestic industry was materially injured by reason of PVA imports from Taiwan.32 Commerce imposed an antidumping duty order on PVA from Taiwan.33 Following a challenge by respondent Chang Chun Petrochemical Co. Ltd. (“CCPC”), however, the CIT remanded Commerce’s final determination for further consideration on April 10, 2013.34 On remand, Commerce amended its final determination, finding a revised weighted‐average dumping margin for the only mandatory respondent CCPC of 0.00 percent for the period July 1, 2003 through June 30, 2004. On December 18, 2013, the CIT sustained Commerce’s remand redetermination.35 Pursuant to the CIT’s decision affirming its remand redetermination, Commerce revoked the antidumping duty order on PVA from Taiwan.36
STATUTORY CRITERIA AND ORGANIZATION OF THE REPORT
Statutory criteria
Section 751(c) of the Act requires Commerce and the Commission to conduct a review no later than five years after the issuance of an antidumping or countervailing duty order or the suspension of an investigation to determine whether revocation of the order or termination of the suspended investigation “would be likely to lead to continuation or recurrence of dumping or a countervailable subsidy (as the case may be) and of material injury.”
Section 752(a) of the Act provides that in making its determination of likelihood of continuation or recurrence of material injury‐‐
(1) IN GENERAL.‐‐ . . . the Commission shall determine whether revocation of an order, or termination of a suspended investigation, would be likely to lead to continuation or recurrence of material injury within a reasonably foreseeable time. The Commission shall consider the likely volume, price effect, and impact of imports of the subject merchandise on the industry if the order is revoked or the suspended investigation is terminated. The Commission shall take into account‐‐
31 Polyvinyl Alcohol From Taiwan: Final Determination of Sales at Less Than Fair Value, 76 FR 5562, February 1, 2011.
32 See Polyvinyl Alcohol from Taiwan, Inv. No. 731‐TA‐1088 (Final), USITC Publication 4218, March 2011.
33 76 FR 13982, March 15, 2011. 34 Chang Chun Petrochemical Co. Ltd. v. United States, 906 F. Supp. 2d 1369 (Ct. Int’l Trade 2013). 35 Chang Chun Petrochemical Co. Ltd. v. United States, 953 F. Supp. 2d 1300 (Ct. Int’l Trade 2013). 36 Polyvinyl Alcohol From Taiwan: Notice of Court Decision Not in Harmony With Final Determination
of Sales at Less Than Fair Value and Revocation of Antidumping Duty Order, 79 FR 4442, January 28, 2014.
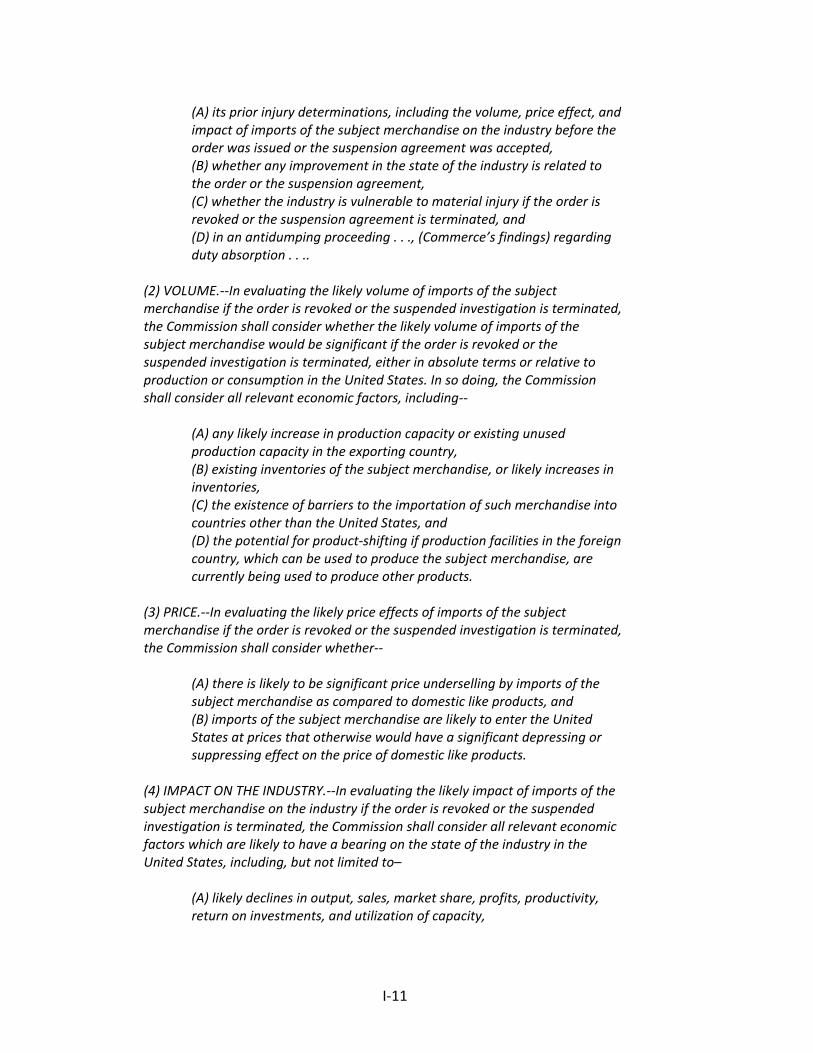
I‐11
(A) its prior injury determinations, including the volume, price effect, and impact of imports of the subject merchandise on the industry before the order was issued or the suspension agreement was accepted, (B) whether any improvement in the state of the industry is related to the order or the suspension agreement, (C) whether the industry is vulnerable to material injury if the order is revoked or the suspension agreement is terminated, and (D) in an antidumping proceeding . . ., (Commerce’s findings) regarding duty absorption . . ..
(2) VOLUME.‐‐In evaluating the likely volume of imports of the subject merchandise if the order is revoked or the suspended investigation is terminated, the Commission shall consider whether the likely volume of imports of the subject merchandise would be significant if the order is revoked or the suspended investigation is terminated, either in absolute terms or relative to production or consumption in the United States. In so doing, the Commission shall consider all relevant economic factors, including‐‐
(A) any likely increase in production capacity or existing unused production capacity in the exporting country, (B) existing inventories of the subject merchandise, or likely increases in inventories, (C) the existence of barriers to the importation of such merchandise into countries other than the United States, and (D) the potential for product‐shifting if production facilities in the foreign country, which can be used to produce the subject merchandise, are currently being used to produce other products.
(3) PRICE.‐‐In evaluating the likely price effects of imports of the subject merchandise if the order is revoked or the suspended investigation is terminated, the Commission shall consider whether‐‐
(A) there is likely to be significant price underselling by imports of the subject merchandise as compared to domestic like products, and (B) imports of the subject merchandise are likely to enter the United States at prices that otherwise would have a significant depressing or suppressing effect on the price of domestic like products.
(4) IMPACT ON THE INDUSTRY.‐‐In evaluating the likely impact of imports of the subject merchandise on the industry if the order is revoked or the suspended investigation is terminated, the Commission shall consider all relevant economic factors which are likely to have a bearing on the state of the industry in the United States, including, but not limited to–
(A) likely declines in output, sales, market share, profits, productivity, return on investments, and utilization of capacity,
I‐12
(B) likely negative effects on cash flow, inventories, employment, wages, growth, ability to raise capital, and investment, and (C) likely negative effects on the existing development and production efforts of the industry, including efforts to develop a derivative or more advanced version of the domestic like product.
The Commission shall evaluate all such relevant economic factors . . . within the context of the business cycle and the conditions of competition that are distinctive to the affected industry.
Section 752(a)(6) of the Act states further that in making its determination, “the Commission may consider the magnitude of the margin of dumping or the magnitude of the net countervailable subsidy.”
Organization of report
Information obtained during the course of these second five‐year reviews that relates to the statutory criteria is presented throughout this report. A summary of trade and financial data for PVA as collected in these reviews is presented in appendix C. Also presented in appendix C are reproductions of summary data for PVA compiled from the original investigations and first five‐year reviews.
U.S. industry data are based on the questionnaire responses provided by three U.S. producers of PVA that are believed to have accounted for all domestic production of PVA during January 2008‐September 2014. U.S. import data and related information are based on Commerce’s official import statistics, as revised, and the questionnaire responses of 23 U.S. importers of PVA, 5 of which are believed to have accounted for 99 percent of the total U.S. imports of PVA from China,37 14 of which are believed to have accounted for 89 percent of the total U.S. imports of PVA from Japan,38 and 12 of which are believed to have accounted for 95 percent of the total U.S. imports of PVA from all nonsubject countries (primarily Taiwan)39 during January 2008‐September 2014.40 There are believed to have been no U.S. imports of Korean‐produced PVA subject to the antidumping duty order during January 2008‐September 2014. Japanese industry data and related information are based on the questionnaire
37 All five U.S. importers of PVA from China reported imports of the subject PVA. These firms reported no U.S. imports of the PVA products that are excluded from the scope of these reviews (“excluded forms of PVA”).
38 Six of the 14 U.S. importers of PVA from Japan reported imports of the subject PVA. Ten of the 14 U.S. importers reported U.S. imports of excluded forms of PVA from Japan.
39 Nine of the 12 U.S. importers of PVA from nonsubject countries reported imports of PVA meeting the scope description of the subject merchandise. Five of the 12 U.S. importers of PVA from nonsubject countries reported U.S. imports of excluded forms of PVA.
40 The U.S. importer coverage estimates are based on individual company information contained in proprietary Customs documents for HTS subheading 3905.30.00.
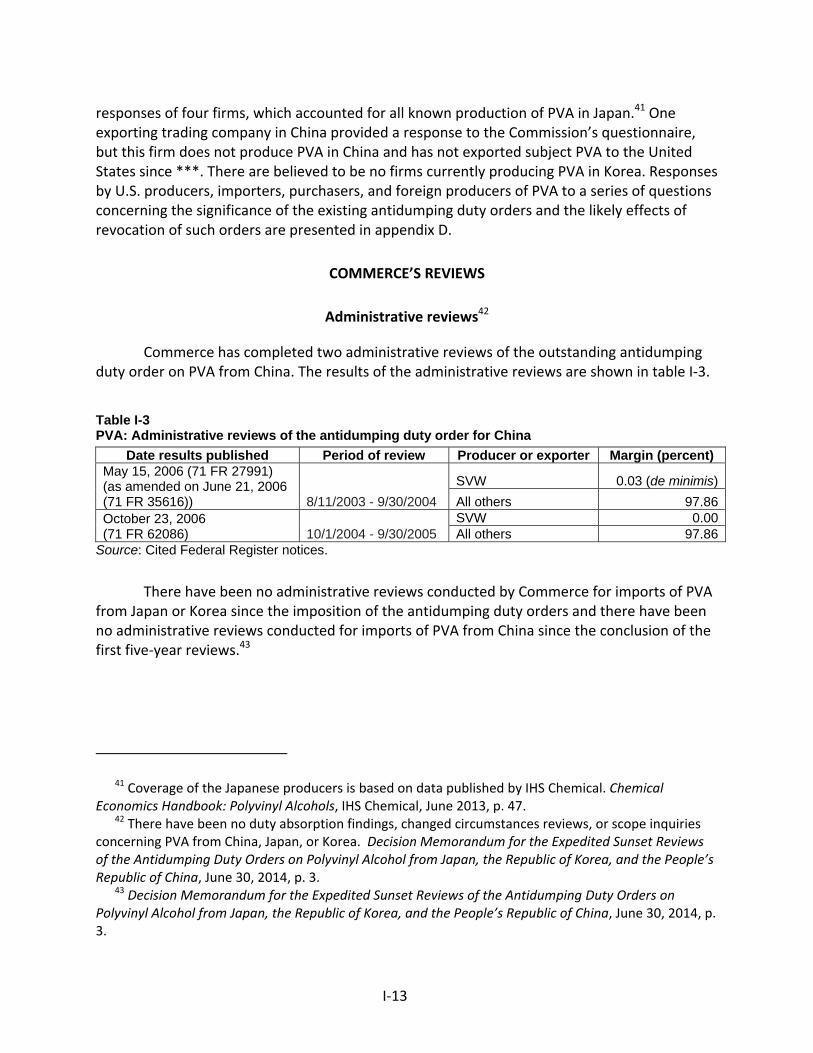
I‐13
responses of four firms, which accounted for all known production of PVA in Japan.41 One exporting trading company in China provided a response to the Commission’s questionnaire, but this firm does not produce PVA in China and has not exported subject PVA to the United States since ***. There are believed to be no firms currently producing PVA in Korea. Responses by U.S. producers, importers, purchasers, and foreign producers of PVA to a series of questions concerning the significance of the existing antidumping duty orders and the likely effects of revocation of such orders are presented in appendix D.
COMMERCE’S REVIEWS
Administrative reviews42
Commerce has completed two administrative reviews of the outstanding antidumping duty order on PVA from China. The results of the administrative reviews are shown in table I‐3.
Table I-3 PVA: Administrative reviews of the antidumping duty order for China
Date results published Period of review Producer or exporter Margin (percent) May 15, 2006 (71 FR 27991) (as amended on June 21, 2006 (71 FR 35616)) 8/11/2003 - 9/30/2004
SVW 0.03 (de minimis)
All others 97.86October 23, 2006 (71 FR 62086) 10/1/2004 - 9/30/2005
SVW 0.00All others 97.86
Source: Cited Federal Register notices.
There have been no administrative reviews conducted by Commerce for imports of PVA from Japan or Korea since the imposition of the antidumping duty orders and there have been no administrative reviews conducted for imports of PVA from China since the conclusion of the first five‐year reviews.43
41 Coverage of the Japanese producers is based on data published by IHS Chemical. Chemical Economics Handbook: Polyvinyl Alcohols, IHS Chemical, June 2013, p. 47.
42 There have been no duty absorption findings, changed circumstances reviews, or scope inquiries concerning PVA from China, Japan, or Korea. Decision Memorandum for the Expedited Sunset Reviews of the Antidumping Duty Orders on Polyvinyl Alcohol from Japan, the Republic of Korea, and the People’s Republic of China, June 30, 2014, p. 3.
43 Decision Memorandum for the Expedited Sunset Reviews of the Antidumping Duty Orders on Polyvinyl Alcohol from Japan, the Republic of Korea, and the People’s Republic of China, June 30, 2014, p. 3.

I‐14
Five‐year reviews
Commerce has issued the final results of its expedited second five‐year reviews with respect to all subject countries.44 Table I‐4 presents the dumping margins calculated by Commerce in its original investigations and subsequent five‐year reviews.
Table I-4 PVA: Commerce’s original and subsequent five-year dumping margins for producers/exporters in China, Japan, and Korea
Producer/exporter
Original margin
(percent)
First five-year review margin
(percent)
Second five-year review
margin (percent)
China
Sinopec Sichuan Vinylon Works 5.51 5.51 3.45
All others 97.86 97.86 97.86
Japan
Denki Kagaku Kogyo Kabushiki Kaisha 144.16 144.16 144.16
Japan VAM & POVAL Co., Ltd. 144.16 144.16 144.16
Kuraray Co., Ltd. 144.16 144.16 144.16
The Nippon Synthetic Chemical Industry Co., Ltd. 144.16 144.16 144.16
All others 76.78 76.78 76.78
Korea
DC Chemical Co., Ltd. 38.74 38.74 38.74
All others 32.08 32.08 32.08
Source: Antidumping Duty Order: Polyvinyl Alcohol From Japan, 68 FR 39518, July 2, 2003; Antidumping Duty Order: Polyvinyl Alcohol from the People’s Republic of China, 68 FR 56620, October 1, 2003; Antidumping Duty Order: Polyvinyl Alcohol from the Republic of Korea, 68 FR 56621, October 1, 2003; Antidumping Duty Order: Polyvinyl Alcohol from the People’s Republic of China: Correction, 68 FR 58169, October 8, 2003; Polyvinyl Alcohol from the People's Republic of China: Notice of Court Decision Not In Harmony with Final Determination, 72 FR 36960, July 6, 2007; Polyvinyl Alcohol From Japan, the Republic of Korea, and the People’s Republic of China: Final Results of the Expedited Sunset Reviews of the Antidumping Duty Orders, 73 FR 57596, October 3, 2008; and Polyvinyl Alcohol From Japan, the Republic of Korea, and the People’s Republic of China: Final Results of the Expedited Sunset Reviews of the Antidumping Duty Orders, 79 FR 38278, July 7, 2014.
44 Polyvinyl Alcohol From Japan, the Republic of Korea, and the People’s Republic of China: Final Results of the Expedited Sunset Reviews of the Antidumping Duty Orders, 79 FR 38278, July 7, 2014.

I‐15
THE SUBJECT MERCHANDISE
Commerce’s scope
The imported product subject to the antidumping duty orders under review, as defined by Commerce in its final results of expedited second five‐year reviews, is as follows:
The merchandise covered by these orders is PVA. This product consists of all PVA hydrolyzed in excess of 80 percent, whether or not mixed or diluted with commercial levels of defoamer or boric acid, except as noted below. The following products are specifically excluded from the scope of these orders: (1) PVA in fiber form. (2) PVA with hydrolysis less than 83 mole percent and certified not for use in the production of textiles. (3) PVA with hydrolysis greater than 85 percent and viscosity greater than or equal to 90 cps. (4) PVA with a hydrolysis greater than 85 percent, viscosity greater than or equal to 80 cps but less than 90 cps, certified for use in an ink jet application. (5) PVA for use in the manufacture of an excipient or as an excipient in the manufacture of film coating systems which are components of a drug or dietary supplement, and accompanied by an end‐use certification. (6) PVA covalently bonded with cationic monomer uniformly present on all polymer chains in a concentration equal to or greater than one mole percent. (7) PVA covalently bonded with carboxylic acid uniformly present on all polymer chains in a concentration equal to or greater than two mole percent, certified for use in a paper application. (8) PVA covalently bonded with thiol uniformly present on all polymer chains, certified for use in emulsion polymerization of non‐vinyl acetic material. (9) PVA covalently bonded with paraffin uniformly present on all polymer chains in a concentration equal to or greater than one mole percent. (10) PVA covalently bonded with silan uniformly present on all polymer chains certified for use in paper coating applications. (11) PVA covalently bonded with sulfonic acid uniformly present on all polymer chains in a concentration level equal to or greater than one mole percent. (12) PVA covalently bonded with acetoacetylate uniformly present on all polymer chains in a concentration level equal to or greater than one mole percent. (13) PVA covalently bonded with polyethylene oxide uniformly present on all polymer chains in a concentration level equal to or greater than one mole percent. (14) PVA covalently bonded with quaternary amine uniformly present on all polymer chains in a concentration level equal to or greater than one mole percent. (15) PVA covalently bonded with diacetoneacrylamide uniformly present on all polymer chains in a concentration level greater than three mole percent, certified for use in a paper application.

I‐16
The merchandise subject to these orders is currently classifiable under subheading 3905.30.00 of the Harmonized Tariff Schedule of the United States (HTSUS). Although the HTSUS subheading is provided for convenience and customs purposes, the written description of the scope of these orders is dispositive.45
Tariff treatment
Polyvinyl alcohol is classifiable in the Harmonized Tariff Schedule of the United States (“HTSUS”) under subheading 3905.30.00 and enters the United States at a column‐1 general duty tariff rate of 3.2 percent ad valorem for imports from countries with normal trade relations, including China, Japan, and Korea. The tariff rate was not reduced as a result of the Uruguay Round of multilateral tariff negotiations and remains unchanged since the original investigations.
THE DOMESTIC LIKE PRODUCT
Description and applications46
PVA is a water‐soluble synthetic polymer, usually sold as a white granular solid or in powdered form. PVA can be categorized on the basis of the degree of hydrolysis, the viscosity of an aqueous solution, and the average molecular weight of the finished product. PVA is highly stable in dry form. It is nontoxic and therefore considered safe to handle and relatively environmentally friendly. Care must be taken, however, to minimize airborne dust concentrations during shipping and storage to reduce the potential for dust explosions.
The degree of hydrolysis is determined by the percentage of acetate groups in the polyvinyl acetate feedstock that are replaced by hydroxyl groups in the finished PVA. Fully hydrolyzed PVA has a replacement percentage in excess of 98 percent. The viscosity (resistance to shear stress or flow) of an aqueous solution of PVA increases as the molecular weight of the PVA increases. The molecular weight is determined by the average length of the polymer chain in the finished product in terms of monomer units. Low‐viscosity grades tend to have PVA chain lengths as low as 300 monomer units, with average molecular weights around 45,000 to 55,000 unified atomic mass units (“u”), whereas high‐viscosity, fully hydrolyzed grades have PVA chain lengths up to 3,500 monomer units and average molecular weights around 200,000 to 225,000 u. The degree of hydrolysis of PVA affects a variety of PVA properties, such as solution interfacial tensions, compatibility, reaction kinetics, rheology, and water solubility.
45 Polyvinyl Alcohol From Japan, the Republic of Korea, and the People’s Republic of China: Final Results of the Expedited Sunset Reviews of the Antidumping Duty Orders, 79 FR 38278, July 7, 2014.
46 In general, the information contained in this section was drawn from the publication for the original investigations, Polyvinyl Alcohol from Germany and Japan, Invs. Nos. 731‐TA‐1015 and 1016 (Final), USITC Publication 3604, June 2003.
I‐17
In the United States, PVA is used primarily as an intermediate in the production of polyvinyl butyral (PVB), which is an adhesive used between panes of automotive safety glass or load‐resistant architectural glass. PVA is also used in the textile and paper industries in sizing formulations; as a binder in adhesive and soil binding formulations; and as an emulsion or polymerization aid in colloidal suspensions, water‐soluble films, cosmetics, and joint compounds. A recently developed new use reported for PVA in the United States (though not new outside the United States) is in non‐woven‐glass paper.47 The domestic interested parties also noted the following examples of promising advances in products that would use PVA: ***.48
For most applications, PVA is dissolved in an aqueous solution. PVA’s solubility behavior in water depends on several factors, including degree of polymerization, degree of hydrolysis, drying temperature, particle size, and molecular weight. PVA polymers possess variable solubility properties, ranging from soluble in cold (room temperature) water to soluble only in hot water. For example, PVA of 88 percent hydrolysis is soluble in both cold and hot water, whereas 98 percent hydrolyzed PVA may be soluble only in hot water. All other characteristics being equal, the higher the degree of hydrolysis, the lower the solubility. By altering certain product characteristics, however, solubility can be changed. All standard grades of PVA, regardless of degree of hydrolysis, must be “cooked” to achieve complete solubility. At the end of the saponification process49 PVA is a hard solid suitable for grinding into granular or powdered form.
PVA is sold in a variety of standard and specialty grades, each varying according to its molecular weight and the degree of hydrolysis. According to the petitioners in the original investigations, the degree of hydrolysis is commonly denoted as super (more than 99 percent hydrolyzed), fully (98‐99 percent hydrolyzed), intermediate (90‐98 percent hydrolyzed), and partial (85‐89 percent hydrolyzed).50 The specific performance of various grades of PVA varies with the degree of hydrolysis and viscosity. For example, the greater the degree of hydrolysis, the better the water resistance. For this reason, in adhesive applications that require water resistance, a fully hydrolyzed grade of PVA is used. On the other hand, in adhesive applications that do not require water resistance, a partially hydrolyzed PVA may be used. Similarly, paper manufacturers select a specific grade of PVA depending on the property required for the paper. Grease and water resistance, ink receptivity, and other components of the size solution determine grade selection. In the textile market, where PVA is used as a warp sizing for yarns to prevent breakage during weaving, various grades of PVA are selected for use
47 Owens Corning has begun construction of a plant that will produce the newly developed non‐woven‐glass paper. DKK’s responses to Commission questions, p. 3.
48 Domestic interested parties’ responses to Commission questions, p. 6. 49 Saponification is the chemical reaction in which an ester is heated with aqueous alkali to form an
alcohol and the sodium salt of the acid corresponding to the ester. 50 The definitions of fully, intermediate, and partially hydrolyzed PVA in terms of degrees of hydrolysis
vary somewhat within the industry.

I‐18
depending on the yarn, machine type, other components of the sizing solution (e.g., starch), required viscosity, abrasion resistance, and ease of solution removal after fabric weaving.
Although all grades of PVA are not completely interchangeable with other grades, more than one grade may be sold to specific end‐use markets. For example, fully hydrolyzed PVA can be used in many of the same end uses in which intermediate or partially hydrolyzed PVA can be used, such as textiles, paper, and adhesives. The same grade of PVA is frequently sold for different commercial uses, and many end users are able to use a wide range of grades. However, many applications have evolved using particular grades such that substitution, although possible, could involve some cost and time to reformulate, and end users tend to avoid changing the grade of PVA they use in their applications because their formulas and process parameters might have to be adjusted. Because it is a synthetic water soluble polymer with unique characteristics, PVA has few substitutes for most end‐use applications.
Manufacturing processes
PVA is generally manufactured by first polymerizing the vinyl acetate monomer (“VAM”) into polyvinyl acetate and then hydrolyzing the acetate groups with methanol in the presence of anhydrous sodium methylate or aqueous sodium hydroxide at moderate temperatures and pressures. This is a continuous process in which the end‐product PVA is hydrolyzed in excess of 80 percent. All of the U.S. and foreign producers are believed to use some form of a continuous manufacturing process to make PVA.
Acetic acid, a by‐product, could either be recycled to produce VAM or sold in the acetic acid market. Given the high‐volume need for acetic acid in the production of VAM, in general, producers return the by‐product to their own production process rather than sell it on the market.
DOMESTIC LIKE PRODUCT ISSUES
In its original determinations and its full first five‐year review determinations, the Commission defined the domestic like product as all domestically produced PVA meeting the specifications stated in Commerce’s scope definition, and it defined the domestic industry as all domestic producers of PVA, whether captively consumed or produced for the commercial market.51
In its notice of institution in these current five‐year reviews, the Commission solicited comments from interested parties regarding the appropriate domestic like product.52
51 Polyvinyl Alcohol from Germany and Japan, Invs. Nos. 731‐TA‐1015 and 1016 (Final), USITC Publication 3604, June 2003, p. 6; and Polyvinyl Alcohol from China, Japan, and Korea, Inv. Nos. 731‐TA‐1014, 1016, and 1017 (Review), USITC Publication 4067, March 2009, pp. 8‐9.
52 Polyvinyl Alcohol From China, Japan, and Korea; Institution of Five‐Year Reviews Concerning the Antidumping Duty Orders on Polyvinyl Alcohol From China, Japan, and Korea, 79 FR 11821, March 3, 2014.
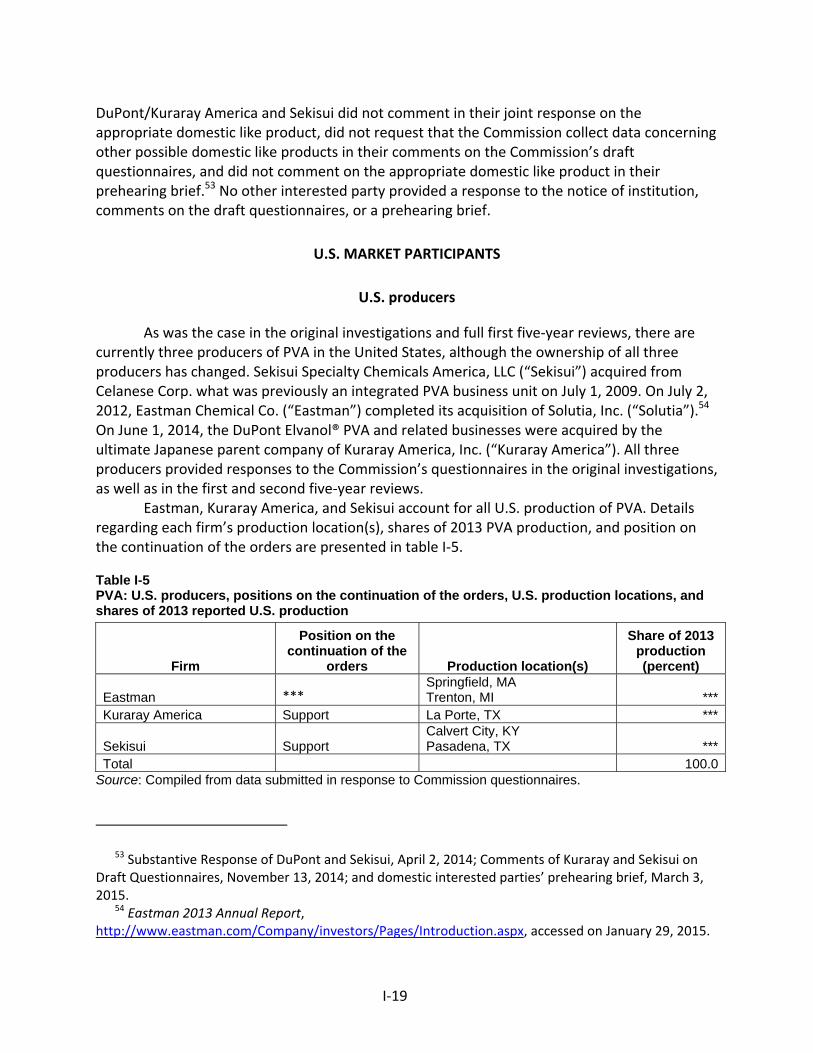
I‐19
DuPont/Kuraray America and Sekisui did not comment in their joint response on the appropriate domestic like product, did not request that the Commission collect data concerning other possible domestic like products in their comments on the Commission’s draft questionnaires, and did not comment on the appropriate domestic like product in their prehearing brief.53 No other interested party provided a response to the notice of institution, comments on the draft questionnaires, or a prehearing brief.
U.S. MARKET PARTICIPANTS
U.S. producers
As was the case in the original investigations and full first five‐year reviews, there are currently three producers of PVA in the United States, although the ownership of all three producers has changed. Sekisui Specialty Chemicals America, LLC (“Sekisui”) acquired from Celanese Corp. what was previously an integrated PVA business unit on July 1, 2009. On July 2, 2012, Eastman Chemical Co. (“Eastman”) completed its acquisition of Solutia, Inc. (“Solutia”).54 On June 1, 2014, the DuPont Elvanol® PVA and related businesses were acquired by the ultimate Japanese parent company of Kuraray America, Inc. (“Kuraray America”). All three producers provided responses to the Commission’s questionnaires in the original investigations, as well as in the first and second five‐year reviews.
Eastman, Kuraray America, and Sekisui account for all U.S. production of PVA. Details regarding each firm’s production location(s), shares of 2013 PVA production, and position on the continuation of the orders are presented in table I‐5.
Table I-5 PVA: U.S. producers, positions on the continuation of the orders, U.S. production locations, and shares of 2013 reported U.S. production
Firm
Position on the continuation of the
orders Production location(s)
Share of 2013 production (percent)
Eastman *** Springfield, MA Trenton, MI ***
Kuraray America Support La Porte, TX ***
Sekisui Support Calvert City, KY Pasadena, TX ***
Total 100.0Source: Compiled from data submitted in response to Commission questionnaires.
53 Substantive Response of DuPont and Sekisui, April 2, 2014; Comments of Kuraray and Sekisui on Draft Questionnaires, November 13, 2014; and domestic interested parties’ prehearing brief, March 3, 2015.
54 Eastman 2013 Annual Report, http://www.eastman.com/Company/investors/Pages/Introduction.aspx, accessed on January 29, 2015.
I‐20
Two U.S. PVA producers, Kuraray America and Sekisui, are indirectly related to Japanese producers of PVA. In addition, as discussed in greater detail below and in Part III, Kuraray America has directly imported PVA from ***. Kuraray America is also indirectly related to a U.S. importer that has directly imported PVA from ***. Sekisui has purchased PVA from U.S. importers and is engaged in a joint venture with respect to a production facility in Japan with a firm in Japan whose affiliate is a U.S. importer of PVA.55
Kuraray America, whose Japanese parent corporation acquired the domestic DuPont PVA businesses on June 1, 2014, provided a complete response to the U.S. producer questionnaire that included information for the previously acquired DuPont domestic PVA operations. Kuraray America reported in its combined questionnaire response that since January 2008 it has produced excluded and subject forms of PVA in the United States. It also reported that it has not purchased PVA domestically, but it has directly imported excluded and subject forms of PVA from *** and subject forms of PVA from ***. Kuraray America is 100‐percent owned by Kuraray Holdings U.S.A., Inc., which is 100‐percent owned by Japanese corporation Kuraray Co., Ltd. (“Kuraray Japan”). Kuraray Japan is a producer in Japan of subject and excluded forms of PVA, as well as other products (i.e., ethylene vinyl alcohol copolymer). Kuraray Japan also owns PVA production facilities in Germany (Kuraray Europe GmbH) and Singapore (Kuraray Asia Pacific Pte. Ltd.). Kuraray America is indirectly related to MonoSol, LLC (“MonoSol”), a U.S. importer of subject forms of PVA from Japan.56
Kuraray America was asked to discuss the level at which managerial control is exercised concerning Kuraray Japan’s corporate global production and shipments of PVA. In particular, it was asked to identify the level at which any final decision is made as to how much PVA is produced in the corporation’s U.S. facility and how much PVA is produced in Japan (or elsewhere) and exported to the United States. Kuraray America’s response is as follows: ***.
Sekisui, which acquired the assets of the Celanese PVA business on July 1, 2009, provided a complete response to the U.S. producer questionnaire that included information for the previously acquired Celanese domestic PVA operations. Sekisui reported in its combined questionnaire response that since January 2008 it has produced excluded and subject forms of PVA in the United States. It reported that it has directly imported excluded forms of PVA from ***, as well as subject and excluded forms of PVA from ***. It also reported that it has purchased subject forms of PVA imported by other firms from *** and ***. Sekisui’s parent company, Sekisui Chemical Co., jointly owns (*** percent‐share) DS Poval Co., Ltd., a manufacturer of PVA in Japan. The other joint venture owner, DKK, wholly owns U.S. PVA importer Denka Corp. and is the majority shareholder (*** percent) of Japanese PVA producer DS Poval Co., Ltd. Denka reported U.S. imports of excluded forms of PVA from ***. Sekisui’s Japanese parent company also owns Sekisui Specialty Chemicals Europe, S.L., a producer of PVA in Spain.
Sekisui was asked to discuss the level at which managerial control is exercised concerning its global production and shipments of PVA. In particular, it was asked to identify
55 Domestic interested parties’ responses to Commission questions, p. 12. 56 ***.

I‐21
the level at which any final decision is made as to how much PVA is produced in the U.S. facility and how much PVA is produced in Japan (or elsewhere) and exported to the United States. Sekisui’s response is as follows: ***.
Eastman, which completed its acquisition of Solutia on July 2, 2012, is a U.S. producer of the subject forms of PVA for internal consumption. Eastman also reported that it has purchased PVA produced by the other two domestic PVA producers. The U.S. producer is not a U.S. importer of PVA, nor is it related to any U.S. importers or subject foreign producers of PVA, although it wholly owns subsidiary Solutia Europe SPRL/BVBA, a producer of PVA in Belgium.
U.S. importers
U.S. import data presented in the staff reports of the original investigations and the full first five‐year reviews were based on official import statistics for all sources, except for Japan for which questionnaire data were utilized due to the relatively large amount of U.S. imports of excluded forms of PVA from Japan. Official Commerce statistics for other sources were adjusted to subtract excluded forms of PVA. Completed U.S. importer questionnaire responses were received from 16 companies in the original investigations and 13 firms in the first five‐year reviews.
In the current proceedings, the Commission issued U.S. importers’ questionnaires to 47 firms identified as possible U.S. importers of PVA, as well as to all U.S. producers of PVA. Usable questionnaire responses were received from 23 firms, 5 of which are believed to have accounted for *** percent of the total U.S. imports of PVA from China,57 14 of which are believed to have accounted for *** percent of the total U.S. imports of PVA from Japan,58 and 12 of which are believed to have accounted for 95 percent of the total U.S. imports of PVA from all nonsubject countries (primarily Taiwan)59 during January 2008‐September 2014. There are believed to have been no U.S. imports of Korean‐produced PVA subject to the antidumping duty order during January 2008‐September 2014.60 Table I‐6 lists all responding U.S. importers of PVA from China, Japan, Korea, and other sources, their locations, and their shares of U.S. imports in 2013.
57 These five firms reported U.S. imports of the subject forms of PVA from China. 58 Six of these 14 firms reported imports of the subject forms of PVA from Japan and ten reported
imports of excluded forms of PVA from Japan. 59 Nine of the 12 firms reported imports of the subject forms of PVA from nonsubject countries and 5
reported imports of the excluded forms of PVA. 60 Only one firm (***) was identified in proprietary Customs data as having imported “dutied”
material from Korea during January 2008‐September 2014. ***’s imports of *** in 2013 were incorrectly identified in proprietary Customs documents as imports from Korea. *** confirmed that these items were subject PVA produced in Japan. In addition, four firms were identified in proprietary Customs records as having imported minor amounts of “non‐dutied” merchandise from Korea: ***. The Korean supplier of *** imports in 2010 is an export trading company of a variety of materials and not a Korean producer of PVA. The only known Korean producer of PVA ceased PVA production in 2009.
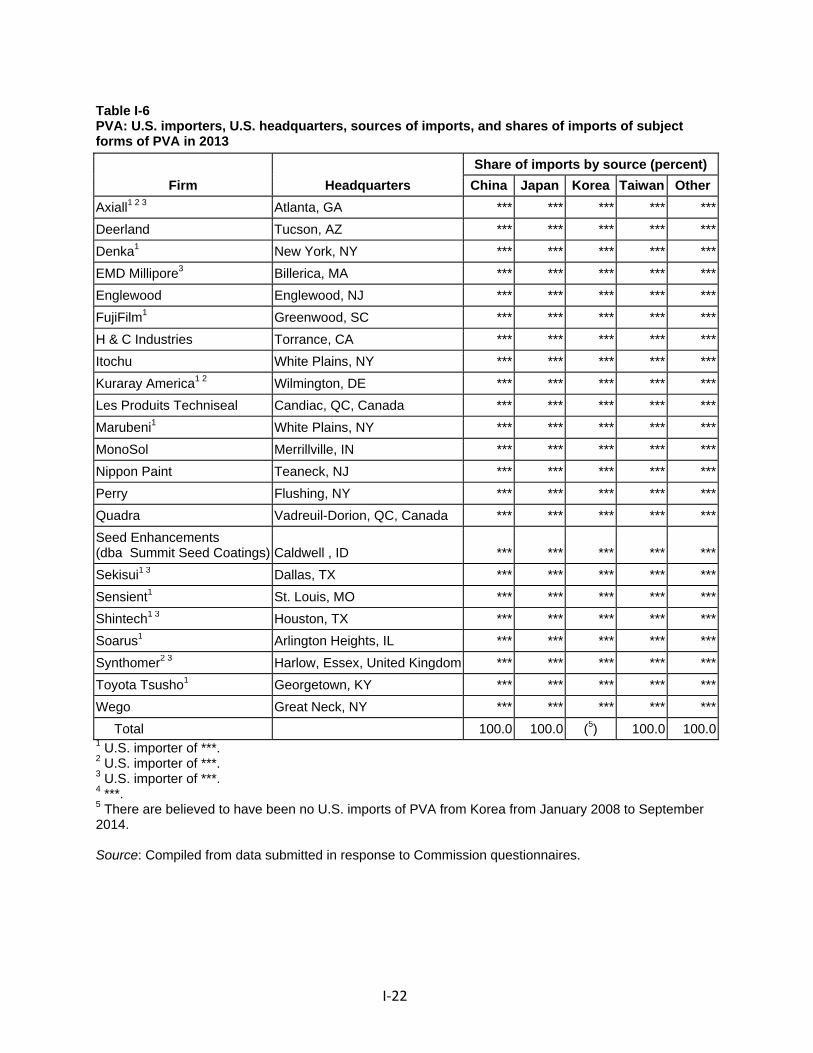
I‐22
Table I-6 PVA: U.S. importers, U.S. headquarters, sources of imports, and shares of imports of subject forms of PVA in 2013
Firm Headquarters
Share of imports by source (percent)
China Japan Korea Taiwan Other
Axiall1 2 3 Atlanta, GA *** *** *** *** ***
Deerland Tucson, AZ *** *** *** *** ***
Denka1 New York, NY *** *** *** *** ***
EMD Millipore3 Billerica, MA *** *** *** *** ***
Englewood Englewood, NJ *** *** *** *** ***
FujiFilm1 Greenwood, SC *** *** *** *** ***
H & C Industries Torrance, CA *** *** *** *** ***
Itochu White Plains, NY *** *** *** *** ***
Kuraray America1 2 Wilmington, DE *** *** *** *** ***
Les Produits Techniseal Candiac, QC, Canada *** *** *** *** ***
Marubeni1 White Plains, NY *** *** *** *** ***
MonoSol Merrillville, IN *** *** *** *** ***
Nippon Paint Teaneck, NJ *** *** *** *** ***
Perry Flushing, NY *** *** *** *** ***
Quadra Vadreuil-Dorion, QC, Canada *** *** *** *** ***
Seed Enhancements (dba Summit Seed Coatings) Caldwell , ID *** *** *** *** ***
Sekisui1 3 Dallas, TX *** *** *** *** ***
Sensient1 St. Louis, MO *** *** *** *** ***
Shintech1 3 Houston, TX *** *** *** *** ***
Soarus1 Arlington Heights, IL *** *** *** *** ***
Synthomer2 3 Harlow, Essex, United Kingdom *** *** *** *** ***
Toyota Tsusho1 Georgetown, KY *** *** *** *** ***
Wego Great Neck, NY *** *** *** *** ***
Total 100.0 100.0 (5) 100.0 100.01 U.S. importer of ***. 2 U.S. importer of ***. 3 U.S. importer of ***. 4 ***. 5 There are believed to have been no U.S. imports of PVA from Korea from January 2008 to September 2014. Source: Compiled from data submitted in response to Commission questionnaires.
I‐23
U.S. purchasers
The Commission received 20 purchaser questionnaire responses from firms that have purchased PVA since January 1, 2008. These purchasers reported purchasing more than 99 million pounds of PVA in 2013 and more than 83 million pounds of PVA during January‐September 2014.61 Reported purchases accounted for *** percent of 2013 U.S. PVA consumption and *** percent of U.S. PVA consumption during January‐September 2014.62 The two largest purchasers of PVA are ***.63 The purchasers included five adhesives producers,64 four distributors, three emulsion polymerization producers,65 three building products producers,66 two textile products producers,67 two paper producers,68 two purchasers use PVA for film applications/production, one ceramics manufacturer, and one manufacturer of PVB resin and film.
APPARENT U.S. CONSUMPTION AND MARKET SHARES
Apparent U.S. consumption
Data concerning total apparent U.S. consumption of PVA during 2008‐13, January‐September 2013, and January‐September 2014 are presented in table I‐7. Data concerning open‐market (commercial) apparent U.S. consumption are presented in appendix C, table C‐2.
Apparent U.S. consumption in terms of both quantity and value fell from 2008 to 2009, but generally increased thereafter to a level in 2013 that was *** percent higher in terms of quantity than in 2008. Total apparent U.S. consumption reported during January‐September 2014 was *** percent higher in terms of quantity than the level reported during January‐September 2013.
61 Fourteen purchasers reported purchasing PVA produced in the United States, three reported purchasing PVA produced in China, two reported purchasing PVA produced in Japan, eight reported purchasing PVA produced in Taiwan, a nonsubject source, and three reported purchasing PVA produced in other nonsubject countries (Germany and Singapore) during 2013 and January‐September 2014. No purchasers reported purchasing PVA produced in Korea during 2013 or January‐September 2014.
62 Reported purchases accounted for *** percent of U.S. commercial shipments of PVA during 2013 and *** percent of U.S. commercial shipments of PVA during January‐September 2014.
63 These two firms accounted for ***. *** purchases accounted for ***. *** purchases accounted for ***.
64 These firms reported producing industrial and water based adhesives and blended tackified resins. 65 These firms reported producing adhesives, coatings, construction, and engineering fabrics. 66 These firms reported producing joint compound and texture products, water‐based adhesives, and
glass fiber veils for flooring, ceilings, and wall coverings. 67 One purchaser ***. The other purchaser, ***. 68 These firms reported producing paperboard packaging, paper towels, toilet tissue, and personal
tissue.
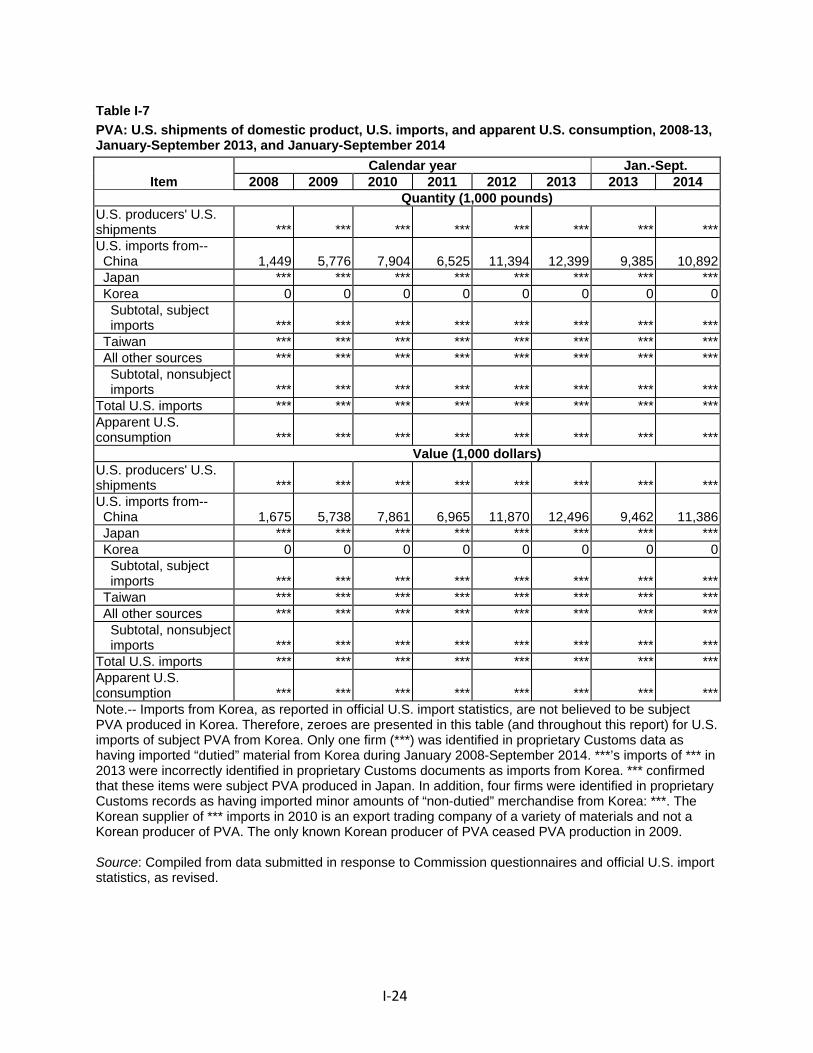
I‐24
Table I-7
PVA: U.S. shipments of domestic product, U.S. imports, and apparent U.S. consumption, 2008-13, January-September 2013, and January-September 2014
Item Calendar year Jan.-Sept.
2008 2009 2010 2011 2012 2013 2013 2014 Quantity (1,000 pounds)
U.S. producers' U.S. shipments *** *** *** *** *** *** *** ***U.S. imports from-- China 1,449 5,776 7,904 6,525 11,394 12,399 9,385 10,892 Japan *** *** *** *** *** *** *** *** Korea 0 0 0 0 0 0 0 0 Subtotal, subject imports *** *** *** *** *** *** *** *** Taiwan *** *** *** *** *** *** *** *** All other sources *** *** *** *** *** *** *** *** Subtotal, nonsubject imports *** *** *** *** *** *** *** ***Total U.S. imports *** *** *** *** *** *** *** ***Apparent U.S. consumption *** *** *** *** *** *** *** ***
Value (1,000 dollars) U.S. producers' U.S. shipments *** *** *** *** *** *** *** ***U.S. imports from-- China 1,675 5,738 7,861 6,965 11,870 12,496 9,462 11,386 Japan *** *** *** *** *** *** *** *** Korea 0 0 0 0 0 0 0 0 Subtotal, subject imports *** *** *** *** *** *** *** *** Taiwan *** *** *** *** *** *** *** *** All other sources *** *** *** *** *** *** *** *** Subtotal, nonsubject imports *** *** *** *** *** *** *** ***Total U.S. imports *** *** *** *** *** *** *** ***Apparent U.S. consumption *** *** *** *** *** *** *** ***Note.-- Imports from Korea, as reported in official U.S. import statistics, are not believed to be subject PVA produced in Korea. Therefore, zeroes are presented in this table (and throughout this report) for U.S. imports of subject PVA from Korea. Only one firm (***) was identified in proprietary Customs data as having imported “dutied” material from Korea during January 2008-September 2014. ***’s imports of *** in 2013 were incorrectly identified in proprietary Customs documents as imports from Korea. *** confirmed that these items were subject PVA produced in Japan. In addition, four firms were identified in proprietary Customs records as having imported minor amounts of “non-dutied” merchandise from Korea: ***. The Korean supplier of *** imports in 2010 is an export trading company of a variety of materials and not a Korean producer of PVA. The only known Korean producer of PVA ceased PVA production in 2009. Source: Compiled from data submitted in response to Commission questionnaires and official U.S. import statistics, as revised.

I‐25
Forecasts expect apparent U.S. consumption of PVA in 2017 to be higher than reported in 2012.69 Domestic consumption of PVA in the production of PVB, which is the largest use for PVA in the United States, is forecast to increase annually by approximately *** percent during 2012‐17.70 From 2012 to 2017, the use of PVA in the United States is also expected to grow in adhesive applications by *** percent and as an aid to polymerization by *** percent. U.S. consumption of PVA for textile warp sizings and paper applications has been stagnant to downward in the past and the demand for PVA in these applications is expected to continue to decline annually by an average of *** percent and *** percent per year, respectively, during 2012‐17.71 For all other applications, U.S. consumption of PVA is expected to increase by approximately *** percent annually during 2012‐17.72
Market shares
Data concerning market shares of total U.S. consumption of PVA during 2008‐13, January‐September 2013, and January‐September 2014 are presented in table I‐8. Market share data concerning the open‐market (commercial) apparent U.S. consumption are presented in appendix C, table C‐2.
Table I-8
PVA: U.S. market shares, 2008-13, January-September 2013, and January-September 2014
* * * * * * *
69 Information published by IHS Chemical is for all PVA, including both subject forms and excluded forms. Chemical Economics Handbook: Polyvinyl Alcohols, IHS Chemical, June 2013, p. 11. The domestic interested parties argued that domestic PVA demand is stagnant and is “***.” They also stated that “the stagnation is likely to persist in the future, even if GDP growth continues to increase.” Domestic interested parties’ responses to Commission questions, p. 5; and domestic interested parties’ prehearing brief, p. 30. On the other hand, respondent DKK argued that it believes that demand for PVA in the United States will increase in the future due to the projected growth of the U.S. economy. DKK’s responses to Commission questions, p. 1.
70 Chemical Economics Handbook: Polyvinyl Alcohols, IHS Chemical, June 2013, p. 13. 71 Ibid., pp. 14‐15. 72 Ibid., p. 16.

I‐26
The U.S. market share held by U.S. PVA producers fell from *** percent in 2008 to *** percent in 2013, and was *** percent during January‐September 2014. There were no U.S. imports of PVA from Korea and U.S. imports of subject forms of PVA from Japan accounted for *** of apparent U.S. consumption during 2008‐13, January‐September 2013, and January‐September 2014. The share of the U.S. market held by U.S. imports of subject forms of PVA from China generally increased from *** percent in 2008 to *** percent in 2013. The share held by such imports from China was *** percent during January‐September 2014. The share of apparent U.S. consumption held by U.S. imports of subject forms of PVA from Taiwan fluctuated from a low of *** percent in 2009 to a high of *** percent in 2008 and the share held by U.S. imports of subject forms of PVA from all other nonsubject countries fluctuated from a low of *** percent in 2008 to a high of *** percent during January‐September 2014.
II‐1
PART II: CONDITIONS OF COMPETITION IN THE U.S. MARKET
U.S. MARKET CHARACTERISTICS
PVA is used in a wide variety of end‐use products, of which PVB (polyvinyl butyral) is the largest in the United States.1 Other major end uses for PVA include adhesives, paper, emulsion polymerization, and textiles. PVA is also used to manufacture other products including building products, film, ceramics, and skin care products.
Only Kuraray America and Sekisui produce PVA in the United States for sale on the open market. U.S. producer Eastman internally consumes the PVA it produces in its manufacturing of PVB and does not sell PVA on the open market. Kuraray America, which acquired DuPont’s domestic PVA operations in June 2014, is also building a new PVA production facility in La Porte, Texas, where production is expected to begin in *** 2015.2
Apparent U.S. consumption of PVA, by quantity, decreased from 2008 to 2009 but then increased each year through 2012. Apparent U.S. consumption decreased slightly in 2013, but was higher in January‐September 2014 than in January‐September 2013.
CHANNELS OF DISTRIBUTION
U.S.‐produced and imported PVA is shipped primarily to end users (table II‐1).
Table II-1 PVA: U.S. producers’ and importers’ share of reported U.S. commercial shipments, by sources and channels of distribution, 2008-13, January-September 2013, and January-September 2014
* * * * * * *
1 Chemical Economics Handbook: Polyvinyl Alcohols, IHS Chemical, June 2013, p. 7. PVB is primarily used to manufacture laminated safety glass for automobile windshields and architectural applications while small amounts of PVB resin are used in adhesive and surface coating applications. Chemical Economics Handbook: Polyvinyl Alcohols, IHS Chemical, June 2013, p. 12.
2 Domestic interested parties’ prehearing brief, p. 6, and domestic interested parties’ responses to Commission questions, p. 18. Kuraray reported that construction of the greenfield facility in La Porte, Texas began prior to its acquisition of the DuPont facility. Kuraray also reported that it ***. Domestic interested parties’ responses to Commission questions, pp. 17‐18.
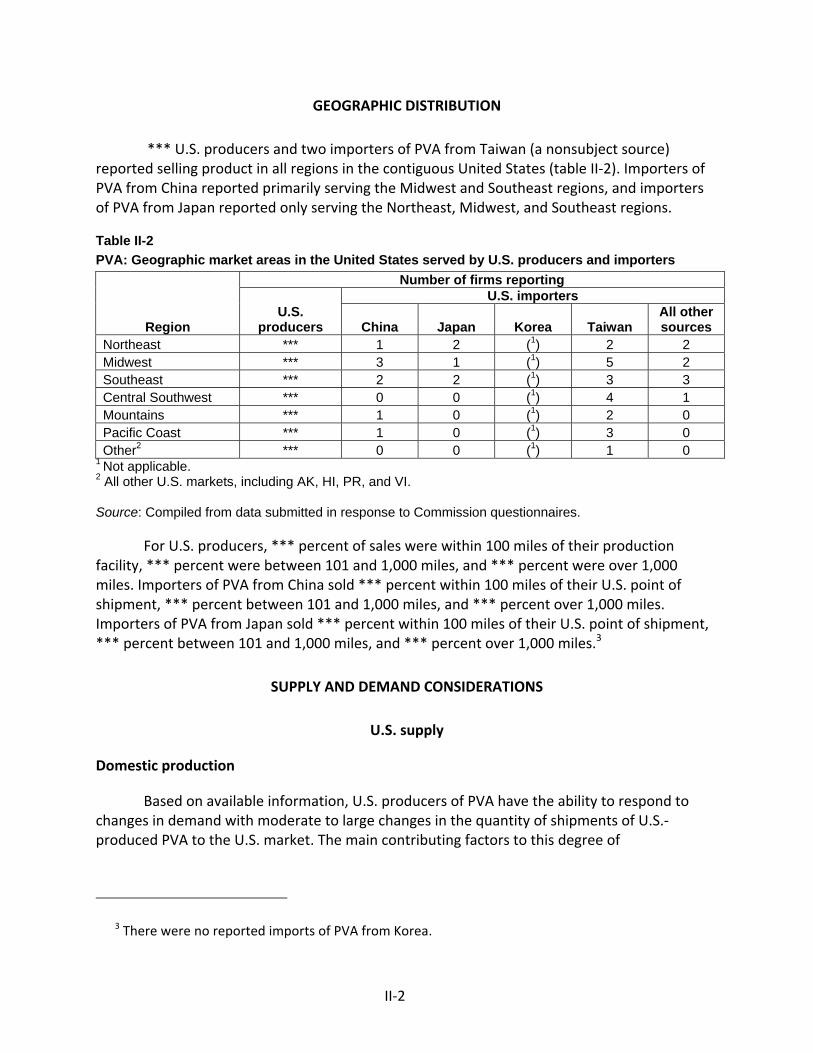
II‐2
GEOGRAPHIC DISTRIBUTION
*** U.S. producers and two importers of PVA from Taiwan (a nonsubject source) reported selling product in all regions in the contiguous United States (table II‐2). Importers of PVA from China reported primarily serving the Midwest and Southeast regions, and importers of PVA from Japan reported only serving the Northeast, Midwest, and Southeast regions.
Table II-2
PVA: Geographic market areas in the United States served by U.S. producers and importers
Region
Number of firms reporting
U.S. producers
U.S. importers
China Japan Korea Taiwan All other sources
Northeast *** 1 2 (1) 2 2 Midwest *** 3 1 (1) 5 2 Southeast *** 2 2 (1) 3 3 Central Southwest *** 0 0 (1) 4 1 Mountains *** 1 0 (1) 2 0 Pacific Coast *** 1 0 (1) 3 0 Other2 *** 0 0 (1) 1 0
1 Not applicable. 2 All other U.S. markets, including AK, HI, PR, and VI. Source: Compiled from data submitted in response to Commission questionnaires.
For U.S. producers, *** percent of sales were within 100 miles of their production facility, *** percent were between 101 and 1,000 miles, and *** percent were over 1,000 miles. Importers of PVA from China sold *** percent within 100 miles of their U.S. point of shipment, *** percent between 101 and 1,000 miles, and *** percent over 1,000 miles. Importers of PVA from Japan sold *** percent within 100 miles of their U.S. point of shipment, *** percent between 101 and 1,000 miles, and *** percent over 1,000 miles.3
SUPPLY AND DEMAND CONSIDERATIONS
U.S. supply
Domestic production
Based on available information, U.S. producers of PVA have the ability to respond to changes in demand with moderate to large changes in the quantity of shipments of U.S.‐produced PVA to the U.S. market. The main contributing factors to this degree of
3 There were no reported imports of PVA from Korea.
II‐3
responsiveness of supply are the availability of some unused capacity, existence of alternative markets, and some available inventories. Supply responsiveness is constrained by an inability to produce alternate products.
Industry capacity
U.S. producers have somewhat limited unused capacity with which they could increase production of PVA in the event of a price change. Domestic capacity utilization fluctuated during 2008‐13, increasing overall from *** percent in 2008 to *** percent in 2013.4 U.S. producers reported production increased by *** percent during 2008‐13 while capacity remained relatively stable.
Alternative markets
U.S. producers have some ability to shift shipments of PVA from other markets to the United States in response to a change in price. U.S. producers’ exports, as a share of total shipments, increased from *** percent in 2008 to *** percent in 2013.5 6 U.S. producer *** reported that the United States is its largest market, but that it has exported PVA in response to lower U.S. demand. *** also noted the higher freight costs associated with exporting PVA. U.S. producer *** stated that shifting sales between the United States and alternative country markets is not feasible to a significant degree because of higher transportation costs, longer lead times, increased rigidity of financial requirements, and weakening Asian currencies. *** U.S. producers, ***, reported that their U.S.‐produced PVA for export is subject to trade barriers in other countries (China, European Union, India, Indonesia, Korea, Malaysia, and most South American countries).7
Inventory levels
U.S. producers have some ability to use inventories as a means of increasing shipments of PVA to the U.S. market. The ratio of end‐of‐period inventories to total shipments for U.S. producers decreased from *** percent in 2008 to *** percent in 2013.8
4 Domestic capacity utilization was *** percent in January‐September 2013 and *** percent in January‐September 2014.
5 U.S. producers’ exports as a share of total shipments were *** percent in January‐September 2013 and *** percent in January‐September 2014.
6 Between *** percent and *** percent of U.S. producers’ total exports were exports to a related firm during 2008‐13. U.S. producers’ exports to related firms as a share of total exports increased to *** percent in January‐September 2014. *** reported exporting PVA to a related firm.
7 U.S. producer ***. 8 U.S. producers’ ratio of end‐of‐period inventories to total shipments was *** in January‐September
2013 and *** percent in January‐September 2014.

II‐4
Production alternatives
*** U.S. producers stated that they could not switch production from PVA to products other than PVA. Domestic interested parties added that a producer’s ability to switch production between in scope and excluded forms of PVA depends on the producer’s production technology and equipment configuration.9
Subject imports from China
No questionnaire responses were received from Chinese producers of PVA.10 The Commission received one questionnaire response from Chinese exporter Alanchem Corp. (“Alanchem”).11 Alanchem reported that *** percent of its exports during *** were shipped to the United States.12
Data published in the Chemical Economics Handbook indicate that ***.13 According to data from Global Trade Atlas, exports from China to all countries increased by 86.9 percent during 2008‐14, and exports from China to the United States increased from 248,000 pounds in 2008 to 12.2 million pounds in 2014.14
Subject imports from Japan15
Based on available information, producers of PVA from Japan have the ability to respond to changes in demand with moderate to large changes in the quantity of shipments of PVA to the U.S. market. The main contributing factors to this degree of responsiveness of supply are the availability of unused capacity, ability to shift sales from alternate markets, and availability of inventories. Supply responsiveness is constrained by the inability to produce alternative products.
Industry capacity
Japanese producers have some available capacity with which they could increase production of PVA in the event of a price change. Japanese producers’ capacity utilization
9 Domestic interested parties’ responses to Commission questions, p. 21. 10 There are believed to be at least 15 producers of PVA in China. Please see Part IV of this report for
more information on the PVA industry in China. 11 Alanchem’s exports to the United States accounted for *** percent of U.S. imports of PVA from
China during 2008‐13 and January‐September 2014. 12 ***. 13 Production of PVA in China increased by *** percent during 2008‐12. Chemical Economics
Handbook: Polyvinyl Alcohols, IHS Chemical, June 2013, pp. 57‐59. 14 Global Trade Atlas (HTS 3905.30.00, polyvinyl alcohols, in primary forms). 15 The Commission received questionnaire responses from all four known Japanese producers.

II‐5
decreased from 80.1 percent in 2008 to 73.1 percent in 2013.16 Japanese producers’ capacity increased by 7.4 percent during 2008‐13 while production decreased by 2.0 percent.
Alternative markets
Japanese producers reported that the largest share of their total shipments of subject PVA were shipped to their home market during 2008‐13 and January‐September 2014,17 with smaller shares exported to Asia and the European Union. Japanese producers reported exporting *** of their total shipments of subject PVA to the United States during 2008‐13 and January‐September 2014.18 19
Japanese producer *** reported that it can easily shift sales from the United States to other countries but noted that it would be difficult to shift sales of its high value PVA because it is used in unique applications, such as ***. *** reported that it takes *** months to receive a customer’s quality approval so this would be the minimal time needed to shift sales between the United States and other markets. *** also stated that this time could be shortened if needed. Japanese producer *** stated that, while it is possible to shift sales between markets, it is not practical as *** supplies PVA through annual contracts with long‐standing customers and will not cut off existing customers to switch markets based on short‐term considerations. Japanese producer *** stated that it does not have excess volume that it could shift to the United States because it is meeting strong demand in its home market and the Asian market.
Inventory levels
Japanese producers have some ability to use inventories as a means of increasing shipments of PVA. The ratio of end‐of‐period inventories to total shipments for Japanese producers decreased from 18.8 percent in 2008 to 17.1 percent in 2010 then increased to 20.9 percent in 2013.20
16 Japanese producers’ capacity utilization was 72.4 percent in January‐September 2013 and 70.8 percent in January‐September 2014.
17 Home market shipments for commercial use ranged from *** percent to *** percent of Japanese producers’ total home market shipments during 2008‐10 and *** to *** percent to *** percent during 2011‐13 and January‐September 2014.
18 Japanese producers reported exporting *** pounds of subject PVA but *** pounds of excluded forms of PVA to the United States during 2013.
19 Japanese producer DKK reported that ***. DKK’s foreign producer questionnaire response, section II‐4, and DKK’s responses to Commission questions, p. 3. In their prehearing brief, domestic interested parties reported that ***. Domestic interested parties’ prehearing brief, p. 3.
20 Japanese producers’ ratio of end‐of‐period inventories to total shipments was 22.3 percent in January‐September 2013 and 18.0 percent in January‐September 2014.

II‐6
Production alternatives
*** responding Japanese producers reported that they are not able to shift production between PVA and products other than PVA. However, foreign producer DKK added that producers are able to switch between subject forms of PVA and excluded forms of PVA because the facility (total process including polymerization system, saponification system, drying system, and solvent recovery system) and labor would not change when producing excluded or subject forms of PVA.21
Subject imports from Korea
The Commission received no foreign producer questionnaires from Korean producers, and there are believed to be no firms currently producing PVA in Korea. According to the Chemical Economics Handbook, ***.22 ***.23
Imports from nonsubject countries
The largest sources of imports from nonsubject countries during 2008‐13 were Taiwan, Germany, and Singapore. Combined, they accounted for *** percent of imports from nonsubject sources in 2013. Taiwan, the largest single source of imports from nonsubject sources during 2008‐13 and January‐September 2014, accounted for *** percent of all such imports in 2013.
Supply constraints
Six purchasers reported supply constraints, four of which reported supply issues with a U.S. producer. Purchaser *** reported that ***. Purchaser *** reported that ***. Purchaser *** reported that ***.24 Purchaser ***.25 ***.
New suppliers
Four of 18 purchasers indicated that new suppliers entered the U.S. market since January 1, 2008, and six purchasers expect additional entrants. Most firms cited Kuraray America’s new production facility in LaPorte, Texas, which will open in 2015. One purchaser cited Sekisui as a new supplier since it acquired Celanese in 2009, and another purchaser
21 DKK’s responses to Commission questions, p. 6. 22 Chemical Economics Handbook: Polyvinyl Alcohols, IHS Chemical, June 2013, p. 67. Please see part
IV of this report for more information on the PVA industry in Korea. 23 Emails from ***. 24 ***. Email from ***. 25 Ethylene and acetic acid are combined to make VAM, which is polymerized and combined with
methanol to produce PVA. Polyvinyl Alcohol from China, Japan, and Korea, Inv. Nos. 731‐TA‐1014, 1016, and 1017 (Review), USITC Publication 4067, March 2009, p. V‐1.

II‐7
expects new suppliers from China, Korea, and Japan if the duties on these countries are removed.
U.S. demand
Based on available information, the overall demand for PVA is likely to experience moderate changes in response to changes in price. The main contributing factors are the somewhat limited range of substitute products and the small cost share of PVA in most of its end‐use products. However, some factors increase the responsiveness of demand, including the large cost share of PVA in some end‐use products and the existence of substitutes for some applications of PVA.
End uses
U.S. producers, importers, and purchasers reported similar end uses for PVA, including adhesives (angle board adhesive, core adhesive, laminating adhesive, towel and tissue adhesive, and wood glue); building products (joint treatment, synthetic grout, and texture products); ceramic proppant; emulsion polymers; paper products (paper, paper towels, paperboard, personal tissue, and toilet tissue); PVA film; PVB; PVB film; PVC; specialty resin; textile products (spun yarn warp sizing and textiles); vinyl acetate ethylene; automotive paint; and water soluble film. Foreign producers reported many of the same end‐use products and added agrochemicals, excipients, pharmaceutical products, PVA fiber, and vinylon fiber. Foreign producers also reported that the end uses are the same in their home and export markets. One foreign producer, ***, reported that it also exports a specialized high functioning PVA that functions as a binder in non‐woven glass paper.26
All U.S. producers, importers, 17 of 19 purchasers, and 4 of 5 foreign producers reported no changes in end uses since January 1, 2008. All U.S. producers, importers, foreign producers, and 15 of 19 purchasers also reported that they do not anticipate any changes in end uses.
Domestic interested parties assert that the domestic industry is always looking for new uses for PVA but that research and development requires significant investment. Domestic interested parties provided examples of recent promising advances in end uses for PVA including, ***, but noted that these new end uses partially offset declining demand in other sectors (textiles and paper coatings) where domestic PVA consumption is decreasing.27 DKK reported that ***.28
Cost share
PVA accounts for a varying share of the cost of the end‐use products in which it is used. In general, PVA accounts for a small to moderate share of the total cost of adhesives products,
26 ***. Email from ***. 27 Domestic interested parties responses to Commission questions, pp. 6‐7. 28 DKK’s responses to Commission questions, p. 3. ***. Email from ***. ***.
II‐8
building products, emulsion polymers, paper products, PVC, vinyl acetate ethylene, and automotive paint, and it accounts for a moderate to large share of the total cost of PVA film, PVB, PVB film, specialty resin, textile products, and water soluble film.
Firms reported that the cost share of PVA in adhesives applications ranged from 2 to 50 percent. While most firms reported that PVA accounted for 15 percent or less of the total end‐use cost in most adhesives products, wood glue and towel and tissue adhesives were among the highest reported end‐use cost shares. PVA accounted for 12 percent or less of the total cost of emulsion polymers, 1 to 2 percent of the total cost for paper products, 1 percent of the total cost of PVC, and 15 percent or less of the total cost of vinyl acetate ethylene. PVA accounted for 5 to 60 percent of the total cost of building products, 35 percent of the total cost of PVA film, 37 percent of the total cost of PVB film, 29 to 70 percent of the total cost of PVB, 59 percent of the total cost of specialty resin, 2 to 80 percent of the total cost of textile products, and 35 percent of the total cost of water soluble film.
Demand characteristics
Demand for PVA is driven by demand for its primary end uses, which depend on the performance of the general economy.29 Real GDP growth in the United States fluctuated during first quarter 2008 to fourth quarter 2014 (figure II‐1). Real GDP growth was ‐2.7 percent in first quarter 2008, increased in second quarter 2008, then fell to ‐8.2 percent in fourth quarter 2008. Real GDP growth increased in 2009 and fluctuated through third quarter 2014. Real GDP growth was 5.0 percent in third quarter 2014 but decreased to 2.2 percent in fourth quarter 2014. According to Blue Chip Economic Indicators, real GDP is expected to grow by *** percent in 2015 and *** percent in 2016.30
Demand trends
Most firms reported that demand increased overall or did not change since January 1, 2008, and they expect these trends to continue (table II‐3). In additional comments, firms reported that demand tends to keep pace with GDP, which decreased in 2009 due to the recession and has been slowly recovering. One firm noted that demand for PVA used in manufacturing PVB has increased due to the increased use of safety glass and one firm attributed increased demand to overall manufacturing growth.
29 Chemical Economics Handbook: Polyvinyl Alcohols, IHS Chemical, June 2013, p. 8. 30 Blue Chip Economic Indicators, Vol. 31, No. 1, March 10, 2015.

II‐9
Figure II-1
Real U.S. GDP growth: Percentage change, quarterly, first quarter 2008-fourth quarter 2014
Source: National Income and Product Accounts, Table 1.1.1, Percent Change from Preceding Period in Real Gross Domestic Product, Bureau of Economic Analysis, http://www.bea.gov/national/nipaweb, retrieved March 30, 2015. Table II-3
PVA: Firms’ responses regarding U.S. demand
Item
Number of firms reporting
Increase No
change Decrease Fluctuate
Demand in the United States: U.S. producers *** *** *** ***
Importers 3 3 1 4 Purchasers 5 7 3 2 Foreign producers 2 2 1 0
Anticipated future demand in the United States: U.S. producers *** *** *** ***
Importers 5 3 0 3 Purchasers 11 5 1 0 Foreign producers 3 1 1 0
Demand for purchasers' final products: Purchasers 9 1 4 3
Source: Compiled from data submitted in response to Commission questionnaires.

II‐10
According to the Chemical Economics Handbook, overall demand for PVA is expected to increase by *** percent per year during 2012‐17. The fastest growing market for PVA is ***. Growth for PVA used in PVB applications is forecasted at *** percent per year during 2012‐17. PVA for use in adhesives is also expected to grow by *** percent per year during that same time frame while PVA for use in textile and paper coating applications is expected to decline.31
DKK reported that demand for PVA is related to the growth of the economy and that demand for PVA in the United States will increase in the future because the U.S. economy is expected to grow.32 Domestic interested parties assert that, while demand for PVA is driven by demand for its primary end uses and the overall economy, “Overall, demand for PVA is stagnant at best, and the stagnation is likely to persist in the future.”33 Domestic interested parties stated that demand for PVA failed to progress as the overall economy has, a trend that is likely to continue.34
Business cycles
Two of 3 U.S. producers, 7 of 10 importers, and 15 of 17 purchasers indicated that the PVA market was not subject to business cycles or conditions of competition. Of the firms that reported the PVA market was subject to business cycles or conditions of competition, *** reported some seasonality, as a portion of PVA demand is for applications in the building and construction industry, for which demand increases during warmer months and decreases during colder months.
Substitute products
All three U.S. producers, 3 of 13 importers, 5 of 19 purchasers, and 3 of 5 foreign producers reported that there are substitutes for PVA. The most commonly identified substitute product was starch. Starch can be substituted for PVA in textile, paper, and adhesives applications. No firm reported that the price of starch affected the price of PVA. Another commonly identified substitute was styrene butadiene latex (“SBL”) for paper applications. *** reported that the price of SBL affected the price of PVA and that SBL prices have decreased and put pressure on the price of PVA used in coated paper applications. Other substitutes include polyvinyl acetate and methyl cellulose (for adhesives applications), cellulose ethers (for building and construction applications), and carboxylmethylcellulose (for textile warp sizing). Firms reported that prices for most of these substitutes did not affect the prices for PVA. No firm reported that substitutes for PVA have changed since 2008.
31 Chemical Economics Handbook: Polyvinyl Alcohols, IHS Chemical, June 2013, p. 7. 32 DKK’s responses to Commission questions, pp. 1‐2. 33 Domestic interested parties’ prehearing brief, p. 30. 34 Domestic interested parties’ responses to Commission questions, p. 4.

II‐11
SUBSTITUTABILITY ISSUES
The degree of substitution between domestic and imported PVA depends upon such factors as relative prices, quality (e.g., grade standards, reliability of supply, etc.), and conditions of sale (e.g., price discounts/rebates, lead times between order and delivery dates, payment terms, product services, etc.). Based on available data, staff believes that there is a moderate degree of substitutability between domestically produced PVA and PVA imported from subject sources.
Lead times
PVA is primarily sold from inventory. U.S. producers reported that *** percent of their 2013 sales were from inventory, with lead times of *** days.35 Importers of PVA from China reported that *** percent of their 2013 sales were from U.S. inventories, with lead times of *** days, and *** percent were from foreign inventories, with lead times of *** days. Importers of PVA from Japan reported that *** percent of their 2013 sales were from U.S. inventories, with lead times of *** days, and *** percent were from foreign inventories, with lead times of *** days.36
Knowledge of country sources
Seventeen purchasers indicated they had marketing/pricing knowledge of U.S.‐produced PVA, 7 of PVA from China, 6 of PVA from Japan, 2 of PVA from Korea, and 10 of PVA from Taiwan.
As shown in table II‐4, purchasers’ responses regarding whether they make purchasing decisions based on the producer and country of origin were mixed. One purchaser that reported always making purchasing decisions based on the producer and country of origin reported doing so because its only qualified supplier is a U.S. producer while another purchaser reported making sourcing decisions based on the best total value among vendors, including cost, innovation, quality, logistics, and supplier responsiveness. All purchasers reported that their customers sometimes or never make purchasing decisions based on the producer or country of origin.
35 U.S. producer *** reported that *** percent of its 2013 sales were from inventory, and U.S producer *** reported that *** percent of its 2013 sales were from inventory and the remaining *** percent were produced to order with lead times of *** days.
36 ***, an importer of PVA from China and Japan, reported that *** percent of its 2013 sales were from U.S. inventories, with a lead time of *** days, *** percent were from foreign inventories, with a lead time of *** days, and the remaining *** percent were produced to order with a lead time of *** days. ***, an importer of PVA from China, reported that *** percent of its 2013 sales were from U.S. inventories, with lead times of *** days, and *** percent were from foreign inventories, with lead times of *** days.

II‐12
Table II-4
PVA: Purchasing decisions based on producer and country of origin
Decision Number of firms reporting
Always Usually Sometimes Never
Purchases based on producer: Purchaser's decision 6 4 3 5
Purchaser's customer's decision 0 1 5 8
Purchases based on country of origin: Purchaser's decision 4 2 5 7
Purchaser's customer's decision 0 0 4 10 Source: Compiled from data submitted in response to Commission questionnaires.
Factors affecting purchasing decisions
As shown in table II‐5, the leading factors that firms consider in their purchasing decisions for PVA were price (17 firms), quality (16 firms), and availability (9 firms). Quality was the most frequently cited first‐most important factor (cited by 10 firms); and price was most frequently reported as the second‐ or third‐most important factor (8 and 7 firms, respectively).
Table II-5 PVA: Ranking of factors used in purchasing decisions as reported by U.S. purchasers, by factor
Factor Number of firms reporting
First Second Third Total Price 2 8 7 17 Quality1 10 6 0 16 Availability 2 2 5 9 Reliability/continuity of supply 1 1 5 7 Other2 4 2 2 8
1 Purchasers defined quality as certificate of analysis, grade/fineness of material (ash content, heavy metals, hydrolysis, viscosity, and volatiles/organic volatiles), meeting/consistently meeting manufacturer’s published specifications, pH levels, quality of the end product produced with the PVA, and water resistance. 2 Other factors include ability to meet specifications, contracts, credit/payment terms, and functionality. Source: Compiled from data submitted in response to Commission questionnaires.
The majority of purchasers (13 of 19) reported that they usually or sometimes purchase the lowest priced product for their purchases. Four purchasers reported that they never purchase the lowest priced product, and two reported that they always purchase the lowest priced product.
When asked if they purchased PVA from one source although a comparable product was available at a lower price from another source, purchasers reported reasons including service, diversity of supply, supplier qualification, preference for U.S.‐produced product, continuity and reliability of supply, and contractual obligations. Four of 16 purchasers reported that certain types of product were only available from a single source. Purchaser *** reported that fully

II‐13
hydrolyzed PVA is only available in the United States. Purchaser *** reported that a special PVA grade is only manufactured by ***. Purchaser *** noted that PVA produced in China does not meet its quality requirements. Purchaser *** reported that ***.37
Importance of specified purchase factors
Purchasers were asked to rate the importance of 19 factors in their purchasing decisions (table II‐6). The factors rated as “very important” by more than half of responding purchasers were availability, product consistency, and reliability of supply (19 firms each); price and quality meets industry standards (17 firms each); availability of preferred type (16 firms); viscosity (15 firms); hydrolysis and supplier prequalification (14 firms each); and delivery time (12 firms).
Table II-6 PVA: Importance of purchase factors, as reported by U.S. purchasers, by factor
Factor Number of firms reporting
Very Somewhat Not Availability 19 0 0 Availability of preferred type 16 3 0 Delivery terms 5 12 2 Delivery time 12 6 1 Discounts offered 6 9 4 Extension of credit 4 9 6 Hydrolysis 14 5 0 Minimum quantity requirements 5 8 6 Packaging 6 8 5 Price 17 2 0 Product consistency 19 0 0 Product range 7 7 5 Quality exceeds industry standards 9 9 1 Quality meets industry standards 17 2 0 Reliability of supply 19 0 0 Supplier prequalification 14 4 1 Technical support/service 4 10 5 U.S. transportation costs 6 10 3 Viscosity 15 3 1
Source: Compiled from data submitted in response to Commission questionnaires.
Supplier certification
Fifteen of 18 responding purchasers require their suppliers to become certified or qualified to sell PVA to their firm.38 Nine purchasers reported that the time to qualify a new supplier ranged between 180‐365 days, three purchasers reported 30 days, one purchaser
37 DKK reported that ***. DKK’s responses to Commission questions, p. 3. ***. Email from ***. 38 Of the three firms that do not require their suppliers to become certified or qualified, one is a
distributor, one is an adhesives producer, and one is a textile producer.

II‐14
reported 90 days, one purchaser reported 1 to 7 days, and one purchaser reported that the time to qualify a new supplier was variable. Purchasers reported varying certification processes. Several purchasers require an ISO quality certification, while others run production tests on sample product. Purchaser *** reported that its qualification process includes ***. Purchaser *** reported that its qualification process includes ***. Only one purchaser (***) reported that any supplier had failed in its attempt to qualify product, or had lost its approved status since January 1, 2008. ***.39
Changes in purchasing patterns
Purchasers were asked about changes in their purchasing patterns from different sources since January 1, 2008 (table II‐7). Purchasers that reported increasing purchases of U.S.‐produced PVA indicated that they expanded their market share or added a new production facility while purchasers that reported decreasing purchases of U.S.‐produced product reported that their business had slowed or purchases fluctuated with market cycles.
Table II-7
PVA: Changes in purchase patterns from U.S., subject, and nonsubject countries
Factor
Number of firms reporting Did not
purchase Decreased Increased Constant Fluctuated United States 2 5 3 6 2 China 10 2 2 1 0 Japan 12 1 0 2 0 Korea 14 0 0 0 0 Taiwan 8 3 3 2 1 All other sources 12 2 1 0 1
Source: Compiled from data submitted in response to Commission questionnaires.
Seven of 19 responding purchasers reported that they had changed suppliers since January 1, 2008. Two purchasers (***) reported changing suppliers from U.S. producer Celanese to U.S. producer Sekisui when Sekisui purchased Celanese’s PVA production business in 2009. Purchaser *** reported adding U.S. producer Celanese (now Sekisui) in 2009 to purchase a ***. Purchaser ***.40 Purchaser *** stated that it dropped importer Perry due to a contractual obligation with a U.S. producer.
Importance of purchasing domestic product
No purchaser reported that U.S.‐produced product was required by law for any of their 2013 purchases. Nine of 15 responding purchasers reported that 95 to 100 percent of their
39 ***. Email from ***. In their prehearing brief, domestic interested parties reported that ***. Domestic interested parties’ prehearing brief, p. 37, and domestic interested parties’ responses to Commission questions, p. 18.
40 ***.

II‐15
purchases did not require U.S.‐produced PVA. Two purchasers reported that U.S.‐produced PVA was required for 100 percent of their purchases for other reasons, including strict quality and specification requirements.41 One purchaser (***) reported that U.S.‐produced PVA was required by its customers for 100 percent of its purchases.
Comparisons of domestic products, subject imports, and nonsubject imports
Purchasers were asked a number of questions comparing PVA produced in the United States, subject countries, and nonsubject countries. First, purchasers were asked for a country‐by‐country comparison on the same 19 factors (table II‐8) for which they were asked to rate the importance. When comparing PVA from the United States with PVA from subject countries China, Japan, and Korea, and nonsubject Taiwan, most purchasers reported that the product was comparable for most factors.
Table II-8
PVA: Purchasers’ comparisons between U.S.-produced and imported product
Factor
Number of firms reporting U.S. vs. China U.S. vs. Japan U.S. vs. Korea
S C I S C I S C I Availability 4 4 0 3 4 1 1 1 0 Availability of preferred type 2 5 0 1 4 2 0 1 0 Delivery terms 3 4 0 2 5 1 1 1 0 Delivery time 3 4 0 3 4 1 0 2 0 Discounts offered 0 7 0 0 7 1 0 2 0 Extension of credit 1 6 0 0 6 2 0 2 0 Hydrolysis 0 7 0 0 6 2 0 2 0 Minimum quantity requirements 0 7 0 0 7 1 0 2 0 Packaging 1 6 0 0 7 1 0 2 0 Price 1 5 1 2 4 2 0 2 0 Product consistency 1 6 0 0 7 1 0 2 0 Product range 1 6 0 0 6 2 0 2 0 Quality exceeds industry standards 1 6 0 0 7 1 0 2 0 Quality meets industry standards 1 6 0 0 7 1 0 2 0 Reliability of supply 3 4 0 0 7 1 0 2 0 Supplier prequalification 1 6 0 0 7 1 0 2 0 Technical support/service 3 3 0 2 4 2 1 1 0 U.S. transportation costs 3 4 0 2 5 1 1 1 0 Viscosity 0 7 0 0 6 2 0 2 0
Table continued on following page.
41 Of the two purchasers that require 100 percent U.S.‐produced PVA for other reasons, one is a *** manufacturer and the other is a *** producer.
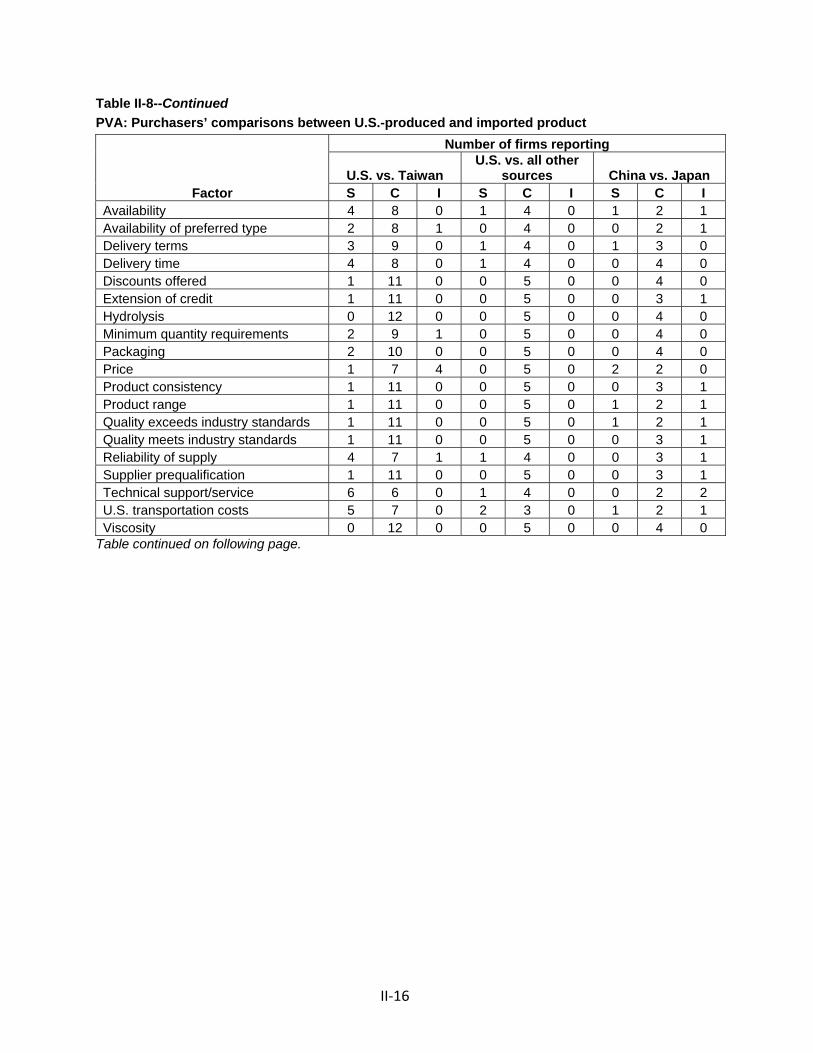
II‐16
Table II-8--Continued
PVA: Purchasers’ comparisons between U.S.-produced and imported product
Factor
Number of firms reporting
U.S. vs. Taiwan U.S. vs. all other
sources China vs. Japan S C I S C I S C I
Availability 4 8 0 1 4 0 1 2 1 Availability of preferred type 2 8 1 0 4 0 0 2 1 Delivery terms 3 9 0 1 4 0 1 3 0 Delivery time 4 8 0 1 4 0 0 4 0 Discounts offered 1 11 0 0 5 0 0 4 0 Extension of credit 1 11 0 0 5 0 0 3 1 Hydrolysis 0 12 0 0 5 0 0 4 0 Minimum quantity requirements 2 9 1 0 5 0 0 4 0 Packaging 2 10 0 0 5 0 0 4 0 Price 1 7 4 0 5 0 2 2 0 Product consistency 1 11 0 0 5 0 0 3 1 Product range 1 11 0 0 5 0 1 2 1 Quality exceeds industry standards 1 11 0 0 5 0 1 2 1 Quality meets industry standards 1 11 0 0 5 0 0 3 1 Reliability of supply 4 7 1 1 4 0 0 3 1 Supplier prequalification 1 11 0 0 5 0 0 3 1 Technical support/service 6 6 0 1 4 0 0 2 2 U.S. transportation costs 5 7 0 2 3 0 1 2 1 Viscosity 0 12 0 0 5 0 0 4 0
Table continued on following page.
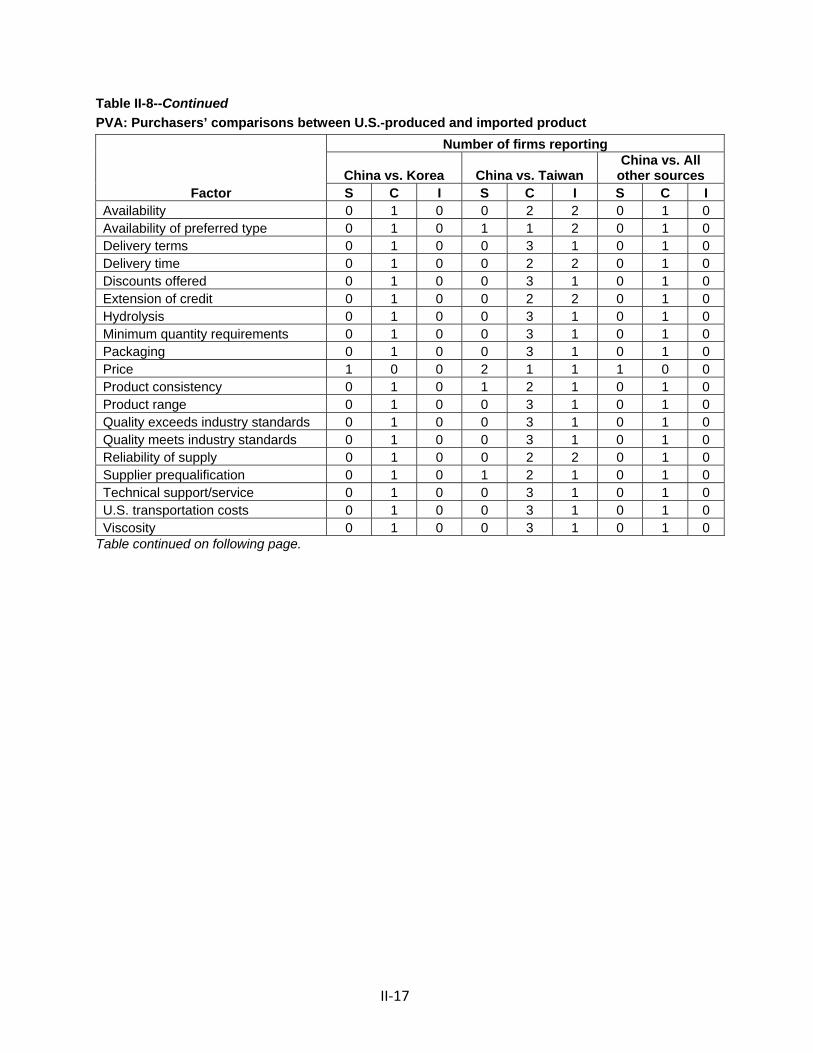
II‐17
Table II-8--Continued
PVA: Purchasers’ comparisons between U.S.-produced and imported product
Factor
Number of firms reporting
China vs. Korea China vs. Taiwan China vs. All
other sources S C I S C I S C I
Availability 0 1 0 0 2 2 0 1 0 Availability of preferred type 0 1 0 1 1 2 0 1 0 Delivery terms 0 1 0 0 3 1 0 1 0 Delivery time 0 1 0 0 2 2 0 1 0 Discounts offered 0 1 0 0 3 1 0 1 0 Extension of credit 0 1 0 0 2 2 0 1 0 Hydrolysis 0 1 0 0 3 1 0 1 0 Minimum quantity requirements 0 1 0 0 3 1 0 1 0 Packaging 0 1 0 0 3 1 0 1 0 Price 1 0 0 2 1 1 1 0 0 Product consistency 0 1 0 1 2 1 0 1 0 Product range 0 1 0 0 3 1 0 1 0 Quality exceeds industry standards 0 1 0 0 3 1 0 1 0 Quality meets industry standards 0 1 0 0 3 1 0 1 0 Reliability of supply 0 1 0 0 2 2 0 1 0 Supplier prequalification 0 1 0 1 2 1 0 1 0 Technical support/service 0 1 0 0 3 1 0 1 0 U.S. transportation costs 0 1 0 0 3 1 0 1 0 Viscosity 0 1 0 0 3 1 0 1 0
Table continued on following page.

II‐18
Table II-8--Continued
PVA: Purchasers’ comparisons between U.S.-produced and imported product
Factor
Number of firms reporting
Japan vs. Korea Japan vs. Taiwan Japan vs. All other
sources S C I S C I S C I
Availability 0 1 0 0 4 2 0 3 0 Availability of preferred type 1 0 0 2 2 2 1 2 0 Delivery terms 0 1 0 0 5 1 0 3 0 Delivery time 0 1 0 0 4 2 0 3 0 Discounts offered 0 1 0 0 5 1 0 3 0 Extension of credit 0 1 0 1 4 1 0 3 0 Hydrolysis 0 1 0 0 5 1 0 3 0 Minimum quantity requirements 0 1 0 0 5 1 0 3 0 Packaging 0 1 0 0 6 0 0 3 0 Price 0 1 0 0 4 2 0 2 1 Product consistency 0 1 0 1 5 0 0 3 0 Product range 1 0 0 2 3 1 1 2 0 Quality exceeds industry standards 1 0 0 2 3 1 0 3 0 Quality meets industry standards 0 1 0 1 4 1 0 3 0 Reliability of supply 0 1 0 0 5 1 0 3 0 Supplier prequalification 0 1 0 1 4 1 0 3 0 Technical support/service 1 0 0 2 3 1 0 3 0 U.S. transportation costs 0 1 0 0 5 1 0 3 0 Viscosity 0 1 0 0 6 0 0 3 0
Table continued on following page.

II‐19
Table II-8--Continued
PVA: Purchasers’ comparisons between U.S.-produced and imported product
Factor
Number of firms reporting
Korea vs. Taiwan Korea vs. All other
sources Taiwan vs. All other sources
S C I S C I S C I Availability 0 0 1 0 0 1 0 4 0 Availability of preferred type 0 1 0 0 1 0 0 4 0 Delivery terms 0 1 0 0 1 0 0 4 0 Delivery time 0 1 0 0 1 0 0 4 0 Discounts offered 0 1 0 0 1 0 0 4 0 Extension of credit 0 1 0 0 1 0 0 4 0 Hydrolysis 0 1 0 0 1 0 0 4 0 Minimum quantity requirements 0 1 0 0 1 0 0 4 0 Packaging 0 1 0 0 1 0 0 4 0 Price 1 0 0 1 0 0 0 4 0 Product consistency 0 1 0 0 1 0 0 4 0 Product range 0 1 0 0 1 0 0 4 0 Quality exceeds industry standards 0 1 0 0 1 0 0 4 0 Quality meets industry standards 0 1 0 0 1 0 0 4 0 Reliability of supply 0 1 0 0 1 0 0 4 0 Supplier prequalification 0 1 0 0 1 0 0 4 0 Technical support/service 0 1 0 0 1 0 0 3 1 U.S. transportation costs 0 1 0 0 1 0 0 3 0 Viscosity 0 1 0 0 1 0 0 4 0
1 A rating of superior means that price/U.S. transportation costs is generally lower. For example, if a firm reported “U.S. superior,” it meant that the U.S. product was generally priced lower than the imported product. Note.--S=first listed country’s product is superior; C=both countries’ products are comparable; I=first listed country’s product is inferior. Source: Compiled from data submitted in response to Commission questionnaires.
Comparison of U.S.‐produced and imported PVA
In order to determine whether U.S.‐produced PVA can generally be used in the same applications as imports from China, Japan, Korea, Taiwan, and all other countries, U.S. producers, importers, and purchasers were asked whether the products can “always,” “frequently,” “sometimes,” or “never” be used interchangeably. As shown in table II‐9, most U.S. producers and importers reported that product from the United States and China is “always” or “frequently” interchangeable while most purchasers reported that product from
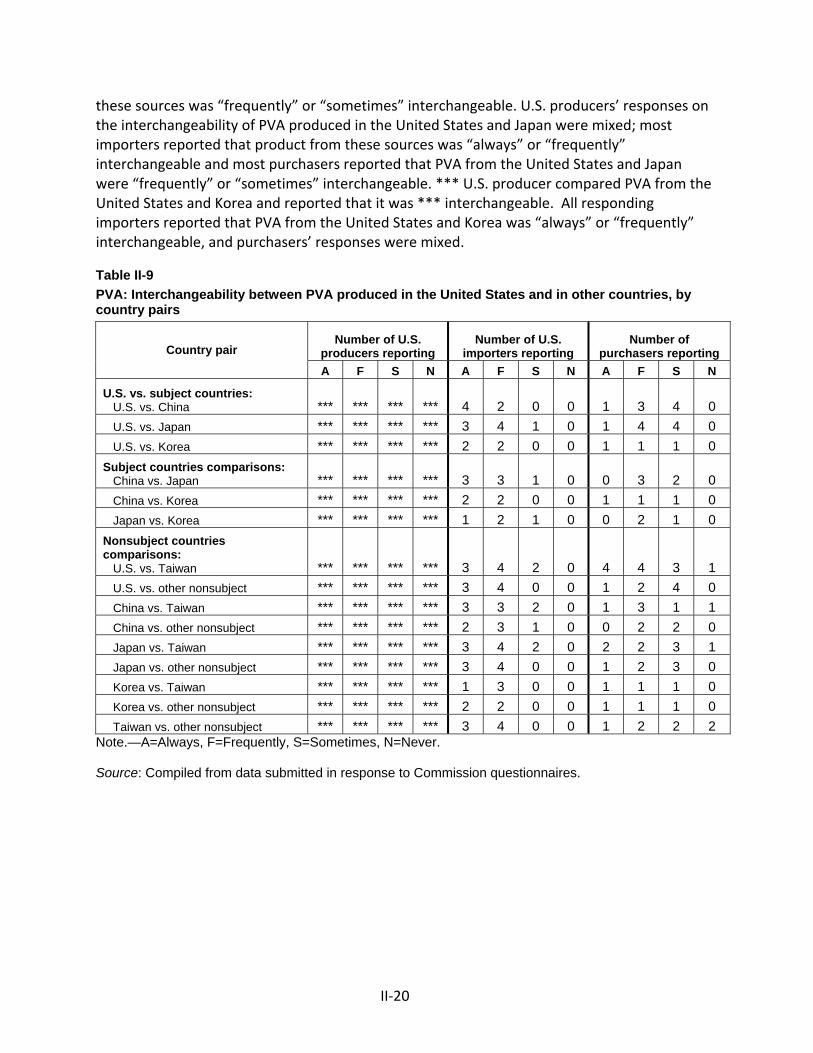
II‐20
these sources was “frequently” or “sometimes” interchangeable. U.S. producers’ responses on the interchangeability of PVA produced in the United States and Japan were mixed; most importers reported that product from these sources was “always” or “frequently” interchangeable and most purchasers reported that PVA from the United States and Japan were “frequently” or “sometimes” interchangeable. *** U.S. producer compared PVA from the United States and Korea and reported that it was *** interchangeable. All responding importers reported that PVA from the United States and Korea was “always” or “frequently” interchangeable, and purchasers’ responses were mixed.
Table II-9
PVA: Interchangeability between PVA produced in the United States and in other countries, by country pairs
Country pair Number of U.S.
producers reporting Number of U.S.
importers reporting Number of
purchasers reporting
A F S N A F S N A F S N
U.S. vs. subject countries: U.S. vs. China *** *** *** *** 4 2 0 0 1 3 4 0
U.S. vs. Japan *** *** *** *** 3 4 1 0 1 4 4 0
U.S. vs. Korea *** *** *** *** 2 2 0 0 1 1 1 0
Subject countries comparisons: China vs. Japan *** *** *** *** 3 3 1 0 0 3 2 0
China vs. Korea *** *** *** *** 2 2 0 0 1 1 1 0
Japan vs. Korea *** *** *** *** 1 2 1 0 0 2 1 0
Nonsubject countries comparisons: U.S. vs. Taiwan *** *** *** *** 3 4 2 0 4 4 3 1
U.S. vs. other nonsubject *** *** *** *** 3 4 0 0 1 2 4 0
China vs. Taiwan *** *** *** *** 3 3 2 0 1 3 1 1
China vs. other nonsubject *** *** *** *** 2 3 1 0 0 2 2 0
Japan vs. Taiwan *** *** *** *** 3 4 2 0 2 2 3 1
Japan vs. other nonsubject *** *** *** *** 3 4 0 0 1 2 3 0
Korea vs. Taiwan *** *** *** *** 1 3 0 0 1 1 1 0
Korea vs. other nonsubject *** *** *** *** 2 2 0 0 1 1 1 0
Taiwan vs. other nonsubject *** *** *** *** 3 4 0 0 1 2 2 2 Note.—A=Always, F=Frequently, S=Sometimes, N=Never. Source: Compiled from data submitted in response to Commission questionnaires.

II‐21
As can be seen from table II‐10, the majority of responding purchasers reported that domestically produced and imported PVA “always” or “usually” meets minimum quality specifications. Purchaser *** reported that U.S.‐produced PVA “rarely” or “never” meets minimum quality specifications, and purchaser *** reported that PVA imported from China and Taiwan “rarely” or “never” meets minimum quality specifications.42
Table II-10
PVA: Ability to meet minimum quality specifications, by source1
Source
Number of firms reporting
Always Usually Sometimes Rarely or never
United States 13 3 0 1
China 2 3 0 1
Japan 5 3 1 0
Korea 0 2 0 0
Taiwan 7 5 0 1
Other 2 1 0 0 1 Purchasers were asked how often domestically produced or imported PVA meets minimum quality specifications for their own or their customers’ uses. Source: Compiled from data submitted in response to Commission questionnaires.
In addition, U.S. producers, importers, and purchasers were asked to assess how often differences other than price were significant in sales of PVA from the United States, subject, or nonsubject countries. As seen in table II‐11, U.S. producers reported that differences other than price were “never” significant in all country comparisons, and most importers reported that differences other than price are “sometimes” or “never” significant. Purchasers’ responses regarding the significance of differences other than price were mixed among “always,” “sometimes,” and “never.”
42 ***. Email from ***. ***.
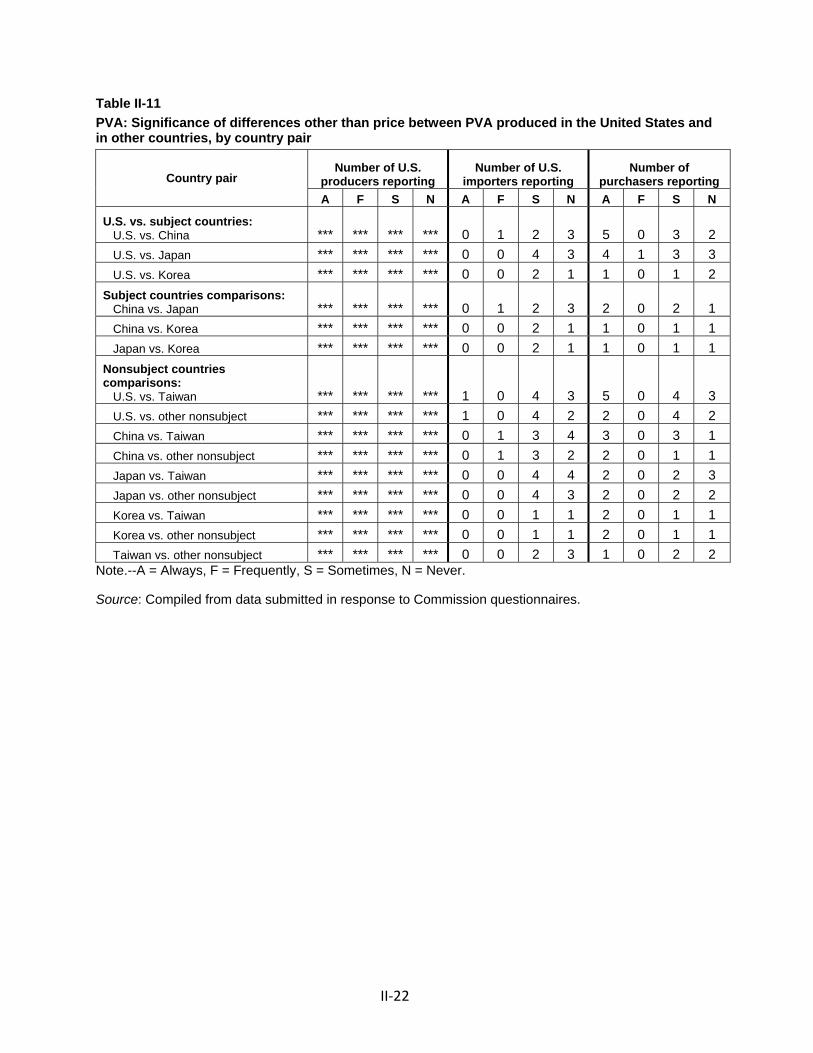
II‐22
Table II-11
PVA: Significance of differences other than price between PVA produced in the United States and in other countries, by country pair
Country pair Number of U.S.
producers reporting Number of U.S.
importers reporting Number of
purchasers reporting
A F S N A F S N A F S N
U.S. vs. subject countries: U.S. vs. China *** *** *** *** 0 1 2 3 5 0 3 2
U.S. vs. Japan *** *** *** *** 0 0 4 3 4 1 3 3
U.S. vs. Korea *** *** *** *** 0 0 2 1 1 0 1 2
Subject countries comparisons: China vs. Japan *** *** *** *** 0 1 2 3 2 0 2 1
China vs. Korea *** *** *** *** 0 0 2 1 1 0 1 1
Japan vs. Korea *** *** *** *** 0 0 2 1 1 0 1 1
Nonsubject countries comparisons: U.S. vs. Taiwan *** *** *** *** 1 0 4 3 5 0 4 3
U.S. vs. other nonsubject *** *** *** *** 1 0 4 2 2 0 4 2
China vs. Taiwan *** *** *** *** 0 1 3 4 3 0 3 1
China vs. other nonsubject *** *** *** *** 0 1 3 2 2 0 1 1
Japan vs. Taiwan *** *** *** *** 0 0 4 4 2 0 2 3
Japan vs. other nonsubject *** *** *** *** 0 0 4 3 2 0 2 2
Korea vs. Taiwan *** *** *** *** 0 0 1 1 2 0 1 1
Korea vs. other nonsubject *** *** *** *** 0 0 1 1 2 0 1 1
Taiwan vs. other nonsubject *** *** *** *** 0 0 2 3 1 0 2 2 Note.--A = Always, F = Frequently, S = Sometimes, N = Never. Source: Compiled from data submitted in response to Commission questionnaires.

II‐23
ELASTICITY ESTIMATES
This section discusses elasticity estimates; there were no comments on these estimates in prehearing briefs.
U.S. supply elasticity
The domestic supply elasticity43 for PVA measures the sensitivity of the quantity supplied by U.S. producers to changes in the U.S. market price of PVA. The elasticity of domestic supply depends on several factors including the level of excess capacity, the ease with which producers can alter capacity, producers’ ability to shift to production of other products, the existence of inventories, and the availability of alternate markets for U.S.‐produced PVA. Analysis of these factors earlier indicates that the U.S. industry has a moderate to large ability to increase or decrease shipments to the U.S. market; an estimate in the range of 4 to 6 is suggested.
U.S. demand elasticity
The U.S. demand elasticity for PVA measures the sensitivity of the overall quantity demanded to a change in the U.S. market price of PVA. This estimate depends on factors discussed earlier such as the existence, availability, and commercial viability of substitute products, as well as the component share of the PVA in the production of any downstream products. Based on the available information, the demand elasticity for PVA is likely to be in the range of ‐0.5 to ‐1.5.
Substitution elasticity
The elasticity of substitution depends upon the extent of product differentiation between the domestic and imported products.44 Product differentiation, in turn, depends upon such factors as quality (e.g., chemistry, appearance, etc.) and conditions of sale (e.g., availability, sales terms/discounts/promotions, etc.). Based on available information, the elasticity of substitution between U.S.‐produced PVA and imported PVA is likely to be in the range of 2 to 4.
43 A supply function is not defined in the case of a non‐competitive market. 44 The substitution elasticity measures the responsiveness of the relative U.S. consumption levels of
the subject imports and the domestic like products to changes in their relative prices. This reflects how easily purchasers switch from the U.S. product to the subject products (or vice versa) when prices change.


III‐1
PART III: CONDITION OF THE U.S. INDUSTRY
OVERVIEW
Background
The information in this section of the report was compiled from responses to the Commission’s questionnaires. Three firms, which accounted for all U.S. production of PVA during 2008‐13 and January‐September 2014, supplied information on their operations in these reviews. Sekisui is the *** domestic producer of the subject form of PVA, accounting for *** percent of U.S. production in 2013. The firm, which acquired the assets of the domestic Celanese PVA businesses in Calvert City, Kentucky, and Pasadena, Texas, on July 1, 2009, reported production of subject and excluded forms of PVA in Calvert City, Kentucky, and Pasadena, Texas, ***. The *** domestic producer of the subject form of PVA is Kuraray America, accounting for *** percent of U.S. production in 2013. Kuraray America, which acquired the DuPont Elvanol® PVA and related businesses on June 1, 2014, reported producing subject and excluded forms of PVA in La Porte, Texas, ***. The *** domestic producer of the subject form of PVA is Eastman, which accounted for *** percent of domestic production in 2013. Eastman, which acquired Solutia on July 2, 2012, reported producing subject forms of PVA in Springfield, Massachusetts, and Trenton, Michigan, ***.
Changes experienced by the industry
Domestic producers were asked to indicate whether their firm had experienced any plant openings, relocations, expansions, acquisitions, consolidations, closures, or prolonged shutdowns because of strikes or equipment failure; curtailment of production because of shortages of materials or other reasons, including revision of labor agreements; or any other change in the character of their operations or organization relating to the production of PVA since January 2008. *** Eastman indicated ***, the firm’s 2013 Annual Report notes that it completed its acquisition of Solutia on July 2, 2012.1 Kuraray and Sekisui reported in their questionnaire responses ***. U.S. producers’ responses to the Commission’s question are detailed in table III‐1.
Table III-1
PVA: Changes in the character of U.S. operations since January 1, 2008
* * * * * * *
1 Eastman 2013 Annual Report, http://www.eastman.com/Company/investors/Pages/Introduction.aspx, accessed on January 29, 2015.

III‐2
Anticipated changes in operations
The Commission asked domestic producers to report anticipated changes in the character of their operations relating to the production of PVA. Eastman and Sekisui reported ***. Kuraray replied as follows: ***.
Kuraray reported ***.2 In particular, it reported ***.
U.S. PRODUCTION, CAPACITY, AND CAPACITY UTILIZATION
The Commission requested information on PVA capacity and production from PVA producers. Their data on PVA capacity, production, and capacity utilization are presented in table III‐2. The U.S. industry’s capacity to produce PVA, which was based on operating *** hours per week and *** weeks per year, has remained relatively stable since 2008, despite *** that resulted in an industry decline of *** percent from 2011 to 2012. Domestic production fell from 2008 to 2009, but fluctuated upward thereafter to a level in 2013 that was *** percent higher than that reported in 2008. Domestic production during January‐September 2014 was *** percent higher than reported in January‐September 2013. A similar trend is shown for domestic capacity utilization, with a decline reported from 2008 to 2009 and a general increase thereafter. Capacity utilization ranged from a low of *** percent (2009) to a high of *** percent (2011).
Table III-2
PVA: U.S. producers’ production, capacity, and capacity utilization, 2008-13, January-September 2013, and January-September 2014
* * * * * * *
Constraints on capacity
Producers were asked to describe the constraints that set the limit of their production capacity. Eastman reported ***. Kuraray reported ***. Kuraray also noted that “***.” Sekisui reported ***. It noted that its PVA business is “***.”
Alternative products
Producers were asked to describe their ability to switch production between subject forms of PVA and other products using the same equipment and/or labor. Eastman reported ***. Kuraray reported ***. Sekisui reported ***. Table III‐3 presents the U.S. producers’ overall capacity and production of PVA and other products.
2 Domestic interested parties’ responses to Commission questions, p. 18.
III‐3
Table III-3
PVA: U.S. producers’ overall capacity, production, and capacity utilization, 2008-13, January-September 2013, and January-September 2014
* * * * * * *
Toll production
Sekisui reported ***. Eastman and Kuraray reported ***.
Foreign trade zone
None of the U.S. PVA producers produce PVA in and/or admit PVA into a foreign trade zone (“FTZ”) and none were aware of any firms in the United States that import PVA into a FTZ for use in distribution of PVA and/or the production of downstream articles.
U.S. PRODUCERS’ U.S. SHIPMENTS AND EXPORTS
Table III‐4 presents U.S. producers’ U.S. shipments, export shipments, and total shipments. The quantity of U.S. producers’ U.S. shipments, which accounted for between *** to *** percent of U.S. producers’ total shipments, declined from 2008 to 2009, increased from 2009 to 2012, and declined in 2013 to a level that was *** percent higher than reported for 2008. U.S. shipments were *** percent higher in January‐September 2014 than in January‐September 2013. U.S. commercial shipments were consistently the *** component of overall U.S. shipments, accounting for between *** and *** percent of total shipments. The unit values of commercial U.S. shipments ranged from $*** per pound in 2009 to $*** per pound in 2011, whereas the unit value of internal U.S. consumption ranged from $*** per pound in 2008 to $*** per pound in January‐September 2014.
Table III-4
PVA: U.S. producers’ U.S. shipments, export shipments, and total shipments, 2008-13, January-September 2013, and January-September 2014
* * * * * * *
U.S. producers’ exports, which accounted for between *** and *** percent of U.S. producers’ total shipments, followed a similar trend as U.S. shipments, falling from 2008 to 2009 and generally increasing from 2009 to 2012, then declining in 2013. U.S. producers’ exports were lower in January‐September 2014 than in January‐September 2013, however, in contrast to their U.S. shipments. Sekisui, which has related PVA facilities in Spain and Japan, reported *** exports *** to ***. Kuraray reported *** exports to ***.

III‐4
End use applications
Table III‐5 presents the shares of U.S. producers’ U.S. shipments, export shipments, and total shipments, by end use application. The largest use for domestically produced PVA in the United States is in the production of PVB, accounting for *** percent of total U.S. shipments during 2013 and January‐June 2014.
Table III-5
PVA: Shares of U.S. producers’ U.S. shipments, export shipments, and total shipments, by end use, 2013 and January-September 2014
* * * * * * *
Hydrolysis levels
Table III‐6 presents the shares of U.S. producers’ U.S. shipments, export shipments, and total shipments, by hydrolysis level. These data show that during 2013 and January‐September 2014 *** of U.S. shipments of domestically produced PVA was hydrolyzed to a level greater than or equal to 97 percent. *** U.S. producer reported shipments of subject forms of PVA hydrolyzed to a level greater than 80 percent but less than or equal to 85 percent.
Table III-6
PVA: Shares of U.S. producers’ U.S. shipments, export shipments, and total shipments, by hydrolysis level, 2013 and January-September 2014
* * * * * * *
U.S. PRODUCERS’ INVENTORIES
Table III‐7 presents domestic producers’ end‐of‐period inventories of PVA. The domestic industry’s inventories of PVA fluctuated from 2008 to 2013, with the lowest level of inventories reported at year end 2009 and the highest level reported at year end 2011. Inventories held at the end of September 2014 were higher than for the same time period in 2013. The U.S. producers’ ratio of inventories to total shipments fluctuated between a low of *** percent reported at year end 2010 and a high of *** percent at year end 2011.
Table III-7
PVA: U.S. producers’ inventories, 2008-13, January-September 2013, and January-September 2014
* * * * * * *
III‐5
U.S. PRODUCERS’ IMPORTS AND PURCHASES
Table III‐8 presents direct imports and purchases of subject forms of PVA by U.S. producers, as well as their production of subject forms of PVA. Also presented in table III‐8 are ***.
Table III-8
PVA: U.S. producers’ U.S. production and U.S. producers’ and related importers’ U.S. imports, purchases of imports, and ratios of imports to U.S. production of subject forms of PVA, 2008-13, January-September 2013, and January-September 2014
* * * * * * *
Kuraray America reported ***, but it has directly imported subject forms (as well as excluded forms) of PVA from ***. Kuraray America is also indirectly related to MonoSol, a U.S. importer of subject forms of PVA from ***.3 Kuraray America indicated that it has imported PVA in the past ***. Kuraray America explains that ***.
Sekisui reported that it has directly imported excluded and subject forms of PVA from ***. It explained that ***. Sekisui also reported that it has directly imported excluded forms of PVA from ***.4 Additionally, Sekisui ***. Sekisui explained the reasoning as follows: ***.
U.S. EMPLOYMENT, WAGES, AND PRODUCTIVITY
Data provided by U.S. producers on the number of production related workers (“PRWs”) engaged in the production of PVA, the total hours worked by such workers, and wages paid to such PRWs are presented in table III‐9. After reported highs of *** PRWs working *** hours in 2008, the numbers of workers and hours worked decreased in 2009‐10, increased in 2011‐12, and fell in 2013 to a level that was *** percent and *** percent lower, respectively, than reported in 2008. Although fluctuations in other employment indicators were also reported for 2008‐13, wages paid, hours worked per PRW, hourly wages, and productivity were higher in 2013 than in 2008. Unit labor costs, which were $*** per pound in 2008, fluctuated from a high of $*** per pound in 2009 to a low of $*** per pound in 2011, before settling once again at $*** per pound during 2013 and the first three quarters of 2014.
3 Kuraray America’s parent Kuraray Holdings U.S.A. wholly owns MonoSol Holdings, Inc., which in turn wholly owns MonoSol LLC (MonoSol), an importer of subject PVA from ***. Kuraray America’s U.S. Importer Questionnaire at I‐3, I‐4.
4 Sekisui’s parent company, Sekisui Chemical Co., jointly owns (*** percent‐share) DS Poval Co., Ltd., a manufacturer of PVA in Japan. The other joint venture owner, DKK, is the majority shareholder (*** percent) of Japanese PVA producer DS Poval Co., Ltd. DKK’s wholly owned U.S. affiliate Denka reported direct U.S. imports of excluded forms of PVA from ***.
III‐6
Table III-9
PVA: Average number of production related workers, hours worked, wages paid to such employees, hourly wages, productivity, and unit labor costs, 2008-13, January-September 2013, and January-September 2014
* * * * * * *
PART III: FINANCIAL EXPERIENCE OF U.S. PRODUCERS
Background
The same three firms, Eastman, Kuraray America, and Sekisui, that provided production and shipment data reported useable financial data on their operations on PVA.5 Each of these firms has a December 31 fiscal year end or provided data on a calendar year basis; there are only small differences between the trade and financial sections of the Commission’s questionnaire, which are due to rounding. These data accounted for all known U.S. production of PVA in 2013.
Operations on PVA
Table III‐10 presents aggregated data on U.S. producers’ operations in relation to PVA from January 1, 2008 through September 30, 2014, while table III‐11 presents selected company‐specific financial data.6 In brief, sales and costs were *** lower in 2009 than in 2008 because of the effects of the recession; sales rose thereafter to a higher level in 2012 before declining in 2013 while costs and expenses rose from 2009 to 2012 and were flat to *** higher between 2012 and 2013. The quantity and value of total net sales were *** higher in January‐
5 On July 2, 2012, Eastman Chemical Co. announced that it completed its acquisition of Solutia Inc. for approximately $4.8 billion. Eastman press release, “Eastman completes acquisition of Solutia,” http://www.eastman.com/company/news_center /2012, retrieved January 26, 2015. Solutia was formed on September 1, 1997 as a divestiture from the Monsanto Co. chemical business; it underwent restructuring pursuant to bankruptcy proceedings from December 17, 2003 to February 28, 2008. As previously indicated, Eastman (formerly Solutia) provided data for the firm’s internal consumption of PVA for the production of PVB film grade resin.
On June 1, 2014, Kuraray America acquired DuPont’s Elvanol® PVA and related businesses, which included the production facility at LaPorte, Texas and the Poval business unit. This latter unit was an importing and resale business but broke ground for a new plant (also in LaPorte, Texas) in 2013 and is expected to begin producing in 2015. DuPont provided Kuraray America with its financial data for the period January 1, 2008 through May 31, 2014.
On July 1, 2009, Sekisui America Corp. acquired Celanese Corporation’s PVA Business Unit, consisting of two PVA plants at Calvert City, Kentucky, and Pasadena, Texas, and renamed the business Sekisui Specialty Chemicals America, LLC. Sekisui has operated both plants and provided data for the period July 1, 2009 through September 30, 2014. ***.
6 Financial data for commercial sales only are presented in appendix C, table C‐2.
III‐7
September 2014 than in January‐September 2013. Total costs and expenses (total cost of goods sold (“COGS”) plus selling, general and administrative (“SG&A”) expenses) also were *** lower in 2009 than in 2008 but rose from 2010 to 2013 and were greater in interim 2014 than in interim 2013. Operating income increased from 2008 to a high point in 2011, then declined from that year to 2013, and was lower in January‐September 2014 than in the comparable period one year earlier. Net income before taxes and cash flow followed the trend in operating income—increasing between 2008 and 2011, declining between 2011 and 2013, and lower in interim 2014 compared with interim 2013.
Table III-10 PVA: Results of operations of U.S. producers, 2008-13, January-September 2013, and January-September 2014
* * * * * * *
Table III-11 PVA: Results of operations of U.S. producers, by firm, 2008-13, January-September 2013, and January-September 2014
* * * * * * *
Total net sales
Total net sales (table III‐10) include the commercial sales of ***, internal consumption reported by ***, and transfers to related firms reported by ***.7 ***. Total sales fell between 2008 and 2009, mostly due to the lower quantity and value of commercial sales. Commercial sales and internal consumption recovered from their recession levels, rose after 2009, and irregularly increased from 2010 to 2013. Transfers to related firms likewise increased between 2009 and 2010 but declined irregularly thereafter. The average unit value of total sales increased irregularly from 2008 to 2011 and then declined from 2011 to 2013; it was greater in January‐September 2014 than in January‐September 2013, reflecting the higher unit value of transfers to related parties and internal consumption.
Table III‐11 shows the sales experience of each firm. Each firm’s sales fell between 2008 and 2009 consistent with the recession. ***. The average unit value of total sales of the three firms together fell between 2008 and 2009, recovered in 2010 and rose to a high point in 2011 but was *** lower in 2012 and 2013.
7 As noted earlier, ***. Responding firms converted the values of internal consumption and transfers to related firms from a transfer price to a market based price for purposes of reporting questionnaire data. For example, see ***.

III‐8
Costs and expenses
As noted earlier in Part I of this report, PVA is manufactured by first combining ethylene with acetic acid8 to produce vinyl acetate monomer (“VAM”),9 polymerizing the VAM into polyvinyl acetate, and then hydrolyzing the acetate groups with methanol in the presence of anhydrous sodium methylate or aqueous sodium hydroxide at moderate temperatures and pressures. As shown in table III‐10, raw material costs represent the single largest component of overall COGS, averaging approximately *** percent of total COGS during 2008‐13 (ranging from *** percent in 2009 to *** percent in 2011) and *** percent of total COGS in the interim periods. Raw material costs as a percentage of total net sales value ranged from *** percent in 2009 to *** percent in 2013 and increased irregularly from 2008 to 2013. VAM is the main raw material input for the production of PVA and periodic shortages have led to price increases for this material.10 With regard to raw material costs of the three reporting U.S. firms: *** raw materials are valued at fair market value ***. ***.11 Likewise, ***.12 In this regard, ***.13 The production of PVA generates byproducts, which may be used to produce PVA or sold. If reused, the accounting is to offset costs by issuing a credit for the fair market value of the byproduct; that credit practice may then offset (reduce) production costs. If sold, the proceeds are classified as a credit to production costs or as revenue. Table III‐12 provides information on raw material costs by firm.
Table III-12 PVA: Raw material costs of U.S. producers, by firm, 2008-13, January-September 2013, and January-September 2014
* * * * * * *
8 Ethylene is produced by refining petroleum raw materials or from ethane, which is a natural gas derivative; acetic acid may be produced through the aerobic bacterial oxidation of alcohol or the fermentation of dilute alcohol. Methanol is manufactured by the high‐pressure organic synthesis of carbon monoxide and hydrogen. According to ***, costs of VAM are primarily driven by global ethylene costs; the firm also stated that tightness in U.S. VAM supply in 2014 caused VAM prices to increase while ethylene prices decreased. Questionnaire response of ***.
9 Celanese transferred acetic acid and VAM, which it produced, to its plants that produced PVA. When Sekisui acquired the two U.S. plants making PVA from Celanese, ***. Eastman ***.
10 For example, ***. Questionnaire response of ***. Another firm, ***, states that “VAM capacity closures in Europe in 2013 and a worldwide supply crisis in 2014 will result in a rebalancing of international trade flows and probably a structural increase in VAM market prices.” Questionnaire response of ***. According to ***, costs of VAM are primarily driven by global ethylene costs, although it states that tightness in U.S. VAM supply in 2014 caused VAM prices to increase while ethylene prices decreased. Questionnaire response of ***.
11 ***. Questionnaire response of ***. 12 ***. Questionnaire response of ***. 13 ***. Questionnaire response of ***.

III‐9
The sale or use of byproducts generated from the production of PVA provides some compensation for the cost of VAM, as described earlier. Acetic acid recovery was reported by ***; ***. The value of byproducts that were reported by the U.S. firms is shown in table III‐13.
Table III-13
PVA: Byproduct credits reported by U.S. firms, by firm, 2008-13, January-September 2013, and January-September 2014
* * * * * * *
Average raw material costs, direct labor, and other factory costs (i.e., conversion costs) vary from company to company. These costs generally reflect underlying differences in input costs and conversion costs (labor and overhead). The highest average raw material costs as a ratio to sales (as revised) were reported by ***. After raw materials, the largest component of reported COGS is other factory costs, which as a ratio to sales irregularly declined from 2008 to 2013.14 Direct labor costs, the smallest component of COGS, rose irregularly between 2008 and 2013 as a ratio to sales and on a per‐unit basis. As shown in tables III‐10 and III‐11, total COGS rose irregularly from 2008 to 2013 and was greater in January‐September 2014 than in the same period one year earlier. The ratio of COGS to total net sales and the per‐unit value of total COGS followed a similar trend. Total SG&A expenses increased irregularly in absolute dollars, as a ratio to sales, and on a per‐unit basis from 2008 to 2013.15
Profitability
Table III‐10 shows that the industry’s gross profit rose *** from 2008 to 2011 but declined from 2011 through 2013; gross profit was lower in January‐September 2014 than in the period one year earlier. Operating income also rose *** from 2008 to 2011 but fell from that year to 2013 and was *** lower in January‐September 2014 than in January‐September 2013. While *** of the firms reported positive results on a gross profit level, *** on an operating profit basis, as shown in table III‐11. For example, ***. Net income before taxes and cash flow generally followed the trends of operating income/(loss) for the industry and for each firm.
14 ***. ***. 15 SG&A expense data reported by ***.

III‐10
Variance analysis
A variance analysis for the operations of U.S. producers of PVA is presented in table III‐14.16 The information for this variance analysis is derived from and is consistent with table III‐10. As the data depict, operating income increased between 2008 and 2013, attributable to a favorable net cost/expense variance (unit costs and expenses decreased between the periods) that was greater than the unfavorable price variance (unit sales values decreased). Between 2011‐12 and 2012‐13 operating income fell because of the combination of an unfavorable price variance (unit sales values fell) and net cost/expense variance (unit costs and expenses increased). Operating income was lower in January‐June 2014 than in January‐September 2013 because the favorable price variance was lower than an unfavorable net cost/expense variance.
Table III-14 PVA: Variance analysis on the operations of U.S. producers, 2008-13, January-September 2013, and January-September 2014
* * * * * * *
Capital expenditures and research and development expenses
Table III‐15 presents capital expenditures and research and development (“R&D”) expenses by firm. Total capital expenditures increased irregularly from 2008 to 2013 and were lower in interim 2014 than in interim 2013. *** from 2008 to September 2014. Each of the three reporting firms provided data on their R&D expenses, ***. Reported R&D expenses declined irregularly from 2008 to 2013 and were *** lower in January‐September 2014 than in the interim period one year earlier.
16 The Commission’s variance analysis is calculated in three parts: Sales variance, cost of sales variance (COGS variance), and SG&A expense variance. Each part consists of a price variance (in the case of the sales variance) or a cost or expense variance (in the case of the COGS and SG&A expense variance), and a volume variance. The sales or cost/expense variance is calculated as the change in unit price or per‐unit cost/expense times the new volume, while the volume variance is calculated as the change in volume times the old unit price or per‐unit cost/expense. Summarized at the bottom of the table, the price variance is from sales; the cost/expense variance is the sum of those items from COGS and SG&A variances, respectively, and the volume variance is the sum of the volume components of the net sales, COGS, and SG&A expense variances. The overall volume component of the variance analysis is generally small.

III‐11
Table III-15 PVA: Capital expenditures and research and development expenses of U.S. producers, 2008-13, January-September 2013, and January-September 2014
* * * * * * *
Kuraray America stated that “***.”17 Sekisui stated “***.”18 Eastman ***.19
Assets and return on investment
Table III‐16 presents data on the U.S. producers’ total assets as well as the ratio of operating income (or loss) to total assets. The total value of net assets increased from 2009 through 2013 largely due to the ***. The ratio of operating income to total assets increased to a high point in 2011 before declining in 2012 and 2013.
Table III-16 PVA: U.S. producers’ total assets and ratio of operating income to total assets, 2008-13
* * * * * * *
17 Questionnaire response of Kuraray America, section III‐15b. 18 Questionnaire response of Sekisui, section III‐15b. 19 Questionnaire response of Eastman, section III‐15b.

IV‐1
PART IV: U.S. IMPORTS AND THE FOREIGN INDUSTRIES
U.S. IMPORTS
Overview
The Commission issued U.S. importers’ questionnaires to 47 firms identified as possible U.S. importers of PVA. Twenty‐three firms provided data and information in response to the questionnaire, 15 firms indicated that they did not import PVA, and nine firms did not provide a response.1 Firms responding to the Commission’s questionnaire accounted for the following shares of PVA imports (as a share of official import statistics, by quantity) during January 2008‐September 2014:
*** percent of total U.S. imports of PVA from China;2
*** percent of total U.S. imports of PVA from Japan; and3
*** percent of the total U.S. imports of PVA from all nonsubject countries.4
Import data presented in this report for Japan are based on official Commerce statistics (HTS subheading 3905.30.00), as adjusted to exclude all non‐dutied merchandise identified by proprietary Customs documents. Import data presented for China and all nonsubject countries are based on official Commerce statistics, as adjusted to remove the excluded forms of PVA imported from nonsubject countries reported in questionnaire responses. Since there are believed to have been no U.S. imports of PVA from Korea since January 2008, the minor amounts of import data (as reported in official Commerce statistics) have been removed from the presentation for Korea in this report.
1 Five of the nine firms that did not provide a response were identified by domestic producers during the adequacy phase of these reviews as possible importers but were not identified by proprietary Customs documents as U.S. importers of record for PVA. Of the remaining four non‐responding firms, one firm (***) is believed to have accounted for approximately *** percent of imports from all countries other than China, Japan, Korea, and Taiwan during January 2008‐September 2014, two firms (***) are believed to be incorrectly identified as importers of subject PVA from Korea, and one firm (***) accounted for *** percent of PVA imports from Japan during January 2008‐September 2014. ***.
2 Five firms responded to the Commission’s questionnaire providing data on U.S. imports of the subject forms of PVA from China. There were no reported imports of excluded forms of PVA from China.
3 Fourteen firms responded to the Commission’s questionnaire providing data on U.S. imports of PVA from Japan, six of which reported imports of the subject forms of PVA and ten of which reported imports of excluded forms of PVA.
4 Twelve firms responded to the Commission’s questionnaire providing data on U.S. imports of PVA from all nonsubject sources (primarily Taiwan), nine of which reported imports of the subject forms of PVA and five of which reported imports of the excluded forms of PVA.
IV‐2
Imports from subject and nonsubject countries
Table IV‐1 presents information on U.S. imports of subject forms of PVA from China, Japan, Korea, Taiwan, and all other sources during 2008‐13, January‐September 2013, and January‐September 2014. Imports from China increased from 1.4 million pounds in 2008 to 12.4 million pounds in 2013 and were 16.1 percent higher in January‐September 2014 than in January‐September 2013. The share of total U.S. imports held by U.S. imports from China increased from *** percent in 2008 to *** percent in 2013 and was higher at *** percent in January‐September 2014. A general increase from 2008 to 2013 was also reported for U.S. imports from Japan, albeit at much lower levels. Imports from Japan increased from *** pounds in 2008 to *** pounds in 2013. Imports from Japan were *** percent lower in January‐September 2014 than in January‐September 2013. The share of total U.S. imports held by U.S. imports from Japan remained at *** percent or less during January 2008‐September 2014. As previously noted, there are believed to have been no U.S. imports of PVA from Korea since January 2008.
Although Taiwan is by far the leading nonsubject source supplier, U.S. imports from Taiwan declined overall in absolute and relative terms since 2008. U.S. imports of PVA from Taiwan decreased by *** percent from *** pounds in 2008 to *** pounds in 2013. U.S. imports from Taiwan were modestly lower in January‐September 2014 than in the comparable period of 2013. The share of total U.S. imports accounted for by U.S. imports from Taiwan declined from *** percent in 2008 to *** percent in 2013 and was even lower at *** percent in January‐September 2014. U.S. imports of PVA from all other nonsubject sources combined, on the other hand, increased by *** percent from 2008 to 2013 and were higher in January‐September 2014 than in the comparable period of 2013.5 The share of total U.S. imports held by U.S. imports from all other nonsubject sources combined increased from *** percent in 2008 to *** percent in 2013 and was higher at *** percent in January‐September 2014.
The unit values of U.S. imports from China, ranging from $0.99 to $1.16 per pound, were among the lowest reported; whereas the unit values of U.S. imports from Japan, ranging from $*** to $*** per pound, were among the highest. The unit values of U.S. imports from Taiwan ranged from $*** to $*** per pound and the unit values of U.S. imports from all other nonsubject sources ranged from $*** to $*** per pound.
The ratio of U.S. imports from Japan to U.S. production remained at *** percent, whereas the ratio of U.S. imports from China to U.S. PVA production increased from *** percent in 2008 to *** percent in 2013 and was higher in January‐September 2014 at *** percent.
5 Other primary nonsubject countries include Germany and Singapore.

IV‐3
Table IV-1
PVA: U.S. imports by source, 2008-13, January-September 2013, and January-September 2014
Item
Calendar year January to September
2008 2009 2010 2011 2012 2013 2013 2014
Quantity (1,000 pounds)
U.S. imports from-- China 1,449 5,776 7,904 6,525 11,394 12,399 9,385 10,892
Japan *** *** *** *** *** *** *** ***
Korea 0 0 0 0 0 0 0 0
Subject sources *** *** *** *** *** *** *** ***
Taiwan *** *** *** *** *** *** *** ***
All other sources *** *** *** *** *** *** *** ***
Nonsubject sources *** *** *** *** *** *** *** ***
Total U.S. imports *** *** *** *** *** *** *** ***
Value (1,000 dollars)
U.S. imports from-- China 1,675 5,738 7,861 6,965 11,870 12,496 9,462 11,386
Japan *** *** *** *** *** *** *** ***
Korea 0 0 0 0 0 0 0 0
Subject sources *** *** *** *** *** *** *** ***
Taiwan *** *** *** *** *** *** *** ***
All other sources *** *** *** *** *** *** *** ***
Nonsubject sources *** *** *** *** *** *** *** ***
Total U.S. imports *** *** *** *** *** *** *** ***
Unit value (dollars per pound)
U.S. imports from-- China 1.16 0.99 0.99 1.07 1.04 1.01 1.01 1.05
Japan *** *** *** *** *** *** *** ***
Korea --- --- --- --- --- --- --- ---
Subject sources *** *** *** *** *** *** *** ***
Taiwan *** *** *** *** *** *** *** ***
All other sources *** *** *** *** *** *** *** ***
Nonsubject sources *** *** *** *** *** *** *** ***
Total U.S. imports *** *** *** *** *** *** *** ***Table continued on following page.

IV‐4
Table IV-1--Continued
PVA: U.S. imports by source, 2008-13, January-September 2013, and January-September 2014
Item
Calendar year January to September
2008 2009 2010 2011 2012 2013 2013 2014
Share of quantity (percent)
U.S. imports from-- China *** *** *** *** *** *** *** ***
Japan *** *** *** *** *** *** *** ***
Korea 0.0 0.0 0.0 0.0 0.0 0.0 0.0 0.0
Subject sources *** *** *** *** *** *** *** ***
Taiwan *** *** *** *** *** *** *** ***
All other sources *** *** *** *** *** *** *** ***
Nonsubject sources *** *** *** *** *** *** *** ***
Total U.S. imports 100.0 100.0 100.0 100.0 100.0 100.0 100.0 100.0
Share of value (percent)
U.S. imports from-- China *** *** *** *** *** *** *** ***
Japan *** *** *** *** *** *** *** ***
Korea 0.0 0.0 0.0 0.0 0.0 0.0 0.0 0.0
Subject sources *** *** *** *** *** *** *** ***
Taiwan *** *** *** *** *** *** *** ***
All other sources *** *** *** *** *** *** *** ***
Nonsubject sources *** *** *** *** *** *** *** ***
Total U.S. imports 100.0 100.0 100.0 100.0 100.0 100.0 100.0 100.0
Ratio to U.S. production (percent)
U.S. imports from-- China *** *** *** *** *** *** *** ***
Japan *** *** *** *** *** *** *** ***
Korea 0.0 0.0 0.0 0.0 0.0 0.0 0.0 0.0
Subject sources *** *** *** *** *** *** *** ***
Taiwan *** *** *** *** *** *** *** ***
All other sources *** *** *** *** *** *** *** ***
Nonsubject sources *** *** *** *** *** *** *** ***
Total U.S. imports *** *** *** *** *** *** *** ***
Source: Compiled from official Commerce statistics, as adjusted using data submitted in response to Commission questionnaires and proprietary Customs data.
IV‐5
U.S. importers’ imports subsequent to September 30, 2014
The Commission requested importers to indicate whether they had imported or arranged for the importation of PVA from China, Japan, Korea, Taiwan, and all other sources combined for delivery after September 30, 2014. Twelve firms indicated that they had arranged such imports and provided quarterly data for their arranged imports for October 2014 to September 2015. Four firms reported arranged imports of PVA from China, three firms reported arranged imports from Japan, six firms reported arranged imports from Taiwan, and one reported arranged imports from all other nonsubject sources. Table IV‐2 presents data provided by U.S. importers on such arranged imports.
Table IV-2
PVA: Arranged U.S. imports by source, October-December 2014, January-March 2015, April-June 2015, and July-September 2015
* * * * * * *
Excluded forms of PVA
Table IV‐3 presents U.S. imports of excluded forms of PVA. U.S. imports from Japan comprised the *** share of such imports in each annual and interim period.
CUMULATION CONSIDERATIONS
In assessing whether U.S. imports from the subject countries are likely to compete with each other and with the domestic like product, the Commission has generally considered four factors: (1) fungibility, (2) presence of sales or offers to sell in the same geographical markets, (3) common or similar channels of distribution, and (4) simultaneous presence in the market. Information regarding channels of distribution appears in Part II of this report. Additional information concerning fungibility, geographical markets, and simultaneous presence in the market is presented below.
Fungibility
One of the largest end use applications in the United States for PVA is PVB. Kuraray America and Sekisui reported the production of PVA for most major applications; in contrast, Eastman reported the production of PVA *** for PVB applications. Table IV‐4 presents U.S. shipments of PVA produced in the United States and U.S. imports of subject forms of PVA from each subject country, by end use application, during 2013 and January‐September 2014. Table IV‐5 presents the quantities and shares of PVA by hydrolysis range for the United States and each of the subject countries for 2013 and January‐September 2014.
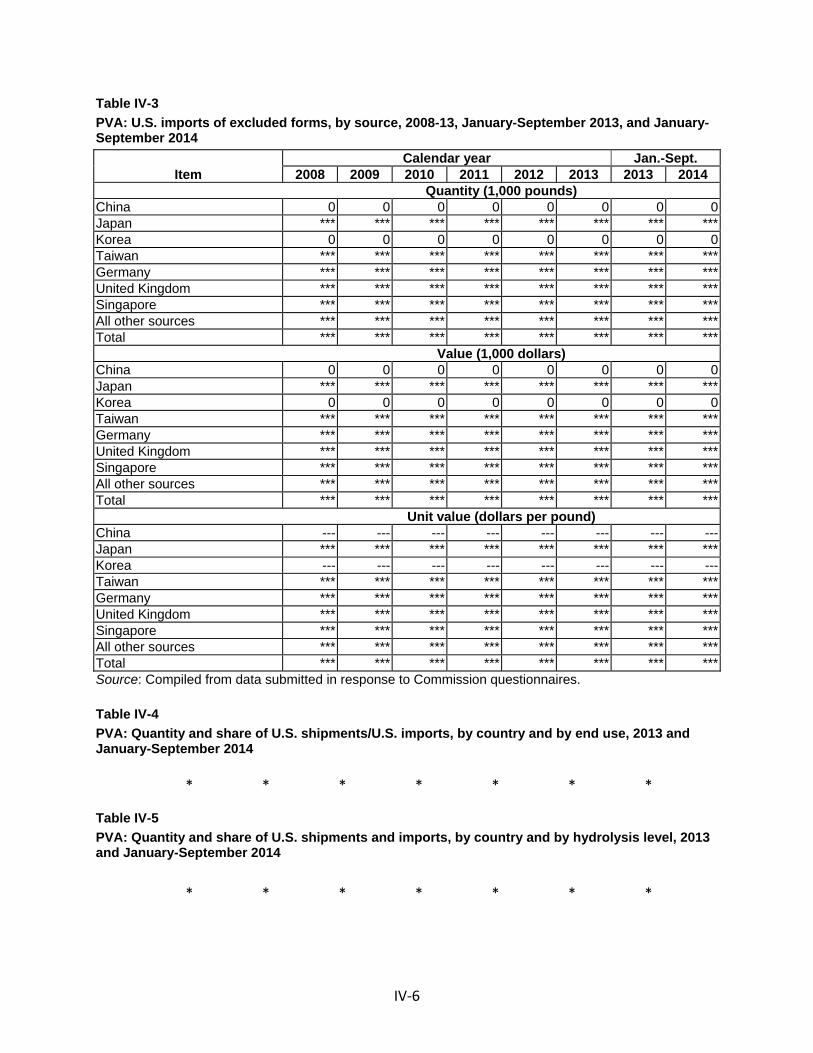
IV‐6
Table IV-3
PVA: U.S. imports of excluded forms, by source, 2008-13, January-September 2013, and January-September 2014
Item Calendar year Jan.-Sept.
2008 2009 2010 2011 2012 2013 2013 2014 Quantity (1,000 pounds)
China 0 0 0 0 0 0 0 0Japan *** *** *** *** *** *** *** ***Korea 0 0 0 0 0 0 0 0Taiwan *** *** *** *** *** *** *** ***Germany *** *** *** *** *** *** *** ***United Kingdom *** *** *** *** *** *** *** ***Singapore *** *** *** *** *** *** *** ***All other sources *** *** *** *** *** *** *** ***Total *** *** *** *** *** *** *** ***
Value (1,000 dollars) China 0 0 0 0 0 0 0 0Japan *** *** *** *** *** *** *** ***Korea 0 0 0 0 0 0 0 0Taiwan *** *** *** *** *** *** *** ***Germany *** *** *** *** *** *** *** ***United Kingdom *** *** *** *** *** *** *** ***Singapore *** *** *** *** *** *** *** ***All other sources *** *** *** *** *** *** *** ***Total *** *** *** *** *** *** *** ***
Unit value (dollars per pound) China --- --- --- --- --- --- --- ---Japan *** *** *** *** *** *** *** ***Korea --- --- --- --- --- --- --- ---Taiwan *** *** *** *** *** *** *** ***Germany *** *** *** *** *** *** *** ***United Kingdom *** *** *** *** *** *** *** ***Singapore *** *** *** *** *** *** *** ***All other sources *** *** *** *** *** *** *** ***Total *** *** *** *** *** *** *** ***Source: Compiled from data submitted in response to Commission questionnaires.
Table IV-4
PVA: Quantity and share of U.S. shipments/U.S. imports, by country and by end use, 2013 and January-September 2014
* * * * * * *
Table IV-5
PVA: Quantity and share of U.S. shipments and imports, by country and by hydrolysis level, 2013 and January-September 2014
* * * * * * *

IV‐7
Presence in the market
As previously indicated, there are believed to have been no U.S. imports of PVA from Korea since January 2008. Although the quantities of subject imports from Japan have been relatively limited, Japanese producers have shipped much larger quantities of excluded forms of PVA. U.S. dutied PVA imports from Japan have entered the U.S. market in 50 of the 81 months from January 2008 and September 2014. U.S. imports of PVA from China have entered the U.S. market in 78 of the 81 months between January 2008 and September 2014.6
Geographical markets
Table IV‐6 presents U.S. imports of PVA from China, Japan, and Korea during January 2008‐September 2014, by Customs entry district. More than one‐half of U.S. imports of PVA from China entered the United States through Charleston, South Carolina and one‐fifth entered through New York, New York. Primary entry districts for U.S. imports of dutied PVA from Japan during January 2008‐September 2014 are Chicago, Illinois, New Orleans, Louisiana, and Los Angeles, California.
U.S. IMPORTERS’ INVENTORIES
Data relating to U.S. importers’ inventories of PVA are presented in table IV‐7. As the data illustrate, inventories of subject imports (primarily from China) increased overall from 2008 to 2013. Subject inventories, as well as inventories of PVA from Taiwan and all other sources, were *** higher in January‐September 2014 than they were during the same period in 2013. Taiwan was *** and China was ***. The largest source of import inventories ***. *** accounted for *** inventories of U.S. imports from China, and *** accounted for *** U.S. imports from Taiwan and *** inventories of U.S. imports from all other nonsubject sources.
6 Compiled from proprietary Customs data.

IV‐8
Table IV-6
PVA: U.S. imports from subject sources, by Customs entry district, January 2008-September 2014
District
China Japan
Quantity (1,000 pounds) Share (percent)
Quantity (1,000 pounds) Share (percent)
Anchorage, AK (1) (2) *** ***Boston, MA -- -- *** ***Buffalo, NY 89 0.2 *** *** Charleston, SC 28,903 51.3 *** ***Chicago, IL 5,739 10.2 *** ***Cleveland, OH -- -- *** ***Columbia-Snake, OR 3,011 5.3 *** *** Dallas-Fort Worth, TX 382 0.7 *** *** Detroit, MI 508 0.9 *** *** Los Angeles, CA 5,279 9.4 *** ***Miami, FL 1 (2) *** *** Minneapolis, MN -- -- *** ***Mobile, AL -- -- *** ***New Orleans, LA 73 0.1 *** ***New York, NY 11,638 20.7 *** *** Norfolk, VA 2 (2) *** *** San Francisco, CA 1 (2) *** *** San Juan, PR 37 0.1 *** *** Savannah, GA 463 0.8 *** ***Seattle, WA 212 0.4 *** ***
Total 56,338 100.0 *** 100.01 Less than 500 pounds. 2 Less than 0.05 percent. Source: Compiled from official Commerce statistics, as adjusted using proprietary Customs data for Japan. Table IV-7
PVA: U.S. importers’ end-of-period inventories of imports, by source, 2008-13, January-September 2013, and January-September 2014
* * * * * * *
IV‐9
THE INDUSTRY IN CHINA
Overview
In the original investigations and first five‐year reviews, the Commission collected data from Sinopec Sichuan Vinylon Works (“SVW”), the Chinese manufacturer/exporter that accounted for *** of China’s reported exports of PVA to the United States during 2000‐02. The Commission noted in the first five‐year reviews, however, that while SVW had been a primary exporter of Chinese PVA to the U.S. market, it was only one of approximately 14 firms believed to have produced PVA in China at that time. As noted in Part I, Commerce has completed two administrative reviews of SVW’s antidumping duty margins for 2003‐04 and 2004‐05, in which it calculated 0.03 percent (de minimis) and 0.00 percent antidumping margins for SVW, respectively.
In these second five‐year reviews, the Commission issued foreign producer questionnaires to 19 firms identified as possible producers of PVA in China.7 Despite repeated attempts by staff to elicit responses from Chinese producers, only one small exporting firm that accounted for *** percent of PVA exports from China to the United States during January 2008‐September 2014 provided a response to the Commission’s questionnaire.
Table IV‐8 presents known Chinese producers of PVA, their capacity to produce PVA in China, and information concerning certain changes in the character of their operations. There are believed to be at least 15 producers of PVA in China today. The largest *** Chinese producers account for approximately *** percent of the total capacity to produce PVA in China. SVW was believed to be the *** PVA producer in China during 2013, accounting for approximately *** percent of the total capacity to produce PVA in China in that year. However, projections indicate that Inner Mongolia Shuangxin Chemical Co., Ltd., which began production of PVA in 2011, will have ***. In addition, several new PVA plants in China were approved or were under construction as of 2013.8
7 Two of the 19 firms are believed to have closed their PVA facilities in China. Guizhou Crystal Organic Chemical (Group) Co., Ltd. and Lanzhou Xinxibu Vinylon Industry Co., Ltd. reportedly closed their PVA facilities after 2011. A third firm, Jiangxi Chemical Fibre and Chemical Engineering Co. Ltd. idled its PVA plant following an explosion in the PVA unit that interrupted operations in September 2011. Chemical Economics Handbook: Polyvinyl Alcohols, IHS Chemical, June 2013, pp. 58‐59. Multiple attempts to contact two additional firms (Shijiazhuang Chemical Technology and Chemical Fibre Co., Ltd. and Sinopro Sichuan Vinylon Works) were unsuccessful as contact information for these firms was found to be invalid.
8 Some PVA construction projects in China that were reported to have been approved or under construction as of 2013 have since been cancelled. Email from ***, April 2, 2015.

IV‐10
Table IV-8
PVA: Producers of PVA in China, production capacity in 2013 and 2017 (forecasted), and changes in the character of operations
* * * * * * *
PVA operations
As previously noted, no responses to the Commission’s foreign producer questionnaire were received from producers of PVA from China; therefore, information presented in this report for the Chinese industry has largely been obtained from secondary sources.
Since the Commission conducted its original investigations and its first five‐year reviews, China has experienced marked expansion in its capacity to produce PVA. PVA capacity in China, which was estimated to be *** metric tons (*** pounds) in 2002 and (*** metric tons (*** pounds) in 2006, grew to *** metric tons (*** pounds) in 2013. Industry projections expect further growth in the next several years, reaching *** metric tons (*** pounds) by 2017.9
Table IV‐9 presents salient statistics for the PVA industry in China during 2002 (final annual period of original investigations), 2007 (final annual period of first five‐year reviews), and 2008‐12. These data indicate that Chinese production of PVA, as well as apparent consumption in China, is reported to have increased since 2002. Since the Commission’s first five‐year review, production of PVA in China grew by *** percent from *** metric tons (*** pounds) in 2008 to *** metric tons (*** pounds) in 2012. These data indicate that the Chinese PVA industry operated at an estimated *** percent capacity utilization during 2012, with *** metric tons (*** pounds) of excess capacity. This excess capacity is *** the amount of the apparent U.S. consumption of PVA during 2013 of *** pounds (compare with table I‐8).
Table IV-9
PVA: China production, imports, exports, and apparent consumption, 2002, 2007, and 2008-12
* * * * * * *
During most of this period of rising production from 2008 to 2012, China is believed to have been a net exporter of PVA. Chinese exports of PVA compiled by the Global Trade Atlas are shown in table IV‐10. Total exports of PVA from China to all countries combined increased by 86.9 percent from 93 million pounds in 2008 to 173 million pounds in 2014. The top three export markets for China’s PVA are the Netherlands, India, and Pakistan, although the growth of Chinese PVA exports to the United States has surpassed the growth to almost all other
9 Polyvinyl Alcohols, Chemical Economics Handbook, SRI Consulting, December 2003, p. 43; Polyvinyl Alcohols, Chemical Economics Handbook, SRI Consulting, March 2007, p. 50; and Chemical Economics Handbook: Polyvinyl Alcohols, IHS Chemical, June 2013, pp. 58‐59, as revised (see email from ***, April 2, 2015).
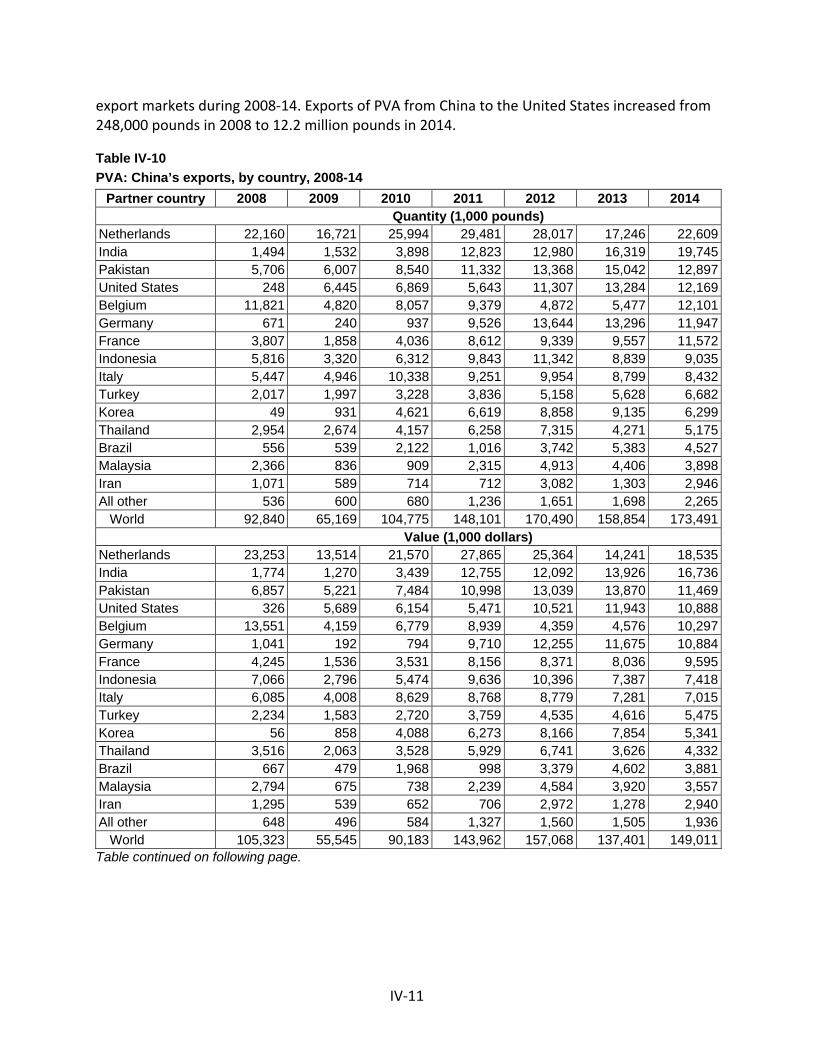
IV‐11
export markets during 2008‐14. Exports of PVA from China to the United States increased from 248,000 pounds in 2008 to 12.2 million pounds in 2014.
Table IV-10
PVA: China’s exports, by country, 2008-14
Partner country 2008 2009 2010 2011 2012 2013 2014 Quantity (1,000 pounds) Netherlands 22,160 16,721 25,994 29,481 28,017 17,246 22,609 India 1,494 1,532 3,898 12,823 12,980 16,319 19,745 Pakistan 5,706 6,007 8,540 11,332 13,368 15,042 12,897 United States 248 6,445 6,869 5,643 11,307 13,284 12,169 Belgium 11,821 4,820 8,057 9,379 4,872 5,477 12,101 Germany 671 240 937 9,526 13,644 13,296 11,947 France 3,807 1,858 4,036 8,612 9,339 9,557 11,572 Indonesia 5,816 3,320 6,312 9,843 11,342 8,839 9,035 Italy 5,447 4,946 10,338 9,251 9,954 8,799 8,432 Turkey 2,017 1,997 3,228 3,836 5,158 5,628 6,682 Korea 49 931 4,621 6,619 8,858 9,135 6,299 Thailand 2,954 2,674 4,157 6,258 7,315 4,271 5,175 Brazil 556 539 2,122 1,016 3,742 5,383 4,527 Malaysia 2,366 836 909 2,315 4,913 4,406 3,898 Iran 1,071 589 714 712 3,082 1,303 2,946 All other 536 600 680 1,236 1,651 1,698 2,265 World 92,840 65,169 104,775 148,101 170,490 158,854 173,491 Value (1,000 dollars) Netherlands 23,253 13,514 21,570 27,865 25,364 14,241 18,535 India 1,774 1,270 3,439 12,755 12,092 13,926 16,736 Pakistan 6,857 5,221 7,484 10,998 13,039 13,870 11,469 United States 326 5,689 6,154 5,471 10,521 11,943 10,888 Belgium 13,551 4,159 6,779 8,939 4,359 4,576 10,297 Germany 1,041 192 794 9,710 12,255 11,675 10,884 France 4,245 1,536 3,531 8,156 8,371 8,036 9,595 Indonesia 7,066 2,796 5,474 9,636 10,396 7,387 7,418 Italy 6,085 4,008 8,629 8,768 8,779 7,281 7,015 Turkey 2,234 1,583 2,720 3,759 4,535 4,616 5,475 Korea 56 858 4,088 6,273 8,166 7,854 5,341 Thailand 3,516 2,063 3,528 5,929 6,741 3,626 4,332 Brazil 667 479 1,968 998 3,379 4,602 3,881 Malaysia 2,794 675 738 2,239 4,584 3,920 3,557 Iran 1,295 539 652 706 2,972 1,278 2,940 All other 648 496 584 1,327 1,560 1,505 1,936 World 105,323 55,545 90,183 143,962 157,068 137,401 149,011 Table continued on following page.

IV‐12
Table IV-10--Continued
PVA: China’s exports, by country, 2008-14
Partner country 2008 2009 2010 2011 2012 2013 2014
Unit value (dollars per pound)
Netherlands 1.05 0.81 0.83 0.95 0.91 0.83 0.82
India 1.19 0.83 0.88 0.99 0.93 0.85 0.85
Pakistan 1.20 0.87 0.88 0.97 0.98 0.92 0.89
United States 1.32 0.88 0.90 0.97 0.93 0.90 0.89
Belgium 1.15 0.86 0.84 0.95 0.89 0.84 0.85
Germany 1.55 0.80 0.85 1.02 0.90 0.88 0.91
France 1.12 0.83 0.87 0.95 0.90 0.84 0.83
Indonesia 1.21 0.84 0.87 0.98 0.92 0.84 0.82
Italy 1.12 0.81 0.83 0.95 0.88 0.83 0.83
Turkey 1.11 0.79 0.84 0.98 0.88 0.82 0.82
Korea South 1.16 0.92 0.88 0.95 0.92 0.86 0.85
Thailand 1.19 0.77 0.85 0.95 0.92 0.85 0.84
Brazil 1.20 0.89 0.93 0.98 0.90 0.85 0.86
Malaysia 1.18 0.81 0.81 0.97 0.93 0.89 0.91
Iran 1.21 0.92 0.91 0.99 0.96 0.98 1.00
All other 1.21 0.83 0.86 1.07 0.94 0.89 0.85
World 1.13 0.85 0.86 0.97 0.92 0.86 0.86
Share of quantity (percent)
Netherlands 23.9 25.7 24.8 19.9 16.6 10.9 13.0
India 1.6 2.4 3.7 8.7 7.6 10.3 11.4
Pakistan 6.1 9.2 8.2 7.7 7.8 9.5 7.4
United States 0.3 9.9 6.6 3.8 6.6 8.4 7.0
Belgium 12.7 7.4 7.7 6.3 2.9 3.4 7.0
Germany 0.7 0.4 0.9 6.4 8.0 8.4 6.9
France 4.1 2.9 3.9 5.8 5.5 6.0 6.7
Indonesia 6.3 5.1 6.0 6.6 6.6 5.6 5.2
Italy 5.9 7.6 9.9 6.2 5.8 5.5 4.9
Turkey 2.2 3.1 3.1 2.6 3.0 3.5 3.9
Korea South 0.1 1.4 4.4 4.5 5.2 5.8 3.6
Thailand 3.2 4.1 4.0 4.2 4.3 2.7 3.0
Brazil 0.6 0.8 2.0 0.7 2.2 3.4 2.6
Malaysia 2.5 1.3 0.9 1.6 2.9 2.8 2.2
Iran 1.2 0.9 0.7 0.5 1.8 0.8 1.7
All other 0.6 0.9 0.6 0.8 1.0 1.1 1.3
World 100.0 100.0 100.0 100.0 100.0 100.0 100.0 Source: Compiled from Global Trade Atlas (HTS 3905.30, polyvinyl alcohols, in primary forms).

IV‐13
As previously indicated, only one small exporting firm provided a response to the Commission’s foreign producer questionnaire. Alanchem Corp. (“Alanchem”), a Chinese exporter of subject forms of PVA exclusively to the United States, provided information concerning its exporting operations. The firm, however, does not have the capacity to produce PVA in China. Alanchem’s exports of PVA to the United States accounted for *** percent of total U.S. PVA imports from China during January 2008‐September 2014. Alanchem’s reported exports to the United States are presented in table IV‐11.
Table IV-11:
PVA: Alanchem’s exports to the United States, 2008-13, January-September 2013, and January-September 2014
* * * * * * *
Table IV‐12 presents apparent consumption of PVA in China, by end use application. In 2012, the major Chinese end use applications which utilized PVA were polymerization aids (*** percent), textile warp sizing (*** percent), adhesives (*** percent), PVA fibers (*** percent), paper sizing and coatings (*** percent), architecture coatings (*** percent), and other applications (primarily PVB) (*** percent).
Table IV-12
PVA: China’s apparent consumption of PVA, by end uses, 2008-12, and projected 2017
* * * * * * *
Chinese consumption of PVA as a polymerization aid, which is the largest use for PVA in China, is forecast to increase annually by approximately *** percent during 2012‐17 primarily due to the increase in demand in the Chinese construction market, especially in the rural areas. From 2012 to 2017, the use of PVA in China is also expected to grow in paper applications by *** percent, adhesive applications by *** percent, textile applications by *** percent, and in PVA fiber applications by *** percent. Chinese consumption of PVA for architectural coatings applications, however, has declined, primarily due to poor performance (e.g., poor “waterproofability” and “washability” and undesirable release of formaldehyde). The demand for PVA in architectural coatings applications is expected to continue to decline annually by an average of *** percent per year during 2012‐17. For all other applications (primarily PVB), the overall growth for Chinese consumption of PVA is expected to be about *** percent annually during 2012‐17.10
10 Chemical Economics Handbook: Polyvinyl Alcohols, IHS Chemical, June 2013, pp. 60‐62.
IV‐14
Alternative products
Since no Chinese producers provided a response to the Commission’s questionnaire, data on the production of alternative products (e.g., excluded forms of PVA) in the same production facilities using the same production workers are not presented. However, according to importer questionnaire responses received in these reviews, there were no U.S. imports of excluded forms of PVA from China during January 2008‐September 2014.
THE INDUSTRY IN JAPAN
Overview
During the Commission’s original investigations and first five‐year reviews, there were four known producers of PVA in Japan. In the original investigations, questionnaire responses were provided by Japanese producers Denki Kagaku Kogyo Kabushiki Kaisha (“DKK”), Japan VAM & Poval Co., Ltd. (“JVP”), and Kuraray Co., Ltd. (“Kuraray Japan”).11 These three Japanese producers accounted for *** percent of total capacity to produce PVA in Japan during 2003.12 Only JVP, a wholly owned subsidiary of the Shin‐Etsu Group Co., provided a response to the Commission’s questionnaire in the first five‐year reviews. The Commission noted that JVP, which was the *** producer of PVA in Japan, accounted for *** percent of total Japanese capacity to produce PVA during 2007.13
In these second five‐year reviews, the Commission issued foreign producer questionnaires to the four firms identified as producers of PVA in Japan, all of which provided a response. Because the Japanese industry coverage for Commission questionnaire responses is widely divergent for the original investigations and the first and second five‐year reviews, Japanese industry data collected by the Commission during those proceedings are not presented for comparison purposes. Instead, certain published Japanese industry data compiled by IHS Chemicals for 2002, 2007, and 2012 are presented for PVA (both subject and excluded forms) in table IV‐13.
Table IV-13:
PVA: Salient statistics for Japan, 2002, 2007, and 2012
* * * * * * *
11 Nippon Gohsei provided a complete response to the Commission’s questionnaire in the preliminary phase of the original investigations, but provided only limited data in the final phase. Investigations Nos. 731‐TA‐1014‐1017 (Final): Polyvinyl Alcohol from China, Germany, Japan, and Korea—Staff Report, INV‐AA‐056, May 27, 2003, p. VII‐6.
12 Polyvinyl Alcohols, Chemical Economics Handbook, SRI Consulting, December 2003, p. 32. 13 Investigation Nos. 731‐TA‐1014, 1016, and 1017 (Review): Polyvinyl Alcohol from China, Japan, and
Korea—Report, INV‐GG‐015, February 26, 2009, pp. I‐24 and IV‐22; Polyvinyl Alcohols, Chemical Economics Handbook, SRI Consulting, March 2007, p. 40.
IV‐15
Details obtained through Commission questionnaire responses in these second five‐year reviews regarding each Japanese producer and its 2013 operations concerning subject forms of PVA in Japan are presented in table IV‐14.
Table IV-14 PVA: Summary data on firms in Japan, 2013
* * * * * * *
As previously noted, both DKK and Kuraray Japan are related to U.S. producers of PVA. These two Japanese producers accounted for *** percent of production of subject forms of PVA in Japan during 2013. ***14 and ***.15 Neither JVP nor Nippon have any related firms that produce PVA in the United States. JVP added ***.
Changes experienced by the industry
Japanese producers were asked to indicate whether their firm had experienced any plant openings, relocations, expansions, acquisitions, consolidations, closures, or prolonged shutdowns because of strikes or equipment failure; curtailment of production because of shortages of materials or other reasons, including revision of labor agreements; or any other change in the character of their operations or organization relating to the production of PVA since January 2008. Japanese producers’ responses to the Commission’s question are detailed in table IV‐15.
Table IV-15
PVA: Changes in the character of Japanese operations since January 1, 2008
* * * * * * *
Anticipated changes in operations
The Commission asked Japanese producers to report anticipated changes in the character of their operations relating to the production of PVA. DKK, JVP, and Nippon reported ***. Kuraray Japan replied as follows: ***.
Operations on PVA
Table lV‐16 presents data provided in response to the Commission’s foreign producer questionnaire by the four Japanese producers of PVA.
14 The parent company of U.S. importer Marubeni Specialty Chemicals Inc., Marubeni Corp., is a ***‐percent shareholder of Nippon.
15 ***.
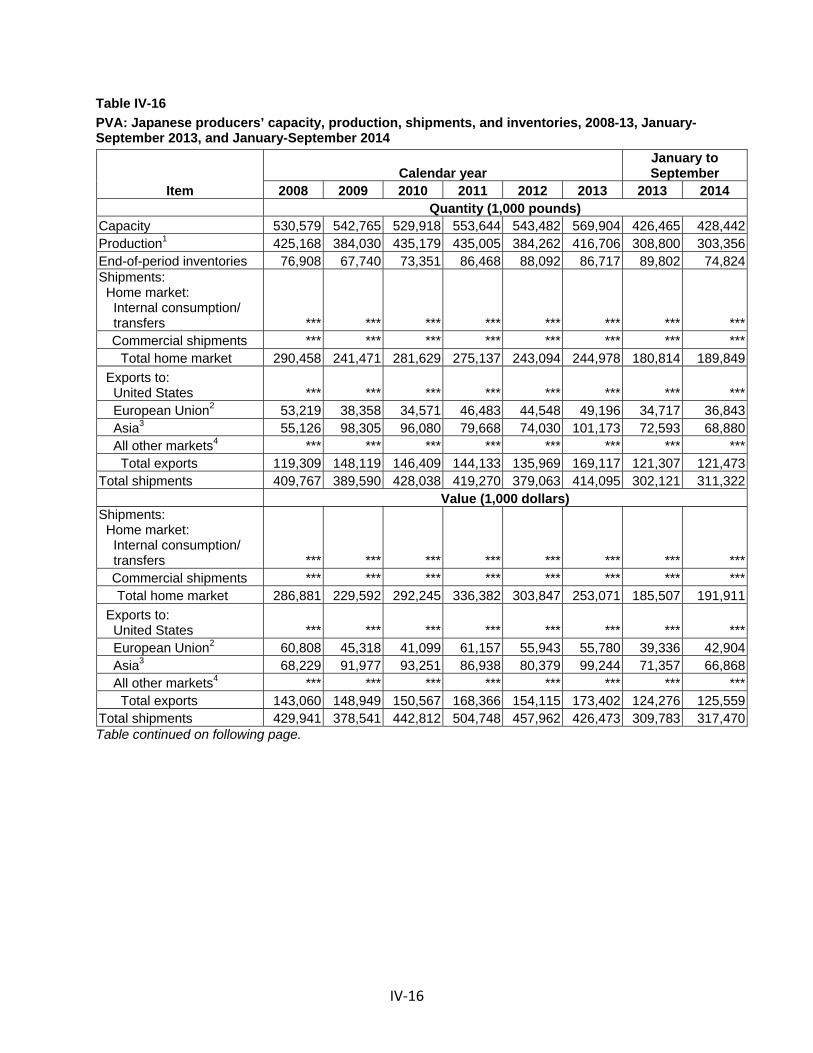
IV‐16
Table IV-16
PVA: Japanese producers’ capacity, production, shipments, and inventories, 2008-13, January-September 2013, and January-September 2014
Item Calendar year
January to September
2008 2009 2010 2011 2012 2013 2013 2014 Quantity (1,000 pounds) Capacity 530,579 542,765 529,918 553,644 543,482 569,904 426,465 428,442Production1 425,168 384,030 435,179 435,005 384,262 416,706 308,800 303,356 End-of-period inventories 76,908 67,740 73,351 86,468 88,092 86,717 89,802 74,824 Shipments: Home market: Internal consumption/ transfers *** *** *** *** *** *** *** ***
Commercial shipments *** *** *** *** *** *** *** *** Total home market 290,458 241,471 281,629 275,137 243,094 244,978 180,814 189,849
Exports to: United States *** *** *** *** *** *** *** *** European Union2 53,219 38,358 34,571 46,483 44,548 49,196 34,717 36,843 Asia3 55,126 98,305 96,080 79,668 74,030 101,173 72,593 68,880 All other markets4 *** *** *** *** *** *** *** *** Total exports 119,309 148,119 146,409 144,133 135,969 169,117 121,307 121,473 Total shipments 409,767 389,590 428,038 419,270 379,063 414,095 302,121 311,322 Value (1,000 dollars) Shipments: Home market: Internal consumption/ transfers *** *** *** *** *** *** *** ***
Commercial shipments *** *** *** *** *** *** *** *** Total home market 286,881 229,592 292,245 336,382 303,847 253,071 185,507 191,911
Exports to: United States *** *** *** *** *** *** *** *** European Union2 60,808 45,318 41,099 61,157 55,943 55,780 39,336 42,904 Asia3 68,229 91,977 93,251 86,938 80,379 99,244 71,357 66,868 All other markets4 *** *** *** *** *** *** *** *** Total exports 143,060 148,949 150,567 168,366 154,115 173,402 124,276 125,559 Total shipments 429,941 378,541 442,812 504,748 457,962 426,473 309,783 317,470 Table continued on following page.

IV‐17
Table IV-16--Continued
PVA: Japanese producers’ capacity, production, shipments, and inventories, 2008-13, January-September 2013, and January-September 2014
Item Calendar year
January to September
2008 2009 2010 2011 2012 2013 2013 2014 Unit value (dollars per pound) Shipments: Home market: Internal consumption/ Transfers *** *** *** *** *** *** *** ***
Commercial shipments *** *** *** *** *** *** *** *** Total home market 0.99 0.95 1.04 1.22 1.25 1.03 1.03 1.01
Exports to: United States *** *** *** *** *** *** *** *** European Union2 1.14 1.18 1.19 1.32 1.26 1.13 1.13 1.16 Asia3 1.24 0.94 0.97 1.09 1.09 0.98 0.98 0.97 All other markets4 *** *** *** *** *** *** *** *** Total exports 1.20 1.01 1.03 1.17 1.13 1.03 1.02 1.03Total shipments 1.05 0.97 1.03 1.20 1.21 1.03 1.03 1.02 Ratios and shares (percent) Capacity utilization 80.1 70.8 82.1 78.6 70.7 73.1 72.4 70.8Inventories/production 18.1 17.6 16.9 19.9 22.9 20.8 21.8 18.5Inventories/total shipments 18.8 17.4 17.1 20.6 23.2 20.9 22.3 18.0Shipments: Home market: Internal consumption/ Transfers *** *** *** *** *** *** *** ***
Commercial shipments *** *** *** *** *** *** *** *** Total home market 70.9 62.0 65.8 65.6 64.1 59.2 59.8 61.0
Exports to: United States *** *** *** *** *** *** *** *** European Union2 13.0 9.8 8.1 11.1 11.8 11.9 11.5 11.8 Asia3 13.5 25.2 22.4 19.0 19.5 24.4 24.0 22.1 All other markets4 *** *** *** *** *** *** *** *** Total exports 29.1 38.0 34.2 34.4 35.9 40.8 40.2 39.0Total shipments 100.0 100.0 100.0 100.0 100.0 100.0 100.0 100.0
1 “Off-grade” or “off-spec” production accounted for *** percent of DKK’s production, *** percent of JVP’s production, *** percent of Kuraray Japan’s production, and *** percent of Nippon’s production. 2 Principal European Union export markets are: ***. 3 Principal Asian export markets are: ***. 4 Principal other export markets are: ***. Source: Compiled from data submitted in response to Commission questionnaires.
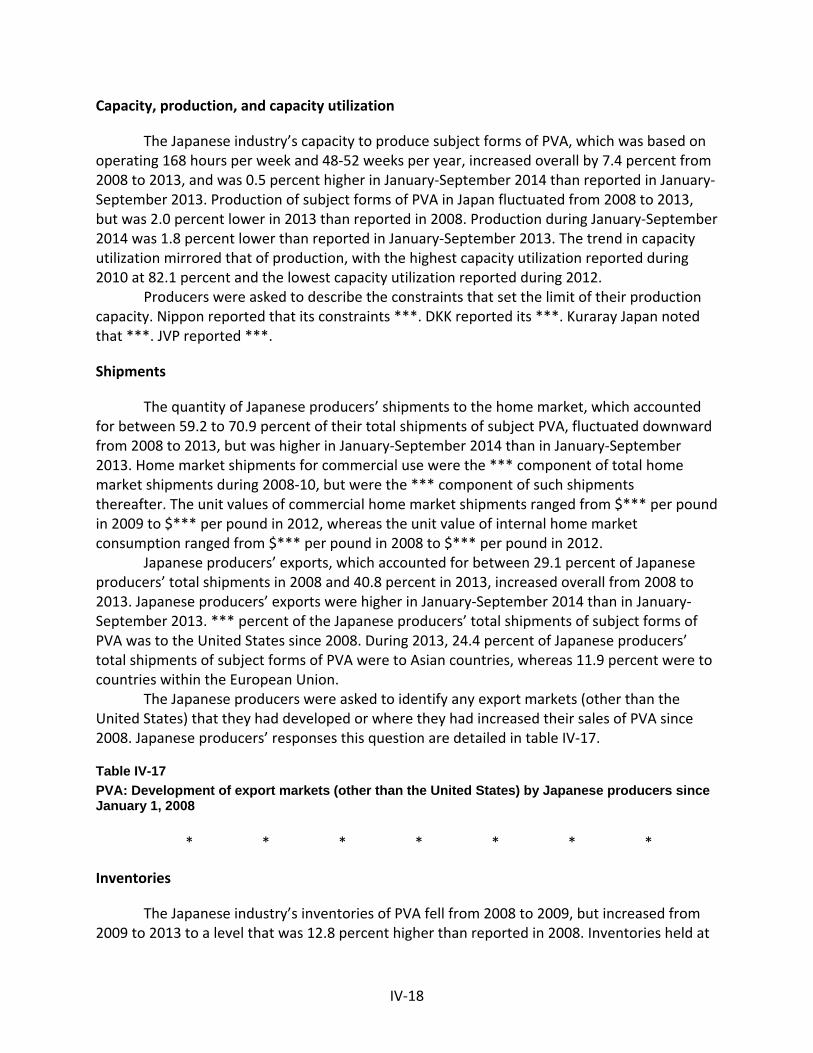
IV‐18
Capacity, production, and capacity utilization
The Japanese industry’s capacity to produce subject forms of PVA, which was based on operating 168 hours per week and 48‐52 weeks per year, increased overall by 7.4 percent from 2008 to 2013, and was 0.5 percent higher in January‐September 2014 than reported in January‐September 2013. Production of subject forms of PVA in Japan fluctuated from 2008 to 2013, but was 2.0 percent lower in 2013 than reported in 2008. Production during January‐September 2014 was 1.8 percent lower than reported in January‐September 2013. The trend in capacity utilization mirrored that of production, with the highest capacity utilization reported during 2010 at 82.1 percent and the lowest capacity utilization reported during 2012.
Producers were asked to describe the constraints that set the limit of their production capacity. Nippon reported that its constraints ***. DKK reported its ***. Kuraray Japan noted that ***. JVP reported ***.
Shipments
The quantity of Japanese producers’ shipments to the home market, which accounted for between 59.2 to 70.9 percent of their total shipments of subject PVA, fluctuated downward from 2008 to 2013, but was higher in January‐September 2014 than in January‐September 2013. Home market shipments for commercial use were the *** component of total home market shipments during 2008‐10, but were the *** component of such shipments thereafter. The unit values of commercial home market shipments ranged from $*** per pound in 2009 to $*** per pound in 2012, whereas the unit value of internal home market consumption ranged from $*** per pound in 2008 to $*** per pound in 2012.
Japanese producers’ exports, which accounted for between 29.1 percent of Japanese producers’ total shipments in 2008 and 40.8 percent in 2013, increased overall from 2008 to 2013. Japanese producers’ exports were higher in January‐September 2014 than in January‐September 2013. *** percent of the Japanese producers’ total shipments of subject forms of PVA was to the United States since 2008. During 2013, 24.4 percent of Japanese producers’ total shipments of subject forms of PVA were to Asian countries, whereas 11.9 percent were to countries within the European Union.
The Japanese producers were asked to identify any export markets (other than the United States) that they had developed or where they had increased their sales of PVA since 2008. Japanese producers’ responses this question are detailed in table IV‐17.
Table IV-17
PVA: Development of export markets (other than the United States) by Japanese producers since January 1, 2008
* * * * * * *
Inventories
The Japanese industry’s inventories of PVA fell from 2008 to 2009, but increased from 2009 to 2013 to a level that was 12.8 percent higher than reported in 2008. Inventories held at

IV‐19
the end of September 2014 were lower than for the same time period in 2013. The Japanese producers’ ratio of inventories to total shipments fluctuated between 17.1 and 23.2 percent. Kuraray Japan noted that “***.”
End‐use applications
Table IV‐18 presents the Japanese producers’ production of subject forms of PVA, by end use application. Although approximately *** of production of subject forms of PVA in Japan are for “other” end‐use applications (i.e., agrochemical, film, molding, PVC polymerization, oil and gas applications, PVC dispersant, binder for non‐woven glasspaper, and miscellaneous end uses), the single largest specified end‐use application for subject forms of PVA produced in Japan is PVB, followed by ***; in addition, a *** share of production is divided between ***. For the broader Japanese market for all PVA (including both subject and excluded forms of PVA), *** were identified as the largest end use application in 2012 (*** percent), followed by ***.16
Table IV-18
PVA: Quantity and shares of Japanese production of subject forms of PVA, by end use, 2013 and January-September 2014
* * * * * * *
Hydrolysis levels
Table IV‐19 presents the shares of Japanese producers’ production of PVA, by hydrolysis level. These data show that during 2013 and January‐September 2014 *** percent of Japanese production of subject forms of PVA was hydrolyzed to a level greater than or equal to 97 percent, and *** percent was hydrolyzed greater than 85 percent but less than 97 percent. *** of subject forms of PVA produced by Japanese producers was hydrolyzed to a level greater than 80 percent but less than or equal to 85 percent.
Table IV-19
PVA: Shares of Japanese producers’ production, by hydrolysis level, 2013 and January-September 2014
* * * * * * *
Alternative products
Japanese producers were asked about their ability to switch production (capacity) between subject forms of PVA and other products (such as excluded forms of PVA and ***)
16 Chemical Economics Handbook: Polyvinyl Alcohols, IHS Chemical, June 2013, p. 49.

IV‐20
using the same equipment and/or labor. DKK, JVP, Kuraray Japan, and Nippon reported ***. Nippon stated ***. DKK added that PVA producers ***. It explained that “the facility (total process including polymerization system, saponification system, drying system, solvent recovery system) and labor would not change when producing excluded or subject PVA.”17 Table IV‐20 presents the Japanese producers’ overall plant capacity and production of PVA (both subject and excluded forms) and other products.
Table IV-20
PVA: Japanese producers’ overall capacity, production, and capacity utilization, 2008-13, January-September 2013, and January-September 2014
Item
Calendar year Jan.-Sept.
2008 2009 2010 2011 2012 2013 2013 2014
Quantity (1,000 pounds)
Overall capacity 576,001 585,591 576,001 585,591 580,001 607,591 471,497 468,106
Production: PVA (subject) 425,168 384,030 435,179 435,005 384,262 416,706 308,800 303,356
Excluded forms *** *** *** *** *** *** *** ***
Other products1 *** *** *** *** *** *** *** ***
Total production 490,951 452,854 525,333 532,597 501,888 534,056 392,194 397,084
Ratios and shares (percent)
Capacity utilization 85.2 77.3 91.2 91.0 86.5 87.9 83.2 84.8
Share of production: PVA (subject) 86.6 84.8 82.8 81.7 76.6 78.0 78.7 76.4
Excluded forms *** *** *** *** *** *** *** ***
Other products1 *** *** *** *** *** *** *** ***
Total production 100.0 100.0 100.0 100.0 100.0 100.0 100.0 100.01 Other products include ***. Source: Compiled from data submitted in response to Commission questionnaires.
Table IV‐21 presents the Japanese producers’ exports of the excluded forms of PVA to the United States. Nippon accounted for *** of the quantity of Japanese producers’ excluded PVA exports to the United States during 2013, *** Kuraray Japan (*** percent), JVP (*** percent), and DKK (*** percent).
Table IV-21
PVA: Japanese producers’ exports of excluded forms of PVA to the United States, 2008-13, January-September 2013, and January-September 2014
* * * * * * *
17 DKK noted as an example that the two significant differences in the production process for the subject PVA it produces and an excluded PVA product it produces ***. DKK’s responses to Commission questions, p. 6.
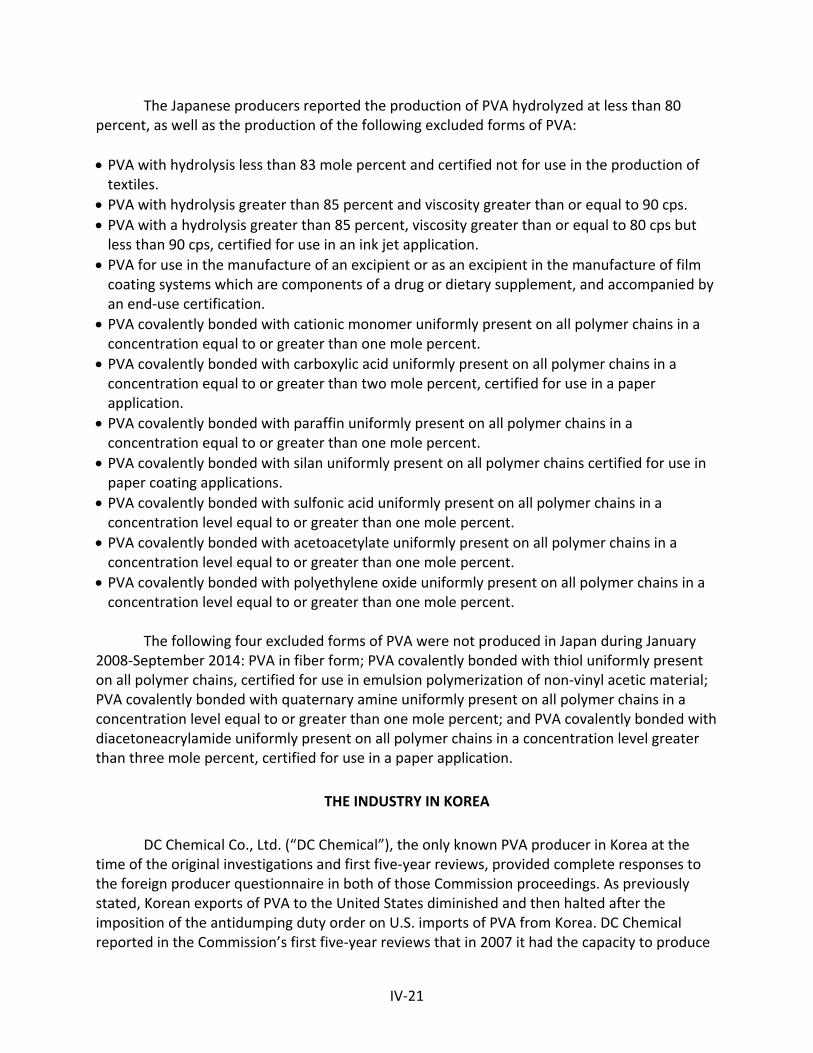
IV‐21
The Japanese producers reported the production of PVA hydrolyzed at less than 80 percent, as well as the production of the following excluded forms of PVA:
PVA with hydrolysis less than 83 mole percent and certified not for use in the production of textiles.
PVA with hydrolysis greater than 85 percent and viscosity greater than or equal to 90 cps. PVA with a hydrolysis greater than 85 percent, viscosity greater than or equal to 80 cps but less than 90 cps, certified for use in an ink jet application.
PVA for use in the manufacture of an excipient or as an excipient in the manufacture of film coating systems which are components of a drug or dietary supplement, and accompanied by an end‐use certification.
PVA covalently bonded with cationic monomer uniformly present on all polymer chains in a concentration equal to or greater than one mole percent.
PVA covalently bonded with carboxylic acid uniformly present on all polymer chains in a concentration equal to or greater than two mole percent, certified for use in a paper application.
PVA covalently bonded with paraffin uniformly present on all polymer chains in a concentration equal to or greater than one mole percent.
PVA covalently bonded with silan uniformly present on all polymer chains certified for use in paper coating applications.
PVA covalently bonded with sulfonic acid uniformly present on all polymer chains in a concentration level equal to or greater than one mole percent.
PVA covalently bonded with acetoacetylate uniformly present on all polymer chains in a concentration level equal to or greater than one mole percent.
PVA covalently bonded with polyethylene oxide uniformly present on all polymer chains in a concentration level equal to or greater than one mole percent.
The following four excluded forms of PVA were not produced in Japan during January 2008‐September 2014: PVA in fiber form; PVA covalently bonded with thiol uniformly present on all polymer chains, certified for use in emulsion polymerization of non‐vinyl acetic material; PVA covalently bonded with quaternary amine uniformly present on all polymer chains in a concentration level equal to or greater than one mole percent; and PVA covalently bonded with diacetoneacrylamide uniformly present on all polymer chains in a concentration level greater than three mole percent, certified for use in a paper application.
THE INDUSTRY IN KOREA
DC Chemical Co., Ltd. (“DC Chemical”), the only known PVA producer in Korea at the time of the original investigations and first five‐year reviews, provided complete responses to the foreign producer questionnaire in both of those Commission proceedings. As previously stated, Korean exports of PVA to the United States diminished and then halted after the imposition of the antidumping duty order on U.S. imports of PVA from Korea. DC Chemical reported in the Commission’s first five‐year reviews that in 2007 it had the capacity to produce

IV‐22
*** pounds of PVA in Korea. PVA production in Korea during 2007 was *** pounds, and DC Chemical reported that *** percent of its total shipments were export shipments, although none were destined for the United States. In fact, DC Chemical reported that it had not exported PVA to the United States since 2003. DC Chemical also reported in the Commission’s first five‐year reviews that it did not produce any alternative products utilizing the same equipment or labor used to produce PVA in Korea.18
On April 1, 2009, DC Chemical Co., Ltd. relaunched itself with a new corporate identity—OCI Co. Ltd. (“OCI”).19 Early that same year, OCI exited from several businesses (including its PVA business) citing limited growth potential. During the remainder of 2009, OCI’s Gunsan plant, which previously produced PVA and micronized silica, produced polysilicon, toluene di‐isocyanate, fumed silica, and caustic soda instead. A review of OCI’s Annual Reports from 2009 to 2013 reveals that the company has not produced PVA in Korea since it exited the business early in 2009.20 *** at OCI confirmed that the company has not produced PVA in Korea since April 2009 and that it does not produce PVA elsewhere in the world. In fact, OCI does not have any capability to produce PVA in Korea, does not plan to resume production of PVA, and is not aware of any other producer of PVA or other firm in the process of becoming a PVA producer in Korea. The production equipment that was previously used by OCI to produce PVA in Korea was ***. Only a few of the workers who previously manufactured PVA at OCI facilities in Korea are currently employed by OCI in other departments that are unrelated to PVA production. OCI ***. The company does not maintain any inventory of PVA manufactured in Korea and ***. OCI reported that it is currently building photovoltaic plants in the United States but does not have any commercial PVA relationships in the United States.21
IHS Chemical, which conducts research services for the global chemical industry, confirms that there has been no production of PVA in Korea since OCI ceased production in 2009.22 It reported that annual production of PVA in Korea prior to 2009 was *** metric tons
18 Investigation Nos. 731‐TA‐1014, 1016, and 1017 (Review): Polyvinyl Alcohol from China, Japan, and Korea‐‐Staff Report, INV‐GG‐015, February 26, 2009, pp. IV‐30 – IV‐31.
19 OCI Annual Report 2010, http://www.oci.co.kr/eng/invest/ir_annualreport.asp, accessed on January 29, 2015.
20 OCI Annual Reports 2009‐13, http://www.oci.co.kr/eng/invest/ir_annualreport.asp, accessed on January 29, 2015.
21 E‐mails from ***, OCI, March 5, 6, and 11, 2015. 22 Chemical Economics Handbook: Polyvinyl Alcohols, IHS Chemical, June 2013, p. 67. Parties to these
reviews noted that construction of a new PVA production facility typically takes *** and costs ***. Domestic interested parties’ responses to Commission questions, pp. 18‐19; and DKK responses to Commission questions, p. 5. The domestic interested parties noted that the estimates include the time and costs related to the design and construction of the PVA production facility, as well as the related equipment and infrastructure (e.g., steam, air, cooling water, wastewater treatment). They added that “Where a particular project falls with these ranges can vary depending on whether equipment is custom‐built or off‐the‐shelf. The high up‐front costs associated with constructing a new PVA facility are the main reason that PVA manufacturers must generally achieve very high capacity utilization rates.
(continued...)

IV‐23
(*** pounds). It also reported that the growth in consumption of PVA in Korea has slowed in recent years because of Korea’s stagnant construction economy and depressed fiber industry, which moved outside the country (mostly to China). Consumption of PVA in Korea was estimated to be *** metric tons (*** pounds) in 2012 and forecasts indicate that Korean consumption of PVA will grow annually by about *** percent through 2017. Applications for PVA consumed in Korea include adhesives (*** percent), fibers (*** percent), paper (*** percent) and other applications (*** percent).23
In 2013, Korea imported 38.4 million pounds of PVA to meet its domestic demand. Korea’s imports of PVA during 2013 were primarily from Japan (48.7 percent), China (24.1 percent), Taiwan (16.5 percent), and the United States (9.2 percent). Korean exports of PVA after 2009 are minor.24
SUBJECT COUNTRY PRODUCERS
Table IV‐22 presents salient statistics for the PVA industries in China, Japan, and Korea during 2008‐12. The data presented are for all PVA, including both subject and excluded forms of PVA.
Table IV-22
PVA: Capacity, production, imports, exports, and apparent consumption of all PVA (including subject and excluded forms), by subject country, 2008-12
* * * * * * *
ANTIDUMPING OR COUNTERVAILING DUTY ORDERS IN THIRD‐COUNTRY MARKETS
With regard to PVA produced in China, Korea imposed a duty of 11.1 to 35.17 percent on such imports from December 12, 2006 through December 11, 2009. In addition, on December 19, 2006, the European Union (“EU”) initiated an antidumping duty proceeding with regard to imports of PVA from China. On September 17, 2007, the EU imposed a provisional antidumping duty of 10.06 percent on imports from China. On March 17, 2007, the EU terminated its antidumping proceeding concerning imports of PVA from China.25 (…continued) Once such an investment is made, the marginal cost of continuing to operate existing production lines is relatively low.” Domestic interested parties’ responses to Commission questions, p. 19.
23 Chemical Economics Handbook: Polyvinyl Alcohols, IHS Chemical, June 2013, p. 67. 24 During 2013, Korea exported 674,683 pounds of PVA, 661 pounds of which were destined for the
United States. Global Trade Atlas (HTS 3905.30.00, Polyvinyl Alcohols, Whether Or Not Containing Unhydrolyzed Acetate Groups), accessed February 5, 2015. Based on information obtained from U.S. importers responding to the Commission’s importer questionnaire in these five‐year reviews, exports of PVA from Korea to the United States were manufactured in other countries (e.g., Japan).
25 Inv. Nos. 731‐TA‐1014, 1016, and 1017 (Review): Polyvinyl Alcohol from China, Japan, and Korea‐ Staff Report, INV‐GG‐015, February 26, 2009, p. IV‐16.

IV‐24
With regard to PVA produced in Japan, Japanese producer JVP reported in the Commission’s first five‐year reviews that its exports of PVA were subject to barriers to trade in Korea. It explained that, in 1998, Korea imposed a 37.75 percent tariff rate.26
In these second five‐year reviews, the Japanese producers indicated in their responses to the Commission’s questionnaire that their PVA exports are not subject to any third country trade actions.
GLOBAL MARKET
Capacity, production, imports, exports, and consumption
According to the published sources, global capacity in 2013 was approximately *** pounds (*** metric tons) with approximately *** located in Asia. China alone was estimated to account for *** percent of global capacity in 2012. Collectively, the various Kuraray facilities account for nearly *** of world capacity, with plant locations in Japan, the United States, Singapore, and Western Europe.27 Table IV‐23 presents capacity, production, trade and consumption data on a regional basis. Table IV‐24 shows the world producers.
Table IV-23
PVA: World capacity, production, imports, exports and consumption, 2012, projected capacity and consumption, 2017, and annual growth rate, 2012 and 2017 (forecast), by region/country
* * * * * * *
Table IV-24
PVA: Major world producers, locations, and average annual capacity, 2013 and 2017 (forecast)
* * * * * * *
The different regions consume PVA for different applications. In the United States, PVA is primarily used to make PVB. The next two major uses in the U.S. market are adhesives and polymerization aids. In Western Europe, the primary application for PVA is again to make PVB, while the next two leading uses are polymerization aids and adhesive coatings. In Japan, PVB production is still substantial, but the top three applications of PVA are vinylon fibers, adhesives, and paper coatings. In China, the primary application is the manufacture of polymerization aids, followed by textile sizing and adhesives.28 The Korean market top three applications are adhesives, fibers, and paper.29 Table IV‐25 presents export data for the larger
26 Inv. Nos. 731‐TA‐1014, 1016, and 1017 (Review): Polyvinyl Alcohol from China, Japan, and Korea‐ Staff Report, INV‐GG‐015, February 26, 2009, pp. IV‐23 – IV‐24.
27 Chemical Economics Handbook: Polyvinyl Alcohols, IHS Chemical, June 2013, p. 6. 28 Chemical Economics Handbook: Polyvinyl Alcohols, IHS Chemical, June 2013, p. 7. 29 Chemical Economics Handbook: Polyvinyl Alcohols, IHS Chemical, June 2013, p. 67.
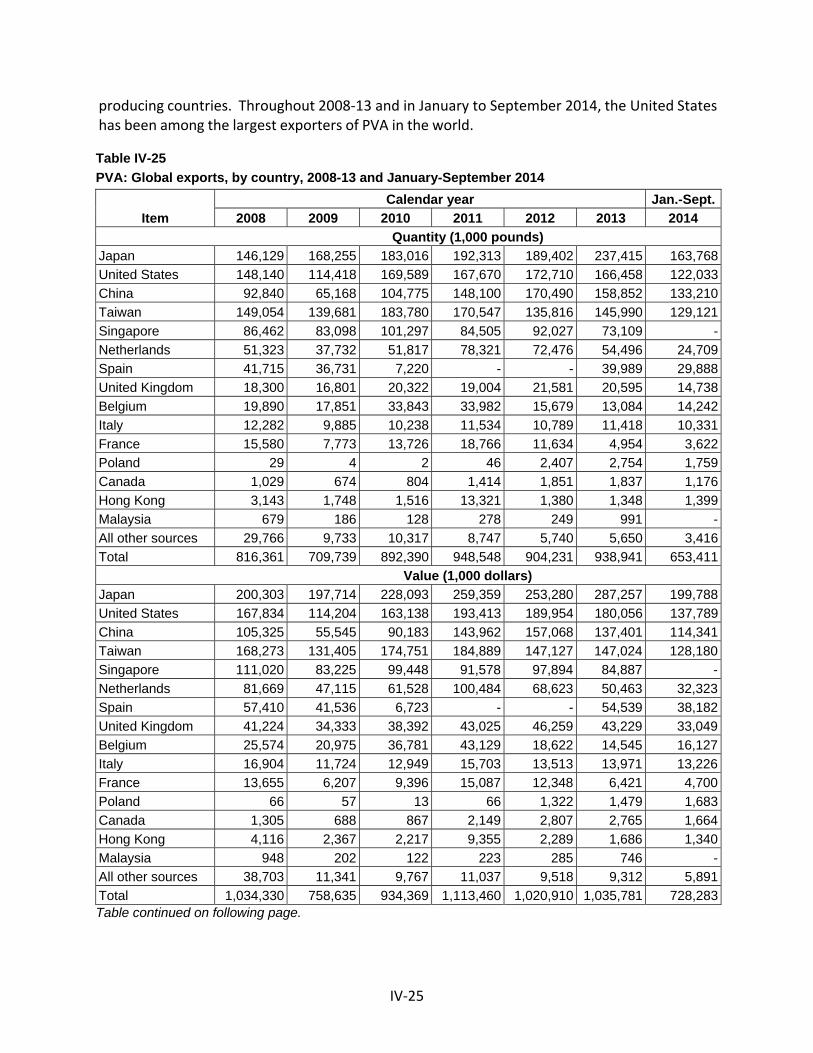
IV‐25
producing countries. Throughout 2008‐13 and in January to September 2014, the United States has been among the largest exporters of PVA in the world.
Table IV-25
PVA: Global exports, by country, 2008-13 and January-September 2014
Item
Calendar year Jan.-Sept.
2008 2009 2010 2011 2012 2013 2014
Quantity (1,000 pounds)
Japan 146,129 168,255 183,016 192,313 189,402 237,415 163,768
United States 148,140 114,418 169,589 167,670 172,710 166,458 122,033
China 92,840 65,168 104,775 148,100 170,490 158,852 133,210
Taiwan 149,054 139,681 183,780 170,547 135,816 145,990 129,121
Singapore 86,462 83,098 101,297 84,505 92,027 73,109 -
Netherlands 51,323 37,732 51,817 78,321 72,476 54,496 24,709
Spain 41,715 36,731 7,220 - - 39,989 29,888
United Kingdom 18,300 16,801 20,322 19,004 21,581 20,595 14,738
Belgium 19,890 17,851 33,843 33,982 15,679 13,084 14,242
Italy 12,282 9,885 10,238 11,534 10,789 11,418 10,331
France 15,580 7,773 13,726 18,766 11,634 4,954 3,622
Poland 29 4 2 46 2,407 2,754 1,759
Canada 1,029 674 804 1,414 1,851 1,837 1,176
Hong Kong 3,143 1,748 1,516 13,321 1,380 1,348 1,399
Malaysia 679 186 128 278 249 991 -
All other sources 29,766 9,733 10,317 8,747 5,740 5,650 3,416
Total 816,361 709,739 892,390 948,548 904,231 938,941 653,411
Value (1,000 dollars)
Japan 200,303 197,714 228,093 259,359 253,280 287,257 199,788
United States 167,834 114,204 163,138 193,413 189,954 180,056 137,789
China 105,325 55,545 90,183 143,962 157,068 137,401 114,341
Taiwan 168,273 131,405 174,751 184,889 147,127 147,024 128,180
Singapore 111,020 83,225 99,448 91,578 97,894 84,887 -
Netherlands 81,669 47,115 61,528 100,484 68,623 50,463 32,323
Spain 57,410 41,536 6,723 - - 54,539 38,182
United Kingdom 41,224 34,333 38,392 43,025 46,259 43,229 33,049
Belgium 25,574 20,975 36,781 43,129 18,622 14,545 16,127
Italy 16,904 11,724 12,949 15,703 13,513 13,971 13,226
France 13,655 6,207 9,396 15,087 12,348 6,421 4,700
Poland 66 57 13 66 1,322 1,479 1,683
Canada 1,305 688 867 2,149 2,807 2,765 1,664
Hong Kong 4,116 2,367 2,217 9,355 2,289 1,686 1,340
Malaysia 948 202 122 223 285 746 -
All other sources 38,703 11,341 9,767 11,037 9,518 9,312 5,891
Total 1,034,330 758,635 934,369 1,113,460 1,020,910 1,035,781 728,283 Table continued on following page.

IV‐26
Table IV-25--Continued
PVA: Global exports, by country, 2008-13 and January-September 2014
Item
Calendar year Jan.-Sept.
2008 2009 2010 2011 2012 2013 2014
Unit value (dollars per pound)
Japan 1.37 1.18 1.25 1.35 1.34 1.21 1.22
United States 1.13 1.00 0.96 1.15 1.10 1.08 1.13
China 1.13 0.85 0.86 0.97 0.92 0.86 0.86
Taiwan 1.13 0.94 0.95 1.08 1.08 1.01 0.99
Singapore 1.28 1.00 0.98 1.08 1.06 1.16 (1)
Netherlands 1.59 1.25 1.19 1.28 0.95 0.93 1.31
Spain 1.38 1.13 0.93 (1) (1) 1.36 1.28
United Kingdom 2.25 2.04 1.89 2.26 2.14 2.10 2.24
Belgium 1.29 1.18 1.09 1.27 1.19 1.11 1.13
Italy 1.38 1.19 1.26 1.36 1.25 1.22 1.28
France 0.88 0.80 0.68 0.80 1.06 1.30 1.30
Poland 2.28 14.25 6.50 1.43 0.55 0.54 0.96
Canada 1.27 1.02 1.08 1.52 1.52 1.51 1.42
Hong Kong 1.31 1.35 1.46 0.70 1.66 1.25 0.96
Malaysia 1.40 1.08 0.95 0.80 1.14 0.75 (1)
All other sources 1.30 1.17 0.95 1.26 1.66 1.65 1.72
Average 1.27 1.07 1.05 1.17 1.13 1.10 1.111 Undefined. Source: Global Trade Atlas, data run 02/05/2015, based on HTS subheading 3905.30.00.
Foreign demand
Firms’ responses regarding demand outside the United States since January 1, 2008 and anticipated future demand are summarized in table IV‐26. The majority of firms reported that demand has increased overall, and indicated that they expect these trends to continue. Three of five foreign producers reported that demand in their home markets has not changed since January 1, 2008.
In additional comments, U.S. producers, purchasers, and one foreign producer stated that demand outside of the United States follows GDP. U.S. producer *** added that demand for PVA used to produce PVB grew more quickly than GDP due to increased use of safety glass. Purchaser *** noted an increase in global demand for specialty PVA used to make building products. Firms anticipate that demand will continue to follow GDP trends. One importer (***) reported that it anticipates an increase in demand in Asia resulting from an increase in production of PVC for the construction market, and another firm (***) anticipates an increase in global demand due to overall manufacturing growth.
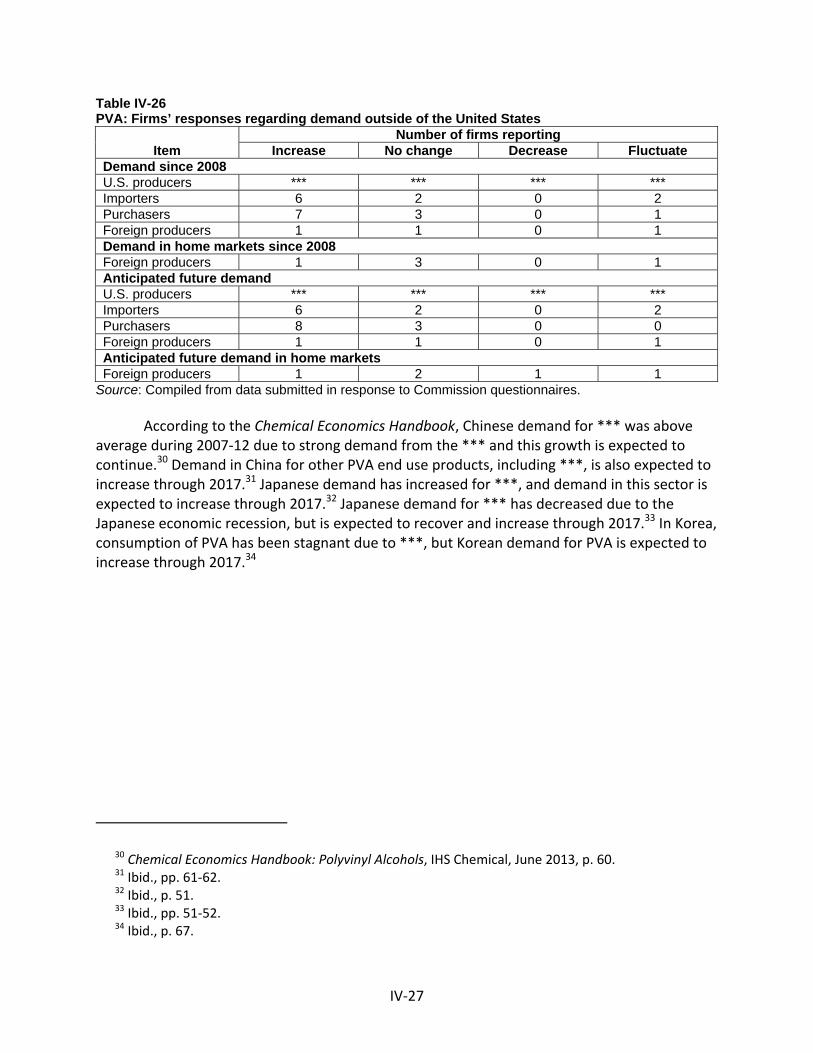
IV‐27
Table IV-26 PVA: Firms’ responses regarding demand outside of the United States
Item Number of firms reporting
Increase No change Decrease Fluctuate Demand since 2008 U.S. producers *** *** *** *** Importers 6 2 0 2 Purchasers 7 3 0 1 Foreign producers 1 1 0 1 Demand in home markets since 2008 Foreign producers 1 3 0 1 Anticipated future demand U.S. producers *** *** *** *** Importers 6 2 0 2 Purchasers 8 3 0 0 Foreign producers 1 1 0 1 Anticipated future demand in home markets Foreign producers 1 2 1 1
Source: Compiled from data submitted in response to Commission questionnaires.
According to the Chemical Economics Handbook, Chinese demand for *** was above average during 2007‐12 due to strong demand from the *** and this growth is expected to continue.30 Demand in China for other PVA end use products, including ***, is also expected to increase through 2017.31 Japanese demand has increased for ***, and demand in this sector is expected to increase through 2017.32 Japanese demand for *** has decreased due to the Japanese economic recession, but is expected to recover and increase through 2017.33 In Korea, consumption of PVA has been stagnant due to ***, but Korean demand for PVA is expected to increase through 2017.34
30 Chemical Economics Handbook: Polyvinyl Alcohols, IHS Chemical, June 2013, p. 60. 31 Ibid., pp. 61‐62. 32 Ibid., p. 51. 33 Ibid., pp. 51‐52. 34 Ibid., p. 67.
IV‐28
Prices
Producers, importers, and foreign producers were asked to compare prices of PVA in U.S. and foreign markets. U.S. producers ***, responding importers, and three of five foreign producers35 reported that PVA prices in the United States are higher than prices in other markets.36 Firms specifically identified other markets, including Asia, Canada, China, Europe, Japan, Latin America, and Mexico. In its response to Commission questions, respondent DKK disagreed and referenced Chemical Economics Handbook data showing that average sales values in Japan were higher than in the United States, import prices into Canada were higher than market prices in the United States, and market prices in Western Europe fell within the range of U.S. market prices during 2008‐13.37 38
35 Foreign producer *** reported that prices were the same overall. Foreign producer *** reported that, depending on the exchange rate between the U.S. dollar and ***, market prices change substantially.
36 Domestic interested parties *** reported that the antidumping duty orders are the primary reason why PVA prices in the United States are higher than in other global markets. Domestic interested parties’ responses to Commission questions, p. 2, and *** statement, p. 3.
37 DKK’s responses to Commission questions, p. 1. However, in its foreign producer questionnaire response, DKK reported that ***. DKK’s foreign producer questionnaire response, section III‐17.
38 As noted in the prehearing report, The Chemical Economics Handbook provides pricing information on PVA in various markets. However, the data presented vary greatly in product mix and estimation methods from market to market.
V‐1
PART V: PRICING DATA
FACTORS AFFECTING PRICES
Raw material costs
The principal raw material inputs used to produce PVA are ethylene, acetic acid, and methanol, or vinyl acetate monomer (VAM) and methanol. Ethylene and acetic acid are combined to make VAM, which is polymerized and combined with methanol to produce PVA.1 U.S. producers reported that raw materials as a share of cost of goods sold increased from *** percent in 2008 to *** percent in 2013.2 Two of three U.S. producers reported that raw material costs had fluctuated since January 1, 2008, and they expect these trends to continue. Ten of 12 importers reported that raw materials prices have either increased or fluctuated since January 1, 2008, and eight importers expect that raw materials prices will continue to fluctuate. U.S. producer *** reported that PVA costs move with VAM costs and VAM prices are driven by global ethylene costs. *** added that tightness in VAM supply in 2014 caused VAM prices to increase while ethylene prices decreased. U.S. producer *** reported that the pricing of raw materials (natural gas, ethylene, methanol, and VAM) increased in early 2008, but decreased in 2009 due to the recession. *** reported that raw material prices have increased since 2010, and that it has followed these increases and decreases with changes in its PVA prices. *** added that predicting raw material costs is difficult as prices for petroleum, natural gas, and their derivatives (ethylene, methanol, and VAM) continue to be volatile.
Natural gas, or its derivative ethane, is the primary feedstock used to manufacture VAM.3 As shown in figure V‐1, natural gas prices peaked in mid‐2008, declined through mid‐2009 and fluctuated through 2014. Overall, natural gas prices declined by 43.5 percent between first quarter 2008 and third quarter 2014, and leveled off in fourth quarter 2014.
1 Polyvinyl Alcohol from China, Japan, and Korea, Inv. Nos. 731‐TA‐1014, 1016, and 1017 (Review), USITC Publication 4067, March 2009, p. V‐1.
2 U.S. producers’ raw materials as a share of cost of goods sold were *** percent in January‐September 2013 and *** percent in January‐September 2014.
3 Polyvinyl Alcohol from China, Japan, and Korea, Inv. Nos. 731‐TA‐1014, 1016, and 1017 (Review), USITC Publication 4067, March 2009, p. V‐1.

V‐2
Figure V-1
Natural gas: Quarterly average U.S. industrial prices, 2008-14 and 2015-16 (forecast)
Source: Short Term Energy Outlook, Energy Information Administration, www.eia.gov, March 26, 2015.
Transportation costs to the U.S. market
Transportation costs for PVA shipped from subject countries to the United States averaged 6.6 percent for China and 4.4 percent for Japan during 2008‐13.4 These estimates were derived from official import data and represent the transportation and other charges on imports.5
Eleven of 15 responding importers and all five responding foreign producers reported that the exporters typically arranged international transportation. Reported transportation cost ranges for shipping PVA from China and Japan are reported in table V‐1.
4 The calculation for Japan includes data for excluded forms of PVA. There were no imports of subject PVA from Korea during 2008‐13.
5 Staff estimated transportation costs by subtracting the customs value from the c.i.f. value of the imports for 2013 and then dividing by the customs value based on the HTS subheading 3905.30.00.

V‐3
Table V-1
PVA: Transportation costs to the U.S. market, 2013
Source U.S. importers Foreign producers
Dollars per 1,000 pounds China 100 - 420 (1) Japan 120 - 694 44 - 180
1 The sole responding exporter of PVA from China, ***, did not report exporting PVA from China to the United States in 2013, and therefore did not provide transportation cost data. Source: Compiled from data submitted in response to Commission questionnaires.
U.S. inland transportation costs
*** U.S. producers and seven of eight importers reported that they typically arrange transportation to their customers. U.S. producers reported that their U.S. inland transportation costs ranged from 3 to 5 percent while importers reported costs of 2 to 7 percent. Two importers reported shipping PVA from their point of importation, and two importers reported shipping from a storage facility.
PRICING PRACTICES
Pricing methods
Price determination
As presented in table V‐2, U.S. producer *** reported determining PVA prices ***, while U.S. producer *** reported using ***. Importers primarily use transaction‐by‐transaction negotiations, although some use contracts. Other price setting methods reported by importers included meeting competitive offers and formulas based on adjustments in raw materials costs.
Table V-2
PVA: U.S. producers and importers reported price setting methods, by number of responding firms1
Method U.S. producers Importers Transaction-by-transaction *** 9 Contract *** 3 Set price list *** 1 Other *** 3
1 The sum of responses down may not add up to the total number of responding firms as each firm was instructed to check all applicable price setting methods employed. Source: Compiled from data submitted in response to Commission questionnaires.
Contract and spot sales
U.S. producers reported selling most of their PVA *** and selling a smaller share *** (table V‐3). Importers of PVA from China reported selling *** of their PVA from China ***,
V‐4
while importers of PVA from Japan reported selling the majority of their subject PVA from Japan ***.
Table V-3
PVA: U.S. producers’ and importers’ shares of U.S. commercial shipments, by type of sale, 2013
* * * * * * *
Three of four Japanese producers reported selling *** percent of their 2013 PVA sales to U.S. customers on the spot market. Japanese producer *** reported selling *** percent of its 2013 PVA sales through annual contracts.6
U.S. producer Sekisui reported selling ***. U.S. producer Kuraray America reported selling ***. ***, an importer of PVA from China, reported selling ***. ***, an importer of PVA from China and Japan, reported selling ***.
Negotiations
Eleven purchasers reported that they purchase PVA weekly, five purchase monthly, two purchase daily, one purchases every other month, and one purchaser (***) reported that it ***. Sixteen of 19 purchasers reported that they do not expect their purchasing patterns to change in the next two years. Sixteen of 17 responding purchasers reported contacting 3 or fewer suppliers when making a purchase.7 Five of these 16 firms reported only contacting one supplier. Eleven of 19 purchasers reported that their PVA purchases usually involve negotiations with the supplier. Purchasers reported negotiating pricing, quality, volume, availability, payment terms, and service. Three firms stated that they do not share competitor’s pricing during negotiations.
Sales terms and discounts
*** and all 10 responding importers reported quoting prices on a delivered basis. U.S. producer and importer Kuraray America reported that it ***. U.S. producer and importer Sekisui reported that it ***. Eight of 10 responding importers reported offering no discounts, and one importer reported only offering total volume discounts. *** and eight of 11 importers reported sales terms of net 30 days. Two importers reported sales terms of net 60 days, one importer reported sales terms of net 15 days for consignment stock, and one reported that it requires cash in advance.
Price leadership
Purchasers primarily reported that U.S. producers Sekisui (identified by 8 firms) and Kuraray America (3 firms) were price leaders in the U.S. market. Purchasers reported that these
6 *** reported that its annual contracts ***. 7 One purchaser, ***, reported contacting three to five suppliers before making a purchase.
V‐5
suppliers are usually the first to announce price increases. Several purchasers also stated that Sekisui is the largest supplier in the U.S. market. One purchaser identified importer Perry as a price leader, and two firms reported that there were no price leaders.
PRICE DATA
The Commission requested U.S. producers and importers to provide quarterly data for the total quantity and f.o.b. value of the following PVA products shipped to unrelated U.S. end user customers during January 2008‐September 2014.
Product 1.‐‐ PVA for use in textile applications with a range of hydrolysis between 89‐100 (percent) and a viscosity between 13‐35 (centipois), sold in bags
Product 2.‐‐ PVA for use in adhesive applications with a range of hydrolysis between 80‐100 (percent) and a viscosity between 20‐35 (centipois), sold in bags
Product 3.‐‐ PVA for use in paper applications with a range of hydrolysis between 87‐100 (percent) and a viscosity between 13‐55 (centipois), sold in bags
Product 4.‐‐ PVA for use in adhesive applications with a range of hydrolysis between 80‐100 (percent) and a viscosity between 0‐19 (centipois), sold in bags
Product 5.‐‐ PVA for use in adhesive applications with a range of hydrolysis between 80‐89 (percent) and a viscosity between 36‐55 (centipois), sold in bags
Product 6.‐‐ PVA for use in PVB applications with a range of hydrolysis between 98‐100 (percent) and a viscosity between 28‐32 (centipois), sold in bulk (i.e. packed in railcars rather than bags)
Two U.S. producers and six importers provided usable pricing data for sales of the requested products, although not all firms reported pricing for all products for all quarters.8 Pricing data reported by these firms accounted for approximately *** percent of U.S. producers’ shipments of PVA, *** percent of subject imports from China, *** percent of imports from Japan, and *** percent of imports from nonsubject source Taiwan9 during 2008‐13 and January‐September 2014.10
8 Per‐unit pricing data are calculated from total quantity and total value data provided by U.S. producers and importers. The precision and variation of these figures may be affected by rounding, limited quantities, and producer or importer estimates.
9 A smaller importer of PVA from Taiwan, ***, provided quarterly price and quantity data for ***. Email from ***. These data reported by *** are not included in the pricing analysis.
10 Pricing data reported by these firms accounted for approximately *** percent of U.S. producers’ U.S. commercial shipments of PVA to end users, *** percent of importers’ U.S. commercial shipments of
(continued...)

V‐6
Price data for products 1‐5 are available for PVA from the United States, subject country China, and nonsubject source Taiwan. Price data for product 3 were also available for PVA from subject country Japan, although data were for small quantities of import sales with much higher unit values.11 Price data for product 6 (PVA for PVB applications) are only available for product from the United States. Product 6 was the highest volume product for sales of U.S.‐produced PVA and also had the lowest prices.
Generally, prices for all products fluctuated throughout January 2008‐September 2014. Prices for product 1 increased through mid‐to‐late 2008, decreased in 2009, then increased through the third quarter of 2014. U.S. prices for product 2 fluctuated and increased slightly from first quarter 2008 to third quarter 2014, while prices for product 2 from China decreased. Prices for product 2 from Taiwan peaked in mid‐2008 and declined to their lowest point in early 2009, then increased through late 2014. Prices for product 3 from the United States, China, and Taiwan generally followed the same trends and fluctuated from 2008 to 2010, increasing in early 2011 then fluctuated through third quarter 2014. Prices for product 4 from the United States and Taiwan increased in mid‐2008, declined through early 2010, then increased through 2014. Prices for product 5 from the United States peaked in mid‐2008 and late 2011, but returned to near first quarter 2008 levels by third quarter 2014. Price data for products 1‐6 are presented in tables V‐4 to V‐9 and figures V‐2 to V‐7.
Table V-4
PVA: Weighted-average f.o.b. prices and quantities of domestic and imported product 1 and margins of underselling/(overselling), by quarters, January 2008-September 2014
* * * * * * *
Table V-5
PVA: Weighted-average f.o.b. prices and quantities of domestic and imported product 2 and margins of underselling/(overselling), by quarters, January 2008-September 2014
* * * * * * *
Table V-6
PVA: Weighted-average f.o.b. prices and quantities of domestic and imported product 3 and margins of underselling/(overselling), by quarters, January 2008-September 2014
* * * * * * *
(…continued) PVA from China to end users, *** percent of importers’ U.S. commercial shipments of PVA from Japan to end users, and *** percent of importers’ U.S. commercial shipments of PVA from Taiwan to end users during 2008‐13 and January‐September 2014.
11 Japanese price data were reported by one importer, ***. The data are presented in table V‐6, but not in figure V‐4. ***. Email from ***.
V‐7
Table V-7
PVA: Weighted-average f.o.b. prices and quantities of domestic and imported product 4 and margins of underselling/(overselling), by quarters, January 2008-September 2014
* * * * * * *
Table V-8
PVA: Weighted-average f.o.b. prices and quantities of domestic and imported product 5 and margins of underselling/(overselling), by quarters, January 2008-September 2014
* * * * * * *
Table V-9
PVA: Weighted-average f.o.b. prices and quantities of domestic product 6, by quarters, January 2008-September 2014
* * * * * * *
Figure V-2
PVA: Weighted-average prices and quantities of domestic and imported product 1, by quarters, January 2008-September 2014
* * * * * * *
Figure V-3
PVA: Weighted-average prices and quantities of domestic and imported product 2, by quarters, January 2008-September 2014
* * * * * * *
Figure V-4
PVA: Weighted-average prices and quantities of domestic and imported product 3, by quarters, January 2008-September 2014
* * * * * * *
Figure V-5
PVA: Weighted-average prices and quantities of domestic and imported product 4, by quarters, January 2008-September 2014
* * * * * * *
Figure V-6
PVA: Weighted-average prices and quantities of domestic and imported product 5, by quarters, January 2008-September 2014
* * * * * * *

V‐8
Figure V-7
PVA: Weighted-average prices and quantities of domestic product 6, by quarters, January 2008-September 2014
* * * * * * *
Price trends
Table V‐10 summarizes the price trends, by product and by country. As shown in the table, U.S. prices for product 5 declined by *** percent, while domestic price increases for products 1‐4 and 6 ranged from *** percent. Price decreases for products 1‐2 and 5 imported from China ranged from *** percent, while price increases for products 3‐4 imported from China were *** percent, respectively. Prices for PVA imported from Taiwan increased for products 1‐5. Price increases ranged from *** percent.
Table V-10
PVA: Summary of weighted-average f.o.b. prices for products 1-6 from the United States, China, Japan, and Taiwan
Item
Number of quarters
Low price
(per pound)
High price
(per pound) Change in price1
(percent)
Product 1
United States 27 $*** $*** ***
China 27 *** *** ***
Taiwan 27 *** *** ***
Product 2
United States 27 *** *** ***
China 15 *** *** ***
Taiwan 27 *** *** ***
Product 3
United States 27 *** *** ***
China 25 *** *** ***
Japan 9 *** *** ***
Taiwan 27 *** *** ***
Product 4
United States 27 *** *** ***
China 23 *** *** ***
Taiwan 27 *** *** ***
Product 5
United States 27 *** *** ***
China 26 *** *** ***
Taiwan 27 *** *** ***
Product 6
United States 27 *** *** *** 1 Percentage change from the first quarter in which data were available to the last quarter in which price data were available.
Source: Compiled from data submitted in response to Commission questionnaires.
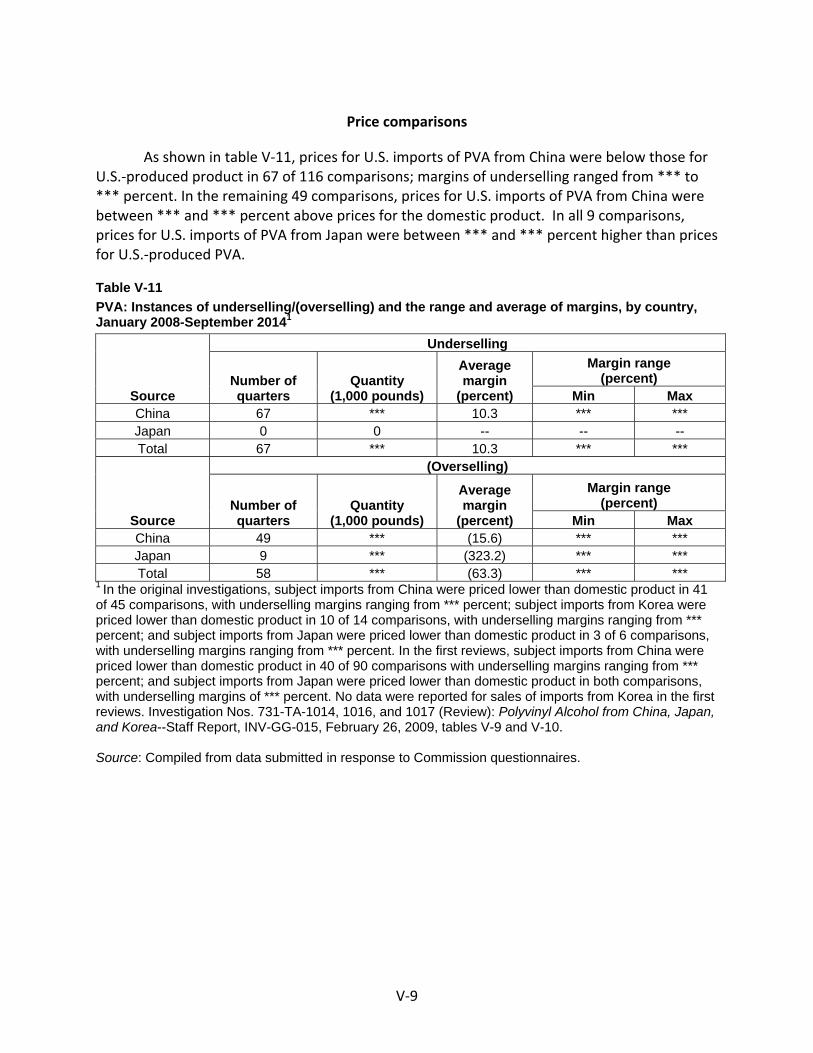
V‐9
Price comparisons
As shown in table V‐11, prices for U.S. imports of PVA from China were below those for U.S.‐produced product in 67 of 116 comparisons; margins of underselling ranged from *** to *** percent. In the remaining 49 comparisons, prices for U.S. imports of PVA from China were between *** and *** percent above prices for the domestic product. In all 9 comparisons, prices for U.S. imports of PVA from Japan were between *** and *** percent higher than prices for U.S.‐produced PVA.
Table V-11
PVA: Instances of underselling/(overselling) and the range and average of margins, by country, January 2008-September 20141
Source
Underselling
Number of quarters
Quantity (1,000 pounds)
Average margin
(percent)
Margin range (percent)
Min Max China 67 *** 10.3 *** *** Japan 0 0 -- -- -- Total 67 *** 10.3 *** ***
Source
(Overselling)
Number of quarters
Quantity (1,000 pounds)
Average margin
(percent)
Margin range (percent)
Min Max China 49 *** (15.6) *** *** Japan 9 *** (323.2) *** *** Total 58 *** (63.3) *** ***
1 In the original investigations, subject imports from China were priced lower than domestic product in 41 of 45 comparisons, with underselling margins ranging from *** percent; subject imports from Korea were priced lower than domestic product in 10 of 14 comparisons, with underselling margins ranging from *** percent; and subject imports from Japan were priced lower than domestic product in 3 of 6 comparisons, with underselling margins ranging from *** percent. In the first reviews, subject imports from China were priced lower than domestic product in 40 of 90 comparisons with underselling margins ranging from *** percent; and subject imports from Japan were priced lower than domestic product in both comparisons, with underselling margins of *** percent. No data were reported for sales of imports from Korea in the first reviews. Investigation Nos. 731-TA-1014, 1016, and 1017 (Review): Polyvinyl Alcohol from China, Japan, and Korea--Staff Report, INV-GG-015, February 26, 2009, tables V-9 and V-10. Source: Compiled from data submitted in response to Commission questionnaires.

V‐10
Purchasers’ perceptions of relative price trends
Purchasers were asked how the prices of PVA from the United States had changed relative to the prices of PVA from China, Korea, and Japan since 2008. Five purchasers reported that prices had changed by the same amount. Six purchasers reported that the price of U.S.‐produced PVA is now higher than PVA from China, and one purchaser reported that it is now lower. Three purchasers reported that the price of U.S.‐produced PVA is now higher than PVA from Japan, and one purchaser reported that it is lower. One purchaser reported that the price of U.S.‐produced PVA is now higher than the price of PVA from Korea, and one reported that it is lower.

A‐1
APPENDIX A
FEDERAL REGISTER NOTICES

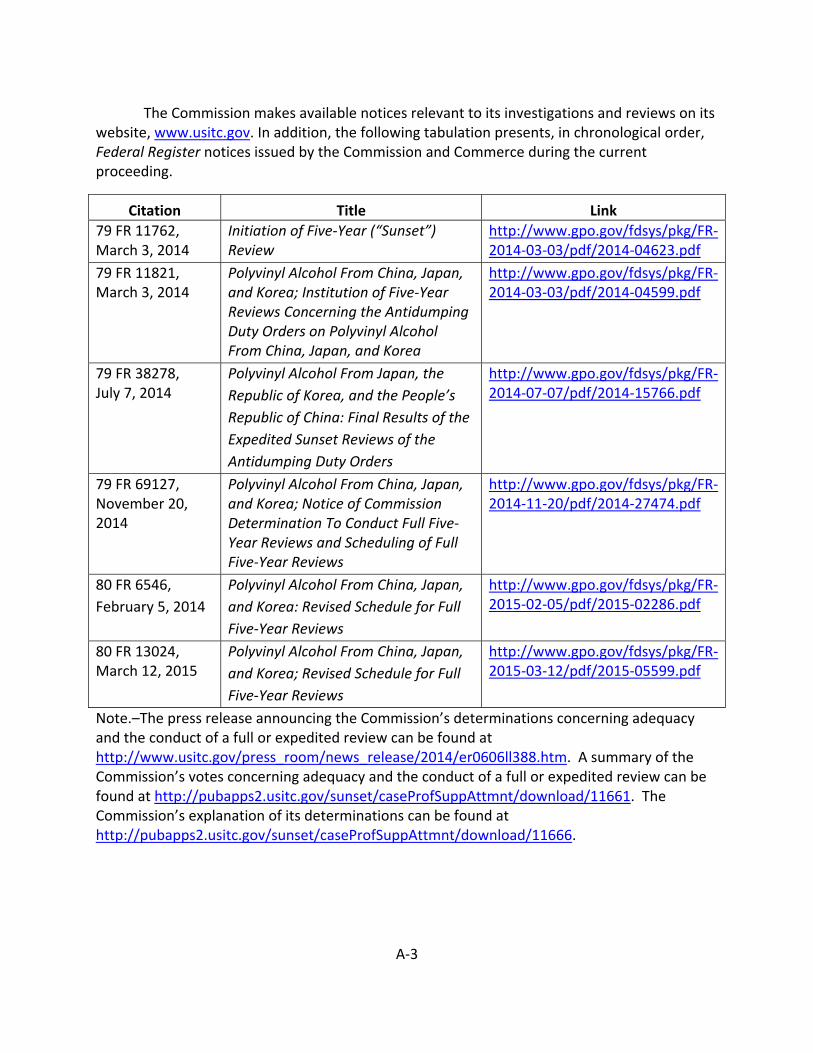
A‐3
The Commission makes available notices relevant to its investigations and reviews on its website, www.usitc.gov. In addition, the following tabulation presents, in chronological order, Federal Register notices issued by the Commission and Commerce during the current proceeding.
Citation Title Link
79 FR 11762, March 3, 2014
Initiation of Five‐Year (“Sunset”) Review
http://www.gpo.gov/fdsys/pkg/FR‐2014‐03‐03/pdf/2014‐04623.pdf
79 FR 11821, March 3, 2014
Polyvinyl Alcohol From China, Japan, and Korea; Institution of Five‐Year Reviews Concerning the Antidumping Duty Orders on Polyvinyl Alcohol From China, Japan, and Korea
http://www.gpo.gov/fdsys/pkg/FR‐2014‐03‐03/pdf/2014‐04599.pdf
79 FR 38278, July 7, 2014
Polyvinyl Alcohol From Japan, the
Republic of Korea, and the People’s
Republic of China: Final Results of the
Expedited Sunset Reviews of the
Antidumping Duty Orders
http://www.gpo.gov/fdsys/pkg/FR‐2014‐07‐07/pdf/2014‐15766.pdf
79 FR 69127, November 20, 2014
Polyvinyl Alcohol From China, Japan, and Korea; Notice of Commission Determination To Conduct Full Five‐Year Reviews and Scheduling of Full Five‐Year Reviews
http://www.gpo.gov/fdsys/pkg/FR‐2014‐11‐20/pdf/2014‐27474.pdf
80 FR 6546,
February 5, 2014
Polyvinyl Alcohol From China, Japan,
and Korea: Revised Schedule for Full
Five‐Year Reviews
http://www.gpo.gov/fdsys/pkg/FR‐2015‐02‐05/pdf/2015‐02286.pdf
80 FR 13024, March 12, 2015
Polyvinyl Alcohol From China, Japan,
and Korea; Revised Schedule for Full
Five‐Year Reviews
http://www.gpo.gov/fdsys/pkg/FR‐2015‐03‐12/pdf/2015‐05599.pdf
Note.–The press release announcing the Commission’s determinations concerning adequacy and the conduct of a full or expedited review can be found at http://www.usitc.gov/press_room/news_release/2014/er0606ll388.htm. A summary of the Commission’s votes concerning adequacy and the conduct of a full or expedited review can be found at http://pubapps2.usitc.gov/sunset/caseProfSuppAttmnt/download/11661. The Commission’s explanation of its determinations can be found at http://pubapps2.usitc.gov/sunset/caseProfSuppAttmnt/download/11666.

B‐1
APPENDIX B
THE DOMESTIC INTERESTED PARTIES’ REQUEST TO CANCEL THE COMMISSION’S HEARING


APPENDIX C
SUMMARY DATA


Table C-1PVA: Summary data concerning the U.S. market, 2008-13, January to September 2013, and January to September 2014
2008 2009 2010 2011 2012 2013 2013 2014U.S. consumption quantity:
Amount........................................................ *** *** *** *** *** *** *** ***Producers' share (fn1).................................. *** *** *** *** *** *** *** ***Importers' share (fn1):
China........................................................ *** *** *** *** *** *** *** ***Japan....................................................... *** *** *** *** *** *** *** ***Korea........................................................ *** *** *** *** *** *** *** ***
Subject sources..................................... *** *** *** *** *** *** *** ***Taiwan...................................................... *** *** *** *** *** *** *** ***All others sources..................................... *** *** *** *** *** *** *** ***
Nonsubject sources............................... *** *** *** *** *** *** *** ***Total imports....................................... *** *** *** *** *** *** *** ***
U.S. consumption value:Amount........................................................ *** *** *** *** *** *** *** ***Producers' share (fn1).................................. *** *** *** *** *** *** *** ***Importers' share (fn1):
China........................................................ *** *** *** *** *** *** *** ***Japan....................................................... *** *** *** *** *** *** *** ***Korea........................................................ *** *** *** *** *** *** *** ***
Subject sources..................................... *** *** *** *** *** *** *** ***Taiwan...................................................... *** *** *** *** *** *** *** ***All others sources..................................... *** *** *** *** *** *** *** ***
Nonsubject sources............................... *** *** *** *** *** *** *** ***Total imports....................................... *** *** *** *** *** *** *** ***
U.S. imports from:China:
Quantity.................................................... 1,449 5,776 7,904 6,525 11,394 12,399 9,385 10,892 Value........................................................ 1,675 5,738 7,861 6,965 11,870 12,496 9,462 11,386 Unit value.................................................. $1.16 $0.99 $0.99 $1.07 $1.04 $1.01 $1.01 $1.05 Ending inventory quantity.......................... *** *** *** *** *** *** *** ***
Japan:Quantity.................................................... *** *** *** *** *** *** *** ***Value........................................................ *** *** *** *** *** *** *** ***Unit value.................................................. *** *** *** *** *** *** *** ***Ending inventory quantity.......................... *** *** *** *** *** *** *** ***
Korea:Quantity.................................................... 0 0 0 0 0 0 0 0 Value........................................................ 0 0 0 0 0 0 0 0 Unit value.................................................. fn3 fn3 fn3 fn3 fn3 fn3 fn3 fn3Ending inventory quantity.......................... *** *** *** *** *** *** *** ***
Subject sources:Quantity.................................................... *** *** *** *** *** *** *** ***Value........................................................ *** *** *** *** *** *** *** ***Unit value.................................................. *** *** *** *** *** *** *** ***Ending inventory quantity.......................... *** *** *** *** *** *** *** ***
Taiwan:Quantity.................................................... *** *** *** *** *** *** *** ***Value........................................................ *** *** *** *** *** *** *** ***Unit value.................................................. *** *** *** *** *** *** *** ***Ending inventory quantity.......................... *** *** *** *** *** *** *** ***
All other sources:Quantity.................................................... *** *** *** *** *** *** *** ***Value........................................................ *** *** *** *** *** *** *** ***Unit value.................................................. *** *** *** *** *** *** *** ***Ending inventory quantity.......................... *** *** *** *** *** *** *** ***
Nonsubject sources:Quantity.................................................... *** *** *** *** *** *** *** ***Value........................................................ *** *** *** *** *** *** *** ***Unit value.................................................. *** *** *** *** *** *** *** ***Ending inventory quantity.......................... *** *** *** *** *** *** *** ***
Total imports:Quantity.................................................... *** *** *** *** *** *** *** ***Value........................................................ *** *** *** *** *** *** *** ***Unit value.................................................. *** *** *** *** *** *** *** ***Ending inventory quantity.......................... *** *** *** *** *** *** *** ***
Table continued next page.
(Quantity=1,000 pounds; Value=1,000 dollars; Unit values, unit labor costs, and unit expenses=dollars per pound; Period changes=percent--exceptions noted)
C-3
January to SeptemberCalendar yearReported data

Table C-1--ContinuedPVA: Summary data concerning the U.S. market, 2008-13, January to September 2013, and January to September 2014
Jan-Sep2008-13 2008-09 2009-10 2010-11 2011-12 2012-13 2013-14
U.S. consumption quantity:Amount........................................................ *** *** *** *** *** *** ***Producers' share (fn1).................................. *** *** *** *** *** *** ***Importers' share (fn1):
China........................................................ *** *** *** *** *** *** ***Japan....................................................... *** *** *** *** *** *** ***Korea........................................................ *** *** *** *** *** *** ***
Subject sources..................................... *** *** *** *** *** *** ***Taiwan...................................................... *** *** *** *** *** *** ***All others sources..................................... *** *** *** *** *** *** ***
Nonsubject sources............................... *** *** *** *** *** *** ***Total imports....................................... *** *** *** *** *** *** ***
U.S. consumption value:Amount........................................................ *** *** *** *** *** *** ***Producers' share (fn1).................................. *** *** *** *** *** *** ***Importers' share (fn1):
China........................................................ *** *** *** *** *** *** ***Japan....................................................... *** *** *** *** *** *** ***Korea........................................................ *** *** *** *** *** *** ***
Subject sources..................................... *** *** *** *** *** *** ***Taiwan...................................................... *** *** *** *** *** *** ***All others sources..................................... *** *** *** *** *** *** ***
Nonsubject sources............................... *** *** *** *** *** *** ***Total imports....................................... *** *** *** *** *** *** ***
U.S. imports from:China:
Quantity.................................................... 755.8 298.7 36.9 (17.5) 74.6 8.8 16.1 Value........................................................ 646.0 242.6 37.0 (11.4) 70.4 5.3 20.3 Unit value.................................................. (12.8) (14.1) 0.1 7.3 (2.4) (3.3) 3.7 Ending inventory quantity.......................... *** *** *** *** *** *** ***
Japan:Quantity.................................................... *** *** *** *** *** *** ***Value........................................................ *** *** *** *** *** *** ***Unit value.................................................. *** *** *** *** *** *** ***Ending inventory quantity.......................... *** *** *** *** *** *** ***
Korea:Quantity.................................................... fn3 fn3 fn3 fn3 fn3 fn3 fn3Value........................................................ fn3 fn3 fn3 fn3 fn3 fn3 fn3Unit value.................................................. fn3 fn3 fn3 fn3 fn3 fn3 fn3Ending inventory quantity.......................... *** *** *** *** *** *** ***
Subject sources:Quantity.................................................... *** *** *** *** *** *** ***Value........................................................ *** *** *** *** *** *** ***Unit value.................................................. *** *** *** *** *** *** ***Ending inventory quantity.......................... *** *** *** *** *** *** ***
Taiwan:Quantity.................................................... *** *** *** *** *** *** ***Value........................................................ *** *** *** *** *** *** ***Unit value.................................................. *** *** *** *** *** *** ***Ending inventory quantity.......................... *** *** *** *** *** *** ***
All other sources:Quantity.................................................... *** *** *** *** *** *** ***Value........................................................ *** *** *** *** *** *** ***Unit value.................................................. *** *** *** *** *** *** ***Ending inventory quantity.......................... *** *** *** *** *** *** ***
Nonsubject sources:Quantity.................................................... *** *** *** *** *** *** ***Value........................................................ *** *** *** *** *** *** ***Unit value.................................................. *** *** *** *** *** *** ***Ending inventory quantity.......................... *** *** *** *** *** *** ***
Total imports:Quantity.................................................... *** *** *** *** *** *** ***Value........................................................ *** *** *** *** *** *** ***Unit value.................................................. *** *** *** *** *** *** ***Ending inventory quantity.......................... *** *** *** *** *** *** ***
Table continued next page.
C-4
Calendar yearPeriod changes
(Quantity=1,000 pounds; Value=1,000 dollars; Unit values, unit labor costs, and unit expenses=dollars per pound; Period changes=percent--exceptions noted)

Table C-1--ContinuedPVA: Summary data concerning the U.S. market, 2008-13, January to September 2013, and January to September 2014
2008 2009 2010 2011 2012 2013 2013 2014U.S. producers':
Average capacity quantity............................ *** *** *** *** *** *** *** ***Production quantity...................................... *** *** *** *** *** *** *** ***Capacity utilization (fn1)............................... *** *** *** *** *** *** *** ***U.S. shipments:
Quantity.................................................... *** *** *** *** *** *** *** ***Value........................................................ *** *** *** *** *** *** *** ***Unit value.................................................. *** *** *** *** *** *** *** ***
Export shipments:Quantity.................................................... *** *** *** *** *** *** *** ***Value........................................................ *** *** *** *** *** *** *** ***Unit value.................................................. *** *** *** *** *** *** *** ***
Ending inventory quantity............................. *** *** *** *** *** *** *** ***Inventories/total shipments (fn1).................. *** *** *** *** *** *** *** ***Production-related workers.......................... *** *** *** *** *** *** *** ***Hours worked (1,000s)................................. *** *** *** *** *** *** *** ***Wages paid ($1,000).................................... *** *** *** *** *** *** *** ***Hourly wages............................................... *** *** *** *** *** *** *** ***Productivity (pounds per hour)..................... *** *** *** *** *** *** *** ***Unit labor costs............................................ *** *** *** *** *** *** *** ***Net sales:
Quantity.................................................... *** *** *** *** *** *** *** ***Value........................................................ *** *** *** *** *** *** *** ***Unit value.................................................. *** *** *** *** *** *** *** ***
Cost of goods sold (COGS)......................... *** *** *** *** *** *** *** ***Gross profit or (loss).................................... *** *** *** *** *** *** *** ***SG&A expenses.......................................... *** *** *** *** *** *** *** ***Operating income or (loss)........................... *** *** *** *** *** *** *** ***Unit COGS................................................... *** *** *** *** *** *** *** ***Unit SG&A expenses................................... *** *** *** *** *** *** *** ***Unit operating income or (loss)..................... *** *** *** *** *** *** *** ***COGS/sales (fn1)........................................ *** *** *** *** *** *** *** ***Operating income or (loss)/sales (fn1).......... *** *** *** *** *** *** *** ***Capital expenditures.................................... *** *** *** *** *** *** *** ***
Table continued next page.
Reported dataCalendar year January to September
(Quantity=1,000 pounds; Value=1,000 dollars; Unit values, unit labor costs, and unit expenses=dollars per pound; Period changes=percent--exceptions noted)
C-5
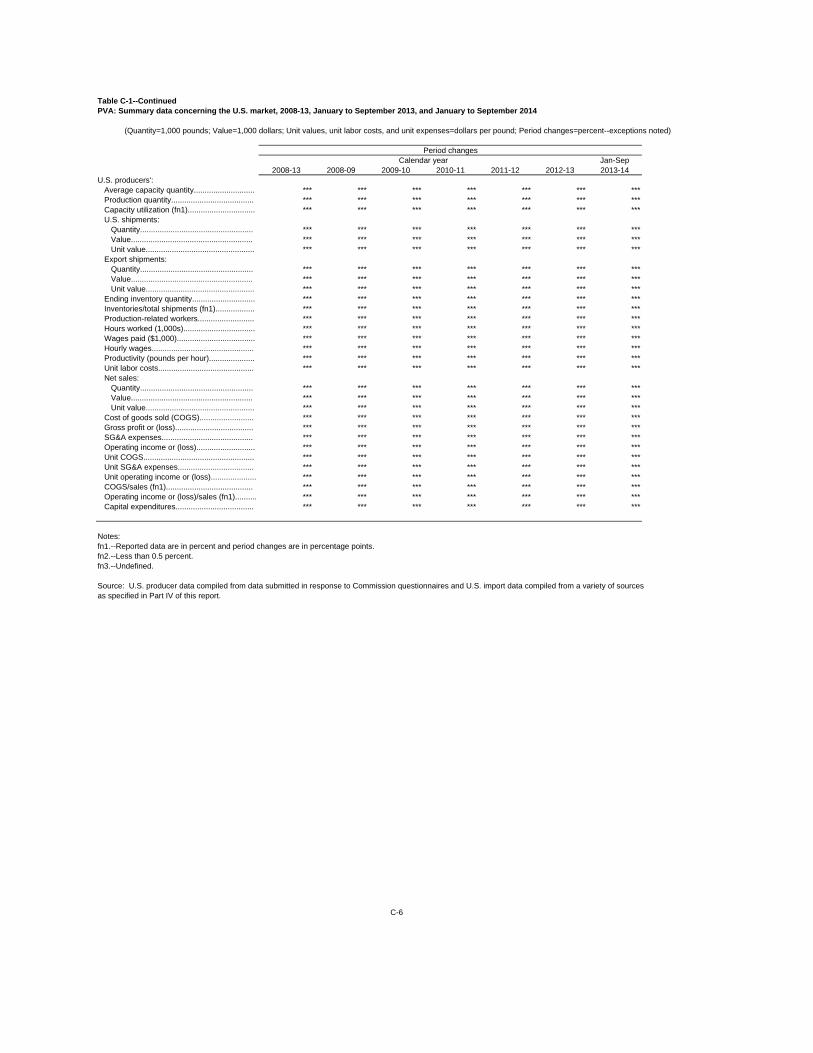
Table C-1--ContinuedPVA: Summary data concerning the U.S. market, 2008-13, January to September 2013, and January to September 2014
Jan-Sep2008-13 2008-09 2009-10 2010-11 2011-12 2012-13 2013-14
U.S. producers':Average capacity quantity............................ *** *** *** *** *** *** ***Production quantity...................................... *** *** *** *** *** *** ***Capacity utilization (fn1)............................... *** *** *** *** *** *** ***U.S. shipments:
Quantity.................................................... *** *** *** *** *** *** ***Value........................................................ *** *** *** *** *** *** ***Unit value.................................................. *** *** *** *** *** *** ***
Export shipments:Quantity.................................................... *** *** *** *** *** *** ***Value........................................................ *** *** *** *** *** *** ***Unit value.................................................. *** *** *** *** *** *** ***
Ending inventory quantity............................. *** *** *** *** *** *** ***Inventories/total shipments (fn1).................. *** *** *** *** *** *** ***Production-related workers.......................... *** *** *** *** *** *** ***Hours worked (1,000s)................................. *** *** *** *** *** *** ***Wages paid ($1,000).................................... *** *** *** *** *** *** ***Hourly wages............................................... *** *** *** *** *** *** ***Productivity (pounds per hour)..................... *** *** *** *** *** *** ***Unit labor costs............................................ *** *** *** *** *** *** ***Net sales:
Quantity.................................................... *** *** *** *** *** *** ***Value........................................................ *** *** *** *** *** *** ***Unit value.................................................. *** *** *** *** *** *** ***
Cost of goods sold (COGS)......................... *** *** *** *** *** *** ***Gross profit or (loss).................................... *** *** *** *** *** *** ***SG&A expenses.......................................... *** *** *** *** *** *** ***Operating income or (loss)........................... *** *** *** *** *** *** ***Unit COGS................................................... *** *** *** *** *** *** ***Unit SG&A expenses................................... *** *** *** *** *** *** ***Unit operating income or (loss)..................... *** *** *** *** *** *** ***COGS/sales (fn1)........................................ *** *** *** *** *** *** ***Operating income or (loss)/sales (fn1).......... *** *** *** *** *** *** ***Capital expenditures.................................... *** *** *** *** *** *** ***
Notes:fn1.--Reported data are in percent and period changes are in percentage points.fn2.--Less than 0.5 percent. fn3.--Undefined.
Source: U.S. producer data compiled from data submitted in response to Commission questionnaires and U.S. import data compiled from a variety of sourcesas specified in Part IV of this report.
Calendar year
C-6
Period changes
(Quantity=1,000 pounds; Value=1,000 dollars; Unit values, unit labor costs, and unit expenses=dollars per pound; Period changes=percent--exceptions noted)

Table C-2PVA: Summary data concerning the U.S. merchant market, 2008-13, January to September 2013, and January to September 2014
2008 2009 2010 2011 2012 2013 2013 2014U.S. consumption quantity:
Amount........................................................ *** *** *** *** *** *** *** ***Producers' share (fn1).................................. *** *** *** *** *** *** *** ***Importers' share (fn1):
China........................................................ *** *** *** *** *** *** *** ***Japan....................................................... *** *** *** *** *** *** *** ***Korea........................................................ *** *** *** *** *** *** *** ***
Subject sources..................................... *** *** *** *** *** *** *** ***Taiwan...................................................... *** *** *** *** *** *** *** ***All others sources..................................... *** *** *** *** *** *** *** ***
Nonsubject sources............................... *** *** *** *** *** *** *** ***Total imports....................................... *** *** *** *** *** *** *** ***
U.S. consumption value:Amount........................................................ *** *** *** *** *** *** *** ***Producers' share (fn1).................................. *** *** *** *** *** *** *** ***Importers' share (fn1):
China........................................................ *** *** *** *** *** *** *** ***Japan....................................................... *** *** *** *** *** *** *** ***Korea........................................................ *** *** *** *** *** *** *** ***
Subject sources..................................... *** *** *** *** *** *** *** ***Taiwan...................................................... *** *** *** *** *** *** *** ***All others sources..................................... *** *** *** *** *** *** *** ***
Nonsubject sources............................... *** *** *** *** *** *** *** ***Total imports....................................... *** *** *** *** *** *** *** ***
U.S. imports from:China:
Quantity.................................................... 1,449 5,776 7,904 6,525 11,394 12,399 9,385 10,892 Value........................................................ 1,675 5,738 7,861 6,965 11,870 12,496 9,462 11,386 Unit value.................................................. $1.16 $0.99 $0.99 $1.07 $1.04 $1.01 $1.01 $1.05 Ending inventory quantity.......................... *** *** *** *** *** *** *** ***
Japan:Quantity.................................................... *** *** *** *** *** *** *** ***Value........................................................ *** *** *** *** *** *** *** ***Unit value.................................................. *** *** *** *** *** *** *** ***Ending inventory quantity.......................... *** *** *** *** *** *** *** ***
Korea:Quantity.................................................... 0 0 0 0 0 0 0 0 Value........................................................ 0 0 0 0 0 0 0 0 Unit value.................................................. fn2 fn2 fn2 fn2 fn2 fn2 fn2 fn2Ending inventory quantity.......................... *** *** *** *** *** *** *** ***
Subject sources:Quantity.................................................... *** *** *** *** *** *** *** ***Value........................................................ *** *** *** *** *** *** *** ***Unit value.................................................. *** *** *** *** *** *** *** ***Ending inventory quantity.......................... *** *** *** *** *** *** *** ***
Taiwan:Quantity.................................................... *** *** *** *** *** *** *** ***Value........................................................ *** *** *** *** *** *** *** ***Unit value.................................................. *** *** *** *** *** *** *** ***Ending inventory quantity.......................... *** *** *** *** *** *** *** ***
All other sources:Quantity.................................................... *** *** *** *** *** *** *** ***Value........................................................ *** *** *** *** *** *** *** ***Unit value.................................................. *** *** *** *** *** *** *** ***Ending inventory quantity.......................... *** *** *** *** *** *** *** ***
Nonsubject sources:Quantity.................................................... *** *** *** *** *** *** *** ***Value........................................................ *** *** *** *** *** *** *** ***Unit value.................................................. *** *** *** *** *** *** *** ***Ending inventory quantity.......................... *** *** *** *** *** *** *** ***
Total imports:Quantity.................................................... *** *** *** *** *** *** *** ***Value........................................................ *** *** *** *** *** *** *** ***Unit value.................................................. *** *** *** *** *** *** *** ***Ending inventory quantity.......................... *** *** *** *** *** *** *** ***
Table continued next page.
C-7
(Quantity=1,000 pounds; Value=1,000 dollars; Unit values, unit labor costs, and unit expenses=dollars per pound; Period changes=percent--exceptions noted)
Reported dataCalendar year January to September
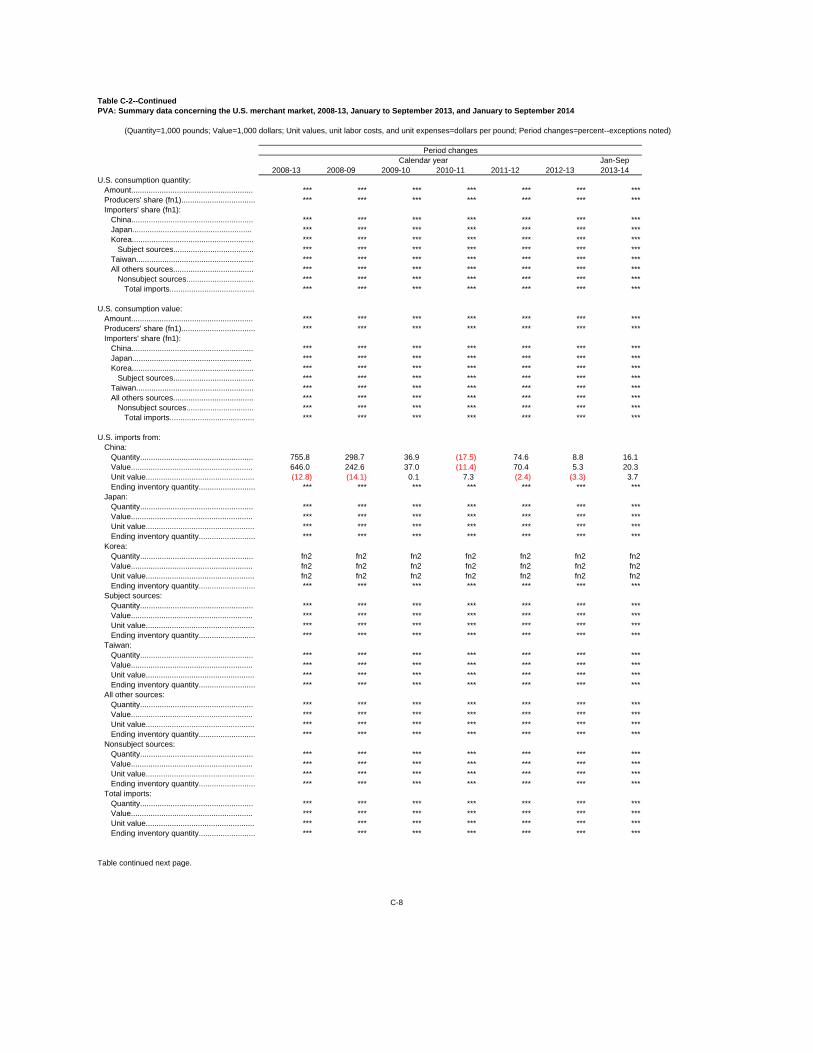
Table C-2--ContinuedPVA: Summary data concerning the U.S. merchant market, 2008-13, January to September 2013, and January to September 2014
Jan-Sep2008-13 2008-09 2009-10 2010-11 2011-12 2012-13 2013-14
U.S. consumption quantity:Amount........................................................ *** *** *** *** *** *** ***Producers' share (fn1).................................. *** *** *** *** *** *** ***Importers' share (fn1):
China........................................................ *** *** *** *** *** *** ***Japan....................................................... *** *** *** *** *** *** ***Korea........................................................ *** *** *** *** *** *** ***
Subject sources..................................... *** *** *** *** *** *** ***Taiwan...................................................... *** *** *** *** *** *** ***All others sources..................................... *** *** *** *** *** *** ***
Nonsubject sources............................... *** *** *** *** *** *** ***Total imports....................................... *** *** *** *** *** *** ***
U.S. consumption value:Amount........................................................ *** *** *** *** *** *** ***Producers' share (fn1).................................. *** *** *** *** *** *** ***Importers' share (fn1):
China........................................................ *** *** *** *** *** *** ***Japan....................................................... *** *** *** *** *** *** ***Korea........................................................ *** *** *** *** *** *** ***
Subject sources..................................... *** *** *** *** *** *** ***Taiwan...................................................... *** *** *** *** *** *** ***All others sources..................................... *** *** *** *** *** *** ***
Nonsubject sources............................... *** *** *** *** *** *** ***Total imports....................................... *** *** *** *** *** *** ***
U.S. imports from:China:
Quantity.................................................... 755.8 298.7 36.9 (17.5) 74.6 8.8 16.1 Value........................................................ 646.0 242.6 37.0 (11.4) 70.4 5.3 20.3 Unit value.................................................. (12.8) (14.1) 0.1 7.3 (2.4) (3.3) 3.7 Ending inventory quantity.......................... *** *** *** *** *** *** ***
Japan:Quantity.................................................... *** *** *** *** *** *** ***Value........................................................ *** *** *** *** *** *** ***Unit value.................................................. *** *** *** *** *** *** ***Ending inventory quantity.......................... *** *** *** *** *** *** ***
Korea:Quantity.................................................... fn2 fn2 fn2 fn2 fn2 fn2 fn2Value........................................................ fn2 fn2 fn2 fn2 fn2 fn2 fn2Unit value.................................................. fn2 fn2 fn2 fn2 fn2 fn2 fn2Ending inventory quantity.......................... *** *** *** *** *** *** ***
Subject sources:Quantity.................................................... *** *** *** *** *** *** ***Value........................................................ *** *** *** *** *** *** ***Unit value.................................................. *** *** *** *** *** *** ***Ending inventory quantity.......................... *** *** *** *** *** *** ***
Taiwan:Quantity.................................................... *** *** *** *** *** *** ***Value........................................................ *** *** *** *** *** *** ***Unit value.................................................. *** *** *** *** *** *** ***Ending inventory quantity.......................... *** *** *** *** *** *** ***
All other sources:Quantity.................................................... *** *** *** *** *** *** ***Value........................................................ *** *** *** *** *** *** ***Unit value.................................................. *** *** *** *** *** *** ***Ending inventory quantity.......................... *** *** *** *** *** *** ***
Nonsubject sources:Quantity.................................................... *** *** *** *** *** *** ***Value........................................................ *** *** *** *** *** *** ***Unit value.................................................. *** *** *** *** *** *** ***Ending inventory quantity.......................... *** *** *** *** *** *** ***
Total imports:Quantity.................................................... *** *** *** *** *** *** ***Value........................................................ *** *** *** *** *** *** ***Unit value.................................................. *** *** *** *** *** *** ***Ending inventory quantity.......................... *** *** *** *** *** *** ***
Table continued next page.
Calendar year
C-8
(Quantity=1,000 pounds; Value=1,000 dollars; Unit values, unit labor costs, and unit expenses=dollars per pound; Period changes=percent--exceptions noted)
Period changes

Table C-2--ContinuedPVA: Summary data concerning the U.S. merchant market, 2008-13, January to September 2013, and January to September 2014
2008 2009 2010 2011 2012 2013 2013 2014U.S. producers':
U.S. commecial shipments:Quantity.................................................... *** *** *** *** *** *** *** ***Value........................................................ *** *** *** *** *** *** *** ***Unit value.................................................. *** *** *** *** *** *** *** ***
Commercial export shipments:Quantity.................................................... *** *** *** *** *** *** *** ***Value........................................................ *** *** *** *** *** *** *** ***Unit value.................................................. *** *** *** *** *** *** *** ***
Commercial sales:Quantity.................................................... *** *** *** *** *** *** *** ***Value........................................................ *** *** *** *** *** *** *** ***Unit value.................................................. *** *** *** *** *** *** *** ***
Cost of goods sold (COGS)......................... *** *** *** *** *** *** *** ***Gross profit or (loss).................................... *** *** *** *** *** *** *** ***SG&A expenses.......................................... *** *** *** *** *** *** *** ***Operating income or (loss)........................... *** *** *** *** *** *** *** ***Unit COGS................................................... *** *** *** *** *** *** *** ***Unit SG&A expenses................................... *** *** *** *** *** *** *** ***Unit operating income or (loss)..................... *** *** *** *** *** *** *** ***COGS/sales (fn1)........................................ *** *** *** *** *** *** *** ***Operating income or (loss)/sales (fn1).......... *** *** *** *** *** *** *** ***
Table continued next page.
C-9
(Quantity=1,000 pounds; Value=1,000 dollars; Unit values, unit labor costs, and unit expenses=dollars per pound; Period changes=percent--exceptions noted)
Reported dataCalendar year January to September
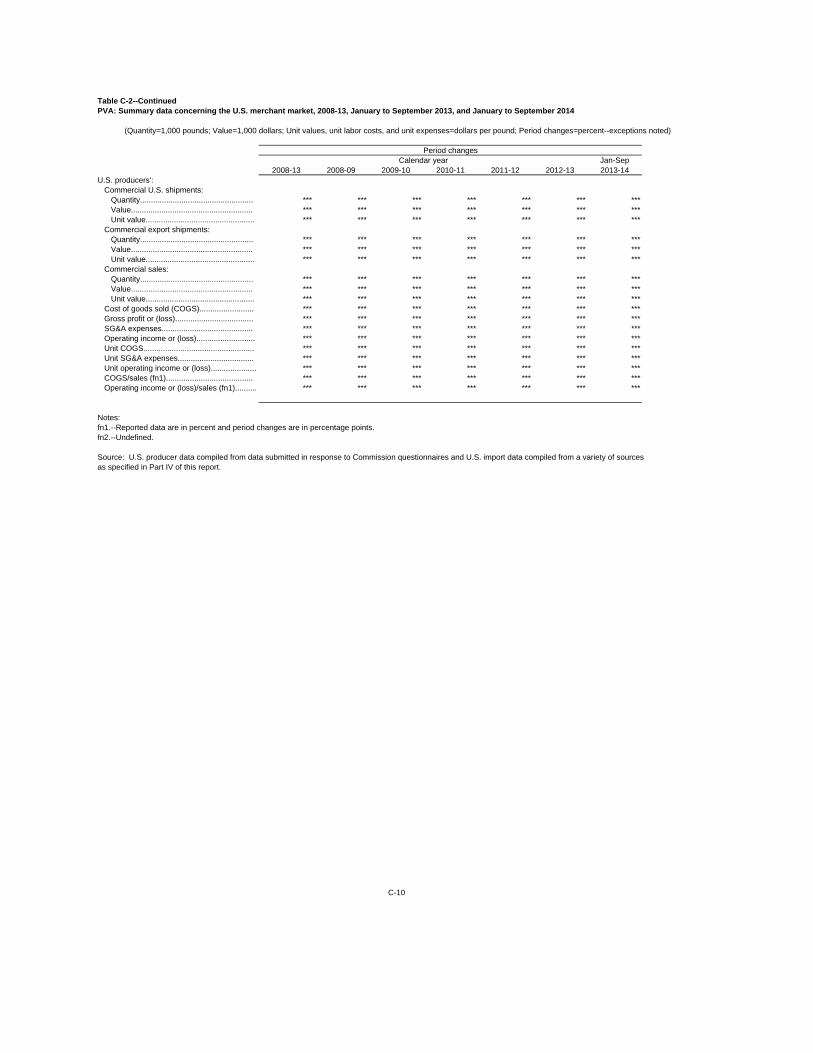
Table C-2--ContinuedPVA: Summary data concerning the U.S. merchant market, 2008-13, January to September 2013, and January to September 2014
Jan-Sep2008-13 2008-09 2009-10 2010-11 2011-12 2012-13 2013-14
U.S. producers':Commercial U.S. shipments:
Quantity.................................................... *** *** *** *** *** *** ***Value........................................................ *** *** *** *** *** *** ***Unit value.................................................. *** *** *** *** *** *** ***
Commercial export shipments:Quantity.................................................... *** *** *** *** *** *** ***Value........................................................ *** *** *** *** *** *** ***Unit value.................................................. *** *** *** *** *** *** ***
Commercial sales:Quantity.................................................... *** *** *** *** *** *** ***Value........................................................ *** *** *** *** *** *** ***Unit value.................................................. *** *** *** *** *** *** ***
Cost of goods sold (COGS)......................... *** *** *** *** *** *** ***Gross profit or (loss).................................... *** *** *** *** *** *** ***SG&A expenses.......................................... *** *** *** *** *** *** ***Operating income or (loss)........................... *** *** *** *** *** *** ***Unit COGS................................................... *** *** *** *** *** *** ***Unit SG&A expenses................................... *** *** *** *** *** *** ***Unit operating income or (loss)..................... *** *** *** *** *** *** ***COGS/sales (fn1)........................................ *** *** *** *** *** *** ***Operating income or (loss)/sales (fn1).......... *** *** *** *** *** *** ***
Notes:fn1.--Reported data are in percent and period changes are in percentage points.fn2.--Undefined.
Source: U.S. producer data compiled from data submitted in response to Commission questionnaires and U.S. import data compiled from a variety of sourcesas specified in Part IV of this report.
Calendar year
C-10
(Quantity=1,000 pounds; Value=1,000 dollars; Unit values, unit labor costs, and unit expenses=dollars per pound; Period changes=percent--exceptions noted)
Period changes

HISTORICAL SUMMARY DATA
FROM THE COMMISSION’S ORIGINAL INVESTIGATIONS


HISTORICAL SUMMARY DATA
FROM THE COMMISSION’S FIRST FIVE‐YEAR REVIEWS

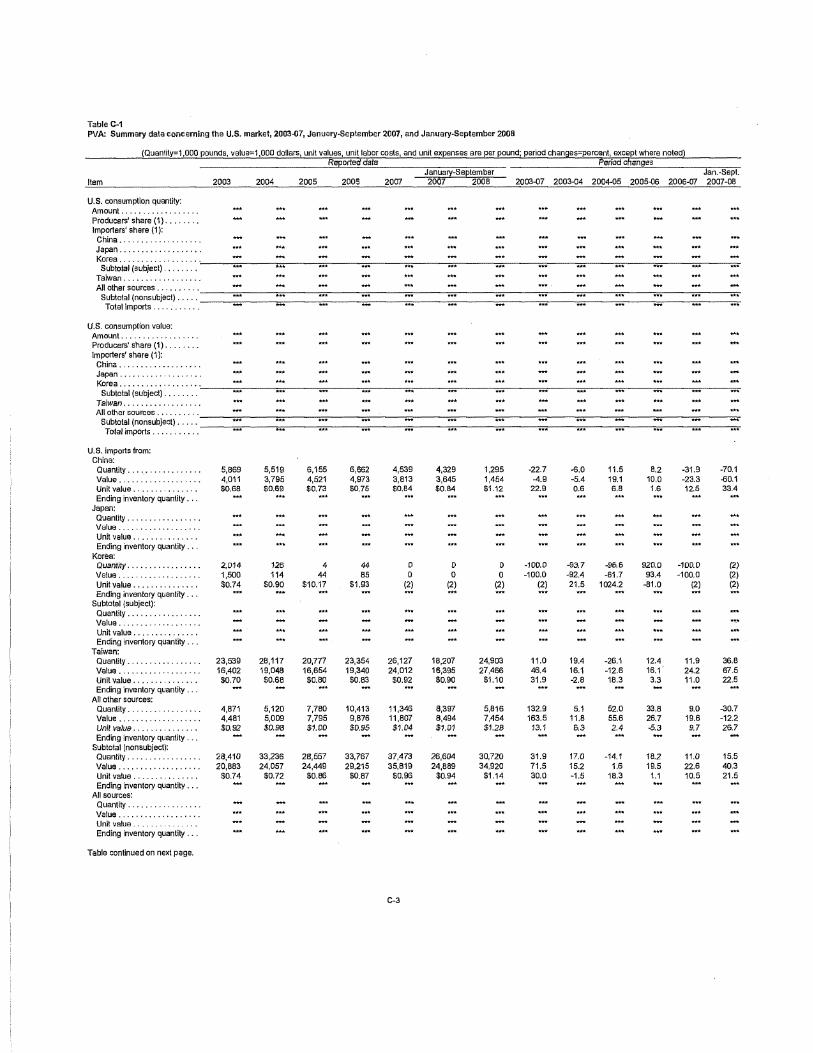

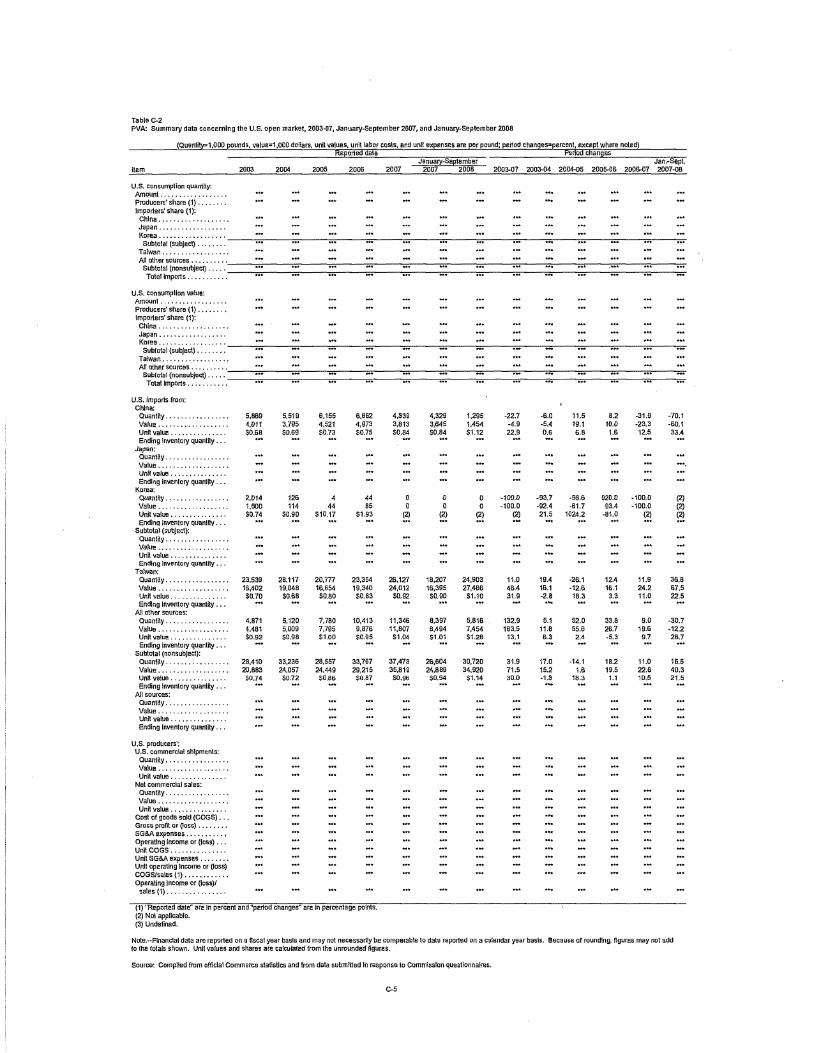


D‐1
APPENDIX D
COMMENTS BY U.S. PRODUCERS, IMPORTERS, PURCHASERS, AND FOREIGN PRODUCERS REGARDING THE EFFECTS OF THE ORDERS AND THE LIKELY EFFECTS OF REVOCATION


D‐3
The information in Appendix D is entirely confidential and has been redacted.
* * * * * * *