polypharmacy and opioid use among medicare part d enrollees
TRANSCRIPT

polypharmacy and opioid use among
Medicare part D enrollees
C h A p t e R 5

117 Repo r t t o t h e Cong r e s s : Med i ca r e and t h e Hea l t h Ca r e De l i v e r y S y s t em | J u ne 2015
polypharmacy and opioid use among Medicare part D enrollees
C h A p t e R 5Chapter summary
Recently, the Commission examined the effects of medication adherence on
health spending. We found that these effects vary with medical conditions,
ranging from modest savings to increased costs. We also found it difficult
to control for all the factors that can influence this relationship. One factor
that we had not previously examined is how the use of multiple drugs
(polypharmacy) can affect the relationship between medication adherence and
health spending.
The relationship between medication adherence and health spending for
individuals who are treated with multiple medications can be more complex
than it is for individuals treated with a single medication or very few
medications. For example, adhering to multiple drug regimens could result in
drug–drug interactions that may affect a patient’s medical condition and lead
to additional physician visits, emergency department visits, or hospitalizations.
Adverse effects from polypharmacy can occur when a patient is prescribed
more drugs than are clinically warranted or when all prescribed medications
are appropriate, but the total is too many for the patient to ingest or manage
safely. Studies have found that patients who are on multiple drug regimens
often have difficulty managing their medications, which can lead to adverse
drug events (ADEs) and nonadherence to appropriate medications. Individuals
ages 65 and older, who are more likely to suffer from multiple chronic
In this chapter
• Background
• Polypharmacy and adverse drug events
• Types of problems associated with polypharmacy
• Relationship between polypharmacy, adherence, and patient confusion
• Opioid use and polypharmacy
• Examples of team-based approaches to improving pharmaceutical care
• Policy responses to polypharmacy

118 Po l ypha r macy and op i o i d u s e among Med i ca r e Pa r t D e n r o l l e e s
conditions, are at high risk for ADEs associated with polypharmacy, yet there are
few clinical guidelines pertinent to prescribing and managing multiple prescription
drugs among this population.
Studies find that adverse events are often associated with opioid use, in part because
individuals using opioids tend to take multiple drugs and because opioid use
itself can lead to many ADEs, including unintentional overdoses. In addition, the
side effects associated with opioids can interfere with the treatment of comorbid
conditions not associated with pain.
Patterns of medication use by Part D enrollees who use opioids raise concerns
about polypharmacy issues and adverse effects on health. In 2012, over one-third of
Part D enrollees filled at least one prescription for an opioid. Opioid users filled an
average of 52 prescriptions per year, including opioids, from about 10 drug classes
(a prescription is standardized to a 30-day supply). Beneficiaries who filled at least
one prescription for opioids tended to have more comorbid conditions than those
who did not fill a prescription for opioids. The enrollees with the highest use of
opioids filled an average of 23 prescriptions for opioids each in 2012. Those with
very high use of opioids were more likely to be beneficiaries under age 65 who
received the low-income subsidy. The Agency for Healthcare Research and Quality
recently reported an 80 percent increase in the number of Medicare beneficiaries’
inpatient stays related to opioid overuse between 2006 and 2012.
Analysts generally agree that the most effective way to reduce adverse events
associated with polypharmacy is to reduce the number of medications taken.
However, research on the results of programs to reduce unnecessary drug use has
been limited. In the case of opioids, some have suggested limiting the number of
prescribers per patient or requiring patients to fill their prescriptions at one or two
pharmacies. For more general polypharmacy issues, there has been only a limited
discussion of policy options.
Medicare Part D includes a medication therapy management (MTM) program that
is intended to improve the quality of pharmaceutical care received by beneficiaries
who have multiple chronic conditions and are treated with multiple drug therapies.
One of the goals of MTM is to prevent medication errors, which are most likely
to occur when a drug regimen is modified (e.g., when a patient transitions from
hospital to home), when a patient does not understand drug administration
instructions, or when a patient does not follow clinical advice. However, enrollment
in MTM programs remains low, and there is little evidence that the program has
been effective for enrolled beneficiaries. Better medication management might be

119 Repo r t t o t h e Cong r e s s : Med i ca r e and t h e Hea l t h Ca r e De l i v e r y S y s t em | J u ne 2015
achieved through programs offered by accountable care organizations, medical
homes, and other team-based delivery models if such programs tackle the issues
connected to polypharmacy, particularly when a patient is transitioning from one
site of care to another. ■


121 Repo r t t o t h e Cong r e s s : Med i ca r e and t h e Hea l t h Ca r e De l i v e r y S y s t em | J u ne 2015
that because of the beneficial effects of medications on many chronic conditions, providers should not limit the number of drugs they prescribe, but monitor their effects (Duerden 2013, Wise 2013).
Definitions of adherenceThe literature on polypharmacy and on medication adherence are different, and researchers in one area rarely cite studies from the other body of work. From some perspectives, the findings appear to be contradictory. While some studies of adherence show health benefits, often measured by reduced medical service use among adherent patients, studies of polypharmacy show that patients taking multiple drug therapies have increased ADEs, leading to more health service use. In addition, such studies find that increased drug use is associated with nonadherence to drug regimens. This finding is consistent with polypharmacy literature that finds patient confusion can result in ADEs and/or nonadherence to medications when a patient is faced with managing multiple medication regimens.
In part, these conflicting results can be ascribed to different definitions of the problem, different data, and different research designs. Both health-services
Background
Recently, the Commission examined the effects of medication adherence on health spending and found that, depending on the medical condition, the effects vary widely, from modest savings to increased costs. We found it difficult to control for all the factors that can influence this relationship. One factor not previously examined is how the use of multiple drugs (polypharmacy) can affect the relationship between medication adherence and health spending.
The relationship between medication adherence and health spending for individuals who are treated with multiple medications can be more complex than it is for individuals treated with a single medication or very few medications. For example, adhering to multiple drug regimens can result in drug–drug interactions that may affect a patient’s medical condition and lead to additional physician visits, emergency department (ED) visits, or hospitalizations. Studies have found that patients who are on multiple drug regimens often have difficulty managing their medications, which can lead to adverse drug events (ADEs) and/or nonadherence to appropriate medications.
What is polypharmacy?Some Medicare beneficiaries may have medical problems caused or exacerbated by polypharmacy—that is, the use of multiple medications (Lorincz et al. 2011) (Table 5-1). Adverse effects of polypharmacy can occur when a patient is prescribed more drugs than are clinically warranted (often by multiple prescribers) or when all the prescribed medications are appropriate, but the total is too many for the patient to ingest or manage safely (Haque 2009). Individuals ages 65 and older, who are more likely to suffer from multiple chronic conditions, are at high risk for adverse events associated with polypharmacy, yet there are few clinical guidelines pertinent to prescribing and managing multiple prescription drugs among this population (Lorgunpai et al. 2014).
There is no consensus on what constitutes polypharmacy (Bushardt et al. 2008). Some researchers identify polypharmacy in terms of the number of drugs taken concurrently by a patient. Most commonly, researchers describe polypharmacy as a situation in which a patient takes five to seven drugs concurrently.
While there is a general consensus about the increased risk of adverse events associated with polypharmacy as patients take more medications, some clinicians believe
t A B L e5–1 Average number of prescriptions
filled per month by part D enrollees, 2012
All part D enrollees
Average number of prescriptions per enrollee per month 4
Share of enrollees, by average number of prescriptions per month
None 6%More than 0, less than 2 212 or more, less than 4 264 or more, less than 8 298 or more 19
Note: Number of prescriptions is standardized to a 30-day supply. Average number of prescriptions filled per month was estimated by dividing by 12 the annual total prescriptions filled by Part D enrollees who were enrolled in the program for the full year in 2012. Numbers may not sum to totals due to rounding.
Source: MedPAC analysis of Part D prescription drug event data.

122 Po l ypha r macy and op i o i d u s e among Med i ca r e Pa r t D e n r o l l e e s
Some studies of potential harm associated with polypharmacy analyze data on hospitalized patients. A study by the Centers for Disease Control and Prevention (CDC), using data drawn from the National Electronic Injury Surveillance System–Cooperative Adverse Drug Event Surveillance Project, estimated that from 2007 through 2009, about 100,000 emergency hospitalizations among the elderly for adverse drug events occurred annually. Nearly half were among adults 80 years and older. More than half of the ED visits that resulted in hospitalizations involved patients taking five or more concomitant medications. Four drug classes accounted for more than 10 percent of all cases: warfarin (33 percent), insulin (14 percent), oral antiplatelet agents (13 percent), and oral hypoglycemic agents (11 percent) (Budnitz et al. 2011).
In a study of ambulatory care visits, researchers found that the number of medications taken was the only factor significantly associated with adverse events (Gandhi et al. 2003). The study found that the number of events per patient increased by 10 percent for each additional medication. Another study of polypharmacy in ambulatory care found that almost 60 percent of older adults in the sample took at least one unnecessary drug (Maher et al. 2014). In addition, studies have found that the use of medications deemed inappropriate for the elderly by consensus panels of clinicians (e.g., Beers list drugs) increases with the number of medications taken (Mansur et al. 2009, Steinman et al. 2006).1
types of problems associated with polypharmacy
Potentially harmful situations associated with polypharmacy can be classified into three broad categories: therapeutic competition, therapeutic duplication, and toxic combinations. These problems are most acute for older individuals because they tend to take more drugs than younger people and can have more difficulty absorbing them.
Therapeutic competition. This occurs when treatment for one condition worsens a coexisting condition. One study estimates that 20 percent of Medicare beneficiaries over 65 take at least one medication that can exacerbate coexisting conditions (Lorgunpai et al. 2014). For example, some medications used to treat heart failure can exacerbate urinary incontinence, a
and economic studies of adherence and patient safety studies focused on polypharmacy stress the importance of adherence, but they define it differently. Studies of medication adherence from an economic perspective often use various measures of drug possession to approximate a patient’s adherence to the drug regimen. For example, in our analysis of the effects of medication adherence, our measure of adherence involved the possession of any of the study medications based on Part D prescription drug event data (Medicare Payment Advisory Commission 2014b). This type of measure allows use of administrative data and lends itself to large cross-sectional studies. Outcome measures may include hospitalizations, other types of medical service use, and medical spending.
In contrast, adherence is defined in patient-safety polypharmacy studies in terms of taking drugs as prescribed, including correct dosage; discontinuing drugs based on doctors’ orders; discontinuing drugs when there are adverse events; and not taking another person’s medication. These studies are more clinically based and require access to medical records and sometimes extensive interviews with patients. As a result, these studies tend to be smaller and results may not achieve statistical significance. In addition, the occurrence of adverse events, one measure of potential polypharmacy, depends on clinical judgment and may not always be reliable. Such studies are less focused on cost effects. Outcome measures are usually ADEs, ED visits, or hospitalizations.
polypharmacy and adverse drug events
In 2005, researchers estimated that over 4.3 million health care visits and 10 percent of ED visits by Medicare beneficiaries stemmed from ADEs (Maher et al. 2014). Although adverse drug events are not necessarily linked to polypharmacy, the relationship between the number of drugs and adverse events was found consistently in multiple studies using different data, sites of care, and research designs (Field et al. 2007, Kripalani et al. 2008, Sarkar et al. 2011). A literature review of 16 studies (based on Medicare data) found polypharmacy to be a statistically significant predictor of hospitalization, nursing home placement, death, hypoglycemia, fractures, decreased mobility, pneumonia, and malnutrition (Frazier 2005). Polypharmacy among Medicare beneficiaries has also been associated with cognitive decline, falls, and urinary incontinence (Maher et al. 2014).

123 Repo r t t o t h e Cong r e s s : Med i ca r e and t h e Hea l t h Ca r e De l i v e r y S y s t em | J u ne 2015
understand physician instructions regarding medication use. For example, if one medication is meant to replace another, patients may not understand that they should no longer take the previously prescribed drug. They also may not tell their health care provider about any over-the-counter drugs or dietary supplements that they take (Field et al. 2007).
Additionally, some patients are unwilling to eliminate medications from their drug regimen, even when recommended by their physician. In one study, elderly patients taking five or more medications were assessed to see whether the number of drugs could be reduced. All recommendations had to be endorsed by the patient’s primary care provider. Although the number of drugs was reduced by an average of 1.5 per patient, providers had recommended eliminating an average of 4.5 drugs. Patients tended to resist stopping some of their drugs. They were most reluctant to stop sleeping pills, benzodiazepines, narcotic analgesics, and all psychoactive drugs (Williams et al. 2004).
Finally, nonadherence to appropriate medications also is associated with polypharmacy (Hajjar et al. 2007, Lee et al. 2013, Salazar et al. 2007, Vik et al. 2004). Multiple drugs often result in complicated drug administration instructions that patients may find difficult to follow, a situation often referred to as “pill burden.” Patients may take drugs at the wrong time of day, stop some drugs because of side effects, or find the cost of the drugs too expensive and eliminate some medications without telling their providers. One study found that about 20 percent of preventable ADEs in an ambulatory setting were caused at least in part by adherence errors by patients and their families (Field et al. 2007).
opioid use and polypharmacy
Opioid analgesics, or opioids, are a class of drugs used to treat pain.2 Studies find that adverse events are often associated with opioid use, in part because individuals using opioids tend to take multiple drugs (polypharmacy) and because opioid use itself can lead to many ADEs, including unintentional overdoses. In addition, the side effects associated with opioids can interfere with treatments for comorbid conditions not associated with pain. Our work examined the use of opioid analgesics by Medicare beneficiaries enrolled in Part D.
common issue for heart failure patients, which may result in more medications if the physician prescribes a drug to treat the incontinence instead of changing heart failure medications. The consequence can be a prescribing cascade and more potential drug interactions (Tannenbaum and Johnell 2014). In a recent study of older adults with multiple chronic conditions, more than 20 percent of individuals in the sample were prescribed drugs that could worsen at least one of their other chronic conditions. Further, 13 percent had prescription drugs that could worsen multiple conditions (Lorgunpai et al. 2014).
Therapeutic duplication. Therapeutic duplication is defined as the use of multiple medications from the same therapeutic class at the same time. It can occur when a physician replaces one prescription with another but the patient does not discontinue the first drug or uses multiple pharmacies (Giusani and White 2011). One common example is therapeutic duplication of nonsteroidal anti-inflammatory drugs (NSAIDs), which can result in gastrointestinal distress, including ulcers and bloody stools. Muscle relaxants and antidepressants are also frequent sources of therapeutic duplications.
Toxic combinations. Toxic combinations occur when the interaction between two medications leads to serious complications. There are numerous examples in the literature. For example, warfarin (a blood thinner) and simvastatin (a drug to lower cholesterol in the blood) taken together increase the risk of bleeding and worsen statins’ side effects. Lisinopril (a drug to treat high blood pressure and heart failure) and potassium together increase the risk of hyperkalemia, a condition in which the concentration of potassium in the blood is elevated, which can lead to heart attacks and death (Laroche et al. 2006).
Relationship between polypharmacy, adherence, and patient confusion
Studies have found that patients with complicated drug regimens often have difficulty managing their medications, leading to ADEs. Errors are most likely to occur when a drug regimen is modified, when a patient does not understand drug administration instructions, and when a patient does not follow clinical advice. Patients, particularly those discharged from hospitals, may not

124 Po l ypha r macy and op i o i d u s e among Med i ca r e Pa r t D e n r o l l e e s
Wide variation in use of opioids across states
In 2012, 12.3 million beneficiaries (about 36 percent of Part D enrollees) filled at least one prescription for an opioid. The share of Part D enrollees who used opioids in 2012 varied across states, from about 23 percent in Hawaii to about 50 percent in Alabama, with many Southern states (such as Arkansas, Georgia, Kentucky, Louisiana,
opioid use in part DOpioid use is widespread among Medicare beneficiaries enrolled in Part D. Over one-third of Part D enrollees fill at least one prescription for an opioid in any given year. Opioid analgesics rank as one of the top therapeutic classes used by Part D enrollees, accounting for about 5 percent of the total volume and spending for drugs covered under the program.
Wide variation in use of opioids across states, 2012
Source: MedPAC analysis of Part D denominator and prescription drug event data.
Title hereFIGUREX-X
Source: Note and Source in InDesign.
43.1% or more
34.1% to 38%
32.1% to 34%
22% to 32%
38.1% to 43%
Opioid users by state(as a percent of Part D enrollees)
F IguRe5–1

125 Repo r t t o t h e Cong r e s s : Med i ca r e and t h e Hea l t h Ca r e De l i v e r y S y s t em | J u ne 2015
Beneficiaries in the “other” category had higher average spending (6.3 prescriptions at $262 per beneficiary) than either beneficiaries with cancer (5.5 prescriptions at $232 per beneficiary) or beneficiaries in hospice (5.2 prescriptions at $219 per beneficiary).3
patterns of opioid use by part D enrollees without hospice use or cancer diagnosis
While many issues surround the use of opioids, particularly over an extended period of time, use of opioids to treat pain associated with cancer and pain at the end of life is generally well accepted and is typically closely monitored by clinicians. In contrast, while there are legitimate uses of opioids for pain not associated with cancer or terminal conditions, there are no agreed-on clinical guidelines for treating other types of pain using opioids.
In 2012, beneficiaries in the category of “other” opioid users accounted for about one-third of all Part D enrollees (Table 5-3, p. 126). Opioid users differed from Part D enrollees overall in significant ways. For example, they were more likely to be under age 65 (30 percent compared
Oklahoma, and Tennessee) in the mid- to upper-40 percent range (Figure 5-1).
Most opioid uses are unrelated to cancer treatment or hospice use
In 2012, 12.3 million Part D enrollees filled 76.1 million opioid prescriptions at a cost of over $3 billion (Table 5-2). Of those, about 3.4 percent were in hospice at some point during the year (some with cancer diagnoses). A little over 9 percent had cancer diagnoses with no hospice use. Those with hospice use accounted for about 2.9 percent of total spending and prescriptions filled for opioids under Part D. Nonhospice beneficiaries with cancer diagnoses accounted for slightly over 8 percent of total spending and prescriptions filled for opioids. The remaining 10.7 million beneficiaries (87.4 percent) who filled at least one prescription for an opioid did not have any hospice stays during the year and were not being treated for cancer. We categorized this group of opioid users as “other” users to distinguish them from those for whom opioid uses were likely related to pain associated with cancer or terminal conditions.
t A B L e5–2 Most opioid uses were unrelated to cancer treatment or hospice use, 2012
All part D opioid users
part D opioid users by hospice use and cancer diagnosis
Any hospice use*
Cancer diagnosis (no hospice use) other
Number of beneficiaries (in millions) 12.3 0.4 1.1 10.7As a percent of total users 3.4% 9.2% 87.4%
Total gross spending on opioids (in billions) $3.16 $0.09 $0.26 $2.81As a percent of total gross spending 2.9% 8.3% 88.8%
Total number of opioid prescriptions (in millions) 76.1 2.2 6.2 67.7As a percent of total prescriptions 2.8% 8.2% 89.0%
Average annual use per beneficiaryGross spending on opioids $258 $219 $232 $262Number of opioid prescriptions 6.2 5.2 5.5 6.3
Note: “Other” refers to Part D enrollees who had opioid prescriptions but did not use hospice care or have a cancer diagnosis. Therapeutic classification and identification of generic prescriptions are based on the First DataBank Enhanced Therapeutic Classification System 1.0. Gross spending includes all payments to pharmacies for Part D–covered prescription drugs, including ingredient costs, dispensing fees, sales tax, and manufacturer discounts for brand-name drugs filled during the coverage gap by beneficiaries not receiving the low-income subsidy. Number of prescriptions is standardized to a 30-day supply. Numbers may not sum to totals due to rounding. *For a beneficiary who used hospice at some point during the year, the opioid medications obtained through the Part D benefit may not reflect the full amount of opioid use by the beneficiary during the year because most medications, including opioids, to treat symptoms associated with the terminal condition are included in the hospice bundled payment.
Source: MedPAC analysis of Part D prescription drug event data 2012.

126 Po l ypha r macy and op i o i d u s e among Med i ca r e Pa r t D e n r o l l e e s
(called MA−PDs) (data not shown). Other beneficiary characteristics, such as being non-White (26 percent) or institutionalized for at least some portion of the year (4 percent), were similar to characteristics of the overall Part D population (also 26 percent and 4 percent, respectively).
In 2012, annual gross spending per beneficiary on opioids among those in the “other” user category varied widely, ranging from about $4 for the beneficiary at the 10th percentile to over $400 at the 90th percentile. The highest spending beneficiary had over $800,000 in opioid spending. On average, opioid users enrolled in PDPs filled more prescriptions than those in MA−PDs (6.7 prescriptions compared with 5.6 prescriptions, respectively), with gross spending that was about 50 percent higher, on average ($294 compared with $202, respectively) (Table 5-4). Most of the differences between PDPs and MA−PDs reflect the fact that a higher share of opioid users enrolled in PDPs are LIS beneficiaries, who tend to fill more opioid medications than non-LIS beneficiaries, on average. LIS beneficiaries filled an average of 8.1 prescriptions at a total cost of $387, compared with an average of 4.8 prescriptions at $158 for non-LIS beneficiaries.
Beneficiaries with very high opioid use
Beneficiaries with annual opioid spending in the highest 5 percent (annual gross spending above $911) accounted for 68 percent ($1.91 billion) of total gross drug spending on opioids and about 18 percent of prescriptions (12.4 million) for opioids used by beneficiaries in the “other” opioid user category (Table 5-5). In 2012, those in the top 5 percent filled, on average, about 23 prescriptions
with 21 percent for the overall Part D population) and more likely to receive the low-income subsidy (LIS) (45 percent compared with 36 percent for the overall Part D population). LIS enrollees made up a disproportionate share of opioid users in both stand-alone prescription drug plans (PDPs) and Medicare Advantage (MA) plans
t A B L e5–3 “other” opioid users were more likely
to be under age 65 and receive the low-income subsidy, 2012
All part D enrollees
“other” opioid users
Number of beneficiaries (in millions) 33.8 10.7
Selected demographic characteristicsFemale 58% 63%Non-White 26 26Under age 65 21 30
Plan typePDP 63% 65%MA–PD 37 35
Percent:LIS 36% 45%Institutionalized 4 4
Note: PDP (prescription drug plan), MA−PD (Medicare Advantage−Prescription Drug [plan]), LIS (low-income [drug] subsidy). “Other” refers to Part D enrollees who had opioid prescriptions but did not use hospice care or have a cancer diagnosis.
Source: MedPAC analysis of Part D denominator and prescription drug event data 2012.
t A B L e5–4 patterns of opioid use by “other” opioid users in part D, by plan type and LIs status, 2012
All opioid users in “other”
user category
plan type LIs status
pDp MA–pD LIs non-LIs
Number of beneficiaries (in millions) 10.7 7.0 3.7 4.9 5.9As a percent of all opioid users 65% 35% 45% 55%
Average annual use per beneficiaryGross spending on opioids $262 $294 $202 $387 $158Number of opioid prescriptions 6.3 6.7 5.6 8.1 4.8
Note: PDP (prescription drug plan), MA−PD (Medicare Advantage−Prescription Drug [plan]), LIS (low-income [drug] subsidy). “Other” refers to Part D enrollees who had opioid prescriptions but did not use hospice care or have a cancer diagnosis. Gross spending includes all payments to pharmacies for Part D–covered prescription drugs, including ingredient costs, dispensing fees, sales tax (where applicable), and manufacturer discounts for brand-name drugs filled during the coverage gap by beneficiaries not receiving the low-income subsidy. Number of prescriptions standardized to a 30-day supply.
Source: MedPAC analysis of Part D denominator and prescription drug event data.

127 Repo r t t o t h e Cong r e s s : Med i ca r e and t h e Hea l t h Ca r e De l i v e r y S y s t em | J u ne 2015
received the LIS. Finally, the top users were more likely to have resided in a long-term care facility at some point during the year compared with those in the other 95 percent (7 percent vs. 4 percent, respectively).
The patterns of opioid use we observed among the Part D enrollees with very high opioid use raise concerns about clinical appropriateness and, in some cases, fraud and abuse (see text box about potentially inappropriate opioid use, pp. 128–130).
opioid use and polypharmacy concernsWidespread use of opioids among Medicare beneficiaries is a concern. Opioid prescribing for Medicare beneficiaries by multiple prescribers is common and associated with higher rates of opioid-related hospital admissions (Jena et al. 2014). The Agency for Healthcare Research and Quality
for opioids at a cost of over $3,500, compared with an average of 5.4 prescriptions at $88 for those with spending below the 95th percentile.4 Much of the difference in the per prescription costs for these two groups ($154 per prescription compared with $16 per prescription, respectively) is likely driven by the fact that beneficiaries in the top 5 percent were somewhat less likely to fill generic versions of opioids, compared with the other 95 percent of the opioid users (80 percent vs. 98 percent, respectively).5
A comparison of demographic characteristics shows that opioid users in the top 5 percent (the top users) differed from the other 95 percent in several respects. For example, the top users were more likely to be White and much more likely to be under age 65. Most of the top users (72 percent) were enrolled in PDPs, and nearly two-thirds
t A B L e5–5 opioid use and selected characteristics of the top 5 percent of opioid users
in part D compared with “other” part D opioid users, 2012
All opioid users in “other”
user category
opioid users by percentile of spending distribution
Below 95th percentile
95th percentile and above
(top 5 percent)
Number of beneficiaries (in millions) 10.7 10.2 0.5
Total gross spending on opioids (in billions) $2.81 $0.90 $1.91As a percent of total for “other” opioid users 32% 68%
Total number of opioid prescriptions (in millions) 67.7 55.3 12.4As a percent of total for “other” opioid users 82% 18%
Average annual use per beneficiaryGross spending on opioids $262 $88 $3,565Number of opioid prescriptions 6.3 5.4 23.1
Share of generic opioid prescriptions 95% 98% 80%
Selected demographic characteristicsFemale 63% 63% 61%Non-White 26 26 17Under age 65 30 29 65
Percent:PDP 65% 65% 72%LIS 45 44 65Institutionalized 4 4 7
Note: PDP (prescription drug plan), LIS (low-income [drug] subsidy). “Other” refers to Part D enrollees who had opioid prescriptions but did not use hospice care or have a cancer diagnosis. Gross spending includes all payments to pharmacies for Part D–covered prescription drugs, including ingredient costs, dispensing fees, sales tax (where applicable), and manufacturer discounts for brand-name drugs filled during the coverage gap by beneficiaries not receiving the low-income subsidy. Number of prescriptions is standardized to a 30-day supply. Numbers may not sum to totals due to rounding.
Source: MedPAC analysis of Part D denominator and prescription drug event data.

128 Po l ypha r macy and op i o i d u s e among Med i ca r e Pa r t D e n r o l l e e s
opioids can interfere with the treatments of comorbid conditions not associated with pain.
A study of opioid users found that over 20 percent of the users took more than 10 concurrent medications. Our analysis of Part D claims data found similar patterns among opioid users. In 2012, opioid users filled an average of 52 prescriptions per year, including opioids, from about 10 drug classes (a prescription is standardized to a 30-day
recently reported an 80 percent increase between 2006 and 2012 in the number of inpatient stays related to opioid overuse by Medicare beneficiaries (Owens et al. 2014).
Studies find that adverse events are often associated with opioid use, in part because individuals using opioids tend to take multiple drugs (polypharmacy) and because opioid use itself can lead to many ADEs, including unintentional overdoses. In addition, the side effects associated with
potentially inappropriate opioid use in Medicare part D
The use of opioids has been growing in recent years. According to the Centers for Disease Control and Prevention (CDC), the use of
prescription opioids in the United States increased by 300 percent between 1999 and 2010 (National Center for Health Statistics 2014). Because opioids have addictive properties with a high risk for abuse, they are generally classified as Schedule II drugs, the most restrictive class of medically legitimate drugs, under the Drug Enforcement Administration (DEA) classification system.6 Thus, while opioids can play an important role in pain control and palliative care, their use must be closely monitored to prevent inappropriate use.
Inappropriate use of opioids, including overuse, can be accidental (e.g., the patient misunderstood the directions for use) or deliberate (e.g., an individual takes opioid medications prescribed for someone else), and the effects of such misuse can result in symptoms that range from pleasure to nausea, vomiting, severe allergic reactions, and overdose, in which breathing and heartbeat slow or even stop (Substance Abuse and Mental Health Services Administration 2013). The CDC reports that the death rate per 100,000 for poisoning involving opioid analgesics more than tripled between 2000 and 2010 (National Center for Health Statistics 2014).
Findings from recent government reports suggest that some of the opioid prescriptions filled under the Part D program may not be clinically indicated and may be fraudulent. For example, the Government Accountability Office found that, in 2008, about 1.8 percent of Part D enrollees may have engaged in “doctor shopping” to obtain frequently abused
drugs (mostly opioids) from multiple prescribers (Government Accountability Office 2011). In addition, the Office of Inspector General’s (OIG’s) recent findings of questionable practices by pharmacies and prescribers suggest that the program may be vulnerable to fraud and abuse, such as diversion of opioids. For example, in examining pharmacy billing and physician prescribing behaviors, OIG found that, in 2009, over 1,000 pharmacies billed for an extremely high share of Schedule II or III drugs, and nearly 500 general-care physicians ordered an extremely high share of Schedule II or III drugs (Office of Inspector General 2013b, Office of Inspector General 2012). In a separate study, OIG found that some prescriptions ordered by individuals who did not appear to have prescribing authority were for controlled substances (Office of Inspector General 2013a).
Identifying patients who are at risk of inappropriately using opioids can be challenging in part because there is no clearly defined maximum dose in the Food and Drug Administration–approved labeling for most opioid analgesics. In addition, until recently, Part D plan sponsors and pharmacists dispensing medications to Part D enrollees often had limited ability to determine, at the point of service, whether the prescription presented was legitimate or appropriate for the clinical condition(s), or whether the individual possessed or would possess opioid medications in excess of clinically appropriate amounts.7 Finally, because assessment of pain largely relies on self-reporting by patients, and patients who use drugs inappropriately are unlikely to be forthcoming about their addiction to opioids or their intent to divert the excess supply,
(continued next page)
129 Repo r t t o t h e Cong r e s s : Med i ca r e and t h e Hea l t h Ca r e De l i v e r y S y s t em | J u ne 2015
nonusers. For example, compared with nonusers, opioid users were more likely to have been diagnosed with:
• osteoporosis (13.0 percent vs. 9.5 percent, respectively),
• bipolar disorder (4.6 percent vs. 1.9 percent, respectively), and
• depression (21.0 percent vs. 10.0 percent, respectively).
supply). Opioid users with very high opioid use may be at a greater risk of ADEs resulting from interactions with other drugs or overdose due to therapeutic duplications.
In 2012, beneficiaries who filled at least one prescription for opioids tended to have more comorbid conditions than beneficiaries who did not fill a prescription for opioids (4.8 conditions vs. 3.3 conditions, respectively). Some conditions were more prevalent among opioid users than
potentially inappropriate opioid use in Medicare part D (cont.)
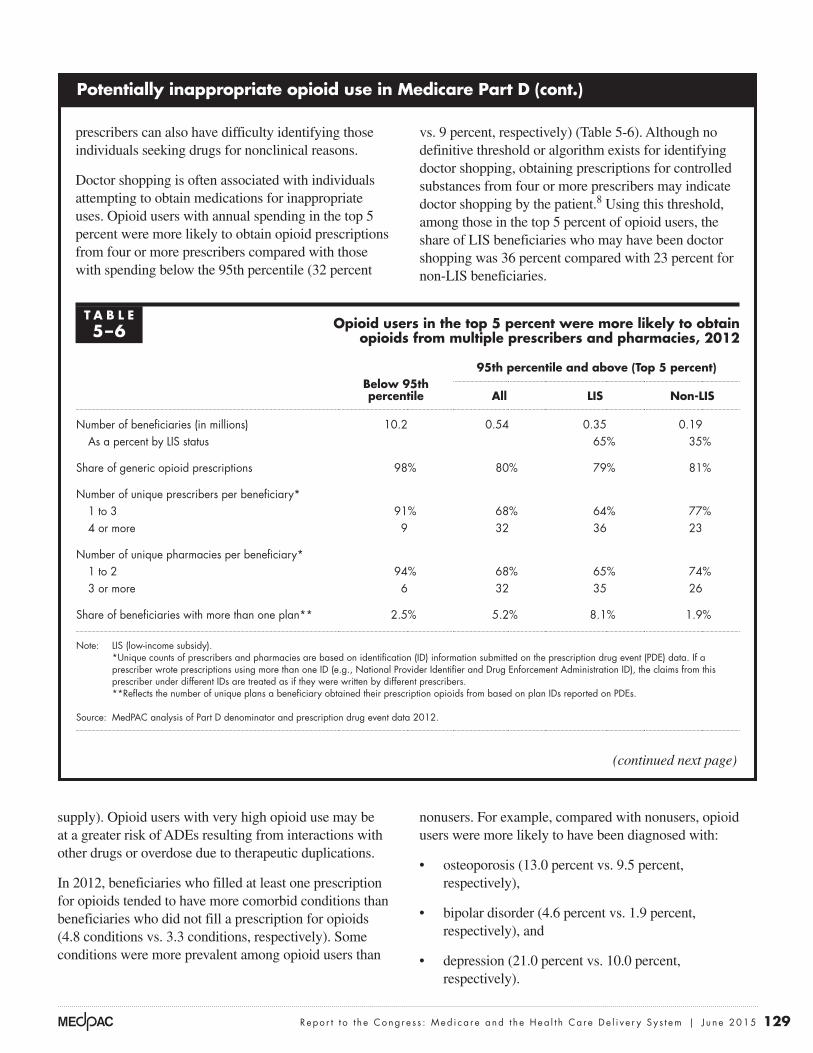
prescribers can also have difficulty identifying those individuals seeking drugs for nonclinical reasons.
Doctor shopping is often associated with individuals attempting to obtain medications for inappropriate uses. Opioid users with annual spending in the top 5 percent were more likely to obtain opioid prescriptions from four or more prescribers compared with those with spending below the 95th percentile (32 percent
vs. 9 percent, respectively) (Table 5-6). Although no definitive threshold or algorithm exists for identifying doctor shopping, obtaining prescriptions for controlled substances from four or more prescribers may indicate doctor shopping by the patient.8 Using this threshold, among those in the top 5 percent of opioid users, the share of LIS beneficiaries who may have been doctor shopping was 36 percent compared with 23 percent for non-LIS beneficiaries.
(continued next page)
t A B L e5–6 opioid users in the top 5 percent were more likely to obtain
opioids from multiple prescribers and pharmacies, 2012
Below 95th percentile
95th percentile and above (top 5 percent)
All LIs non-LIs
Number of beneficiaries (in millions) 10.2 0.54 0.35 0.19As a percent by LIS status 65% 35%
Share of generic opioid prescriptions 98% 80% 79% 81%
Number of unique prescribers per beneficiary*1 to 3 91% 68% 64% 77%4 or more 9 32 36 23
Number of unique pharmacies per beneficiary*1 to 2 94% 68% 65% 74%3 or more 6 32 35 26
Share of beneficiaries with more than one plan** 2.5% 5.2% 8.1% 1.9%
Note: LIS (low-income subsidy). *Unique counts of prescribers and pharmacies are based on identification (ID) information submitted on the prescription drug event (PDE) data. If a
prescriber wrote prescriptions using more than one ID (e.g., National Provider Identifier and Drug Enforcement Administration ID), the claims from this prescriber under different IDs are treated as if they were written by different prescribers.
**Reflects the number of unique plans a beneficiary obtained their prescription opioids from based on plan IDs reported on PDEs.
Source: MedPAC analysis of Part D denominator and prescription drug event data 2012.

130 Po l ypha r macy and op i o i d u s e among Med i ca r e Pa r t D e n r o l l e e s
Opioids and therapeutic competition. As noted previously, therapeutic competition occurs when treatment for one medical condition adversely affects another condition. One of the most common side effects of opioid therapy is constipation. Research has found that about 40 percent of cancer patients taking opioids for pain relief have constipation and other gastrointestinal effects. The problem can be so acute that patients stop taking the pain therapy. The treatment for constipation can lead
The prevalence of conditions related to nerve damage (e.g., neuralgia) and migraine headaches were also higher among opioid users than nonusers.
The side effects associated with opioids can worsen medical conditions that may or may not be related to pain. Opioids can cause confusion, and one characteristic of polypharmacy is that patients often have difficulty managing their medication regimen.
potentially inappropriate opioid use in Medicare part D (cont.)
Pharmacy shopping, like doctor shopping, is another behavior associated with inappropriate use of controlled substances. While most beneficiaries with spending below the 95th percentile (94 percent) filled their opioid prescriptions at one or two pharmacies, a much lower share (68 percent) of beneficiaries with spending in the top 5 percent did so (Table 5-6, p. 129). Among the top 5 percent of users, those who received the LIS were more likely to obtain opioid prescriptions from three or more pharmacies compared with non-LIS beneficiaries (35 percent vs. 26 percent, respectively).
In 2013, CMS responded to the widespread use of opioids and the potential for overuse among Part D enrollees by implementing a centralized data system—the Overutilization Monitoring System (OMS)—to monitor opioid use by Part D enrollees. Plans are required to take action (e.g., apply case management principles) to ensure appropriate opioid use among enrollees who are identified through OMS as being at risk for opioid or acetaminophen overuse. Plans are also required to have safety controls at point of service and conduct drug utilization reviews to proactively identify and prevent potential misuse or overuse of opioids.9
Other changes that are taking place in 2015 or later focus on prescribers and pharmacies that are enabling abusive or fraudulent behaviors or are part of abusive or fraudulent schemes themselves. For example, beginning in June 2015, plan sponsors must deny claims for prescriptions written by prescribers not enrolled with Medicare. CMS is also developing a tool (Predictive Learning Analytics Tracking Outcomes, or PLATO®) to assess the risk of fraud and abuse by prescribers and pharmacies based on an analysis of Part D’s prescription drug event data. PLATO could help plan sponsors, CMS’s Center for Program Integrity, and law
enforcement agencies identify potentially fraudulent or abusive actors and take appropriate actions as needed (Abankwah 2014).
These changes may reduce the incidence of inappropriate opioid use, as well as limit the Part D program’s vulnerability to fraud and abuse. Early CMS data suggest that these policy changes may have had some effect in reducing potential overuse and fraudulent cases. However, it is too early to know the full extent of their impact and effectiveness.
Additional actions could be taken to curb Medicare beneficiaries’ opioid overuse and abuse. For example, Part D could limit the number of prescribers or pharmacies from which beneficiaries would be allowed to obtain some or all of their medications once they are identified as potentially at risk for overuse or abuse of controlled substances (so-called lock-in provisions). Another idea would be to limit the ability of LIS enrollees to change plans during the year if they are determined to be at high risk for abusing controlled substances. These actions, however, would be impermissible under current law because CMS does not have the authority to implement lock-in programs or limit the ability of LIS enrollees to switch plans during the year.
Balancing access to needed pain medications with the need to prevent inappropriate use of opioids is important in considering any new policy options. Monitoring the effects of efforts already under way to curb the overuse and abuse of opioids remains essential to helping policymakers better understand how CMS’s current actions affect beneficiaries, plan sponsors’ operations, and other actors such as pharmacies and prescribers. ■
131 Repo r t t o t h e Cong r e s s : Med i ca r e and t h e Hea l t h Ca r e De l i v e r y S y s t em | J u ne 2015
by integrated health systems (Group Health of Puget Sound, Kaiser Permanente, and Fairview Health Services of Minneapolis-St. Paul).
The Group Health program focuses on safe opioid prescribing practices by the organization’s clinical staff (Trescott et al. 2011). Clinical and research staff developed an online clinician education program on chronic pain management and opioid prescribing. The goal was to standardize opioid prescribing in a way that would improve safety without adding undue burdens to appropriate prescribing. Starting in 2010, a single physician is designated as responsible for management of long-term opioid therapy (90 days or more) for each patient. An individual care plan is developed with the active participation of the patient. A standardized treatment plan is agreed on, and patients are educated on the risks and potential benefits of opioid use. The prescribing physician is responsible for a minimum number of monitoring visits based on patient opioid dosage and risk factors. The program also entails drug screening for high-risk patients. Online educational support is available for physicians, and performance measures are tracked.
to additional side effects. For example, gastrointestinal medications are often associated with other ADEs. In one study of self-reported ADEs among the elderly, researchers found that opioids were among the most common drugs associated with therapeutic competition (Chrischilles et al. 2009).
Opioids and therapeutic duplication. Opioids—including oxycodone, hydromorphone, oxymorphone, and morphine—are particularly subject to therapeutic duplication, or taking more than one drug from the same drug class concurrently. Therapeutic duplication of opioids can result in sedation, respiratory depression, constipation, dependence, and death (Giusani and White 2011). One study of self-reported adverse drug events among the elderly found that opioids were the most commonly duplicated therapeutic class (Chrischilles et al. 2009).
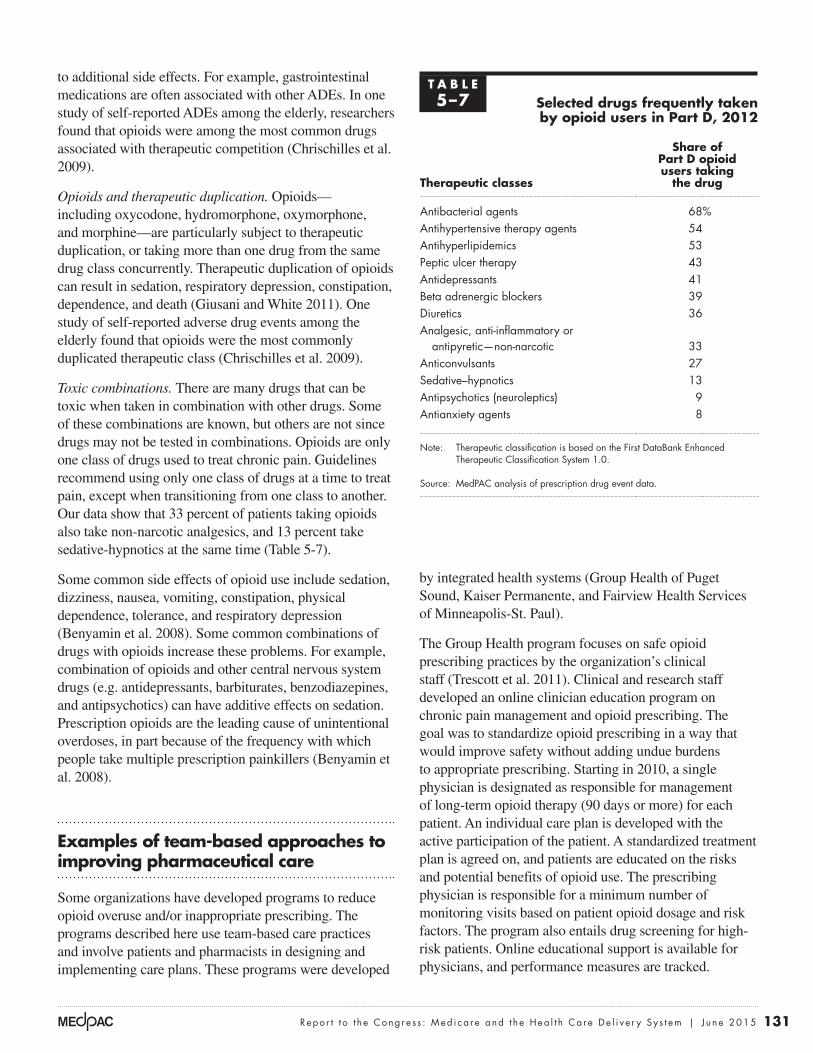
Toxic combinations. There are many drugs that can be toxic when taken in combination with other drugs. Some of these combinations are known, but others are not since drugs may not be tested in combinations. Opioids are only one class of drugs used to treat chronic pain. Guidelines recommend using only one class of drugs at a time to treat pain, except when transitioning from one class to another. Our data show that 33 percent of patients taking opioids also take non-narcotic analgesics, and 13 percent take sedative-hypnotics at the same time (Table 5-7).
Some common side effects of opioid use include sedation, dizziness, nausea, vomiting, constipation, physical dependence, tolerance, and respiratory depression (Benyamin et al. 2008). Some common combinations of drugs with opioids increase these problems. For example, combination of opioids and other central nervous system drugs (e.g. antidepressants, barbiturates, benzodiazepines, and antipsychotics) can have additive effects on sedation. Prescription opioids are the leading cause of unintentional overdoses, in part because of the frequency with which people take multiple prescription painkillers (Benyamin et al. 2008).
examples of team-based approaches to improving pharmaceutical care
Some organizations have developed programs to reduce opioid overuse and/or inappropriate prescribing. The programs described here use team-based care practices and involve patients and pharmacists in designing and implementing care plans. These programs were developed
t A B L e5–7 selected drugs frequently taken
by opioid users in part D, 2012
therapeutic classes
share of part D opioid users taking
the drug
Antibacterial agents 68%Antihypertensive therapy agents 54Antihyperlipidemics 53Peptic ulcer therapy 43Antidepressants 41Beta adrenergic blockers 39Diuretics 36Analgesic, anti-inflammatory or
antipyretic—non-narcotic 33Anticonvulsants 27Sedative–hypnotics 13Antipsychotics (neuroleptics) 9Antianxiety agents 8
Note: Therapeutic classification is based on the First DataBank Enhanced Therapeutic Classification System 1.0.
Source: MedPAC analysis of prescription drug event data.

132 Po l ypha r macy and op i o i d u s e among Med i ca r e Pa r t D e n r o l l e e s
reliably measured (Tjia et al. 2013). Two small studies have achieved success reducing patient drug use without adverse consequences. Each study used a protocol to identify unnecessary drugs and involved pharmacists in the program (Garfinkel and Mangin 2010, Williams et al. 2004).
Because clinical guidelines are generally focused on specific conditions rather than on populations, there are no clear guidelines for treating elderly individuals who have multiple conditions. The absence of these clinical guidelines hinders clinicians’ ability to prescribe appropriately for elderly patients. Although not directly related to policies that could be implemented within the Medicare program, the involvement of Medicare beneficiaries with multiple chronic conditions in clinical trials to determine, for example, the effectiveness of a given therapy could inform clinical practices for this population and could result in a greater reduction in polypharmacy.
Limits on the number of prescribers or pharmaciesThe Part D program provides limited incentives and tools for plan sponsors to address polypharmacy. In the case of opioids, some have suggested limiting the number of prescribers per patient or requiring patients to fill their prescriptions at one pharmacy. While this type of policy is typically used for patients who may be at risk of opioid overuse or abuse, it may also have a broader application for more general polypharmacy issues. For example, a patient may receive better coordinated care, and therefore be at less risk for polypharmacy and ADEs, if he or she received pharmaceutical care from a limited number of clinicians. But a policy that limits the choice of providers may not always be desirable from the beneficiaries’ perspective, particularly if they have chosen to be in traditional Medicare (fee-for-service) rather than a managed environment (Medicare Advantage). In addition, coordinating the pharmaceutical care with clinicians may be particularly challenging for stand-alone PDPs because they do not have contractual relationships with the prescribers.
Measuring the quality of pharmaceutical services
Medicare has tried to improve the quality of prescribing for beneficiaries. The program uses one definition of inappropriate prescribing as one of the quality measures used to rate Part D plan performance. The definition involves measuring how often plans provide inappropriate drugs to beneficiaries. The High Risk Medication measure
Under Kaiser Permanente’s High Risk Medication in the Elderly initiative, clinicians, geriatricians, pharmacists, and nurse care program managers from Kaiser’s regions work as a team to evaluate the safety and efficacy of drugs, including nutritional supplements, for elderly patients with multiple chronic conditions. Many of the team’s recommendations are communicated directly through the patients’ electronic health record (Gray and Gardner 2009).
Fairview Health Services, an integrated delivery system, has developed a team-based medication therapy management (MTM) program. The program is not limited to Medicare beneficiaries. It includes patient participation and shared savings based on total cost of care, performance measures, and patient satisfaction. The focus is on adherence to prescribed medications and avoidance of inappropriate drugs, not polypharmacy. Analysis of the results reported by participating pharmacists in the program found that of the 4,135 drug interventions, 8 percent involved unnecessary drug use while 21 percent involved the need for additional drugs. Similarly, in 30 percent of the cases, the team reported that dosages were too low compared with 8 percent of cases in which the team identified dosages that were too high (Isetts et al. 2012).
policy responses to polypharmacy
Analysts generally agree that the most effective way to reduce the risk of harm associated with polypharmacy is to reduce the number of medications taken (Laroche et al. 2006, Milton et al. 2008). However, determining which medications can be eliminated can often be a challenge for nonclinicians (e.g., insurance plans) and even for clinicians because it requires weighing clinical benefits and costs for each medication, which are often prescribed by multiple clinicians. Other recommendations to reduce the risk of harm associated with polypharmacy include simplifying drug regimens, providing patient and provider education, limiting the number of prescribers, and avoiding treatment of ADEs with more drugs when possible (Milton et al. 2008).
However, research on results from programs to reduce unnecessary drug use has been limited. One literature review on efforts to reduce unnecessary medication among the frail elderly identified only 15 randomized controlled trials from 1966 to 2012. Most of these studies focused on individuals in nursing homes, hospices, and assisted living facilities. The effects of these efforts could not be

133 Repo r t t o t h e Cong r e s s : Med i ca r e and t h e Hea l t h Ca r e De l i v e r y S y s t em | J u ne 2015
regimens (Medicare Payment Advisory Commission 2014a). PDPs have little incentive to offer MTM programs. Further, even within MA–PDs, which do have a financial incentive to engage in MTM-like activities (to improve the quality of pharmaceutical services and potentially reduce spending on other medical services), other care management programs or tools may have greater potential to improve outcomes for beneficiaries and address polypharmacy issues.
Better medication management might be achieved through programs offered by ACOs, medical homes, and other team-based delivery models. These programs could identify issues related to patients’ medication regimens, including potentially harmful effects associated with polypharmacy. Patients might be more likely to follow the advice they receive if it comes from their physicians and pharmacists. Further, because medication errors are most likely to occur when a drug regimen is modified (e.g., when a patient transitions from one site of care to another), medication management programs that reside in a clinical setting may be more effective in identifying when patients’ medications should be reviewed and reconciled. ■
used in the Part D star rating system is based on the Pharmacy Quality Alliance– and National Quality Forum–endorsed list, the best known of which is the Beers list developed by a consensus panel of clinicians. However, researchers have found little association between use of Beers list drugs and ADEs (Corsonello et al. 2009, Laroche et al. 2006). The Beers list was revised in 2012, after these studies were published. CMS is considering modifying or adding measures of inappropriate drug use in the future (Centers for Medicare & Medicaid Services 2015).
part D’s medication therapy management programs
Medicare Part D includes an MTM program that is intended to improve the quality of the pharmaceutical care high-risk beneficiaries receive. To be eligible, beneficiaries must have multiple chronic diseases and take multiple drugs.
The Commission has questioned whether MTM programs offered through stand-alone PDPs, without the cooperation and coordination of a beneficiary’s care team, have the capacity to significantly improve beneficiaries’ drug

134 Po l ypha r macy and op i o i d u s e among Med i ca r e Pa r t D e n r o l l e e s
1 The Beers list is a list of medications that are potentially inappropriate for the elderly population because they can create unfavorable risks based on expert panel reviews of clinical evidence. The list was originally developed for nursing home residents and was subsequently expanded to include all settings of geriatric care.
2 The term opioid generally refers to all derivatives of the opium poppy, including the naturally occurring opiate alkaloids (e.g., opium itself, morphine, and codeine) and semisynthetic agents (e.g., hydrocodone and oxycodone) (Centers for Medicare & Medicaid Services 2014).
3 For a beneficiary who used hospice at some point during the year, the opioid medications obtained through the Part D benefit likely do not reflect the full amount of opioid use by the beneficiary during the year since most medications, including opioids, to treat symptoms associated with the terminal condition are included in the hospice bundled payment.
4 Demographic characteristics and patterns of opioid use for the top 5 percent based on volume (rather than spending) may look different from those reported here.
5 Monthly costs of opioid medications can vary widely. Generic versions are available for many opioid medications, often with an average monthly cost of about $100 or less. However, branded versions can have a cost that is substantially higher than their generic counterparts, particularly in higher doses. For example, in 2011, retail prices reported on Part D claims for one branded opioid (Fentora®, typically used to treat “breakthrough” cancer pain that is not managed by other medications) ranged from several thousand dollars to over $50,000 for a one-month supply.
6 The Controlled Substances Act establishes schedules for controlled substances, ranging from Schedule I (most restrictive) to Schedule V (least restrictive). Drugs on Schedule I (e.g., heroin) currently have no accepted medical use in the United States (Kroll 2014). The DEA recently reclassified hydrocodone combination products from the more permissive Schedule III to the more restrictive Schedule II category, leaving codeine as the only opiate pain reliever in the Schedule III category.
7 Most states operate or are in the process of implementing Prescription Drug Monitoring Programs (PDMPs), electronic databases that track dispensed prescriptions for controlled substances. Although information collected by PDMPs may aid in identifying individuals who may be overusing or abusing controlled substances, access to information contained in the database varies from state to state. For example, some states allow access to the information by insurers and health insurance programs (e.g., Medicare) while others do not.
8 One study found that using a criterion of three or more prescribers and three or more pharmacies was likely to misclassify patients who were using opioids appropriately. Thus, the study used a criterion of four or more prescribers and four or more pharmacies to evaluate questionable activity in the Massachusetts prescription [drug] monitoring program data (Prescription Drug Monitoring Program Center of Excellence 2014).
9 In the final 2016 call letter, CMS reported a reduction in the number of potential opioid overusers as identified by the CMS Overutilization Monitoring System between 2011 and 2014 (Centers for Medicare & Medicaid Services 2015).
endnotes

135 Repo r t t o t h e Cong r e s s : Med i ca r e and t h e Hea l t h Ca r e De l i v e r y S y s t em | J u ne 2015
Abankwah, R. 2014. Combatting Part D drug diversion. Presentation by staff from the Centers for Medicare & Medicaid Services. September 11.
Benyamin, R., A. M. Trescot, S. Datta, et al. 2008. Opioid complications and side effects. Pain Physician 11, no. 2 supplement (March): S105–120.
Budnitz, D. S., M. C. Lovegrove, N. Shehab, et al. 2011. Emergency hospitalizations for adverse drug events in older Americans. New England Journal of Medicine 365, no. 21 (November 24): 2002–2012.
Bushardt, R. L., E. B. Massey, T. W. Simpson, et al. 2008. Polypharmacy: Misleading, but manageable. Clinical Interventions in Aging 3, no. 2: 383–389.
Centers for Medicare & Medicaid Services, Department of Health and Human Services. 2015. Memo to all Medicare Advantage organizations, prescription drug plan sponsors, and other interested parties regarding the announcement of calendar year (CY) 2016 Medicare Advantage capitation rates and Medicare Advantage and Part D payment policies and final call letter. April 6. http://www.cms.gov/Medicare/Health-Plans/MedicareAdvtgSpecRateStats/Downloads/Announcement2016.pdf.
Centers for Medicare & Medicaid Services, Department of Health and Human Services. 2014. Drug diversion toolkit: Prescription opioids—An overview for prescribers and pharmacists. Baltimore, MD: CMS. http://www.cms.gov/Medicare-Medicaid-Coordination/Fraud-Prevention/Medicaid-Integrity-Education/Provider-Education-Toolkits/Downloads/prescription-opioids-booklet0814.pdf.
Chrischilles, E. A., R. VanGilder, K. Wright, et al. 2009. Inappropriate medication use as a risk factor for self-reported adverse drug effects in older adults. Journal of the American Geriatrics Society 57, no. 6 (Jun): 1000–1006.
Corsonello, A., C. Pedone, F. Lattanzio, et al. 2009. Potentially inappropriate medications and functional decline in elderly hospitalized patients. Journal of the American Geriatrics Society 57, no. 6 (June): 1007–1014.
Duerden, M. 2013. Polypharmacy and medicines optimization. London: The King’s Fund.
Field, T. S., K. M. Mazor, B. Briesacher, et al. 2007. Adverse drug events resulting from patient errors in older adults. Journal of the American Geriatrics Society 55, no. 2 (February): 271–276.
Frazier, S. C. 2005. Health outcomes and polypharmacy in elderly individuals: An integrated literature review. Journal of Gerontological Nursing 31, no. 9 (September): 4–11.
Gandhi, T. K., S. N. Weingart, J. Borus, et al. 2003. Adverse drug events in ambulatory care. New England Journal of Medicine 348, no. 16 (April 17): 1556–1564.
Garfinkel, D., and D. Mangin. 2010. Feasibility study of a systematic approach for discontinuation of multiple medications in older adults: Addressing polypharmacy. Archives of Internal Medicine 170, no. 18 (October 11): 1648–1654.
Giusani, M., and A. White. 2011. Therapeutic duplication. https://www.scripnet.com/therapeutic-duplication/.
Government Accountability Office. 2011. Medicare Part D: Instances of questionable access to prescription drugs. GAO–11–699 Washington, DC: GAO.
Gray, C. L., and C. Gardner. 2009. Adverse drug events in the elderly: An ongoing problem. Journal of Managed Care Pharmacy 15, no. 7 (September): 568–571.
Hajjar, E. R., A. C. Cafiero, and J. T. Hanlon. 2007. Polypharmacy in elderly patients. American Journal of Geriatric Pharmacotherapy 5, no. 4 (December): 345–351.
Haque, R. 2009. ARMOR: A tool to evaluate polypharmacy in elderly persons. Annals of Long-Term Care 17, no. 6 (June): 26–30.
Isetts, B. J., A. R. Brummel, D. R. de Oliveira, et al. 2012. Managing drug-related morbidity and mortality in the patient-centered medical home. Medical Care 50, no. 11 (November): 997–1001.
Jena, A. B., D. Goldman, L. Weaver, et al. 2014. Opioid prescribing by multiple providers in Medicare: Retrospective observational study of insurance claims. British Medical Journal 348: g1393.
Kripalani, S., M. Price, V. Vigil, et al. 2008. Frequency and predictors of prescription-related issues after hospital discharge. Journal of Hospital Medicine 3, no. 1 (January): 12–19.
Kroll, D. 2014. New rules for hydrocodone: What you should know. Forbes, August 22.
Laroche, M. L., J. P. Charmes, Y. Nouaille, et al. 2006. Impact of hospitalisation in an acute medical geriatric unit on potentially inappropriate medication use. Drugs and Aging 23, no. 1: 49–59.
References

136 Po l ypha r macy and op i o i d u s e among Med i ca r e Pa r t D e n r o l l e e s
Owens, P. L., M. L. Barrett, A. J. Weiss, et al. 2014. Hospital inpatient utilization related to opioid overuse among adults, 1993–2012. HCUP statistical brief #177 Rockville, MD: Agency for Healthcare Research and Quality. http://www.hcup-us.ahrq.gov/reports/statbriefs/sb177-Hospitalizations-for-Opioid-Overuse.pdf.
Prescription Drug Monitoring Program Center of Excellence, Brandeis University. 2014. Study analysis 101. Waltham, MA: PDMP Center of Excellence.
Salazar, J. A., I. Poon, and M. Nair. 2007. Clinical consequences of polypharmacy in elderly: Expect the unexpected, think the unthinkable. Expert Opinion Drug Safety 6, no. 6 (November): 695–704.
Sarkar, U., A. López, J. H. Maselli, et al. 2011. Adverse drug events in U.S. adult ambulatory medical care. Health Services Research: 10.1111/j.1475-6773.2011.01269.
Steinman, M. A., C. S. Landefeld, G. E. Rosenthal, et al. 2006. Polypharmacy and prescribing quality in older people. Journal of the American Geriatrics Society 54, no. 10 (October): 1516–1523.
Substance Abuse and Mental Health Services Administration, Department of Health and Human Services. 2013. SAMHSA opioid overdose prevention toolkit. HHS publication no. (SMA) 13-4742. Rockville, MD: SAMHSA. http://www.hcup-us.ahrq.gov/reports/statbriefs/sb177-Hospitalizations-for-Opioid-Overuse.pdf.
Tannenbaum, C., and K. Johnell. 2014. Managing therapeutic competition in patients with heart failure, lower urinary tract symptoms and incontinence. Drugs and Aging 31, no. 2 (February): 93–101.
Tjia, J., S. J. Velten, C. Parsons, et al. 2013. Studies to reduce unnecessary medication use in frail older adults: A systematic review. Drugs and Aging 30, no. 5 (May): 285–307.
Trescott, C. E., R. M. Beck, M. D. Seelig, et al. 2011. Group Health’s initiative to avert opioid misuse and overdose among patients with chronic noncancer pain. Health Affairs 30, no. 8 (August): 1420–1424.
Vik, S. A., C. J. Maxwell, and D. B. Hogan. 2004. Measurement, correlates, and health outcomes of medication adherence among seniors. Annals of Pharmacotherapy 38, no. 2 (February): 303–312.
Williams, M. E., C. C. Pulliam, R. Hunter, et al. 2004. The short-term effect of interdisciplinary medication review on function and cost in ambulatory elderly people. Journal of the American Geriatrics Society 52, no. 1 (January): 93–98.
Wise, J. 2013. Polypharmacy: A necessary evil. British Medical Journal 347: f7033.
Lee, V. W., K. K. Pang, K. C. Hui, et al. 2013. Medication adherence: Is it a hidden drug-related problem in hidden elderly? Geriatrics & Gerontology International 13, no. 4 (October): 978–985.
Lorgunpai, S. J., M. Grammas, D. S. Lee, et al. 2014. Potential therapeutic competition in community-living older adults in the U.S.: Use of medications that may adversely affect a coexisting condition. PLoS One 9, no. 2: e89447.
Lorincz, C. Y., E. Drazen, P. E. Sokol, et al. 2011. Research in ambulatory patient safety 2000–2010: A 10-year review. Chicago, IL: American Medical Association.
Maher, R. L., J. Hanlon, and E. R. Hajjar. 2014. Clinical consequences of polypharmacy in elderly. Expert Opinion Drug Safety 13, no. 1 (January): 57–65.
Mansur, N., A. Weiss, and Y. Beloosesky. 2009. Is there an association between inappropriate prescription drug use and adherence in discharged elderly patients? Annals of Pharmacotherapy 43, no. 2 (February): 177–184.
Medicare Payment Advisory Commission. 2014a. Letter to Ms. Marilyn Tavenner, Administrator, Centers for Medicare & Medicaid Services, regarding request for comments on the “Medicare program; contract year 2015 policy and technical changes to the Medicare Advantage and the Medicare prescription drug benefit programs, proposed rule.” February 28.
Medicare Payment Advisory Commission. 2014b. Report to the Congress: Medicare and the health care delivery system. Washington, DC: MedPAC.
Milton, J. C., I. Hill-Smith, and S. H. Jackson. 2008. Prescribing for older people. British Medical Journal 336, no. 7644 (March 15): 606–609.
National Center for Health Statistics, Department of Health and Human Services. 2014. Health, United States, 2013: Chartbook. Figures 20–29, special feature on prescription drugs. Hyattsville, MD: NCHS. http://www.cdc.gov/nchs/hus/chartbook.htm#chartbook_special_feature.
Office of Inspector General, Department of Health and Human Services. 2013a. Medicare inappropriately paid for drugs ordered by individuals without prescribing authority. OEI–02–09–00608. Washington, DC: OIG.
Office of Inspector General, Department of Health and Human Services. 2013b. Prescribers with questionable patterns in Medicare Part D. OEI–02–09–00603. Washington, DC: OIG.
Office of Inspector General, Department of Health and Human Services. 2012. Retail pharmacies with questionable Part D billing. OEI–02–09–00600. Washington, DC: OIG.