polymerization-induced phase separation iii. morphologies and contrast ratios of polymer dispersed...
TRANSCRIPT

This article was downloaded by: [University of Strathclyde]On: 06 October 2014, At: 18:38Publisher: Taylor & FrancisInforma Ltd Registered in England and Wales Registered Number: 1072954 Registered office: MortimerHouse, 37-41 Mortimer Street, London W1T 3JH, UK
Liquid CrystalsPublication details, including instructions for authors and subscription information:http://www.tandfonline.com/loi/tlct20
Polymerization-induced phase separation III.Morphologies and contrast ratios of polymerdispersed liquid crystalsC. SERBUTOVIEZ , J. G. KLOOSTERBOER , H. M. J. BOOTS , F. A. M. A. PAULISSEN &F. J. TOUWSLAGERPublished online: 06 Aug 2010.
To cite this article: C. SERBUTOVIEZ , J. G. KLOOSTERBOER , H. M. J. BOOTS , F. A. M. A. PAULISSEN & F. J.TOUWSLAGER (1997) Polymerization-induced phase separation III. Morphologies and contrast ratios of polymerdispersed liquid crystals, Liquid Crystals, 22:2, 145-156, DOI: 10.1080/026782997209504
To link to this article: http://dx.doi.org/10.1080/026782997209504
PLEASE SCROLL DOWN FOR ARTICLE
Taylor & Francis makes every effort to ensure the accuracy of all the information (the “Content”)contained in the publications on our platform. However, Taylor & Francis, our agents, and our licensorsmake no representations or warranties whatsoever as to the accuracy, completeness, or suitabilityfor any purpose of the Content. Any opinions and views expressed in this publication are the opinionsand views of the authors, and are not the views of or endorsed by Taylor & Francis. The accuracy ofthe Content should not be relied upon and should be independently verified with primary sources ofinformation. Taylor and Francis shall not be liable for any losses, actions, claims, proceedings, demands,costs, expenses, damages, and other liabilities whatsoever or howsoever caused arising directly orindirectly in connection with, in relation to or arising out of the use of the Content.
This article may be used for research, teaching, and private study purposes. Any substantial orsystematic reproduction, redistribution, reselling, loan, sub-licensing, systematic supply, or distributionin any form to anyone is expressly forbidden. Terms & Conditions of access and use can be found athttp://www.tandfonline.com/page/terms-and-conditions

L iquid Crystals, 1997, Vol. 22, No. 2, 145 ± 156
Polymerization-induced phase separationIII. Morphologies and contrast ratios of polymer dispersed
liquid crystals²
by C. SERBUTOVIEZ³ , J. G. KLOOSTERBOER*, H. M. J. BOOTS,F. A. M. A. PAULISSEN and F. J. TOUWSLAGER
Philips Research Laboratories, Professor Holstlaan 4, 5656 AA Eindhoven,The Netherlands
(Received 10 June 1996; accepted 23 August 1996 )
Polymerization induced phase separation in mixtures of liquid crystals (LCs) and acrylates(Merck TL205/PN393) proceeds by liquid ± gel demixing, in most cases of practical interest.At high LC content or low temperature of polymerization liquid ± liquid separation cannot beexcluded. Depending on the elasticity and homogeneity of the polymer network at the onsetof phase separation, spherical or non-spherical LC domains are observed; non-sphericaldomains re¯ ect an inhomogeneous gel structure. The change from spherical to non-sphericaloccurs in a very narrow range of LC concentrations and curing temperatures. The transitionbetween these two morphologies can be explained using conversion phase diagrams obtainedfrom the Flory± Huggins± DusÏ ek theory. The contrast ratio of PDLCs made from the Merckmixture passes through a maximum when the droplet shape at the onset of phase separationchanges from spherical to non-spherical. Lowering the LC content or increasing the temper-ature leads to smaller LC domains which scatter less e� ciently. The reverse changes lead toearly phase separation and large LC domains which also scatter ine� ciently. It is speculatedthat the maximum of the contrast ratio is related to secondary phase separation, leading tosubdomains of an appropriate size.
1. Introduction depending on the structure and the amount of polymerPolymer Dispersed Liquid Crystal (PDLC) materials gel at the appearance of the nematic phase.
are promising materials for the preparat ion of electro- Using the concept of a conversion phase diagram,optical devices such as displays and electrically control- predictions of morphology can be made in a qualitat ivelable light shutters [1 ± 4 ]. UV light-induced polymeriz- way [10 ]. The next step would be to relate theseation is presently the most common technique for morphological changes to the electro-optical perform-making PDLCs. It is well-known that the electro-optical ance of PDLCs. However, this was impeded by the poorperformance of PDLCs depends on a large number of contrast ratio, high switching voltage and strong hyster-parameters such as type and concentration of LC, type esis of PDLCs made from the simple model system.and functionality of monomers, UV intensity, temper- Therefore, we have switched to PDLCs made from aature of polymerization , crosslink density, etc. [1, 4 ± 8] . well-known and widely used commercially availabl eRather than studying many di� erent systems and chan- mixture, TL205/PN393. TL205 is an LC mixture con-ging many parameters, we have recently analysed the taining halogenated biphenyl and terphenyl compounds;phase separation process in a model system composed PN393 is a mixture of mono- and multi-functionalof a single LC compound and a single monomer [9]. It acrylates. Although this is a multicomponent system, weemerged that liquid ± gel phase separation occurs rather will treat it as a pseudo-ternary system composed ofthan liquid ± liquid demixing. We also found that either monomer (M ), LC solvent (LC), and polymer (P). Wespherical or non-spherical nematic liquid crystal will ® rst report the phase diagram of the unpolymerizeddomains appear at the onset of phase separation, starting mixture, then explain the di� erences in morpho-
logy obtained under various polymerization conditionsusing conversion phase diagrams, and ® nally we will
*Author for correspondence.relate these di� erences to variations of the contrast ratio.² II: ref. 9. I: ref. 10.
A clear relationship will be shown to exist between³ Present address: Thomson LCD, Sextant Avionique, Z.I.Centr.Alp., 38430 Moirans, France. the values of the contrast ratio and the size and the
0267 ± 8292/97 $12 0́0 Ñ 1997 Taylor & Francis Ltd.
Dow
nloa
ded
by [
Uni
vers
ity o
f St
rath
clyd
e] a
t 18:
38 0
6 O
ctob
er 2
014
146 C. Serbutoviez et al.
shape of the liquid crystal domains at the onset of phase 2.4. Photopolymerization in the DSCSamples were made by sandwiching a droplet betweenseparation. Its existence will be rationalized on the basis
of the conversion-phase diagram which also guides in a polished silicon disc and a glass disc of 7 mm diameter.Spacers of 18 mm were used for thickness control. Lightchoosing the proper reaction conditions to obtain the
desired morphology. intensities were varied between 0´07 and 7 mW cm Õ 2 .The DSC measures the exothermic heat ¯ ux of thepolymerization reaction which is proport ional to the2. Experimentalrate of reaction. Integration yields the heat of reaction,2.1. Chemicalsand division by the total heat of reaction gives theTL205 and PN393 were obtained from Merck Ltddouble bond conversion, assuming total conversion at(Poole, UK). The physical characteristics of TL205 arethe end of the reaction. The DSC had been modi® ed tothe following: T N � I=87 4́ ß C, Dn=0´2175, De=5´0.monitor the intensity of a HeNe laser beam re¯ ected atthe bottom of the sample. When the sample becomes
2.2. Phase diagram before polymerization turbid due to nematic phase formation the intensity ofThe phase diagram of the model system PN393/TL205 the re¯ ected light beam drops considerably. The DSC
was determined by microscopy. Various mixtures were curve enables calculat ion of the conversion at whichheated above their clearing temperature, then one drop turbidity sets in. The formation of isotropic dropletswas sandwiched between two glass plates contain ing cannot be observed with the thin samples used. Furtherglass ® bre spacers with a thickness of 18 mm, and next details have been given elsewhere [11, 12 ].the samples were mounted on the heating/cooling stage(Linkam TMS 92/THMS 600) of a polarizing micro- 2.5. Electro-optical measurementsscope. The light from the lamp of the microscope was The measurements for electro-optical characterization® ltered with a Kapton foil to avoid unwanted exposure of PDLC cells were performed on a modi® ed Displayto UV. The sample was heated above its clearing point Measuring System (DMS) from Autronic GmbHand then cooled and observed under the microscope (Karlsruhe, Germany) . The cells were illuminated by awhile cooling to Õ 40 ß C; it was then heated back to its narrow white light beam with a divergence of 1´5 ß . Theclearing point. Heating and cooling rates were varied full collection angle was 5´2 ß . Detection and measure-between 10 and 5 ß C min Õ 1 during each scan, the lowest ment of the intensity of transmitted light was made withrate being used near the phase transition. a photomultiplie r. Addressing was achieved with a
square wave ( f=1 kHz) and the voltage increase as afunction of time was 0´05 V s Õ 1 . All measurements were2.3. Photopolymerization under the microscope
The samples were prepared in the same way as those performed at room temperature.used for the determination of the phase diagram. Theywere cured by radiation from a high pressure mercury 3. Results
3.1. Binary phase diagram before polymerizationlamp equipped with an optical ® bre (Efos Ultracure100). The UV intensities were measured at the sample The phases observed upon cooling and heating mix-
tures of TL205 and PN393 are depicted in ® gure 1. Thesurface at a wavelength of 365 nm. UV intensities weregenerally low ( 0´1± 1 mW cm Õ 2 ) in order to bring the general shapes of the two diagrams are similar; how-
ever, the phase transition curves obtained on coolingrate of phase separation into an easily accessible timedomain . The UV irradiation was stopped at the onset are shifted to lower temperatures due to supercooling
(dashed areas) . Two single phases, isotropic ( I ) andof the phase separation and the behaviou r of the dropletswas examined. The samples were then cooled down at nematic (N), and one large biphasic region (I+N) can
be identi ® ed. No crystallization was observed in the1 ß C min Õ 1 during 5 minutes and then heated back totheir original curing temperature. When phase separa- range of temperatures and concentrations studied.
Figure 2 shows a microscope picture of a mixturetion sets in during polymerization , a front-like formationof droplets occurs due to the unavoidable intensity contain ing 80 wt % of TL205 and 20 wt % of PN393 at
Õ 5 ß C between crossed polarizers. Thermal phase sep-gradient in our set-up. Observations were made using astandard magni ® cation of 200 Ö . The resolution on the aration has led to the formation of a two phase system
composed of a dispersion of nearly equally sized LCvideo screen was then about 1 mm. In a few cases, a highspeed video recording was made during exposure at droplets (around 15 mm) in an isotropic liquid. If such a
dispersion could be stabilized by polymerization , PDLCs7 mW cm Õ 2 (Kodak Ektapro EM ). The sampling ratewas 500 frames s Õ 1 . The high speed camera reduced the with a low polydispersity in LC domain size would
be obtained. However, polymerization leads to theresolution to about 1´5 mm. At the sampling rate chosen,the time interval of observat ion was about 3 s. formation of many new, small domains (see § 3.2.1 ).
Dow
nloa
ded
by [
Uni
vers
ity o
f St
rath
clyd
e] a
t 18:
38 0
6 O
ctob
er 2
014

147Polymerization-induced phase separation
Figure 1. Phase behaviour of thetechnical system TL205/PN393observed upon cooling (dashedline) and upon heating (con-tinuous line). I: isotropic phase;N: nematic phase. Upperhatched area: supercooled iso-tropic liquid; lower hatchedarea: supercooled nematicphase. Dotted arrows depict theisothermal and isocon-centration modes of phaseseparation.
morphology. We have also determined the conversionat incipient phase separation.
3.2.1. Variation of L C concentration and temperatureIn order to investigate the in¯ uence of the polymer
network on the morphology of PDLCs, we have mon-itored the photopolymerization of the technical systemat high, intermediate and low concentrations of TL205and at di� erent curing temperatures. The observat ionsduring polymerization and subsequent cooling and heat-ing are summarized in table 1. In the ® rst series, concen-trations ranged from 83 to 96 wt % of TL205 (table 1,samples 1 to 3 ). In order to start the photopolymeriz-ation in the isotropic state, the ® rst two samples had tobe heated to 75 and 60 ß C, respectively. Sample 3 wasisotropic at 25 ß C (cf. ® gure 1 ) . The samples polymerizedat high temperature required a high UV dose for phaseFigure 2. Unpolymerized mixture containing 80 wt % of
TL205 and 20 wt % of PN393, cooled from +40 to Õ 5 ß C. separation to start (cf. samples 1 and 2 with sample 3 ).Crossed polarizers. At the onset of the phase separation, only a few nematic
droplets were present and pronounced coalescence wasobserved. By contrast, the phase separation in sample 33.2. Polymerization-induced phase separation and
morphology already occurred after a UV dose of 69 mJ cm Õ 2 . Largenumbers of droplets were formed, all of them sphericalThe onset of phase separation shows up as a front-
like formation of droplets due to the unavoidable intens- and nematic with sizes ranging from 10 to 25 mm. Sincethe cell gap used was 18 mm, the larger domains extendity gradient under our microscope. The droplets are
nematic as soon as they appear. For clarity, pictures from the top to the bottom of the cell. As in the formercases, signi ® cant coalescence was observed. Resumptionhave been taken mainly near this front. Further in the
sample or later in time, the droplet density increases of the irradiation in sample 3 caused the formation ofnew domains and further coalescence. Subsequent cool-considerably. Depending on the LC content and the
reaction temperature, coalescence does or does not ing led to an increase of the size of the existing LCdroplets and only very few new LC droplets were formed.occur. In the limited resolution depth of our microscope,
a spaghett i-like structure develops during continued By heating the sample back to its curing temperature,the size of the small droplets decreased, and at 25 ß Cexposure. Pictures of that structure are less informative
than the ones obtained near the front. We were unable only a few large droplets remained. A permanent changein morphology had occurred.to determine whether or not co-continuous phases were
formed in the ® nal stage. If coalescence occurs it shows In the second series of experiments, the LC concentra-tions ranged from 76 to 81 wt % (table 1, samples 4 ± 8 ).up on the video. We have studied the in¯ uence of LC
content and temperature of polymerization on the In sample 4 ( ® gure 3 ), small spherical nematic droplets
Dow
nloa
ded
by [
Uni
vers
ity o
f St
rath
clyd
e] a
t 18:
38 0
6 O
ctob
er 2
014

148 C. Serbutoviez et al.
Table 1. Microscopic observations during polymerization-induced phase separation in TL205/PN393.
Sample no. LC content/ Curing UV intensity/ Irradiation time Dose/( ® gure no.) wt % TL205 temp./ ß C mW cm Õ 2 to phase sepn./s mJ cm Õ 2 Droplet shape
High1 96 75 0´3 625 187 spherical and
nematic2 90 60 0´6 290 174 spherical and
nematic3 83 25 0´3 232 69 spherical and
nematic
Medium4 81 25 0´3 297 89 spherical and(3 ) nematic
5 80 25 0´3 317 95 non-spherical and(4 ) nematic
6 80 20 0´3 148 44 spherical and(5 ) nematic7 80 40 0´3 491 147 non-spherical and(6 (a)) nematic (v. small )8 76 25 0´3 514 163 non-spherical and
nematic (v. small )
Low9, 10 72 ± 70 25 0´6± 6 Ð Ð extremely small
nematic domains11± 13 65 ± 40 25 0´6± 6 Ð Ð no visible phase
separation
Sample no. Coalescence during Second exposure (few s, E� ect of cooling to 5 ß C E� ect of reheat to Tcure
( ® gure no.) exposure same UV intensity) below Tcure at 1 ß C min Õ 1 at 1 ß C min Õ 1
1 yes Ð Ð Ð
2 yes Ð Ð Ð
3 yes ( large formation of new domains; increase of droplet size; no decrease of LC domain size;polydispersity in size) increased coalescence new droplets at 25 ß C few large droplets;
permanent change inmorphology
4 hardly any LC depletion zone between slight increase of droplet size; decrease of droplet size;(3 ) new and ® rst formed droplets new spherical droplets recovery of original
morphology5 no Ð slight increase of droplet size; decrease of droplet size;(4 ) new deformed LC domains nearly full recovery of
original morphology6 yes Ð increase of droplet size; new decrease of droplet size;(5 ) droplets partial change in morphology7 no Ð Ð Ð( (6a) )
8 no Ð Ð Ð
9, 10 not observable Ð Ð Ð
11± 13 not observable Ð Ð Ð
Ð : not done or not determined.
Dow
nloa
ded
by [
Uni
vers
ity o
f St
rath
clyd
e] a
t 18:
38 0
6 O
ctob
er 2
014

149Polymerization-induced phase separation
Figure 4. Non-spherical nematic droplets at the onset ofFigure 3. Spherical nematic droplets at the onset of phaseseparation. Composition: 81 wt % of TL205, 19 wt % of phase separation. Composition: 80 wt % of TL205,
20 wt % of PN393; temperature: 25 ß C; IUV=0 3́ mW cm Õ 2 ;PN393; temperature: 25 ß C; IUV=0 3́ mW cm Õ 2 ; irradi-ation time: 297 s. Straight bars are glass spacers with a irradiation time: 317 s. Straight bars are glass spacers with
a thickness of 18 mm. No polarizers.thickness of 18 mm. No polarizers.
phase separated after a UV dose of 87 mJ cm Õ 2 ( ® gure 3 ) .Very few coalescence events were observed, most of thedroplets remaining separated. Resumption of the irradi-ation (second exposure in table 1 ) led to a depletionzone around existing domains. This shows that at theonset of the second phase separation, the system was farfrom equilibrium. Cooling from 25 to 20 ß C led to theformation of new spherical nematic droplets all over thesample. During subsequent heating, droplets which wereformed during cooling disappeared again.
At 80 wt % TL205, the phase separation occurredsomewhat later, after a UV dose of 95 mJ cm Õ 2 (sample5 ). The LC phase nucleated as spherical, nematic drop-lets, but as these expanded their size, their shape rapidlybecame non-spherical ( ® gure 4 ) . No coalescence wasobserved in this system and, upon cooling, not only Figure 5. Spherical nematic droplets at the onset of phasethe size of the existing non-spherical droplets increased, separation. Composition: 80 wt % of TL205, 20 wt % ofbut also many new, large, deformed LC domains were PN393; temperature: 20 ß C; IUV=0 3́ mW cm Õ 2 ; irradi-
ation time: 148 s. Straight bars are glass spacers with aformed all over the sample. During subsequent heating,thickness of 18 mm. No polarizers.most of the droplets which had been formed during
cooling disappeared again.At 80 wt % TL205, a high speed video recording was the droplets behaved in an intermediate way to those
obtained in samples 3 and 4.also made at ambient temperature during exposure at7 mW cm Õ 2 . No signi ® cant di� erences from the regular At a curing temperature of 40 ß C (sample 7 ), the phase
separation occurred after an exposure dose ofspeed recordings at 25 ß C were noticed; in particular nocoalescence was observed. Unlike the other experiments, 147 mJ cm Õ 2 and led to very small nematic and non-
spherical domains with a size close to the limit of theexposure was continued after phase separation set in.If the UV-polymerization was performed at the same resolution of the optical microscope (around 1 mm,
® gure 6 (a)) . No coalescence was observed in this sample.concentration, but at a temperature of 20 ß C (sample 6 ),spherical nematic droplets were formed at the onset of A similar morphology could be obtained by polymeriz-
ing a mixture of 76 wt % of TL205 at 25 ß C (sample 8,the phase separation ( ® gure 5 ) . Pronounced coalescencewas observed in this sample. Upon cooling and heating, ® gure 6 (b) ).
Dow
nloa
ded
by [
Uni
vers
ity o
f St
rath
clyd
e] a
t 18:
38 0
6 O
ctob
er 2
014

150 C. Serbutoviez et al.
concentrations below 70 wt % of TL205, no visible phaseseparation occurred under the microscope (samples11 ± 13 ) . However, with crossed polarizers, some vagueanisotropic patterns could be seen.
3.2.2. Conversion at incipient turbidityThe UV dose required for phase separation strongly
depends on LC content and temperature (table 1 ) . Inorder to check whether this is due to a di� erence inreaction rate or to a di� erence in conversion, we havesimultaneously carried out photo-DSC and turbiditymeasurements. This technique allows the determinationof the extent of double bond conversion at incipientturbidity, assuming total conversion at the end of thepolymerization . It was checked with FTIR spectroscopythat the polymerization reaction indeed runs to comple-tion. After 5 min of exposure at 7 mW cm Õ 2 , the doublebond conversion was >98%. A sudden increase ofturbidity sets in at the appearance of a nematic phase.In the experiments described in § 3.2.1, the phase separ-ated droplets were always nematic. Three di� erent sys-tems were measured, and results are shown in ® gures 7and 8 and table 2.
In experiment 1 ( ® gure 7 ) , the phase separationoccurred at 11% double bond conversion. This meansthat at the onset of the phase separation, the gel isloosely crosslinked (cf. sample 4 in table 1; however, inthe DSC a higher light intensity was used throughoutthe series). In such a gel, spherical droplets are formed.In experiment 2 ( ® gure 8 ), 22% of the double bonds hadreacted at incipient turbidity. This showed up as a muchlater development of turbidity (cf. sample 5 in table 1 ).
Figure 6. LC domains at the onset of phase separation. Non-spherical droplets were observed. In experiment 3,(a) Composition: 80 wt % of TL205, 20 wt % of PN393;
the decrease of LC concentration was compensated bytemperature: 40 ß C; IUV=0 3́ mW cm Õ 2 ; irradiation time:the decrease of curing temperature. Phase separation491 s. (b) Composition: 76 wt % of TL205, 24 wt % ofstarted at 10% conversion. At this low gel contentPN393; temperature: 25 ß C; IUV=0 3́ mW cm Õ 2 ; irradi-
ation time: 514 s. Straight bars are glass spacers with a spherical droplets appeared (cf. sample 6 in table 1 ).thickness of 18 mm. No polarizers.
3.3. Morphology at phase separation and contrast ratioTwo series of PDLC cells were prepared. In the ® rstA third series of samples contain ing 40 to 72 wt % of
TL205 was polymerized at 25 ß C (table 1 ) . As in the case series, the curing temperature was kept constant at 25 ß Cand the percentage of TL205 in PN393 in the startingof the model system K15/TEGDA, the phase separa-
tion process was strongly delayed and the droplet size mixture was varied from 82 to 78 wt %. In the secondseries, a mixture contain ing 80 wt % of TL205 andat the onset of the phase separation decreased as
the LC concentration decreased (samples 9, 10 ) [9 ]. For 20 wt % of PN393 was polymerized at di� erent temper-
Table 2. Double bond conversion at incipient turbidity; light intensity: 7 mW cm Õ 2 .
Experiment Composition wt % T Conversion atno. TL205/PN393 ß C turbidity/% Droplet shape
1 81/19 25 11 spherical2 80/20 25 22 non-spherical3 80/20 20 10 spherical
Dow
nloa
ded
by [
Uni
vers
ity o
f St
rath
clyd
e] a
t 18:
38 0
6 O
ctob
er 2
014

151Polymerization-induced phase separation
Figure 7. Photo-DSC/turbiditymeasurement: 81 wt % ofTL205/19 wt % of PN393,cured at 25 ß C. IUV=7 mW cm Õ 2 ; C=C conversionat phase separation: 11%.
Figure 8. Photo-DSC/turbiditymeasurement: 80 wt % ofTL205/20 wt % of PN393,cured at 25 ß C. IUV=7 mW cm Õ 2 . C=C conversionat phase separation: 22%.
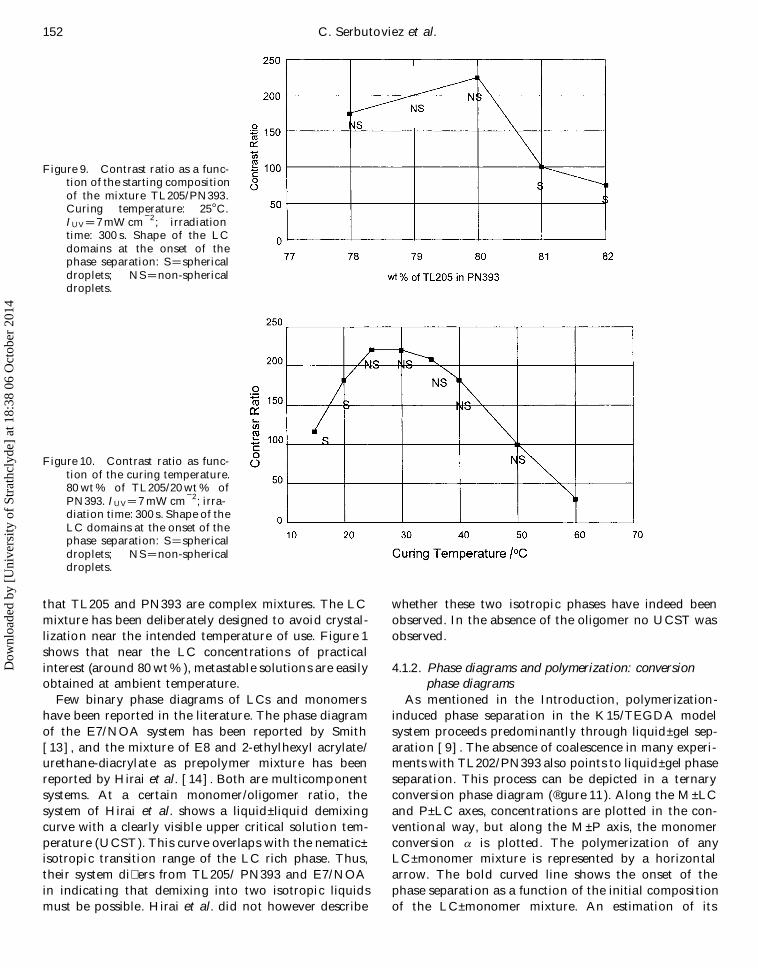
atures ( from 15 to 60 ß C). The values of the contrast temperature of photopolymerization is raised above35 ß C.ratio (Ton /Toff ) of these PDLC cells are plotted as a
function of the polymerization conditions in ® gures 9and 10. In ® gure 9 the contrast ratio increases strongly 4. Discussion
4.1. Phase diagramsfrom 50 to 220 upon reduction of the LC content from82 to 80 wt %. This steep transition occurs simultan- 4.1.1. Binary phase diagram of the L C± monomer
mixtureeously with a change in shape of the LC droplets fromspherical to non-spherical. When the LC concentration Before studying polymerization- induced phase separa-
tion, the phase behaviou r of the unpolymerized modelis further reduced, the contrast ratio decreases again.The in¯ uence of the curing temperature on the contrast system should be established since it gives the thermo-
dynamic stability of the starting mixture as a functionratio is shown in ® gure 10. The graph shows that thecontrast ratio increases considerably when the temper- of temperature and composition.
Although the system TL205/PN393 is a multicompon-ature of polymerization is increased from 15 to 25 ß C.As in the ® rst series of experiments, a signi ® cant increase ent system, we will consider it as a pseudo-binary system,
assuming that the LC and the acrylate mixtures behaveof the contrast coincides with a change in shape of thedomains from spherical to non-spherical. Figure 10 also as pure components. However, the absence of crystalliza-
tion in the temperature interval studied re¯ ects the factshows that the contrast ratio decreases again when the
Dow
nloa
ded
by [
Uni
vers
ity o
f St
rath
clyd
e] a
t 18:
38 0
6 O
ctob
er 2
014
152 C. Serbutoviez et al.
Figure 9. Contrast ratio as a func-tion of the starting compositionof the mixture TL205/PN393.Curing temperature: 25 ß C.IUV=7 mW cm Õ 2 ; irradiationtime: 300 s. Shape of the LCdomains at the onset of thephase separation: S=sphericaldroplets; NS=non-sphericaldroplets.
Figure 10. Contrast ratio as func-tion of the curing temperature.80 wt % of TL205/20 wt % ofPN393. IUV=7 mW cm Õ 2 ; irra-diation time: 300 s. Shape of theLC domains at the onset of thephase separation: S=sphericaldroplets; NS=non-sphericaldroplets.
that TL205 and PN393 are complex mixtures. The LC whether these two isotropic phases have indeed beenobserved. In the absence of the oligomer no UCST wasmixture has been deliberately designed to avoid crystal-
lization near the intended temperature of use. Figure 1 observed.shows that near the LC concentrations of practicalinterest (around 80 wt %), metastable solutions are easily 4.1.2. Phase diagrams and polymerization: conversion
phase diagramsobtained at ambient temperature.Few binary phase diagrams of LCs and monomers As mentioned in the Introduction, polymerization-
induced phase separation in the K15/TEGDA modelhave been reported in the literature. The phase diagramof the E7/NOA system has been reported by Smith system proceeds predominantly through liquid ± gel sep-
aration [9]. The absence of coalescence in many experi-[13 ], and the mixture of E8 and 2-ethylhexyl acrylate/urethane-diacrylate as prepolymer mixture has been ments with TL202/PN393 also points to liquid ± gel phase
separation. This process can be depicted in a ternaryreported by Hirai et al. [14 ]. Both are multicomponentsystems. At a certain monomer/oligomer ratio, the conversion phase diagram ( ® gure 11 ). Along the M± LC
and P± LC axes, concentrations are plotted in the con-system of Hirai et al. shows a liquid ± liquid demixingcurve with a clearly visible upper critical solution tem- ventional way, but along the M± P axis, the monomer
conversion a is plotted. The polymerization of anyperature (UCST). This curve overlaps with the nematic±isotropic transition range of the LC rich phase. Thus, LC ± monomer mixture is represented by a horizontal
arrow. The bold curved line shows the onset of thetheir system di� ers from TL205/ PN393 and E7/NOAin indicating that demixing into two isotropic liquids phase separation as a function of the initial composition
of the LC± monomer mixture. An estimation of itsmust be possible . Hirai et al. did not however describe
Dow
nloa
ded
by [
Uni
vers
ity o
f St
rath
clyd
e] a
t 18:
38 0
6 O
ctob
er 2
014

153Polymerization-induced phase separation
con® rmed by the photo-DSC/turbidity measurements(table 2 ) . This means that the polymerization of twomixtures of slightly di� erent initial LC concentrationwill lead to a di� erence of the networks at the onset ofthe phase separation: either a large volume fraction of adensely and inhomogeneously crosslinked network (forlow LC concentrations) which has a su� ciently highelasticity to deform the shape of the LC domains, or amuch smaller volume fraction of a loosely crosslinkedgel (for high LC concentrations) with a low elasticityand a high ¯ exibility . In the latter case, the dropletsremain spherical. In this way the simple diagram explainsthe various morphologies of the LC domains observedduring photopolymerization, as collected in table 1.
In all cases, isolated nematic droplets appear atthe beginning of phase separation (cf. ® gures 3 ± 6 ) .Depending on the experimental conditions, coalescence
Figure 11. Ternary conversion phase diagram (schematic): does or does not occur later in the reaction. If thee� ect of the initial composition on the phase separation
exposure is continued after the onset of phase separation,process. a=degree of monomer conversion.a spaghett i-like structure is formed in most cases. Wewere unable to establish whether or not co-continuousphases result at the end of the reaction. However,position can be obtained on the basis of the Flory±
Huggins ± DusÆek theory and by making further assump- the relatively high LC contents used might favour theformation of a continuous LC phase.tions about the respective x values ( xM± LC , xM± P , xLC± P)
and the crosslink e� ciency during polymerization [10]. At high LC contents (samples 1 ± 3 ) , considerablecoalescence occurs. This indicates that the gel is eitherPhase separation starts at the intersection of a polymeriz-
ation line with the phase separation line. In ® gure 11, very weakly crosslinked or that gelation occurs afterphase separation, i.e. liquid ± liquid demixing of a polymerthe two horizontal arrows represent the polymerization
of two mixtures of slightly di� erent initial composition. rich and an LC rich phase precedes gelation . At mediumLC contents, very few or no coalescence events areThe diagram shows that the extent of polymerization at
which phase separation starts is very sensitive to the observed; phase separation occurs at higher conversionand the gel is strong enough to prevent coalescence. Ininitial monomer or LC concentration.sample 4 most of the droplets remain separated. Thissituation is depicted schematically in ® gure 12 (a) .4.2. Morphology and conversion phase diagram
The most intriguing results from the three series of In sample 5, the phase separation occurs still later inthe reaction so that the gel is strong enough to preventexperiments summarized in table 1 are the absence of
coalescence for LC concentrations of less than 81 wt % coalescence of LC droplets. Moreover, its elasticity andinhomogeneity are also high enough to deform the LC(except sample 6 ) and the abrupt change of the shape of
the LC domains as a function of initial LC content and domains. Therefore, a non-spherical morphology results( ® gure 12 (b)) . In samples 7 and 8, the LC domains arecuring temperature.
The absence of coalescence points to liquid ± gel separa- even more in¯ uenced by the presence of the gel andhence they remain very small ( ® gure 12 (c)) . At low LCtion and the formation of non-spherical domains re¯ ects
the inhomogeneous structure of the polymer network. content the gel is so strong at phase separation that thedomains become vanishingly small.The same phenomena have already been noticed in a
simple model system composed of K15/TEGDA [9 ]. The distorting e� ect of a decreasing LC content onthe droplet shape can be o� set by lowering the curingHowever, in the technical system, the change from
spherical to non-spherical occurs within only a one per temperature: sample 6 shows coalescence. This temper-ature e� ect on droplet shape can also be readily under-cent LC concentration range or within a 5 degrees
change in the curing temperature. As indicated in the stood from the conversion phase diagram. Now the LCcontent is kept constant, but upon increasing the temper-conversion phase diagram of ® gure 11, the extent of
polymerization a at which phase separation starts is ature, the interaction parameters xM± P and xLC± P willdecrease, leading to an increase of the swelling capacityvery sensitive to the initial LC concentration. The higher
the LC concentration, the lower is the conversion at the of the polymer network. Consequently, the phase separa-tion line shifts slightly upwards ( ® gure 13 ). A higheronset of the phase separation. This was experimentally
Dow
nloa
ded
by [
Uni
vers
ity o
f St
rath
clyd
e] a
t 18:
38 0
6 O
ctob
er 2
014

154 C. Serbutoviez et al.
Figure 12. Schematic representa-tion of the gel at the onset ofthe phase separation. Gel con-tent at incipient phase separa-tion increases from (a) to (c) (seetext for discussion).
cules separate out. Droplets may grow in size (sample 3 ),in number, or both (samples 6, 5 and 4 ), depending onthe strength of the gel. During heating, droplets whichhave been formed during cooling disappear again dueto the recovery of the swelling capacity of the polymernetwork.
The ternary conversion phase diagram also explainswhy at a low LC content or at a high curing temperaturethere may be no phase separation at all. At low LCconcentrations or high curing temperatures, the phaseseparation is not only delayed until high conversion,such that only very small droplets can be formed, butalso the increasing gel fraction reduces the driving forcefor phase separation until the swelling capacity of thenetwork is su� cient to accommodate all of the LCmolecules.
The absence of coalescence in a large number ofFigure 13. Ternary conversion phase diagram (schematic):
experiments is considered strong evidence for liquid ± gele� ect of the temperature of polymerization on the phaseseparation rather than liquid ± liquid demixing. An altern-separation process. a=degree of monomer conversion.ative explanation is a high viscosity. However, in [9 ]we have shown that even the high viscosity occurringcuring temperature delays the phase separation signi ® c-during very late phase separation in a linear polymer/LCantly, so that at the onset of phase separation, a moresystem does not suppress coalescence. The presence ofdensely crosslinked gel is present. Its elasticity is thena gel at phase separation is even more clearly visiblesu� ciently high to deform the shape of the LC dropletswhen distorted droplets are formed. This is di� cult to( ® gure 12 (b)) . Conversely, a low curing temperaturevisualize in any liquid solution .leads to early phase separation. Therefore, a partially
In the literature, it is often assumed that phase separa-crosslinked gel is present at the onset of phase separation.tion occurs as a result of the increasing size of theThe LC droplets can easily deform this gel, so they willgrowing polymer molecules, i.e. by liquid ± liquid demix-keep their spherical shape ( ® gure 12 (a) ) and eventuallying [1 ± 4, 13, 14]. This may be correct for linear polymersshow coalescence (sample 6 ).where the morphology is stabilized by vitri ® cation ratherCooling after polymerization decreases the swellingthan by crosslinking and also in the ® rst part ofcapacity of the network due to an increase of xM± P and
xLC± P . Consequently, additional LC and monomer mole- crosslinking polymerization through step reactions. In
Dow
nloa
ded
by [
Uni
vers
ity o
f St
rath
clyd
e] a
t 18:
38 0
6 O
ctob
er 2
014

155Polymerization-induced phase separation
the latter case, according to Doane [2], the solubili ty The question remains why the non-spherical LCdomains lead to a much better contrast ratio than theof the LC decreases due to the decreasing compatibility
of the growing polymer chains with the LC solvent ; spherical ones. It looks as if at 25 ß C and at 80 wt % ofTL205, the network elasticity at the onset of the phaseisotropic droplets contain ing LC and monomer separate
and grow until gelation of the polymer matrix arrests separation is exactly that required to achieve the propersize of the LC domains for optimal scattering (typicalfurther growth. Then puri ® cation of the droplets occurs
by consumption of their dissolved monomer by the still sizes are around 1 ± 2 mm). However, from ® gures 3 and4 it can be seen that the actual domain sizes are muchgrowing matrix. In step reactions, demixing will precede
gelation since gelation generally occurs at relatively high larger than 1 mm and therefore much larger than thewavelength of visible light . Such a PDLC should exhibitconversion (33 ± 75 wt %) [15]. However, one would
expect a di� erent order of events if PDLCs are obtained a poor contrast ratio. At the onset of the phase separa-tion, the gel must have just enough elasticity to avoidthrough radical chain crosslinking reactions as described
in the present paper. Chain polymerization involves the coalescence of LC droplets and to prevent excessivegrowth of the LC domains by di� usion. Since at incipientimmediate formation of very high molecular weight
polymer upon starting the reaction. If the reaction phase separation, the LC domains still contain mon-omers and a photoinitiator, subsequent UV exposuremixture contains a signi ® cant fraction of a multifunc -
tional acrylate , as PN393 does, gelation may occur will initiate secondary phase separation. This process iswell documented [12, 16 ± 18]. It might lead to LCalmost at the beginning of the reaction, often at conver-
sions of less than 1 wt % and usually without phase domains with an adequate size for e� cient scattering oflight . It could also be that splitting of relatively largeseparation. Therefore, the driving force for phase separa-
tion is crosslinking rather than size inequali ty between domains into smaller ones leads to di� erent LC orienta-tions in the sub-domains, such that multiple scatteringpolymer and LC molecules. In samples polymerized at
high dilution or low temperature which do show coales- is enhanced. So far, we believe that the contrast ratio ofa PDLC is controlled by the elasticity of the gel at phasecence, the situation is less clear. Liquid ± gel separation
followed by strong deformation of the loose gel is still separation and by the degree of secondary phase separa-tion. Although the appearance of the samples changespossible , but so is liquid ± liquid demixing.
The TL205/PN393 system has recently been studied considerably during further exposure, the localization ofthe transition between spherical and non-spherical LCby Srinivasarao and Amundson [16 ]. These authors
also observed coalescence at high LC content ( 82 4́ wt %) domains appears to be a valuable guidelin e to determinethe right LC content and curing temperature for optimaland no coalescence at a slightly lower LC content
(80 wt %) at 26 ß C. They did not report an abrupt change scattering. However, the questions of precise domainstructures and LC phase continuity in the fully curedfrom spherical to non-spherical droplets upon reducing
the LC content, and the developments of morphology samples require further study.at 80 and 75 wt % LC were similar, albeit that at 75 wt %LC, smaller droplets were formed. We also found that 4.4. Morphology and reaction mechanism
Morphology is known to be a key parameter.droplet size decreases with decreasing LC content ( table1 ) . It should be noted that the light intensity used in Yamagishi et al. claim that the reaction mechanism of
polymerization (step or chain reaction) plays a dominant[16 ] was much higher than in the present paper.role with respect to morphology and performance[19, 20]. A p̀olymer ball’ morphology was associated4.3. Morphology at phase separation and contrast ratio
The data in ® gure 9 show that the contrast ratio with a chain reaction, whereas a more desirable S̀wisscheese’ morphology should result from a step reactionpasses through a pronounced maximum upon reduction
of the LC content from 82 to 78 wt %. The steepest or from a chain reaction with excessive chain transfer,such as the thiol-ene system present in NOA65 [20 ].increase occurs simultaneously with a change in the
shape of the LC droplets from spherical to non-spherical. Unfortunately, it is not possible to change the mechan-ism only, without changing molecular interactionThe slow decline on further reduction of the LC content
can be explained by a late phase separation leading to parameters at the same time.Our experiments show that widely di� erent morpho-domain sizes which are much smaller than the wave-
length of the light and therefore do not scatter the logies can be obtained without any change of the mech-anism. Both in TL205/PN393 and K15/TEGDA, theincident light e� ciently (see ® gure 6 ). Variation of the
curing temperature produces a similar result ( ® gure 10 ). crosslink density of the gel at the onset of phase separa-tion dominates the morphology of the LC droplets.Here too, the decline beyond the maximum can be
explained by a later phase separation, leading to very Similarly , the di� erences in electro-optic performancewhich have been observed with polymer ball and Swisssmall LC domains (cf. ® gures 12 (b) and 12 (c)) .
Dow
nloa
ded
by [
Uni
vers
ity o
f St
rath
clyd
e] a
t 18:
38 0
6 O
ctob
er 2
014
156 Polymerization-induced phase separation
[3] Doane, J. W ., Golemme, A., West, J. L., Whitehead,cheese systems might well be due to di� erences in gelJ. R., and Wu, B. G ., 1988, Mol. Cryst. liq. Cryst.,point and monomer conversion at the onset of the phase165, 511.
separation. [4] Montgomery, G . P., Smith, G . W ., and Vaz, N . A.,1994, L iquid Crystalline and Mesomorphic Polymers,
5. Conclusions edited by V. P. Shibaev and L. Lam, (New York:Springer) , p. 149.The isothermal phase separation during chain
[5] Lovinger, A. J., Amundson, K . R., and Davis, D . D .,crosslinking polymerization of PN393/TL205 is driven1994, Chem. Mater., 6, 1726.by liquid ± gel demixing rather than by liquid ± liquid
[6] Nazarenko, V. G ., Sarala, S., and Madhusudana,demixing if the polymerization is carried out at 25 ß C
N . V., 1994, Jpn. J. appl. Phys., 33, 2641.and if the LC content does not exceed 80 wt %. The [7] Lackner, A. M ., Margerum, J. D ., Ramos, E., andabrupt change from spherical to non-spherical droplet Lim, K .-C., 1989, Proc. SPIE, 1080, 53.
[8] Margerum, J. D ., Lackner, A. M ., Erdmann, J. H .,shapes upon lowering the LC content or increasing theand Sherman, E., 1991, Proc. SPIE, 1455, 27.temperature of reaction re¯ ects the inhomogeneity of
[9] Serbutoviez, C., Kloosterboer, J. G ., Boots, H . M . J.,the densely crosslinked gel. At the morphological trans- and Touwslager, F. J., Macromolecules , ( in press).ition from spherical to non-spherical, the contrast ratio [10 ] Boots, H . M . J., Kloosterboer, J. G ., Serbutoviez, C.,passes through a maximum. The increase is speculatively and Touwslager, F. J., Macromolecules , ( in press).
[11 ] Kloosterboer, H ., Serbutoviez, C., Boots, H ., andascribed to favourab le secondary phase separation, andTouwslager, F., 1996, Polym. Mater. Sci. Eng., 74, 190.the decrease to an observed reduction in droplet size.
[12 ] Kloosterboer, J. G ., Serbutoviez, C., Boots, H . M . J.,The in¯ uence of variation of LC content and temper-and Touwslager, F. J., Polym. Commun., ( in press).
ature of reaction on the shape of the droplets has been [13 ] Smith, G . W ., 1993, Int. J. mod. Phys. B., 7, 4187.explained qualitat ively by means of a conversion-phase [14 ] (a) H irai, Y., N iiyama, S., Kumai, H ., and Gunjima, T.,
1990, Proc. SPIE, 1257, 2; (b) idem, Reps. Res. L ab. Asahidiagram calculated on the basis of the Flory± Huggins ±Glass Co. 1990, 40, 285.DusÆek theory.
[15 ] Flory, P. J., Principles of Polymer Chemistry, 1953,( Ithaca NY: Cornell University Press), p. 348.C. S. thanks the EU for ® nancial support of this work
[16 ] Srinivasarao, M ., and Amundson, K ., 1996, Polym.under contract ERB4001GT930175 . Prep., 37 ( 1 ), 200.
[17 ] K im, J. Y., Cho, C. H ., Palffy-Muhoray, P.,References Mustafa, M ., and Kyu, T., 1993, Phys. Rev. L ett.
71, 2232.[1] Drzaic, P. S., 1995, L iquid Crystal Dispersions,[18 ] Shen, C., and Kyu, T., 1995, J. chem. Phys., 102, 556.(Singapore: World Scienti® c).[19 ] Yamagishi, F. G ., M iller, L. J., and Van Ast, C. I.,[ 2 ] Doane, J. W ., 1990, L iquid Crystals: Applications and
1989, Proc. SPIE, 1080, 24.Uses, edited by B. Bahadur, (Singapore: WorldScienti® c), p. 361. [20 ] Vaz, N . A., 1989, Proc. SPIE, 1080, 2.
Dow
nloa
ded
by [
Uni
vers
ity o
f St
rath
clyd
e] a
t 18:
38 0
6 O
ctob
er 2
014