polymer nanocomposites with fibrillar inclusions generated ... · 1 polymer nanocomposites with...
TRANSCRIPT

1
Polymer nanocomposites with fibrillar inclusions generated during compounding
Kinga Jurczuk PhD Thesis
Advisor: Prof. dr hab. Andrzej Gałęski
Centre of Molecular and Macromolecular Studies Polish Academy of Sciences Polymer Physics Department
Łódź, 2012

2

3
I am heartily thankful to my advisor, Prof. dr hab. Andrzej Gałęski, whose encouragement, guidance and support from the initial to the final level
enabled me to develop an understanding of the subject.
I am also grateful to Prof. dr hab. Ewa Piórkowska-Gałęska, for all helpful discussions we have sheared.
Lastly, I offer my regards to all of those, especially my husband, my parents and my brother, who supported me
in any respect during the completion of this thesis.

4

5
Contents
General introduction 7
Chapter 1 State of knowledge 11
1.1 Mixing of polymers 11
1.1.1 Capillary instabilities and breakup 13
1.1.2 Dispersive mixing 15
1.1.3 References 18
1.2 Polytetrafluoroethylene, PTFE 20
1.2.1 Synthesis of polytetrafluoroethylene 20
1.2.2 Morphology of nascent PTFE particles 21
1.2.3 Crystalline structure of PTFE 23
1.2.4 Properties of polytetrafluoroethylene 25
1.2.5 PTFE processing and its applications 26
1.2.6 References 27
1.3 Mechanisms of plastic deformation in semicrystalline polymers 31
1.3.1 Deformation of amorphous phase 33
1.3.2 Deformation of polymer crystals 34
1.3.3 References 38
1.4 Scope of the thesis 45
Chapter 2 Experimental Section 47
2.1 Materials 47
2.2 Apparatus and experimental techniques 51
2.2.1 Scanning Electron Microscopy (SEM) 51
2.2.2 Mechanical properties 52
2.2.3 Instruments for rheological tests 53
2.2.4 Wide-angle X-ray Scattering (WAXS) 55
2.2.5 Differential Scanning Calorimetry (DSC) 55
2.2.6 Polarized Light Microscopy (PLM) 56
6
2.2.7 Dynamic Mechanical Thermal Analysis (DMTA) 57
Chapter 3 Results and Discussion 58
3.1 Nascent polytetrafluoroethylene powders 58
3.2 Deformation of polytetrafluoroethylene crystals 63
3.3 Structure of the nanocomposites with PTFE inclusions 66
3.3.1 Type of polytetrafluoroethylene powder 66
3.3.2 Thermoplastic matrix and its viscosity 68
3.3.3 Shear rate and compounding time 71
3.4 Thermal properties of the nanocomposites with PTFE inclusions 75
3.5 Mechanical properties of the nanocomposites with PTFE inclusions 80
3.6 Rheological properties of the nanocomposites with PTFE inclusions 86
3.6.1 Oscillatory shear flow 86
3.6.2 Uniaxial extensional flow 88
3.7 Conclusions 95
3.8 References 97
3.9 Nomenclature 103
3.10 List of publications and patents 105
3.11 Summary 106
7
General introduction
The properties of thermoplastic polymers can be modified by means of filling. A
type and a content of filler used, and also shapes of filler grains and mutual interactions
between a filler and a polymer matrix affect the properties of filled polymers. Fillers can be
classified as powders, composed of spherical or flaky grains, or short cut fibers, and as
continuous unidirectional fillers, called also fibers. A content of powders or continuous
fillers in composites ranges typically from 5 to 60 wt. %. Commonly used fillers comprise
various chemical compounds (e.g. talc, chalk, volcanic minerals, metal powders and
others) [Rothon 1999], carbon fibers, glass fibers or polymeric fibers (e.g. polypropylene
PP, polyethylene PE, polyamide PA, poly(ethylene terephthalate) PET, and poly(buthylene
terephthalete) PBT, and also natural fillers (e.g. cellulose, wood flour etc.) [Klason 1984].
Polymer nanocomposites represent a new and attractive alternative to
conventionally filled polymers. A characteristic feature of polymeric nanocomposites is
that filler particles are of nanometer sizes (typically 1÷100 nm thick in at least one
dimension). Nowadays, most often used are inorganic nanofillers including silicates, clays,
carbon nanotubes and carbon nanofibers. Owing to a large surface area of interactions
between filler nanoparticles and a polymer a desirable modification of properties including
increased modulus and strength, toughness, outstanding barrier properties, improved
solvent and heat resistance, reduced weight and improved dimensional stability, induced
electrical conductivity, thermal conductivity, scratch resistance and other properties, can be
achieved at low filler loadings (1÷5 wt. %) [Friedrich 2005].
The virtue of polymer nanocomposites is neither solely based on the mechanical
enhancement of the neat resin nor based on the direct replacement of current filler or blend
technology. Rather, its importance comes from providing value-added properties not
present in the neat resin, without sacrificing thee resin’s inherent processability and
mechanical properties or by adding excessive weight. Polymer nanocomposites contain
substantially less filler and thus enabling greater retention of the inherent processability
and toughness of the neat resin than conventional polymer composites [Usuki 1993a;
Usuki 1993b; Pinnavaia 2001; Ray 2003; Lee 2005; Sanchez 2005; Mai 2006;
Moniruzzaman 2006; Manias 2007; Morgan 2007; Leszczynska 2007; Utracki 2007;
Darder 2007; Okada 2007; Vaia 2007; Schaefer 2007].
Polymer-polymer composites are rear and known only when ready-made nanofibers or
nanodroplets are dispersed in the matrix. Polymer nanofibers are now produced by
8
electrospinning only. “All-polymer” nanofiber composites are only known from 3 papers
[Iwatake 2008; Jenoobi 2010; Kowalczyk 2011], all of them describing composites
containing cellulose nanofibers.
In mixing of immiscible polymers, drops of dispersed phase are extended but they
do not preserve the shape after deformation. The occurrence of capillary instabilities
phenomenon leading to the disintegration of liquid extended threads causes that polymer
inclusions finally appear in a form of droplets instead of fibers. The idea is to find a way to
preserve the shape of polymer inclusions after deformation, i.e. act against capillary
instabilities. A range of means can be proposed but there are limits of achievable
deformation: (a) fast crosslinking while deformed inclusions, (b) fast solidification of a
matrix, (c) fast solidification of inclusions, (d) use of crystalline but easy to deform
inclusions, (e) very viscous matrix and inclusions subjected to shear, (f) drastic change of
surface tension and (g) use of liquid crystal (LC) polymers as a dispersed phase. (a-c) and
(f-g) are unrealistic, (e) could be considered but difficult to perform on existing
equipments, while (d) seems to be a promising case to generate polymer nanofibers
through shearing the medium in which crystalline inclusions are dispersed (a polymer
matrix). The higher the capillary number the more efficient is the stress transfer from
sheared polymer matrix to the crystal inclusions. If the shear stress overrules the interfacial
stress the inclusion can be deformed. In order to deform polymer crystals embedded in a
viscous media a critical shear stress, resolved in a slip plane of the respective slip systems
to be activated, must be reached and exceeded. There is only one paper published
describing a possibility of deformation of a sheet crystal embedded in viscous matrix under
shearing flow [Harrowell 1990]. Shearing of the matrix was found to lead to a mechanical
instability of a crystal which results in a continuous decrease in the coherence length of
crystalline order in the sliding layers as the shear rate increases. The shear modulus and
shear yield stress of the sheet crystal was at the level of 2 MPa which value is
characteristic for crystals of many polymer at temperatures few tens of degrees below their
melting. The above estimation makes the idea to transform polymer crystals into
nanofibers by shear deformation quite realistic.
The state of knowledge of the mixing of immiscible polymers,
polytetrafluoroethylene used in the thesis as an easy deformable crystalline inclusions, and
the deformation of semicrystalline polymers, especially mechanisms o polymer crystals
deformation, will be described for proper understanding the subject of further studies
presented in this thesis.

9
References
Darder M., Aranda P., Ruiz-Hitzky E., 2007. Bionanocomposites: A New Concept
of Ecological, Bioinspired, and Functional Hybrid Materials. Adv. Mater. 19, 1309-1319;
Friedrich K., Fakirov S., Zhang Z., 2005. Polymer Composites. From Nano- to Macro-
Scale. Springer, New York;
Harrowell P., 1990. Mechanical instability of colloidal crystals under shear flow.
Phys. Rev. A 42, 3427–3431;
Iwatake A., Nogi M., Yano H., 2008. Cellulose nanofiber-reinforced polylactic acid.
Comp. Sci. Tech. 68, 2103-2106;
Jenoobi M., Harun J., Mathew A.P., Oksman K., 2010. Mechanical properties of cellulose
nanofiber (CNF) reinforced polylactic acid (PLA) prepared by twin screw extrusion.
Comp. Sci. Tech. 70, 1742-1747;
Klason C., Kubat J., Strömvall H.E., 1984. The efficiency of cellulosic fillers in common
thermoplastics. Part 1. Filling without processing aids or coupling agents.
Int. J. Polym. Mater. 10, 159-187;
Kowalczyk M., Piorkowska E., Kulpinski P., Pracella M., 2011. Mechanical and thermal
properties of PLA composites with cellulose nanofibers and standard size fibers.
Composites Part A 42, 1509-1514;
Lee L.J., Zeng C., Cao X., Han X., Shen J., Xu G., 2005. Polymer nanocomposite foams.
Comp. Sci. Tech. 65, 2344-2364;
Leszczynska A., Njuguna J., Pielichowski K., Banerjee J.R., 2007.
Polymer/montmorillonite nanocomposites with improved thermal properties Part I.
Factors influencing thermal stability and mechanisms of thermal stability improvement.
Thermochimca Acta 435, 75-96;
Mai Y.-W., Yu Z.-Z., 2006. Polymer Nanocomposites. Woodhead Publ.,
ISBN 978-1-85573-969-7;
Manias E., 2007. Nanocomposites: Stiffer by design. Nature Materials 6, 9–11;
Moniruzzaman M., Winey K.I., 2006. Polymer Nanocomposites Containing Carbon
Nanotubes. Macromolecules 39, 5194-5205;
Morgan A.B., Wilkie C.A., 2007. Flame Retardant Polymer Nanocomposites. Wiley,
ISBN 978-0-471-73426-0;
Okada A., Usuki A., 2007. Twenty Years of Polymer-Clay Nanocomposites.
Macromol. Mater. Eng. 291, 1449-1476;

10
Pinnavaia T.J., Beall G.W., 2001. Polymer-Clay Nanocomposites. Wiley,
ISBN 978-0-471-63700-4;
Ray S.S., Okamoto M., 2003. Polymer/layered silicate nanocomposites: a review
from preparation to processing. Prog. Polym. Sci. 28, 1539-1641;
Rothon R.N., 1999. Mineral Fillers In Thermoplastics: Filler Manufacture
and Characterisation. Adv. Polym. Sci. 139, 67-107;
Sanchez C., Julian B., Belleville P., Popall M., 2005. Applications of hybrid organic-
inorganic nanocomposites. J. Mater. Chem. 15, 3559-3592;
Schaefer D.W., Justice R.S., 2007. How Nano are Nanocomposites?.
Macromolecules 40, 8501-8517;
Usuki A., Kawasumi M., Kojima Y., Okada A., Kurauchi T., Kamigaito O., 1993a.
Swelling behavior of montmorillonite cation exchanged for ω-amino acids
by ε-caprolactam. J. Mater. Research 8, 1174-1178;
Usuki A., Kojima Y., Kawasumi M., Okada A., Fukushima Y., Kurauchi T., 1993b.
Synthesis of nylon 6-clay hybrid. J. Mater. Research 8, 1179-1184;
Utracki L.A., Sepehr M., Boccaleri E., 2007. Synthetic, layered nanoparticles for
polymeric nanocomposites (PNCs). Polym. Adv. Technol. 18, 1-37;
Vaia R.A., Maguire J.F., 2007. Polymer Nanocomposites with Prescribed Morphology:
Going beyond Nanoparticle-Filled Polymers. Chem. Mater. 19, 2736-2751;

11
Chapter 1
State of knowledge
1.1 Mixing of polymers
Mixing is a key step in almost every polymer processing operation, affecting
material properties, processability and cost. The development of new materials seems to
rely nowadays more on modification, blending and compounding rather than on the
synthesis of chemically new polymers. Polymers are blended with other polymers to
combine their properties and sometimes to even synergistically increase their physical
characteristics. Also various additives and reinforcing agents are mixed with polymers to
improve mechanical performance and impart specific properties to the mixture.
The words: mixing, blending and compounding are synonyms and according to the
English dictionaries are defined as “an action to combine ingredients into one mass, so that
the constituent parts are indistinguishable”. However, in the plastic processing, these three
terms have different meanings. While mixing indicates the physical act of homogenization,
e.g., mixing of fractions, blending commonly specifies preparation of polymer blends or
alloys, while compounding means incorporation of additives into polymeric matrix, i.e.
antioxidants, lubricants, pigments, fillers, or reinforcements.
There are two basic mechanisms of mixing polymers. First involves the reduction
in size of a cohesive minor component such as liquid drops or agglomerates of solid
particles, and is called dispersive or intensive mixing. The second, referred to as
distributive, laminar or extensive mixing, is the process of spreading the minor component
throughout the matrix in order to obtain a good spatial distribution. In any mixing device,
these two mechanisms may occur simultaneously. In distributive mixing the second
component is usually a powder whose particles cannot be further broken down.
The spherical liquid drops are usually the starting morphology of dispersed phase.
Their deformation in flow field is promoted by the shear stress, τ, and counteracted by the
interfacial stress, σ/R. The ratio between these two stresses is called the capillary number,
Ca:
c RRCa
η γτσ σ
= =&
(1.1)

12
where R is the local radius of a drop, σ is the interfacial tension, ηc is the viscosity of
matrix (or continuous phase), and γ& is the shear rate.
Taylor [Taylor 1932; Taylor 1934; Taylor 1954] and others [Cerf 1951; Travelyan
1951; Bartok 1957; Bartok 1959; Rumscheidt 1961a; Rumscheidt 1961b] extensively
studied the process of liquid drop deformation in two basic flow fields: simple shear flow
(or rotational flow) and extensional flow (or irrotational flow). Later, Grace [Grace 1982]
determined the critical conditions for the affine deformation of drop and breakup
phenomena (Figure 1.1).
Figure 1.1. Critical capillary number, Cacrit as a function of viscosity ratio, p [Grace 1982].
The critical value of capillary number, Cacrit, strongly depends on the viscosity
ratio, p, defined as the ratio between viscosity of dispersed phase and viscosity of matrix.
Figure 1.1 shows that when the capillary number is lower than its critical value, Ca < Cacrit
interfacial stress competes with shear stress and the liquid drop is deformed only slightly in
the flow field, yielding a stable drop shape. However, when Ca >> Cacrit the shear stress
dominates and the liquid spherical drop is extended into a thread, which can disintegrate
into smaller droplets by capillary instability and breakup mechanisms. Karam et al. [Karam
1968] found that there are upper and lower limits of the viscosity ratio beyond which no
drop breakup can occurs. In simple shear flow, deformed drops will be stable when the
viscosity ratio will be 0.005 ≤ p ≥ 4.
13
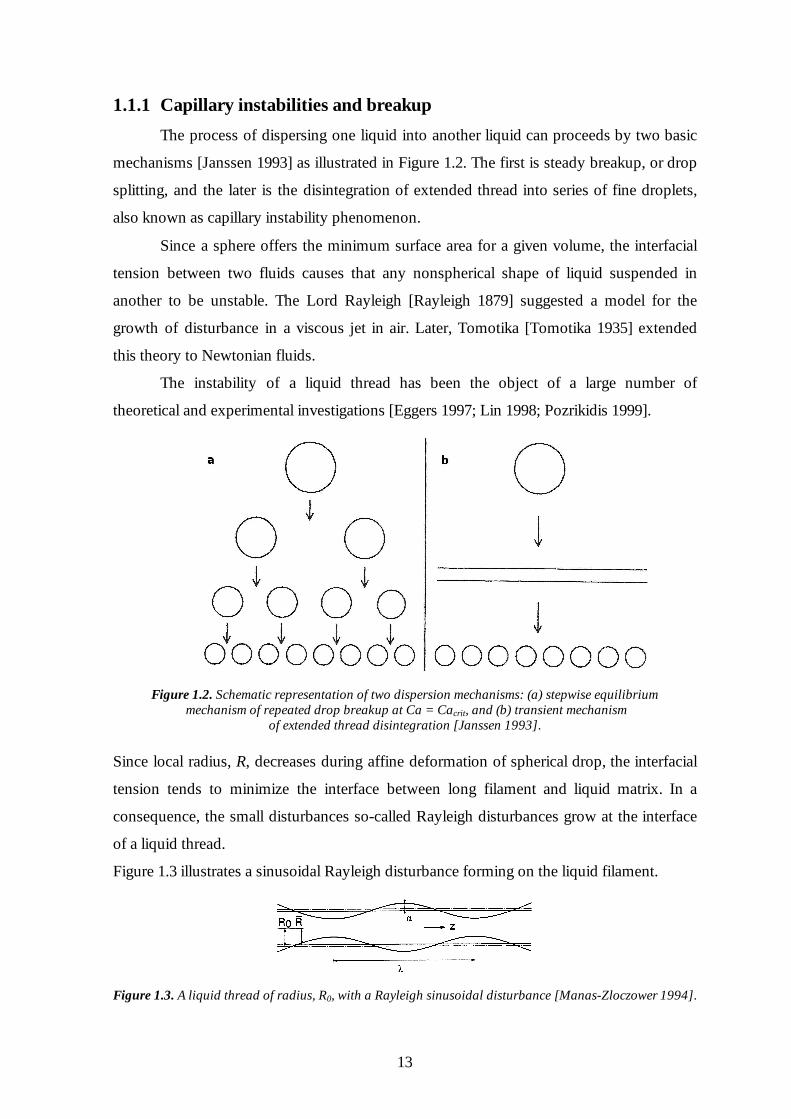
1.1.1 Capillary instabilities and breakup
The process of dispersing one liquid into another liquid can proceeds by two basic
mechanisms [Janssen 1993] as illustrated in Figure 1.2. The first is steady breakup, or drop
splitting, and the later is the disintegration of extended thread into series of fine droplets,
also known as capillary instability phenomenon.
Since a sphere offers the minimum surface area for a given volume, the interfacial
tension between two fluids causes that any nonspherical shape of liquid suspended in
another to be unstable. The Lord Rayleigh [Rayleigh 1879] suggested a model for the
growth of disturbance in a viscous jet in air. Later, Tomotika [Tomotika 1935] extended
this theory to Newtonian fluids.
The instability of a liquid thread has been the object of a large number of
theoretical and experimental investigations [Eggers 1997; Lin 1998; Pozrikidis 1999].
Figure 1.2. Schematic representation of two dispersion mechanisms: (a) stepwise equilibrium
mechanism of repeated drop breakup at Ca = Cacrit, and (b) transient mechanism of extended thread disintegration [Janssen 1993].
Since local radius, R, decreases during affine deformation of spherical drop, the interfacial
tension tends to minimize the interface between long filament and liquid matrix. In a
consequence, the small disturbances so-called Rayleigh disturbances grow at the interface
of a liquid thread.
Figure 1.3 illustrates a sinusoidal Rayleigh disturbance forming on the liquid filament.
Figure 1.3. A liquid thread of radius, R0, with a Rayleigh sinusoidal disturbance [Manas-Zloczower 1994].
14
The radius of this small disturbance, R(z), is expressed by:
0.5220
2 2( ) sin sin
2z z
R z R Rπ α πα αλ λ
= + = − +
(1.2)
where R0 is the radius of undisturbed thread, R is the average radius of disturbed thread
( R R< 0 ), α is the disturbance amplitude, and λ is the disturbance wavelength. The
disturbance amplitude, α, grows exponentially with time:
0teβα α= (1.3)
where α0 is the original disturbance amplitude, and β is the growth rate given by
( )0
,
2 c
p
R
σ λβ
ηΩ
= (1.4)
The dimensionless growth rate of the disturbance, Ω, is a function of the
wavelength, λ and the viscosity ratio, p. Initially, the small amplitudes of all wavelengths
exist, but for a given value of p, only one disturbance with the particular wavelength, λm,
becomes dominant and grows the fastest, and finally results in disintegration of the liquid
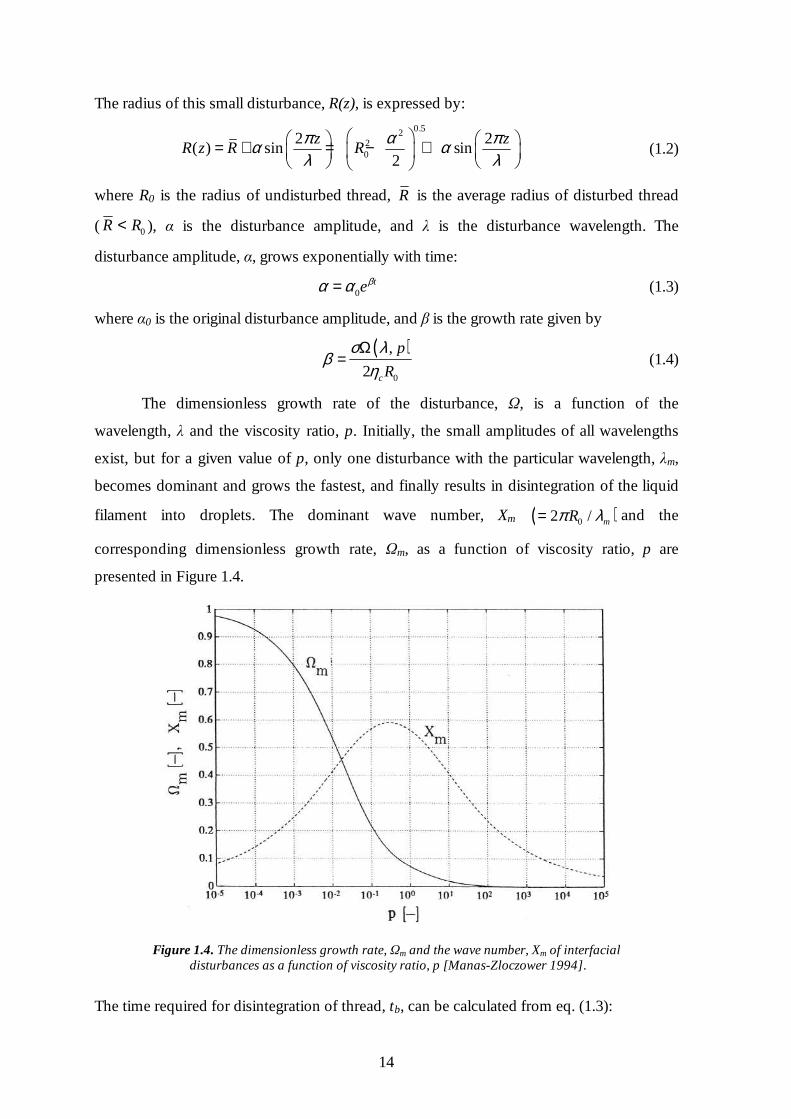
filament into droplets. The dominant wave number, Xm ( )02 / mRπ λ= and the
corresponding dimensionless growth rate, Ωm, as a function of viscosity ratio, p are
presented in Figure 1.4.
Figure 1.4. The dimensionless growth rate, Ωm and the wave number, Xm of interfacial
disturbances as a function of viscosity ratio, p [Manas-Zloczower 1994].
The time required for disintegration of thread, tb, can be calculated from eq. (1.3):

15
0
1lnbt
αβ α
=
(1.5)
Tomotika [Tomotika 1935] estimated that the process of thread disintegration occurs when
the amplitude of disturbance approaches 00.82R . Hence, the equation for breakup time
takes form:
0
0
0.821lnb
Rt
β α= (1.6)
Depending on the viscosity ratio, p there are two different modes of drop breakup
[Bartok 1959; Rumscheidt 1961b; Grace 1982; Smith 1985]. In the simple shear flow, for
1p > the extended drop having rounded ends disintegrate in the middle in two or three
almost equally sized droplets with a few tiny satellite drops between them (Figure 1.5a).
The smaller viscosity ratio, p, between extended thread and matrix, the more satellite
droplets are formed [Tjahjadi 1992].
Figure 1.5. Breakup modes of deformed drop in the simple shear flow:
(a) fracture and (b) tipstreaming [Bruijn 1993].
At low viscosity ratios 0.1p < small droplets are released from the sharply pointed
ends (Figure 1.5b). This so-called tipstreaming process is potentially very important since
the shear rates required for this type of breakup have in some circumstances been observed
to be two orders of magnitude lower than the fracture mode. The tipstreaming may also be
useful for separation processes [Srinivasan 1986].
1.1.2 Dispersive mixing
During the initial stages of mixing, the local radius of drop, R, is large
( Ca Cacrit>> ), the shear stress, τ, dominates over the interfacial stress, σ/R, and dispersed
drops are affinely deformed in a flow field of the matrix [Janssen 1992]. The affine
deformation of a spherical drop with diameter a (=2R) into an ellipsoidal shape under
simple shear flow is illustrated in Figure 1.6.

16
Figure 1.6. The affine deformation of a sphere in the simple shear flow [Grace 1982; Manas-Zloczower 1994].
Deformation of a liquid drop, D, is defined as:
L BD
L B
−=+
(1.7)
where L and B are length and width of ellipsoid, respectively. It appeared that the drop
cannot be deform infinitely. The steady drop deformation for Newtonian fluids [Taylor
1932; Taylor 1934] is finite and is expressed by:
19 1616 16
pD Ca
p
+=+
(1.8)
Cerf [Cerf 1951] investigated theoretically the rotation phenomenon of affinely
deformed drop in simple shear flow and derived the following formula for an orientation
angle, φ which is applicable only for small deformations:
21
4 5
pD
πφ = + +
(1.9)
At high viscosity ratios, so high that the forces of surface tension counteracting
deformation are negligible compared with those due to viscosity, the final deformation
becomes a function of p only:
15
4D p− =
(1.10)
and the maximum of orientation angle, φ , along the flow direction, reaches 2π .
Torza et al. [Torza 1972] expanded the studies on the liquid drop deformation for
Non-Newtonian fluids, e.g. molten polymers and determined the formula for D:
( ) ( )0.52 2
5(19 16)
4(1 ) 19 20 /
pD
p p Ca
+= + +
(1.11)
and the corresponding value of the orientation angle, φ :
17
11 19tan
4 2 20
pCaπφ − = +
(1.12)
When the deformation D ≥ 05. the liquid drop becomes unstable and breaks up into series
of droplets, both for simple shear flow and extensional flow.
Quantitative studies on drop deformation in simple shear and pure extensional
flows [Taylor 1934; Rumscheidt 1961b; Grace 1982; Elmendorp 1986; Bentley 1986a;
Bentley 1986b; Elemens 1993] have shown that an extension is more effective than a
simple shear, especially in the case of high viscosity ratios and low interfacial tensions.
However, it is impossible to achieve pure extensional flow in the confined flow geometries
encountered in mixing machines and during limited periods of time. So, in practice, shear
flow is more important.
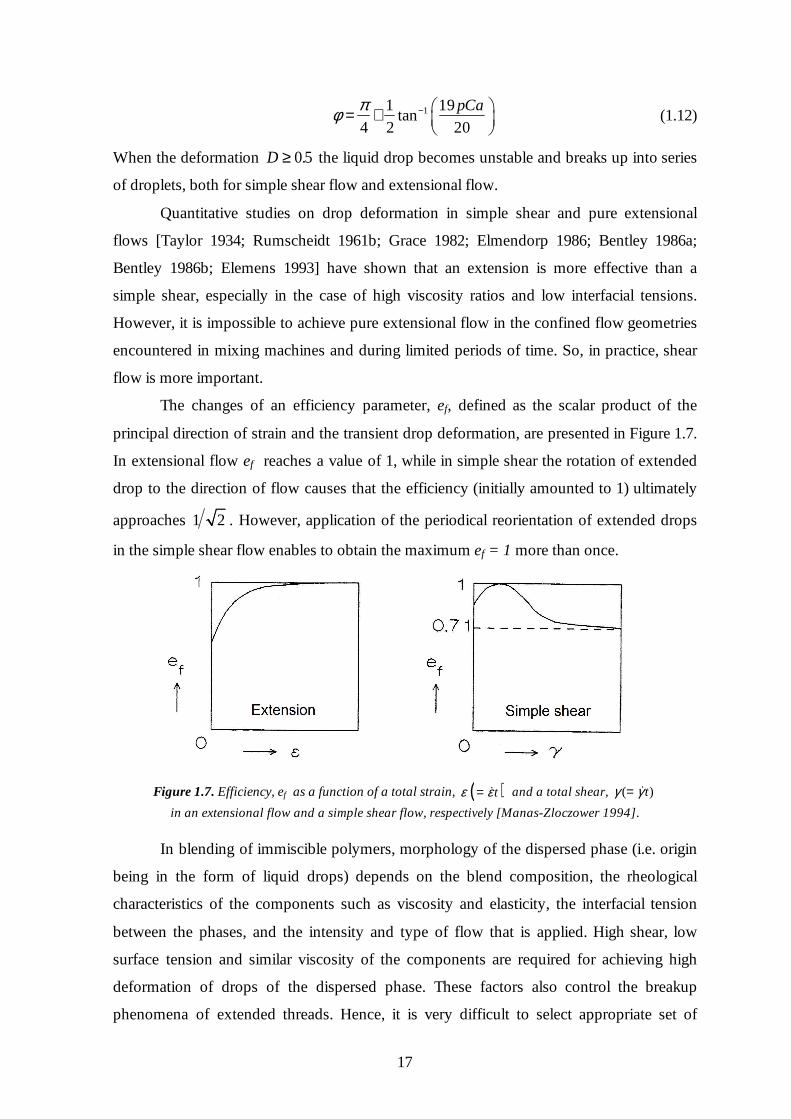
The changes of an efficiency parameter, ef, defined as the scalar product of the
principal direction of strain and the transient drop deformation, are presented in Figure 1.7.
In extensional flow ef reaches a value of 1, while in simple shear the rotation of extended
drop to the direction of flow causes that the efficiency (initially amounted to 1) ultimately
approaches 1 2 . However, application of the periodical reorientation of extended drops
in the simple shear flow enables to obtain the maximum ef = 1 more than once.
Figure 1.7. Efficiency, ef as a function of a total strain, ( )tε ε= & and a total shear, ( )tγ γ= &
in an extensional flow and a simple shear flow, respectively [Manas-Zloczower 1994].
In blending of immiscible polymers, morphology of the dispersed phase (i.e. origin
being in the form of liquid drops) depends on the blend composition, the rheological
characteristics of the components such as viscosity and elasticity, the interfacial tension
between the phases, and the intensity and type of flow that is applied. High shear, low
surface tension and similar viscosity of the components are required for achieving high
deformation of drops of the dispersed phase. These factors also control the breakup
phenomena of extended threads. Hence, it is very difficult to select appropriate set of
18
parameters to act against capillary instabilities and preserve the shape of extended
inclusions.
1.1.3 References
Bartok W., Mason S.J., 1957. Particle motions in sheared suspensions. V. Rigid rods
and collision doublets of spheres. J. Coll. Sci. 12, 243-262;
Bartok W., Mason S.J., 1959. Particle motions in sheared suspensions. VIII singlets
and doublets of liquid spheres. J. Coll. Sci. 14, 13-26;
Bentley B.J., Leal L.G., 1986a. A computer-controlled four-roll mill for investigations
of particle and drop dynamics in two-dimensional linear shear flows.
J. Fluid Mech. 167, 219-240;
Bentley B.J., Leal L.G., 1986b. An experimental investigation of drop deformation
and breakup in steady, two-dimensional linear flows. J. Fluid Mech. 167, 241-283;
Bruijn de R.A., 1993. Tipstreaming of drops in simple shear flows.
Chem. Eng. Sci. 48, 277-284;
Cerf R., 1951. Recherchers theoriques et experimetales sur leffet maxwell des solutions
de macromolecules deformables 1. Theorie de leffet maxwell des suspensions de spheres
elastiques. J. Clin. Phys. 48, 59-84;
Eggers J., 1997. Nonlinear dynamics and breakup of free-surface flows.
Rev. Modern Phys. 69, 865-930;
Elemens P.H.M., Bos H.L., Janssen J.M.H., Meijer H.E.H., 1993. Transient phenomena
in dispersive mixing. Chem. Eng. Sci. 48, 267-276;
Elmendorp J.J., 1986. A study of polymer blending microrheology.
Polym. Eng. Sci. 26, 418-426;
Grace H.P., 1982. Dispersion phenomena in high viscosity immiscible fluid systems
and application of static mixers as dispersion devices in such systems.
Chem. Eng. Commun. 14, 225-277;
Janssen J.M.H., Peters G.W.M., Meijer H.E.H., Baaijens F.P.T., 1992. Mixing
of immiscible liquids. Theor. Appl. Rheol. 369-371;
Janssen J.M.H., Meijer H.E.H., 1993. Droplet breakup mechanisms: Stepwise equilibrium
versus transient dispersion. J. Rheol. 37, 597-608;
Karam H.J., Bellinger J.C., 1968. Deformation and breakup of liquid droplets in a simple
shear field. Ind. Eng. Chem. Fundam. 7, 576-581;

19
Lin S.P., Reitz R.D., 1998. Drop and spray formation from a liquid jet.
Ann. Rev. Fluid Mech. 30, 85-105;
Manas-Zloczower I., Tadmor Z. 1994. Mixing and Compounding of Polymers: Theory
and Practice. Hanser, New York;
Pozrikidis C., 1999. Capillary instability and breakup of liquid threads.
J. Eng. Math. 36, 255-275;
Rayleigh L., 1879. On the capillary phenomenon of jets.
Proc. Roy. Soc. London. 29, 71-97;
Rumscheidt F.D., Mason S.G., 1961a. Particle motions in sheared suspensions. XI.
Internal circulation of fluid droplets (experimental). J. Coll. Sci. 16, 210-237;
Rumscheidt F.D., Mason S.G., 1961b. Particle motions in sheared suspensions XII
Deformation and burst of liquid drops in shear and hyperbolic flow.
J. Coll. Sci. 16, 238-261;
Smith P.G., Ven T.G.M. van de, 1985. Shear induced deformation and rupture
of suspended solid/liquid clusters. Coll. and Surf. 15, 191-210;
Srinivasan M.P., Stroeve P., 1986. Subdrop ejection from double emulsion drops in shear
flow. J. Memb. Sci. 26, 231-236;
Taylor G.I., 1932. The viscosity of a fluid containing small drops of another fluid.
Proc. Roy. Soc. London Ser. A 138, 41-48;
Taylor G.I., 1934. The formation of emulsions in definable fields of flow.
Proc. Roy. Soc. London Ser. A 146, 501-523;
Taylor G.I., 1954. The two coefficients of viscosity for an incompressible fluid containing
air bubbles. Proc. Roy. Soc. London Ser. A 226, 34-39;
Tjahjadi M., Stone H.A., Ottino J.M., 1992. Satellite and sub-satellite formation
in capillary breakup. J. Fluid Mech. 243, 297-317;
Tomotika S., 1935. On the instability of a cylindrical thread of a viscous liquid
surrounded by another viscous fluid. Proc. Roy. Soc. London Ser. A 150, 322-337;
Torza S., Cox R.G., Mason S.G., 1972. Particle Motions in Sheared Suspensions. XXVII
Transient and Steady Deformation and Burst of Liquid Drops.
J. Coll. Int. Sci. 38, 395-411;
Travelyan B.J., Mason S.G., 1951. Particle motions in sheared suspensions. I. Rotations.
J. Coll. Sci. 6, 354-367;
20
1.2 Polytetrafluoroethylene, PTFE
Polytetrafluoroethylene is the best known fluoropolymer representing the extreme
of known polymers and since its discovery in the half of 20th century [Plunkett 1941] is
used as a common engineering material for many demanding applications. PTFE possesses
a high thermal stability and chemical inertness, high dielectric strength and extremely low
dielectric loss factor. It has also a unique non-adhesion and antifrictional properties. Many
of other outstanding properties [Renfrew 1946; Sperati 1961; Smith 1985; Narkis 1995],
such as high melting temperature, extremely high molecular weight and melt viscosity,
insolubility in all common solvents cause restraints for the processing of
polytetrafluoroethylene. Industrial processing of PTFE, including paste extrusion of
lubricated fine powders [Lontz 1952b], compression moulding, ram extrusion of granular
powders [Ebnesajjad 2005] and coating from aqueous dispersions [Lontz 1952a], is
hindered due to high melt viscosity of PTFE and also requires long times and expense,
which limit the use of polytetrafluoroethylene for many applications. Cold compaction of
polytetrafluoroethylene followed by sintering of the preforms at elevated temperatures is
presently a common practice [Bigg 1977; Crawford 1982; Radhakrishnan 1986; Jog 1993;
Jog 1994; Hambir 1994; Narkis 1995].
1.2.1 Synthesis of polytetrafluoroethylene
The first report on polytetrafluoroethylene was by Plunkett in 1941 [Plunkett 1941].
He obtained white, opaque powder as a residue from the storage of tetrafluoroethylene
monomer under superatmospheric pressure (two or three times atmospheric pressure).
After this essential discovery various methods of polymerization were tried and now
preferred synthesizes of PTFE involve aqueous media and superatmospheric pressures.
Stable aqueous suspensions of colloidal polytetrafluoroethylene particles can be
obtained via emulsion polymerization with minimal quantities of fluorinated surfactants
and free-radical initiators such as sodium, potassium, ammonium persulfates, hydrogen
peroxide, oxygen or organic peroxy compounds [Brubaker 1946; Hanford 1946; Joyce
1946a; Joyce 1946b; Renfrew 1950].
PTFE dispersions prepared by methods described above contain colloidal,
negatively charged particles suspended in water [Lontz 1952a]. These dilute products can
be concentrated into dispersions containing from 35 to 75 wt.% of PTFE using methods
described by Berry [Berry 1949]. The concentration of dilute aqueous dispersions

21
comprises: (1) adding a surface-active agent into the dispersion, (2) flocculating the
polymer by insolubilizing the surfactant, (3) separating the flocculated polymer from the
bulk of aqueous phase, and (4) forming a concentrated dispersion by peptization of the
polymer floc. Although, the surface-active agent acting primarily as a stabilizing agent to
prevent coagulation can also influence the morphology of PTFE particles [Luhmann 1989].
The absence of any surfactant results in marginal stability of as-polymerized PTFE
dispersions and flocculation of the particles into aggregates during high shear mixing
and/or addition of the electrolyte. Rinsing, drying and screening of these aggregates lead to
the production of fine powder PTFE particles [Lontz 1952b].
1.2.2 Morphology of nascent PTFE particles
The morphology of nascent PTFE dispersions has been extensively studied by
different authors. Rahl et al. [Rahl 1972] examined emulsion-grade PTFE particles at
various stages of polymerization. In the early stages of polymerization the nonspherical,
ribbon-shaped objects are formed. Those ribbons are chain-extended single crystals with
the chain axis parallel to the long axis of ribbons. The authors suggested that folding of
thin ribbons (approximately 60 Å in thickness) occurs as a consequence of hydrodynamic
forces acting on extremely thin chain-extended crystals once they exceed a certain aspect
ratio and presumably competes with further reaction and crystallization on the surface of
the growing particles. At polymerization with low-yields the rod-like particles are formed
also as apparently single crystals with the chain axis parallel to the long axis of rod.
Seguchi et al. [Seguchi 1974] also suggested that the polymer morphology (shape
and molecular weight) strongly depends on the polymerization conditions, especially the
concentration of emulsifier as is shown on Figure 1.8. When polymerization is carried out
without emulsifier, only nearly spherical to elliptical particles are formed with average
diameter of 1000 Å and molecular weight above 106 Da. Increasing the concentration of
emulsifier, the type of polymer in the latex changes from rods with 300÷600 Å in diameter
and molecular weight from 2×10⁵ to 5×10⁵ Da to fibrils with diameter of 200 Å and
molecular weight below 2×10⁴ Da.
The influence of emulsifier concentration and polymerization time on the structure
of polytetrafluoroethylene was reexamined in the middle of the 1980s by Luhman and
Feiring [Luhmann 1989]. The authors observed three types of the particles with different
morphology: rod-like, roughly spherical and, in the case of very low molecular weight,

22
small hexagonal particles. Both hexagonally shaped and short rod-like particles are formed
in early stages of polymerization when the initial surfactant concentration is below its
critical micelle concentration. An increase in the surfactant chain length and concentration
tends to promote the formation of hexagonal particles. Also, at longer polymerization
times, roughly spherical particles form dominant population.
Figure 1.8. Electron micrographs of nascent radiation initiated PTFE dispersion particles.
The polymerization conditions were: (a) 0 % emulsifier, 90 min; (b) 0.5 % emulsifier, 60 min; (c) 1 % emulsifier, 60 min; (d) 2 % emulsifier, 90 min [Seguchi 1974].
Geil et al. [Geil 2005] examined the evolution of nascent PTFE particles
morphology in commercial PTFE nanoemulsions as a function of sintering time and
temperature. The initial stages of polymerization of standard-size polytetrafluoroethylene
resins involve the formation of chain-extended fibrils, rods or ribbons that fold back on
themselves to form elliptical or short rod-like particles as the emulsifying agent is used up
by the increasing surface area.
It is known that melting of semicrystalline polymers like polytetrafluoroethylene
with very high molecular high weight (Mw ≥ 106) leads to the systems with high
concentration of entanglements persisting in the amorphous phase and in consequence
drastically reduced deformability. Experimental observations and computer simulation
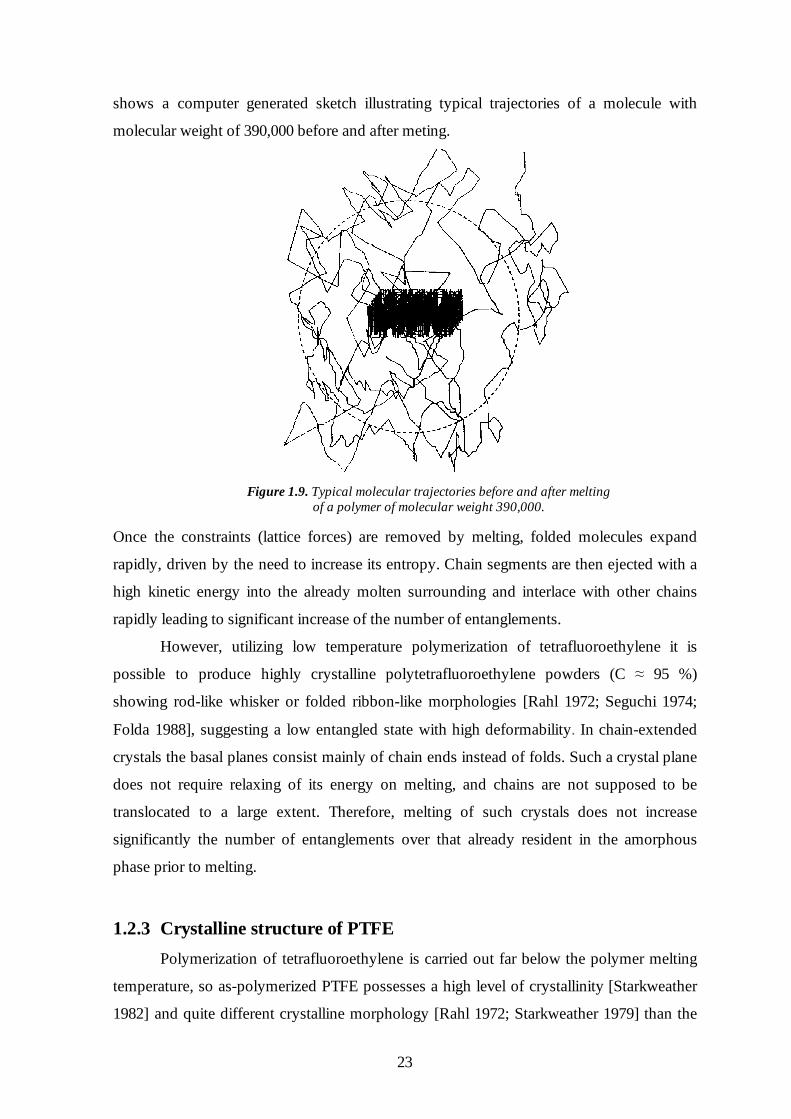
revealed that chain-folded crystals “explode” upon melting [Barham 1991]. Figure 1.9
23
shows a computer generated sketch illustrating typical trajectories of a molecule with
molecular weight of 390,000 before and after meting.
Figure 1.9. Typical molecular trajectories before and after melting
of a polymer of molecular weight 390,000.
Once the constraints (lattice forces) are removed by melting, folded molecules expand
rapidly, driven by the need to increase its entropy. Chain segments are then ejected with a
high kinetic energy into the already molten surrounding and interlace with other chains
rapidly leading to significant increase of the number of entanglements.
However, utilizing low temperature polymerization of tetrafluoroethylene it is
possible to produce highly crystalline polytetrafluoroethylene powders (C ≈ 95 %)
showing rod-like whisker or folded ribbon-like morphologies [Rahl 1972; Seguchi 1974;
Folda 1988], suggesting a low entangled state with high deformability. In chain-extended
crystals the basal planes consist mainly of chain ends instead of folds. Such a crystal plane
does not require relaxing of its energy on melting, and chains are not supposed to be
translocated to a large extent. Therefore, melting of such crystals does not increase
significantly the number of entanglements over that already resident in the amorphous
phase prior to melting.
1.2.3 Crystalline structure of PTFE
Polymerization of tetrafluoroethylene is carried out far below the polymer melting
temperature, so as-polymerized PTFE possesses a high level of crystallinity [Starkweather
1982] and quite different crystalline morphology [Rahl 1972; Starkweather 1979] than the

24
same polymer recrystallized from the melt. High crystallinity degree of nascent
polytetrafluoroethylene, which has been found to be between 93 to 98 %, can be obtained
only when the chain structure is substantially unbranched. Belief that PTFE is an entirely
linear polymer with fluorine atoms attached to the carbon chain, was confirmed by the
absence of branched-chain compounds in the products of its pyrolysis [Benning 1946].
The temperature-pressure phase behavior of polytetrafluoroethylene has been
extensively reported in the literature. Figure 1.10 presents four possible crystalline phases
of PTFE. Two first-order crystalline phase transitions at 19 ºC and 30 ºC were first
discussed in a report on thermal expansion [Rigby 1949] and confirmed in subsequent
studies using dilatometry, calorimetry [Marx 1955] and thermal conductivity [Piorkowska
1986].
Figure 1.10. Temperature-pressure phase behavior of crystalline polytetrafluoroethylene [Brown 2007].
Phase II [Weeks 1981] exists below 19 ºC. The unit cell is hexagonal with PTFE chains
arranged in a zig-zag twisted by 180º per 13 carbon atoms. Between 19 ºC and 30 ºC
transitions, phase IV [Bunn 1954] is observed with 15/7 helical PTFE chains. Above 30 ºC
and up to the melting point a pseudohexagonal very conformationally disordered phase I is
the stable one [Bunn 1954; Sperati 1961; Grebowicz 1986].
Studies on the crystalline transitions in polytetrafluoroethylene at high pressures
have been reported by Beecroft and Swenson [Beecroft 1959]. Compression measurements
made on PTFE samples at various temperatures and pressures up to 2 GPa showed that in
25
addition to the three crystalline phases which are separated by the 19 ºC and 30 ºC
transitions at atmospheric pressure, there is the fourth modification at high pressures. Phase
III is present above ~0.65 GPa at room temperature [Rae 2004; Rae 2005]. Brown et al.
[Brown 2007] reported that the crystalline phase transitions of PTFE can also be activated
by tension and compression even at much lower stress levels.
1.2.4 Properties of polytetrafluoroethylene
Polytetrafluoroethylene exhibits many unusual properties such as exceedingly high
molecular weight, high melting temperature and melt viscosity, high thermal stability and
chemical inertness. Commercial homopolymer fine powders are linear but have molecular
weight, Mn exceeding 107 Da. The melting point of melt-processed PTFE is about 327 ºC
[Suwa 1975] but that of the virgin polymer is considerably higher up to 345 ºC [Weeks
1980]. The melting behavior of PTFE depends on its molecular weight [Suwa 1975] and
rises with increasing molecular weight.
The melt viscosity of PTFE typically ranges from 1010 to 2×10¹¹ poise at 380 ºC
[Renfrew 1946]. So high melt viscosity is considered essentially as a consequence of PTFE
structure and high chain length [Hanford 1946]. Polytetrafluoroethylene unlike other
thermoplastics does not undergo the Newtonian flow at a measurable rate [Tuminello
1988], and is capable of only a very slow plastic flow. The polymer remains in a semisolid
gel state, even at temperatures higher than 370 ºC [Lontz 1952a].
Thermal stability of polytetrafluoroethylene is outstanding. Polymer can be held for
long period of time at the higher temperatures with relatively little changes of its tensile
strength. After one month at 230 ºC, the loss in tensile strength of molded bars is negligible
and at 300 ºC will drop only 10 to 20 % in comparison to that at room temperature
[Renfrew 1946].
PTFE reveals the almost universal chemical resistance. It has been attributed to the
strength of the carbon-fluorine bond and the way in which the fluorine atoms protect
carbon chains from attack by highly corrosive chemicals [Renfrew 1946]. However,
difficulties in dissolving PTFE arise also from its very high melting temperature which sets
a lower limit for the boiling point of solvent candidates. Only some perfluorokerosenes and
perfluorinated oils are reported to dissolve 1÷2 wt.% of polytetrafluoroethylene at 290 to
310 ºC [Compton 1950]. It has been shown that PTFE can also dissolve at ambient
pressure in its oligomers having a chain length of 21 carbon atoms, or more [Smith 1985].

26
The dielectric loss factor of PTFE (< 10-4), invariant over the frequency range 60 -
106 cycles and the temperature range 25 to 310 ºC [Hanford 1946; Gonon 2002], is one of
the lowest known for solid substances. It has also a low dielectric constant (≈ 2) and a very
high resistivity (> 1018 Ω m).
1.2.5 PTFE processing and its applications
An extremely high melt viscosity and a lack of Newtonian flow at processing
temperature cause that polytetrafluoroethylene is hard-to-process polymer and shear
processing by either screw extrusion or injection molding is impractical.
Fabrication of PTFE, known as fine or coagulated dispersions powder include
powder processing techniques such as compression moulding, preforming, sintering
[Sperati 1961; Bigg 1977; Crawford 1982; Radhakrishnan 1986; Jog 1993; Jog 1994;
Hambir 1994], ram extrusion [Ebnesajjad 2005] and paste extrusion [Lontz 1952b].
Blending PTFE powder with 18 to 20 wt.% of a lubricant facilitates the process of
extrusion below the melting temperature of polymer.
PTFE plays an important role in many industrial and consumer applications.
Nonstick surfaces for home cookware is its best-known application. In combination with
heat endurance and chemical resistance, polytetrafluoroethylene is favorably used as an
electrical insulation in chemical plants [Joyce 1946b].
The aqueous dispersions containing relatively high concentrations of PTFE
particles are especially suitable for films forming, dip coating, impregnating applications,
and to preparing the mixtures with a variety of fillers, i.e. carbon, silica, clay, and glass
fibers. Polytetrafluoroethylene films can be made by casting an aqueous dispersion on a
supporting surface such as metal, glass, and ceramics, drying to remove the water, baking,
and cooling [Lontz 1952a]. Valves, flexible circuit boards, conveyer belts, tubings are the
most common articles coated using polytetrafluoroethylene aqueous dispersions. The main
application of filled PTFE is the fabrication of special bearings, and gaskets [Ebnesajjad
2005]. There are a number of other minor uses of PTFE dispersions in fuel cells, batteries,
de-dusting, and chloralkali processing.
Formulating dispersions or powders in form which can be spun through the
spinneret it is possible to produce PTFE fibers, which can be applied as diaphragms for the
electrolysis of alkali chlorides, as well as porous filters for fluids. High strength PTFE
fibers can be produced in a fluidized bed [Klatt 2001] or by drawing of monofilament of

27
polytetrafluoroethylene polymer fabricated in paste extrusion process [Shimizu 1997;
Donckers 2009].
Utilizing solid-state extrusion [Starkweather 1979; Mc Gee 1986; Okayama 1994]
and two-stage draw [Uehara 1997; Endo 1998; Endo 2001; Sawai 2006] it has been shown
that some nascent polytetrafluoroethylene powders are ultradrawable. Morooka et al.
[Morooka 2011] shown that modifying two-stage draw technique by applying so-called
PIN draw above melting temperature, it is possible to achieve a superdrawing of
compacted films of nascent PTFE powder, to draw ratios up to 500 and the tensile modulus
of 120 GPa. This technique seems to be promising to develop high performance
polytetrafluoroethylene fibers.
1.2.6 References
Barham P.J., Sadler D.M., 1991. A neutron scattering study of the melting behaviour
of polyethylene single mats. Polymer 32, 393-395;
Beecroft R.I., Swenson C.A., 1959. Behavior of Polytetrafluoroethylene (Teflon) under
High Pressures. J. Appl. Phys. 30, 1793-1798;
Benning A.F., Dowing F.B., Park J.D., 1946. Pyrolysis of tetrafluoroethylene polymer.
US Patent 2394581;
Berry K.L., 1949. Concentrated aqueous colloidal dispersions of polytetrafluoroethylene
and methods for their preparation. US Patent 2478229;
Bigg D.M., 1977. A study of the effect of pressure, time, and temperature on high-pressure
powder molding. Polym. Eng. Sci. 17, 691-699;
Brown E.N., Dattelbaum D.M., Brown D.W., Rae P.J., Clausen B., 2007. A new path
to inducing phase transitions in semi-crystalline polymers. Polymer 48, 2531-2536;
Brubaker M.M., 1946. Process for polymerizing tetrafluoroethylene. US Patent 2393967;
Bunn C.W., Howells E.R., 1954. Structures of molecules and crystals of fluorocarbons.
Nature 274, 549-551;
Compton J.D., Justice J.W., Irwin C.F., 1950. Plasticized polymers. US Patent 2510078;
Crawford R.J., 1982. Effect of compaction rate during the cold forming of polymeric
powders. Polym. Eng. Sci. 22, 300-306;
Donckers M., 2009. Thermally stable polytetrafluoroethylene fiber and method of making
same. US Patent 7498079;

28
Ebnesajjad S., Khaladkar P.R., 2005. Fluoropolymers Applications in Chemical
Processing Industries. William Andrew Inc., New York;
Endo R., Kanamoto T., Porter R.S., 1998. Uniaxial Drawing of Polytetrafluoroethylene
Virgin Powder by Extrusion Plus Cold Tensile Draw.
J. Polym. Sci. Part B: Polym. Phys. 36, 2551-2562;
Endo R., Kanamoto T., 2001. Superdrawing of Polytetrafluoroethylene Virgin Powder
above the Static Melting Temperature. J. Polym. Sci. Part B: Polym. Phys. 39, 1995-2004;
Folda T., Hoffman H., Chanzy H., Smith P., 1988. Liquid crystalline suspensions
of poly(tetrafluoroethylene). Nature 333, 55-66;
Geil P.H., Yang J., Williams R.A., Petersen K.L., Long T.-C., Xu P., 2005. Effect
of Molecular Weight and Melt Time and Temperature on the Morphology
of Poly(tetrafluoroethylene). Adv. Polym. Sci. 180, 89-159;
Gonon P., Sylvestre A., 2002. Dielectric properties of fluorocarbon thin films deposited
by radio frequency sputtering of polytetrafluoroethylene. J. Appl. Phys. 92, 4584-4589;
Grebowicz J., Cheng S.Z.D., Wunderlich B., 1986. Kinetics of transitions involving condis
crystals. J. Polym. Sci. Part B Polym. Phys. 24, 675-685;
Hambir S.S., Jog J.P., Nadkarni V.M., 1994. Strength development in powder processing
of poly(tetrafluoroethylene). Polym. Eng. Sci. 34, 1065-1069;
Hanford W.E., Joyce R.M. Jr., 1946. Polytetrafluoroethylene.
J. Am. Chem. Soc. 68, 2082-2085;
Jog J.P., 1993. Solid state processing of polymers: A review.
Adv. Polym. Technol. 12, 281-289;
Jog J.P., Nath K.R., Nadkarni V.M., 1994. Solid-state processing of
polytetrafluoroethylene Simulation of sintering cycle.
Itern. J. Mater. Prod. Technol. 9, 155-169;
Joyce R.M. Jr., 1946a. Process for polymerizing tetrafluoroethylene. US Patent 2394243;
Joyce R.M. Jr., 1946b. Electrical apparatus. US Patent 2392388;
Klatt B., Horx M., Koelling H., Berndt K., Krueger G., Kuenne H.-J., Moerl L.,
Backhauss L., 2001. Method for physically converting PTFE particles to fibers.
US Patent 6187238;
Lontz J.F., Happoldt W.B. Jr., 1952a. A new aqueous colloidal dispersion
of polytetrafluoroethylene. Ind. Eng. Chem. 44, 1800-1805;
Lontz J.F., Jaffe J.A., Robb L.E., Happoldt W.B. Jr., 1952b. Extrusion properties
of lubricated resin from coagulated dispersion. Ind. Eng. Chem., 44, 1805-1810;

29
Luhmann B., Feiring A.E., 1989. Surfactant effects in polytetrafluoroethylene dispersion
polymerization. Polymer 30, 1723-1732;
Marx P., Dole M., 1955. Specific Heat of Synthetic High Polymers. V. A Study of the
Order-Disorder Transition in Polytetrafluoroethylene. J. Am. Chem. Soc. 77, 4771-4774;
Mc Gee R.L., Collier R., 1986. Solid state extrusion of polytetrafluoroethylene fibers.
J. Polym. Eng. Sci. 26, 239-242;
Morooka N., Sawai D., Ohama T., Sano A., Matsuura K., Kanamoto T., 2011. Processing
of nascent polymer powders to high performance fibers, in: Myasnikowa L., Lemstra P.J.
(Eds.), Reactor Powder Morphology. Nova Science Publishers, Inc, New York,
pp. 295-316;
Narkis M., Rosenzweig N., 1995. Polymer Powder Technology. John Wiley & Sons Ltd.,
Chichester;
Okayama H., Kanamoto T., Porter R.S., 1994. Solid-state deformation
of polytetrafluoroethylene powder. Part I Extrusion drawing. J. Mater. Sci. 29, 6485-6494;
Piorkowska E., Galeski A., 1986. Measurements of thermal conductivity of materials
using a transient technique. II. Description of the apparatus. J. Appl. Phys. 60, 493-498.
Plunkett R.J., 1941. Tetrafluoroethylene polymers. US Patent 2230654;
Radhakrishnan S., Nadkarni V.M., 1986. Modification of Crystallinity and Structure in
Powder Processing of Polytetrafluoroethylene. Inter. J. Polym. Mater. 11, 79-94;
Rae P.J., Dattelbaum D.M., 2004. The properties of poly(tetrafluoroethylene) (PTFE)
in compression. Polymer 45, 7615-7625;
Rae P.J., Brown E.N., 2005. The properties of poly(tetrafluoroethylene) (PTFE) in tension.
Polymer 46, 8128-8140;
Rahl F.J., Evanco M.A., Fredericks R.J., Reimschuessel A.C., 1972. Studies of the
Morphology of Emulsion-Grade Polytetrafluoroethylene. J. Polym. Sci. Part A-2: Polym.
Phys. 10, 1337-1350;
Renfrew M.M., Lewis E.E., 1946. Polytetrafluoroethylene. Heat-Resistant, Chemically
Inert Plastic. Ind. Eng. Chem. 38, 871-877;
Renfrew M.M., 1950. Polymerization of tetrafluoroethylene with dibasic acid peroxide
catalysts. US Patent 2534058;
Rigby H.A., Bunn C.W., 1949. A Room-Temperature Transition
in Polytetrafluoroethylene. Nature, 164, 583;
Sawai D., Watanabe D., Morooka N., Kuroki H., Kanamoto T., 2006. Superdrawing
30
of Polytetrafluoroethylene Nascent Powder by Solid-State Coextrusion.
J. Polym. Sci. Part B: Polym. Phys. 44, 3369-3377;
Seguchi T., Suwa T., Tamura N., Takehisa M., 1974. Morphology
of Polytetrafluoroethylene Prepared by Radiation-Induced Emulsion Polymerization.
J. Polym. Sci. Polym. Phys. Ed. 12, 2567-2576;
Shimizu M., 1997. Process of making PTFE fibers. US Patent 5686033;
Smith P., Gardner K.H., 1985. Dissolution of Poly(tetrafluoroethylene).
Macromolecules 18, 1222-1228;
Sperati C.A., Starkweather H.W. Jr., 1961. Fluorine-Containing Polymers.
II. Polytetrafluoroethylene. Fortschr. Hochpolym.-Forsch. Bd. 2, 465-495;
Starkweather H.W. Jr., 1979. A Comparison of the Rheological Properties
of Polytetrafluoroethylene below Its Melting Point with Certain Low-Molecular Smectic
States. J. Polym. Sci. Polym. Phys. Ed. 17, 73-79;
Starkweather H.W. Jr., Zoller P., Jones G.A., Vega A.J., 1982. The Heat of Fusion
of Polytetrafluoroethylene. J. Polym. Sci. Polym. Phys. Ed. 20, 751-761;
Suwa T., Seguchi T., Takehisa M., Machi S., 1975. Effect of Molecular Weight
on the Crystalline Structure of Polytetrafluoroethylene As-Polymerized.
J. Polym. Sci. Polym. Phys. Ed. 13, 2183-2194;
Tuminello W.H., Treat T.A., English A.D., 1988. Poly(tetrafluoroethylene): Molecular
Weight Distributions and Chain Stiffness. Macromolecules 21, 2606-2610;
Uehara H., Jounai K., Endo R., Okuyama H., Kanamoto T., Porter R.S., 1997. High
modulus films of polytetrafluoroethylene prepared by two-stage drawing of reactor
powder. Polym. J. 29, 198-200;
Weeks J.J., Sanchez I.C., Eby R.K., Poser C.I., 1980. Order-disorder transitions
in polytetrafluoroethylene. Polymer 21, 325-331;
Weeks J.J., Clark E.S., Eby R.K., 1981. Disorder in the crystal structures of phases I
and II of copolymers of tetrafluoroethylene and hexafluoropropylene.
Polymer 22, 1496-1499;

31
1.3 Mechanisms of plastic deformation in semicrystalline polymers
The understanding of the basic mechanisms of deformation in semicrystalline
polymers has been a subject of intense interest since at least four decades. Plastic
deformation in semicrystalline materials is a complex phenomenon because of their
complicated structure and morphology. Presently, the structure of bulk-crystallized
polymer is described by two-phase model: where the crystalline lamellae are separated
from each other by a layer of amorphous polymer and held together by tie molecules
[Keller 1968].
In the past, three principal conceptions were worked out to explain the nature of
plastic deformation in semicrystalline polymers. The first so-called “micronecking” model
proposed by Peterlin [Peterlin 1969; Peterlin 1971; Peterlin 1977] assumes that at large
strains the initial chain-folded lamellar structure is discontinuously transformed into
microfibrils. These catastrophic process occurring during tensile drawing is schematically
presented in Figure 1.11.
Figure 1.11. Schematic illustration of ‘micronecking’ model [Peterlin 1969].
The second model assumes that the plastic deformation is connected with the melting of
polymer crystals and simultaneous recrystallization during tensile drawing [Flory 1978;
Popli 1987; Gent 1989; Wu 1992; Kennedy 1994; Annis 1996; Peacock 1998]. The third
conception based on the idea that the deformation of crystals proceeds by crystallographic

32
mechanisms, was adopted to polymers by Young and others [Young 1974b; Bowden 1974;
Lin 1994] from the science of metals and other low molecular materials.
The nature of mechanisms accompanying deformation of crystalline polymers and
the factors affecting them were intensively studied [Bowden 1974; Escaig 1982; Galeski
1992; Lin 1994; Porter 1995; Oleinik 2003; Galeski 2003; Pawlak 2005]. The mechanical
behavior of semicrystalline polymers in tension, is influenced by a number of factors such
as molecular weight [Capaccio 1975; Capaccio 1976; Fu 2003; Stern 2007; Pawlak 2008],
thermal history [Capaccio 1975; Capaccio 1976; Fu 2003; Davies 2004; Pawlak 2007;
Stern 2007], orientation of lamellar structure [Hobeika 2000], deformation rate [Hobeika
2000; Viana 2005; Stern 2007] and temperature of deformation [Hartmann 1987; Hobeika
2000; Schneider 2010].
Figure 1.12. Hermans orientation parameters of the crystalline phase, fc and amorphous phase, fa
for a series of isotactic polypropylene samples uniaxially deformed to a different degree of orientation. The region surrounded by the dotted lines represents the course of deformation
starting from fc and fa equal 0 [Kryszewski 1978].
Deformation in semicrystalline polymers takes place firstly in the amorphous
phase, since the stress required to initiate this process constitutes from 2 to 10 % of the
value of stress needed to activate the deformation modes in crystallites [Peterson 1966b].

33
This predictions were confirmed experimentally by Kryszewski et al. [Kryszewski 1978]
and also by Bartczak [Bartczak 1992a; Bartczak 1992b; Bartczak 1994].
Figure 1.12 presents the Hermans orientation parameters for the crystalline and amorphous
phases of a series of tensile deformed samples of isotactic polypropylene. In the initial
stage of deformation, the amorphous phase becomes oriented while the crystalline phase
remains very slightly oriented or oriented in the transverse direction. Further increase in
the draw ratio results in almost entirely stretched out amorphous phase and beginning of
orientation process of the crystalline phase. Finally, at high draw ratio the macromolecular
chain fragments embedded in both phases become highly oriented.
1.3.1 Deformation of amorphous phase
The structure of amorphous phase and mechanisms of their plastic deformation in
polyethylene has been intensively studied by Fisher and others [Fisher 1988; Lin 1994;
Bartczak 1997]. The amorphous regions above glass transition temperature, Tg, exhibit a
rubber-like behavior, hence their plastic deformation takes place according to the three
principal mechanisms: interlamellar slip (or interlamellar shear), interlamellar separation
and lamellae-stack rotation [Bowden 1974; Lin 1994; Bartczak 1996] which are
schematically illustrated in Figure 1.13.
Figure 1.3. Deformation mechanisms of the amorphous phase in semicrystalline polymers:
(a) interlamellar slip, (b) interlamellar separation and (c) lamellae-stack rotation [Bowden 1974].
Interlamellar slip involves a simple shear of amorphous layers between crystalline
lamellae parallel to each other and causes rotation of crystalline lamellae around the
direction of deformation. These deformation mode is not observable below Tg of the

34
amorphous phase [Keller 1971; Young 1973; Bowden 1974; Pope 1975]. Keller and Pope
[Keller 1971] showed that above 80 oC in the early stage of deformation, interlamellar slip
is the dominant mode of deformation of oriented low density polyethylene, LDPE and can
be completely reversible up to deformation, ε < 0.6 [Bartczak 2005].
The second deformation mode of amorphous phase is interlamellar separation
which involves a change of the distance between adjacent lamellae parallel to each other,
when the direction of stress is perpendicular to their surface [Quynn 1971; Keller 1971;
Kaufman 1973; Pope 1975; Petermann 1978]. The deformation resistance to interlamellar
separation depends upon the detailed structure of the material, including the amount of an
active, taut tie molecules between the lamellae, distribution of their chain lengths, and on
the lateral dimension of crystalline lamellae. The implementation of this deformation mode
is possible by two processes: either a large density fluctuations (cavities) leading to the
formation of voids [Pawlak 2005; Pawlak 2007; Pawlak 2008] or a flow of the amorphous
material into structural traps, i.e. opening gaps between lamellae [Pope 1975].
In contrast to interlamellar slip and interlamellar separation, a lamellae-stack
rotation requires the cooperative movement of amorphous phase and crystalline lamellae.
The crystallites are embedded in the amorphous phase in the form of stacks, and they are
free to rotate under the influence of stress [Cowking 1968; Groves 1969; Keller 1971].
Tagawa showed that the stack rotation involves three to ten crystallites [Tagawa 1980].
1.3.2 Deformation of polymer crystals
Plastic deformation of polymer crystals proceeds by three basic mechanisms, i.e.
crystallographic slip, twinning and stress-induced martensitic transformation, but slip
mode is predominant since it can generate larger plastic strains than two others.
Crystallographic slip is identified as (hkl)[uvw] which is a combination of the slip
plane (hkl) and the slip direction [uvw] in these plane where h, k, l, u, v and w are the
Miller indices.
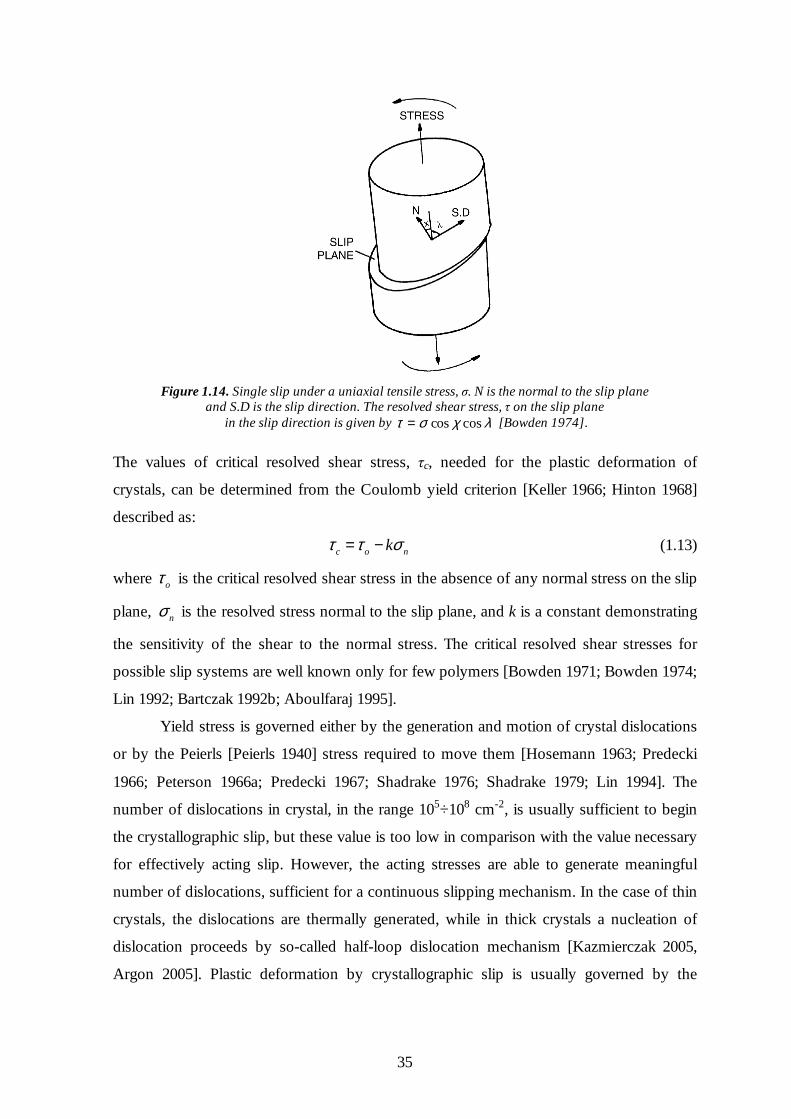
The crystallographic slip, schematically presented in Figure 1.14, takes place when the
actual shear stress acting on the slip plane reaches a critical value, known as the critical
resolved shear stress cτ or plastic resistance [Bowden 1971; Young 1973; Young 1974a]
and afterwards two parts of crystal separated by the slip plane undergo a relative
translation.
35
Figure 1.14. Single slip under a uniaxial tensile stress, σ. N is the normal to the slip plane
and S.D is the slip direction. The resolved shear stress, τ on the slip plane in the slip direction is given by τ σ χ λ= cos cos [Bowden 1974].
The values of critical resolved shear stress, τc, needed for the plastic deformation of
crystals, can be determined from the Coulomb yield criterion [Keller 1966; Hinton 1968]
described as:
c o nkτ τ σ= − (1.13)
where oτ is the critical resolved shear stress in the absence of any normal stress on the slip
plane, nσ is the resolved stress normal to the slip plane, and k is a constant demonstrating
the sensitivity of the shear to the normal stress. The critical resolved shear stresses for
possible slip systems are well known only for few polymers [Bowden 1971; Bowden 1974;
Lin 1992; Bartczak 1992b; Aboulfaraj 1995].
Yield stress is governed either by the generation and motion of crystal dislocations
or by the Peierls [Peierls 1940] stress required to move them [Hosemann 1963; Predecki
1966; Peterson 1966a; Predecki 1967; Shadrake 1976; Shadrake 1979; Lin 1994]. The
number of dislocations in crystal, in the range 105÷108 cm-2, is usually sufficient to begin
the crystallographic slip, but these value is too low in comparison with the value necessary
for effectively acting slip. However, the acting stresses are able to generate meaningful
number of dislocations, sufficient for a continuous slipping mechanism. In the case of thin
crystals, the dislocations are thermally generated, while in thick crystals a nucleation of
dislocation proceeds by so-called half-loop dislocation mechanism [Kazmierczak 2005,
Argon 2005]. Plastic deformation by crystallographic slip is usually governed by the
36
resistance to the motion of dislocations on the slip planes [Bowden 1974; Reck 1985;
Galeski 1992; Lin 1994; Porter 1995].
The crystallographic slips in chain-folded crystals can proceed only along planes
containing axes of macromolecular chains and folds since the covalent bonds along chain
axes cannot be broken down during deformation. The easiest slip occurs along a slip plane
which tend to be a close-packed plane in the structure. In case of polyethylene the slip
plane must be of the (hk0) type and the slip direction parallel to the chain axis [001]
[Young 1973]. Hence, there are only two possible crystallographic slips: chain slip (or
parallel slip), i.e. slip along the chains, and transverse slip, i.e. slip perpendicular to the
chains. The chain slip and transverse slip can occur simultaneously on a common slip
plane [Lewis 1972; Young 1973], but the critical resolved shear stress for chain slip is
lower than τc for any transverse slip [Bowden 1974].
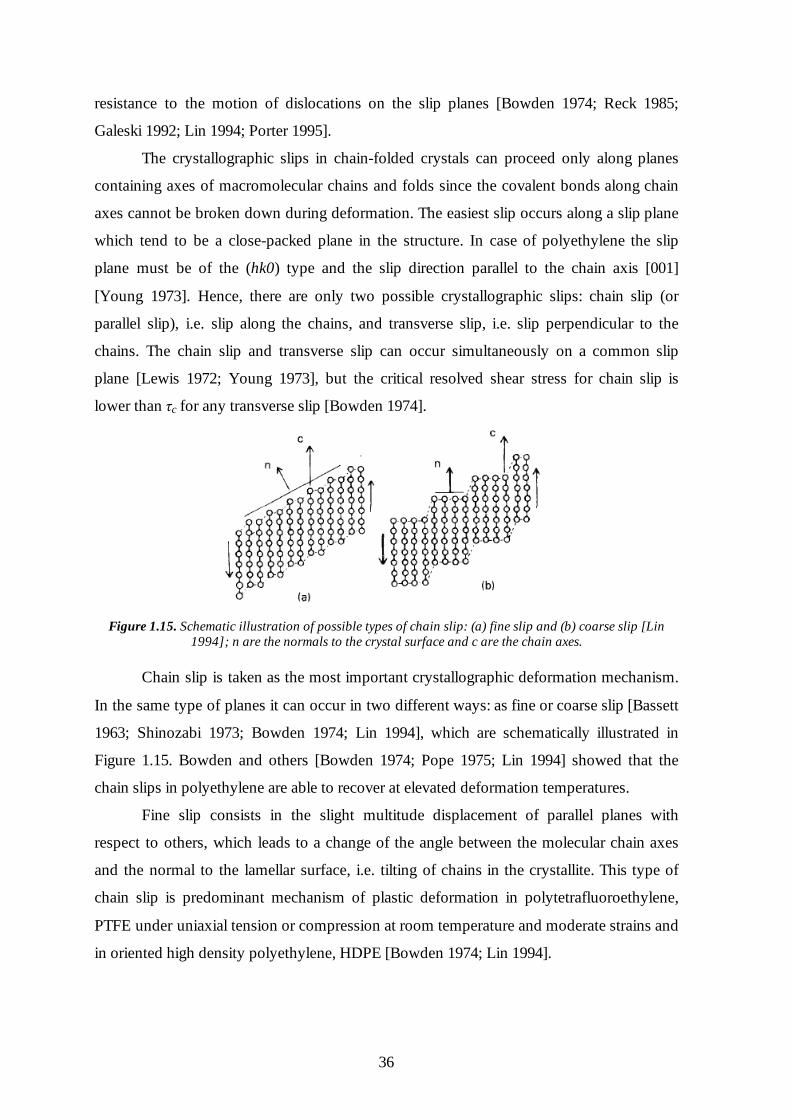
Figure 1.15. Schematic illustration of possible types of chain slip: (a) fine slip and (b) coarse slip [Lin
1994]; n are the normals to the crystal surface and c are the chain axes.
Chain slip is taken as the most important crystallographic deformation mechanism.
In the same type of planes it can occur in two different ways: as fine or coarse slip [Bassett
1963; Shinozabi 1973; Bowden 1974; Lin 1994], which are schematically illustrated in
Figure 1.15. Bowden and others [Bowden 1974; Pope 1975; Lin 1994] showed that the
chain slips in polyethylene are able to recover at elevated deformation temperatures.
Fine slip consists in the slight multitude displacement of parallel planes with
respect to others, which leads to a change of the angle between the molecular chain axes
and the normal to the lamellar surface, i.e. tilting of chains in the crystallite. This type of
chain slip is predominant mechanism of plastic deformation in polytetrafluoroethylene,
PTFE under uniaxial tension or compression at room temperature and moderate strains and
in oriented high density polyethylene, HDPE [Bowden 1974; Lin 1994].
37
In case of coarse slip the shear displacements appear only along the confined
number of crystalline planes, and no chain tilting is observed during the deformation. The
role of coarse slip usually increases with the total strain of the material.
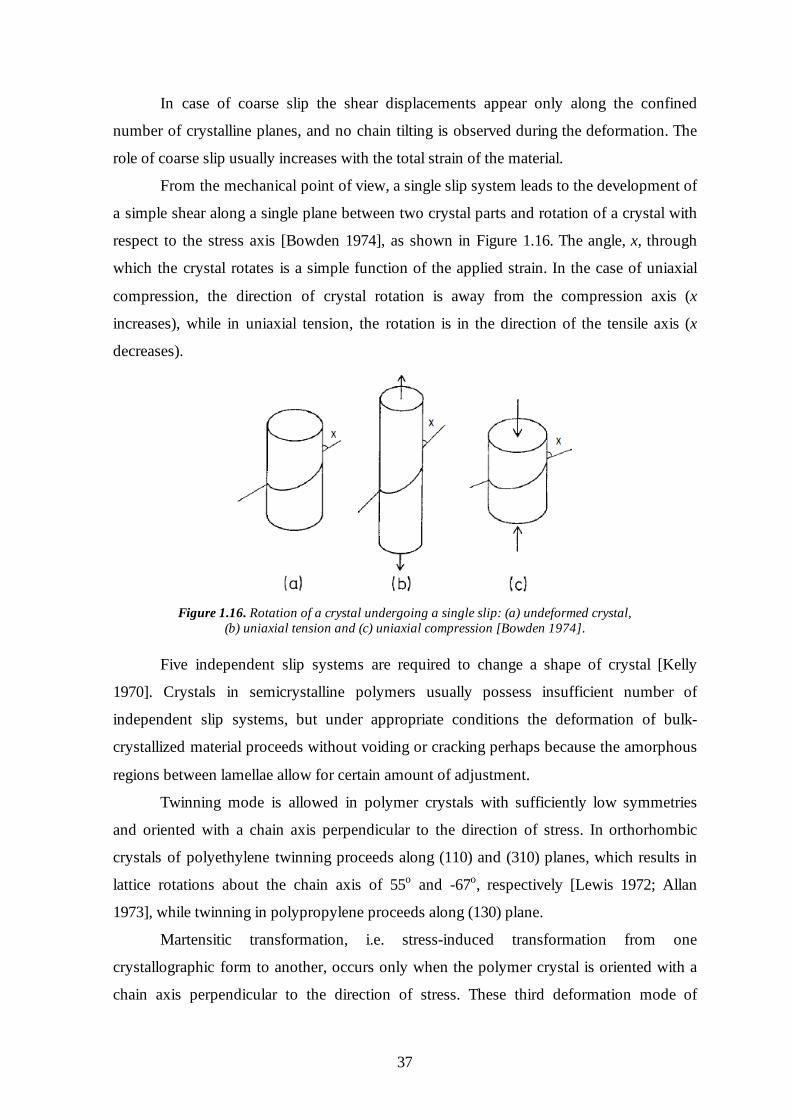
From the mechanical point of view, a single slip system leads to the development of
a simple shear along a single plane between two crystal parts and rotation of a crystal with
respect to the stress axis [Bowden 1974], as shown in Figure 1.16. The angle, x, through
which the crystal rotates is a simple function of the applied strain. In the case of uniaxial
compression, the direction of crystal rotation is away from the compression axis (x
increases), while in uniaxial tension, the rotation is in the direction of the tensile axis (x
decreases).
Figure 1.16. Rotation of a crystal undergoing a single slip: (a) undeformed crystal,
(b) uniaxial tension and (c) uniaxial compression [Bowden 1974].
Five independent slip systems are required to change a shape of crystal [Kelly
1970]. Crystals in semicrystalline polymers usually possess insufficient number of
independent slip systems, but under appropriate conditions the deformation of bulk-
crystallized material proceeds without voiding or cracking perhaps because the amorphous
regions between lamellae allow for certain amount of adjustment.
Twinning mode is allowed in polymer crystals with sufficiently low symmetries
and oriented with a chain axis perpendicular to the direction of stress. In orthorhombic
crystals of polyethylene twinning proceeds along (110) and (310) planes, which results in
lattice rotations about the chain axis of 55o and -67o, respectively [Lewis 1972; Allan
1973], while twinning in polypropylene proceeds along (130) plane.
Martensitic transformation, i.e. stress-induced transformation from one
crystallographic form to another, occurs only when the polymer crystal is oriented with a
chain axis perpendicular to the direction of stress. These third deformation mode of

38
crystals was found in several polymers such as an oriented polyethylene subjected to
uniaxial compression (transformation from orthorhombic to monoclinic form) [Tanaka
1962], polypropylene (transformation from γ-form to α-form), poly(L-lactic acid) with
transformation from α-form to β-form [Eling 1982] and nylon 6 with α-form transforming
to γ-form [Galeski 1991].
In can be concluded that plastic deformation of semicrystalline polymers requires
both deformation of amorphous and crystalline phase because of their complicated
hierarchical structure [Lin 1994; Galeski 2003]. Deformation of amorphous phase can be
activated relatively easy [Kryszewski 1978] but it is rapidly exhausted due to different
alignment of crystalline lamellae with respect to the deformation direction. Further
deformation of semicrystalline polymer could be possible by initiation of plastic
deformation of lamellar crystals. Plastic deformation of a polymer is initiated by crystal
plasticity. Plastic yielding of semicrystalline polymers based on dislocation mechanism
[Peterson 1966a; Peterson 1968; Shadrake 1974; Young 1988] was intensively studied in
the past [Lin 1994; Wilhelm 2004; Kazmierczak 2005; Séguéla 2007]. It is known that the
yield stress of semicrystalline polymers depends not only on crystal thickness [Brooks
2000; Séguéla 2002] but also on the degree of crystallinity and entanglement of
macromolecules [O’Kane 1995; Ayoub 2011]. Bartczak et al. [Bartczak 2012] have shown
that the molecular network characterized by the density of entanglements is the key
parameter controlling deformability of the melt of ultra high molecular weight
polyethylene, UHMWPE. Lower the entanglements density the higher the ultimate strain
in the plain-strain compression of a molten material.
1.3.3 References
Aboulfaraj M., G’Sell C., Ulrich B., Dahoun A., 1995. In situ observation of the plastic
deformation of polypropylene spherulites under uniaxial tension and simple shear in the
scanning electron microscope. Polymer 36, 731-742;
Allan P., Crellin E.B., Bevis M., 1973. Stress-induced twinning and phase transformations
in polyethylene single crystals. Philos. Mag. 27, 127-145;
Annis B.K., Strizak J., Wignall G.D., Alamo R.G., Mandelkern L., 1996. A small-angle
neutron scattering study of the plastic deformation of linear polyethylene.
Polymer 37, 137-140;
39
Argon A.S., Galeski A., Kazmierczak T., 2005. Rate mechanisms of plasticity in semi-
crystalline polyethylene. Polymer 46, 11798-11805;
Ayoub G., Zairi F., Frederix C., Gloaguen J.M., Nait-Abdelaziz M., Seguela R., 2011.
Effects of crystal content on the mechanical behaviour of polyethylene under finite strains:
experiments and constitutive modeling. Int. J. Plasticity 27, 492-511;
Bartczak Z., Cohen R.E., Argon A.S., 1992a. Evolution of the Crystalline Texture
of High-Density Polyethylene during Uniaxial Compression.
Macromolecules 25, 4692-4704;
Bartczak Z., Argon A.S., Cohen R.E., 1992b. Deformation Mechanisms and Plastic
Resistance in Single-Crystal-Textured High-Density Polyethylene.
Macromolecules 25, 5036-5053;
Bartczak Z., Argon A.S., Cohen R.E., 1994. Texture evolution in large strain simple shear
deformation of high density polyethylene. Polymer 35, 3427-3441;
Bartczak Z., Galeski A., Argon A.S., Cohen R.E., 1996. On the plastic deformation of the
amorphous component in semicrystalline polymers. Polymer 37, 2113-2123;
Bartczak Z., Martuscelli E., 1997. Orientation and properties of sequentially drawn films
of an isotactic polypropylene/hydrogenated oligocyclopentadiene blend.
Polymer 38, 4139-4149;
Bartczak Z., 2005. Influence of molecular parameters on high-strain deformation
of polyethylene in the plane-strain compression. Part II. Strain recovery.
Polymer 46, 10339-10354;
Bartczak Z., Beris P.F.M., Wasilewski K., Galeski A., Lemstra P.J., 2012. Deformation
of the Ultra-High Molecular Weight Polyethylene Melt in the Plain-Strain Compression.
J. Appl. Polym. Sci. DOI 10.1002/app.36595;
Bassett D.C., Keller A., Mitsuhashi S., 1963. New features in polymer crystal growth from
concentrated solutions. J. Polym. Sci. Part A 1, 763-788;
Bowden P.B., Young R.J., 1971. Critical Resolved Shear Stress for [001] Slip in
Polyethylene. Nature Phys. Sci. 229, 23-25;
Bowden P.B., Young R.J., 1974. Deformation mechanisms in crystalline polymers.
J. Mater. Sci. 9, 2034-2051;
Brooks N.W.J., Mukhtar M., 2000. Temperature and stems length dependence of the yield
stress of polyethylene. Polymer 41, 1475-1480;
Capaccio G., Ward I.M., 1975. Effect of molecular weight on the morphology and drawing
behaviour of melt crystallized linear polyethylene. Polymer, 16, 239-243;

40
Capaccio G., Chapman T.J., Ward I.M., 1976. The Drawing Behavior of Linear
Polyethylene. I. Rate of Drawing as a Function of Polymer Molecular Weight and Initial
Thermal Treatment. J. Polym. Sci. Polym. Phys. Ed. 14, 1641-1658;
Cowking A., Rider J.G., Hay I.L., Keller A., 1968. A Study of the Orientation Effects in
Polyethylene in the Light of Crystalline Texture. Part 3 On the Effect of Applied Stress on
the Molecular and Textural Orientation. J. Mater. Sci. 3, 646-654;
Davies R., Zafeiropoulos N., Schneider K., Roth S., Burghammer M., Riekel C., Kotek J.,
Stamm M., 2004. The use of synchrotron X-ray scattering coupled with in situ mechanical
testing for studying deformation and structural change in isotactic polypropylene.
Colloid Polym. Sci. 282, 854-866;
Eling B., Gogolewski S., Pennings A.J., 1982. Biodegradable materials of poly(L-lactid
acid): 1. Melt-spun and solution-spun fibers. Polymer 23, 1587-1593;
Escaig B., G'Sel C., 1982. Plastic Deformation of Amorphous and Semicrystalline
Materials. Les Editeurs de Physique, Paris;
Fisher E.W., 1988. The conformation of polymer chains in the semicrystalline state.
Macromol. Chem. Macromol. Symp. 20-21, 277-291;
Flory P.J., Yoon D.Y., 1978. Molecular morphology in semicrystalline polymers.
Nature 272, 226-229;
Fu Q., Men Y., Strobl G., 2003. A molar mass induced transition in the yielding properties
of linear polyethylene. Polymer 44, 1941-1947;
Galeski A., Argon A.S., Cohen R.E., 1991. Morphology of Bulk Nylon 6 Subjected to
Plane Strain Compression. Macromolecules 24, 3953-3961;
Galeski A., Bartczak Z., Argon A.S., Cohen R.E., 1992. Morphological Alternations
during Texture-Producing Plastic Plane Strain Compression of High-Density
Polyethylene. Macromolecules 25, 5705-5718;
Galeski A., 2003. Strength and toughness of crystalline polymer systems.
Prog. Polym. Sci. 28, 1643-1699;
Gent A.N., Madan. S., 1989. Plastic Yielding of Partially Crystalline Polymers.
J. Polym. Sci. Part B: Polym. Phys. 271, 1529-1542;
Groves G.W., Hirsch P.B., 1969. Interlamellar Slip in Polyethylene.
J. Mater. Sci. Lett. 4, 929-932;
Hartmann B., Lee G.F., Wong W., 1987. Tensile Yield in Polypropylene.
Polym. Eng. Sci. 27, 823-828;

41
Hinton T., Rider G.J., 1968. Tensile Deformation of Oriented Polyethylene.
J. Appl. Phys. 39, 4932-4938;
Hobeika S., Men Y., Strobl G., 2000. Temperature and Strain Rate Independence
of Critical Strains in Polyethylene and Poly(ethylene-co-vinyl acetate).
Macromolecules 33, 1827-1833;
Hosemann R., 1963. Crystalline and Paracrystalline Order in High Polymers.
J. Appl. Phys. 34, 25-42;
Kaufman W.E., Schultz J.M., 1973. Lamellar and interlamellar structure in melt-
crystallized polyethylene. Part 3 Effects of small deformation. J. Mater. Sci. 8, 41-46;
Kazmierczak T., Galeski A., Argon A.S., 2005. Plastic deformation of polyethylene
crystals as a function of crystal thickness and compression rate. Polymer 46, 8926-8936;
Keller A., Rider J.G., 1966. On the Tensile Behaviour of Oriented Polyethylene.
J. Mater. Sci. 1, 389-398;
Keller A., 1968. Polymer crystals. Rep. Prog. Phys. 31, 623-704;
Keller A., Pope D.P., 1971. Identification of Structural Processes in Deformation
of Oriented Polyethylene. J. Mater. Sci. 6, 453-578;
Kelly A., Groves G.W., 1970. Crystallography of crystal defects. Longman, London;
Kennedy M.A., Peacock A.J., Mandelkern L., 1994. Tensile Properties of Crystalline
Polymers: Linear Polyethylene. Macromolecules 27, 5297-5310;
Kryszewski M., Pakula T., Galeski A., Milczarek P., Pluta M., 1978. Uber einige
Ergebnisse der Untersuchung der Korrelation zwischen der Morphologie und den
mechanischen Eigenschaften von kristallinen Polymeren.
Faserforschung u Textiltech. 29, 76-85;
Lewis D., Wheeler E.J., Maddams W.F., Preedy J.E., 1972. Comparison of twinning
produced by rolling and annealing in high- and low-density polyethylene.
J. Polym. Sci. A-2 Notes 10, 369-373;
Lin L., Argon A.S., 1992. Deformation Resistance in Oriented Nylon 6.
Macromolecules 25, 4011-4024;
Lin L., Argon A.S., 1994. Structure and plastic deformation of polyethylene.
J. Mater. Sci. 29, 294-323;
Oleinik E.F., 2003. Plasticity of Semicrystalline Flexible-Chain Polymers at the
Microscopic and Mesoscopic Levels. Polym. Sci. Ser. C. 45, 17-117;
O’Kane W.J., Young R.J., Ryan A.J., 1995. The effect of annealing on the structure and
properties of isotactic polypropylene films. J.Macromol. Sci. Phys. B34, 427-458;

42
Peacock A.J., Mandelkern L., Alamo R.G., Fatou J.G., 1998. The influence of the
deformation temperature on the tensile properties of polyethylenes.
J. Mater. Sci. 33, 2255-2268;
Pawlak A., Galeski A., 2005. Plastic Deformation of Crystalline Polymers: The Role
of Cavitation and Crystal Plasticity. Macromolecules 38, 9688-9697;
Pawlak A., 2007. Cavitation during tensile deformation of high-density polyethylene.
Polymer 48, 1397-1409;
Pawlak A., Galeski A., 2008. Cavitation during Tensile Deformation of Polypropylene.
Macromolecules 41, 2839-2851;
Peierls R., 1940. The size of dislocations. Proc. Phys. Soc. 289, 34-37;
Peterlin A., 1969. Plastic deformation of polyethylene by rolling and drawing.
Kolloid Z.Z. Polym. 233, 857-862;
Peterlin A., 1971. Molecular Model of Drawing Polyethylene and Polypropylene.
J. Mater. Sci. 6, 490-508;
Peterlin A., 1977. Drawing and annealing of fibrous material.
J. Appl. Phys. 48, 4099-4108;
Petermann J., Schultz J.M., 1978. Lamellar separation during the deformation of high-
density polyethylene. J. Mater. Sci. 13, 50-54;
Peterson J.M., 1966a. Thermal Initiation of Screw Dislocations in Polymer Crystal
Platelets. J. Appl. Phys. 37, 4047-4051;
Peterson J.M., Lindenmeyer P.H., 1966b. Screw Dislocations in Anisotropic Media.
J. Appl. Phys. 37, 4051-4053;
Peterson J.M., 1968. Peierls Stress for Screw Disclocations in Polyethylene.
J. Appl. Phys. 39, 4920-4929;
Pope D.P., Keller A., 1975. Deformation of oriented polyethylene.
J. Polym. Sci. Polym. Phys. Ed. 13, 533-566;
Popli R., Mandelkern L., 1987. Influence of structural and morphological factors
on the mechanical properties of the polyethylenes.
J. Polym. Sci. Polym. Part B: Polym. Phys. 25, 441-483;
Porter R.S., Wang L.-H., 1995. Uniaxial Extension and Order Development in Flexible
Chain Polymers. J. Macromol. Sci. Part C: Polym. Rev. 35, 63-115;
Predecki P., Statton W.O., 1966. Dislocation caused by chain ends in crystal polymers.
J. Appl. Phys. 37, 4053-4059;
Predecki P., Statton W.O., 1967. A Dislocation Mechanism for Deformation

43
in Polyethylene. J. Appl. Phys. 38, 4140-4144;
Quynn R.G., Brody H., 1971. Elastic “Hard” Fibers.
J. Macromol. Sci. Phys. B5, 721-738;
Reck E.-M., Schenk H., Wilke W., 1985. Investigation of the deformation and relaxation
of various polyethylenes by X-ray diffraction. Progr. Coll. Polym. Sci. 71, 154-163;
Schneider K., 2010. Investigation of Structural Changes in Semi-Crystalline Polymer
During Deformation by Synchrotron X-Ray Scattering.
J. Polym. Sci. Part B: Polym. Phys. 48, 1574-1586;
Séguéla R., 2002. Dislocation approach to the plastic deformation of semicrystalline
polymers: kinetic aspects for polyethylene and polypropylene. J. Polym. Sci. Part B:
Polym. Phys. 40, 593-601;
Séguéla R., 2007. Plasticity of semi-crystalline polymers: crystal versus melting-
recrystallization. e-Polymers Art. No: 032, 1-20;
Shadrake L.G., Guiu F., 1974. Dislocation in polyethylene crystals: line energies and
deformation modes. Philos. Mag. 34, 565-581;
Shadrake L.G., Guiu F., 1976. Dislocations in polyethylene crystals: Line energies
and deformation modes. Philos. Mag. 34, 565-582;
Shadrake L.G., Guiu F., 1979. Elastic line energies and line tensions of dislocations
in polyethylene crystals. Philos. Mag. 39, 785-796;
Shinozabi D., Groves G.W., 1973. The plastic deformation of oriented polypropylene
and polyethylene: deformation mechanisms. J. Mater. Sci. 8, 1012-1022;
Stern C., Frick A., Weickert G., 2007. Relationship Between the Structure and Mechanical
Properties of Polypropylene: Effects of the Molecular Weight and Shear-Induced
Structure. J. Appl. Polym. Sci. 103, 519-533;
Tagawa T., Ogura K., 1980. Piled-Lamellae Structure in Polyethylene Films and its
Deformation. J. Polym. Sci. Polym. Phys. Ed. 18, 971-979;
Tanaka K., Seto T., Hara T., 1962. Crystal structure of a new form of high-density
polyethylene produced by press. J. Phys. Soc. Jpn. 17, 873-874;
Viana J.C., 2005. Structural interpretation of the strain-rate, temperature and morphology
dependence of the yield of injection molded semicrystalline polymers.
Polymer 46, 11773-11785;
Wilhelm H., Paris A., Schafler E., Bernstorff S., Bonarski J., Zehetbauer M.J., 2004.
Evidence of dislocations in melt-crystallized and plastically deformed polypropylene.
Mater. Sci. Eng: A 387-389, 1018-1022;

44
Wu W., Wignall G.D., Mandelkern L., 1992. A SANS study of the plastic deformation
mechanism in polyethylene. Polymer 33, 4137-4140;
Young R.J., Bowden P.B., Ritchie J.M., Rider J.G., 1973. Deformation mechanisms in
oriented high-density polyethylene. J. Mater. Sci. 8, 23-36;
Young R.J., Bowden P.B., 1974a. Twinning and martensitic transformations in oriented
high-density polyethylene. Philos. Mag. 29, 1061-1073;
Young R.J., 1974b. A dislocation model for yield in polyethylene. Philos. Mag. 30, 85-94;
Young R.J., 1988. Screw dislocation model for yield in polyethylene.
Mater. Forum. 11, 210-216;
45
1.4 Scope of the thesis
Polymer nanocomposites are materials in which nanometric, usually inorganic
particles are dispersed in an organic polymer matrix in order to dramatically improve the
performance properties of the polymer. Polymer-polymer nanocomposites are rear and
known only when ready-made nanofibers or nanodroplets are dispersed in the matrix.
Previous attempts of formation of polymer nanocomposites with fibrillar inclusions by
compounding were unsuccessful, because it was impossible to deform a solidified polymer
inclusions during compounding, while in a molten state impossible to preserve the shape of
extended threads because of capillary instabilities leading to their breakup into droplets. A
new idea is to use crystalline polymer inclusions and deform them into nanofibers during
compounding by shearing via second polymer being in the molten state. If the crystals of
polymer inclusions will be sufficiently large, macromolecules disentangled while the
deformation ratios and rates sufficiently large the crystals can be deformed to nanofibers
dispersed in the polymer matrix. In consequence, a nanocomposite with nanofibrillar
inclusions, containing only two polymers, can be formed after solidification of the material
by cooling.
Deformation of polymer crystals to large strains is possible when the density of
entanglements persisting in the amorphous phase is drastically reduced. This state can be
achieved by crystallization under pressure (e.g. for polyethylene, PE, and poly(vinylidene
fluoride), PVDF), crystallization from dilute solutions and crystallization during
polymerization (e.g. polytetrafluoroethylene, PTFE, and ultra-high molecular weight
polyethylene, UHMWPE). Hence, selection of a polymer for the studies was based on the
chain disentanglement ability of the polymer forming crystals. Since, the slow
polymerization of tetrafluoroethylene, TFE, at suitable carefully selected conditions
(temperature, pressure), which result in much faster crystallization compared to
polymerization, enables formation of separate extended-chain crystals of
polytetrafluoroethylene and/or their small agglomerates. Because of reduced density of
entanglements and crystals with extended chains, deformation process of PTFE by
shearing is possible. Such phenomenon was observed in our laboratory few years ago when
non-isothermal crystallization of thin iPP+PTFE films with free surface was studied.
During mixing isotactic polypropylene with aqueous emulsion of polytetrafluoroethylene,
some PTFE grains were deformed into PTFE nanofibers with lateral dimensions
46
200÷350 nm. These unexpected results inspired us to select polytetrafluoroethylene as
crystalline polymer inclusions for further studies.
The main objective of this thesis was to generate nanofibers of
polytetrafluoroethylene in situ during compounding solid PTFE particles with
thermoplastic matrix being in a molten state. The influence of a type of
polytetrafluoroethylene, polymer matrix and its viscosity, as well as processing parameters
including shear rate and compounding time on the so-called fibrillation process,
understood as a deformation of polymer crystals into form of nanofibers, has been studied.
Other objective of the thesis was to analyze an effect of generated PTFE nanofibers on the
thermal, mechanical, and rheological properties of studied materials.
The results in this thesis will lead to a development of new generation of ‘all
polymer’ nanocomposites reinforced by polymer nanofibers with wide potential
applications. Simplicity of fabrication just by shearing the dispersion in another molten
polymers would play very important role in minimizing the costs, hazardous exposure and
environmental impact, all being usually very high when dealing with ready made
nanofillers.

47
Chapter 2
Experimental Section
2.1 Materials
Studies presented in the paper have been conducted for a number of compositions
prepared by compounding thermoplastic polymers with virgin polytetrafluoroethylene
powders. Four grades of isotactic polypropylene, low density polyethylene, high density
polyethylene and atactic polystyrene were used as polymeric matrices. Three grades of
polytetrafluoroethylene powders were utilized as fillers. Characteristics of thermoplastic
polymers and PTFE fillers according to their manufacturers and codes used in the studies
are presented below.
Polypropylene (1), i-PP (PP) having weight-average molecular weight, Mw, of 220
kg mol-1, melt flow index, MFI, of 13.8 g/10min (for 230 oC, 2.16 kg according to ISO
1133 standard) and density, d, of 0.89 g cm-3, by Polysciences Inc., USA;
Polypropylene (2), Malen-P B200 (PPB) having melt flow index, MFI, of 0.6
g/10min (for 230 oC, 2.16 kg according to ISO 1133 standard), density, d, of 0.91g cm-3,
by Basell Orlen Polyolefins, Poland;
Polypropylene (3), Hostalen H 2150 (PPH) having melt flow index, MFI, of 0.3
g/10min (for 230 oC, 2.16 kg according to ISO 1133 standard) and density, d, of 0.90
g cm-3, by LyondellBasell, the Netherlands;
Polypropylene (4), Adstif HA840K (PPA) having melt flow index, MFI, of 3.5
g/10min (for 230 oC, 2.16 kg according to ISO 1133 standard) and density, d, of 0.90
g cm-3, by LyondellBasell, the Netherlands;
Low density polyethylene, Lupolen 1810D (LDPE) having melt flow index, MFI,
of 0.1–0.3 g/10min (for 190 oC, 2.16 kg according to ISO 1133 standard) and density, d, of
0.92 g cm-3, by LyondellBasell, the Netherlands;
High density polyethylene, S-2203 (HDPE) having melt flow index, MFI, of 0.03
g/10min (for 190 oC, 5 kg according to ISO 1133 standard) and density, d, of 0.97 g cm-3;
Atactic polystyrene, a-PS (PS) having weight-average molecular weight, Mw, of
120-250 kg mol-1 and density, d, of 1.05 g cm-3, by Polysciences, Inc., USA;
Polytetrafluoroethylene (1), Teflon PTFE 7C (7C) having average particle size of
28 µm and melting peak temperature, Tm, of 346 oC, by DuPont, USA;
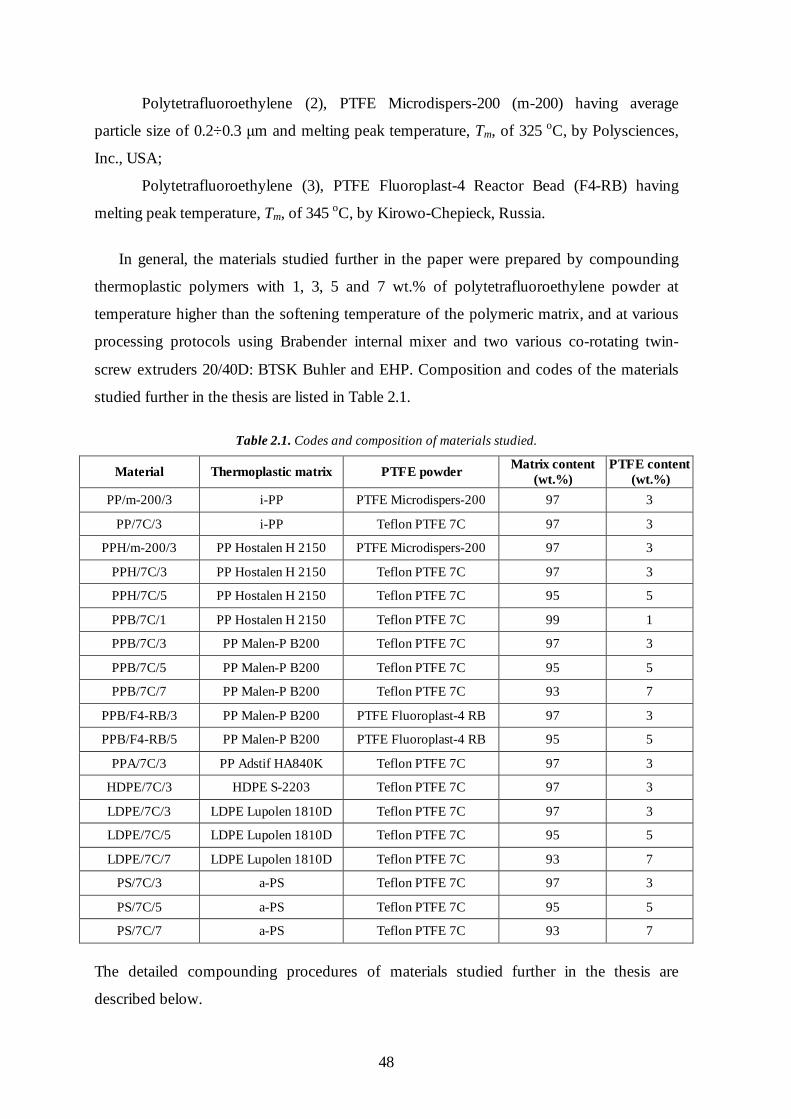
48
Polytetrafluoroethylene (2), PTFE Microdispers-200 (m-200) having average
particle size of 0.2÷0.3 µm and melting peak temperature, Tm, of 325 oC, by Polysciences,
Inc., USA;
Polytetrafluoroethylene (3), PTFE Fluoroplast-4 Reactor Bead (F4-RB) having
melting peak temperature, Tm, of 345 oC, by Kirowo-Chepieck, Russia.
In general, the materials studied further in the paper were prepared by compounding
thermoplastic polymers with 1, 3, 5 and 7 wt.% of polytetrafluoroethylene powder at
temperature higher than the softening temperature of the polymeric matrix, and at various
processing protocols using Brabender internal mixer and two various co-rotating twin-
screw extruders 20/40D: BTSK Buhler and EHP. Composition and codes of the materials
studied further in the thesis are listed in Table 2.1.
Table 2.1. Codes and composition of materials studied.
Material Thermoplastic matrix PTFE powder Matrix content (wt.%)
PTFE content (wt.%)
PP/m-200/3 i-PP PTFE Microdispers-200 97 3
PP/7C/3 i-PP Teflon PTFE 7C 97 3
PPH/m-200/3 PP Hostalen H 2150 PTFE Microdispers-200 97 3
PPH/7C/3 PP Hostalen H 2150 Teflon PTFE 7C 97 3
PPH/7C/5 PP Hostalen H 2150 Teflon PTFE 7C 95 5
PPB/7C/1 PP Hostalen H 2150 Teflon PTFE 7C 99 1
PPB/7C/3 PP Malen-P B200 Teflon PTFE 7C 97 3
PPB/7C/5 PP Malen-P B200 Teflon PTFE 7C 95 5
PPB/7C/7 PP Malen-P B200 Teflon PTFE 7C 93 7
PPB/F4-RB/3 PP Malen-P B200 PTFE Fluoroplast-4 RB 97 3
PPB/F4-RB/5 PP Malen-P B200 PTFE Fluoroplast-4 RB 95 5
PPA/7C/3 PP Adstif HA840K Teflon PTFE 7C 97 3
HDPE/7C/3 HDPE S-2203 Teflon PTFE 7C 97 3
LDPE/7C/3 LDPE Lupolen 1810D Teflon PTFE 7C 97 3
LDPE/7C/5 LDPE Lupolen 1810D Teflon PTFE 7C 95 5
LDPE/7C/7 LDPE Lupolen 1810D Teflon PTFE 7C 93 7
PS/7C/3 a-PS Teflon PTFE 7C 97 3
PS/7C/5 a-PS Teflon PTFE 7C 95 5
PS/7C/7 a-PS Teflon PTFE 7C 93 7
The detailed compounding procedures of materials studied further in the thesis are
described below.

49
(a) Polypropylene (i-PP), high density polyethylene (HDPE S-2203) with PTFE
powder (Teflon PTFE 7C and PTFE Microdispers-200): Polytetrafluoroethylene
powder was finely grounded in a homogenizer at the temperature of liquid nitrogen,
then added to the polypropylene powder in the amount of 3 wt.%. The mixture of
powders was compounded in the Brabender internal mixer at 200 oC and 120 rev.
min-1 for 15 min. Neat polypropylene was processed in the similar conditions in
order to apply the same thermo-mechanical history as for the materials with
polytetrafluoroethylene. Compounding procedure described above was also utilized
for the preparation of high density polyethylene-based materials with
polytetrafluoroethylene, however the compounding temperature of 170 oC was
applied in order to maintain high viscosity of the matrix during processing.
(b) Polypropylene (PP Hostalen H 2150; PP Malen-P B200) with
polytetrafluoroethylene powder (Teflon PTFE 7C; PTFE Microdispers-200 and
PTFE Fluoroplast-4 RB): Polypropylene was melted in the Brabender internal
mixer. Then polytetrafluoroethylene powder was added to the molten polymer in
the amount of 1, 3, 5 and 7 wt.%, respectively. The polytetrafluoroethylene powder
was compounded with polypropylene at 200 oC and 120 rev. min-1 for 10 or 15
min. Neat polypropylene was processed at the similar conditions in order to apply
the same thermo-mechanical history as for the materials with PTFE.
(c) Low density polyethylene (LDPE Lupolen 1810D), atactic polystyrene (a-PS) with
polytetrafluoroethylene powder (Teflon PTFE 7C): Low density polyethylene was
melted in the Brabender internal mixer. Then polytetrafluoroethylene powder was
added to the molten polymer in the amount of 3, 5 and 7 wt.%, respectively. The
PTFE powder was compounded with low density polyethylene at 170 oC and 120
rev. min-1 for 15 min. Neat low density polyethylene was processed at the similar
conditions in order to apply the same thermo-mechanical history as for the
materials with polytetrafluoroethylene. Compounding procedure described above
was also utilized for the preparation of atactic polystyrene-based materials with
polytetrafluoroethylene.
(d) Polypropylene (PP Hostalen H 2150) with polytetrafluoroethylene powder (Teflon
PTFE 7C): Polypropylene pellets were covered with polytetrafluoroethylene
powder in the amount of 5 wt.% and then compounded using co-rotating twin-
screw extruder, type BTSK 20/40D operating at 250 rev. min-1. The temperature
profile of 215, 230, 230, 230 and 200 oC was applied. Neat polypropylene was

50
processed at the similar conditions in order to apply the same thermo-mechanical
history as for the materials with polytetrafluoroethylene.
(e) Polypropylene (PP Adstif HA840K) with polytetrafluoroethylene powder (Teflon
PTFE 7C): Polypropylene pellets were transformed to a powder form by two-step
process: dissolution in hot toluene, and then precipitation in methanol. Afterwards,
the dried polypropylene powder was used to produce masterbatch containing 20
wt.% of polytetrafluoroethylene in the Brabender internal mixer at 200 oC and 100
rev. min-1 for 10 min. The final material containing 3 wt.% of
polytetrafluoroethylene was prepared by dilution of former masterbatch using co-
rotating twin-screw extruder, type EHP 20/40D operating at 100 rev. min-1. The
temperature profile of 175, 180, 185, 190, 190, 195, 200, 200 and 200 oC was
applied. Neat polypropylene was processed at the similar conditions in order to
apply the thermo-mechanical history as for the material with PTFE.
Processing devices used to produce materials studied further in the thesis are described
below:
(a) Brabender internal mixer consists of a mixer backstand with gear unit and a mixer
bowl. It is equipped with two counter-rotating rotors (roller blades type W50 E).
Volume of the mixer bowl is approx. 55 cm3. The special shape of the rotors as well as
the tight clearance between rotors and mixing chamber guarantee an intensive, high
shear mixing.
(b) Co-rotating twin-screw extruder BTSK 20/40D (Buhler, Germany). The screws are 20
mm in diameter and possess a length/diameter ratio equal to 40. The segmented screw
in configuration of K3 consists of 30 segments, including 8 starting segments and 6
final segments of the same size and shape. Segments from 9 to 24 (double-winded
transporting segments and mixing shearing segments) perform intensive plasticization
in the II zone and intensive mixing in III zone. The extruder contains five heating
zones.
(c) Co-rotating twin-screw extruder EHP 20/40D (Zamak, Poland). The screws are 20 mm
in diameter and possessed a length/diameter ratio equal to 40. The segmented screw
consists of 17 segments, including 2 starting and 1 final segment of the same size and
shape. Segments from 3 to 16 (double-winded transporting segments and mixing
shearing segments) perform intensive plasticization in the II zone and intensive mixing
in III zone. This extruder contains nine heating zones.

51
Materials prepared in Brabender internal mixer were collected in the form of billets which
were further cut into smaller pieces using metal-cutting machine, while materials produced
using co-rotating twin screw extruders, both BTSK and EHP, were extruded out from the
die in the form of continuous strand. The strand after air cooling was cut into small pellets
(granules) using pelleting machine (PROMA).
2.2 Apparatus and experimental techniques
Results presented further in the paper were obtained on the basis of a number of
research methods and techniques. Measuring instruments used to characterize materials
which are the subject of the paper included a scanning electron microscope (SEM), tensile,
compression and impact testing machines, rotational rheometer (ARES), wide-angle X-ray
diffractometer (WAXS), differential scanning calorimeter (DSC), polarized light
microscope (PLM) and dynamic mechanical thermal analyzer (DMTA).
2.2.1 Scanning Electron Microscopy (SEM)
The bulk morphology of samples was studied by means of scanning electron
microscopy (SEM) using a microscope JEOL JSM 5500LV. The 1 mm thick films were
prepared by compression molding at 190 oC for polypropylene-based materials and 170oC
for both low density polyethylene, high density polyethylene, and atactic polystyrene-
based materials. Afterwards, all samples were solidified between two metal blocks. In
order to display the internal structure of samples, two separate methods were applied:
etching of polymeric matrix and fracture of samples at temperature of liquid nitrogen. The
film for etching was first cut with an ultramicrotome (Power Tome XL, Boeckeler
Instruments, Inc.) equipped with a glass knife, in order to expose a flat and smooth cross-
section surface. The exposed surfaces of the material were then etched for 45 days at room
temperature in permanganic etchant according to the procedure proposed by Olley et al.
[Olley, 1982]. It must be mention that PTFE is resistant to permanganic etching, only
polyolefins are susceptible to etching. The purpose of such prolonged etching was to reveal
large fragments of PTFE nanofibers. The etching solution was composed of potassium
permanganate, KMnO4 (0.7 wt.%) dissolved in a mixture of concentrated sulphuric acid,
H2SO4 (95 %), orthophosphoric acid, H3PO4 (85 %) and distilled water in the volume ratio
5/4/1. To improve etching, the mixture was placed in an ultrasonic bath running
periodically for short time periods during the etching process (for approximately 5 min

52
every 1 hour). After completion of etching, the sample was immersed into four tubes in the
following order: with diluted sulphuric acid (sulphuric acid/water 2/7 vol), perhydrol,
distilled water and acetone. Washing was run in the presence of ultrasounds, so as to
ensure more efficient transport from/to the surface of impurities/liquids.
The cryogenic fracture was also used to display the internal surface of samples. In this
method a piece of sample placed between pliers was immersed into a vessel containing a
liquid nitrogen (LN2). After 60 min, the sample was fractured inside vessel and left to dry
heat to room temperature.
Afterwards, exposed surfaces of samples were coated with a fine gold layer (about
20 nm) by ion sputtering (JEOL JFC-1200) and examined with SEM in a high vacuum
mode at the accelerating voltage of 10 kV. Microscopic images were created using
secondary electron detector (SEI).
2.2.2 Mechanical properties
Tensile Testing. Uniaxial tensile drawing of the selected materials was assessed
using a testing machine (Instron 5582) with load range of 0-100 kN. The oar-shaped
samples according to ISO 527-2 1BA standard were cut out from 1 mm thick films non-
isothermally crystallized in the conditions analogous to those used to prepare the materials
for morphology studies. The samples with the gauge length of 25 mm were applied. All
measurements were performed at the room temperature. In order to characterize tensile
properties of materials, two tests with different cross-head speeds were performed. For
determination modulus of elasticity, E, an extensometer with a gauge length of 25 mm and
an accuracy of 1 % was utilized. A cross-head speed of 1 mm min-1 which corresponds to
strain rate of 4 % min-1 was applied. The tensile properties were measured at the cross-
head speed of 5 mm min-1 corresponding to strain rate of 20 % min-1. The modulus of
elasticity and selected tensile parameters of studied materials were determined on the basis
of recorded stress-strain curves.
Compression Testing. The samples of polytetrafluoroethylene were uniaxially
compressed in order to determine their mechanical behavior. The 15 mm × 20 mm × 13
mm rectangular prisms were cut out from the samples prepared by: (a) sintering of
polytetrafluoroethylene powder in dedicated brass mould at 290 oC and 2×10⁷ Pa for 3 h,
and (b) melting at 360 oC for 3 h and subsequent non-isothermal crystallization. The
compression tests were carried out using testing machine (Instron 5582), sample stabilizing

53
fixture and compression plates. The specimens were uniaxially compressed in a special
device with initial compression rate of 0.5 mm min-1 at room temperature. The
compressive yield stress, σy, was determined at the intersection of measured stress-strain
curve and a straight line parallel to initial slope of the curve and offset by 2 % of strain.
Impact Testing. Izod impact measurements of selected materials were performed
using instrumented impact tester (Resil 5.5, CEAST S.p.A.). The 80 mm × 10 mm × 4 mm
bar-like specimens according to ISO 180/1A standard were injection molded by means of a
5 g laboratory injection molding machine (PROMA, Poland) at 4.5×10⁵ Pa and 200 oC for
polypropylene-based materials and 170 oC for both atactic polystyrene and low density
polyethylene-based materials. Later, the notch type A with a base radius of 0.25 mm was
cut into the samples in order to achieve a stress concentration as well as an increase in
crack propagation rate at the front of the crack tip. Notched samples were tested in Izod
configuration using pendulum hammer with nominal impact energy of 4 J and impact
velocity of 3.5 m s-1. Izod impact strength, UI, was determined as an impact energy
absorbed in breaking a notched specimen, referred to the original cross-sectional area of
the specimen at the notch.
2.2.3 Instruments for rheological tests
Linear viscoelasticity. The small-amplitude oscillatory measurements of selected
materials were executed using a strain-controlled rheometer (ARES LS2, TA Instruments)
with both a torque transducer (0.02÷2000 g cm) and a normal force transducer (2–2000 g).
Parallel plates with diameter of 25 mm and the gap distance kept in the range of 0.8-0.9
mm were applied. The disk-shaped samples were cut out from 1 mm thick films prepared
by compression molding at 200 °C. The boundaries of the linear regime over which the
storage modulus, G’, and loss modulus, G’’ , are independent on the strain amplitude were
determined by running the strain amplitude sweeps from 0.1 to 10 % at different
frequencies on each sample. The main oscillatory measurements were performed by
running the frequency sweeps from 0.01 to 100 rad s-1 at 190 °C and 0.5 % of strain.
Steady shear. Simple shear measurements of selected materials were performed
using the ARES rheometer described above. Parallel plates in diameter of 25 mm with the
gap distance kept in the range of 0.8÷0.9 mm were applied. Disk-shaped samples were cut
out from 1 mm thick films prepared by compression molding at 200 °C and subjected to
shearing with the rate of 4 s-1 at various temperatures ranging from 200 to 230 oC until the
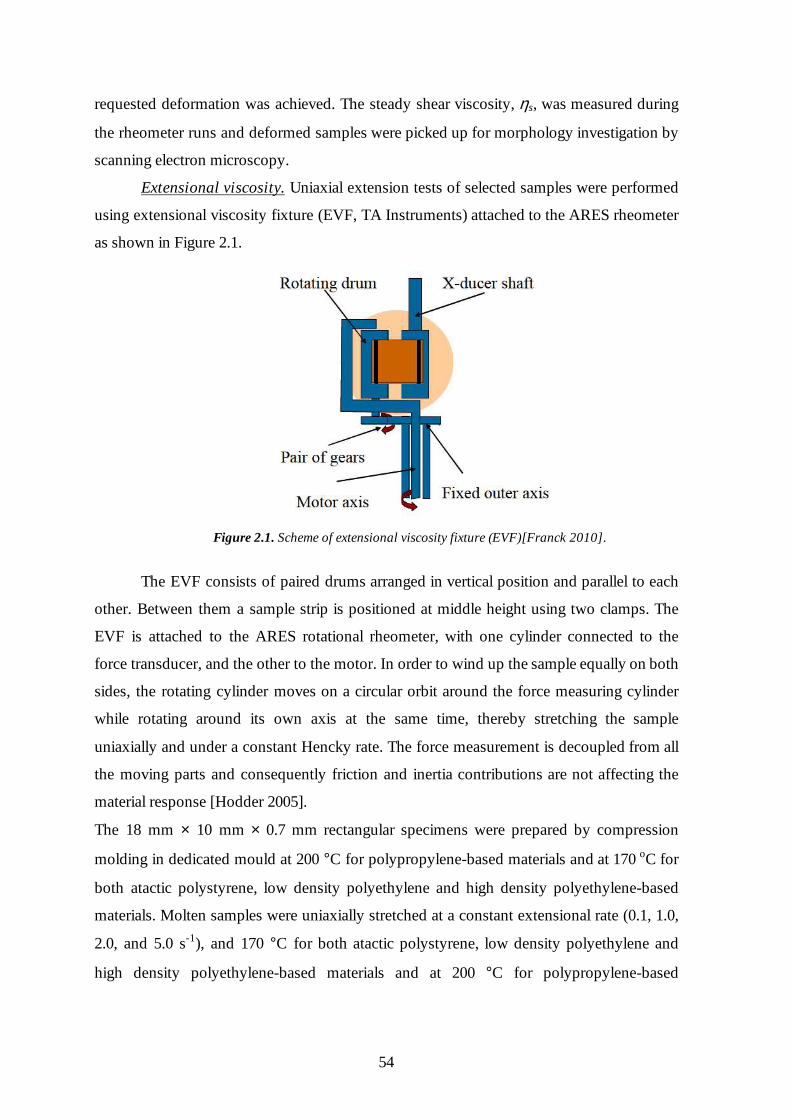
54
requested deformation was achieved. The steady shear viscosity, ηs, was measured during
the rheometer runs and deformed samples were picked up for morphology investigation by
scanning electron microscopy.
Extensional viscosity. Uniaxial extension tests of selected samples were performed
using extensional viscosity fixture (EVF, TA Instruments) attached to the ARES rheometer
as shown in Figure 2.1.
Figure 2.1. Scheme of extensional viscosity fixture (EVF)[Franck 2010].
The EVF consists of paired drums arranged in vertical position and parallel to each
other. Between them a sample strip is positioned at middle height using two clamps. The
EVF is attached to the ARES rotational rheometer, with one cylinder connected to the
force transducer, and the other to the motor. In order to wind up the sample equally on both
sides, the rotating cylinder moves on a circular orbit around the force measuring cylinder
while rotating around its own axis at the same time, thereby stretching the sample
uniaxially and under a constant Hencky rate. The force measurement is decoupled from all
the moving parts and consequently friction and inertia contributions are not affecting the
material response [Hodder 2005].
The 18 mm × 10 mm × 0.7 mm rectangular specimens were prepared by compression
molding in dedicated mould at 200 °C for polypropylene-based materials and at 170 oC for
both atactic polystyrene, low density polyethylene and high density polyethylene-based
materials. Molten samples were uniaxially stretched at a constant extensional rate (0.1, 1.0,
2.0, and 5.0 s-1), and 170 °C for both atactic polystyrene, low density polyethylene and
high density polyethylene-based materials and at 200 °C for polypropylene-based

55
materials. The transient extensional viscosity, ηE+ , as a function of extensional time at a
constant strain rate was determined.
Shear viscosity. Transient shear measurements of selected samples were executed
using rheometer ARES described above. Cone-plate geometry with diameter of 25 mm, the
cone angle of 0.1 rad and actual gap distance of 0.46 mm was applied. Disk-shaped
samples were cut out from 1 mm thick films prepared by compression molding at 200 °C
for polypropylene-based materials and 170 oC for high density polyethylene-based
materials. Data of the transient shear viscosity, ηS+ , were collected during shearing of
molten samples at the strain rate of 0.01 s-1 and 170 °C for high density polyethylene-based
materials and 200 °C for polypropylene-based materials. Trouton ratio, Tr, was estimated
as the ratio of the transient extensional viscosity to the transient shear viscosity at a total
strain achieved.
2.2.4 Wide-Angle X-ray Scattering (WAXS)
The crystalline structure of materials was probed by wide-angle X-ray scattering.
Computer controlled wide-angle goniometer coupled to a Philips PW3830 sealed-tube X-
ray generator operating at 30 kV and 50 mA was used. The X-ray beam consisted of Cu Kα
radiation Ni-filtered. The samples for WAXS measurements were prepared from 1 mm
thick films non-isothermally crystallized in the conditions analogous to those used to
produce the materials for morphological and mechanical studies. 2θ scans were collected
both in reflection and transmission mode with a divergence angle of 0.05o.
2.2.5 Differential Scanning Calorimetry (DSC)
Melting and non-isothermal crystallization of selected materials were performed by
means of differential scanning calorimetry (DSC) using an indium-calibrated TA
Instruments 2920 calorimeter. 1 mm thick films were prepared by compression molding in
the conditions analogous to those used to produce the materials for morphology and
mechanical studies. Samples of weight 6÷10 mg were heated at the rate of 10 oC min-1 to
220 oC, annealed for 3 min and then cooled at the rate of 10 oC min-1 to room temperature.
The entire thermal treatment was performed under nitrogen flow.
The melting peak temperature, Tm, and crystallization peak temperature, Tc, of the
samples were determined from recorded DSC thermograms as a maximum value of

56
endothermic and exothermic peaks, respectively. The degree of crystallinity, C, was
estimated from the heat of melting according to a formula:
CH
Hm
m
= ∆∆ 0 (2.1)
where ∆Hm is the measured heat of melting of the sample and ∆Hm0 is the heat of melting
of 100 % crystalline material. In this study, ∆Hm0 of 82 J g-1 for polytetrafluoroethylene
[Lau 1984], 293 J g-1 for polyethylene [Wunderlich 1977], and 177 J g-1 for polypropylene
[Li 1999] has been assumed.
Polytetrafluoroethylene powders were characterized by DSC during heating to 400 oC and cooling to room temperature, followed by subsequent heating. Both the cooling and
heating rate of 10 oC min-1 was applied. The entire thermal treatment was performed under
nitrogen flow. The melting peak temperature, Tm1 and Tm2, crystallization peak
temperature, Tc, degree of crystallinity, C1 and C2, were calculated on the basis of DSC
thermograms.
Differential scanning calorimetry was also used to study isothermal crystallization
of neat isotactic polypropylene and isotactic polypropylene with polytetrafluoroethylene. 1
mm thick films were prepared by compression molding at conditions analogous to those
used to produce the materials for morphology and mechanical studies. Samples of 6-10 mg
were heated at the rate of 10 oC min-1 to 220 oC, annealed for 3 min and then cooled at the
rate of 10 oC min-1 to pre-selected crystallization temperature of 128 oC or 145 oC,
respectively. The entire thermal treatment was performed under nitrogen flow. Afterwards,
10 µm thin sections of selected isothermally crystallized samples were examined by
polarized light microscopy (PLM). Conversion degree, α(t) was calculated based on DSC
thermograms recorded during isothermal crystallization.
2.2.6 Polarized Light Microscopy (PLM)
Isothermal crystallization of selected materials was studied by polarized light
microscopy (PLM) in quiescent state using a Linkam hot stage CSS450 mounted on a
Nikon Eclipse 80i light microscope. 30 µm thick films were placed between microscope
glass slides, heated to 220 oC, annealed for 3 min and then cooled at the rate of 30 oC min-1
to pre-selected crystallization temperature of 132 oC and 138 oC, respectively. The
isothermal crystallization was monitored and recorded by a camera connected to a PC class
57
computer with a frame grabber card. All isothermal crystallization measurements were
performed under nitrogen flow.
Additionally, thin films of selected materials were non-isothermally crystallized
with free surface using a Linkam hot stage CSS450. The 70 µm thick samples were heated
at the rate of 30 oC min-1 to 220 oC, annealed for 3 min and then cooled at the rate of 10 oC
min-1 to room temperature. Afterwards, the non-isothermally crystallized samples were
picked up for morphology investigation by SEM.
2.2.7 Dynamic Mechanical Thermal Analysis (DMTA)
Dynamic mechanical thermal measurements of selected materials were conducted
using DMTA MkIII apparatus (Rheometric Scientific Inc.) in a double cantilever bending
mode at the frequency of 1 Hz and heating rate of 2 °C min-1, in the temperature range
from -100 to 100 oC for polypropylene-based materials and -100 oC to 140 oC for atactic
polystyrene-based materials. The 30 mm × 10 mm rectangular specimens were cut out
from 1 mm thick films non-isothermally crystallized in the conditions analogous to those
used to produce the materials for morphological, thermal and mechanical studies. The
storage modulus, E’, and loss modulus, E’’ , as a function of temperature were recorded
during DMTA runs.

58
Chapter 3 Results and Discussion
3.1 Nascent polytetrafluoroethylene powders
Some semicrystalline polymers like polyethylene, PE, or poly(vinylidene fluoride),
PVDF, are able to crystallize in a chain-extended fashion under elevated pressure [Philips
1990]. Polytetrafluoroethylene, PTFE, can also possess either chain-folded or chain-
extended crystals depending on the conditions of crystallization process. Melting of
semicrystalline polymers with very high molecular weight (Mw≥106), like ultra high
molecular weight polyethylene, UHMWPE, and polytetrafluoroethylene leads to the
systems with high concentration of entanglements. Experimental observations revealed that
chain-folded crystals “explode” upon melting [Barham 1991]. Once the constraints (lattice
forces) are removed by melting, folded molecules expand rapidly, driven by the need to
increase its entropy. Chain segments are then ejected with a high kinetic energy into the
already molten surrounding and interlace with other chains rapidly leading to significant
increase of the number of entanglements.
During crystallization entanglements are rejected to the amorphous phase. In the
case of PTFE much less entangled system with either fully or nearly chain-extended
crystals can be obtain by the crystallization during polymerization. While decreasing the
polymerization temperature well below the crystallization temperature, the polymerization
rate becomes lower than the crystallization rate and it is possible to reach the state when
growing chains are separated from each other while crystallization proceeds
simultaneously with polymerization. This results in an independent growth of
monomolecular crystals - a single chain forming a single crystal. Polymer crystals grown
during polymerization are called nascent or as-polymerized crystals [Wunderlich 1976].
Three different polytetrafluoroethylene powders were used in these studies. Two nascent
powders: Teflon PTFE 7C (7C) and PTFE Fluoroplast-4 Reactor Bead (F4-RB) and dried
aqueous dispersion of polytetrafluoroethylene: PTFE Microdispears-200 (m-200). The
morphology of polytetrafluoroethylene powders was examined by scanning electron
microscopy. SEM micrographs of PTFE powders with appropriate diagrams of particle

59
c
b
a
size distribution are presented in Figure 3.1. The diagrams were based on counting
particles in several SEM images.
Figure 3.1. SEM images of polytetrafluoroethylene powders studied with diagrams of PTFE particle size distribution: (a) Teflon PTFE 7C, (b) PTFE Fluoroplast-4 RB, and (c) PTFE Microdispers-200.
Manufacturer of as-polymerized polytetrafluoroethylene 7C states that this powder
consists of spherical particles with an average size of 28 µm. However, the morphology
studies revealed that 7C, shown in Figure 3.1a, contains two populations of particles: a flat
ellipsoidal particles with length in the range between 20 and 60 µm and a flaky fibrillar

60
particles having length in the range from 90 to 200 µm. This difference in morphology of
polytetrafluoroethylene powder 7C arises from pretreatment of the producer (Dupont Co.)
of as-polymerized powder by rolling.
Second nascent PTFE powder F4-RB contains spherical and flaky particles with different
lengths ranging from 30 up to 600 µm as shown in Figure 3.1b.
The dominant population of polytetrafluoroethylene particles in m-200, prepared by drying
the aqueous dispersion of PTFE are particles with sizes of 0.2-0.3 µm and aggregates of
polytetrafluoroethylene smaller than 5 µm. Aggregates larger than 55 µm are also observed
in Figure 3.1c.
The thermal properties of so-called virgin polytetrafluoroethylene, i.e. the polymer
which has never been heated above the melting temperature after polymerization, were
studied by means of differential scanning calorimetry. Figure 3.2 shows exemplary DSC
thermograms of virgin, as-polymerized PTFE powder F-4 RB with melting and
crystallization peaks recorded during heating, and cooling. The melting of as-polymerized
PTFE is at high temperature, above equilibrium melting temperature, Tm0 , and is very
strong suggesting high degree of crystallinity. Tm0 was determined by different authors
being in the range between 332 and 336 oC [Lau 1984; Bassett 1974; Pucciariello 1999].
Crystallization peak during cooling is at much lower temperature, the subsequent melting
differs significantly from the first melting: the melting temperature is significantly lower
than Tm0 . Similar behavior is exhibited by PTFE 7C. PTFE dispersion m-200 shows first
melting peak at lower temperature and the peak is lower. The calorimetric data of all three
studied polytetrafluoroethylene powders are collected in Table 3.1, where Tm1, Tm2, and
∆Hm1, ∆Hm2 denote the melting peak temperature and the melting enthalpy during the first
and the second heating, respectively, whereas Tc, denotes the crystallization peak
temperature. The degrees of crystallinity, C1 and C2, were calculated from the eq. 2.1, on
the basis of the heat required to melt the sample, ∆Hm1 and ∆Hm2, respectively, assuming
the heat of melting of 100 % crystalline polytetrafluoroethylene of 82 J·g-1 [Lau 1984].
Polytetrafluoroethylene powder m-200 shows the melting peak temperature, Tm1,
lower than both Tm2 and the equilibrium melting temperature, Tm0 . It is known that the
polymer crystals with chain folding are not equilibrium crystals.

61
Figure 3.2. DSC thermograms of virgin polytetrafluoroethylene powder F4-RB: (1) the first heating,
(2) the first cooling, and (3) the second heating. The thermograms were shifted for clarity.
Their melting peak temperature, Tm, determined from Gibbs-Thomson equation
[Wunderlich 1980] expressed as
T TH lm m
e
m
= − ⋅
0 12 1σ∆
(3.1)
where σe is the basal surface free energy, l is the lamellae thickness, and ∆Hm is the
enthalpy of fusion per unit volume of crystal, Tm is lower than the equilibrium melting
temperature of infinitely thick crystal, Tm0 , by the magnitude inversely proportional to the
their thickness.
Table 3.1. Thermal properties of polytetrafluoroethylene powders used in the studies.
PTFE Tm1 [oC] Tm2 [oC] Tc [oC] ∆∆∆∆Hm1 [J g-1] ∆∆∆∆Hm2 [J g-1] C1 [%] C 2 [%]
m-200 325.1 325.9 313.1 73.0 69.7 89.1 85.0 7C 345.7 327.8 315.2 77.7 39.0 94.7 47.6
F4-RB 344.6 327.6 314.0 75.8 34.7 92.4 42.3
The melting peak temperature, Tm1, of both virgin polytetrafluoroethylene powders: 7C and
F4-RB exceeds their Tm2, and is above Tm0 . Such high melting peak temperature, Tm1, of
nascent polytetrafluoroethylene was measured by others [Bassett 1974; Toda 2002;
Pucciariello 2004] and interpreted as superheating of chain-extended crystals. The most
stable state are crystals built from the extended polymer chains. Such thick crystals being
unable to melt sufficiently quickly during heating at high heating rates, hence their interior
are heated above the equilibrium melting point.
In all cases, ∆Hm1 exceeds ∆Hm2 indicating the high degree of crystallinity of
polytetrafluoroethylene powders developed during polymerization, being in the range
between 89 and 95 %.

62
It can be concluded on the basis of above results that polytetrafluoroethylene
powder m-200 obtained by drying the aqueous dispersion of PTFE particles is composed
of chain-folded crystals. While the conditions used to polymerize tetrafluoroethylene, TFE,
enabled the synthesis of polytetrafluoroethylene powders (7C and F4-RB) with large
crystals in chain-extended fashion without significant entanglements. It is expected that
such crystals will deform easily.
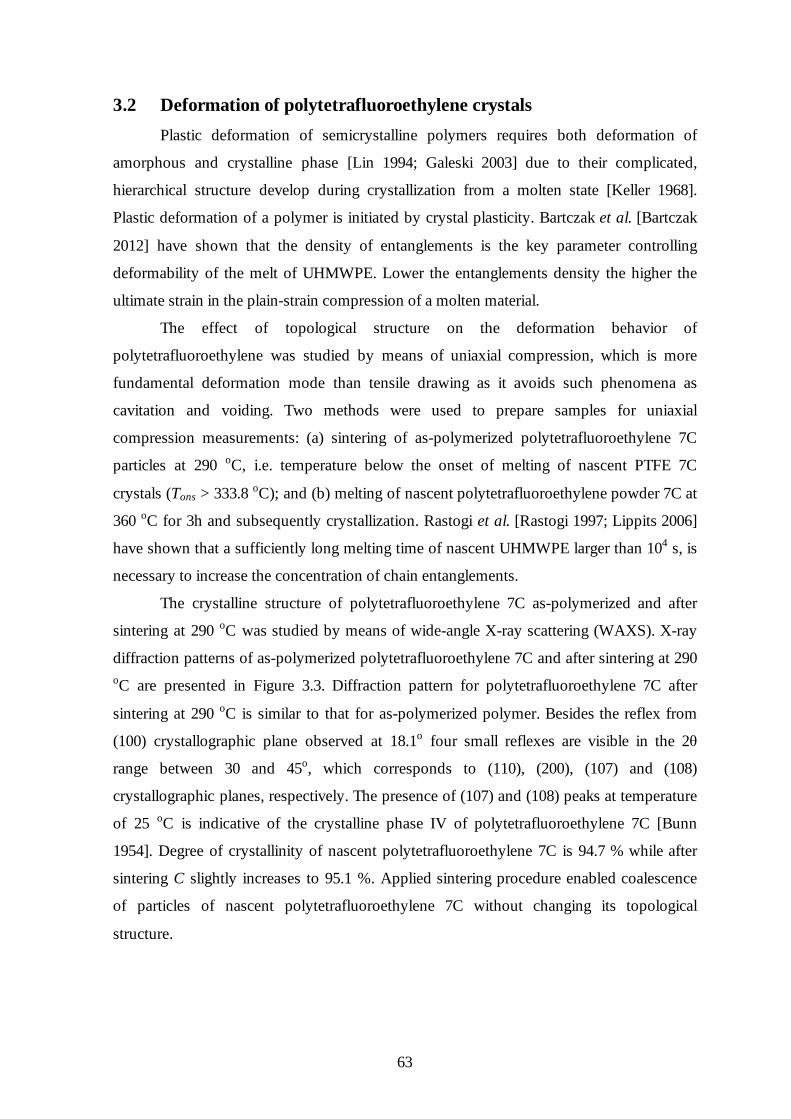
63
3.2 Deformation of polytetrafluoroethylene crystals
Plastic deformation of semicrystalline polymers requires both deformation of
amorphous and crystalline phase [Lin 1994; Galeski 2003] due to their complicated,
hierarchical structure develop during crystallization from a molten state [Keller 1968].
Plastic deformation of a polymer is initiated by crystal plasticity. Bartczak et al. [Bartczak
2012] have shown that the density of entanglements is the key parameter controlling
deformability of the melt of UHMWPE. Lower the entanglements density the higher the
ultimate strain in the plain-strain compression of a molten material.
The effect of topological structure on the deformation behavior of
polytetrafluoroethylene was studied by means of uniaxial compression, which is more
fundamental deformation mode than tensile drawing as it avoids such phenomena as
cavitation and voiding. Two methods were used to prepare samples for uniaxial
compression measurements: (a) sintering of as-polymerized polytetrafluoroethylene 7C
particles at 290 oC, i.e. temperature below the onset of melting of nascent PTFE 7C
crystals (Tons > 333.8 oC); and (b) melting of nascent polytetrafluoroethylene powder 7C at
360 oC for 3h and subsequently crystallization. Rastogi et al. [Rastogi 1997; Lippits 2006]
have shown that a sufficiently long melting time of nascent UHMWPE larger than 104 s, is
necessary to increase the concentration of chain entanglements.
The crystalline structure of polytetrafluoroethylene 7C as-polymerized and after
sintering at 290 oC was studied by means of wide-angle X-ray scattering (WAXS). X-ray
diffraction patterns of as-polymerized polytetrafluoroethylene 7C and after sintering at 290 oC are presented in Figure 3.3. Diffraction pattern for polytetrafluoroethylene 7C after
sintering at 290 oC is similar to that for as-polymerized polymer. Besides the reflex from
(100) crystallographic plane observed at 18.1o four small reflexes are visible in the 2θ
range between 30 and 45o, which corresponds to (110), (200), (107) and (108)
crystallographic planes, respectively. The presence of (107) and (108) peaks at temperature
of 25 oC is indicative of the crystalline phase IV of polytetrafluoroethylene 7C [Bunn
1954]. Degree of crystallinity of nascent polytetrafluoroethylene 7C is 94.7 % while after
sintering C slightly increases to 95.1 %. Applied sintering procedure enabled coalescence
of particles of nascent polytetrafluoroethylene 7C without changing its topological
structure.

64
Figure 3.3. Diffractograms 2θ for samples of polytetrafluoroethylene 7C as (1) nascent powder
and (2) after sintering at 290 oC and 2×10⁷ Pa for 3 h, recorded in reflection mode at 25 oC. The WAXS diffractograms were shifted vertically for clarity.
Melt-crystallized polytetrafluoroethylene 7C shows the melting peak temperature (331.7 oC) lower than Tm of nascent polymer which in consequence leads to drastic decrease of the
degree of crystallinity by about 30 % from 94.7 % to 65.1 %. This suggests that applied
method of crystallization causes formation of polytetrafluoroethylene 7C chain-folded
crystals composed of many different chains and entangling of these chains in adjacent
amorphous layers.
Figure 3.4 presents the true stress-compression ratio curves obtained for the
samples of polytetrafluoroethylene 7C after sintering and melt-crystallization deformed by
uniaxial compression. Samples were deformed with the constant compression rate of 0.5
mm min-1 at room temperature.
Figure 3.4. True stress-compression ratio curves of PTFE 7C samples after sintering at 290 oC and melt-
recrystallization at 360 oC deformed at room temperature with the compression rate of 0.5 mm min-1.

65
The compressive yield stress, σy, for sintered nascent PTFE 7C is only about 12.1 MPa at
room temperature, while for melt-crystallized material is 19.5 MPa. Sintered
polytetrafluoroethylene, deformed at room temperature, fractured early at compression
ratio of 0.18, due to poor connectivity between crystals and/ or grains of the powder [see
Bartczak 2012, for similar phenomena in UHMWPE sintered powder]. In contrast, melt-
crystallized sample deformed to 0.72 with a distinct strain hardening stage, leading to
ultimate stress of 137 MPa. The resolved shear stress ,τ , acting under 45o can be
calculated according to the following equation:
τ σ σ= =cos( ) cos( ) /45 45 2o o (3.2)
Hence, to initiate plastic deformation of chain-extended crystals of polytetrafluoroethylene
7C embedded in viscous media (a polymeric matrix) through shearing, the resolved shear
stress of only 6.05 MPa must be reached and exceeded at room temperature. Since crystal
plasticity is thermally activated process, the required resolved shear stress at elevated
temperature will be significantly lower. The higher the temperature the lower the shear
stress for crystal plasticity.

66
3.3 Structure of the nanocomposites with PTFE inclusions
The materials studied further in the paper were generally prepared by compounding
of polytetrafluoroethylene powders with thermoplastic polymers including isotactic
polypropylene, i-PP, high density polyethylene, HDPE, low density polyethylene, LDPE,
and atactic polystyrene, PS, at various processing conditions, which are described in details
in Chapter 2.1. The effect of type of polytetrafluoroethylene powder and thermoplastic
matrix, viscosity of matrix, shear rate and compounding time on the final morphology of
the materials was intensively examined. The results of those studies are presented in the
following subsections.
3.3.1 Type of polytetrafluoroethylene powder
Two nascent polytetrafluoroethylene powders (7C and F4-RB) and dried aqueous
dispersion of PTFE particles (m-200) were compounded with isotactic polypropylene. The
final morphology of prepared materials was examined by scanning electron microscopy.
Figures 3.5a-c presents SEM images of cryogenic fractured samples of polypropylene-
based materials containing 3 wt.% of PTFE m-200, 7C and F4-RB, respectively. In the
case of m-200 used as a filler, aggregates of PTFE particles having longitudinal sizes of
3÷10 µm dispersed in polypropylene matrix are visible (Figure 3.5a). In contrast, when
using nascent polytetrafluoroethylene 7C powder, the final morphology of PPB/7C/3
considerably differs from PP/m-200/3. During compounding nascent 7C powder with
isotactic polypropylene, particles of polytetrafluoethylene are subjected to sufficient
shearing and can be readily deformed and transformed without a melting step into
nanofibers with transverse sizes ranging from 30 to 580 nm (Figure 3.5b). Similar fibrillar
inclusions with transverse sizes in the range from 60 to 650 nm are observed in the
cryogenic fractured surface of PPB/F4-RB/3 nanocomposite (Figure 3.5c).
Formation of nanofibers during shearing of grains of polytetrafluoroethylene
emulsions was noticed in the past [Yang 2005]. Only few authors observed [Van der Meer
2005; Masirek 2007; Bernland 2009] that polytetrafluoroethylene powder added to
thermoplastic polymer including isotactic polypropylene, poly(methylene oxide), POM,
and high density polyethylene can transform to a network of fibers, in the form of bunches
and bundles. Those studies aimed at optimizing the nucleation of crystallization of PP,
POM and PE by PTFE. But untill now, no one has determined the critical conditions for

67
a b
c
fibrillation of polytetrafluoroethylene and the mechanism responsible for deformation of
PTFE crystals into form of nanofibers.
Figure 3.5. SEM micrographs of cryogenic fractured samples of isotactic polypropylene-based
materials: (a) PP/m-200/3, (b) PPB/7C/3, and (c) PPB/F4-RB/3.
In contrast to polytetrafluoroethylene m-200 with melting peak temperature of
325.1 oC, particles of nascent PTFE powders: 7C and F4-RB exhibiting Tm of 345.7 oC and
344.6 oC respectively, can undergo easy fibrillation by plastic deformation of PTFE chain
extended crystals, directly during compounding with thermoplastic polymers, leading to
polymer nanocomposites with fibrillar nanoinclusions of PTFE. This phenomenon was
observed only for PTFE whose crystals are characterized by high melting temperature, in
this case exceeding the equilibrium melting peak temperature of polytetrafluoroethylene
crystals ( 0mT =332÷336 oC).
The structure of polypropylene-based nanocomposite with polytetrafluoroethylene
nanofibers was also examined by X-ray diffraction. Figure 3.6 presents wide-angle X-ray
(WAXS) diffractograms of neat isotactic polypropylene, PPB, and its nanocomposite with
5 wt.% of PTFE 7C nanofibers recorded in the reflection mode in 2θ range from 10 to 30o.
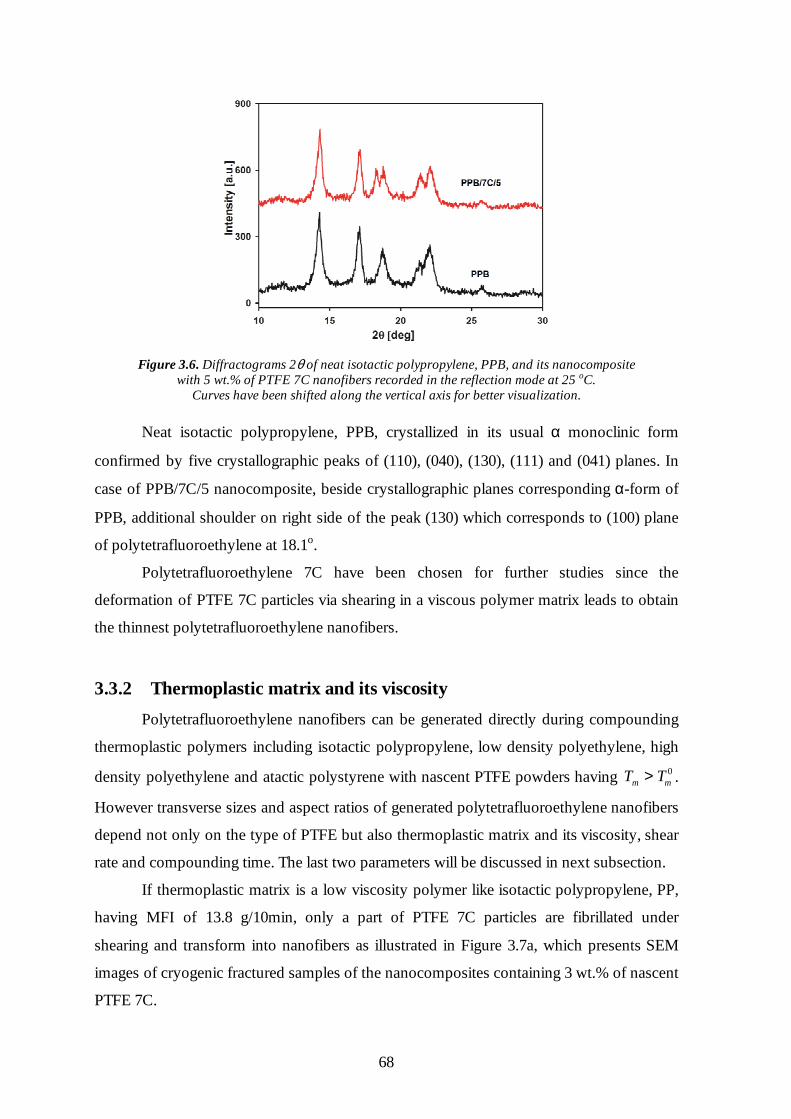
68
Figure 3.6. Diffractograms 2θ of neat isotactic polypropylene, PPB, and its nanocomposite
with 5 wt.% of PTFE 7C nanofibers recorded in the reflection mode at 25 oC. Curves have been shifted along the vertical axis for better visualization.
Neat isotactic polypropylene, PPB, crystallized in its usual α monoclinic form
confirmed by five crystallographic peaks of (110), (040), (130), (111) and (041) planes. In
case of PPB/7C/5 nanocomposite, beside crystallographic planes corresponding α-form of
PPB, additional shoulder on right side of the peak (130) which corresponds to (100) plane
of polytetrafluoroethylene at 18.1o.
Polytetrafluoroethylene 7C have been chosen for further studies since the
deformation of PTFE 7C particles via shearing in a viscous polymer matrix leads to obtain
the thinnest polytetrafluoroethylene nanofibers.
3.3.2 Thermoplastic matrix and its viscosity
Polytetrafluoroethylene nanofibers can be generated directly during compounding
thermoplastic polymers including isotactic polypropylene, low density polyethylene, high
density polyethylene and atactic polystyrene with nascent PTFE powders having T Tm m> 0 .
However transverse sizes and aspect ratios of generated polytetrafluoroethylene nanofibers
depend not only on the type of PTFE but also thermoplastic matrix and its viscosity, shear
rate and compounding time. The last two parameters will be discussed in next subsection.
If thermoplastic matrix is a low viscosity polymer like isotactic polypropylene, PP,
having MFI of 13.8 g/10min, only a part of PTFE 7C particles are fibrillated under
shearing and transform into nanofibers as illustrated in Figure 3.7a, which presents SEM
images of cryogenic fractured samples of the nanocomposites containing 3 wt.% of nascent
PTFE 7C.
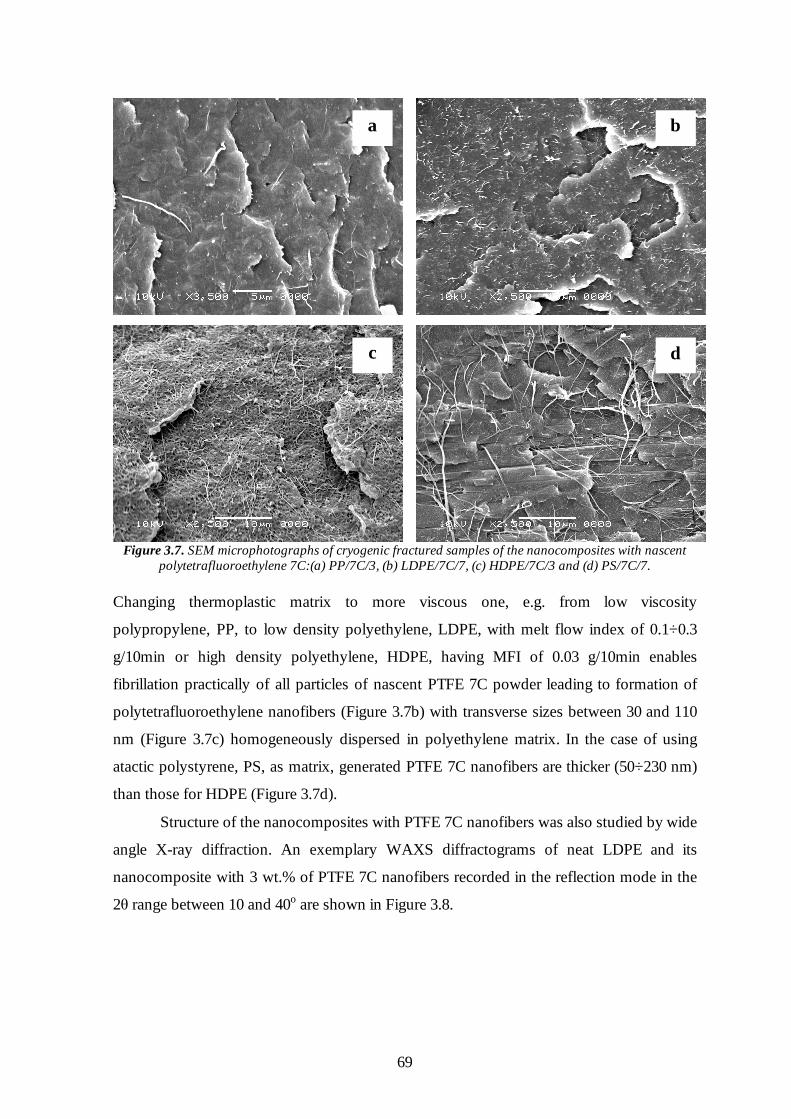
69
Figure 3.7. SEM microphotographs of cryogenic fractured samples of the nanocomposites with nascent polytetrafluoroethylene 7C:(a) PP/7C/3, (b) LDPE/7C/7, (c) HDPE/7C/3 and (d) PS/7C/7.
Changing thermoplastic matrix to more viscous one, e.g. from low viscosity
polypropylene, PP, to low density polyethylene, LDPE, with melt flow index of 0.1÷0.3
g/10min or high density polyethylene, HDPE, having MFI of 0.03 g/10min enables
fibrillation practically of all particles of nascent PTFE 7C powder leading to formation of
polytetrafluoroethylene nanofibers (Figure 3.7b) with transverse sizes between 30 and 110
nm (Figure 3.7c) homogeneously dispersed in polyethylene matrix. In the case of using
atactic polystyrene, PS, as matrix, generated PTFE 7C nanofibers are thicker (50÷230 nm)
than those for HDPE (Figure 3.7d).
Structure of the nanocomposites with PTFE 7C nanofibers was also studied by wide
angle X-ray diffraction. An exemplary WAXS diffractograms of neat LDPE and its
nanocomposite with 3 wt.% of PTFE 7C nanofibers recorded in the reflection mode in the
2θ range between 10 and 40o are shown in Figure 3.8.
a b
c d
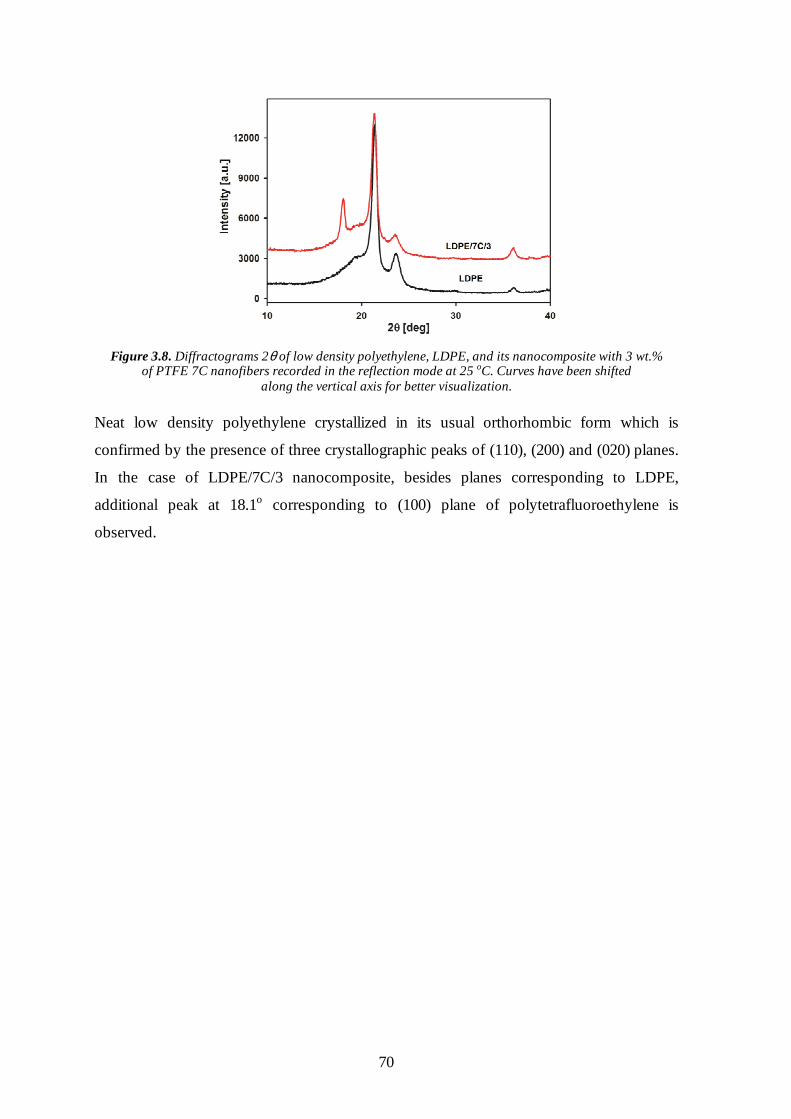
70
Figure 3.8. Diffractograms 2θ of low density polyethylene, LDPE, and its nanocomposite with 3 wt.% of PTFE 7C nanofibers recorded in the reflection mode at 25 oC. Curves have been shifted
along the vertical axis for better visualization.
Neat low density polyethylene crystallized in its usual orthorhombic form which is
confirmed by the presence of three crystallographic peaks of (110), (200) and (020) planes.
In the case of LDPE/7C/3 nanocomposite, besides planes corresponding to LDPE,
additional peak at 18.1o corresponding to (100) plane of polytetrafluoroethylene is
observed.

71
3.3.3 Shear rate and compounding time
The effect of shearing on the final morphology of polypropylene-based
nanocomposites with nascent polytetrafluoroethylene powder was studied by means of
steady shear experiments. Molten samples of isotactic polypropylene, PPB, containing 3
wt.% of PTFE 7C particles were subjected to shearing with the rate of 4 s-1 and the range
of temperatures 200÷230 oC until the requested deformation of the matrix was achieved.
The dependence of steady shear viscosity, ηs, against strain, ε , is shown in Figure 3.9. The
samples after shear experiments were picked up for morphology investigations by scanning
electron microscopy. SEM images of cryogenic fractured samples of PPB/7C/3
nanocomposite, deformed to 10=ε and 5000=ε , are illustrated in Figure 3.10. The
continuous drop of steady shear viscosity for neat isotactic polypropylene, PPB, under
shearing is observed. This is a consequence of the PTFE nanofibers and polypropylene
chains orientation in the direction of shearing. In the case of PPB/7C/3 nanocomposite,
after initial drop of ηs with increasing deformation, the ηs curves are leveling off.
Figure 3.9. Logarithm of steady shear viscosity, ηs, as a function of strain, ε, for neat isotactic
polypropylene, PPB, and its nanocomposite with 3 wt.% of PTFE 7C. Shear rate of 4 s-1 was applied.
As it follows from morphology investigation (Figure 3.10), in the range of strains up to
4000-5000 a strong deformation of polytetrafluoroethylene 7C particles occurs leading to
formation of individual nanofibers. The rate and yield of nanofibers formation is larger for
lower temperatures. For the range of temperatures between 200 and 230 oC and viscosity
range as characteristic for the grade of polypropylene, the deformation above 5000 results
in the drop of steady shear viscosity accompanied by the orientation of PTFE 7C
nanofibers and their occasional fracture.

72
b a
Figure 3.10. SEM microphotographs of cryogenic fractured samples of PPB/7C/3 nanocomposite after shearing at 200 oC and 4 s-1 to a given level of deformation: (a) ε = 10 and (b) ε = 5000.
Samples were fractured parallel to discs radius.
Changing the shear rate within the same compounding device and/or changing the
device, it is possible to affect strongly the final morphology of the polypropylene-based
nanocomposites with nascent polytetrafluoroethylene powders. Figure 3.11 presents SEM
microphotographs of cryogenic fractured samples of isotactic polypropylene-based
nanocomposites with 5 wt. % of PTFE 7C prepared in two different compounding devices:
internal mixer and corrotating twin-screw extruder, at the range of 120÷250 rev. min-1.
Figure 3.11. SEM images of cryogenic fractured samples of isotactic polypropylene-based nanocomposites
with 5 wt.% of PTFE 7C: (a) PPB/7C/5, 120 rev. min-1, Brabender internal mixer type W50E; and (b) PPH/7C/5, 250 rev. min-1, co-rotating twin-screw extruder type BTSK 20/40D.
Flows developing in an internal mixer are extremely complex. Both shear flow and
extensional flow are pronounces, and only simplified assumption that flows are isothermal,
incompressible and creeping allows to derive a formula for average shear rate. Shear rates
acting in chamber of internal mixer can be classified as follows: (i) shear rates are high
between rotor blade crest and chamber wall, (ii) shear rates are in a transition range in the
flanks and (iii) shear rates are low between rotor blade root and chamber wall. The local
a b

73
a b
average shear rates as a function of the local flight width can be calculated from the
following equations [Manas-Zloczower 1994]:
&γ πchamber
c cN D
H= (3.3)
where Nc is the rotor speed, Dc is the diameter of internal mixer chamber, and H is the rotor
clearance. In contrast, the shear rate over the flight in corrotating twin-screw extruder can
be determined from the following equation [Manas-Zloczower 1994]:
δπγ
60ss
flight
DN=& (3.4)
where Ns is the screw speed, Ds is the screw diameter, and δ is the flight clearance.
The average shear rate of 1154 s-1 obtained at the chamber wall in Brabender
internal mixer type W50E operating at 120 rev. min-1, allows to deform PTFE 7C particles
and transform them into nanofibers, however generated chamberγ& is insufficient to obtain the
nanofibers with very high deformation ratios. Preparation of samples for observation in
SEM requires fracture of frozen material. During fracture further limited deformation of
PTFE 7C nanofibers occurs, polytetrafluoroethylene 7C nanofibers are drawn out from the
polypropylene matrix and are observed on the fractured surface of PPB/7C/5
nanocomposite as dangling short fiber ends (Figure 3.11a). Changing the compounding
device to co-rotating twin-screw extruder type BTSK 20/40D operating at 250 rev. min-1
and the average shear rate of 1309 s-1, thinner and stronger PTFE 7C nanofibers are
generated, since only their ends are visible on the surface of cryogenic fractured PPH/7C/5
(Figure 3.11b).
Figure 3.12. SEM image of cryogenic fractured surface of PPB/7C/5 nanocomposite prepared in Brabender internal mixer type W50E operating at 120 rev. min-1
and different time of compounding: (a) 10 min and (b) 15 min.

74
Additionally, the time of compounding is an important parameter affecting the final
morphology of isotactic polypropylene-based nanocomposites with nascent PTFE 7C
powder. Figure 3.12 presents surfaces of cryogenic fractured PPB nanocomposite
containing 5 wt.% of PTFE 7C, which was prepared at different time of compounding.
Longer the time of compounding larger the deformation of PTFE particles at constant
shear rate leading to thinner and stronger polytetrafluoroethylene nanofibers.
Figure 3.13. SEM microphotograph of PPB/7C/5 nanocomposite after 45-day etching
of thin layer of polypropylene. Material was produced by compounding for 15 min in Brabender internal mixer type W50E operating at 120 rev. min-1.
Figure 3.13 shows SEM image of the free surface of PPB/7C/5 nanocomposite after
45-day etching of thin layer polypropylene. It is shown that during compounding nascent
polytetrafluoroethylene 7C powder with isotactic polypropylene at high shear rate (e.g. 120
rev. min-1), sufficiently long compounding time (e.g. 15 min) enables generation of the
entangled network of polytetrafluoroethylene nanofibers.

75
3.4 Thermal properties of the nanocomposites with PTFE inclusions
Semicrystalline polymers can be modified by means of nucleating agents. In general,
presence of a nucleating agent accelerates the crystallization, diminishes the sizes of
spherulites and in case of polyolefins can markedly elevate the crystallization temperature,
which enables to shorten manufacture of a product. Polytetrafluoroethylene in the form of
particles, fibers and films is known to nucleate the crystallization of several semicrystalline
polymers, i.e. isotactic polypropylene, i-PP, polyoxymethylene, POM, and induce their
transcrystalline morphology [Fitchmun 1970; Wittman 1991; Wang 1996; Wang 1999;
Gadzinowska 2003; Van der Meer 2005; Bernland 2009; Masirek 2010].
In this thesis the influence of polytetrafluoroethylene on the crystallization behavior
of various grades of isotactic polypropylene was studied both at non-isothermal and
isothermal conditions. An exemplary DSC cooling thermograms of neat isotactic
polypropylene, PPH, its composite containing 3 wt.% of PTFE particles (PPH/m-200/3)
and its nanocomposite with 3 wt.% of PTFE nanofibers (PPH/7C/3) are shown in Figure
3.14.
Figure 3.14. DSC cooling thermograms of neat isotactic polypropylene and PPH containing 3 wt.% of polytetrafluoroethylene in the form of particles (m-200) and nanofibers (7C). Cooling rate
of 10 oC min-1 was applied. The thermograms have been shifted vertically for clarity.
The calorimetric data for all studied materials are collected in Table 3.2, where Tm and
∆Hm denote the melting peak temperature and melting enthalpy during heating,
respectively, whereas Tc denotes the crystallization peak temperature. Degree of
crystallinity, C, was calculated from ∆Hm assuming the heat of fusion for 100 % crystalline
polypropylene of 177 J g-1 [Li 1999].

76
Table 3.2. Thermal properties of neat isotactic polypropylene and polypropylene with various polytetrafluoroethylene powders.
Material T m [oC] ∆∆∆∆Hm [J g-1] Tc [oC] C [%]
PP 161.8 92.12 109.3 52.0
PP/m-200/3 162.1 89.23 126.1 50.4
PP/7C/3 163.6 91.00 127.5 51.4
PPH 162.3 91.07 117.9 51.5
PPH/m-200/3 162.3 88.36 124.1 49.9
PPH/7C/3 162.2 89.29 127.3 50.4
PPB 163.1 91.45 116.6 51.7
PPB/7C/3 163.3 88.48 127.4 50.0
PPB/7C/5 163.7 88.05 128.0 49.7
PPB/7C/7 162.8 86.61 127.7 48.9
PPB/F4-RB/5 162.4 89.86 127.8 50.8
It appears that all three types of studied polytetrafluoroethylene powders (m-200,
7C and F4-RB) increase the crystallization peak temperature of isotactic polypropylene.
Neat isotactic polypropylene, PPH, exhibits the crystallization peak temperature of 117.8 oC. Addition of 3 wt.% of PTFE m-200 increases Tc of PPH by 6.3 oC while 3 wt.% of
PTFE 7C in the form of nanofibers by 9.5 oC. In the case of other grade of isotactic
polypropylene, i.e. PP, showing Tc of 109.3 oC, the presence of polytetrafluoroethylene 7C
increases the crystallization peak temperature of PP even by 18.2 oC. Masirek et al.
observed [Masirek 2010] that the maximum values of the crystallization peak temperature
of isotactic polypropylene are obtained when 0.2 wt.% of polytetrafluoroethylene particles
are dispersed in the matrix. Further increase of PTFE content does not affect Tc. During the
subsequent heating the melting temperature, Tm, of all isotactic polypropylenes was around
162÷163 oC. The enthalpy of melting, ∆Hm, of isotactic polypropylene for all studied
materials was within the range of 88÷92 J g-1, which corresponds to the degree of
crystallinity of 48÷52 %.
Polytetrafluoroethylene accelerates the crystallization of isotactic polypropylene
simultaneously increasing the crystallization peak temperature, nearly not affecting degree
of crystallinity, but affecting dramatically the spherulitic pattern. Figure 3.15 compares the
structure of neat PPB and PPB/7C/5 nanocomposite formed during isothermal
crystallization at temperature of 132 oC and 138 oC, respectively. Two different
temperatures of isothermal crystallization were applied. The nanocomposite crystallized so
fast at 132 oC that it was impossible to obtain isothermal conditions, while at 138 oC the
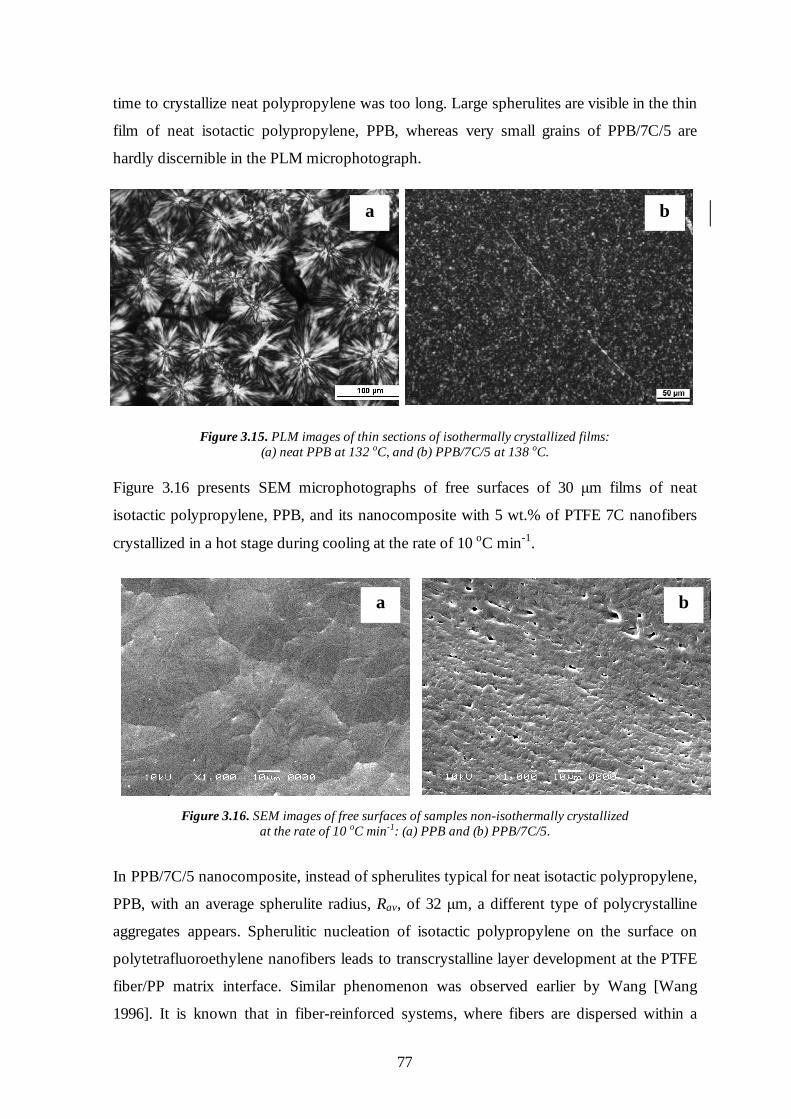
77
a b
time to crystallize neat polypropylene was too long. Large spherulites are visible in the thin
film of neat isotactic polypropylene, PPB, whereas very small grains of PPB/7C/5 are
hardly discernible in the PLM microphotograph.
Figure 3.15. PLM images of thin sections of isothermally crystallized films: (a) neat PPB at 132 oC, and (b) PPB/7C/5 at 138 oC.
Figure 3.16 presents SEM microphotographs of free surfaces of 30 µm films of neat
isotactic polypropylene, PPB, and its nanocomposite with 5 wt.% of PTFE 7C nanofibers
crystallized in a hot stage during cooling at the rate of 10 oC min-1.
Figure 3.16. SEM images of free surfaces of samples non-isothermally crystallized at the rate of 10 oC min-1: (a) PPB and (b) PPB/7C/5.
In PPB/7C/5 nanocomposite, instead of spherulites typical for neat isotactic polypropylene,
PPB, with an average spherulite radius, Rav, of 32 µm, a different type of polycrystalline
aggregates appears. Spherulitic nucleation of isotactic polypropylene on the surface on
polytetrafluoroethylene nanofibers leads to transcrystalline layer development at the PTFE
fiber/PP matrix interface. Similar phenomenon was observed earlier by Wang [Wang
1996]. It is known that in fiber-reinforced systems, where fibers are dispersed within a
b a

78
polymer matrix in a more or less random way, the space inhabited by fibers is not
accessible for crystallization [Piorkowska 2006]. Spherulites might be nucleated on fiber
surfaces beside those nucleated in polymer bulk. The overall kinetics of crystallization in
such systems was intensively studied in the literature [Mehl 1993a; Mehl 1993b; Krause
1994; Benard 1998; Piorkowska 2001]. In those papers the influence of nanofibers on the
isothermal crystallization kinetics was studied on the basis of the Evans-Avrami theory
[Avrami 1939; Avrami 1940; Avrami 1941]. Isothermal crystallization with the
instantaneous or spontaneous nucleation can be described by following Avrami equation:
( )σ ( ) expt ktn= − −1 (3.5)
where ( )α t is the conversion degree, k is the parameter depending on the nucleation rate
and growth rate, n assumes values 2, 3, or 4 depending on the type of nucleation and the
dimensionality of the process. The Avrami plot of the isothermal experimental data,
( )[ ] ln ln− −1 α t vs. ln t should be linear and from the slope of that plot the exponent
value, n, can be determined.
In this thesis a similar procedure was applied for polypropylene and polypropylene
nanocomposite with PTFE nanofibers. Figure 3.17 presents the Avrami plots for neat
polypropylene, PPB, and its nanocomposite with 5 wt.% of polytetrafluoroethylene 7C
nanofibers. Conversion degree, ( )α t , was calculated on the basis of DSC thermograms
recorded during isothermal crystallization. Two different temperatures (128 oC for neat
PPB and 145 oC for PPB/7C/5) for this experiment were applied on the basis of the same
problems as for isothermally crystallized samples presented in Figure 3.15.
In the case of neat isotactic polypropylene, PPB, isothermally crystallized at 128 oC, the Avrami analysis of data for α(t) in the range from 0.05 to 0.95 yields, the exponent
value, n, of 2.97 (~3) indicates 3D (3-dimensional) crystallization beginning with
instantaneous nucleation. This is consistent with straight interspherulitic boundaries found
in thin sections of neat PPB film (Figure 3.15). In contrast, the exponent value, n, of 2.02
(~2) for PPB/7C/5 nanocomposite isothermally crystallized at 145 oC indicates 2D (2-
dimensional) crystallization of isotactic polypropylene with its very dense instantaneous
nucleation on the surfaces of polytetrafluoroethylene 7C nanofibers.
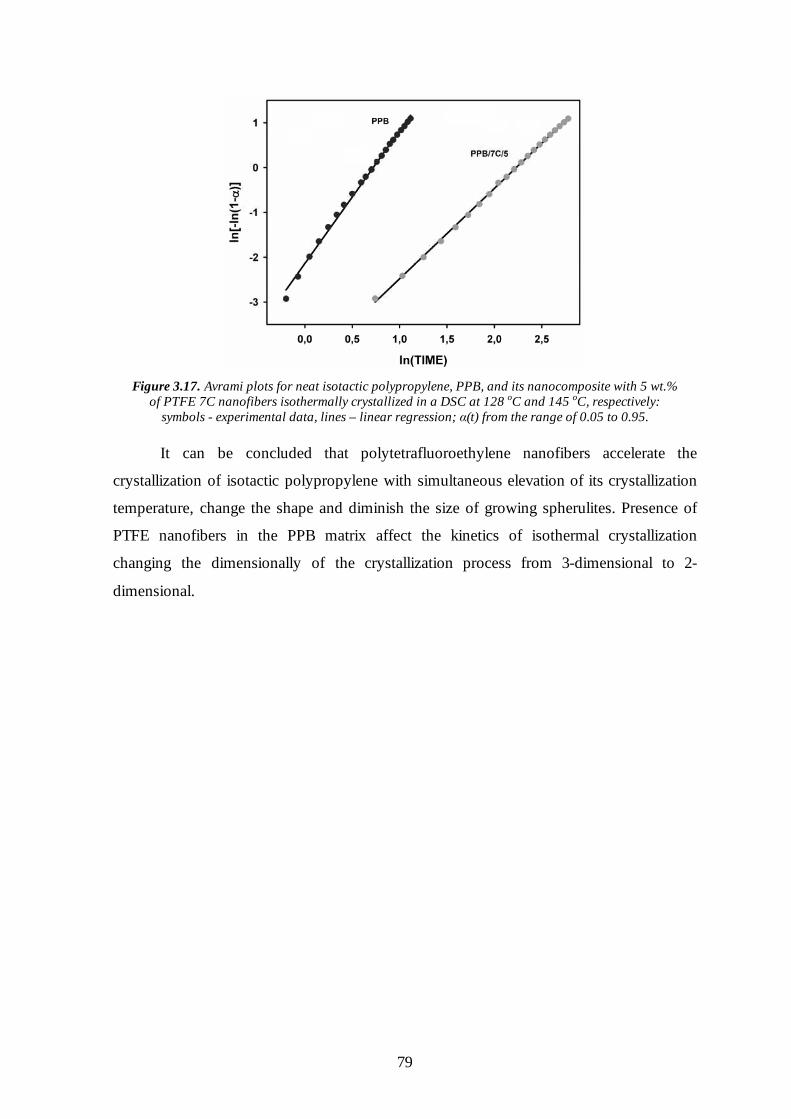
79
Figure 3.17. Avrami plots for neat isotactic polypropylene, PPB, and its nanocomposite with 5 wt.%
of PTFE 7C nanofibers isothermally crystallized in a DSC at 128 oC and 145 oC, respectively: symbols - experimental data, lines – linear regression; α(t) from the range of 0.05 to 0.95.
It can be concluded that polytetrafluoroethylene nanofibers accelerate the
crystallization of isotactic polypropylene with simultaneous elevation of its crystallization
temperature, change the shape and diminish the size of growing spherulites. Presence of
PTFE nanofibers in the PPB matrix affect the kinetics of isothermal crystallization
changing the dimensionally of the crystallization process from 3-dimensional to 2-
dimensional.
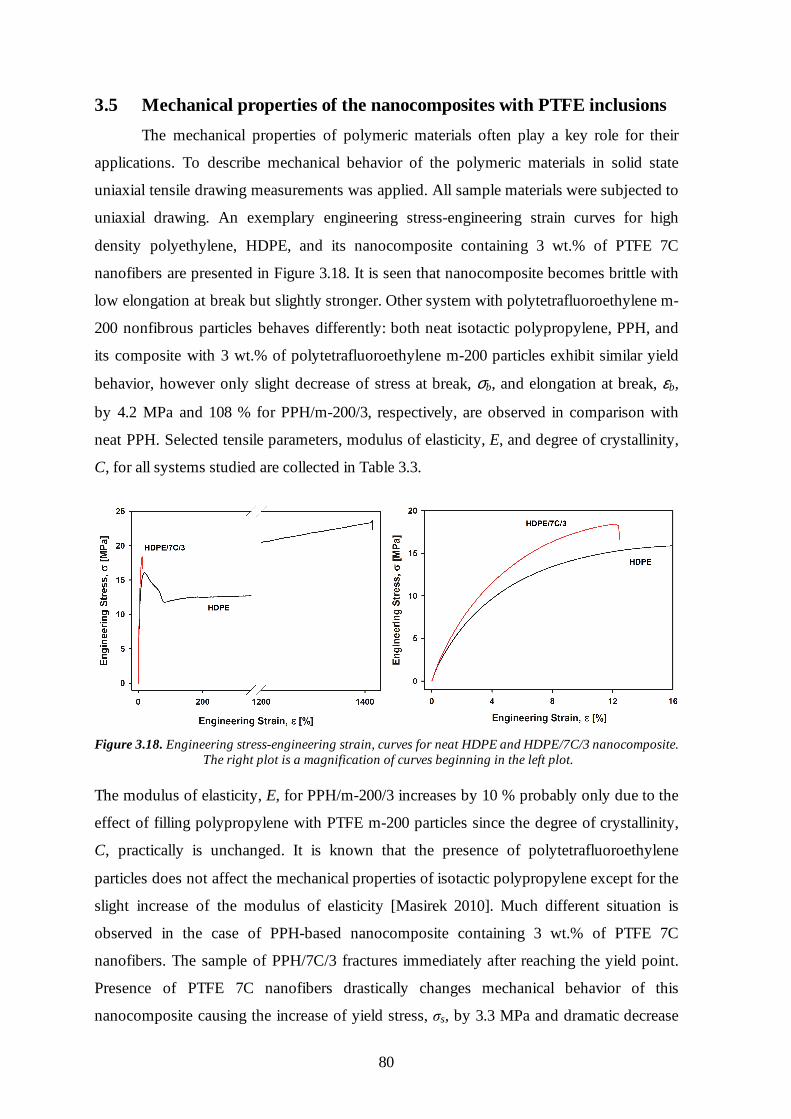
80
3.5 Mechanical properties of the nanocomposites with PTFE inclusions
The mechanical properties of polymeric materials often play a key role for their
applications. To describe mechanical behavior of the polymeric materials in solid state
uniaxial tensile drawing measurements was applied. All sample materials were subjected to
uniaxial drawing. An exemplary engineering stress-engineering strain curves for high
density polyethylene, HDPE, and its nanocomposite containing 3 wt.% of PTFE 7C
nanofibers are presented in Figure 3.18. It is seen that nanocomposite becomes brittle with
low elongation at break but slightly stronger. Other system with polytetrafluoroethylene m-
200 nonfibrous particles behaves differently: both neat isotactic polypropylene, PPH, and
its composite with 3 wt.% of polytetrafluoroethylene m-200 particles exhibit similar yield
behavior, however only slight decrease of stress at break, σb, and elongation at break, εb,
by 4.2 MPa and 108 % for PPH/m-200/3, respectively, are observed in comparison with
neat PPH. Selected tensile parameters, modulus of elasticity, E, and degree of crystallinity,
C, for all systems studied are collected in Table 3.3.
Figure 3.18. Engineering stress-engineering strain, curves for neat HDPE and HDPE/7C/3 nanocomposite.
The right plot is a magnification of curves beginning in the left plot.
The modulus of elasticity, E, for PPH/m-200/3 increases by 10 % probably only due to the
effect of filling polypropylene with PTFE m-200 particles since the degree of crystallinity,
C, practically is unchanged. It is known that the presence of polytetrafluoroethylene
particles does not affect the mechanical properties of isotactic polypropylene except for the
slight increase of the modulus of elasticity [Masirek 2010]. Much different situation is
observed in the case of PPH-based nanocomposite containing 3 wt.% of PTFE 7C
nanofibers. The sample of PPH/7C/3 fractures immediately after reaching the yield point.
Presence of PTFE 7C nanofibers drastically changes mechanical behavior of this
nanocomposite causing the increase of yield stress, σs, by 3.3 MPa and dramatic decrease

81
of elongation at break, εb, to 17.3 %. This type of stress-strain behavior is also observed for
other studied materials containing 3 wt. % of polytetrafluoroethylene 7C nanofibers i.e.,
PP/7C/3 and HDPE/7C/3, however later sample fractures even before reaching the yield
point. It is known that the crystallization of isotactic polypropylene is nucleated by
polytetrafluoroethylene fibers [Wang 1996; Wang 1999] and even more by nanofibers (see
Chapter 3.4). This ability leads to the increase of the degree of crystallinity, C, even by 5
% (e.g. for PPH/7C/3) which in consequence contribute to obtain higher modulus of
elasticity, E, for the isotactic polypropylene–based nanocomposites even by 35 % (e.g. for
PP/7C/3).
Table 3.3. Selected tensile parameters, modulus of elasticity and degree of crystallinity of tensile samples for selected neat thermoplastic polymers and the materials with polytetrafluoroethylene powder.
Material Yield stress,
σσσσs [MPa]
Stress at break, σσσσb [MPa]
Elongation at break, εεεεb [%]
Modulus of elasticity, E [GPa]
Degree of Crystallinity, C [%]
PPH 29.57 36.52 1576 1.19 42.0
PPH/m-200/3 29.74 32.35 1468 1.31 43.4
PPH/7C/3 32.90 32.62 17.3 1.37 47.3
PP 29.32 33.71 1889 1.25 46.4
PP/7C/3 31.95 31.34 17.1 1.68 51.8
HDPE 16.22 23.66 1415 0.89 58.5
HDPE/7C/3 - 19.90 34.5 0.90 62.0
Semicrystalline polymers including high density polyethylene, HDPE, and isotactic
polypropylene, i-PP, exhibit attractive strength and ductility under moderate rates of
deformation and at room temperature. Those features enable to use such polymers as
engineering materials, however they become brittle at low temperature or high strain rates
and can undergo a sharp ductile-to-brittle transition. Because of this disadvantageous
behavior the toughening of semicrystalline engineering thermoplastics was intensively
studied by many authors [Wu 1990; Wu 1992; Arends 1996; Martuscelli 1996; Walter
1997; Perkins 1999; Bartczak 1999a; Bartczak 1999b; Argon 2003; Lin 2010]. The
toughness is a measure of ability of a material to absorb the energy up to fracture [Callister
2007]. Intrinsic properties of a polymer and in consequence its toughness can be changed
by means of chemical modification. Apart from this method, two another routes can be
used to improve the toughness of polymeric materials. One way is to increase the brittle
strength of polymeric material by reinforcing with long, high strength fibers [Kim 1991].
Second way is to reduce the overall plastic resistance of the polymeric material directly or

82
indirectly by incorporation of fine particles [Bartczak 1999a; Bartczak 1999b; Argon 2003;
Lin 2010]. For dynamic loading conditions (i.e. at high strain rates) and when a notch (or
point of stress concentration) is present, so-called notch toughness is assessed by using an
impact test. In the case of notched Izod impact experiments the Izod impact strength, UI,
[Wu 1992] is defined as a breaking energy per unit of specimen thickness at the breaking
point.
The influence of polytetrafluoroethylene nanofibers on the impact properties of
thermoplastic polymers including isotactic polypropylene, PPB, atactic polystyrene, PS,
and low density polyethylene, LDPE was examined. Figure 3.19 presents the Izod impact
strength of atactic polystyrene and the series of its nanocomposites with 1, 3, 5 and 7 wt.%
of PTFE 7C nanofibers, measured at room temperature. The results of UI also for other
studied materials are collected in Table 3.4.
Figure 3.19. Izod impact strength, UI, for neat atactic polystyrene, PS,
and its nanocomposites as a function of content of PTFE 7C nanofibers.
It can be seen that the Izod impact strength of atactic polystyrene continuously increases
with increasing content of polytetrafluoroethylene 7C nanofibers by 40 % for the
nanocomposite containing 7 wt.% of PTFE 7C nanofibers.
The case of nanofibers-filled isotactic polypropylene, PPB, seems to be more complicated
as compared to atactic polystyrene, PS. The highest value of UI (6.27 kJ m-2) is obtained
for PPB containing only 1 wt.% of polytetrafluoroethylene 7C nanofibers, higher of about
58 % in comparison with PPB matrix. Concentration of polytetrafluoroethylene nanofibers
higher than 1 wt.% leads to a slight decrease of Izod impact strength but obtained values of
UI are still higher as compared to neat matrix. Polytetrafluoroethylene 7C nanofibers also

83
affect the impact properties of low density polyethylene-based materials. Izod impact
strength of low density polyethylene containing 3 or 5 wt.% of PTFE 7C nanofibers is
higher by only 8 % in comparison with neat LDPE matrix.
Table 3.4. Izod impact strength of neat polypropylene, PPB, and low density
polyethylene, LDPE, and the series of their nanocomposites with PTFE 7C nanofibers.
Material Izod impact strength, UI [kJ m-2]
PPB 3.96
PPB/7C/1 6.27
PPB/7C/3 6.04
PPB/7C/5 5.54
PPB/7C/7 5.13
LDPE 39.04
LDPE/7C/3 42.17
LDPE/7C/5 42.10
LDPE/7C/7 29.67
Higher content of polytetrafluoroethylene nanofibers (i.e. 7 wt.%) causes drastic decrease
of UI by 25 % as compared to neat low density polyethylene. Since there was no intention
to orient the polytetrafluoroethylene 7C nanofibers neither during compounding nor
preparation of the specimens for impact testing, it is assumed that PTFE 7C nanofibers are
randomly dispersed in thermoplastic matrix. So, only those straight polytetrafluoroethylene
7C nanofibers oriented perpendicular to the impact direction contribute to the increase of
the Izod impact strength of the thermoplastic matrix. PTFE nanofibers which are parallel to
the impact direction do not affect the toughness, but they cause a growth of e.g.,
polypropylene crystals perpendicular to their surface and such crystals can affect the
toughness. At higher concentrations of PTFE 7C, the network of entangled
polytetrafluoroethylene nanofibers produced during compounding is probably partially
responsible for decrease of the Izod impact strength of both thermoplastic polymers
studied.
The dynamic mechanical response of polymeric materials, typically in the terms of
storage modulus, E’, and loss modulus, E’’ , as a function of temperature can be measured
by means of the dynamic mechanical thermal analysis (DMTA). The effect of
polytetrafluoroethylene 7C nanofibers on the dynamic mechanical behavior of isotactic
polypropylene, PPB, and atactic polystyrene, PS, was investigated. Figure 3.20 presents
the temperature-dependence of storage modulus, E’, for neat PPB, and its nanocomposite
with 3, 5, and 7 wt.% of polytetrafluoroethylene 7C nanofibers.

84
Figure 3.20. Storage modulus, E’, as a function of temperature for neat PPB
and its nanocomposite with 3, 5, and 7 wt.% of polytetrafluoroethylene 7C nanofibers.
It can be observed that the presence of 3 wt.% of PTFE 7C nanofibers causes the increase
of storage modulus, E’, of isotactic polypropylene, PPB. The stiffness of PPB/7C/3
nanocomposite increases with decreasing temperature and is much more pronounced at
temperatures below 0 oC which is attributed to the glass transition temperature, Tg, of
amorphous polypropylene [ATHAS Data Bank, http://athas.prz.edu.pl].
Figure 3.21. Temperature dependence of loss modulus, E’’, for neat atactic polystyrene, PS, and its nanocomposite containing 3 wt.% of PTFE 7C nanofibers.
The glass transition temperature, Tg, can be defined as the temperature corresponding to
the maximum of peak in the E’’(T) plot. The PPB-based nanocomposites show glass
transition at about 2.0 oC, the same as Tg observed for neat isotactic polypropylene, PPB.
In contrast, for polystyrene an addition of 3 wt.% of PTFE 7C nanofibers dispersed in the
matrix of atactic polystyrene, PS, causes a shift of the loss modulus maximum to higher
temperatures, as shown in Figure 3.21. In consequence, Tg of PS increases by 9 oC from
94.5 oC to 103.6 oC. No further increase of the glass transition temperature of atactic
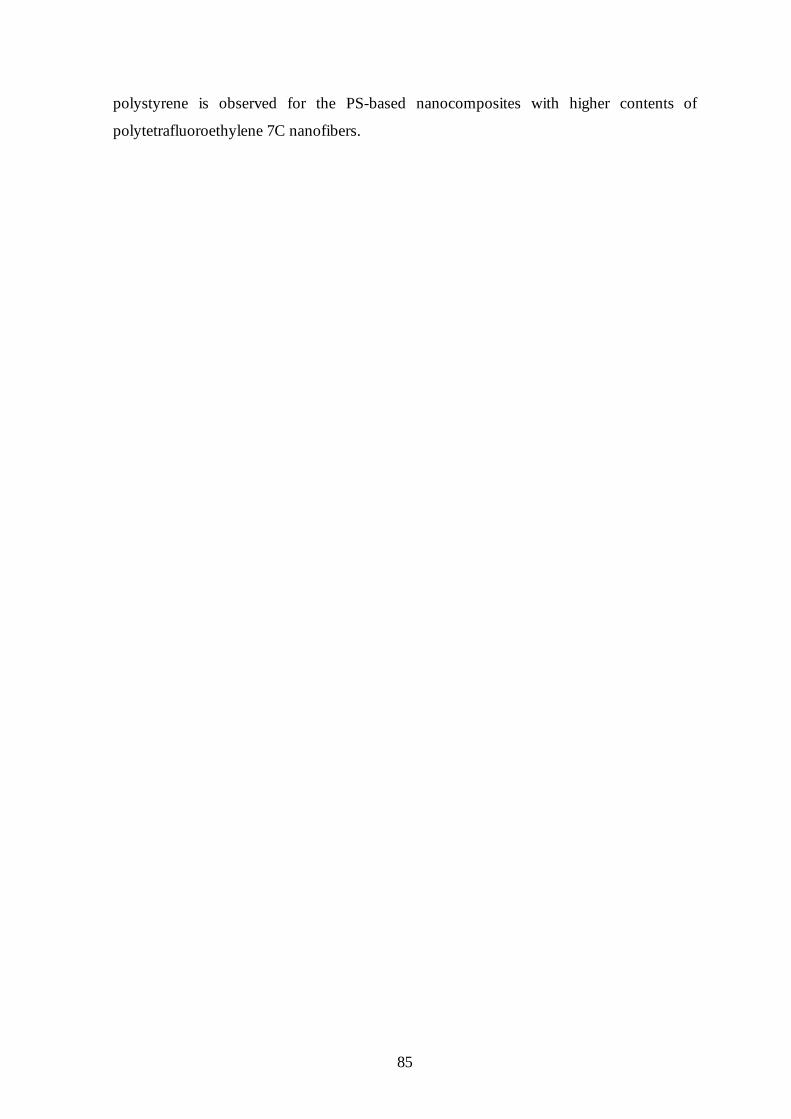
85
polystyrene is observed for the PS-based nanocomposites with higher contents of
polytetrafluoroethylene 7C nanofibers.

86
3.6 Rheological properties of the nanocomposites with PTFE inclusions
Polymeric materials, e.g. homogeneous polymers, immiscible polymer blends,
particulate- or fiber-reinforced polymers exhibit its own unique rheological characteristics.
Hence, successful processing of such materials requires a good understanding of their
viscoelastic behavior both in the shear and extensional flow [Han 2007]. The viscoelastic
properties of polymers depend on their chemical structure [Fetters 1994], molecular weight
[Fuchs 1996], molecular weight distribution [Lovell 1961], degree of branching [Berry
1968], temperature, frequency, and also the stress to which a polymer is subjected [Mittal
2010]. In the case of micro- and nanocomposite systems produced by compounding
homogenous polymers with other materials, e.g. fillers, the rheological behavior depends
also on the filler shape and size, filler concentration, and the extent of any interactions
among the filler particles and filler-polymer matrix [Léopoldès 2004; Chabert 2004; Raos
2006; Osman 2006; Nazockdast 2008; Haghtalab 2011]. The effect of
polytetrafluoroethylene nanofibers on the viscoelastic properties of the molten
nanocomposites based on isotactic polypropylene, i-PP, low density polyethylene, LDPE,
high density polyethylene, HPDE, and atactic polystyrene, a-PS, was intensively
examined.
3.6.1 Oscillatory shear flow
In oscillatory shear flow, the molten polymer is subjected to the small-amplitude
sinusoidal strain with an angular frequency, ω, and the dynamic storage and loss moduli,
G’ and G’’, are measured. G’ represents the amount of energy stored per unit volume of
the molten polymer, while G’’ represents the amount of energy dissipated per unit volume
of the molten polymer [Dealy 2006]. Figure 3.22 presents the storage and loss moduli, G’
and G’’, as a function of angular frequency, ω, for isotactic polypropylene, PPB, and its
nanocomposite with 5 wt.% of PTFE 7C nanofibers.
Both G’ and G’’ increase with increasing ω and in low frequency regime the loss modulus
is larger than the storage modulus, demonstrating the viscous nature of isotactic
polypropylene (note the log-log scales in Figure 3.22). However, the slope of G’’ is
smaller than that of G’, so that with increasing frequency the two curves cross each other
(G’ = G’’ ) at so-called cross-over frequency, ωc. This characteristic frequency marks a
transition from viscous (G’’ > G’) to rubbery (G’ > G’’ ) response. It is known that at low
frequency ranges, both moduli are very sensitive to the molecular structure of polymeric

87
material, especially the size, shape and concentration of dispersed phase [Osman 2006;
Nazockdast 2008; Haghtalab 2011].
Figure 3.22. Storage modulus, G’, and loss modulus, G’’, as a function of angular frequency, ω, at 190 oC for neat polypropylene, PPB, and its nanocomposite with 5 wt.% of PTFE 7C.
Incorporation of nanoinclusions to a polymer matrix should enhance both the storage
modulus and the loss modulus due to its huge specific surface area [Osman 2005].
PPB/7C/5 nanocomposite shows significantly different behavior than neat isotactic
polypropylene. PTFE 7C nanofibers cause the increase in G’ and G’’ over the low- and
high frequency range but in the low frequency region the increase in the storage modulus is
more pronounced than in loss modulus. Polytetrafluoroethylene 7C nanofibers act as a
confinement of polypropylene chains. Such confinement effect leads to an alternation of
the relaxation dynamics of isotactic polypropylene chains and in consequence dramatically
changes its viscoelastic behavior.
Figure 3.23. Loss factor, tan δ, as a function of angular frequency, ω, at 190 oC
for neat isotactic polypropylene, PPB, and its nanocomposite with 5 wt.% of PTFE 7C nanofibers.

88
The loss factor, tan δ (=G’’ /G’), for neat isotactic polypropylene, PPB, and
PPB/7C/5 nanocomposite measured in small-amplitude oscillatory shear is given in Figure
3.23 as a function of angular frequency, ω. For neat PPB, tan δ is high and decays very fast
with increasing ω to reach a value of 0.5, while for the nanocomposite containing 5 wt.%
of PTFE 7C nanofibers, the tan δ curve becomes almost flat i.e., shows a very broad peak,
reflecting development of the physical entangled network of polytetrafluoroethylene 7C
nanofibers which affect the moduli. It appears that PTFE 7C nanofibers cause an increase
in G’ (storage of elastic energy) more than in G’’ (viscous dissipation of that energy) of
studied nanocomposites.
3.6.2 Uniaxial extensional flow
Transient extensional viscosity, ηE+ , characterizes a resistance of a fluid to
extensional deformation. Uniaxial extension measurements of molten polymeric materials
are based on the original Meissner concept [Meissner 1985]. ARES-EVF design enables to
deform the sample at a constant strain rate, &ε , called Hencky rate by extending the sample
symmetrically from the sample center with a constant velocity by rotating clamps. The
measurements of transient extensional viscosity are most often used to identify propensity
of polymeric materials to strain hardening, i.e. how quickly ηE+ rises above linear
viscoelastic response (LVE) with increasing total strain, ε ( )= t &ε and strain rate, &ε
[Takahashi 1993]. Strain hardening induces a so-called self-healing effect which supports a
homogenous deformation of the polymer melt. Thus, polymers exhibiting strain hardening
in extensional flows play an important role in many industrial processes including fiber
spinning, film blowing, blow molding, thermoforming [Yamaguchi 2002], and foaming
[Spitael 2004]. The molecular structure, especially long-chain branching strongly
influences ηE+ . Hence, the uniaxial extension of the molten polymeric materials also
provides a powerful tool for polymer characterization [Münstedt 1998].
The effect of polytetrafluoroethylene 7C nanofibers on the extensional behavior of
various thermoplastic polymers in the molten state was examined using extensional
viscosity fixture (EVF) attached to the ARES rheometer. Figure 3.24 presents curves of the
time-dependent transient extensional viscosity for neat isotactic polypropylene, PPB, and
its nanocomposites containing 3, 5 and 7 wt.% of PTFE 7C nanofibers, recorded during
uniaxial extension at the strain rate of 2.5 s-1 and 200 oC. The solid line presents the curve

89
that was obtained by multiplying by a factor 3 the transient shear viscosity, ηS+ , of neat
PPB measured at low strain rate of 0.01 s-1.
In the case of viscosity, simple correlations between viscous and elastic properties in shear
and extensional flow only exist in the linear regime, i.e. at low strain rates or small strains
[Ferry 1970]. This relationship is known as the Trouton ratio, Tr, expressed as
TrE
S
=+
+
ηη
(3.6)
In the linear regime the transient extensional viscosity becomes simply three times the
transient shear viscosity.
Figure 3.24. Transient extensional viscosity, ηE
+, as a function of extensional time, t, measured at 2.5 s-1 and 200 oC for neat isotactic polypropylene, PPB, and its nanocomposites
with 3, 5, and 7 wt.% of PTFE 7C nanofibers. Solid line presents the curve obtained by multiplying by a factor 3 - the transient shear viscosity, ηS
+, at 0.01 s-1.
During uniaxial extension the molten isotactic polypropylene, PPB, does not exhibit any
indication of strain hardening. Both time-dependent ηE+ and ηS
+ curves for neat PPB
practically superimpose. This behavior is well known for linear polyolefins [Münstedt
1981; Gabriel 2003]. Transient extensional viscosity in LVE region for linear polymers is
3÷4 times of the transient shear viscosity [Macosko 1994]. This relationship was
experimentally verified for various polymers including polypropylene [Auhl 2004],
polyethylene [Meissner 1972; Laun 1978; Münstedt 1998] and polystyrene [Münstedt
1975]. PPB-based nanocomposites containing PTFE 7C nanofibers show a totally different
time-dependence of the transient extensional viscosity in contrast to neat isotactic
polypropylene. PPB/7C/3 nanocomposite shows a significant strain hardening beginning at
the total strain, ε = 123. . The onset of this process begins earlier with increasing content of
polytetrafluoroethylene 7C nanofibers, at ε = 0 64. and ε = 053. for PPB/7C/5 and
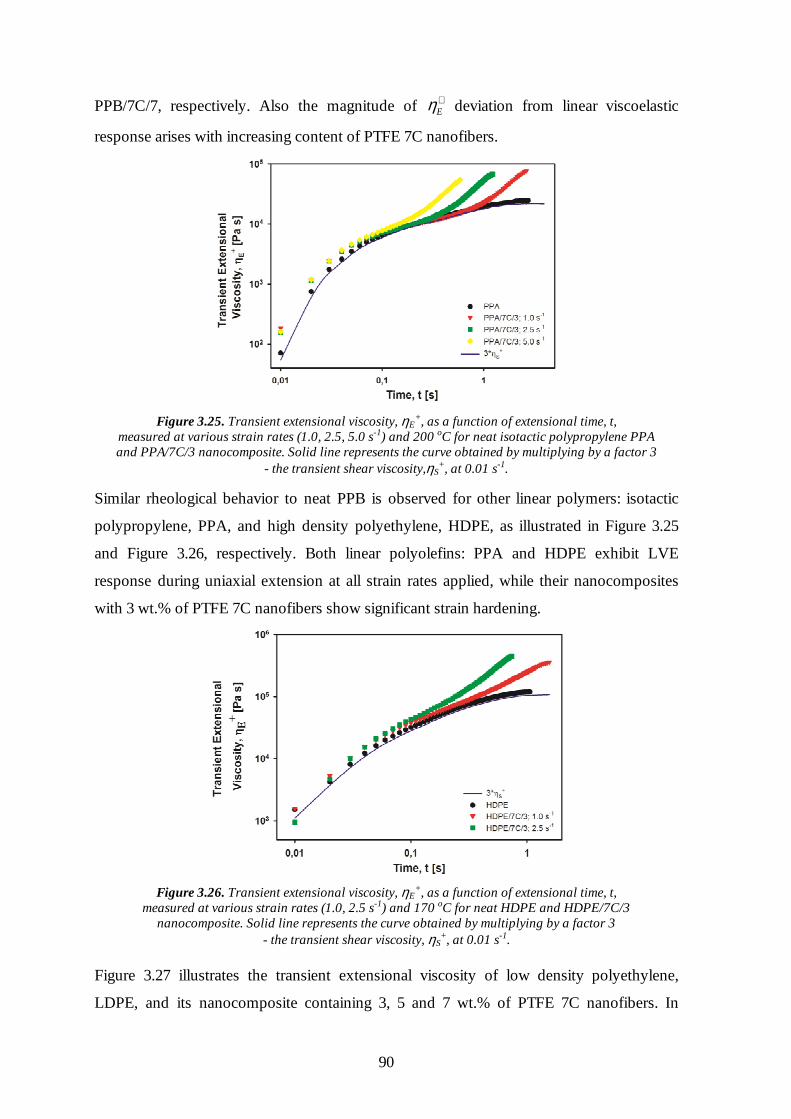
90
PPB/7C/7, respectively. Also the magnitude of ηE+ deviation from linear viscoelastic
response arises with increasing content of PTFE 7C nanofibers.
Figure 3.25. Transient extensional viscosity, ηE
+, as a function of extensional time, t, measured at various strain rates (1.0, 2.5, 5.0 s-1) and 200 oC for neat isotactic polypropylene PPA and PPA/7C/3 nanocomposite. Solid line represents the curve obtained by multiplying by a factor 3
- the transient shear viscosity,ηS+, at 0.01 s-1.
Similar rheological behavior to neat PPB is observed for other linear polymers: isotactic
polypropylene, PPA, and high density polyethylene, HDPE, as illustrated in Figure 3.25
and Figure 3.26, respectively. Both linear polyolefins: PPA and HDPE exhibit LVE
response during uniaxial extension at all strain rates applied, while their nanocomposites
with 3 wt.% of PTFE 7C nanofibers show significant strain hardening.
Figure 3.26. Transient extensional viscosity, ηE+, as a function of extensional time, t,
measured at various strain rates (1.0, 2.5 s-1) and 170 oC for neat HDPE and HDPE/7C/3 nanocomposite. Solid line represents the curve obtained by multiplying by a factor 3
- the transient shear viscosity, ηS+, at 0.01 s-1.
Figure 3.27 illustrates the transient extensional viscosity of low density polyethylene,
LDPE, and its nanocomposite containing 3, 5 and 7 wt.% of PTFE 7C nanofibers. In

91
comparison with linear polymers, LDPE exhibits pronounced strain hardening in
extensional flow due to presence of long-chain branches [Laun 1978; Wagner 2000].
Hence, the influence of PTFE 7C nanofibers on its viscoelastic behavior is more difficult
to observe directly from the transient extensional viscosity-time dependence. However, it
can be seen that the non-linear viscoelastic response of the LDPE-based nanocomposites
slightly increases with increasing content of polytetrafluoroethylene 7C nanofibers.
Figure 3.27. Transient extensional viscosity, ηE
+, as a function of extensional time, t, measured at 1.0 s-1 and 170 oC for neat LDPE and its nanocomposite with 3, 5 and 7 wt.% of PTFE 7C nanofibers.
Presence of 3 wt.% of PTFE 7C nanofibers causes a significant increase of the viscosity of
LDPE/7C/3 nanocomposite in comparison with neat LDPE (note the log-log scale in
Figure 3.27). Similar behaviour is also observed for atactic polystyrene-based
nanocomposites with PTFE 7C nanofibers, as shown in Figure 3.28, but subsequent
increase of the viscosity is observed with increasing content of polytetrafluoroethylene 7C
nanofibers.
Figure 3.28. Transient extensional viscosity, ηE+, as a function of extensional time, t measured at 1.0 s-1
and 170 oC for neat PS and its nanocomposite with 3, 5 and 7 wt.% of PTFE 7C nanofibers.

92
The Trouton ratio, expressed by eq. 3.6, is useful parameter to obtain more quantitative
estimation of the strain hardening effect [Kasehagen 1998]. Table 3.5 presents the Trouton
ratio determined at a given total strain and strain rate for linear thermoplastic polymers:
two grades of isotactic polypropylene, high density polyethylene and their nanocomposites
with PTFE 7C. Neat linear polymers including PPB, PPA and HDPE exhibit no strain
hardening. Hence, obtained values of Trouton ratio are in the range from 3.22 (for HDPE)
to 3.47 (for PPA) since they show linear viscoelastic response during uniaxial extensional
deformation. Those Tr values are strain-rate independent. It can be seen that Trouton ratio
for linear isotactic polypropylene, PPB, drastically increases with increasing content of
PTFE 7C nanofibers and reaches the large value of 21.59 for PPB/7C/7 at 1.0 s-1.
Table 3.5. Trouton ratio for neat isotactic polypropylene, high density polyethylene and their nanocomposites with PTFE 7C nanofibers, uniaxially extended at 1.0, 2.5, and 5.0 s-1. Tr was determined at the total strain of 1.56 for HDPE, 3.01 for PPA, and 2.65 for PPB, respectively.
It can also be seen that values of Trouton ratio obtained for PPB-based nanocomposites
with polytetrafluoroethylene 7C nanofibers at various strain rates, &ε , are different. The
higher the strain rate the lower Tr. This effect is more pronounced with increasing content
of PTFE 7C. It appears that polytetrafluoroethylene 7C nanofibers, generated during
compounding, yield to orientation and/or further deformation during uniaxial extension.
Similar rheological behavior is observed for low density polyethylene- and high density
polyethylene-based nanocomposites with 3 wt. % of PTFE 7C nanofibers. Trouton ratios
of those nanocomposites are few times higher than Tr for neat polymers. Ultimate Trouton
ratio obtained at a given level of Hencky strain depends on the type of nanocomposite
studied (especially the method of its fabrication). If polytetrafluoroethylene 7C nanofibers
Strain rate, &ε [s-1]
1.0 2.5 5.0
Material Trouton ratio, Tr
PPB 3.34 3.34 3.34
PPB/7C/3 8.71 6.35 5.14
PPB/7C/5 13.44 10.82 9.63
PPB/7C/7 21.59 16.57 13.41
PPA 3.47 3.47 3.47
PPA/7C/3 10.55 9.71 8.92
HDPE 3.22 3.22 -
HDPE/7C/3 9.49 9.27 -
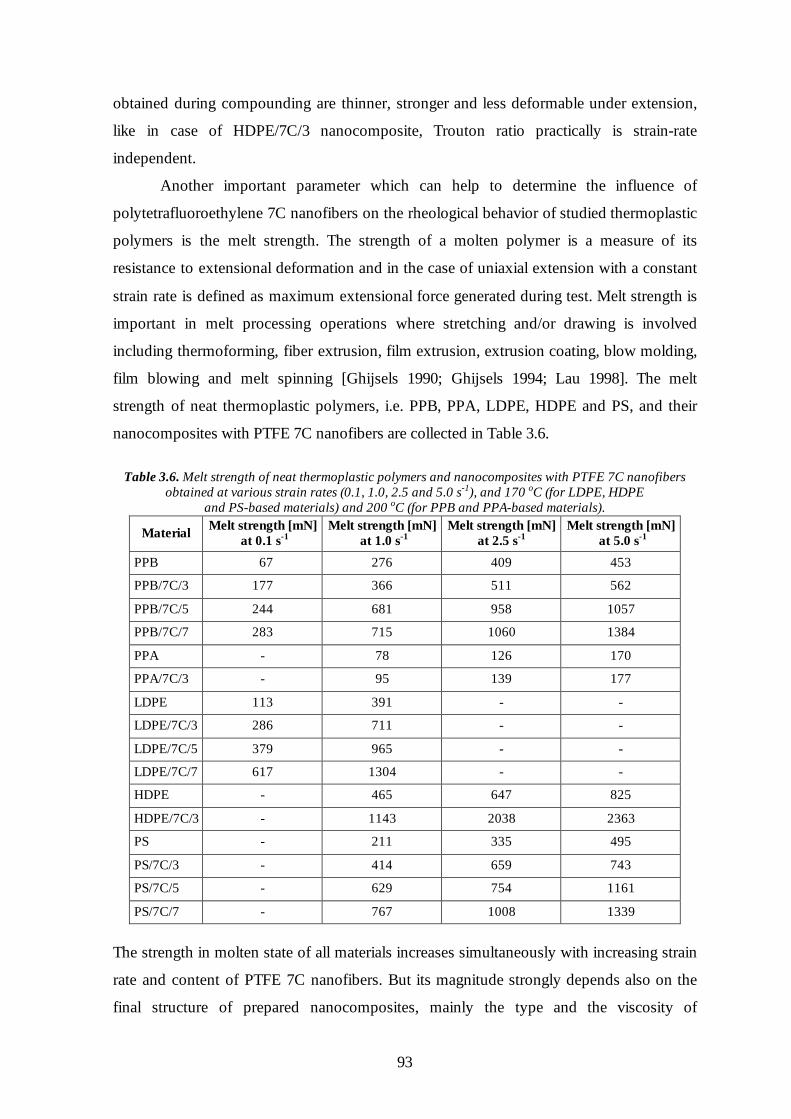
93
obtained during compounding are thinner, stronger and less deformable under extension,
like in case of HDPE/7C/3 nanocomposite, Trouton ratio practically is strain-rate
independent.
Another important parameter which can help to determine the influence of
polytetrafluoroethylene 7C nanofibers on the rheological behavior of studied thermoplastic
polymers is the melt strength. The strength of a molten polymer is a measure of its
resistance to extensional deformation and in the case of uniaxial extension with a constant
strain rate is defined as maximum extensional force generated during test. Melt strength is
important in melt processing operations where stretching and/or drawing is involved
including thermoforming, fiber extrusion, film extrusion, extrusion coating, blow molding,
film blowing and melt spinning [Ghijsels 1990; Ghijsels 1994; Lau 1998]. The melt
strength of neat thermoplastic polymers, i.e. PPB, PPA, LDPE, HDPE and PS, and their
nanocomposites with PTFE 7C nanofibers are collected in Table 3.6.
Table 3.6. Melt strength of neat thermoplastic polymers and nanocomposites with PTFE 7C nanofibers obtained at various strain rates (0.1, 1.0, 2.5 and 5.0 s-1), and 170 oC (for LDPE, HDPE
and PS-based materials) and 200 oC (for PPB and PPA-based materials).
Material Melt strength [mN] at 0.1 s-1
Melt strength [mN] at 1.0 s-1
Melt strength [mN] at 2.5 s-1
Melt strength [mN] at 5.0 s-1
PPB 67 276 409 453
PPB/7C/3 177 366 511 562
PPB/7C/5 244 681 958 1057
PPB/7C/7 283 715 1060 1384
PPA - 78 126 170
PPA/7C/3 - 95 139 177
LDPE 113 391 - -
LDPE/7C/3 286 711 - -
LDPE/7C/5 379 965 - -
LDPE/7C/7 617 1304 - -
HDPE - 465 647 825
HDPE/7C/3 - 1143 2038 2363
PS - 211 335 495
PS/7C/3 - 414 659 743
PS/7C/5 - 629 754 1161
PS/7C/7 - 767 1008 1339
The strength in molten state of all materials increases simultaneously with increasing strain
rate and content of PTFE 7C nanofibers. But its magnitude strongly depends also on the
final structure of prepared nanocomposites, mainly the type and the viscosity of

94
thermoplastic matrix used, the transverse and longitudinal sizes of generated
polytetrafluoroethylene 7C nanofibers and in consequence the magnitude of obtained
entanglements between PTFE 7C nanofibers. The strongest influence of PTFE 7C
nanofibers on the melt strength is observed for high density polyethylene. Only 3 wt.% of
PTFE 7C nanofibers are sufficient to cause the increase in the melt strength of HDPE/7C/3
by 2.4÷3.1 times as compared to neat high density polyethylene, whereas similar values for
PPB, LDPE and PS-based nanocomposites are obtain not below the content of 7 wt.% of
PTFE 7C nanofibers. PPA/7C/3 nanocomposite seems to be a special case since the
presence of PTFE 7C nanofibers practically do not affect its melt strength. Detailed
analysis of this nanocomposite structure reveals that applied compounding protocol
enabled generation of much thinner PTFE 7C nanofibers (transverse sizes of 10÷30 nm)
than those obtained for other polymeric matrices (e.g., 30÷580 nm for PPB/7C/3; and
50÷230 nm for PS/7C/7). In consequence, the network built from such thin PTFE 7C
nanofibers possesses either lower entanglements density or disentangling/breaking of such
PTFE 7C nanofibers is much easier than in other nanocomposites.

95
3.7 Conclusions
Crystalline polymer inclusions (polytetrafluoroethylene) can be deformed into
nanofibers during compounding by shearing via second polymer being in the molten state
provided that crystalline inclusions are formed from disentangled macromolecules. In
consequence, a nanocomposite with nanofibrillar inclusions, containing only two
polymers, can be formed after solidification of the matrix material. Such ‘all polymer’
nanocomposite exhibits a series of enhanced thermal, mechanical and rheological
properties as direct or indirect effects of polytetrafluoroethylene nanofibers dispersed in
the polymer matrix.
To summarize, the PhD thesis allowed to formulate the following important conclusions:
1. Solid inclusions of polytetrafluoroethylene can be deformed into nanofibers by
shearing via second molten polymer during compounding on the following
conditions:
(a) Polytetrafluoroethylene powder should be in the form of large
crystals in chain-extended fashion without significant entanglements of
macromolecules, melting temperature of such crystals must be close to or
higher than equilibrium melting temperature being in the range 332÷336 oC;
(b) The advantage of deformation of solid particles over molten inclusions is
that solid fibers do not undergo capillary instabilities and they do not
disintegrate into smaller droplets;
(c) To initiate the plastic deformation by shearing of chain-extended crystals
of polytetrafluoroethylene embedded in a polymer matrix at room
temperature, the resolved shear stress of only 6 MPa must be reached and
exceeded. The resolved shear stress for crystal shearing is significantly
lower at elevated temperature because crystal plasticity is thermally
activated phenomenon;
(d) Sufficiently large deformation ratios and shear rates, and suitably long
compounding time must be applied to generate thinner and stronger
polytetrafluoroethylene nanofibers;
2. Formation of PTFE nanofibers was observed in all molten polymers used as a
matrix, provided that a sufficient shear stress was imposed on the composite.

96
Various polypropylene, polyethylenes of low and high densities and polystyrene
were employed in the studies.
3. Polytetrafluoroethylene nanofibers accelerate the crystallization of isotactic
polypropylene with simultaneous elevation of its crystallization temperature. They
cause the diminution of the spherulites sizes and change the dimensionally of the
crystallization process from 3-D to 2-D, spherulites of isotactic polypropylene grow
perpendicular to the nanofibers surfaces.
4. Presence of polytetrafluoroethylene nanofibers drastically changes the mechanical
behavior of studied materials causing:
(a) increase in the yield stress and dramatic decrease of the elongation
at break;
(b) increase in the Izod impact strength;
(c) increase in the stiffness of isotactic polypropylene;
(d) increase in the glass transition temperature of polystyrene.
5. Presence of polytetrafluoroethylene nanofibers dramatically changes the
rheological behavior of studied materials causing:
(a) alternation of the relaxation dynamics of isotactic polypropylene chains
and in consequence increase in the storage modulus more than in loss
modulus;
(b) significant strain hardening of molten linear polymers like isotactic
polypropylene and high density polyethylene that exhibit no strain
hardening themselves. Trouton ratios of those nanocomposites are few
times higher as compared to neat polymers.
(c) Increase in the melt strength of other nanocomposites as compared to neat
polymers.
6. The expected applications of such nanocomposites can be found in such area where
high melt strength is required such as: foaming, fiber spinning, film blowing, film
extrusion, film drawing and biaxial film drawing.

97
3.8 References
Argon A.S., Cohen R.E., 2003. Toughenability of polymers. Polymer 44, 6013-6032;
Arends C.B., 1996. Polymer toughening. Marcel Dekker, New York;
ATHAS Data Bank, (the Advanced Thermal Analysis System); http://athas.prz.edu.pl;
Auhl D., Stange J., Münstedt H., Krause B., Voigt D., Lederer A., Lappan U., 2004.
Rheological properties of electron beam irradiated polypropylenes.
Macromolecules 37, 9465-9472;
Avrami M., 1939. Kinetics of phase change. I. General theory.
J. Chem. Phys. 7, 1103-1112;
Avrami M., 1940. Kinetics of phase change. II. Transformation-time relations for random
distribution of nuclei. J. Chem. Phys. 8, 212-224;
Avrami M., 1941. Kinetics of phase change. III. Granulation, phase change and
microstructure. J. Chem. Phys. 9, 177-184;
Barham P.J., Sadler D.M., 1991. A neutron scattering study of the melting behaviour
of polyethylene single mats. Polymer 32, 393-395;
Bartczak Z., Argon A.S., Cohen R.E., Weinberg M., 1999a. Toughness mechanism in
semi-crystalline polymer blends: I. High-density polyethylene toughened with rubbers.
Polymer 40, 2331-2346;
Bartczak Z., Argon A.S., Cohen R.E., Weinberg M., 1999b. Toughness mechanism in
semi-crystalline polymer blends: II. High-density polyethylene toughened with calcium
carbonate filler particles. Polymer 40, 2347-2365;
Bartczak Z., Beris P.F.M., Wasilewski K., Galeski A., Lemstra P.J., 2012. Deformation
of the Ultra-High Molecular Weight Polyethylene Melt in the Plain-Strain Compression.
J. Appl. Polym. Sci. DOI 10.1002/app.36595;
Bassett D.C., Davitt R., 1974. On crystallization phenomena in polytetrafluoroethylene.
Polymer 15, 721-728;
Benard A., Advani S.G., 1998. An analytical model for spherulitic growth in fiber-
reinforced polymers. J. Appl. Polym. Sci. 70, 1677-1787;
Bernland K., Smith P., 2009. Nucleating Polymer Crystallization with
Poly(tetrafluoroethylene) Nanofibrils. J. Appl. Polym. Sci. 114, 281-287;
Berry G.C., Fox T.G., 1968. The viscosity of polymers and their concentrated solutions.
Adv. Polym. Sci. 5, 261-357;
98
Bunn C.W., Howells E.R., 1954. Structures of molecules and crystals of fluorocarbons.
Nature 274, 549-551;
Callister W.D. Jr., Rethwisch R.G., 2007. Fundamentals of Material Science and
Engineering. An Integrated Approach. Third ed., John Wiley & Sons, Inc.;
Chabert E., Dendievel R., Gauthier C., Cavaille J.-Y., 2004. Predictions of the elastic
response of polymer based nanocomposites: a mean field approach and a discrete
simulation. Comp. Sci. Tech. 64, 309-316;
Dealy J.M., Larson R.G., 2006. Structure and Rheology of Molten Polymers. From
structure to flow behavior and back again. Carl Hanser Verlag, Munich;
Ferry J.D., 1970. Viscoelastic properties of polymers.
John Wiley & Sons, Inc., New York;
Fetters L.J., Lohse D.J., Richter D., Witten T.A., Zirkel A., 1994. Connection between
Polymer Molecular Weight, Density, Chain Dimensions, and Melt Viscoelastic Properties.
Macromolecules 27, 4639-4647;
Fitchmun D.R., Newman S., 1970. Surface Crystallization of Polypropylene.
J. Polym. Sci. Part A-2 8, 1545-1564;
Franck A., 2010. The ARES-EVF: Option for Measuring Extensional Viscosity of Polymer
Melts. TA Instruments, Germany, PN002;
Fuchs K., Friedrich Chr., Weese J., 1996. Viscoelastic Properties of Narrow-Distribution
Poly(methyl methacrylates). Macromolecules 29, 5893-5901;
Gabriel C., Münstedt H., 2003. Strain hardening of various poyolefins in uniaxial
elongational flow. J. Rheol. 47, 619-630;
Gadzinowska K., Piorkowska E., 2003. Influence of sample thickness and surface
nucleation on i-PP crystallization kinetics in DSC measurements. Polimery 48, 790-799;
Galeski A., 2003. Strength and toughness of crystalline polymer systems.
Prog. Polym. Sci. 28, 1643-1699;
Ghijsels A., Ente J.J.S.M., Raadsen J., 1990. Melt strength behavior of PE and its relation
to bubble stability in film blowing. Intern. Polym. Process. 5, 284-286;
Ghijsels A., De Clippeleir J., 1994. Melt strength behaviour of polypropylenes.
Intern. Polym. Process. 3, 2-7;
Haghtalab A., Marzban R., 2011. Viscoelastic properties of nanosilica-filled
polypropylene in the molten state: Effect of particle size. Adv. Polym. Tech. 30, 203-218;
Han C.D., 2007. Rheology and Processing of polymeric materials, Vol.1 Polymer
Rheology. Oxford University Press;

99
Hodder P., Franck A., 2005. A new tool for measuring extensional viscosity. in Annual
Transactions of the Nordic Rheology Society. vol. 13, Aho J. (ed), Juvenes Print, Tampere;
Kasehagen L.J., Macosko C.W., 1998. Nonlinear shear and extensional rheology of long-
chain randomly branched polybutadiene. J. Rheol. 42, 1303-1328;
Keller A., 1968. Polymer crystals. Rep. Prog. Phys. 31, 623-704;
Kim J.-K., Mai Y.-W., 1991. High Strength, High Fracture Toughness Fibre Composites
with Interface Control – A Review. Comp. Sci. Tech. 41, 333-378;
Krause T.H., Kalinka G., Auer C., Hinrichsen G., 1994. Computer simulation of
crystallization kinetics in fiber-reinforced composites. J. Appl. Polym. Sci. 51, 399-406;
Lau S.-F., Suzuki H., Wunderlich B., 1984. The thermodynamic properties
of polytetrafluoroethylene. J. Polym. Sci. Polym. Phys. Ed. 22, 379-405;
Lau H.C., Bhattacharya S.N., Field G.J., 1998. Melt Strength of Polypropylene:
Its Relevance to Thermoforming. Polym. Eng. Sci. 38, 1915-1923;
Laun H.M., Münstedt H., 1978. Elongational behaviour of a low density polyethylene melt
I. Strain rate and stress dependence of viscosity and recoverable strain in the steady-state.
Comparison with shear data. Influence of interfacial tension. Rheol. Acta 17, 415-425;
Léopoldès J., Barrès C., Leblanc J.L., Georget P., 2004. Influence of Filler-Rubber
Interactions on the Viscoelastic Properties of Carbon-Black-Filled Rubber Compounds.
J. Appl. Polym. Sci. 91, 577-588;
Li J.X., Cheung W.L., Jia D., 1999. A study on the heat of fusion of β-polypropylene.
Polymer 40, 1219-1222;
Lin L., Argon A.S., 1994. Review: Structure and plastic deformation of polyethylene.
J. Mater. Sci. 29, 294-323;
Lin Y., Chen H., Chan C.-M., Wu J., 2010. The toughening mechanism of
polypropylene/calcium carbonate nanocomposites. Polymer 51, 3277-3284;
Lippits D.R., Rastogi S., Talebi S., Bailly C.M.E., 2006. Formation of entanglements in
initially disentangled polymer melts. Macromolecules 39, 8882-8885;
Lovell S.E., Ferry J.D., 1961. Influence of molecular weight distribution on viscoelastic
properties of polymers as expressed by the rouse and zimm theories.
J. Phys. Chem. 65, 2274-2276;
Macosko C.W., 1994. Rheology: Principles, Measurements, and Applications.
Wiley-VCH, New York;
Manas-Zloczower I., Tadmor Z.Sunder J., 1994. Mixing and compounding of polymers.
Theory and practice. Hanser, New York;

100
Martuscelli E., Musto P., Ragosta G., 1996. Advanced routes for polymer toughening.
Elsevier, Amsterdam;
Masirek R., 2007. Role of spatial confinement in nucleation of polymer crystallization.
PhD Thesis, Lodz, Poland;
Masirek R. Piorkowska E., 2010. Nucleation of crystallization in isotactic polypropylene
and polyoxymethylene with poly(tetrafluoroethylene) particles.
Eur. Polym. J. 46, 1436-1445;
Mehl N.A., Rebenfeld L., 1993a. Computer simulation of crystallization kinetics and
morphology in fiber-reinforced thermoplastic composites. II. Three-dimensional case.
J. Polym. Sci. Part B: Polym. Phys. 31, 187-193;
Mehl N.A., Rebenfeld L., 1993b. Computer simulation of crystallization kinetics and
morphology in fiber-reinforced thermoplastic composites. II. Two-dimensional case.
J. Polym. Sci. Part B: Polym. Phys. 31, 1677-1686;
Meissner J., 1972. Development of a Uniaxial Extensional Rheometer for the Uniaxial
Extension of Polymer Melts. Trans. Soc. Rheol. 16, 405-420;
Meissner J., 1985. Experimental aspects in polymer melt elongational rheology.
Chem. Eng. Commun. 33, 159-180;
Mittal V., 2010. Optimization of polymer nanocomposite properties.
Wiley-VCH Verlag, Weinhein;
Münstedt H., 1975. Viscoelasticity of polystyrene melts in tensile creep experiments.
Rheol. Acta 14, 1077-1088;
Münstedt H., Laun H.M., 1981. Elongational properties and molecular structure of
polyethylene melts. Rheol. Acta 20, 211-221;
Münstedt H., Kurzbeck S., Egersdörfer L., 1998. Influence of molecular structure on
rheological properties of polyethylenes Part II. Elongational behavior.
Rheol. Acta 37, 21-29;
Nazockdast E., Nazockdast H., Goharpey F., 2008. Linear and Nonlinear Melt-State
Viscoelastic Properties of Polypropylene/Organoclay Nanocomposites.
Polym. Eng. Sci. 48, 1240-1249;
Osman M.A., Atallah A., 2005. Interparticle and particle –matrix interactions in
polyethylene reinforcement and viscoelasticity. Polymer 46, 9476-9488;
Osman M.A., Atallah A., 2006. Effect of the particle size on the viscoelastic properties
of filled polyethylene. Polymer 47, 2357-2368;

101
Perkins W.G., 1999. Polymer Toughness and Impact Resistance.
Polym. Eng. Sci. 39, 2445-2460;
Philips P.J., 1990. Polymer crystals. Rep. Prog. Phys. 53, 549-604;
Piorkowska E., 2001. Modeling of crystallization kinetics in fiber reinforced composites.
Macromol. Symp. 169, 143-148;
Piorkowska E., Galeski A., Haudin J.-M., 2006. Critical assessment of overall
crystallization kinetics theories and predictions. Prog. Polym. Sci. 31, 549-575;
Pucciariello R., Villani V., Mancusi C., 1999. On melt-crystallization of
polytetrafluoroethylene and of random fluorinated copolymers of tetrafluoroethylene.
J. Appl. Polym. Sci. 74, 1607-1613;
Pucciariello R., Villani V., 2004. Melt and crystallization behavior of
poly(tetrafluoroethylene) by temperature modulated calorimetry. Polymer 45, 2031-2039;
Raos G., Moreno M., Elli S., 2006. Computational experiments on filled rubber
viscoelasticity: what is the role of particle-particle interactions?
Macromolecules 39, 6744-6751;
Rastogi S., Spoelstra A.B., Goossens J.G.P., Lemstra P.J., 1997. Chain Mobility in
Polymer Systems: on the Borderline between Solid ans Melt. 1. Lamellar Doubling during
Annealing of Polyethylene. Macromolecules 30, 7880-7889;
Spitael P., Macosko C.W., 2004. Strain Hardening in Polypropylenes and Its Role in
Extrusion Foaming. Polym. Eng. Sci. 44, 2090-2100;
Takahashi M., Isaki T., Takigawa T., Masuda J., 1993. Measurement of biaxial and
uniaxial extensional flow behavior of polymer melts at constant strain rates.
J. Rheol. 37, 827-846;
Toda A., Hikosaka M., Yamada K., 2002. Superheating of the melting kinetics in polymer
crystals: a possible nucleation mechanism. Polymer 43, 1667-1679;
Van der Meer D.W., Milazzo D., Sanguineti A., Vancso G.J., 2005. Oriented
Crystallization and Mechanical Properties of Polypropylene Nucleated on Fibrillated
Polytetrafluoroethylene Scaffolds. Polym. Eng. Sci. 45, 458-468;
Wagner M.H., Bastian H., Hachmann P., Meissner J., Kurzbeck S., Münstedt H., 2000.
The strain-hardening behaviour of linear and long-chain-branched polyolefin melts in
extensional flows. Rheol. Acta 39, 97-109;
Walter R., Friedrich K., Privalko V., Savadori A., 1997. On Modulus and Fracture
Toughness of Rigid Particulate Filled High Density Polyethylene. J. Adhesion 64, 87-109;

102
Wang C., Hwang L.M., 1996. Transcrystallization of PTFE Fiber/PP Composites (I)
Crystallization Kinetics and Morphology. J. Polym. Sci. Part B: Polym. Phys. 34, 47-56;
Wang C., Liu C.R., 1999. Transcrystallization of polypropylene composites: nucleation
ability of fibers. Polymer 40, 289-298;
Wittmann J.C., Smith P., 1991. Highly oriented thin films of poly(tetrafluoroethylene) as
a substrate for oriented growth of materials. Nature 352, 414-417;
Wu S., 1990. Chain Structure, Phase Morphology, and Toughness Relationships in
Polymers and Blends. Polym. Eng. Sci. 30, 753-761;
Wu S., 1992. Control of Intrinsic Brittleness and Toughness of Polymers and Blends by
Chemical Structure: A Review. Polym. Inter. 29, 229-247;
Wunderlich B., 1976. Macromolecular Physics, Volume 2 Crystal nucleation, Growth,
Annealing. Academic Press, Inc., New York;
Wunderlich B., 1980. Macromolecular Physics, Volume 3 Crystal Melting.
Academic Press, Inc., New York;
Yamaguchi M., Suzuki K., 2002. Enhanced Strain Hardening in Elongational Viscosity
for HDPE/Crosslinked HDPE Blend. II. Processablility of Thermoforming.
J. Appl. Polym. Sci. 86, 79-83;
Yang J., Williams R., Peterson K., Geil P.H., Long T.-C., Xu P., 2005. Morphology
evolution in polytetrafluoroethylene as a function of melt time and temperature. Part III.
Effect of prior deformation. Polymer 46, 8723-8733;

103
3.9 Nomenclature
Letters of the Roman Alphabet
a Diameter of liquid drop B Width of an ellipsoid C Degree of crystallinity Ca Capillary number Cacrit Critical capillary number d Density D Deformation of liquid drop Dc Chamber diameter Ds Screw diameter E Modulus of elasticity E’ Storage modulus from bending E’’ Loss modulus from bending ef Efficiency parameter fc Hermans orientation parameters of crystalline phase fa Hermans orientation parameters of amorphous phase G’ Storage modulus (from shearing) G’’ Loss modulus (from shearing) H Rotor clearance ∆Hm Heat of melting (or melting enthalpy or enthalpy of fusion)
∆Hm0 Heat of melting of 100% crystalline polymer
k Parameter (shear sensitivity to the normal stress) l Lamellae thickness L Length of an ellipsoid Mn Number-average molecular weight Mw Weight-average molecular weight n Coefficient (exponent value in the Avrami equation) Nc Rotor speed Ns Screw speed p Viscosity ratio R Local radius of a drop Rav Average spherulite radius R0 Radius of an undisturbed thread R(z) Radius of a disturbance R Average radius of disturbed thread tan δ Loss factor, (= G’’ / G’) tb Disintegration time of a liquid thread Tc Crystallization peak temperature Tg Glass transition temperature Tm Melting peak temperature
0mT Equilibrium melting temperature
Tons Onset melting temperature Tr Trouton ratio UI Izod impact strength Xm Dominant wave number x Rotation angle

104
Capital Greek Letters
φ Orientation angle Ω Dimensionless growth rate of a disturbance Ωm Dimensionless growth rate of dominant disturbance Lower Case Greek Letters
α Disturbance amplitude α0 Original disturbance amplitude α(t) Conversion degree β Growth rate of a disturbance γ Total shear γ& Shear rate
chamberγ& Local average shear rate in a chamber
flightγ& Shear rate over the flight
δ Flight clearance ε Total strain (or strain) &ε Strain rate (or Hencky rate) εb Elongation at break ηc Viscosity of a matrix (or a continuous phase) ηE
+ Transient extensional viscosity
sη Steady shear viscosity
ηS+ Transient shear viscosity λ Disturbance wavelength λm Wavelength of dominant disturbance ω Angular frequency ωc Cross-over frequency (G’=G’’ ) τ Shear stress τc Critical resolved shear stress τ0 Critical resolved shear stress in the absence of any normal stress on the slip planes σ Interfacial tension σb Stress at break σe Basal surface free energy σ/R Interfacial stress σn Resolved stress normal to the slip plane σs Yield stress σy Compressive yield stress

105
3.10 List of patents and papers
Patents:
K. Jurczuk, A. Galeski, E. Piorkowska-Galeska, Polish Patent Application No. P-390607,
Polimerowe nanokompozyty włókniste is sposób ich otrzymywania, 4-03-2010;
K. Jurczuk, A. Galeski, E. Piorkowska-Galeska, European Patent Application No. EP-
11460010, All-polymer fibrillar nanocomposites and method for manufacture of thereof,
6-03-2011;
Papers at various stages of publication that resulted from PhD thesis investigations:
1. All-polymer nanocomposites with nanofibrillar inclusions generated in situ during
compounding.
Macromolecules IF 4.838
2. Polytetrafluoroethylene nanofibers as rheology modifiers for thermoplastic
polymers.
Journal of Rheology IF 3.117
3. Role of polytetrafluoroethylene nanofibers in strain hardening.
European Polymer Journal IF 2.517
4. Continuous extrusion foaming of polypropylene/polytetrafluoroethylene
nanocomposites.
Colloid and Polymer Science IF 2.443

106
3.11 Summary
Polymer nanocomposites represent a new and attractive alternative to
conventionally filled polymers. The virtue of polymer nanocomposites is neither solely
based on the mechanical enhancement of the neat resin nor based on the direct replacement
of current filler or blend technology. Rather, its importance comes from providing value-
added properties not present in the neat resin, without sacrificing the resin’s inherent
processability and mechanical properties or by adding excessive weight. Polymer-polymer
composites are rear and known only when ready-made nanofibers or nanodroplets are
dispersed in the matrix. Previous attempts of formation of polymer nanocomposites with
fibrillar inclusions by compounding were unsuccessful, because it was impossible to
deform a solidified polymer inclusions during compounding, while in a molten state
impossible to preserve the shape of extended threads because of capillary instabilities
leading to their breakup into droplets.
A new idea which has been exploited in this thesis was to use crystalline polymer
inclusions and deform them into nanofibers during compounding by shearing via second
polymer being in the molten state. It is known that deformation of polymer crystals to large
strains is possible when the density of entanglements persisting in the amorphous phase is
drastically reduced. Hence, selection of a polymer for the studies was based on the low
chain entanglement of the polymer forming crystals. Crystallization during polymerization
of tetrafluoroethylene enables formation of polytetrafluoroethylene (PTFE) with large
chain-extended crystals having high melting temperature (higher than its equilibrium
melting temperature) suggesting low entanglement state. Because of reduced density of
entanglements and crystals with extended chains, deformation process of
polytetrafluoroethylene by shearing is possible and easy, so PTFE crystalline powder has
been chosen as crystalline polymer inclusions for further studies. A range of polymer
matrices was used including various polypropylenes, high density polyethylene, low
density polyethylene and polystyrene.
The main objective of this thesis was to generate nanofibers of
polytetrafluoroethylene in situ during compounding solid PTFE particles with
thermoplastic matrix being in a molten state. The influence of a type of
polytetrafluoroethylene, polymer matrix and its viscosity, as well as processing parameters
including shear rate and mixing time on the deformation of PTFE crystals into nanofibers ,
107
has been studied. Other objective of the thesis was to analyze an effect of generated PTFE
nanofibers on the thermal, mechanical, and rheological properties of studied materials.
On the basis of performed experimental studies it has been concluded that
polytetrafluoroethylene nanofibers can be generated in situ during compounding solid
PTFE particles with molten polymer matrix if critical conditions of fibrillation described
below are fulfilled:
(a) polytetrafluoroethylene consists of chain-extended crystals with melting
temperature higher than equilibrium melting temperature being in the range
332÷336 oC;
(b) In order to deform PTFE crystals embedded in a polymer matrix a critical shear
stress, in a slip plane of the PTFE crystal slip systems should be resolved, a shear
stress of the order of few MPa must be reached and exceeded.
(c) Formation of PTFE nanofibers was observed in all molten polymers used as a
matrix, provided that a sufficient shear stress was imposed on the composite either
during compounding or in the shearing rheometer.
It has been shown that larger the deformation ratios and shear rates, and longer the
compounding times enable the formation of thinner and stronger polytetrafluoroethylene
nanofibers that are in the form of entangled network, which in turns drastically changes
thermal, mechanical and rheological properties of generated ‘all polymer’ nanocomposites,
especially causes:
(a) acceleration of crystallization of isotactic polypropylene with
simultaneous elevation of its crystallization temperature, diminution of
the spherulites sizes and their alteration (spherulites of isotactic
polypropylene grow perpendicular to the surface of PTFE nanofibers);
(b) increase in Izod impact strength and stiffness of studied materials and
elevation of glass transition temperature of atactic polystyrene;
(c) alternation of the relaxation dynamics of isotactic polypropylene chains
and in consequence increase in storage modulus more than in loss
modulus;
(d) significant increase in strain hardening of molten linear polymers like
isotactic polypropylene and high density polyethylene that exhibit no
strain hardening itself;
(e) increase in the melt strength of nanocomposites compared to neat
polymers.

108
The results of the thesis enabled a fabrication of new generation of ‘all polymer’
nanocomposites reinforced by polytetrafluoroethylene nanofibers with wide potential
applications. Simplicity of fabrication just by shearing the dispersed crystalline inclusions
in another molten polymers would play very important role in minimizing the costs,
hazardous exposure to nanofillers and environmental impact, all being usually very high
when dealing with ready made nanofillers.