pollution prevention and green chemistry - turi.org in... · pollution prevention and green...
TRANSCRIPT

Pollution Prevention and Green Chemistry
Making Our Industries and Communities Safer, Healthier, and More Competitive (I’m serious)

[email protected] www.turi.org
Pollution Prevention
Massachusetts’ Toxics Use Reduction Act
(TURA)
Green Chemistry and Design for Environment Career Possibilities
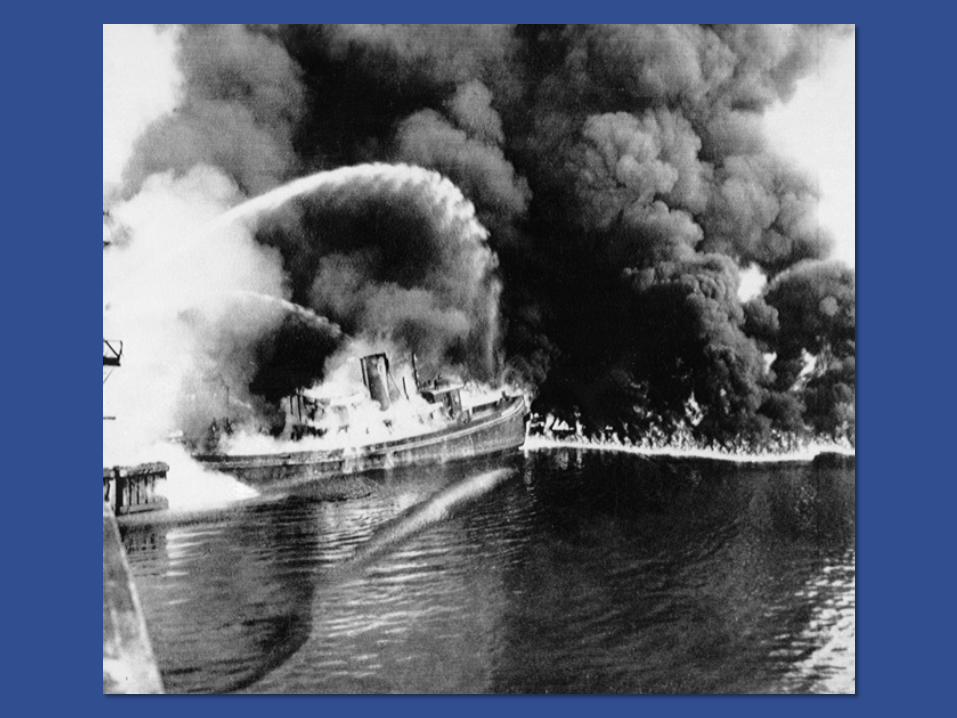
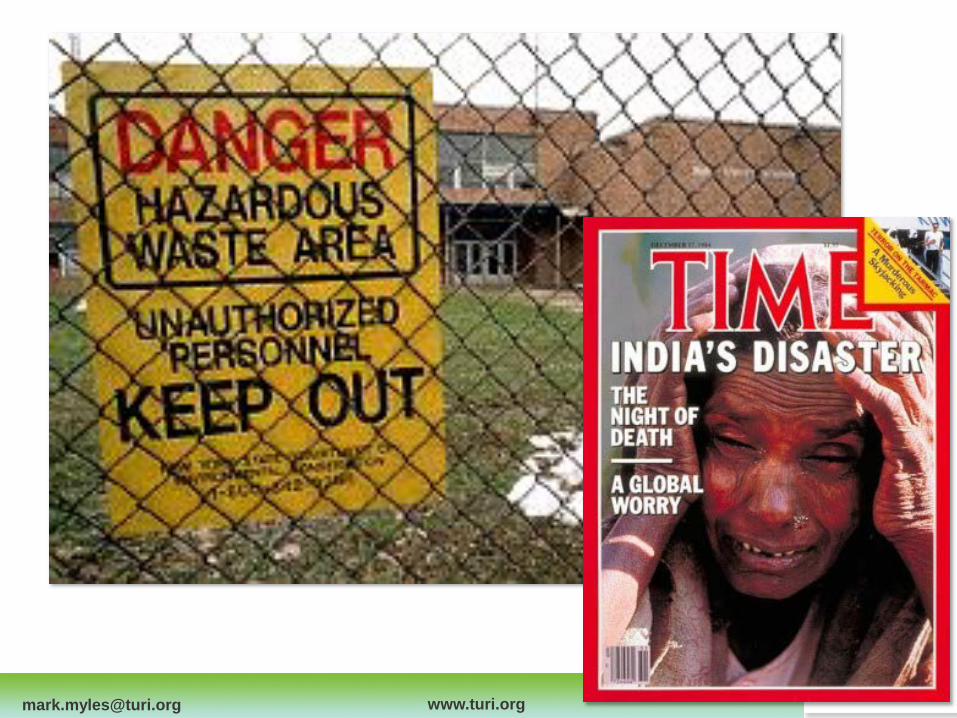
A little history of toxics and pollution prevention

[email protected] www.turi.org

[email protected] www.turi.org


[email protected] www.turi.org
[email protected] www.turi.org

[email protected] www.turi.org


[email protected] www.turi.org
Earl Blumenauer asks the FDA to recall Brazilian Blowout Published: Wednesday, September 28, 2011
Toxics – still newsworthy
EPA Releases Final Health Assessment for TCE Release date: 09/28/2011 WASHINGTON – The U.S. Environmental Protection Agency (EPA) today released the final health assessment for trichloroethylene (TCE) …The final assessment characterizes the chemical as carcinogenic to humans and as a human noncancer health hazard.

[email protected] www.turi.org
Reactionary En
d-of
-the-
pipe
rem
edia
tion
4. Prevention
3. Recycling
2. Treatment
1. Disposal
Anticipatory
1. Prevention
3. Treatment
2. Recycling
SHIFT
4. Disposal

[email protected] www.turi.org
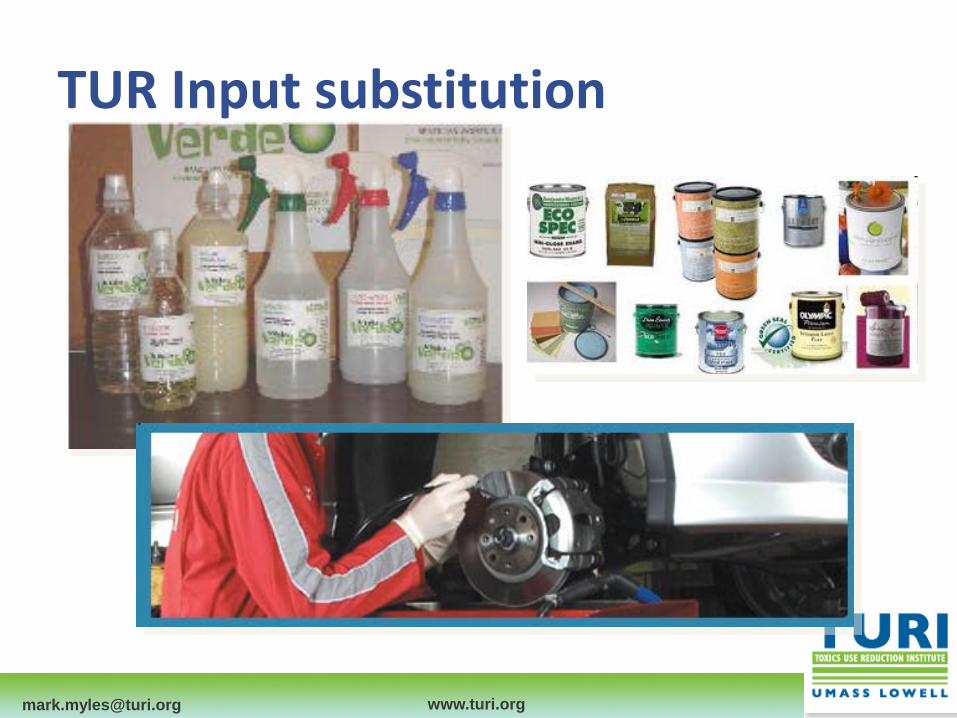
Source Reduction
TUR • Energy Conservation • Cleaner Production
• Resource Conservation
Treatment
Recycling
Waste Disposal Minimization
Energy Recovery
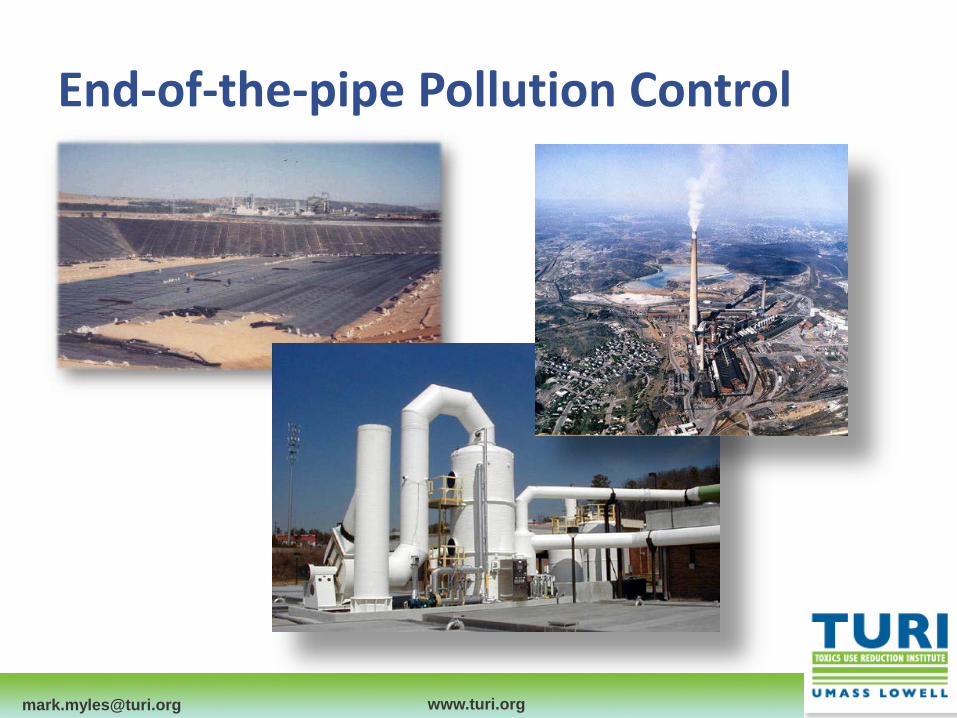
Pollution Control = end of pipe mediation
Pollution Prevention = greater efficiency with less or no toxic material
Pollution Prevention vs Pollution Control
[email protected] www.turi.org
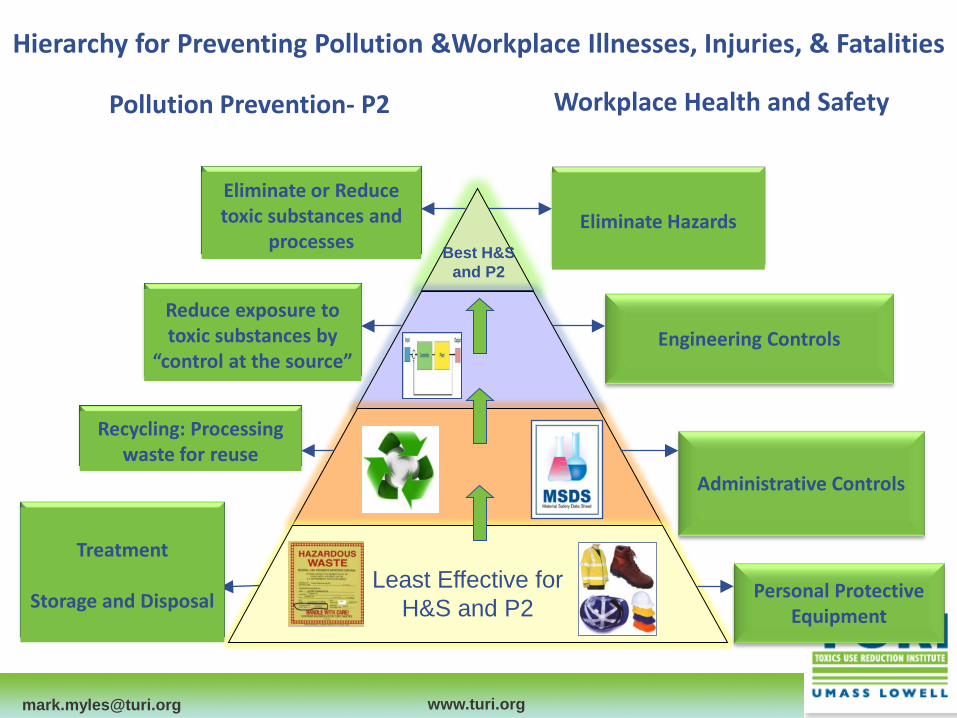
Treatment
Storage and Disposal
Eliminate Hazards
Personal Protective Equipment
Administrative Controls
Reduce exposure to toxic substances by “control at the
source”
Eliminate or Reduce toxic substances and processes
Engineering Controls
Pollution Prevention- P2 Workplace Health and Safety
Least Effective for H&S and P2
Best H&S and P2
Hierarchy for Preventing Pollution &Workplace Illnesses, Injuries, & Fatalities
Recycling: Processing waste for reuse
Treatment
Storage and Disposal
Reduce exposure to toxic substances by “control at the
source”
Eliminate or Reduce toxic substances and processes
Recycling: Processing waste for reuse
Eliminate Hazards
Treatment
Storage and Disposal
Reduce exposure to toxic substances by
“control at the source”
Eliminate or Reduce toxic substances and
processes
Recycling: Processing waste for reuse

[email protected] www.turi.org
Toxics Use Reduction Act (TURA)
• Users of large amounts of toxics must:
– Report toxics use
– Pay fees
– Plan toxics reduction
• 2006 Amendments: – Designates higher and lower hazard substances
– Resource Conservation Planning – energy, water, materials
– Integrates Environmental Management Systems into TUR
Adopted 1989 Effective 1990
Expanded 2006

[email protected] www.turi.org
Required data collection points
Production Unit
In-plant treatment or recycling
Byproduct
Raw Material
Product
Emission

[email protected] www.turi.org
TURA Overview
• Massachusetts competitiveness • Toxics reduction • Technical analysis • Financial analysis • Report toxics use

[email protected] www.turi.org
Did We Achieve the Goals?
19
Total Use Production Adjusted
0.0
200.0
400.0
600.0
800.0
1990
1991
1992
1993
1994
1995
1996
1997
1998
1999
2000
2001
2002
2003
2004
2005
Year
Mill
ions
of P
ound
s
Byproduct
0.020.040.060.080.0
100.0120.0
1990
1991
1992
1993
1994
1995
1996
1997
1998
1999
2000
2001
2002
2003
2004
2005
Year
Mill
ions
of P
ound
s

[email protected] www.turi.org
Toxics Use Reduction Planners
• Only professionals able to certify MA TUR Plans
• 48-hour intensive course
• Certified by exam
TURA 20th Anniversary Video at www.turi.org
“[Becoming a TUR Planner] was a whole new career path….we have new credibility; people listen to us; we became part of the business planning process.”
Jack Bailey, TUR Planner, Bose Corp.

[email protected] www.turi.org
TUR Plans
FINANCIAL ANALYSIS
Draft Project Parameters
Send RFP’s to Vendors
Analyze Proposals for Technical Feasibility
Choose Equipment Based on Technical Merits
Collect Cost Information
Determine Incremental Cash Flows
Apply Measures of Profitability
List Qualitative Issues
Develop Comparative Information
Interpret Results
Prepare Justification Package
Evaluate Performance
TECHNICAL ANALYSIS
QUALITATIVE ANALYSIS
Assess Impacts
Prepare Assessment Map


[email protected] www.turi.org
Alternatives Assessment
Risk Assessment
Better Solutions
Problem-based approach Debates delay prevention Toxicity data limited Risk shifting Game nobody wins
Focus on solutions & opportunities Greater stakeholder participation Promotes innovation, enterprise creation Multi-risk consideration

[email protected] www.turi.org
Green Screen
• Developed by Clean Production Action
• 17 environmental, health and safety criteria
http://www.cleanproduction.org/library/Green_Screen_Report.pdf

[email protected] www.turi.org 32
Car
cino
geni
c
Mut
agen
ic
Rep
rodu
ctiv
e
Dev
elop
men
tal
Endo
crin
e D
isru
ptio
nN
euro
logi
cal
Met
abol
ites
Deg
rada
tion
Prod
ucts
DecaBDE 1163-19-5 97 M L L M M M L L L nd L L nd L L vH Mpenta- to nona-BDE
tri- to nona-BDE
PentaBDE 32534-81-9 nd L M M H M L H L L M M nd H H vH vH
OctaBDE 32536-52-0 nd L M H M M L H L nd L L nd L L vH M ndlower
PBDEs
Human Health Effects Ecotox. Fate
Chr
onic
Pers
iste
nce
Bioa
ccum
ulat
ion
Breakdown Products
Decabromodiphenyl ether (decaBDE) - CAS# 1163-19-5
Bold text = based on experimental data. Black italics text= based on analog data or expert judgment.
Breakdown ProductsPriority Effects
Acut
e To
xici
tySy
stem
ic/O
rgan
Effe
cts
Sens
itiza
tion
(ski
n)
Sens
itiza
tion (
resp
irato
ry)
Irrita
tion/
Cor
rosi
on (s
kin)
Irrita
tion/
Cor
rosi
on
(eye
s)Im
mun
e Sy
stem
Effe
cts
Acut
e
Chemical CAS#%
in F
orm
ulat
ion
Green Screen Benchmarking DecaBDE

[email protected] www.turi.org
TUR Planning Process
• Planning viewed as a continual improvement cycle
33
Implement
Evaluate
Review
Continual Improvement…
Modify
Evaluate
Review Plan (year 0)
Update (year 2)


[email protected] www.turi.org
Great Philosophical Dilemmas of the 21st Century
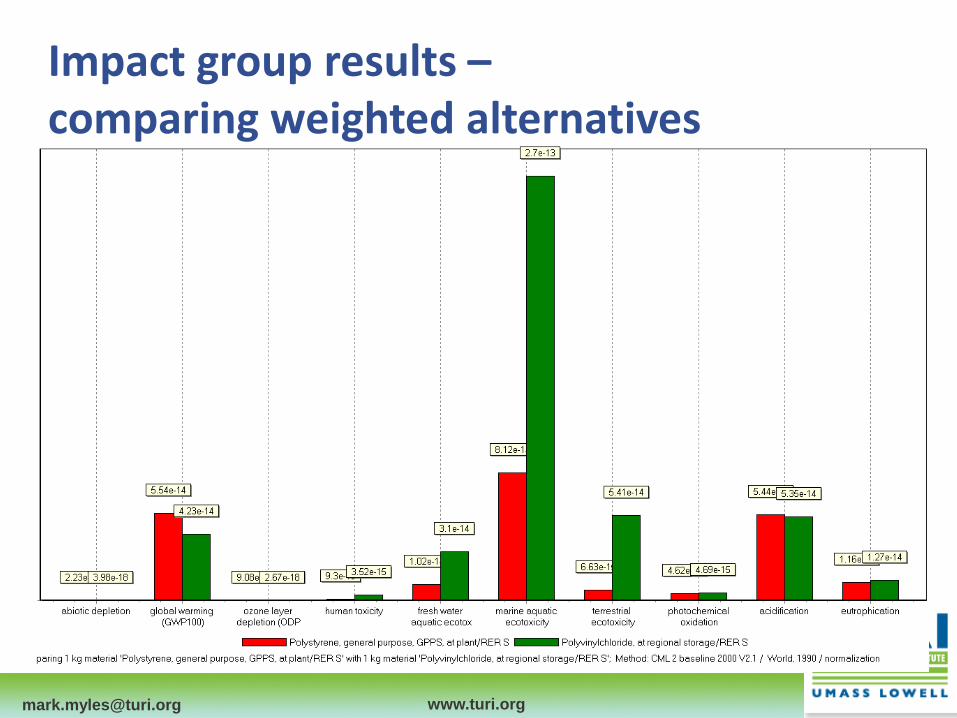
Plastic? (polystyrene)
OR
Paper?
[email protected] www.turi.org
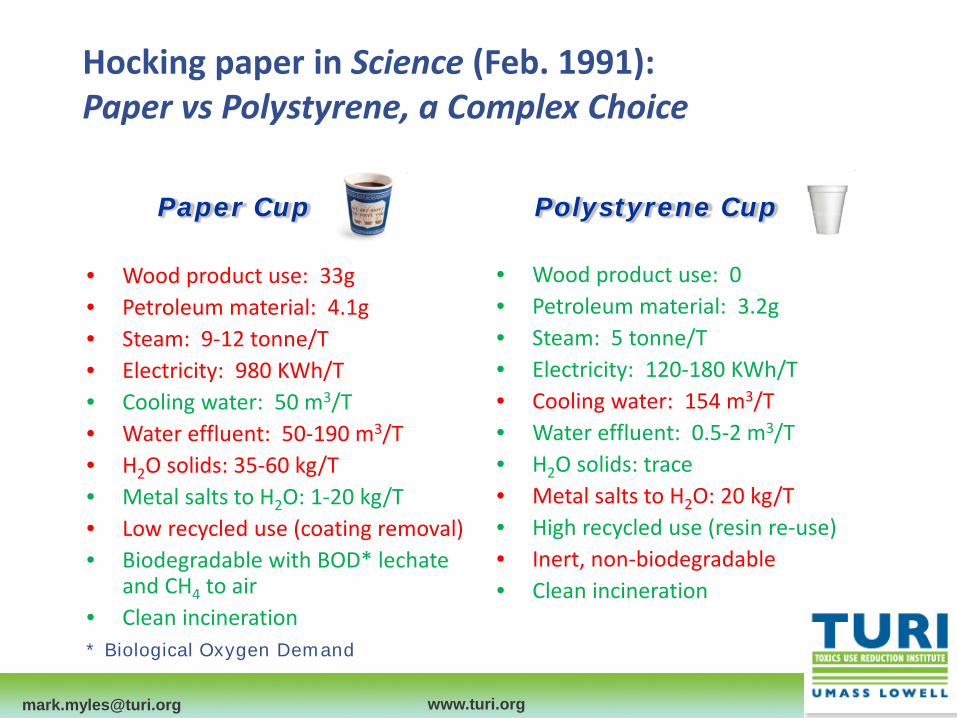
Hocking paper in Science (Feb. 1991): Paper vs Polystyrene, a Complex Choice
• Wood product use: 33g • Petroleum material: 4.1g • Steam: 9-12 tonne/T • Electricity: 980 KWh/T • Cooling water: 50 m3/T
• Water effluent: 50-190 m3/T • H2O solids: 35-60 kg/T • Metal salts to H2O: 1-20 kg/T • Low recycled use (coating removal) • Biodegradable with BOD* lechate
and CH4 to air • Clean incineration
• Wood product use: 0 • Petroleum material: 3.2g • Steam: 5 tonne/T • Electricity: 120-180 KWh/T • Cooling water: 154 m3/T
• Water effluent: 0.5-2 m3/T • H2O solids: trace • Metal salts to H2O: 20 kg/T • High recycled use (resin re-use) • Inert, non-biodegradable • Clean incineration
Paper Cup Polystyrene Cup
* Biological Oxygen Demand
[email protected] www.turi.org
Criticisms of Hocking
• No consideration of human toxicity • No consideration of eco-toxicity • Styrofoam not economical to recycle • Some quantities double-counted

[email protected] www.turi.org
DfE Definitions • “…product contains only those
ingredients that pose the least concern [regarding human health and environmental effects] among chemicals in their class.”
• “Ecodesign aims at reducing the environmental impact of products, including the energy consumption throughout their entire life cycle.”

[email protected] www.turi.org
“The DfE program has three priorities: • Energy efficiency - reduce the energy needed
to manufacture and use our products
• Materials innovation - reduce the amount of materials used in our products and develop materials that have less environmental impact and more value at end-of-life
• Design for recyclability - design equipment that is easier to upgrade and/or recycle”
DfE Definitions


[email protected] www.turi.org
Drivers: Legislation
REACh RoHS TURA ToSCA
EU Energy CA Appliance Efficiency
MA “Stretch Codes”
Energy
Toxics Resource Conservation
WEEE ELV
EU Ecodesign Directive: all 3

[email protected] www.turi.org
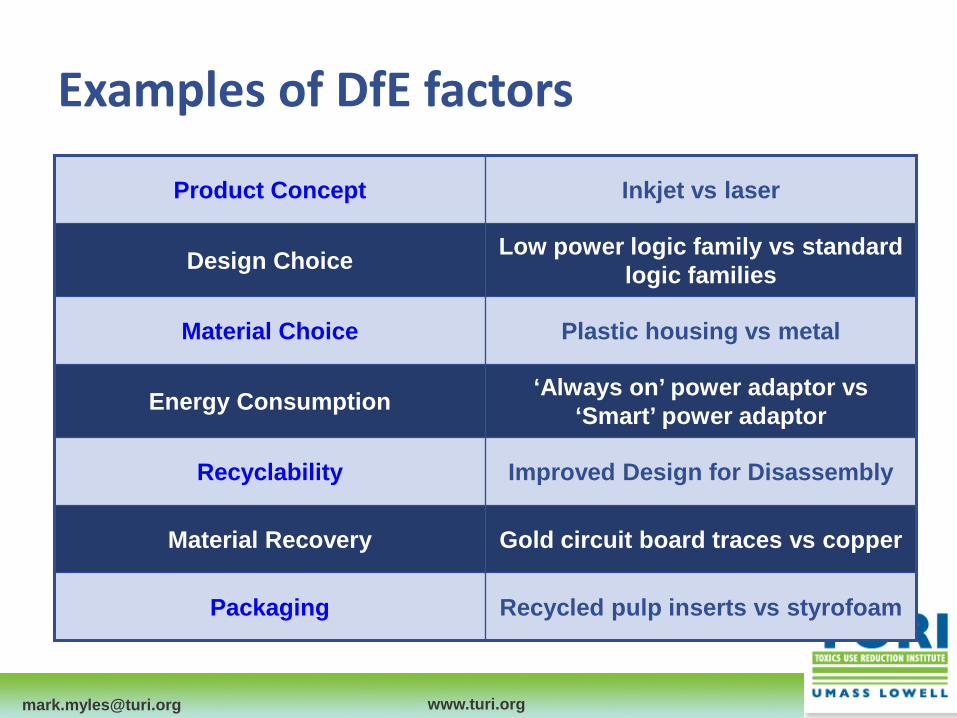
Examples of DfE factors
Low power logic family vs standard logic families Design Choice
Recycled pulp inserts vs styrofoam Packaging
Gold circuit board traces vs copper Material Recovery
Improved Design for Disassembly Recyclability
‘Always on’ power adaptor vs ‘Smart’ power adaptor Energy Consumption
Plastic housing vs metal Material Choice
Inkjet vs laser Product Concept
[email protected] www.turi.org
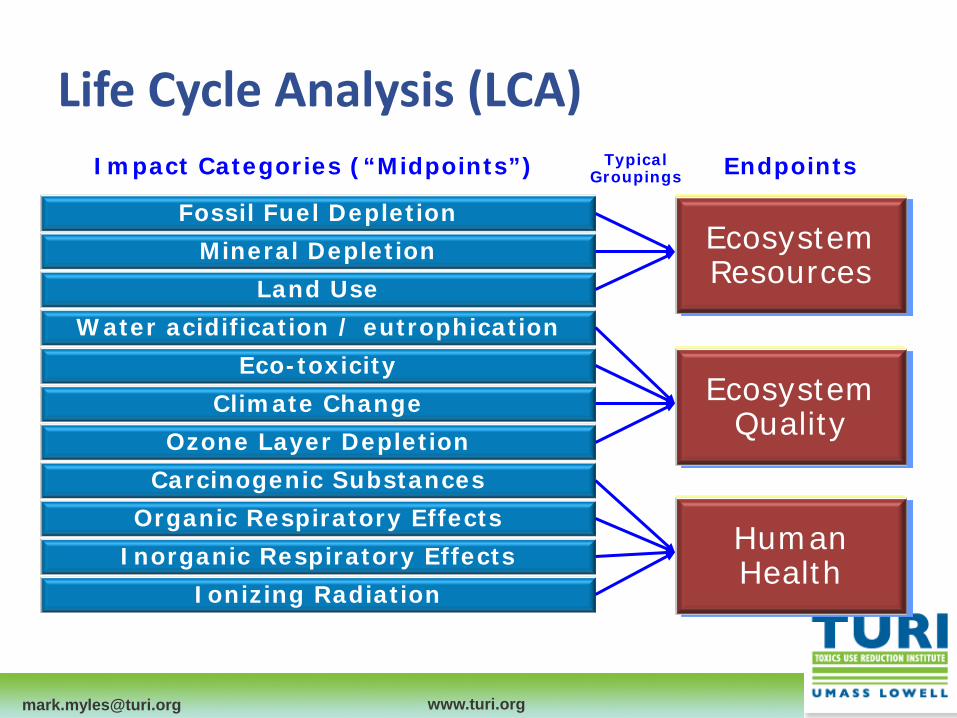
Life Cycle Analysis (LCA)
Fossil Fuel Depletion Mineral Depletion
Land Use Water acidification / eutrophication
Eco-toxicity Climate Change
Ozone Layer Depletion Carcinogenic Substances
Organic Respiratory Effects Inorganic Respiratory Effects
Ionizing Radiation
Ecosystem Resources
Ecosystem Quality
Human Health
Impact Categories (“Midpoints”) Typical Groupings Endpoints
Ecosystem Resources
Ecosystem Quality
Human Health
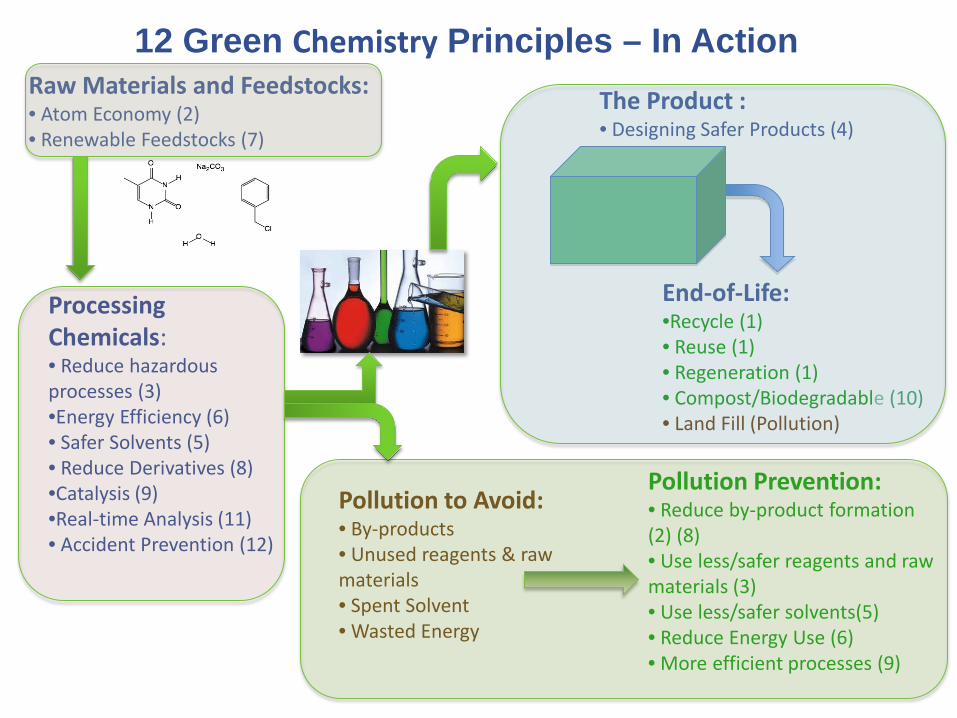
Processing Chemicals: • Reduce hazardous processes (3) •Energy Efficiency (6) • Safer Solvents (5) • Reduce Derivatives (8) •Catalysis (9) •Real-time Analysis (11) • Accident Prevention (12)
The Product : • Designing Safer Products (4)
End-of-Life: •Recycle (1) • Reuse (1) • Regeneration (1) • Compost/Biodegradable (10) • Land Fill (Pollution)
Pollution to Avoid: • By-products • Unused reagents & raw materials • Spent Solvent • Wasted Energy
Pollution Prevention: • Reduce by-product formation (2) (8) • Use less/safer reagents and raw materials (3) • Use less/safer solvents(5) • Reduce Energy Use (6) • More efficient processes (9)
Raw Materials and Feedstocks: • Atom Economy (2) • Renewable Feedstocks (7)
12 Green Chemistry Principles – In Action
[email protected] www.turi.org
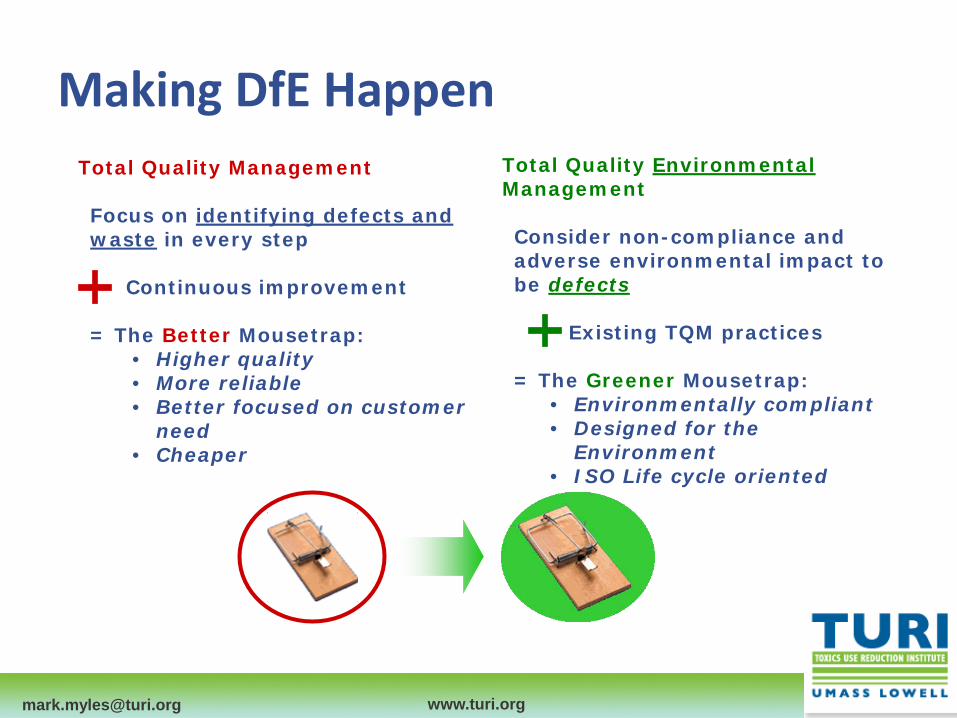
Making DfE Happen Total Quality Management Focus on identifying defects and waste in every step
Continuous improvement = The Better Mousetrap:
• Higher quality • More reliable • Better focused on customer
need • Cheaper
Total Quality Environmental Management Consider non-compliance and adverse environmental impact to be defects
Existing TQM practices
= The Greener Mousetrap:
• Environmentally compliant • Designed for the
Environment • ISO Life cycle oriented

[email protected] www.turi.org
TUR & 6-sigma Quality Management
>$1M in efficiency improvements
$100K scrap
reduction
70% VOC reduction
$15K saved by reducing VOCs

[email protected] www.turi.org
Quality Costs
Supplier Inspection
Incoming Inspection
Fabrication Inspection
Sub-product Test
Final Product Test
Field Service
0.003 0.03
0.30
$3
$30
$300
Quality costs escalate as value is added to a product or service
Cost of finding and correcting a defective electronic component
P. Crosby & Associates, 1979

[email protected] www.turi.org
Environmental Quality Costs
Product concept
Landfill, incineration, etc.
Environmental cleanup
Manufacture
Design
Use
Life Cycle Costs escalate at later stages of the Life Cycle
Life Cycle Cost of a toxic material
“Most environmental costs are incurred on the first day of product development”
[email protected] www.turi.org
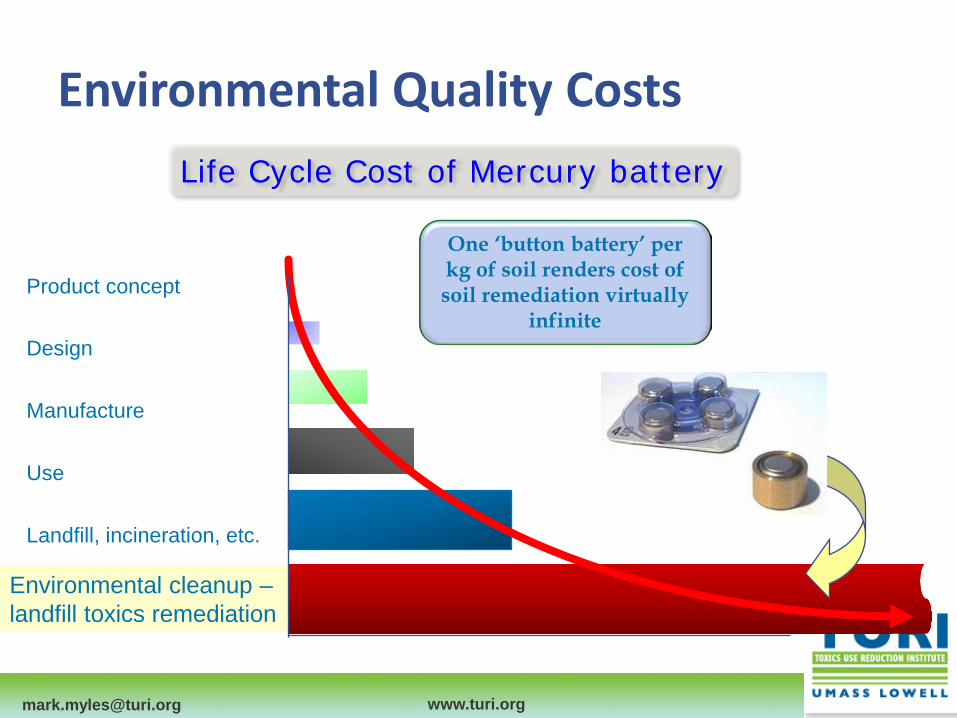
Environmental Quality Costs
Product concept
Landfill, incineration, etc.
Environmental cleanup – landfill toxics remediation
Manufacture
Design
Use
Life Cycle Cost of Mercury battery
One ‘button battery’ per kg of soil renders cost of soil remediation virtually
infinite
[email protected] www.turi.org
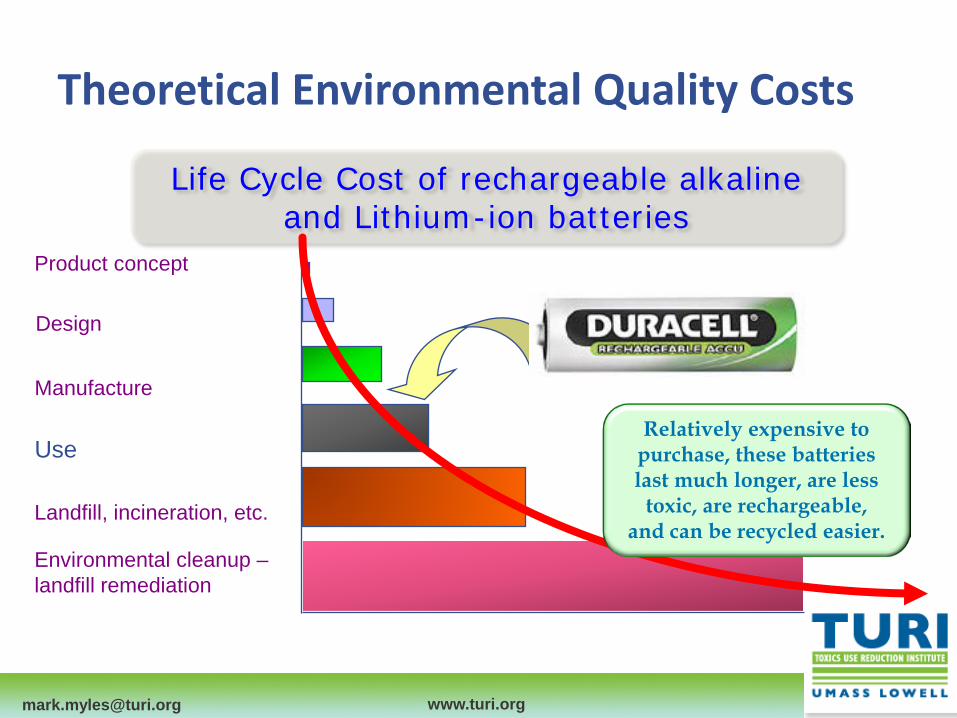
Theoretical Environmental Quality Costs
Product concept
Landfill, incineration, etc.
Environmental cleanup – landfill remediation
Manufacture
Design
Use
Life Cycle Cost of rechargeable alkaline and Lithium-ion batteries
Relatively expensive to purchase, these batteries last much longer, are less
toxic, are rechargeable, and can be recycled easier.
[email protected] www.turi.org
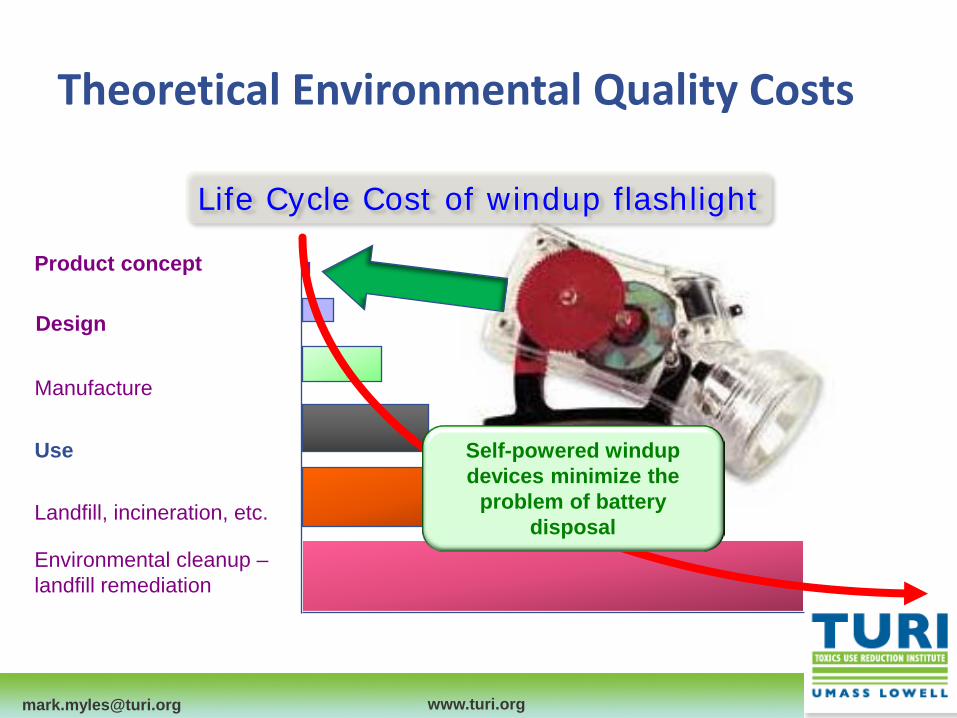
Theoretical Environmental Quality Costs
Product concept
Landfill, incineration, etc.
Environmental cleanup – landfill remediation
Manufacture
Design
Use Self-powered windup devices minimize the
problem of battery disposal
Life Cycle Cost of windup flashlight
[email protected] www.turi.org
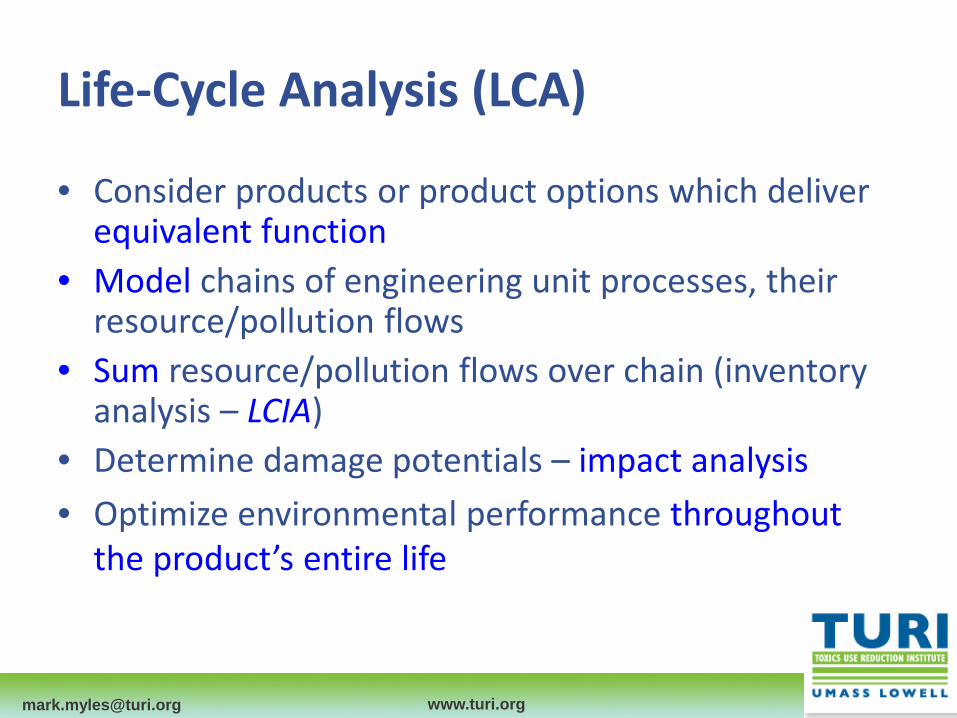
Life-Cycle Analysis (LCA)
• Consider products or product options which deliver equivalent function
• Model chains of engineering unit processes, their resource/pollution flows
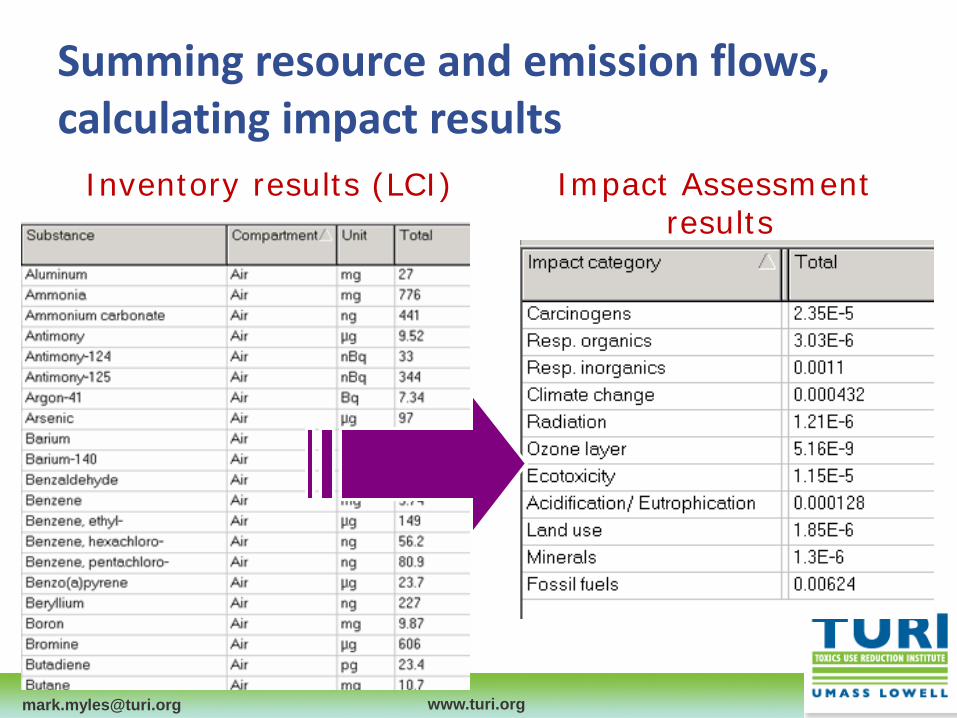
• Sum resource/pollution flows over chain (inventory analysis – LCIA)
• Determine damage potentials – impact analysis • Optimize environmental performance throughout
the product’s entire life

[email protected] www.turi.org
Modeling unit functions
Extractions from the environment • Fuel • Materials • Land, water, air, etc.
Could be from biosphere or technosphere
Emissions to the environment • To air • To water
Product or service
From previous unit
process(es)
To next unit process(es)


[email protected] www.turi.org
Life Cycle Analysis (LCA)
Fossil Fuel Depletion Mineral Depletion
Land Use Water acidification / eutrophication
Eco-toxicity Climate Change
Ozone Layer Depletion Carcinogenic Substances
Organic Respiratory Effects Inorganic Respiratory Effects
Ionizing Radiation
Ecosystem Resources
Ecosystem Quality
Human Health
Impact Categories (“Midpoints”) Typical Groupings Endpoints
Ecosystem Resources
Ecosystem Quality
Human Health
[email protected] www.turi.org
Summing resource and emission flows, calculating impact results
Inventory results (LCI) Impact Assessment results

[email protected] www.turi.org
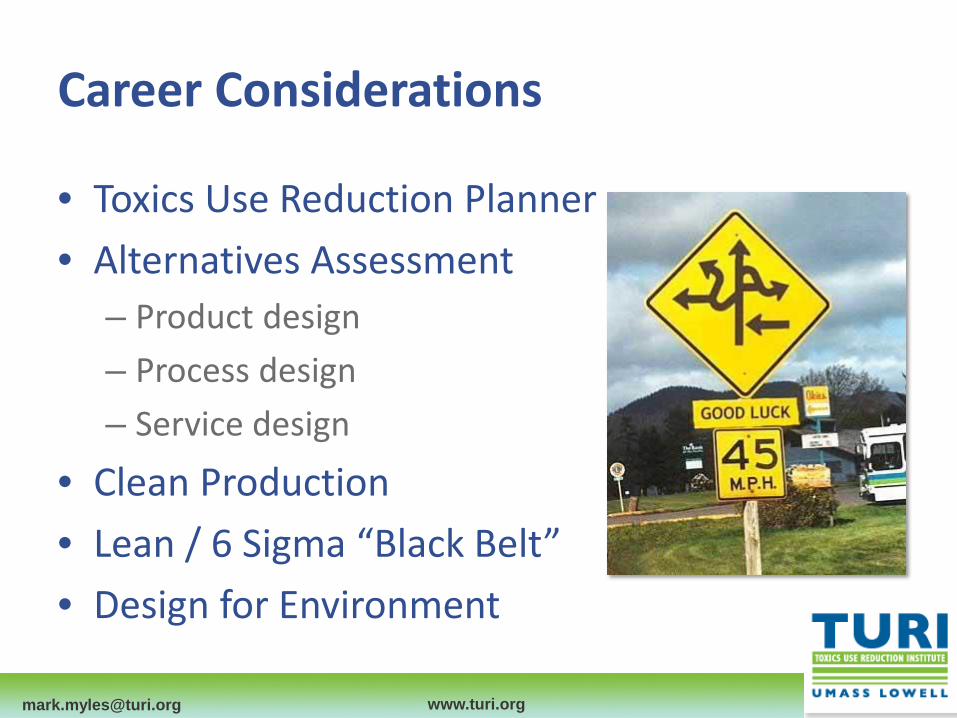
Career Considerations
• Toxics Use Reduction Planner • Alternatives Assessment
– Product design – Process design – Service design
• Clean Production • Lean / 6 Sigma “Black Belt” • Design for Environment

We can't solve problems by using the same kind of thinking
we used when we created them. Albert Einstein
[email protected] +1 978.934.3298