pollinators in the biology classroom teacher resources
TRANSCRIPT

P a g e | 1
Pollinators in the Biology Classroom Teacher Resources Summary Pollinators in the Biology Classroom is a standards-aligned, 5-E life science unit that teaches about aerobic and anaerobic respiration, genetics, biotechnology, and food safety in the context of honey bees. Students will learn about genetic factors that influence food resource preference. A gel electrophoresis simulation introduces students to a biotechnology tool that allows scientists to investigate how genetics affect honey bee behavior. A cellular respiration lab will allow students to examine the chemical changes that can ferment honey and how these changes affect food preservation and food safety both in the hive and on our store shelves. Lastly, students will extend their learning to a larger context by exploring the honey bee’s role in socioscientific issues including maintaining a safe food supply and overcoming the challenge of food preservation in areas lacking consistent electricity for refrigeration. Grade Level 9-12 Contents Lesson 1 | Good Taste: Forager Food Preference .................................................................................................... 2
Lesson 2 | Fermentation of Honey ........................................................................................................................... 19
Lesson 3 | Preservation Power of Honey ................................................................................................................ 32
Lesson 4 | Honey as a Biomolecule .......................................................................................................................... 42
Lesson 5 | Imported Food Safety .............................................................................................................................. 50
Contents address the following Next Generation Science Standards
• HS-LS1-7 Use a model to illustrate that cellular respiration is a chemical process whereby the bonds of food molecules and oxygen molecules are broken and the bonds in new compounds are formed resulting in a net transfer of energy
• HS-LS2-2 Use mathematical representations to support and revise explanations based on evidence about factors affecting biodiversity and populations in ecosystems of different scales.
• HS-LS3-1 Ask questions to clarify relationships about the role of DNA and chromosomes in coding the instructions for characteristic traits passed from parents to offspring.
• HS-ETS1-1 Analyze a major global challenge to specify qualitative and quantitative criteria and constraints for solutions that account for societal needs and wants.
Authors Burke Morrow, Biology and Earth Science Teacher, Lincoln East High School, Lincoln, Nebraska Erin Ingram, Curriculum Development Specialist, University of Nebraska-Lincoln, IANR Science Literacy

P a g e | 2
Lesson 1 | Good Taste: Forager Food Preference Background Purpose Students will examine data about the foraging behavior of bees. They will then predict if the bee’s behavior is related to its ability to detect minimal concentrations of sugar. Students will determine which type of foraging bee would be best for pollination or honey production. Students will learn about the process of gel electrophoresis as a genetic tool. They will then analyze DNA to identify better pollen-collecting bees.
Education Standards Next Generation Science Standards HS-LS3-1 Ask questions to clarify relationships about the role of DNA and chromosomes in coding the instructions for characteristic traits passed from parents to offspring. Common Core RST.11-12.9 Synthesize information from a range of sources (e.g. texts, experiments, simulations) into a coherent understanding of a process, phenomenon, or concept, resolving conflicting information when possible.
Estimated Time Two, 50-minute class periods
Student Materials Each lab group will need:
• 1 gel electrophoresis card • Small bowl • Washing soda solution • Spoon to stir • 1 student worksheet per student • Activity 1 field notes
Teacher Materials
• Answer key • Gel electrophoresis template and instructions • Gel electrophoresis notecards (made using instructions)
o Phenolphthalein o Q-tip o Card stock (4 gel electrophoresis cards per sheet) o Ziplock bag (for storage of cards)

P a g e | 3
Vocabulary
• response threshold: Likelihood of reacting to task-associated stimuli • Proboscis Extension Response (PER): a method for measuring a bee’s response threshold to
sugar • deoxyribonucleic acid (DNA): molecules inside cells of all living things that carry genetic
information and pass characteristic traits from one generation to the next • chromosomes: organized package of all DNA found in the nucleus of the cell • genes: sections of DNA on a chromosome that code for the proteins our body needs to function • DNA fingerprinting: tool used by biologists that analyzes an individual’s unique collection of
DNA • restriction enzyme: enzyme that cuts DNA at a sequence of nucleotides • gel electrophoresis: procedure used to separate and analyze DNA fragments by placing a mixture
of DNA fragments at one end of a porous gel and applying an electric voltage to the gel
Key STEM Ideas Heritable information is passed from parents to offspring via molecules of DNA. This information directs an organism’s growth, development, functioning, and reproduction. DNA of living organisms is responsible, in part, for characteristics or traits (such as sensitivity in taste perception). Genetic tools including gel electrophoresis can be used to analyze an organism’s DNA.
Students’ Prior Knowledge Students should be familiar with the steps in an experiment: formulating a research questions, developing a testable hypothesis, gathering, recording, analyzing, and interpreting data, and drawing conclusions from evidence. Students should be familiar with what DNA is and aware that heritable traits are passed down from parents to offspring. This lesson will introduce genetic tools or techniques useful when examining genetic information.
Connections to Agriculture Quality and yield of fruit, nut, and vegetable crops are improved with adequate pollination by insects such as bees. Honey bees add an estimated $19 billion in added value to agricultural crops (Calderone, 2012). The proper functioning of a honey bee colony depends on all needs in the hive being met by a diverse group of workers. One of the key needs of the colony is foraging for nectar and pollen from flowering plants. Female worker bees accomplish the gathering of these food resources through a division of labor. Bees are genetically and environmentally predisposed to prefer either sweet nectar or not-so-sweet pollen. A more genetically diverse colony will stand a better chance of gathering all the food resources it needs for survival. In addition, successful honey bee colonies will be better pollinators of our fruits, nuts, and vegetables. Even when colonies are healthy, some are better at pollinating than others. Genetics play an important role in determining the types of traits a colony possesses.

P a g e | 4
Genetic testing of bees for their pollen or nectar gathering preference can be used in research programs seeking out new and potentially valuable traits that can benefit the beekeeping industry and growers relying on honey bees for pollination services.
Essential Links
• Proboscis Extension Response video: https://youtu.be/-_cXqda1BZA • Gel electrophoresis and DNA fingerprinting simulation:
http://www.pbslearningmedia.org/asset/tdc02_int_creatednafp2/
Sources/Credits
• $19 billion value of honey bees to U.S. agricultural value from Calderone, 2012 found here: http://journals.plos.org/plosone/article?id=10.1371/journal.pone.0037235
• AgNote: “Pollination of apples by honey bees” by Doug Somerville of New South Wales Department of Agriculture found here: http://www.dpi.nsw.gov.au/__data/assets/pdf_file/0018/117108/bee-apple-pollination.pdf

P a g e | 5
Lesson Procedures Engage
1. Offer students a choice between a sweet and a salty food. After students have selected their choice, facilitate discussion about why some students love sweet things and others like salty ones. Discuss with students what factors might impact our sense of taste.
Explore and Explain Activity 1: Foraging behavior experiment
2. Give each student a worksheet to document their work and a copy of the experiment 1 field notes. Read with students about materials gathered by honey bees (nectar for energy, pollen for proper development, and water to cool the colony). Have students work individually to read about the experiment.
3. Have students identify the research question. 4. Discuss the experimental set-up
a. Plastic numbered tags are glued to the back of 50 worker bees b. Bees are returned to the colony and allowed to forage as usual c. As the bees return to the hive from foraging, the student can capture and examine the bee to
determine what resource has been brought home (pollen will be carried on the leg in a pellet, nectar or water can be regurgitated by the bee by gently applying pressure to the abdomen)
5. Ask if students think that the type of resource brought home is randomly selected by the bees or if certain bees are specialized to bring home specific resources. Have students use their answers to develop a testable hypothesis.
6. Have students work in pairs to complete the data table using the field notes and use this data to answer the remaining questions. Discuss if the data supported their hypothesis or not (depending on their hypothesis, it may or may not be supported). Encourage critical thinking by having students discuss why water is brought back only in the afternoon (hotter temperature require cooling of the hive) and why some foragers returned to the hive with no resource (students don’t need to know this yet, just discuss possible reasons such as maybe they couldn’t find anything, maybe nothing was attractive enough to bring back).
7. Discuss possible reasons why bees might specialize for certain resources. (It might be a learned response, it could be a genetic trait, etc.)
Explore and Explain Activity 2: Proboscis Extension Response
8. Read the introduction for Activity 2. Review a few key points: a. A proboscis is like the bee’s tongue. b. Antennae act like the bee’s nose, but can also detect a resource’s level of sweetness. c. Nectar is made of sugars and is sweet. Pollen is not made of sugar and is not sweet.
9. Explain that a test can be performed to determine the point at which bees can detect sugar. This test is called the Proboscis Extension Response (PER) assay. Have students watch the video of a PER assay: https://youtu.be/-_cXqda1BZA
a. A sugar solution is applied to the antenna of a restrained bee. b. The bee will reflexively extend its tongue to seek out the sugary reward IF it can detect the
sugar content in the solution. c. A series of sugar concentrations can be tested to determine the bee’s response threshold (the
lowest sugar concentration that will elicit a positive response). d. Bees can be identified as having a relatively high or low response threshold depending on
their sensitivity to sugar.

P a g e | 6
10. Based on what students have learned about PER, have student predict foraging behavior for bees with high and low PER thresholds. Apply their predictions to the bees that were tested in the earlier experiment to determine which bees would have high and low PER thresholds.
11. Have students examine the graph showing data from a PER assay experiment. Apply information learned from this graph to determine if the student’s hypothesis was supported. (Yes, it was supported. A greater portion of pollen collecting bees responded to low concentrations of sugar. A smaller portion of nectar collectors responded to low concentrations. Instead, nectar collectors responded only to high concentrations of sugar.)
Extend Activity 3: Gel electrophoresis and DNA fingerprinting as genetic tools
12. Explain to students that now that we have learned that foragers specialize in what resources they bring home and that these specialized foragers also respond differently to sugar, we can start to examine what might be the reason or mechanism for these differences. Could there be a genetic component to explain this difference in ability to perceive sweetness?
13. Have students read the introduction to Activity 3 and work through the DNA fingerprinting simulation: http://www.pbslearningmedia.org/asset/tdc02_int_creatednafp2/
14. As the lab groups experience the simulation, have them write the purpose of each step in the DNA fingerprinting process.
15. Discuss answers as a group and explain that DNA fingerprinting is one way of analyzing a DNA sample. The location of the cuts made by the restriction enzyme all occur at the same nucleotide sequence (or restriction site), but depending on the DNA sequence, the size of the resulting bands will be unique just like a fingerprint! The differences seen in the gel electrophoresis are a result of the different sizes of DNA.
Activity 4: Analyzing forager DNA 16. Read with students about Activity 4. Explain that while the genes responsible for pollen- and nectar-
collecting are still being researched, the following activity simulates how DNA testing might one day be used to visualize the genetic differences between these two strains.
17. Instruct students to use the sample DNA cuts as a guide and mark the cuts on the pollen and nectar collector DNA. Document the number of cuts and segments made by the restriction enzyme in the table. Answer the follow-up questions.
Activity 5: Using gel electrophoresis to identify unknown bees 18. Split students up into lab groups. Have students read through procedures before they begin. Instruct
groups to gather their lab materials and begin. a. Fill bowl approximately 1/2 full with water, add 0.5 tsp of washing soda solution. Mix with
spoon. b. Dip card into solution until pink dots become visible and quickly remove it. c. Briefly sketch results into the data table.
19. Using what they learned from the DNA fingerprinting simulation and their answers from Activity 4, have students answer the follow-up questions.
Reflection and Application to Agriculture 20. Have students discuss and reflect on how foraging behavior may impact pollination effectiveness or
honey production potential. a. “Nectar gatherers quite often forage around the base of the flower and are not as vigorous
on the blossom as pollen gatherers. Pollen gatherers are usually more vigorous on the blossom. As a result, pollen gatherers have more pollen on their body hairs than nectar gatherers. This must enhance their value as pollinators. Because honey bees collecting pollen contact the anthers and stigmas and usually work faster than nectar gatherers, they are regarded as more efficient pollinators. In one trial, nectar-gathering bees set 31% of the

P a g e | 7
flowers and fertilized 15% of the ovules, whereas the pollen gatherers set 46% of the flowers and fertilized 28% of the ovules.” (From “AgNote: Pollination of apples by honey bees” by Doug Somerville of New South Wales Department of Agriculture)
21. Discuss how honey bee queen breeders might select for nectar foraging behavior if they are selling to honey producers or pollen foraging behavior if they are selling to commercial beekeepers who pollinate. Point out that this optimizes the work of the bees for the grower or beekeeper, but not necessarily for the needs of the hive. This is the trade-off.

P a g e | 8
Answer Key Activity 1: What determines a worker bee’s role in the hive? A hive is in constant need of materials such as pollen, water, and nectar. Worker bees forage to supply the hive with these materials. As the colony’s needs change, so do the resources that are collected. Pollen serves as a protein source and is needed in greater abundance when the colony has young offspring. Nectar is a carbohydrate which serves as an energy source. Water is brought back and evaporated to keep the colony cool on a hot day. A student wondered if worker bees shared equally in bringing each type of material to the hive or if there was a division of labor where workers were specialized for different materials. To determine which was correct, the student set up an experiment. To monitor the behavior of specific bees, the student glued plastic, numbered tags to 50 worker bees. She monitored foraging activity at the hive entrance. The student recorded which resources each numbered bee brought back to the nest in her field notes. What is the student’s research question? Do worker bees share equally in bringing each type of material to the hive or is there a division of labor where workers are specialized for different materials? Form a hypothesis for the research question. If there is a division of labor for different materials, then individual bees will continue to bring back the same resources. OR If labor is equally divided, all bees will bring back all types of resources. Use the researcher’s data in the field notes to complete the data table. Table 1:
Bee number Time Point 1 Time Point 2 Time Point 3 Time Point 4 10 - Pollen Water Water
17 Pollen Pollen Water Water
23 - Nectar Nectar Nectar
26 - Nectar Nectar None
34 None None Nectar Nectar
37 - Pollen Water Water
42 Pollen Pollen - -
44 Nectar None None Nectar
Figure 1: Worker bee with plastic numbered tag
17

P a g e | 9
Categorize the bees by their number into two groups. Why did you group them in this manner? Group 1: Bees 10, 17, 37, 42- this group collected water or pollen Group 2: Bees 23, 26, 34, 44- this group collected nectar or nothing Does this data suggest that there is a division of labor in the hive? Explain. Yes. The bees appeared to have specific jobs within the hive. At what point in the day was water was returned to the hive? Suggest a reason. In the afternoon, after 2 pm—the temperature was hotter at this time of day and bees use water to cool the hive. Bees #26, 34, and 44 returned empty on at least one of their foraging trips. Do you think this is related to the time of day that bees foraged? Explain. No. The empty returns were scattered throughout the day. Suggest a reason why Bees 26, 34, and 44 might have returned to the hive without a resource. They could have been unsuccessful in their foraging trip. From the previous data, you should have concluded that there are two strains of bees: those that forage for nectar and those that forage for pollen and water. Why might worker bees be divided into two strains? Discuss and list 3 possible reasons. Accept reasonable answers: this may be a learned behavior, genetic differences lead to different foraging habits, ability to detect sugar may influence foraging behavior, etc.

P a g e | 10
Activity 2: Learning about the Proboscis Extension Response (PER) The student wonders if a honey bee’s foraging behavior is related to their ability to detect sugar. The student hypothesizes if a bee is a nectar collector, then that bee is more likely to be able to detect high concentrations of sugar. Conversely, if a bee is a pollen or water collector, then that bee is more likely to respond to a lower concentration of sugar. Scientists measure a bee’s ability to detect sugar using the proboscis extension response (PER). Watch this video to see a researcher perform a PER test: https://youtu.be/-_cXqda1BZA A bee’s antenna is a sensory organ that smells and tastes substances for the bee. When the antenna contacts a solution, the bee can assess the sugar concentration. If the bee detects a sufficient concentration of sugar, the bee’s proboscis (tongue) reflexively extends. By varying the concentrations of sugar solutions, one can determine the point at which a bee can detect sugar. The threshold is the minimum concentration of sugar needed to elicit the PER.
If a bee’s proboscis extends at a low concentration of sugar, we conclude that the bee has high ability to detect sugar. In other words, these bees think a relatively low concentration of sugar is worth collecting. If a bee has a high PER threshold, it will take a high concentration of sugar to elicit the PER. These bees are like people with a sweet tooth. If it isn’t really sweet, they don’t want it. Make a prediction about a bee’s ability to detect sugar and their foraging habits by filling in the table.
Sugar concentration needed to elicit response (low or high)
Ability to detect sugar (low or high)
PER threshold (low or high)
Predicted foraging behavior (nectar or pollen)
Low High Low Pollen or Water
High Low High Nectar
Positive response: Notice the extended proboscis.
Negative response: Notice the proboscis is not extended.

P a g e | 11
The student decides to use the bees from experiment 1 and test their ability to detect sugar using the PER method. Refer back to question 3 in Activity 1 for the two groups of bees. Which numbered bees do you predict would have high PER thresholds? Bees 23, 26, 34, 44 Which numbered bees would have low PER thresholds? Bees 10, 17, 37, 42 Examine graph 1 to evaluate your earlier prediction and the student’s hypothesis for the PER experiment. Graph 1:
Does the evidence in the graph support the student’s hypothesis? Explain. (Recall the student’s hypothesis: If a bee is a nectar collector, then that bee is more likely to be able to detect high concentrations of sugar. Conversely, if a bee is a pollen or water collector, then that bee is more likely to respond to a lower concentration of sugar.) Yes, a greater portion of pollen collecting bees responded to low concentrations of sugar. A smaller portion of nectar collectors responded to low concentrations. Instead, nectar collectors responded only to high concentrations of sugar.
Pollen collectors (Bee 10, 17, 37, 42)
Nectar collectors (Bee 23, 26, 34, 44)
10 % 30 % 50 % Concentration of sucrose solution
Proportion of bees responding

P a g e | 12
Activity 3: Could genes determine a bee’s foraging behavior? We have learned that bees vary in their threshold response to sugar. Could there be a genetic component to explain this difference in ability to perceive sweetness? To test this idea, you will learn the process of DNA fingerprinting and analyze DNA from a practice case. Next, you will analyze the DNA from a pollen collector and a nectar collector to determine if there is a difference in their genes. You will then use DNA analysis to classify unknown bees as pollen or nectar collectors.
The Process of Gel Electrophoresis and DNA Fingerprinting Analysis Gel electrophoresis is a process where DNA fragments of different sizes are separated and analyzed. Before analyzing DNA from your bees, you will learn the steps of DNA fingerprinting from the simulation “The Case of the Licked Lollipop” Use the link below to describe the purpose of each step of DNA fingerprinting as well as to solve the case. http://www.pbslearningmedia.org/asset/tdc02_int_creatednafp2/
Step Purpose Pour restriction enzymes into DNA
Ex) Enzymes act like scissors cutting DNA at specific places in the DNA code
Pour agarose gel into tray
Pour DNA into tray ** Note: DNA is typically loaded into a slot in the agarose using a pipet
Begin electrophoresis
Place nylon membrane on gel
Add probes to nylon membrane
Place x-ray film on top of nylon film
Develop film and analyze
Who is the culprit in the case of the Licked Lollipop? ___________Honey_____________________

P a g e | 13
Activity 4: Analyzing the DNA from known bees While the genes responsible for pollen collecting and nectar collecting are still being researched, the following activity simulates how DNA testing might one day be used to visualize the genetic differences between these two strains. In this simulation, you have been given DNA from a pollen collector, a nectar collector, and a sample of DNA showing the action of the restriction enzyme, BamHI. BamHI binds at the recognition sequence 5'-GGATCC-3', and cleaves these sequences just after the 5'-guanine on each strand. A DNA sample cut is shown here: Cut the DNA segments from the pollen and nectar collectors in the same manner as shown in the sample by drawing lines in the appropriate places. Each line represents a cut in the DNA. DNA Sample of pollen collector: A G G A T C C G A G G A T C C T T A G G A T C C T C C T A G G C T C C T A G G A A T C C T A G G
DNA Sample of nectar collector: A A G A T C A G A G G A T C C T T A C G A T C A T T C T A G T C T C C T A G G A A T G C T A G T
Fill in the table based on the cuts above.
13. How does the number of cuts in the pollen collector’s DNA compare to the nectar collector’s
DNA? The pollen-collecting bee’s DNA has more cuts than the nectar-collecting bee’s DNA.
14. How will this affect the number of fragments formed on the gel electrophoresis? The pollen-collecting bee will have more fragments of DNA than the nectar-collecting bee.
G T A G G A T C C T C A T C C T A G G A
Pollen collector Nectar collector Number of cuts in DNA
3 1
Number of segments of DNA 4 2

P a g e | 14
Activity 5: Using a gel electrophoresis simulation to identify unknown bees Materials:
• gel electrophoresis card • small bowl • water • 0.5 tsp washing soda • plastic spoon to stir
The card represents a gel tray from the DNA electrophoresis of four unknown bees. Your task is to analyze the DNA from bees 1-4 and determine which bees are pollen collectors and which bees are nectar collectors by comparing the results to the known bees from Activity 4. Procedure:
1. Fill bowl approximately 1/2 full with water, add 0.5 tsp of washing soda solution. Mix with spoon. 2. Dip card into solution until pink dots become visible and quickly remove it. 3. Briefly sketch your results into the data table.
Data:
15. Why do the various segments of DNA separate out along the tray?
Large pieces of DNA travel more slowly through the pores in the gel than small pieces of DNA. This separates the DNA by size.
16. Large pieces of DNA would be found toward which end of the gel tray? Why?
Large pieces of DNA would be found toward the negative end (top) of the gel tray as they do not travel as fast as the smaller pieces of DNA.
17. Using the DNA samples from Activity 4, identify which bees from your gel electrophoresis would be…
a. Pollen collectors ________Bees 1 & 3_______________
b. Nectar collectors ________Bees 2 & 4_______________
positive
negative Bee 1 Bee 2 Bee 3 Bee 4
800
600
400
200
100 50
Standard
x
x
x
x
x x
x x
x x x x
x
x
x
x
x
x

P a g e | 15
Reflection and Application to Agriculture
19. How might a bee’s foraging behavior impact their pollination or honey production potential?
Pollen-collecting bees may be better pollinators because of their interest in carrying this particular food resource back to the colony. Nectar-collecting bees will tend to be better at increasing honey production because of their preference for gathering the high-sugar resources, nectar, which is transformed into honey.
20. Genetics are partially responsible for bees’ foraging preference. How might the beekeeping industry
use this to their advantage?
Bee breeding programs could selectively breed lines of bees to be better pollinators or honey producers depending on the needs of the beekeeper and his or her particular operation.
P a g e | 16
Teacher Materials Activity 5: Gel electrophoresis instructions and template
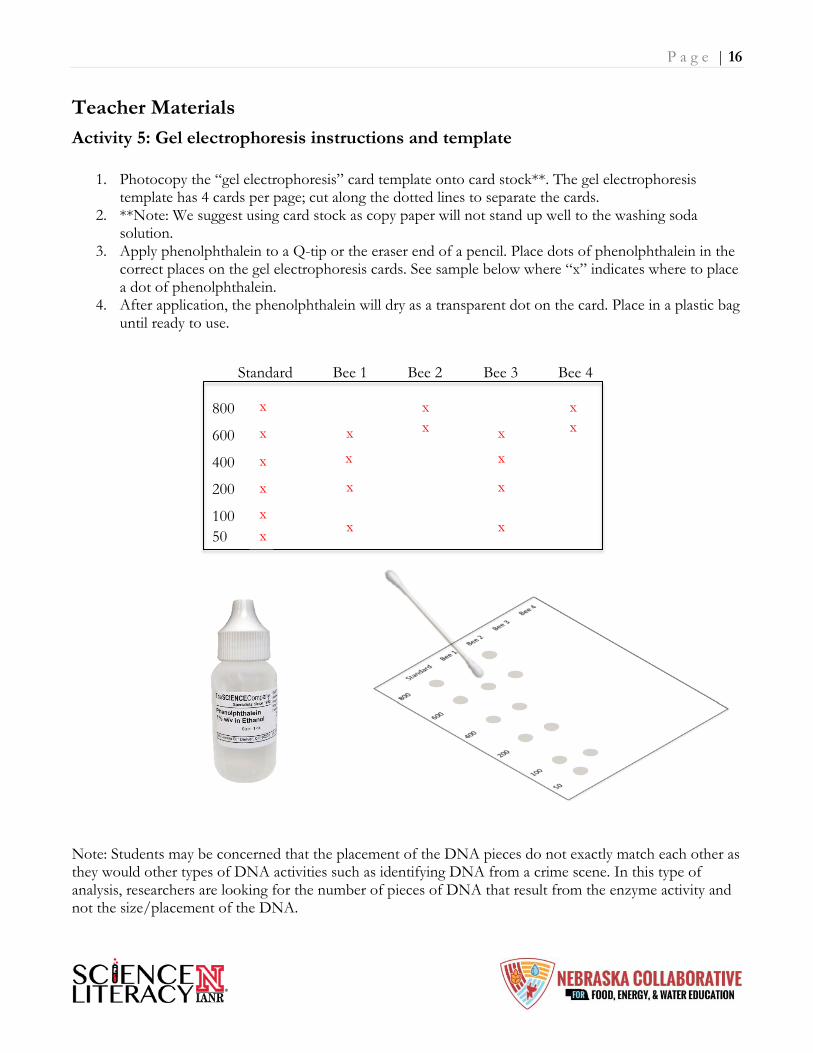
1. Photocopy the “gel electrophoresis” card template onto card stock**. The gel electrophoresis template has 4 cards per page; cut along the dotted lines to separate the cards.
2. **Note: We suggest using card stock as copy paper will not stand up well to the washing soda solution.
3. Apply phenolphthalein to a Q-tip or the eraser end of a pencil. Place dots of phenolphthalein in the correct places on the gel electrophoresis cards. See sample below where “x” indicates where to place a dot of phenolphthalein.
4. After application, the phenolphthalein will dry as a transparent dot on the card. Place in a plastic bag until ready to use.
Note: Students may be concerned that the placement of the DNA pieces do not exactly match each other as they would other types of DNA activities such as identifying DNA from a crime scene. In this type of analysis, researchers are looking for the number of pieces of DNA that result from the enzyme activity and not the size/placement of the DNA.
Bee 1 Bee 2 Bee 3 Bee 4
800
600
400
200
100 50
Standard
x
x
x
x
x x
x x
x x x x
x
x
x
x
x
x

P a g e | 17
Bee 1 Bee 2 Bee 3 Bee 4
800
600
400
200
100
50
Standard Bee 1 Bee 2 Bee 3 Bee 4
800
600
400
200
100
50
Standard
Bee 1 Bee 2 Bee 3 Bee 4
800
600
400
200
100
50
Standard Bee 1 Bee 2 Bee 3 Bee 4
800
600
400
200
100
50
Standard

P a g e | 18
Activity 5: Gel electrophoresis lab procedures Each group will need 1 bowl, water, 0.5 teaspoon of washing soda, a spoon, and 1 gel electrophoresis card.
1. Fill bowl approximately ½ full with water, add ½ tsp of washing soda solution. Mix with spoon.
2. Dip card into solution until pink dots become visible and quickly remove it.
3. Record location of “DNA bands” on student worksheet.

P a g e | 19
Lesson 2 | Fermentation of Honey Background Purpose This lesson will teach students about the processes of cellular respiration and fermentation for the transformation of glucose into usable energy (ATP) for living organisms. In some cases, the competition between living organisms for carbohydrates leads to undesired products and concern for foodborne contaminants.
Standards Next Generation Science Standards HS-LS1-7 Use a model to illustrate that cellular respiration is a chemical process whereby the bonds of food molecules and oxygen molecules are broken and the bonds in new compounds are formed resulting in a net transfer of energy. Common Core CCSS.Math.Content.HSS.ID.B.6 Represent data on two quantitative variables on a scatter plot, and describe how the variables are related.
Estimated Time Three 50-minute class periods
Student Materials
• Sugar • Active dry yeast • Warm water • 100mL beakers • 50 mL beakers • Weighing scale • Weighing boats or portion cups • Spoon • Bowl • Timer or clock • Respirometers
o 5cc syringes (non-luerlock) o 1ml pipets (glass disposable with 0.01 gradations) o Plastic tubing (I.D. = 1/8”; O.D. =1/4”; wall = 1/16”) cut into 1 inch sections
• Student worksheet
Teacher Materials
• Answer key • PowerPoint presentation (optional)

P a g e | 20
Vocabulary
• cellular respiration (aerobic respiration): process that releases energy from food in the presence of oxygen
• fermentation (anaerobic respiration): process that releases energy from food in the absence of oxygen
• carbohydrate: compound made up of carbon, hydrogen, and oxygen atoms; type of nutrient that is the major source of energy for the body
• adenosine triphosphate (ATP): compound used by cells to store and release energy
Key STEM Ideas All living organisms rely on cellular respiration and/or fermentation to transform glucose into usable energy (ATP). Living organisms often compete with one another for the same glucose source. Cellular respiration requires the presence of oxygen and yields more usable energy while fermentation occurs in the absence of oxygen and produces much less usable energy. The byproducts of fermentation (including alcohol, carbon dioxide, and lactic acid) can be beneficial or harmful depending on the intended or unintended nature of the fermentation.
Students’ Prior Knowledge High school students should have some background knowledge of the processes of cellular respiration and fermentation. They should also know that carbohydrates give living organisms the energy to carry out their daily activities. This lesson plan will build on students’ existing knowledge.
Connections to Agriculture Honey bees are valuable managed pollinators of many agricultural crops and produce honey, an energy-rich food source and natural sweetener. Bees gather nectar from flowering plants as a source of sugar and transform it into honey by adding enzymes and removing water. The added enzyme, invertase, breaks down sucrose, a disaccharide into its component monosaccharides, glucose and fructose. Glucose will be used by the bee in the cellular respiration process to produce ATP for energy. When the water content of honey is less than 18.6%, yeast is unlikely able to transform the glucose in honey into ATP via fermentation. Sometimes bees are unable to remove the excess moisture from the honey. When moisture content is greater than 18.6%, fermentation is more likely to occur. Producing a high quality honey crop requires that beekeepers protect it from fermentation. Beekeepers can reduce the moisture content of honey by placing the it in a ‘hot room’ and/or with a dehydrator to decrease the water content. Uncontrolled fermentation can add unwanted byproducts to honey ruining its flavor and making it inedible. However, controlled fermentation of honey can be used to produce an alcoholic drink known as mead. More generally, controlled fermentation of glucose can be used to produce products such as bread, yogurt, and biofuels such as ethanol. Understanding the process of fermentation allows us produce more of the quality food and fuel the world demands.
P a g e | 21
Essential Links N/A
Sources/Credits
• Honey stored in a honey super: (free for educational use from • http://www.alexanderwild.com/Insects/Stories/Honey-Bees/i-PvxSK7J/L) • Honey being bottled: (free for educational use from
http://www.alexanderwild.com/Insects/Stories/Honey-Bees/i-WRm4WdG/L) • Graduated pipette image (free from http://fp.academic.venturacollege.edu/doliver/glassware/LAB-
GIFS/Pipets.gif) • 5cc syringe (free from wikimedia
https://commons.wikimedia.org/wiki/File:5ml_vector_syringe_0point2ml.svg#/media/File:5ml_vector_syringe_0point2ml.svg)
• Simple respirometer image and basic respiration measurement procedures courtesy of http://www.cur.org/assets/1/7/ystferm.pdf
• Fermentation of honey in comb image with permission from Randy Burlew at http://www.honeybeesuite.com/uncapped-honey-fermenting-in-the-comb/
• 2014 honey production (in lbs and dollars) courtesy of USDA National Agricultural Statistics Service http://usda.mannlib.cornell.edu/usda/current/Hone/Hone-03-20-2015.pdf

P a g e | 22
Lesson Procedures Engage - Before beginning the activity: 1. Facilitate a class discussion about carbohydrates. Ask students which kinds of food provide them with
energy. Have students brainstorm a list of foods high in carbohydrates. 2. Pass out the student worksheet and review the processes of cellular respiration and fermentation with
students. Explore Part 1 (Lab activity): How does the concentration of sugar affect yeasts ability to consume sugar and produce CO2 as a waste product? 3. Divide students up into groups of 3-4. 4. Depending on time availability, you may want to have sugar solutions and yeast suspension ready prior
to lab. Mixing instructions are included in the teacher notes and the PowerPoint presentation (slides 4 & 5). Show students how to assemble their respirometer (slide 6). Assembly instructions can also be found in the teacher notes. Designate where used sugar and yeast solutions are to be disposed.
5. Provide each group with access to • 10 mL of each sugar solution • 40 mL of yeast suspension • 4, 50mL beakers • 4, respirometers (made of 5cc syringe, graduated pipet, and plastic tubing) • Timer or clock
6. Introduce materials and the lab activity procedure on the student worksheet (pg. 3). a. Measure 10 ml of the 1% sugar solution and place into a 50 mL beaker. b. Measure 10 ml of the yeast suspension and place it into the same 50 mL beaker with the sugar
solution. c. Allow the yeast and sugar mixture to incubate for 5 minutes occasionally swirling the beaker. d. Draw 3 mL of the yeast and sugar mixture into the syringe. e. Continue drawing the syringe until it has 1 mL of air on top of the sugar-yeast mixture. f. Add a drop of water into the bottom of the pipette and attach the pipette to the top of the
syringe with the plastic tubing. g. Begin timing when the drop of water reaches 0 on the pipette. h. Record the amount of CO2 produced every 2 minutes in the data table. i. Repeat the procedure with the other concentrations of sugar.
7. After students record their observations on the data collection table on page 3 of the student worksheet, take some time to share results and discuss any differences in results between lab groups.
8. Allow time for students to answer the three questions in Part 1 of the student worksheet. Explain Discussion 9. Facilitate discussion of answers to the Part 1 questions and what students observed during the lab
activity. Possible questions include: a. What made the water droplet move up the pipet? (Creation of C02 was created as a byproduct of
fermentation of glucose by the yeast. This increased the pressure in the pipette and pushed the water up.) b. What gas was formed during fermentation? (Carbon dioxide)

P a g e | 23
c. Does a higher sugar concentration necessarily mean more energy can be produced by yeast? (Student answers may vary, but their data should indicate that more sugar isn’t necessarily better for fermentation.)
d. How is measuring the production of CO2 a measure of fermentation and glucose metabolism? (We know this is a byproduct of respiration and should be observable by the presence of bubbles or moving the water droplet up the pipette.)
10. For Part 2, discuss as a whole class the process bees go through to ripen nectar into honey using the diagram provided in the student worksheet or in the PowerPoint presentation (slide 7).
Extend Parts 2 & 3: Graphing and problem-solving 11. Divide students into their lab groups once again. Using their data from Part 1, have them graph their
data and answer the three questions in Part 2 predicting if fermentation will occur in fully ripened honey.
12. Bring class back together to discuss answers to Part 2 of worksheet. Share the graphed data as a class and have a discussion of replication.
a. Did all groups collect and record similar data? b. What are some potential sources of variation or error?
13. For Part 3, have students work on their own to problem-solve the four questions on the worksheet about a beekeeper protecting honey from unwanted fermentation.
14. Either use Part 3 as an assessment of individual understanding or simply conduct a class discussion of answers to Part 3.
Evaluate Wrap-up 15. Reiterate how uncontrolled fermentation in honey by wild yeast can result in an unpalatable food
product for people, loss of market value for the beekeeper, and an unusable food source for bees. 16. Discuss how beekeepers can prevent fermentation from occurring by lowering the water content to
below 18.6% with a dehydrator or storing honey in a heated room to promote evaporation of excess moisture.
Enriching Activity Students may benefit from graphing CO2 production across time for each sugar concentration in Part 1. Have lab groups share their graphs with each other and discuss similarities and differences. Did everyone have similar results? Why or why not?

P a g e | 24
Answer Key Cellular Respiration (Aerobic Respiration) All living organisms need energy to support activities necessary to survive. They obtain this energy from food molecules which contain chemical energy that is released when chemical bonds are broken. In the presence of oxygen, aerobic respiration occurs. Glucose is an energy source for the cell but it must be converted into ATP which is the energy source that the cell can use. The equation for cellular respiration is shown.
C6H12O6 + 6 O2 → 6 CO2 + 6 H2O + ATP Glucose + Oxygen → Carbon Dioxide + Water + ATP
Glycolysis is the first stage where glucose in broken into two pyruvate molecules. The next stage depends on the presence of oxygen. If oxygen is present, the 2 pyruvates enter the Kreb’s Cycle where two more ATP are formed. The final step is the electron transport chain where 34 ATP are produced. Each glucose yields a total of 38 ATP through aerobic respiration. The diagram below summarizes the stages of aerobic respiration. Notice that ATP are produced in 3 different stages.

P a g e | 25
Fermentation (Anaerobic Respiration) In the absence of oxygen, organisms can still obtain the energy they need to survive through the process of fermentation. One type of fermentation, lactic acid fermentation, occurs in the muscle of animals. You may experience lactic acid fermentation when you do short bursts of hard exercise such as lifting weights or running up stairs. A second type of fermentation called alcoholic fermentation occurs in yeast and other microorganisms. This type of fermentation is important in the food science industry for baking bread or brewing beer and wine. It is also important in the biofuels industry as the alcohol ethanol is produced as a byproduct. Although fermentation is necessary when energy is needed and oxygen is not available, it has disadvantages. Fermentation only produces 2 ATP per glucose while aerobic respiration produces a total of 38 ATP per glucose. Also, the byproducts of anaerobic respiration are toxic to cells.

P a g e | 26
Part 1: How does the concentration of sugar affect the rate yeast produces CO2? Materials needed:
• Sugar • Warm water • 4, 100mL beakers • ‘Rapid rise’ activated dry yeast • 4, 50mL beakers per group • 4, respirometers per group (made of 5cc syringe, graduated pipette, and plastic tubing) • 1 timer or clock per group
Student lab procedures:
1. Gather materials needed for lab. 2. Measure out 10 ml of the 1% sugar solution and place the solution into a
50 mL beaker. 3. Measure out 10 ml of the yeast solution and add it to the 50 mL beaker
with the sugar solution. 4. Allow the yeast and sugar mixture to incubate for 5 minutes occasionally
swirling the beaker. 5. Draw 3 mL of the yeast and sugar mixture into the syringe. 6. Continue drawing the syringe until it has 1 mL of air on top of the sugar-
yeast mixture. 7. Add a drop of water into the bottom of the pipette and attach the pipette
to the top of the syringe with plastic tubing. 8. Begin timing when the drop of water reaches 0 on the graduated pipette. 9. Record the amount of CO2 produced every 2 minutes in the data table. 10. Repeat the procedure with the other concentrations of sugar.
Record the data: Note how far the water droplet has moved up the pipette every 2 minutes.
1% sugar 5% sugar 30% sugar 50% sugar
2 minutes
4 minutes
6 minutes
8 minutes
10 minutes
Imag
e so
urce
: http
://w
ww
.cur.o
rg/a
sset
s/1/
7/ys
tferm

P a g e | 27
1. After 10 minutes, which concentration of sugar produced the greatest amount of carbon dioxide? Answers will vary. Generally, 30% sugar concentration will produce optimum carbon dioxide.
2. If you were trying to maintain a yeast population, which concentration of sugar would you want to feed the yeast? Why? 30% sugar concentration because this concentration produced the greatest amount of carbon dioxide meaning the yeast consumed the greatest amount of sugar. The yeast will be well-fed.
3. After 10 minutes, which concentration of sugar produced carbon dioxide at the fastest rate? Answers will vary.

P a g e | 28
Part 2: Predicting fermentation in honey In addition to table sugar, other foods may provide organisms with the glucose needed for energy. The glucose in honey can be transformed into usable energy (ATP) for living organisms. Let’s review the process of how honey is made. Honey bees gather nectar from flowers as a source of sugar. However, nectar has a high water content. Bees evaporate water from nectar by fanning their wings thus increasing the concentration of sugar in the honey. In addition to removing water, bees add enzymes to the nectar. The enzyme invertase is responsible for breaking down sucrose, a disaccharide into its component monosaccharides, glucose and fructose. Glucose can be used in the cellular respiration process of bees to produce ATP for energy.
However, microorganisms such as bacteria and yeast compete with other living organisms such as bees for the same food source. They may hijack the carbohydrates for their own energy needs through fermentation or aerobic respiration sometimes producing unwanted results. Using what you learned from Part 1, answer the following questions to predict how successful yeast would be at using the glucose in honey as a source of carbohydrates for energy production.
1. Honey is a rich source of carbohydrates including glucose. If the water content of ripened honey is 16%, what is the percent of sugar found in ripened honey? 84% is sugar.
2. Graph the data for all sugar concentrations from Part 1 at 10 minutes on the graph below. Now add the sugar concentration of ripened honey to your graph. Predict the amount of CO2 produced. Sample data plotted below.
0
0.2
0.4
0.6
0.8
1
0 10 20 30 40 50 60 70 80 90 100
mL
of C
O2
at 1
0 m
in
Sugar concentration

P a g e | 29
3. Based on the trend of CO2 production, would you predict yeast to be successful in producing energy in ripened honey? No, the trend from Part 1 indicated that at higher sugar concentrations (above 30%) yeast does not produce as much CO2. and therefore does not produce as much energy.

P a g e | 30
Part 3: Honey gone haywire!
Honey is a good source of energy for bees. It’s also a valuable food product for humans. In 2014, U.S. beekeepers sold over 178 million pounds of honey worth nearly $400 million. In order to produce a high quality honey crop worth the highest market value possible, beekeepers are always on the lookout for contaminants that might compromise the safety or taste of their honey.
Suppose you are a beekeeper. Looking at the honey in the honeycomb, answer the following questions on your own.
4. Where did the bubbles come from in this honey? The bubbles are likely CO2 , a byproduct of fermentation.
5. What undesirable components would be found in the honey?
CO2 and alcohol The CO2 would give the honey an undesirable texture. The honey would also contain alcohol, an unwanted component in honey.
6. What process formed these two products?
Fermentation
7. What are the risks of selling this honey product as it is? Accept reasonable answers. The honey may have a detectable alcohol content. As a supplier, your customers may no longer wish to purchase honey from you.
Imag
e so
urce
: ht
tp:/
/ww
w.h
oney
bees
uite
.com
/unc
appe
d-ho
ney-
ferm
entin
g-in
-the-
com
b/

P a g e | 31
Teacher Materials Pre-lab procedures
1. Approximately one hour before lab, suspend the yeast (80 g per liter or 8 g per 100mL) in water on a magnetic stirrer. Each lab group needs access to ~40 mL of yeast suspension.
2. Prior to lab, mix 100mL of 1, 5, 30, and 50% sugar solutions in 4, 100mL beakers.
Note: Sugar solution concentrations are weight: volume ratios. To calculate, use the following equation: % 𝑤𝑤
𝑣𝑣= 𝑔𝑔𝑔𝑔𝑔𝑔𝑔𝑔𝑔𝑔 𝑜𝑜𝑜𝑜 𝑔𝑔𝑠𝑠𝑠𝑠𝑔𝑔𝑠𝑠𝑔𝑔𝑠𝑠𝑠𝑠𝑠𝑠 𝑔𝑔𝑎𝑎𝑎𝑎𝑠𝑠𝑎𝑎
𝑜𝑜𝑓𝑓𝑠𝑠𝑔𝑔𝑓𝑓 𝑣𝑣𝑜𝑜𝑓𝑓𝑠𝑠𝑔𝑔𝑠𝑠 (𝑔𝑔𝑚𝑚)𝑜𝑜𝑜𝑜 𝑔𝑔𝑜𝑜𝑓𝑓𝑠𝑠𝑠𝑠𝑓𝑓𝑜𝑜𝑠𝑠× 100
a. 1 g of sugar in 100 mL of water = 1% sugar solution b. 5g of sugar in 100mL of water =5% sugar solution c. 30g of sugar in 100mL of water =30% sugar solution d. 50g of sugar in 100mL of water =50% sugar solution
Assembly of respirometer:
It may be beneficial to show students how to assemble the respirometer prior to starting the lab activity. Respirometers can stand upright on their own, however, if there are concerns about tipping over, the respirometers can be placed within a ring stand for stability.
Graduated pipette
Short length of plastic tubing 5cc syringe
Droplet of water

P a g e | 32
Lesson 3 | Preservation Power of Honey Background Purpose Students will learn how honey is an antibacterial agent. Honey may be used as a preservative of milk in areas without access to electricity or refrigeration. This preservation relies on elements found specifically in honey and cannot be replicated with other sources of sugar.
Standards Next Generation Science Standards HS-LS2-2 Use mathematical representations to support and revise explanations based on evidence about factors affecting biodiversity and populations in ecosystems of different scales. Common Core RST. 11-12.7 Integrate and evaluate multiple sources of information presented in diverse formats and media (e.g. quantitative data, video, multimedia) in order to address a question or solve a problem
Estimated Time One 50-minute period
Student Materials
• Ruler • Computer with internet access • Student worksheet
Teacher Materials
• Answer key • PowerPoint presentation
Vocabulary
• zone of inhibition: the area around an antimicrobial disc that contains no bacterial growth • microbe: a microscopic living organism—e.g., bacterium, fungus, protozoan • preservative: a substance added to a product to destroy or inhibit multiplication of microorganisms • turbidity: a measure of relative clarity of a liquid

P a g e | 33
Key STEM Ideas All living organisms compete for food sources to fuel their energy needs. A variety of methods are used to protect and preserve our food from bacterial competition. Food preservation practices may include storage in an acidic environment (as with pickles or sauerkraut), refrigeration (many foods), removing moisture (as with dried meats or fruits), or a heavy concentration of sugar (as with fruit cake or Twinkies).
Students’ Prior Knowledge High school students should be aware that food is at risk of spoiling because of microbial growth and contamination and that preservatives are present in the food we consume to prevent spoilage. Students should be familiar with common ways to preserve food. This lesson expands students’ knowledge of preservation by exploring the use of honey as a preservative. Preservatives are an important topic for students to understand because without them we would not have the variety of available food products.
Connections to Agriculture Honey is a food produced by bees that is antimicrobial and antibacterial under the right environmental conditions and can be used to our benefit as a preservative. This is especially important in areas of the world where refrigeration may not be available due to cost or lack of consistent electricity. Honey may offer an alternative means of preserving a nutrient-rich food such as milk without refrigeration improving quality of life and health for people in these regions. Honey is a good preservative that allows us to maintain a nutritious food supply that the population demands.
Essential Links
• Why Honey Doesn’t Spoil? (2:30) http://indianapublicmedia.org/amomentofscience/honey-spoil/ • Honey: Food for Yeast or a Natural Preservative? (2:02)
http://indianapublicmedia.org/amomentofscience/honey-food-yeast-natural-preservative/
Sources/Credits Image sources:
• Milk: https://pixabay.com/en/milk-glass-drink-fresh-beverage-435295/ • "Good Food Display - NCI Visuals Online" by Unknown - This image was released by the National
Cancer Institute, an agency part of the National Institutes of Health, with the ID 2397. Licensed under Public Domain via Commons - https://commons.wikimedia.org/wiki/File:Good_Food_Display_-_NCI_Visuals_Online.jpg#/media/File:Good_Food_Display_-_

P a g e | 34
Lesson Procedures Engage
1. Show students slide 2 of the PowerPoint. Have students review with a partner the following two questions prior to starting the lesson:
a. Why does food spoil or go bad? (Microbial growth, usually from bacteria) b. What conditions make this more likely to happen? (Unsanitary conditions, when food is kept in
conditions favorable for bacterial growth (temperature, moisture, etc.) when food is not cooked thoroughly enough)
2. Introduce the list of foods-- beef jerky, bread, milk, pickles, raw steak, cucumbers, cupcakes, croutons, and Twinkies-- from page 1 of the student worksheet. They may be brought to class, written on the board, or displayed using slide 3 of the PowerPoint presentation.
3. As a class, discuss what makes food spoil. Have students work individually to predict how they believe these foods are preserved.
4. Discuss answers as a whole class and record effective food preservation strategies. Answers are provided in the teacher notes, however, students may come up with additional or creative food preservation techniques. Students should discuss removing water (dehydration), keeping out air (sealing), refrigeration, increasing acidity (adding vinegar), and adding preservatives.
Explore
5. Introduce how bees gather their food from flowers during the spring, summer, and fall, but must protect this food for use during dearth periods.
6. Have students predict and write down which preservation methods bees might use. 7. Listen online to the audio clip “Why Honey Doesn’t Spoil” found at
http://indianapublicmedia.org/amomentofscience/honey-spoil/. 8. Discuss if their predicted answers matched those in the audio clip. (Bees use dehydration by removing
water from nectar. This could also be described as highly concentrating the sugars in honey. Students will not be introduced to it yet, but bees also keep out water by sealing honey in honeycomb cells with a wax capping and by adding an enzyme that produces hydrogen peroxide).
Explain Activity 1: Measuring antibacterial properties of honey
9. Review how to grow a colony of bacteria on agar in petri dishes (use slides 4-6 of the PowerPoint for visual support). Point out how antibiotic discs can be applied to a petri dish to inhibit bacterial growth (if the bacteria are susceptible to the antibiotic in the disc). Facilitate student discussion of how antibiotics might be tested in the lab for their efficacy against bacteria. (Measuring and comparing the zones of inhibition for different antibiotics is one way.)
10. Show students how to measure the zone of inhibition (slide 7 of PowerPoint). (Use a ruler; measure area with no bacterial growth including the disc.)
11. Divide students into pairs to complete part 1 of the worksheet. Students will measure zones of inhibition for each antibacterial disc and use their data to determine the relationship between concentration of honey and the size of the zone of inhibition.
12. Facilitate a whole class discussion of what students observed from the experiment. (The higher the honey concentration on the disc, the larger the zone of inhibition, and therefore the fewer bacteria were able to grow.)
13. Listen online to the audio clip “Honey: Food for Yeast or a Natural Preservative” found at http://indianapublicmedia.org/amomentofscience/honey-food-yeast-natural-preservative/
14. Guide discussion on why bacteria does not thrive in honey. (By the process of osmosis, the high concentration of sugar in honey forces the water out of any yeast or bacteria cells, drying them out and destroying them.)

P a g e | 35
15. Have students work in pairs again to predict if a concentrated sugar solution could be used as a more cost effective preservative. (Based on what they have observed and listened to so far, students will likely predict that sugar is a good substitute for honey as a preservative.) Have students provide evidence for their prediction.
Extend Activity 2: Comparing sugar to honey
16. Ask students to familiarize themselves with the sugar experiment setup from part 2 of the worksheet.
17. Divide students into pairs to measure zones of inhibition for each antibacterial disc and use their data to determine the relationship between concentration of sugar and the size of the zone of inhibition. (There is no effect of the concentration of sugar on the growth of bacteria.)
18. Ask students to compare the effectiveness of honey to a concentrated solution of table sugar and provide evidence to support their choice. (Honey was an effective antibacterial, however, concentrated sugar was not effective at inhibiting bacterial growth.)
19. Discuss if students thought this would be the case. Why or why not? (Based on information presented so far, this should be surprising to students. Honey must be more than simply a source of concentrated sugar.)
20. Read and discuss as a class how nectar is ripened into honey from the student worksheet and have students predict if there is anything special about honey.
21. Have students discuss why honey and concentrated sugar might have had different effects on bacterial growth. Examine the honey ripening diagram. Have students note that hydrogen peroxide and acid are produced by the addition of an enzyme, glucose oxidase.
a. What do we use hydrogen peroxide for? (Cleaning bacteria from wounds) b. How have we used acid in food preservation? (Vinegar is used to pickle foods to prevent bacterial
growth.) 22. Have students predict which components found in honey may have inhibited bacterial growth on
their worksheet. Extend Activity 3: Using honey as a preservative in milk
23. Lead a discussion to review what has been learned about honey and how we might use what we have learned about the antibacterial properties of honey to benefit society (slide 8 of the PPT). (Answers may vary. Honey could be used as a wound dressing in hospitals or as a food preservative in areas without access to other means of food preservation such as refrigeration.)
24. Have students read part 3 of the student worksheet about an experiment testing honey as a preservative for milk. Discuss the following (slide 9 of PPT):
c. What is turbidity? (Turbidity is a measure of how clear a liquid is.) d. How does measuring turbidity help us to determine bacteria growth in milk? (Turbidity is an
indicator of bacterial presence; the cloudier a liquid is, the higher the turbidity, the more bacterial is assumed to be present.)
25. Instruct students to calculate the percent difference in turbidity of milk with honey compared to milk without honey as a sign of inhibition of bacterial growth. Use this data as evidence when answering the two follow-up questions.
26. Facilitate class discussion about the feasibility of using honey an effective preservative for milk. Have students make a list of benefits and challenges. (Potential benefits include availability of an inexpensive, protein-rich food source in areas with no refrigeration, better bone and teeth health, access to calories in areas dealing with malnutrition; potential challenges include cost of adding honey, change in flavor of milk, acceptance of this new method for preservation.)

P a g e | 36
27. Using the class discussion as a starting point, have students complete the final question on the worksheet on their own. Encourage students to think critically about this issue.
Evaluate
28. Use the student worksheet and discussion throughout the lesson to determine if student understanding of key concepts has occurred.

P a g e | 37
Answer Key Introduction Food Preservation Methods How do people prevent the following foods from spoiling?
My prediction Post class discussion Beef jerky
Dehydration by salting beef.
Bread
Keep sealed in plastic to prevent contact with air. Sometimes preservatives are added.
Milk
Refrigeration to slow bacterial growth.
Pickles
Vinegar is acidic and prevents growth of some bacteria
Raw steak
Refrigeration to slow bacterial growth.
Cucumber
Refrigeration to slow bacterial growth.
Cup cake
Keep sealed in plastic to prevent contact with air
Croutons
Dehydration
Twinkie
Doesn’t need much for preservation as the high sugar content prevents much microbial growth. Sorbic acid is added to prevent mold.
Honey bee societies like human societies have to manage logistics such as adequate space, shelter, and a safe year round food supply. Bees rely on plants that flower during summer months to provide nectar a carbohydrate and pollen a protein source to last throughout the year. Bees need to safely store their food during times when flowering plants are not available. Listen to the audio clip: Why Honey Doesn’t Spoil? (2:30) http://indianapublicmedia.org/amomentofscience/honey-spoil/
1. Do bees use any of the same methods to preserve their food supply? If so, which ones? Bees use dehydration by removing water from the honey and sealing honey in the comb under a wax capping to keep out water.

P a g e | 38
Part 1: Does honey inhibit the growth of bacteria in the lab? Researchers interested in the use of honey as an antibacterial set up the following experiment.
1. Bacteria commonly found in milk was evenly applied to growth medium in a petri dish. 2. Five concentrations of honey (5, 10, 15, 20, and 25%) and water (as a control) were applied to
antibacterial discs. 3. All six (6) discs were placed in the petri dish and labelled with letters A-F. 4. The petri dish was incubated at 36oC for 24 hours to allow bacteria to grow.
Using a ruler, measure the zone of inhibition for each disc and record in the data table.
2. What is the relationship between the
concentration of honey and the size of the zone of inhibition caused by the honey? The greater the concentration of honey, the larger the zone of inhibition.
3. Suggest a reason for this relationship.
Microbes are not able to live in high concentrations of honey. The solution may cause the microbes to lose water and die.
Listen to the audio clip: Honey: Food for Yeast or a Natural Preservative? (2:02) http://indianapublicmedia.org/amomentofscience/honey-food-yeast-natural-preservative/
4. Honey is more expensive than sugar, $2.00 per pound versus $0.34 per pound. Do you think a concentrated sugar solution could be used as a more cost effective antibacterial preservative? Allow students to make predictions.
Disc
Concentration (mg/ml) of honey used
Diameter (mm) of zone of inhibition
A 5 10.3 B 10 10.6 C 15 12.6 D 20 15.6 E 25 18.6 F Water only 6.4

P a g e | 39
Part 2: Does concentrated sugar inhibit the growth of bacteria in the lab? The researchers were encouraged by their finding about the antibacterial property of honey in Part 1 and decided to test if the same concentrations of sugar rather than honey could similarly inhibit the growth of bacteria commonly found in milk. The same experimental set up was used from part 1, except the discs were treated with various concentrations of sugar (fructose) rather than honey.
5. Compare the fructose data to the honey data. Do you agree that sugar would be a more cost effective alternative for food preservation? Explain. No. The concentrated sugar solutions were not effective as evidenced by the lack of zones of inhibition.
Is honey “just” a concentrated sugar solution? Do bees add anything special to the mix? To answer these questions, we will need to understand how honey is made. Bees need a source of sugar for energy. Some plants attract bees by providing the sugar in the form of nectar. During the course of collecting the nectar, bees transfer pollen from plant to plant. The foraging bees carry the nectar back to the hive. Upon returning to the hive, the forager unloads the nectar to a receiver bee. The receiver bee modifies the nectar by repeatedly using her tongue to expose the nectar to air which decreases the water content. During this process, two important enzymes are added. The enzyme invertase is responsible for breaking down sucrose, a disaccharide into its component monosaccharides glucose and fructose. The second important enzyme is glucose oxidase which breaks down some of the glucose into hydrogen peroxide (H2O2) and acid.
Disc Concentration (mg/ml) of sugar used
Diameter (mm) of zone of inhibition
A 5 6.4 mm (None observed) B 10 6.4 mm (None observed) C 15 6.4 mm (None observed) D 20 6.4 mm (None observed) E 25 6.4 mm (None observed) F Water only 6.4 mm (None observed)

P a g e | 40
6. Examine the diagram of honey. Which parts of the honey do you think inhibit the growth of bacteria? Hydrogen peroxide and acid inhibit the growth of bacteria. Students can recall that they may have used H2O2 on a wound to prevent infection. Another acid, vinegar, is frequently used as a food preservative.
Part 3: Can honey inhibit the growth of bacteria in food products? Milk and dairy products are an important part of a healthy diet providing an inexpensive source of protein, vitamins, and minerals. Spoilage of milk is a major limitation in providing this valuable food source to people who do not have access to refrigeration. Can the preservation power of honey prevent spoilage in milk?
To test this hypothesis, researchers tested samples of milk divided into two groups, milk with honey added and milk without honey. After six days, milk was tested for bacterial content using turbidity. Turbidity is the measure of relative clarity of a liquid and can be used as an indicator of bacterial content. Presence of bacteria increases the cloudiness and therefore turbidity of the milk.
Image source: http://water.usgs.gov/edu/turbidity.html
7. What is the relationship between cloudiness and the turbidity value of the vials in the image? The cloudier the liquid, the greater the turbidity value.
Use the data in the table to calculate the percent inhibition of growth.
No. of days of storage
Turbidity of milk with honey
Turbidity of milk without honey
Percent difference in inhibition of growth |𝑤𝑤𝑓𝑓𝑠𝑠ℎ ℎ𝑜𝑜𝑠𝑠𝑠𝑠𝑜𝑜 − 𝑤𝑤𝑓𝑓𝑠𝑠ℎ𝑜𝑜𝑠𝑠𝑠𝑠 ℎ𝑜𝑜𝑠𝑠𝑠𝑠𝑜𝑜|
𝑤𝑤𝑤𝑤𝑤𝑤ℎ ℎ𝑜𝑜𝑜𝑜𝑜𝑜𝑜𝑜 + 𝑤𝑤𝑤𝑤𝑤𝑤ℎ𝑜𝑜𝑜𝑜𝑤𝑤 ℎ𝑜𝑜𝑜𝑜𝑜𝑜𝑜𝑜2
𝑥𝑥 100%
0 0.62 0.75 |0.62−0.75|0.62+0.75
2 = 0.13
0.685 = 0.189 x 100% = 18.9%
3 0.78 1.41 57.5%
4 0.82 1.56 62.2%
5 0.89 1.73 64.1%
6 0.94 1.84 64.7%
8. Is honey an effective preservative for milk? Explain.
Yes. After 6 days, the honey inhibited the growth of bacteria 64.7% more than the milk without honey.
P a g e | 41
9. One quarter of the world’s population does not have access to electricity. Without
refrigeration, it can be difficult or impossible for people to gain access to a consistent or safe supply of milk. Do you believe adding honey to milk as a preservative is a feasible solution to this challenge? Why or why not? Accept all reasonable answers.
P a g e | 42
Lesson 4 | Honey as a Biomolecule Background Purpose This lesson teaches about different types of carbohydrates, the role of enzymes in breaking down complex sugars into simple sugars, and how different sugars impact our perception of sweetness and may impact human health.
Standards Next Generation Science Standards HS-LS1-7 Use a model to illustrate that cellular respiration is a chemical process whereby the bonds of food molecules and oxygen molecules are broken and the bonds in new compounds are formed, resulting in a net transfer of energy. Common Core RST.9-10.7 Translate quantitative or technical information expressed in words in a text into visual form (e.g., a table or chart) and translate information expressed visually or mathematically (e.g., in an equation) into words.
Estimated Time One 50-minute class period
Student Materials Student worksheet Three PDF documents found here:
• “Carbohydrates and the Sweetness of Honey” found at http://www.honey.com/images/downloads/carb.pdf
• “Is Honey the same as Sugar?” found at http://extension.arizona.edu/sites/extension.arizona.edu/files/pubs/az1577.pdf
• “Honey: A Reference Guide to Nature’s Sweetener” found at http://www.honey.com/images/uploads/general/refguide.pdf
Computer with internet access
Teacher Materials Answer key
Vocabulary
• carbohydrate: Simple or complex sugars which serve as the main source of energy for living organisms
• monosaccharide: A simple sugar made of a single molecule (e.g. fructose, glucose) • disaccharide: A sugar made of two molecules (e.g. sucrose, maltose) • polysaccharide: A sugar made of multiple molecules (e.g. glycogen, starch) • enzyme: a compound that speeds the rate of a chemical process in the body • glycemic index: A way to measure how quickly glucose gets into the bloodstream and how food
affects blood glucose levels after consumption

P a g e | 43
Key STEM Ideas Carbohydrates are the main source of energy for living organisms. Carbohydrates can come in the form of simple or complex sugar molecules. Complex carbohydrates must be broken down into glucose, a simple sugar, in order to be used for energy production by living organisms. While carbohydrates are always made up of sugar, not all sugars are equally sweet.
Students’ Prior Knowledge Students should be familiar with the basic nutrients needed to sustain human life including carbohydrates, proteins, lipids, vitamins, minerals, and water.
Connections to Agriculture Managed honey bees are a valuable agricultural commodity. Colonies of bees are rented for their pollination services and their honey is used as a natural sweetener. A variety of different sweeteners including sugar, honey, or artificial sweeteners can be used as ingredients in food products. Honey has many applications when used as an ingredient in food products aside from its sweetness. For example, the moisture-retaining property of honey improves many baked goods such as cakes and breads and gives crusts a better texture. Honey can also be used as a dressing on roasted meat or fish as it penetrates the flesh where dry sugar will not (From A Book of Honey by Eva Crane). In using honey as an ingredient in various food products, this agricultural commodity adds nutritional value and aesthetic properties to processed foods.
Essential Links
• “Carbohydrates and the Sweetness of Honey” found at http://www.honey.com/images/downloads/carb.pdf
• “Is Honey the same as Sugar?” found at http://extension.arizona.edu/sites/extension.arizona.edu/files/pubs/az1577.pdf
• “Honey: A Reference Guide to Nature’s Sweetener” found at http://www.honey.com/images/uploads/general/refguide.pdf
Sources/Credits
• Honey production value in U.S. in 2014 (USDA NASS) • Background info on honey from The Book of Honey by Eva Crane

P a g e | 44
Lesson Procedures Engage Food activity:
1. Show students a variety of different carbohydrates such as milk, bread, pasta, table sugar, honey, etc. Discuss with students what they know and have heard about carbohydrates.
2. Make a list of student-generated similarities and differences between these carbohydrates. Discuss the ideas of simple vs. complex carbohydrates, differences in sweetness, and that almost all carbohydrates (except cellulose which we can’t digest) can be used for energy production.
3. Discuss if some carbohydrates are better for us than others. Explore Part 1: Introduction
4. Have students read part 1 and mark their best guesses for the series of true/false questions on the student worksheet about honey and sugar. This sections should not be used for grading purposes, but to illuminate student prior knowledge of honey and sugar.
5. Divide class into groups of 2-3 students. Have students read the following articles: a. “Carbohydrates and the Sweetness of Honey” found at
http://www.honey.com/images/downloads/carb.pdf b. “Is Honey the same as Sugar?” found at
http://extension.arizona.edu/sites/extension.arizona.edu/files/pubs/az1577.pdf 6. Ask students to compare their true-false answers with what they learned about in the articles within
their groups. Did they learn anything new about honey? Did anything surprise them? Explain Part 2: Comparing Carbs
7. Read the first paragraph of part 2 either as a whole class, in small groups, or individually. Facilitate a brief discussion with students about types of carbohydrates. Have students help make a chart on the board of the carbohydrates belonging to monosaccharides, disaccharides, and polysaccharides. To help students build vocabulary skills, discuss the Greek prefixes mono-, di-, and poly- and their meanings.
8. Guide students to evaluate what information is provided in the table in part 2. (Students should be able to see that carbohydrates have different levels of sweetness and disaccharides are made up of two of the monosaccharides.) Answer the question.
9. Read with students about digestion, or how enzymes break apart larger sugar molecules. Why does this happen? (The body makes energy using glucose but not all sugars are in this form so enzymes are used to convert larger sugar molecules into usable smaller molecules. A good analogy might be that this process is like converting a $50 bill into smaller change so that it can be used in a vending machine.)
10. Use the example of breaking down of lactose into glucose and galactose to show how digested lactose has a new sweetness rating of 55 compared to undigested lactose which is 20. Have students work in pairs to answer the follow-up questions. Check for student understanding and clarify when necessary.
11. Have students read the passage about how bees process nectar into honey. Ask students to draw a quick sketch of this process for understanding. Review the carbohydrate conversion taking place in honey processing. (Sucrose is broken down by invertase into fructose and glucose.) Answer the follow-up question.

P a g e | 45
12. Let students examine the ingredient list for Junior Mints. See how many types of carbohydrates students can find on the list of ingredients (Sugar (sucrose), corn syrup, confectioner's glaze (likely sugar and water), and modified food starch).
13. Note that an enzyme is added to the list of ingredients. Discuss what this enzyme will do to the sweetness of the carbohydrates (Increase it, similar to what happens to honey).
Extend Part 3: Developing a Food Product with Honey
14. Review with students that honey is an agricultural product made by bees. Food scientists will sometimes select honey as a sweetener because of its unique properties.
15. Divide students up into groups of 3-4 students. Explain that their task is to create a new food product using honey as one of ingredients.
16. Each group must come up with a produce name, identify a core audience for their product, determine what their packaging will look like, decide on ingredients, and draw a quick sketch of their food product. Lastly, they will list three reasons why they might choose to include honey. A chart of honey application benefits can be found in “Honey: A Reference Guide to Nature’s Sweetener” found at: http://www.honey.com/images/uploads/general/refguide.pdf
Evaluate Review with class
17. Review with students that the process of product development is important in the field of food science. Knowledge of biology, chemistry, and chemical engineering play important roles in developing new and improved food products to meet our nutritional needs.

P a g e | 46
Answer Key Part 1: Introduction In order to stay healthy, people need to eat a variety of nutritious foods. Food contains six nutrients that are necessary for good health. These nutrients include carbohydrates, proteins, lipids, minerals, vitamins, and water. Carbohydrates, lipids, and proteins are called organic molecules. These molecules are called organic molecules because they are carbon based and should not be confused with certified organic products. The USDA defines organic agriculture as using methods that preserve the environment and avoid most synthetic material as pesticides and antibiotics. Read each statement and check the appropriate box indicating if you think that the statement is true or false.
True False Statement
X A teaspoon of honey and a teaspoon of sugar have the same number of calories.
X A teaspoon of honey and a teaspoon of sugar have the same number of carbohydrates.
X
A teaspoon of honey and a teaspoon of sugar have the same effect on a person’s glycemic index (GI). GI is a measure of how carbohydrates affect a person’s blood sugar level. High GI foods “spike” a person’s blood sugar level which may increase a person’s risk of coronary heart disease and Type 2 diabetes.
X Honey is added to certain baked goods to extend shelf life.
X Honey is not recommended for infants under one year of age. Divide into groups of 2-3 students. Read the following articles. Discuss with your group if you learned anything new about honey or table sugar.
• Carbohydrates and the Sweetness of Honey http://www.honey.com/images/downloads/carb.pdf
• Is Honey the Same as Sugar? http://extension.arizona.edu/sites/extension.arizona.edu/files/pubs/az1577.pdf

P a g e | 47
Part 2: Comparing Carbs Carbohydrates are the main source of energy for living organisms. Glucose, fructose, and galactose are the three monosaccharides or single sugar molecules. Disaccharides are formed by two monosaccharides bonded together and include sucrose, also known as table sugar, and lactose, the sugar found in milk. Polysaccharides are large molecules formed by many monosaccharides bonded together. Animals store carbohydrates in the polysaccharide glycogen. Plants store carbohydrates in polysaccharides, starch and cellulose, the latter of which is used for structure and support. Whether simple or complex, all carbohydrates are made of sugar, but not all sugars are equally sweet. Food scientists have rated the relative sweetness of carbohydrates as seen in the table.
Relative Sweetness Scale
Carbohydrate Rating
Glucose 70-80
Galactose 35
Fructose 140
Sucrose (glucose + fructose) 100
Lactose (glucose + galactose) 20
High Fructose Corn Syrup 120-160
1. Which monosaccharide is the sweetest? Fructose When a disaccharide breaks down into its component monosaccharides, the sweetness changes as well. The resulting sweetness can be determined by averaging the sweetness of the two monosaccharides. Lactose is the disaccharide found in milk. Before lactose can be used by the body, it must be broken down into monosaccharides. The enzyme, lactase, breaks down lactose into the monosaccharides, glucose and galactose. When lactose is digested its sweetness changes too. The new sweetness can be calculated by averaging the sweetness rating of the two monosaccharides; glucose (75) and galactose (35). Note: The average value for glucose is used in the example.
Example: 𝟕𝟕𝟕𝟕+𝟑𝟑𝟕𝟕
𝟐𝟐=
𝟏𝟏𝟏𝟏𝟏𝟏
𝟐𝟐= 𝟕𝟕𝟕𝟕
2. How does the sweetness of milk compare to the sweetness of milk that has been digested by lactase? Undigested milk, lactose, is less sweet than digested milk, made of glucose and galactose. Compare the sweetness of lactose, 20, to the average sweetness of glucose and galactose, 𝟕𝟕𝟕𝟕+𝟑𝟑𝟕𝟕
𝟐𝟐= 𝟏𝟏𝟏𝟏𝟏𝟏
𝟐𝟐= 𝟕𝟕𝟕𝟕.

P a g e | 48
3. Sucrose or table sugar is also a disaccharide. What two monosaccharides compose sucrose? Fructose and glucose compose sucrose.
4. Using the average value for glucose, calculate the sweetness of sucrose after it has been broken down into its component monosaccharides. Sucrose = 𝟕𝟕𝟕𝟕+𝟏𝟏𝟏𝟏𝟏𝟏
𝟐𝟐= 𝟐𝟐𝟏𝟏𝟕𝟕
𝟐𝟐= 𝟏𝟏𝟏𝟏𝟕𝟕.𝟕𝟕
5. How does the sweetness of sucrose compare to the sweetness of sucrose that has been digested by
enzymes? Sucrose without digestion (100) is less sweet than digested sucrose (107.5).
6. Breaking down disaccharides into monosaccharides is necessary for digestion but food scientists see
another benefit. Of what advantage is producing sucrose that has already been broken down by enzymes? Sucrose that has been broken down by enzymes will be perceived as more sweet than sucrose that has not been broken down. This extra sweetness is more palatable to a consumer and makes a product more desirable.
Bees make honey by gathering nectar from certain flowering plants. Nectar is sucrose. Foraging bees carry the nectar to their hive where receiving bees unload the nectar load and begin to process the nectar into honey. During the processing, bees add invertase, an enzyme that breaks down sucrose.
7. How do you think sweetness of honey compares to the sweetness
of nectar? Explain your thinking. Honey is sweeter than nectar. Honey is glucose and fructose ( 𝟕𝟕𝟕𝟕+𝟏𝟏𝟏𝟏𝟏𝟏
𝟐𝟐= 𝟐𝟐𝟏𝟏𝟕𝟕
𝟐𝟐= 𝟏𝟏𝟏𝟏𝟕𝟕.𝟕𝟕) while nectar is sucrose
(100). Examine the ingredients on the label for Junior Mints to answer the questions below.
8. What carbohydrates have been used?
Sucrose (sugar), corn syrup, confectioner's glaze (likely sugar and water), and modified food starch
9. What enzyme has been added and how will that affect the sweetness of the carbohydrates? Invertase has been added and this will increase the sweetness of the sucrose by breaking it down into fructose and glucose with higher sweetness ratings.

P a g e | 49
Part 3: Developing a Food Product with Honey Food scientists use their knowledge of biology, chemistry, and chemical engineering to better understand food processes and to improve food products for consumers. Imagine you are a food scientist developing a new food product using honey as an ingredient.
1. What is the name of your product? Answers will vary.
2. Who is the core audience for your product? Answers will vary.
3. What will your packaging look like? Answers will vary.
4. What ingredients will be used in your product? Answers will vary.
5. Draw a quick sketch of what your product will look like? Answers will vary.
6. List three reasons why a food scientist might use honey instead of sugar in this recipe.
(You may want to refer to Honey: A Reference Guide to Nature’s Sweetener found here: http://www.honey.com/images/uploads/general/refguide.pdf to read about some of the applications for honey in food products.)

P a g e | 50
Lesson 5 | Imported Food Safety Background Purpose Students will examine where their food comes from, federal agencies involved in protecting our food supply, how imported foods such as honey present a safety challenge, and what measures are being taken to meet these challenges.
Standards Next Generation Science Standards HS-ETS1-1 Analyze a major global challenge to specify qualitative and quantitative criteria and constraints for solutions that account for societal needs and wants. Common Core RST.11-12.7 Integrate and evaluate multiple sources of information presented in diverse formats and media (e.g. quantitative data, video, multimedia) in order to address a question or solve a problem
Estimated Time One 50-minute class period
Student Materials
• Images of imported produce or actual produce labeled with country of origin labels • Student worksheet • Computer with internet access
Teacher Materials
• Answer key
Vocabulary
• regulation: a principle, rule, or law designed to control or govern conduct. A governmental order having the force of law
• import: a product brought from a foreign country to be sold • export: a product sent to a foreign country to be sold • tariff: a tax on imports or exports

P a g e | 51
Key STEM Ideas A major societal concern is protection of our nation’s food supply. In our increasingly global economy, agricultural products are regularly imported to meet consumer demand. Various federal agencies play a key role in protecting food safety via inspections of imported food. Their application of science, engineering, and technological advances can be applied to address the issue of ensuring food safety in the U.S.
Students’ Prior Knowledge Students should be familiar with webquests and have reading comprehension strategies for identifying important information in long-form texts such as news articles. Students need no prior knowledge of how food is imported or how agencies go about inspecting imported food products.
Connections to Agriculture Social, economic, and political climate has impacted global agriculture trade and has resulted in importation of a multitude of products which then enter the U.S. food supply. Recent legislation has updated government regulation and inspection of food imports. Students may or may not realize where their food comes from and this lesson illustrates the importance of imports in attaining many agricultural products that are taken for granted. In the U.S., consumers eat nearly 400 million pounds of honey each year. Domestic beekeepers produce approximately 150 million pounds of honey each year (USDA National Agricultural Statistics Service). The remaining 250 million pounds of honey is purchased from foreign suppliers. This honey is not just served on toast or in tea. Half of the honey consumed in the U.S. is incorporated into a variety of processed foods such as bread, cereals, and cookies. Regulation and inspection of imported honey is a key step in protecting the safety and integrity of our food supply chain.
Essential Links
• Federal Food Safety Portal, About Us: http://www.foodsafety.gov/about/federal/index.html • Food Safety fact sheet from Pew Charitable Trusts “Boost to Food Safety Funding Would Benefit
Public Health and Food Producers”: http://www.pewtrusts.org/en/research-and-analysis/fact-sheets/2015/03/boost-to-food-safety-funding-would-benefit-public-health-and-food-producers
• NYTimes’ article ““New Rules Make Companies Do More to Police Imported Food”: http://nyti.ms/1kTdpsf
• NYTimes’ article “Food Detectives on a Tough Case”: http://nyti.ms/1ujIb1r
Sources/Credits N/A

P a g e | 52
Lesson Procedures Engage Activity 1: Where does your food come from?
1. Hand out student worksheets. Show students images of imported produce or bring in actual produce labeled with country of origin labels. Have students discuss their answers to the following questions with a partner:
• Where do these foods come from? • Where did you find this information? • Who makes sure that foods in the U.S. are safe to eat?
2. Discuss answers with students to gain a sense of their prior knowledge of imported foods and the governmental agencies involved in food inspection and regulation.
Explore and Explain Activity 2: Global Food Trade Webquest
3. Provide students with access to the internet and instruct them to complete the webquest and record their answers on the student worksheet.
4. Review student answers to the webquest. 5. Conduct a discussion to determine that students understand which federal agencies are involved in
food safety and which foods or other products they are responsible for protecting. 6. Discuss the recent legislation, the Food Safety Modernization Act (FSMA), and how it will help to
improve imported food safety, the costs associated with these rules, and how food importers and consumers may be impacted.
Extend Activity 3: Safety Challenges of Importing Food
7. Have students answer the true/false statements. Guide students to understand how often honey is used in our foods and consumed by us even if they don’t use pure honey.
8. Have students read the New York Times’ article “Food Detectives on a Tough Case” found here: http://nyti.ms/1ujIb1r.
9. Have students answer questions on their own or with a partner. 10. Divide students up into small groups to make a list of problems with honey laundering
(contaminated with illegal antibiotics, adulterated/not a pure food product, lack of government oversight, fraud) and how the new legislation and how they feel the advanced chemical testing of honey or new FDA regulations will address issues of food safety.
Evaluate
11. Have each student work individually to answer the final question regarding if the measures they have read about are enough or if more safety measures should be put in place or not and their evidence-based reasoning.

P a g e | 53
Answer Key Activity 1: Where does your food come from? With a partner, examine the food items. Discuss the following questions. Either provide food items from the grocery store with Country of Origin Labels (COOLs) or provide images found in the PowerPoint presentation.
1. Where do these foods come from? Answers vary depending on what is provided to students.
2. Where did you find this information? Answers vary depending on what is provided to students.
3. Who makes sure that foods in the U.S. are safe to eat? Answers may vary—the idea is just to get students thinking and to evaluate their prior knowledge.
Activity 2: Global Food Trade Webquest In our increasingly global economy, agricultural products are regularly imported and exported between countries. To ensure the safety of food products in the U.S., several government agencies play a role with the process of food safety. Go to the web address: http://www.foodsafety.gov/about/federal/index.html and answer the following questions about how our food supply is kept safe.
1. What are three federal government agencies responsible for protecting our food supply and what are their duties regarding food safety?
• U.S. Department of Agriculture: The Food Safety and Inspection Service (FSIS) is the public health agency in the U.S. Department of Agriculture (USDA) responsible for ensuring that the nation's commercial supply of meat, poultry, and egg products is safe, wholesome, and correctly labeled and packaged.
• U.S. Food and Drug Administration: The FDA is charged with protecting consumers against impure, unsafe, and fraudulently labeled products. FDA, through its Center for Food Safety and Applied Nutrition (CFSAN), regulates foods other than the meat, poultry, and egg products regulated by FSIS.
• The Centers for Disease Control and Prevention: The CDC leads federal efforts to gather data on foodborne illnesses, investigate foodborne illnesses and outbreaks, and monitor the effectiveness of prevention and control efforts in reducing foodborne illnesses
P a g e | 54
2. Which agency would be responsible for ensuring the safety of the following food items?
o A carton of eggs ____USDA____________________________________________ o Bananas _____FDA__________________________________________________ o A burrito from a fast food restaurant ____ CDC ____________________________ o A steak purchased at the grocery store ___ USDA ___________________________ o A hamburger from the school cafeteria ___ CDC ___________________________ o Honey __ FDA ____________________________________________________ o Baby formula _____ FDA ____________________________________________
Read the fact sheet “Boost to Food Safety Funding Would Benefit Public Health and Food Producers” (http://www.pewtrusts.org/en/research-and-analysis/fact-sheets/2015/03/boost-to-food-safety-funding-would-benefit-public-health-and-food-producers) from The Pew Charitable Trusts, March 20, 2015.
3. The FDA is asking for how much additional federal funding to enact legislation that will help protect our food supply? $109.5 million
4. What are the top three ways the FDA proposes to spent this increase in funding? o Strengthen food safety oversight capacity and coordination with state and local authorities o Retrain FDA inspectors o Increase safety of food imports
5. What is the name of the legislation?
Food Safety Modernization Act (FSMA) Read the article “New Rules Make Companies Do More to Police Imported Food” (http://nyti.ms/1kTdpsf) from the New York Times, November 13, 2015.
6. What do the new rules require from food importers? The new rules require the food importers to police the food they import.
7. How does the FDA propose that food importers meet the new requirements? The FDA wants food importers to hire third-party auditors to check the safety of the food in foreign facilities.
8. What percent of the American food supply is imported? 22% of our food supply is imported.
9. The produce rule includes requirements for what four aspects of growing, harvesting, packing, and
storing produce? o water quality o employee health and hygiene o manure use o compost use
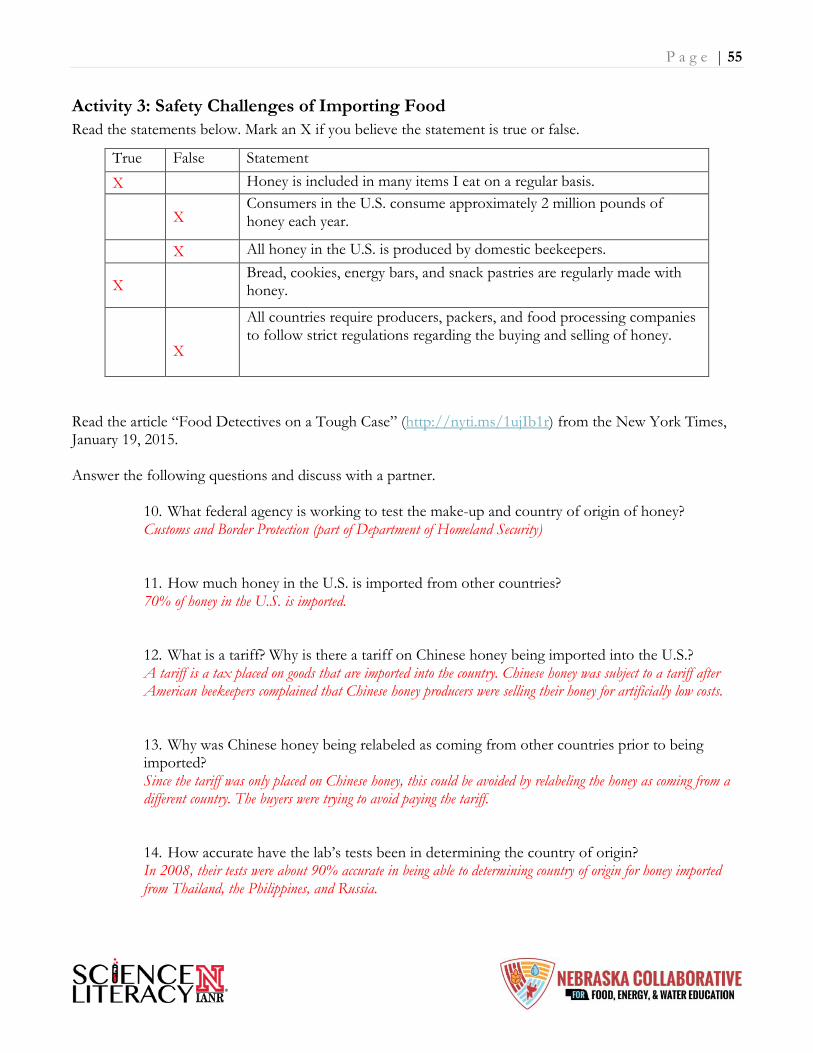
P a g e | 55
Activity 3: Safety Challenges of Importing Food Read the statements below. Mark an X if you believe the statement is true or false.
Read the article “Food Detectives on a Tough Case” (http://nyti.ms/1ujIb1r) from the New York Times, January 19, 2015. Answer the following questions and discuss with a partner.
10. What federal agency is working to test the make-up and country of origin of honey? Customs and Border Protection (part of Department of Homeland Security)
11. How much honey in the U.S. is imported from other countries? 70% of honey in the U.S. is imported.
12. What is a tariff? Why is there a tariff on Chinese honey being imported into the U.S.? A tariff is a tax placed on goods that are imported into the country. Chinese honey was subject to a tariff after American beekeepers complained that Chinese honey producers were selling their honey for artificially low costs.
13. Why was Chinese honey being relabeled as coming from other countries prior to being imported? Since the tariff was only placed on Chinese honey, this could be avoided by relabeling the honey as coming from a different country. The buyers were trying to avoid paying the tariff.
14. How accurate have the lab’s tests been in determining the country of origin? In 2008, their tests were about 90% accurate in being able to determining country of origin for honey imported from Thailand, the Philippines, and Russia.
True False Statement X Honey is included in many items I eat on a regular basis.
X Consumers in the U.S. consume approximately 2 million pounds of honey each year.
X All honey in the U.S. is produced by domestic beekeepers.
X Bread, cookies, energy bars, and snack pastries are regularly made with honey.
X
All countries require producers, packers, and food processing companies to follow strict regulations regarding the buying and selling of honey.

P a g e | 56
15. Give a brief description of how the lab is currently testing the honey’s country of origin. A sample is diluted and pumped into a mass spectrometer. A nebulizer turns the sample into a fine mists and sprays it over headed argon. This gives the lab a distinct signature of trace elements (sort of like a fingerprint of the elements found in the sample). The elements are measured at very low levels and the combination is compared to a reference database of known elemental “fingerprints”. The researchers look for a match.
16. Protecting the safety of our nation’s food supply is an important societal concern. Do you think the new safety legislation and improved laboratory techniques to detect unsafe aspects of our food supply will help to protect our nation’s food supply? Why or why not? Accept all reasonable answers.
17. Should something more be done? If yes, what do you propose? If no, how does the current system address food safety concerns? Accept all reasonable answers.