political ties and raising capital in global markets
TRANSCRIPT
1
Political Ties and Raising Capital in Global Markets:
Evidence from Yankee Bonds1
Gene Ambrocio
Bank of Finland
Xian Gu
Central University of Finance and Economics Wharton School, University of Pennsylvania
Iftekhar Hasan
Fordham University
1 For helpful comments we thank Warren Bailey, Alexander Butler, Stijn Claessens, Essi Eerola, Laura Xiaolei Liu, Darius Miller, Yaxuan Qi and John Wald, and seminar and session participants at Central University of Finance and
Economics (CUFE), Finnish Economics Association Annual Meeting 2019, Financial Management Association
Asia Pacific Meeting 2019.

2
Political Ties and Raising Capital in Global Markets:
Evidence from Yankee Bonds
Abstract
This paper examines whether state-to-state political ties help to obtain better terms when raising
capital in global capital markets. Focusing on publicly issued Yankee bonds, we observe that
firms from countries with close political ties to the US have been successful in reducing
borrowing costs. Specifically, a one-standard-deviation improvement in such ties can lead to a 5-
14 percent reduction in at-issue yield spreads. Such an association is more pronounced for firms
located in countries that are highly indebted, in government-related industries, and during home-
country recessions. Our study sheds lights on the importance of country-level political
relationships in international fund-raising.
Keywords: Yankee bonds; Political ties; Bond yield spread
JEL Code: G15; G30; P16

3
1. Introduction
Firms are increasingly global, not only in terms of markets served, sourcing of inputs,
and integration of supply chains, but also in terms of obtaining finance. Consequently, the
determinants and consequences of cross-border financing are popular topics of study in the
literature (e.g. Pagano et al., 2002; Eun and Sabherwal, 2003; Doidge et al. 2010).2 By and large,
the focus has been on cross-border equity issuance and bank lending and much less is known
about cross-border bond financing. Over the last three decades, there has been a remarkable
growth in international bond issuances and, over the last decade, such issuances have averaged
around 6 trillion USD annually.3 In recent years, about half of these bonds have been issued in
US dollars. Of particular interest is the Yankee Bond market, whereby firms around the globe
raise corporate debt in the United States.
In this paper, we consider a novel factor, state-to-state political ties, specifically the
strength of relations between the US and foreign governments of firms issuing Yankee bonds, as
a key determinant of the pricing of international capital raising. We test the hypothesis that close
political ties between the US and the home country of an issuing firm reduce the cost of Yankee
Bond issuance by improving creditor protection and by providing a hedge against sovereign risk.
Concretely, we examine whether close political ties, as measured in terms of voting similarity in
the UN General Assembly (UNGA) and the amount of US economic and military aid obligations
to a country, is priced into Yankee bond issuances.4
2 A non-exhaustive sample of the literature on cross-border equity listing is Bailey et al. (2006), Doidge et al. (2004),
Doidge et al. (2009), Errunza and Miller (2000), Errunza et al. (1999), Karolyi (2006), and Pagano et al. (2002). For
studies on international bank lending see Boehmer and Megginson (1990), Haselmann et al. (2010), Houston et al. (2012), and Delis et al. (2017). 3 Please see: https://www.bis.org/statistics/secstats.htm 4 There is a large related literature on the economic effects of foreign aid. A non-exhaustive list includes Alesina and
Dollar (2000), Boone (1996), Burnside and Dollar (2000), Clemens et al. (2012), Dreher et al. (2015), Easterly
(2003), and Temple and Van de Sijpe (2017).
4
Unlike other international bond markets (e.g., Eurobonds), the Yankee bond market
provides a unique setting to investigate a number of issues.5 A defining feature of this market is
that, while the home-country environment and firm characteristics are important determinants of
the pricing of bond issuances, foreign issuers of Yankee bonds must adhere to the US Security
and Exchange Commission’s (SEC’s) regulations.6 Consequently, one of the reasons why the
Yankee bond market is thriving is that Yankee bonds issued by firms across the globe with
diverse home-country environments are relatively comparable to US domestic bond issuances for
investors. To date, the literature on the determinants of Yankee bond issuances have focused on
the pricing and valuation of creditor protection along institutional quality in home countries and
security-level dimensions (Miller and Puthenpurackal, 2002; Miller and Reisel, 2012). We
provide a first evidence showing that state-level political ties, specifically with the US
government, also play a significant role in the pricing of Yankee bond issuances.
Our analysis shows that closer political ties with the US lead to lower borrowing costs,
higher issuance amount and longer maturity for firms in the Yankee bond market. Specifically, a
one-standard-deviation improvement in political ties with the US can, on average, results in a 5
to 14 percent reduction in at-issue Yankee bond yield spreads, a 50.4 percent increase in bond
issuance amount and a 29.3 percent increase in bond maturity. Our results on bond pricing terms
are robust to the inclusion of other factors related to country-level variation, such as institutional
quality and creditor protection, country risk, and political and democratic liberties, as well as the
exclusion of observations around the recent global financial crisis.
5 In 1990, the US Securities and Exchange Commission (SEC) approved Rule 144A, which allowed international
firms to sell private placements without having to register with the SEC in contrast with Yankee bonds. 6 For the SEC regulation, for example, as a reporting company in the US with both shares and bonds registered with
the SEC and traded on the New York Stock Exchange, Allianz SE was investigated by the SEC in 2012 due to the
Foreign Corrupt Practices Act (FCPA) violation and finally paid disgorgement of $5,315,649, prejudgment interest
of $1,765,125 and a penalty of $ 5,315,649 for a total of $12,396,423 (https://www.sec.gov/news/press-
release/2012-2012-266htm ).
5
We also show that our results are robust to any other potentially omitted country-time
covariates using a difference-in-difference strategy. We distinguish between industries that are
highly exposed to their governments and those that are not so exposed. Firms in these highly
exposed industries are more likely to benefit from closer state-to-state political ties with the US
as they themselves are more closely tied to their home governments. Exploiting the differential
effect of time-variation in country-level political ties with the US and across these highly
exposed and less exposed industries, we find that a one-standard-deviation increase in political
ties with the US leads to a 29 percent reduction in spreads for firms in industries that are closely
tied to their domestic governments relative to firms in other industries. To address endogeneity
concerns, we conduct instrumental variable analysis using official heads of state visits to the
White House and peak troop deployment contributions in the Iraq War 2003 by other countries.
These two variables measure the degree of (both actual and symbolic) cooperation between other
countries and the United States and are plausibly exogenous to other factors determining Yankee
Bond pricing and thus influence Yankee Bond Issuances only through their effect on political ties.
The analysis confirms our key finding that stronger political ties with the US can reduce the cost
of capital raising in the Yankee bond market.
We then investigate two potential channels by which stronger political ties with the US
benefit Yankee bond issuances, the sovereign risk hedge and investor protection channels. Since
the US is a major global economic, military, and political powerhouse, closer ties to the US may
also provide an implicit state “bailout” guarantee that helps reduce or provide a hedge against
sovereign risk. Bekaert et al. (2016) find that political risk is an important driver of sovereign
spreads. A strand of the literature has shown that IMF and World Bank programs are influenced
by stronger ties with the US. For instance, Malik and Stone (2018) find that the World Bank
6
withholds loan disbursements to enforce conditionality, but private multinational firms in the US
lobby for these funds to be released. Thacker (1999) finds that stronger ties with the US,
measured in terms of voting coincidence at the UN, improves the likelihood of obtaining IMF
loans.7 Consequently, stronger political ties with the US provides an implicit hedge against
sovereign risk faced by investors that may arise due to the potential collapse of domestic
macroeconomic conditions.
First, we test whether Yankee bond issuances by firms in country-years where sovereign
risk is heightened lead to stronger effects on yield spreads. We find that the impact of closer
political ties on Yankee bond yield spreads is more pronounced for firms in highly indebted
countries and during recessions in a home country, consistent with the hypothesis that closer
political ties with the US mitigate the risk of adverse domestic conditions on issuing firms. On
the other hand, we find that the effect of political ties is also stronger when the home country of
the issuing firm has good sovereign ratings. Consequently, these findings lead us to conclude that
closer political ties with the US help reduce the cost of borrowing most significantly through a
sovereign risk hedge channel when sovereign risk is heightened (for highly indebted countries
and during recessions) but not imminent (good sovereign rating).
State-to-state political ties may also influence Yankee bond issuances through an investor
protection channel. Closer state ties may enhance the certification effect that Yankee bond
issuances in the US market provide by implicitly strengthening the idea that US rules and norms
regarding investor protection may be applied to safeguard international investors. Thus, closer
political ties with the US may potentially add another layer of investor protection given that
closer ties may enhance the ability of the US government to better enforce its rules and norms on
7 Barro and Lee (2005) find similar results See also Dreher et al. (2009a,2009b) for results based on UN security
council seats and World Bank and IMF lending.

7
foreign states or put pressure on foreign governments to act in the interest of US-based
investors.8 Politically influenced SEC regulation (Pritchard, 1999; Correia, 2014; Heese, 2019;
Velikonja, 2016) may also serve as another dimension through which stronger state political ties
with the US can provide investor protection.
We also find evidence supporting the investor protection channel of political ties with the
US. We show that political ties with the US may serve as protection against SEC oversight by
exploiting a unique event, the US Supreme Court’s ruling in Morrison v National Australian
Bank (hereafter, Morrison) in 2010, as a shock to the threat of SEC enforcement in the securities
market for foreign issuers. The unexpected ruling in Morrison substantially pared back the
ability of private litigants to sue foreign reporting companies for fraud in the US, resulting a
higher reliance on SEC’s enforcement as a supplement to securities class actions and further on
Congressional intent regarding exercising jurisdiction over foreign matters (Fox, 2012; Bartlett,
et al. 2018; Correia and Klausner, 2018; Bartlett et al., 2018).9 Consistently, we find that post
Morrison, the political ties with the US are even more negatively associated with the Yankee
bond spreads at issuance, indicating that a ruling change that strengthens the SEC’s enforcement
for foreign issuers makes political ties with the US even more important in the pricing of Yankee
bonds. Finally, we explore how political ties interact with other factors relating to investor
protection previously studied in the Yankee Bond literature. We find that the effect of political
ties on Yankee bond yields is stronger when creditor rights are already high in the home country.
8 A related stream of the literature provides evidence that the US exerts influence and pressure on foreign
governments through US aid and news media coverage in Faye and Niehaus (2012) and Qian and Yanagizawa-Drott
(2017) respectively. 9 Originally, in Morrison, the US Supreme Court held that US securities antifraud laws, specifically, Section 10b and Rule 10b-5, do not reach transaction in securities of non-US firms traded outside of the US market, even if investors claim that their losses arose from conducts in the US. Hence, Morrison is about the territorial reach of US securities laws on autifraud, and reduces foreign firms’ exposure to private securities litigation in the US, and might further increase foreign firms’ willingness to enter the US market.
8
Taken together, our results suggest that political ties are most beneficial for firms in
countries with high government debt, good sovereign credit ratings and creditor rights protection,
and during home country recessions. These findings indicate that political ties work best in
reducing borrowing costs when the likelihood of needing investor protection is low (good
creditor rights) but exposure to country risk is significant (highly indebted countries in a
recession) but still low default risk (good sovereign ratings).
Our paper draws on the literature emphasizing the importance of political connections in
firm financing.10 Using campaign contribution data around the Brazilian elections of 1998 and
2002, Claessens et al. (2008) show that firms making substantial contributions experienced
higher stock returns and increased their bank financing. Further, Boubakri et al. (2012), working
largely from the viewpoint that politically connected firms are less risky, find that the cost of
equity capital is lower for such firms. Houston et al. (2014) also show that the cost of bank loans
is significantly lower for companies whose board members have strong political ties. In a related
paper, Solji and Tham (2017) show that foreign political connections add to multinational firm
value as they help firms enter foreign markets. This paper, however, is the first to elevate the
study of the effects and value of political connections on firms to the level of state-to-state
political ties and examine the effect on Yankee bond issuances.
Our study complements the current literature on the determinants of Yankee bond pricing
which have largely focused on investor protection.11 For example, Miller and Puthenpurackal
10 See e.g. Karolyi (2018) who shows that personal relations matter for firm financing conditions. Further, Faccio
(2006) finds that political connections (politician as large shareholder or senior executive) increase firm value, while
Goldman et al. (2009) find that firms exhibit positive abnormal returns following the nomination of a politically
connected individual to the board. Similar results are obtained in Fisman (2001) and Acemoglu et al. (2016). See also Banerji et al. (2016), and Butler et al. (2009). 11 There is a large literature on the determinants of cross-border financing. Qi et al. (2010) find that other domestic
institutions, such as those that cover political rights and freedom of the press, are important channels for reducing
the cost of debt. Haselmann et al. (2010) find that credit supply responds to legal environment. Delis et al. (2017),
using the polity index, show that democracy significantly reduces the cost of private credit. Giannetti and Yafeh
9
(2002) find that creditor protection is important in terms of ex-post protection via domestic legal
framework and institutions governing bankruptcy proceedings.12 Miller and Reisel (2012) show
that security-level protection in terms of covenants serve as ex-ante (prior to default)
mechanisms and are important determinants of the pricing of Yankee bonds. Qi et al. (2011)
examine how country-level legal and institutional quality shapes investor protection at the
contractual level and find that bonds issued firms from countries with stronger creditor rights are
less likely to use covenants. Finally, our use of voting similarity in the United Nations General
Assembly and foreign aid as measures of political ties relates our paper to the extensive literature
on the determinants and effects of foreign aid and international political dimensions to
multilateral organizations. Of special interest is the study by Alesina and Dollar (2000), who find
that important determinants of aid flows are a combination of institutions, policies, and political
variables. They also provide evidence suggesting that US aid is used to induce countries to vote
in line with US policies.
The rest of the paper proceeds as follows: Section 2 provides an overview of the Yankee
bond market; Section 3 describes the data, variables and summary statistics; Section 4 details the
methodology and presents empirical results; and Section 5 concludes.
2. An overview of the Yankee bond market
The Yankee bond market is one of the largest markets for non-US firms to raise US
corporate debt in the public market. Unlike other international corporate bond markets (e.g., Rule
(2015), find that cultural difference affect the contract terms of international syndicated bank loans. More specifically, they document that more culturally distant lead banks offer borrowers smaller loans at a higher interest
rate and are more likely to require third-party guarantees. 12 Djankov et al. (2007) show, using data across 129 countries, that creditor protection through the legal system and
credit bureaus increases the ratio of private credit to GDP. See also Houston et al. (2012), who find that bank credit
flows to markets with less restrictive regulations and stronger property and creditor rights protection.

10
144A bonds), foreign issuers are required to register with the SEC and use a US local syndicate
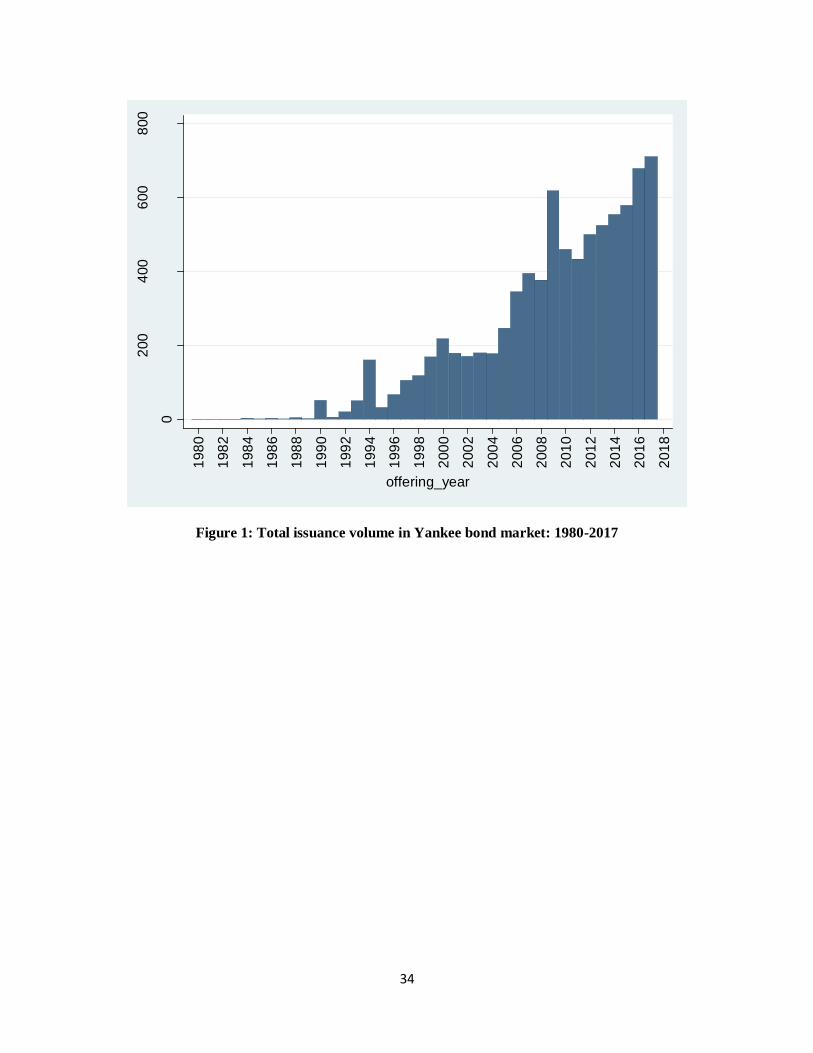
as an underwriter.13 Recent years have witnessed the fast rise of this market. The Yankee bond
issuance by non-financial foreign firms has represented an increasing share of the total US debt
issuance in recent years14 and has nearly doubled over the past decade, from US$395.9 bn in
2007 to $711.9bn in 2017. Figure 1 shows the total issuance volume of Yankee bonds from 1990
to 2016.
[FIGURE 1]
The Yankee bond market has several unique features. First, Yankee bonds are all US dollar-
denominated. Second, although issued by non-US firms, Yankee bond issuance is regulated by
the SEC and the US legal system. Foreign issuers must adhere to similar regulations as US firms,
including the Securities Act of 1933 and the Securities Exchange Act of 1934. For example, the
US Securities Act of 1933 requires that, before issuing Yankee bonds, firms must register with
the SEC and provide a prospectus including financial reports for the two years prior to the
offering. The financial reports must be reconciled with generally accepted US accounting
principles (GAAP). The Securities Exchange Act of 1934 further requires that issuers must
provide supplementary and periodic information after the issue. Third, Yankee bonds are all
underwritten by US syndicates. Fourth, the issuing firms’ home-country environment is also
relevant in Yankee bond contracting. Miller and Reisel (2012) document that both US and local
investor protections are important for Yankee bond issuance, and bond covenants serve as a
complement to investor protection in the home country. Qi et al. (2010) show that political rights
13 There are three bond markets for foreign firms to borrow in U.S. dollars: the Eurodollar bond market, the Rule 144A bond market, and the Yankee bond market (see, Gao, 2011). 14 The rise in Yankee bond issuance has been even more pronounced for financial institutions in recent years. Three
financial institutions (including UBS, Sumitomo Mitsui and Banco Santander) collectively issued a record of $293.5
bn Yankee bonds in 2017. See also: https://blogs.wsj.com/moneybeat/2018/01/16/foreign-companies-flock-to-the-u-
s-bond-market/?ns=prod/accounts-wsj
11
and corruption in issuers’ home countries also affect international capital raising through bond
markets. Finally, SEC oversight of Yankee bond issuances also relate Yankee bonds to evidence
suggesting that the SEC’s prosecutions are subject to political influence. For example, Correia
(2014) shows that firms that make contributions to congressmen who sit on oversight committees
are only about half as likely as others to be subject to SEC enforcement.15 These features of the
Yankee bond market suggest that strong ties with the US government, including indirectly
through relationships between the US government and the government of a firm’s home country,
may have significant influence on foreign firms who intend to raise debt in the Yankee bond
market.
3. Data and descriptive statistics
3.1 Sample construction
The data in this study are collected from multiple sources. We begin with a sample of 23,080
Yankee bonds with initial pricing information from Mergent FISD. Following Miller and Reisel
(2012), we exclude bonds issued before 1991 due to relatively poor data quality, as well as bonds
issued by divisions of US companies and convertible bonds.
We then match our bond data with firm financial data for the year prior to the bond issue
from Compustat Capital IQ.16 Finally we match our bond and firm financial data with country-
level variables, including international political ties, as well as other institutional factors and
country characteristics, retrieved from various sources. This procedure results in a sample of
2,293 Yankee bonds issued by 449 firms from 46 developed and developing countries, over the
period of 1992 to 2015. A full list of country name and number of observations is provided in
15 See also Pritchard (1999), Heese (2019), and Velikonja (2016). 16 We match each issuer using CUSIP and company names, to ensure as many matches as possible.

12
Appendix Table A.2.
3.2 Political ties variables
To measure international political ties, we consider two types of variables encompassing
different dimensions of political ties: voting similarity between a given country and the US in the
United Nations General Assembly (UNGA) and economic/military aid commitments given by
the US to other countries.
For voting similarities, we adopt the widely used Signorino and Ritter (1999) measure of
voting similarity in the voting patterns of two countries (one of which is the US) from the U.N.
General Assembly (see also Garmaise and Natividad, 2013). Voting_a is an index for voting
affinity originally ranging from -1 (least similar interests) to 1 (most similar interests), based on
two-category vote data (1= “yes” or approval of an issue; 2= “no” or disapproval of an issue).
Voting_b is the index of voting affinity with the same range but using three-category vote data
(1= “yes” or approval of an issue; 2= abstain, 3= “no” or disapproval of an issue). The measures
are constructed for each country c in year t by averaging the Signorino-Ritter score (S2) of
voting similarity with the US for each resolution (r) in year t:
(1)
Voting_b is constructed in a similar manner.
For US aid obligations, we retrieve aid data from the US Agency for International Aid
(USAID) Greenbook dataset.17 Laid econ is defined as the natural logarithm of total economic
aid given by the US to a country in constant 2014 USD; and Laid all is defined as the natural
17 The USAID Greenbook dataset allows us to distinguish between economic and military aid as well as to include
firms from both developing and developed countries in our sample. The OECD development aid dataset, however,
focuses only on economic aid and only to developing countries.

13
logarithm of total economic and military aid given by the US to a country also in constant 2014
USD. To consider both aspects and reduce noise in our measure for political ties, we also
employ principal component analysis to obtain an aggregated measure. PCecon_va or
PCecon_vb is defined as the principal component of Voting_a and Laid_econ or Voting_b and
Laid_econ; in a similar manner, PCall_va or PCall_vb is defined as the principal component of
Voting_a and Laid_all or Voting_b and Laid_all.18
3.3 Bond characteristics variables
Our main dependent variable is the At-issue bond yield spread, defined as the difference
between the at-issue bond yield and the yield of US Treasury bonds matched by maturity and
issuance date. We also consider other key bond characteristics: Log offamt is defined as the
natural logarithm of the bond offering amount in US$ thousands; Maturity is defined as the bond
duration in years; Rating score is the numeric score of the bond rating at issue, e.g. 22 for AAA,
21 for AAA-, and so on. If the bond rating is missing at issuance, we use instead the bond rating
or an issuer rating at the closest date after issuance. Enhancement equals one if the bond issue
has credit enhancements such as guarantees, letter of credit, etc., and zero otherwise; Covenants
equals one if covenants are present in the indenture, and zero otherwise; Redeemable equals one
if the bond is redeemable under certain circumstances, and zero otherwise; Puttable equals one if
a put option is present in the bond issue, and zero otherwise.
3.4 Firm characteristics variables
Our analysis also considers an assortment of firm characteristics. Firm size is the natural
logarithm of the book value of total assets; ROA is defined as the net income as a percentage of
18 The chosen principal component is the one where the loadings of both variables have the same sign (positive).
14
total assets; Leverage is the ratio of total liabilities to total assets; Tangibility is defined as net
property, plant and equipment over total assets.
3.5 Other country characteristics variables
Other than international political ties, we consider a set of other institutional factors that
include the legal and political systems of borrowers’ home countries. Creditor rights is an index
developed by Djankov et al. (2007), which measures 1) whether there are restrictions when a
debtor files for reorganization, 2) whether secured creditors can seize their collateral once
reorganization is approved, 3) whether secured creditors are paid out first, 4) whether the
management would be out for running business during reorganization. The index ranges from 1
(weakest protection) to 4 (strongest protection). Civil and Democracy, both ranging from 1 to 7,
measure civil liberties and democracy, both from Freedom House. For each measure, 1
represents the greatest degree of freedom and 7 the least. Civil is a composite based on answers
to 15 questions on topics such as freedom and independence of the press, religious and academic
freedom, freedom of expression and assembly, well-functioning NGOs and unions, as well as the
rule of law and personal rights. On the other hand, Democracy is a composite of ten indicators
measuring fair elections, political pluralism and participation, safeguards against corruption, and
the transparency and well-functioning of government. Following, Qi, Roth and Wald (2010), we
also use Henisz’s political constraint index as an alternative measure of political rights. The first
measure of political constraints in our analysis, Political constraints_a, as proposed in Henisz
(2002), measures the feasibility of political change. The second measure, Political constraints_b
is a structurally derived, internationally comparable indicator of political constraints, as proposed
in Henisz (2000).

15
Our investigation also includes an assortment of macro-economic variables. Openness is
calculated as total trade volume over GDP; Log GDP is the natural logarithm of GDP in current
USD; Trade with US is the trade volume with the US over GDP, measuring the trade relationship
with the US; Government debt is defined as the total government debt over GDP; Country rating
is a numerical index of sovereign long-term credit rating by S&P or Fitch, e.g., 22 for AAA, 21
for AAA-, and so on. Rating spread is defined as the difference between bond rating score at
issuance and country rating score in the same year. Table A.1 in the Appendix provides a detailed
list of variable definitions.
3.6 Descriptive statistics
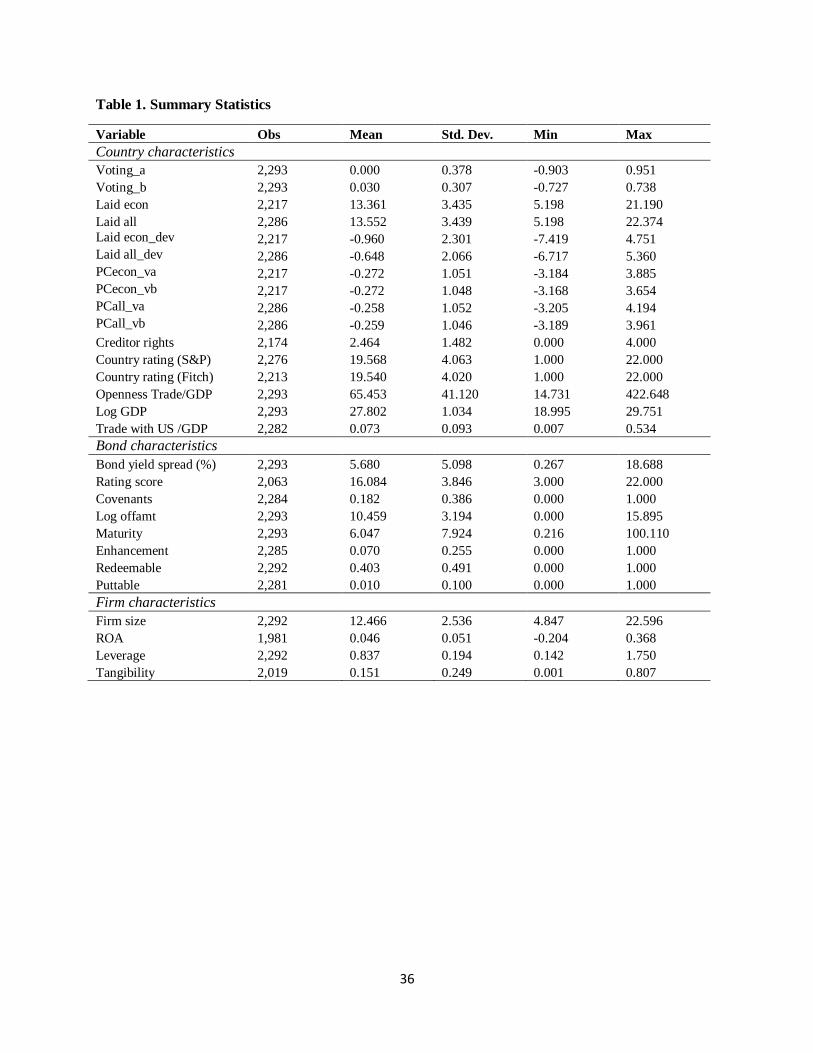
Table 1 provides summary statistics for our matched Yankee bond sample with political-tie
variables as well as other firm and country characteristics. The statistics reveal substantial
heterogeneity. At-issue bond yield spread ranges from 0.27% to 18.69% with a sample mean of
5.68% and standard deviation of 5.10%. The bond rating score ranges from 3 to 22, with a
sample mean of 16.08 and a standard deviation of 3.85. Maturity ranges from 0.22 years to
100.11 years, with a sample of 6.05 years, In our sample, on average, 18.2 percent of bonds have
covenants in the contracts; 7.0 percent have credit enhancements; 40.3 percent are redeemable
under certain circumstances, and 1.0 percent of bond contracts have put options.
[TABLE 1]
For firm characteristics, Firm size (log of total assets) ranges from 4.84 to 22.60, with a
sample mean of 12.47; ROA ranges from -0.20 to 0.37, with a sample mean of 0.05 and a
standard deviation of 0.05; Leverage ranges from 0.14 to 1.75, with a sample of 0.84, indicating
that majority bond issuers in our sample have relatively high leverage over the sample period;
the mean value of Tangibility is 0.15, ranging from 0.00 to 0.81, indicating that bond issuers in

16
our sample have relatively less tangible assets, such as property, plant and equipment, than others.
The issuers’ home country feature also shows substantial heterogeneity. For voting affinity
with the US, Voting_a ranges from -0.90 to 0.95, with a sample mean of 0.00; Voting_b ranges
from -0.73 to 0.74, with a sample mean of 0.03. Regarding aid from the US, Laid econ ranges
from 5.19 to 21.19; Laid all ranges from 5.19 to 22.37. The mean value of PCecon_va, the
principal component variable of Voting_a and Laid econ is -0.27; the mean value of PCecon_vb,
the principal component variable of Voting_b and Laid econ is -0.27. The other two principal
component variables, PCall_va and PCall_vb also shows similar mean value and variation.
Creditor rights range from 0 to 4, with a sample mean of 2.46, indicating that, on average, the
countries in our sample have relatively strong creditor protections. The mean value of Country
rating score by S&P is 19.57, suggesting that the majority of borrowers’ home countries have
ratings above AA+. The country rating score by Fitch shows a similar trend.
4. Methodology and Empirical Results
4.1 Methodology
We start by examining the effects of international political ties on Yankee bond initial
pricing, using the model below.
(2)
where At-issue bond yield spread is the dependent variable and are country, year, and
industry fixed effects respectively. The key explanatory variable is political ties with the US,
where we expect a negative value for the coefficient . Following the bond literature (e.g.
17
Klock, Mansi, and Maxwell, 2005; Hasan et al., 2017), we include bond characteristics: Log
offamt, Rating score, Maturity, Enhancement, Covenants, Redeemable, Puttable. Firm
characteristics included as controls are Firm size, ROA, Leverage, Tangibility. Miller and Reisel
(2012) and Qi, Roth and Wald (2010) show that other institutional factors such as home
country’s domestic creditor rights and political rights are also significant for bond pricing in an
international market. Hence, we also incorporate Creditor rights in our main regressions, as well
as Political uncertainty, Civil liberties and Democracy for robustness checks. Other
macroeconomic variables included in the regressions are Openness, Trade with US and Log GDP.
We include year, country, and industry fixed effects into all the regressions to account for time-,
country- and industry-specific heterogeneities.
4.2 Baseline results
Baseline results are reported in Table 2. In columns (1) to (4) we use Voting_a, Voting_b,
Laid econ and Laid all as the key explanatory variables, each measuring political ties. In all
specifications, coefficients of the political-tie variables are negative and significant, suggesting
that firms from home countries possessing stronger political ties with the US than the others, as
reflected by either stronger voting affinity with the US or more aid from the US, have
significantly lower at-issue bond yield spreads. The impact of stronger political ties with the US
is also economically meaningful. The results in column (1) show that a one-standard-deviation
increase in voting affinity (Voting_a) would reduce bond yield spreads by 61.7 basis points
which, given the average bond yield spreads in the analysis, implies an almost 11 percent
reduction in spreads. Results in columns (2) through (4) yield similar magnitudes, whereby one-
standard-deviation increase of the political ties variable leads to a reduction in yield spreads

18
between 30 and 90 basis points or between 5.7 and 14.3 percent.
[TABLE 2]
Alesina and Dollar (2000) suggest that economic aid can be quite stable and persistent over
time for some countries. In order to address this issue and consider changes in the flow of aid
provided by the US, we next estimate the same Equation (2) for the bond sample, using aid in
deviations from that predicted by known determinants. Laid econ_dev is the deviation of Laid
econ from the aid-prediction model in Alesina and Dollar (2000), where the aid variable is
regressed on the five-year moving average of GDP per capita, its square, trade openness, indices
for civil and political liberties, the log number of years a state was a colony and dummy variables
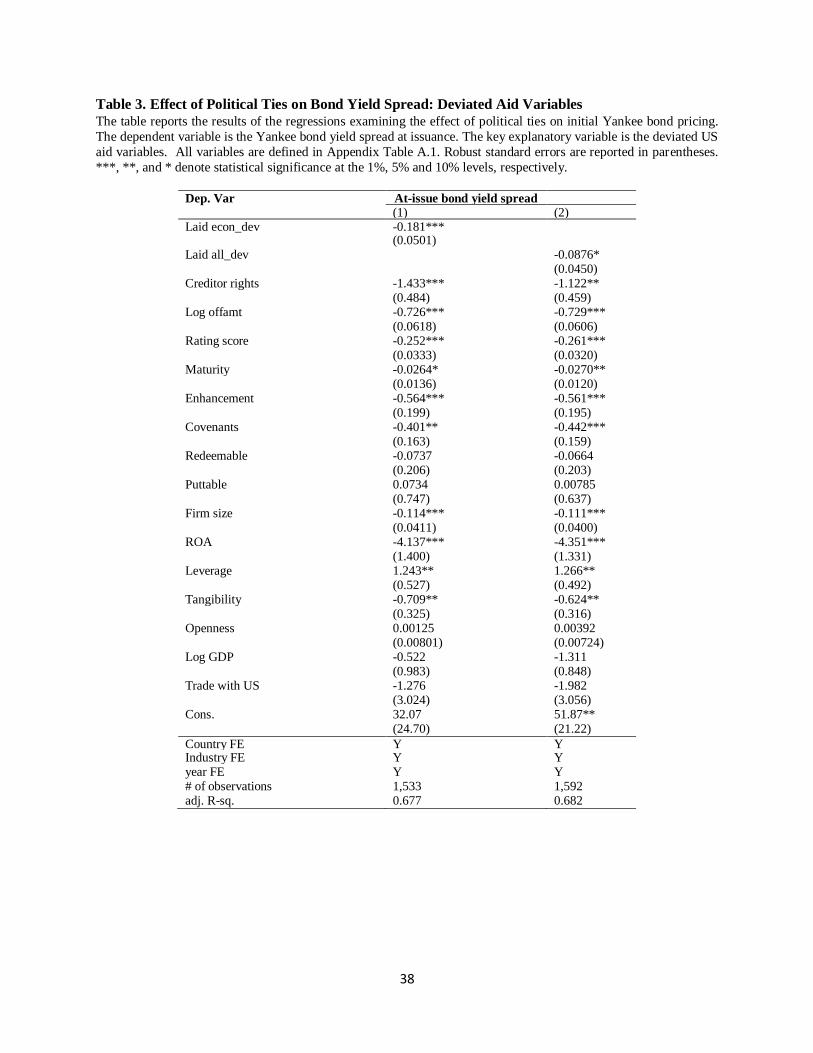
for Israel and Egypt. Laid all_dev is calculated in a similar way. The results are reported in Table
3. In both regressions, unpredicted changes in aid flows enter with significant and negative signs,
suggesting that firms from a home country with more aid from the US would have lower credit
yield spreads when issuing Yankee bonds in the US. Similarly, the impact of US aid is also
economically meaningful. For example, the results in column (1) show that a one-standard-
deviation increase in Laid econ_dev would reduce bond yield spreads by approximately 42 basis
points (or by 7.3 percent).
[TABLE 3]
In summary, evidence from the baseline regressions supports our hypothesis that firms from
a home country with stronger political ties with the US tend to enjoy significantly lower spreads
when they issue bonds in the US market.
4.3 Robustness and discussion
19
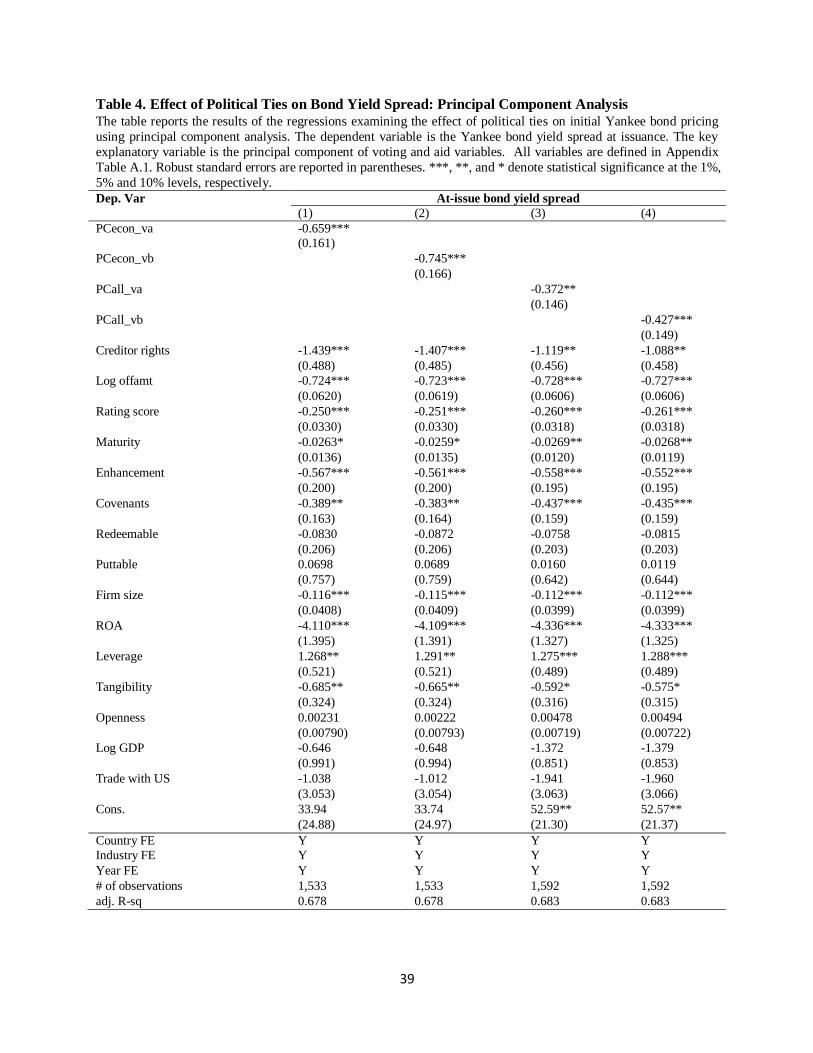
We perform various tests to evaluate robustness. First, we conduct principal component
analysis to extract the common factor driving our two measures of political ties. Results using
the extracted principal component are shown in Table 4. Key explanatory variables are the
principal components with positive loadings on both voting affinity and US aid. In columns (1)
and (2), we use the principal component of US economic aid and the two voting affinity
variables. Both PCecon_va and PCecon_vb enter with negative signs and are significant at the
1% level. In columns (3) and (4), we use the principal component of US total economic and
military aid and the two voting affinity variables. The estimated coefficients for both PCall_va
and PCall_vb are negative and significantly different from zero. The estimated effects are also
economically significant. For instance, the estimation from column (1) suggests that a one-
standard-deviation increase in PCecon_va reduces bond yield spreads by roughly 12.2 percent.
[TABLE 4]
Next, we incorporate more country-level institutional factors into our analysis. Several
studies document that, along with creditor protections, domestic political rights may also
influence debt pricing (e.g., Qi, Roth and Wald, 2010; Delis, Hasan and Ongena, 2019).
Therefore, we include political constraints and civil liberties as well as democracy as additional
controls in our regressions. The regression results are presented in Appendix Table A.3. For
brevity, we only report results using the principal component variables as the measure of political
ties with the US. The results show that the coefficients on political ties remain significantly
negative at the 1% level after controlling for these additional factors, and at a similar or even
larger magnitude of economic effects.
We then show that our results are robust to potentially omitted country-time variables by
focusing on differential effects across industries. Specifically, our hypothesis is that an industry’s
20
relationship and dependence on the domestic government might influence the effect of political
ties with the US on the cost of borrowing from the US market. If a firm is in an industry that is
more reliant on government than others, then it should derive greater benefit from its home
country’s stronger political ties with the US when it borrows from the Yankee bond market.
Moreover, such effects should be stronger and more significant during recessions. Therefore, we
first include the dummy Ind_gov, which takes the value of one if the industry relies more on
government (Utilities or Government agencies in our sample), and zero otherwise, and its
interaction with political-tie variables. Table 5 presents the results. In columns (1) and (3) we
include only political ties, Ind_gov, and a full set of control variables and, in columns (2) and (4),
we employ a difference-in-difference strategy by adding the interaction term of political ties and
Ind_gov. Given this strategy, we omit industry fixed effects but retain the country and year fixed
effects to absorb any other potentially omitted country and time covariates. We find that stronger
political ties with the US on average reduce bond spreads significantly, with the principal
component variables entering with negative and significant signs in all the specifications. More
importantly, the coefficients on the interaction term are negative and statistically significant,
suggesting that the magnitude of the effect of political ties effect is larger for industries with
closer ties to the government of their home country. Based on column (2), a one-standard-
deviation increase in political connection with the US reduces the cost of borrowing by
approximately 29.3 percent more for firms in government-dependent industries than for others.
Results from column (4) point to similar effects.
[TABLE 5]
Recent studies show that it is easier for more politically connected firms to obtain
government bailouts during crises e.g. Banerji, Duygun and Shaban, 2016). Therefore, the effect

21
of political ties with the US should be stronger for firms in government-dependent industries and
during recessions, given the implied additional support from the US government. In order to test
this hypothesis, we divide our sample into bonds issued during booms and those issued during
recessions. The results are reported in Table 6. Consistent with our hypothesis, we find that the
coefficients of the interaction term of political ties and Ind_gov are negative and significant only
during recessions. We also verify that the statistical significance of our results is robust to
clustered standard errors when clustering by home country. These results are reported in
Appendix Table A.4.
[TABLE 6]
In addition, we show that our results are not driven by crisis periods or other extreme events
such as the recent global financial crisis. Figure 2 shows the average at-issue bond yield spreads
in the Yankee bond market in our sample period. Beginning in 2007, the average spreads
increased dramatically because of the financial crisis that originated in the US. In order to isolate
this effect, we also exclude bonds issued between 2007 to 2010 as a robustness check. Appendix
Table A.5 reports the results. Our main results on the effect of political ties on the cost of
borrowing in the Yankee bond market still hold. Overall, the robustness checks confirm our
baseline results that political ties with the US are an important determinant of the cost of
borrowing if a foreign firm issues bonds in the Yankee bond market.
[FIGURE 2]
As a final robustness exercise, we conduct instrumental variable regressions using official
heads of state visits to the White House and peak troop deployment contributions in the Iraq War
by other countries as instruments.19 These two variables measure the degree of (both actual and
19 Official White House visits are taken from the Office of the Historian of the State Department,
https://history.state.gov/departmenthistory/visits. Peak troop contributions to the Iraq War are taken from the 2007
22
symbolic) cooperation between countries and the United States and are plausibly exogenous to
other factors determining Yankee Bond pricing and thus influences Yankee Bond Issuances only
through its effect on political ties, meaning that both the relevance condition and exclusive
condition should be satisfied. Table 7 reports regression results.20 Column (1) to (4) and (5) to (8)
report the results using one instrument at a time and column (9) to (12) use both instruments. For
instrument the peak troop deployment in the Iraq War we use the levels and squares to capture
the non-linear relationship between troops sent and political ties. The Cragg-Donald F and
Kleibergen-Paap F statistics indicate rejection of the null hypothesis of weak instruments. The
Kleigergen-Paap LM statistics reject the hypothesis of under-identification. When there are at
least two instruments, the Hansen J statistic fails to reject the overidentifying restrictions.
Overall the results using IV point to the same direction as our main finding, that stronger
political ties with the US can reduce the cost of fund raising in the Yankee bond market.
[TABLE 7]
4.4 Effect on non-pricing terms
We also investigate how the political ties with the US affect the non-pricing terms of Yankee
bonds over time. Table 8 reports the results, using the principal component variables of the
political ties. Column (1) to (4) show the effect on the offering amount. All the variables of
political ties enter with positive and significant signs at the 1% level, suggesting that issuers
located in countries with stronger political ties with the US tend to have larger offering amount
for each issue, holding all the other factors as constants. In terms of economic magnitude, the
coefficients in column (1) show that one-standard-deviation improvement in PCecon_va leads to
Congressional Report on Post-War Iraq Reconstruction and Stabilization efforts (RL32105). When presented at the
UN, the US proposal to invade Iraq was highly divisive with several NATO countries, notably France and Germany,
vocally opposed. 20 First stage results available upon request.
23
a 50.4 percent increase in offering amount. Column (5) to (8) report the effect on bond maturity.
The positive and significant coefficients on the variables of political ties suggest that issuers that
located in countries with stronger political ties with the US tend to have longer maturity. The
estimated effect is also economically large. Taking column (5) as an example, one-standard-
deviation increase in PCecon_va could lead to a 29.3 percent increase in maturity.
[TABLE 8]
4.5 Sovereign risk hedge channel
To dig deeper into the potential channels which drive our results, we test the sovereign risk
hedge channel by examining whether the effect of political ties on bond issuances are
differentially driven by common indicators of heightened sovereign risk. In particular, we test
whether the effect of political ties on bond pricing is higher when (i) the home country of the
issuing firm is in the downturn of the business cycle (recessions), (ii) the home country of the
issuer has relatively high levels of sovereign debt, and (iii) when the home country of the issuer
has relatively better sovereign credit ratings.
4.5.1 The effect of political ties during recessions
We examine whether the effect of political ties on the cost of borrowing from the Yankee
bond market is more pronounced in recessions. Since economic recessions in the home country
are periods when domestic conditions are worse, investors would be more concerned in such
periods about borrowers’ ability and incentives to repay their debts and engage in asset
substitution and other issues related to agency problems (Jiang et al., 2018). Strong political
connections with the US might help mitigate such concerns by providing an additional layer of
support. For example, some recent studies document that the US exerts influence and pressure on
24
foreign governments both through US aid and news media coverage (Faye and Niehaus, 2012;
Qian and Yanagizawa-Drott, 2017). Similarly, Thacker (1999) and Barro and Lee (2015) find
that voting coincidence with the US improves the likelihood of obtaining loans from the IMF.
A Recession dummy is defined as one when the GDP is below an HP filtered trend, and zero
otherwise. We then split our sample into bonds issued during booms vs. those issued during
recessions. The results are reported in Table 9 with the principal component of voting affinity
and US aid as the main explanatory variable. Consistent with our hypothesis, the effect of
political ties with the US is only significant during recessions, suggesting that additional
insurance from the US government acts as a mitigating factor for uncertainty in a home country
and reduces the cost of borrowing in the US market. Nevertheless, a Chi-square test on the
estimated coefficients across samples suggests that the difference is not statistically significant.
Moreover, our results show that the effect of creditor rights on bond spreads is more pronounced
during booms, while the effect of political ties is more significant during recessions. Investors
seems to place a higher value on policy- or government-oriented interventions as measures of
investor protection in bad economic times relative to market- and institutional-based mechanisms,
which are more highly valued in good times.
[TABLE 9]
4.5.2 The impact of government debt
Next, we turn to whether government debt levels in a home country affect the cost of
borrowing in the Yankee bond market and the values of stronger political ties. If a home country
is burdened by higher government debt, investors may pay more attention to country risk, since
fiscal policy may be limited to a large extent by repercussions on the performance of borrowing

25
firms. Stronger political ties with the US government can provide support to home governments
and help alleviate country risk concerns. Hence, political ties may be interpreted as an additional
implicit guarantee against the home-country risk of Yankee-bond-issuing firms.
In order to test this effect, we divide our sample into bond issuers from high- vs. low-debt
countries using the median value of government debt over GDP. The regression results for each
subsample are reported in Table 10. We find that the effect of political ties with the US is only
negative and significant in the subsample of highly indebted countries. A Chi-square test shows
that the difference across subsamples is also economically large and significant. In terms of the
economic impact for the high-debt countries, a one-standard-deviation increase in political ties
(PCecon_va) can reduce bond yield spreads by approximately 39.1 percent.
[TABLE 10]
4.5.6 The impact of sovereign risk
Finally, as a third indicator of whether stronger political ties with the US serve as a
sovereign risk hedge, we examine how the effect of political ties differs for firms from home
countries with different degrees of sovereign risk. In our sample, over 50 percent of issuers
received a bond rating of AAA. Therefore, we divide our sample into AAA and non-AAA rated
countries for this analysis. Table 11 reports the results. We use the rating spread between bond
rating and country rating instead of the simple bond rating and exclude country fixed effects
from the regressions. We use both sovereign ratings provided by S&P and Fitch for robustness.
We find that, while the overall effect of political ties on the cost of borrowing is negative and
significant for the full sample, this relation is significant only for AAA-rated countries, as shown
in columns (2) and (5), indicating that the insurance effect of political affinity with the US

26
against the tail risk of sovereign default is stronger for top-rated countries. The Chi-square tests
(with a P-value of 0.000 and 0.001 respectively) show that the economic impact of political
affinity is significantly different between the two subsamples. 21 Furthermore, the effects of
security-level protections (covenants) seem to reduce the cost of borrowing in a more significant
and stronger way for non-AAA rated countries. The Chi-square tests also confirm this finding.
[TABLE 11]
Taking into consideration the heterogeneous effects for countries with different levels of
sovereign risk and government debt and at different points of the business cycle, our finding
suggests that strong political ties with the US are most effective in reducing the cost of
borrowing from the Yankee bond market for borrowers from top-rated but also highly indebted
countries and when said countries are in recessions. All in all, our results suggest that political
ties may serve as a hedge for sovereign risk when such risk is more pronounced (high debt and
during recessions) but not imminent (good sovereign credit ratings hence the default risk is low).
4.6 Investor protection channel
Next, we turn to another potential channel by which stronger political ties with the US
provide added value to bondholders, the investor protection channel. Our first hypothesis in this
respect is that stronger political ties with the US may protect bond issuers, and thus their
bondholders, from regulatory activism by the SEC. To test this hypothesis, we exploit a unique
ruling change in the threat of SEC regulatory enforcement brought by the US Supreme Court.
Second, we also study whether or how political ties variable interacts with other measures of
investor protection such as creditor rights protection in home countries as well as security-level
21 For example, the sovereign rating for the UK remained at AAA, while its government debt level to GDP increased
to 100.91%. Our results suggest that the effect of political ties with the US on Yankee bond pricing is particularly
strong and significant for AAA-rated countries.
27
investor protection in terms of covenants.
4.6.1 The impact of ruling change: Morrison v. National Australian Bank (2010)
In this section, we exploit a unique event, the US Supreme Court’s ruling in Morrison v.
National Australian Bank, as a shock to SEC’s enforcement in securities market for foreign
issuers. 22 This ruling, described as a “steamroller”, substantially pared back the ability of
private litigants to bring lawsuits against foreign companies for fraud (Bartlett et al., 2018). The
overall effect of Morrison is a significant reduction of the exposure of foreign issuers to costly
and burdensome private securities litigation in the US (e.g. Fox, 2012). Existing literature (e.g.
Correia and Klausner, 2018; Choi and Pritchard, 2016) documents that the SEC’s enforcement of
the securities laws and private litigation complement each other in protecting investors in
securities market. Therefore, one outcome of Morrison is the stronger reliance on SEC’s
enforcement for foreign issuers. In the meanwhile, Morrison also implies on the extraterritorial
application of the US federal statutes. Bartlett et al. (2018) argue that a series of cases after
Morrison, the Supreme Court drew foreclosing lines to prevent US exercise of jurisdiction
abroad, further implying a more doctrinal point that the US as a matter of international norms
and laws should not be exercising jurisdiction on foreign matters without Congressional intent.
Given these, we should observe that the effect of political ties with the US in reducing Yankee
bond pricing is even stronger after Morrison.
Table 12 reports the results. In column (1) and (3) we include a time indicator, Post
22 The case Morrison v. National Australian Bank was argued on March 29, 2010, and finally decided on June 24,
2010 (For more ruling details, please see: https://www.supremecourt.gov/opinions/09pdf/08-1191.pdf). In Morrison, the US Supreme Court held that US securities antifraud laws do not reach transactions in securities of non-US firms
traded outside of the US market. However, the trading in the US is still covered by US laws. The Supreme Court
restated that “Section 10(b) reaches the use of a manipulative or deceptive device or contrivance only in connection
with the purchase of sale of a security listed on an American stock exchange, and the purchase or sale of any other
security in the US (Morrison, 561 U.S. at 273).

28
Morrison, defined as one if the bond is issued after Morrison, and zero otherwise during our
sample period. In column (2) and (4) we further introduce the interaction term of political ties
and Post Morrison. The results suggest that, holding all else equal, after Morrison, the at-issue
bond spreads are lower significantly, while such effect is even stronger for foreign firms located
in countries with stronger ties with the US. The economic impact is also not negligible. While on
average one-standard-deviation increase in PCecon_va reduces the at-issue bond yield spreads
for 9.5 percent, after Morrison, one-standard-deviation increase in PCecon_va reduces the
spreads for additional 7.6 percent. Overall the results indicate that a ruling change that indirectly
strengthens the SEC’s enforcement results in a more important role of political connections with
the US for foreign firms in issuing Yankee bonds.
[TABLE 12]
4.6.2 The strength of creditor rights
Qian and Strahan (2007) have shown that country-level institutional creditor protection
affect the design of debt contracts as well as borrowing costs. Moreover, bond contracts are more
likely to include security-level investor protection in the form of covenants when creditor rights
are weak (Miller and Reisel, 2012). In this exercise, we examine how international political ties
interact with institutional determinants of creditor protection and bond-contract design. We test
whether political ties substitute for or complement other forms of country-level and security-
level investor protection described in the literature.
To this end, we include the interaction of political ties and covenants in the regressions and
further split our sample into high- and low-creditor-rights countries using the median value of the
creditor rights index in our sample. Table 13 reports the results. First, our main results remain
29
unchanged: The effect of political ties with the US on cost of borrowing remains economically
and statistically significant in all the regressions. In addition, results in columns (2) and (5) show
that the magnitude of the coefficients is larger for the subsample of high-creditor-rights countries,
suggesting that stronger political ties with the US is more effective in reducing borrowing costs
for countries with stronger legal institutions. Second, the interaction terms enter with significant
and negative signs in the subsample of high-creditor-rights countries only in columns (2) and (5),
indicating that political affinity with the US complements security-level protections (i.e.,
covenants) in reducing bond spreads only for countries with stronger legal institutions, whereas
such association is not significant for countries with weak legal protections.
[TABLE 13]
5 Conclusion
In this study, we examine the effect of state-to-state political ties on international capital
raising using publicly issued Yankee bonds. We find that closer political ties with the US
government lead to lower borrowing costs for non-US firms through Yankee bond issuances.
Specifically, a one-standard-deviation improvement in political connection with the US can lead
to a reduction of 5 to 14 percent in at-issue bond yield spreads. Such an association is more
pronounced for firms in highly indebted and good-rated home countries and during recessions.
Moreover, evidence shows that political ties with the US are more effective in reducing
borrowing costs for firms in government-related industries. Overall, our study sheds lights on the
importance of state-to-state political relationships in international capital raising.
30
References
Acemoglu, D., Johnson, S., Kermani, A. & Kwak, J., 2016. The value of connections in turbulent times:
Evidence from the United States. Journal of Financial Economics, Volume 121, pp. 368-391.
Alesina, A. & Dollar, D., 2000. Who Gives Foreign Aid to Whom and Why?. Journal of Economic
Growth, 5(1), pp. 33-63.
Arndt, C., Jones, S. & Tarp, F., 2010. Aid, Growth, and Development: Have we come full circle?. Journal
of Globalization and Development, 1(2).
Bailey, M., Strezhnev, A. & Voeten, E., 2017. Estimating Dynamic State Preferences from United
Nations Voting Data. Journal of Conflict Resolution, 61(2), pp. 430-456.
Bailey, W., Karolyi, A. & Salva, C., 2006. The economic consequences of increased disclosure: Evidence
from international cross-listings. Journal of Financial Economics, Volume 81, pp. 175-213.
Banerji, S., Duygun, M. & Shaban, M., 2016. Political connections, bailouts in financial markets and firm
value. Journal of Corporate Finance, Volume 50, pp. 388-401.
Barro, R. & Lee, J.-W., 2005. IMF programs: Who is chosen and what are the effects?. Journal of
Monetary Economics, Volume 52, pp. 1245-1269.
Bartlett, R., Cain, M., Fisch, J. & Solomon, S., 2018. The Myth of Morrison: Securities Fraud Litigation
Against Foreign Issuers. University of Pennsylvania Law School ILE Working Paper No. 18-34.
Bekaert, G., Harvey, C., Lundblad, C. & Siegel, S., 2017. Political risk and international valuation.
Journal of Corporate Finance, Volume 37, pp. 1-23.
Boehmer, E. & Megginson, W., 1990. Determinants of secondary market prices for developing country
syndicated loans. Journal of Finance, 45(5), pp. 1517-1540.
Boone, P., 1996. Politics and the effectiveness of foreign aid. European Economic Review, Volume 40,
pp. 289-329.
Boubakri, N., Guedhami, O., Mishra, D. & Saffar, W., 2012. Political connections and the cost of equity
capital. Journal of Corporate Finance, Volume 18, pp. 541-559.
Burnside, C. & Dollar, D., 2000. Aid, Policies, and Growth. American Economic Review, 90(4), pp. 847-
868.
Butler, A., Fauver, L. & Mortal, S., 2009. Corruption, Political Connections, and Municipal Finance.
Review of Financial Studies, 22(7), pp. 2873-2905.
Carter, D. & Stone, R., 2015. Democracy and Multilateralism: The case of vote buying in the UN General
Assembly. International Organization, 69(1), pp. 1-33.
Choi, S. & Pritchard, A., 2016. SEC Investigations and Securities Class Actions: An Empirical
Comparison. Journal of Empirical Legal Studies, 13(1), pp. 27-49.
Claessens, S., Feijen, E. & Laeven, L., 2008. Political connections and preferential access to finance: The
role of campaign contributions. Journal of Financial Economics, Volume 88, pp. 554-580.
31
Clemens, M., Radelet, S., Bhavnani, R. & Bazzi, S., 2012. Counting chickens when they hatch: timing
and the effects of aid on growth. Economic Journal, Volume 122, pp. 590-617.
Correia, M., 2014. Political Connections and SEC Enforcement. Journal of Accounting and Economics,
Volume 57, pp. 2-3.
Correia, M. & Klausner, M., 2018. How effective are securities class action lawsuits?. Working Paper.
Delis, M., Hasan, I. & Ongena, S., 2019. Democracy and credit: 'Democracy doesn't come cheap' but at
least credit to its corporations will be. Journal of Financial Economics, forthcoming.
Djankov, S., McLiesh, C. & Shleifer, A., 2007. Private credit in 129 countries. Journal of Financial
Economics, Volume 84, pp. 299-329.
Doidge, C. et al., 2009. Private Benefits of Control, Ownership, and the Cross-Listing Decision. Journal
of Finance, 64(1), pp. 425-466.
Doidge, C., Karolyi, A. & Stulz, R., 2004. Why are foreign firms listed in the US worth more?. Journal of
Financial Economics, Volume 71, pp. 205-238.
Dreher, A., Minasyan, A. & Nunnenkamp, P., 2015. Government ideology in donor and recipient
countries: Does ideological proximity matter for the effectiveness of aid?. European Economic Review,
Volume 79, pp. 80-92.
Dreher, A., Sturm, J.-E. & Vreeland, J. R., 2009a. Development aid and international politics: Does
membership on the UN Security Council influence World Bank decisions?. Journal of Development
Economics, Volume 88, pp. 1-18.
Dreher, A., Sturm, J.-E. & Vreeland, J. R., 2009b. Global horse trading: IMF loans for votes in the United
Nations Security Council. European Economic Review, Volume 53, pp. 742-757.
Easterly, W., 2003. Can Foreign Aid Buy Growth?. Journal of Economic Perspectives, 17(3), pp. 23-48.
Errunza, V., Hogan, K. & Hung, M.-W., 1999. Can the Gains from International Diversification Be
Achieved without Trading Abroad?. Journal of Finance, 54(6), pp. 2075-2107.
Errunza, V. & Miller, D., 2000. Market Segmentation and the Cost of Capital in International Equity
Markets. Journal of Financial and Quantitative Analysis, 35(4), pp. 577-600.
Eun, C. & Sabherwal, S., 2003. Cross-Border Listings and Price Discovery: Evidence from U.S. Listed
Canadian Stocks.. Journal of Finance, 58(2), pp. 549-575.
Faccio, M., 2006. Politically Connected Firms. American Economic Review, 96(1), pp. 369-386.
Faye, M. & Niehaus, P., 2012. Political Aid Cycles. American Economic Review, 102(7), pp. 3516-3530.
Fisman, R., 2001. Estimating the Value of Political Connections. American Economic Review, 91(4), pp.
1095-1102.
Fox, M., 2012. Securities Class Actions Against Foreign Issuers. Stanford Law Review, Volume 64, pp.
1173-1177.
Gao, Y., 2011. The Sarbanes-Oxley Act and the Choice of Bond Market by Foreign Firms, Journal of
Accounting Research. 49(4): 933-968.

32
Garmaise, M. & Natividad, G., 2013. Cheap Credit, Lending Operations, and International Politics: The
Case of Global Microfinance. Journal of Finance, 68(4), pp. 1551-1576.
Giannetti, M. & Yafeh, Y., 2012. Do Cultural Differences Between Contracting Parties Matter? Evidence
from Syndicated Bank Loans. Management Science, 58(2), pp. 365-383.
Goldman, E., Rocholl, J. & So, J., 2009. Do Politically Connected Boards Affect Firm Value?. Review of
Financial Studies, 22(6), pp. 2331-2360.
Hasan, I., C. Hoi, Q. Wu, H. Zhang, 2017. Social Capital and Debt Contracting: Evidence from Bank
Loans and Public Bonds, Journal of Financial and Quantitative Analysis, 52(3): 1017-1047.
Haselmann, R., Pistor, K. & Vig, V., 2010. How Law Affects Lending. Review of Financial Studies,
23(2), pp. 549-580.
Henisz, W., 2000. The Institutional Environment for Economic Growth, Economics and Politics, 12(1):
1-31.
Henisz, W., 2002. The Institutional Environment for Infrastructure Investment, Industrial and Corporate
Change, 11(2): 355-389.
Houston, J., Jiang, L., Lin, C. & Ma, Y., 2014. Political Connections and the Cost of Bank Loans. Journal
of Accounting Research, 52(1), pp. 193-243.
Houston, J., Lin, C. & Ma, Y., 2012. Regulatory Arbitrage and International Bank Flows. Journal of
Finance, 67(5), pp. 1845-1895.
Jiang, F., K. John, W. Li and Y. Qian, 2018. Earthly Reward to the Religious: Religiosity and the Cost of
Public and Private Debt, Journal of Financial and Quantitative Analysis, 53(5): 2131-2160.
Karolyi, A., 2006. The World of Cross-Listings and Cross-Listings of the World: Challeinging
Conventional Wisdom. Review of Finance, Volume 10, pp. 99-152.
Karolyi, S., 2018. Personal Lending Relationships. Journal of Finance, 73(1), pp. 5-49.
Klein, C. & Stellner, C., 2014. Does sovereign risk matter? New evidence from eurozone corporate bond
ratings and zero-volatility spreads. Review of Financial Economics, 23(2), pp. 64-74.
Klock, M., S. Mansi and W. Maxwell, 2005. Does Corporate Governance Matter to Bondholders?
Journal of Financial and Quantitative Analysis, 40(4): 693-719.
Kuziemko, I. & Werker, E., 2006. How much is a Seat on the Security Council Worth? Foreign Aid and
Bribery at the United Nations. Journal of Political Economy, 114(5), pp. 905-930.
Leuz, C. & Oberholzer-Gee, F., 2006. Political relationships, global financing, and corporate transparency:
Evidence from Indonesia. Journal of Financial Economics, Volume 81, pp. 411-439.
Malik, R. & Stone, R., 2018. Corporate influence in World Bank Lending. Journal of Politics, 80(1), pp.
103-118.
Miller, D. & Puthenpurackal, J., 2002. The Costs, Wealth Effects, and Determinants of International
Capital Raising: Evidence from Public Yankee Bonds. Journal of Financial Intermediation, Volume 11,
pp. 455-485.

33
Miller, D. & Reisel, N., 2012. Do Country-level Investor Protections Affect Security-level Contract
Design? Evidence from Foreign Bond Covenants. Review of Financial Studies, 25(2), pp. 408-438.
Pagano, M., Roell, A. & Zechner, J., 2002. The Geography of Equity Listing: Why Do Companies List
Abroad?. Journal of Finance, 57(6), pp. 2651-2694.
Qi, Y., Roth, L. & Wald, J., 2010. Political rights and the cost of debt. Journal of Financial Economics,
Volume 95, pp. 202-226.
Qi, Y., Roth, L. & Wald, J., 2011. How legal environments affect the use of bond covenants. Journal of
International Business Studies, 42(2), pp. 235-262.
Qian, N. & Yanagizawa-Drott, D., 2017. Government distortion in independently owned media: Evidence
from U.S. news coverage of human rights. Journal of the European Economic Association, 15(2), pp.
463-499.
Qian, J. & P. Strahan, 2007. How Laws and Institutions Shape Financial Contracts: the Case of Bank
Loans. Journal of Finance, 62(6): 2803-2834.
Signorino, C. & Ritter, J., 1999. Tau-b or Not Tau-b: Measuring the Similarity of Foreign Policy
Positions. International Studies Quarterly, Volume 43, pp. 115-144.
Solji, E. & Tham, W. W., 2017. Foreign political connections. Journal of International Business Studies,
Volume 48, pp. 244-266.
Temple, J. & Van de Sijpe, N., 2017. Foreign aid and domestic absorption. Journal of International
Economics, Volume 108, pp. 431-443.
Thacker, S., 1999. The High Politics of IMF Lending. World Politics, 52(1), pp. 38-75.
Voeten, E., 2013. Data and analyses of votin in the UN General Assembly.. In: B. Reinalda, ed. Routledge
Handbook of International Organization. s.l.:Routledge.
34
0
200
400
600
800
to
tal offe
rin
g a
mo
un
t (b
n U
SD
)
198
0
198
2
198
4
198
6
198
8
199
0
199
2
199
4
199
6
199
8
200
0
200
2
200
4
200
6
200
8
201
0
201
2
201
4
201
6
201
8
offering_year
Figure 1: Total issuance volume in Yankee bond market: 1980-2017

35
05
10
15
avg_
offe
rin
g_
spre
ad
199
2
199
3
199
4
199
5
199
6
199
7
199
8
199
9
200
0
200
1
200
2
200
3
200
4
200
5
200
6
200
7
200
8
200
9
201
0
201
1
201
2
201
3
201
4
201
5
offering_year
Figure 2: Average bond yield spreads over years in our sample
36
Table 1. Summary Statistics
Variable Obs Mean Std. Dev. Min Max
Country characteristics
Voting_a 2,293 0.000 0.378 -0.903 0.951
Voting_b 2,293 0.030 0.307 -0.727 0.738
Laid econ 2,217 13.361 3.435 5.198 21.190
Laid all 2,286 13.552 3.439 5.198 22.374
Laid econ_dev 2,217 -0.960 2.301 -7.419 4.751
Laid all_dev 2,286 -0.648 2.066 -6.717 5.360
PCecon_va 2,217 -0.272 1.051 -3.184 3.885
PCecon_vb 2,217 -0.272 1.048 -3.168 3.654
PCall_va 2,286 -0.258 1.052 -3.205 4.194
PCall_vb 2,286 -0.259 1.046 -3.189 3.961
Creditor rights 2,174 2.464 1.482 0.000 4.000
Country rating (S&P) 2,276 19.568 4.063 1.000 22.000
Country rating (Fitch) 2,213 19.540 4.020 1.000 22.000
Openness Trade/GDP 2,293 65.453 41.120 14.731 422.648
Log GDP 2,293 27.802 1.034 18.995 29.751
Trade with US /GDP 2,282 0.073 0.093 0.007 0.534
Bond characteristics
Bond yield spread (%) 2,293 5.680 5.098 0.267 18.688
Rating score 2,063 16.084 3.846 3.000 22.000
Covenants 2,284 0.182 0.386 0.000 1.000
Log offamt 2,293 10.459 3.194 0.000 15.895
Maturity 2,293 6.047 7.924 0.216 100.110
Enhancement 2,285 0.070 0.255 0.000 1.000
Redeemable 2,292 0.403 0.491 0.000 1.000
Puttable 2,281 0.010 0.100 0.000 1.000
Firm characteristics
Firm size 2,292 12.466 2.536 4.847 22.596
ROA 1,981 0.046 0.051 -0.204 0.368
Leverage 2,292 0.837 0.194 0.142 1.750
Tangibility 2,019 0.151 0.249 0.001 0.807

37
Table 2. Effect of Political Tie on Bond Yield Spread: Baseline Results
The table reports the baseline results of the regressions examining the effect of political ties on initial Yankee bond
pricing. The dependent variable is the Yankee bond yield spread at issuance. The key explanatory variable is the
voting affinity score (Voting_a and Voting_b) and the US aid variables (Laid econ and Laid all). All variables are
defined in Appendix Table A.1. Robust standard errors are reported in parentheses. ***, **, and * denote statistical
significance at the 1%, 5% and 10% levels, respectively.
Dep. Var At-issue bond yield spread
(1) (2) (3) (4)
Voting_a -1.632**
(0.777)
Voting_b
-2.720***
(0.988)
Laid econ -0.183***
(0.0499)
Laid all -0.0941**
(0.0450)
Creditor rights -1.078** -0.997** -1.469*** -1.164**
(0.453) (0.456) (0.487) (0.460)
Log offamt -0.731*** -0.731*** -0.726*** -0.729***
(0.0608) (0.0608) (0.0619) (0.0606)
Rating score -0.261*** -0.263*** -0.252*** -0.261***
(0.0315) (0.0315) (0.0333) (0.0320)
Maturity -0.0276** -0.0277** -0.0263* -0.0269**
(0.0120) (0.0120) (0.0136) (0.0120)
Enhancement -0.580*** -0.577*** -0.565*** -0.560***
(0.195) (0.195) (0.198) (0.195)
Covenants -0.435*** -0.427*** -0.401** -0.441***
(0.158) (0.158) (0.163) (0.159)
Redeemable -0.0488 -0.0553 -0.0701 -0.0657
(0.202) (0.202) (0.206) (0.203)
Puttable 0.0333 0.0279 0.0619 0.00306
(0.647) (0.652) (0.749) (0.637)
Firm size -0.112*** -0.113*** -0.113*** -0.111***
(0.0391) (0.0391) (0.0410) (0.0400)
ROA -4.378*** -4.393*** -4.109*** -4.335***
(1.322) (1.318) (1.400) (1.330)
Leverage 1.234** 1.245** 1.251** 1.274***
(0.485) (0.484) (0.527) (0.492)
Tangibility -0.642** -0.614* -0.706** -0.620**
(0.316) (0.315) (0.325) (0.316)
Openness 0.00640 0.00708 0.0000454 0.00329
(0.00712) (0.00716) (0.00793) (0.00720)
Log GDP -1.176 -1.111 -0.720 -1.410*
(0.850) (0.857) (0.989) (0.852)
Trade with US -1.574 -1.433 -1.096 -1.867
(3.145) (3.193) (3.006) (3.038)
Cons. 46.95** 44.75** 39.93 55.84***
(21.38) (21.57) (24.94) (21.38)
Country FE Y Y Y Y
Industry FE Y Y Y Y
Year FE Y Y Y Y
# of observations 1,599 1,599 1,533 1,592
adj. R-sq. 0.683 0.683 0.677 0.682
38
Table 3. Effect of Political Ties on Bond Yield Spread: Deviated Aid Variables
The table reports the results of the regressions examining the effect of political ties on initial Yankee bond pricing.
The dependent variable is the Yankee bond yield spread at issuance. The key explanatory variable is the deviated US
aid variables. All variables are defined in Appendix Table A.1. Robust standard errors are reported in parentheses.
***, **, and * denote statistical significance at the 1%, 5% and 10% levels, respectively.
Dep. Var At-issue bond yield spread (1) (2)
Laid econ_dev -0.181*** (0.0501) Laid all_dev -0.0876* (0.0450) Creditor rights -1.433*** -1.122**
(0.484) (0.459)
Log offamt -0.726*** -0.729***
(0.0618) (0.0606)
Rating score -0.252*** -0.261***
(0.0333) (0.0320)
Maturity -0.0264* -0.0270**
(0.0136) (0.0120)
Enhancement -0.564*** -0.561***
(0.199) (0.195)
Covenants -0.401** -0.442***
(0.163) (0.159)
Redeemable -0.0737 -0.0664
(0.206) (0.203)
Puttable 0.0734 0.00785
(0.747) (0.637)
Firm size -0.114*** -0.111***
(0.0411) (0.0400)
ROA -4.137*** -4.351***
(1.400) (1.331)
Leverage 1.243** 1.266**
(0.527) (0.492)
Tangibility -0.709** -0.624**
(0.325) (0.316)
Openness 0.00125 0.00392
(0.00801) (0.00724)
Log GDP -0.522 -1.311
(0.983) (0.848)
Trade with US -1.276 -1.982
(3.024) (3.056)
Cons. 32.07 51.87** (24.70) (21.22)
Country FE Y Y Industry FE Y Y year FE Y Y # of observations 1,533 1,592 adj. R-sq. 0.677 0.682
39
Table 4. Effect of Political Ties on Bond Yield Spread: Principal Component Analysis
The table reports the results of the regressions examining the effect of political ties on initial Yankee bond pricing
using principal component analysis. The dependent variable is the Yankee bond yield spread at issuance. The key
explanatory variable is the principal component of voting and aid variables. All variables are defined in Appendix
Table A.1. Robust standard errors are reported in parentheses. ***, **, and * denote statistical significance at the 1%,
5% and 10% levels, respectively.
Dep. Var At-issue bond yield spread
(1) (2) (3) (4)
PCecon_va -0.659***
(0.161)
PCecon_vb
-0.745***
(0.166)
PCall_va -0.372**
(0.146)
PCall_vb -0.427***
(0.149)
Creditor rights -1.439*** -1.407*** -1.119** -1.088**
(0.488) (0.485) (0.456) (0.458)
Log offamt -0.724*** -0.723*** -0.728*** -0.727***
(0.0620) (0.0619) (0.0606) (0.0606)
Rating score -0.250*** -0.251*** -0.260*** -0.261***
(0.0330) (0.0330) (0.0318) (0.0318)
Maturity -0.0263* -0.0259* -0.0269** -0.0268**
(0.0136) (0.0135) (0.0120) (0.0119)
Enhancement -0.567*** -0.561*** -0.558*** -0.552***
(0.200) (0.200) (0.195) (0.195)
Covenants -0.389** -0.383** -0.437*** -0.435***
(0.163) (0.164) (0.159) (0.159)
Redeemable -0.0830 -0.0872 -0.0758 -0.0815
(0.206) (0.206) (0.203) (0.203)
Puttable 0.0698 0.0689 0.0160 0.0119
(0.757) (0.759) (0.642) (0.644)
Firm size -0.116*** -0.115*** -0.112*** -0.112***
(0.0408) (0.0409) (0.0399) (0.0399)
ROA -4.110*** -4.109*** -4.336*** -4.333***
(1.395) (1.391) (1.327) (1.325)
Leverage 1.268** 1.291** 1.275*** 1.288***
(0.521) (0.521) (0.489) (0.489)
Tangibility -0.685** -0.665** -0.592* -0.575*
(0.324) (0.324) (0.316) (0.315)
Openness 0.00231 0.00222 0.00478 0.00494
(0.00790) (0.00793) (0.00719) (0.00722)
Log GDP -0.646 -0.648 -1.372 -1.379
(0.991) (0.994) (0.851) (0.853)
Trade with US -1.038 -1.012 -1.941 -1.960
(3.053) (3.054) (3.063) (3.066)
Cons. 33.94 33.74 52.59** 52.57**
(24.88) (24.97) (21.30) (21.37)
Country FE Y Y Y Y
Industry FE Y Y Y Y
Year FE Y Y Y Y
# of observations 1,533 1,533 1,592 1,592
adj. R-sq 0.678 0.678 0.683 0.683

40
Table 5. Effect of Political Ties on Bond Yield Spread: the Impact of Government Dependence
The table reports the results of the regressions examining the impact of industry’s dependence on the government on
political ties and Yankee bond initial pricing. The dependent variable is the Yankee bond yield spread at issuance.
The key explanatory variable is the principal component of voting and aid variables, and its interaction with Ind_gov.
Ind_gov is defined as 1 for Utility and Government Agencies, and 0 otherwise (Industry, Finance and
Miscellaneous). All the other variables are defined in Appendix Table A.1. Robust standard errors are reported in parentheses. ***, **, and * denote statistical significance at the 1%, 5% and 10% levels, respectively.
Dep. Var At-issue bond yield spread
(1) (2) (3) (4)
PCecon_va -0.662*** -0.361**
(0.156) (0.157)
Ind_gov 0.458** -0.0871 0.446** -0.0748
(0.223) (0.235) (0.223) (0.234)
PCecon_va *Ind_gov -1.136***
(0.208)
PCecon_vb -0.752*** -0.456***
(0.161) (0.162)
PCecon_vb *Ind_gov -1.118***
(0.212)
Creditor rights -1.281*** -0.891* -1.254*** -0.912*
(0.481) (0.481) (0.479) (0.477)
Log offamt -0.734*** -0.704*** -0.733*** -0.704***
(0.0602) (0.0608) (0.0602) (0.0608)
Rating score -0.265*** -0.275*** -0.266*** -0.276***
(0.0320) (0.0310) (0.0319) (0.0310)
Maturity -0.0282** -0.0247* -0.0278** -0.0247*
(0.0138) (0.0137) (0.0137) (0.0137)
Enhancement -0.668*** -0.423** -0.661*** -0.427**
(0.203) (0.188) (0.203) (0.189)
Covenants -0.426*** -0.475*** -0.421*** -0.468***
(0.155) (0.153) (0.156) (0.154)
Redeemable -0.0532 -0.102 -0.0577 -0.109
(0.200) (0.197) (0.199) (0.197)
Puttable 0.0475 0.0697 0.0470 0.0507
(0.774) (0.733) (0.775) (0.737)
Firm size -0.131*** -0.0652* -0.131*** -0.0666*
(0.0378) (0.0346) (0.0377) (0.0347)
ROA -3.542*** -2.885** -3.536*** -2.806**
(1.318) (1.222) (1.315) (1.222)
Leverage 0.816** 0.832** 0.836** 0.829**
(0.401) (0.395) (0.400) (0.394)
Tangibility -0.803*** -0.384 -0.773*** -0.384
(0.281) (0.282) (0.281) (0.282)
Openness 0.00311 0.00444 0.00290 0.00392
(0.00758) (0.00780) (0.00761) (0.00779)
Log GDP -0.810 -0.925 -0.802 -0.925
(1.015) (0.980) (1.017) (0.983)
Trade with US 0.216 0.0118 0.230 0.0819
(3.013) (3.064) (3.015) (3.044)
Cons. 38.14 38.22 37.72 38.19
(25.62) (24.68) (25.68) (24.77)
Country FE Y Y Y Y
Year FE Y Y Y Y
Industry FE
N N N N
# of observations 1,533 1,533 1,533 1,533
adj. R-sq 0.678 0.682 0.679 0.682

41
Table 6. Effect of Political Ties on Bond Yield Spread: the Impact of Government Dependence over
Business Cycle
The table reports the results of the regressions examining the impact of industry feature (its dependence on
government) over business cycle on political ties and Yankee bond initial pricing. The dependent variable is the
Yankee bond yield spread at issuance. The key explanatory variable is the principal component of voting and aid variables, and its interaction with Ind_gov. Ind_gov is defined as 1 for Utility and Government, and 0 otherwise
(Industry, Finance and Miscellaneous). All the other variables are defined in Appendix Table A.1. Robust standard
errors are reported in parentheses. ***, **, and * denote statistical significance at the 1%, 5% and 10% levels,
respectively.
Dep. Var At-issue bond yield spread
(1) (2)
Boom Recession
PCecon_va -0.00833 0.172
(0.223) (0.290)
Ind_gov -0.169 -0.425
(0.267) (0.446)
PCecon_va *Ind_gov -0.230 -1.328***
(0.253) (0.346)
Creditor rights -2.321*** -2.153
(0.761) (1.557)
Log offamt -0.589*** -0.767***
(0.0730) (0.124)
Rating score -0.279*** -0.341***
(0.0461) (0.0434)
Maturity -0.0189 -0.0320
(0.0165) (0.0202)
Enhancement -0.427* -0.259
(0.251) (0.295)
Covenants -0.879*** 0.212
(0.206) (0.247)
Redeemable 0.228 -0.977***
(0.268) (0.337)
Puttable -0.117 0.0159
(1.188) (0.741)
Firm size 0.0995** -0.135**
(0.0461) (0.0648)
ROA -0.230 -3.726**
(1.622) (1.891)
Leverage -0.108 1.291*
(0.505) (0.751)
Tangibility -0.491 0.183
(0.380) (0.516)
Openness -0.0256*** 0.0387*
(0.00920) (0.0202)
Log GDP -0.138 2.661
(1.049) (2.329)
Cons. 25.05 -53.90
(26.37) (56.46)
Chi-sq 6.86***
(P-value) (0.0088)
Country FE Y Y
Year FE Y Y
Industry FE N N
# of observations 840 693
adj. R-sq 0.437 0.794

42
Table 7. Effect of Political Ties on Bond Yield Spread: Instrument Variable Regressions
The table reports the results of instrumental variable regressions examining the impact of political ties on Yankee bond initial pricing. The dependent variable is the Yankee bond yield spread at issuance. The key explanatory variable is the principal component of voting and aid variables instrumented with official heads of state
visits to the White House (WH visit) and peak troop deployment in the Iraq war (Iraq) where the latter enters in levels and squares to capture non-linear relationship
between troops sent and political ties. All the other variables are defined in Appendix Table A.1. The Cragg-Donald F and Kleibergen-Paap F statistics indicate
rejection of the null hypothesis of weak instruments. The Kleibergen-Paap LM statistics reject the hypothesis of under-identification. When there are at least two instruments, the Hansen J statistic fails to reject the overidentifying restrictions. First stage results available upon request. Robust standard errors are reported in
parentheses. ***, **,* denote statistical significance at the 1%, 5% and 10% levels, respectively.
Dep. Var At-issue bond yield spread
(1) (2) (3) (4) (5) (6) (7) (8) (9) (10) (11) (12)
PCall_va -1.425*** -2.260*** -2.028*** (0.40) (0.29) (0.27) PCecon_va -1.194*** -2.621*** -2.093*** (0.38) (0.37) (0.30) PCall_vb -1.371*** -2.294*** -2.030*** (0.38) (0.29) (0.26)
PCecon_vb -1.157*** -2.661*** -2.065*** (0.36) (0.37) (0.30) Log offamt -0.866*** -0.879*** -0.871*** -0.883*** -0.813*** -0.799*** -0.816*** -0.802*** -0.836*** -0.840*** -0.839*** -0.845*** (0.06) (0.06) (0.05) (0.06) (0.05) (0.06) (0.05) (0.06) (0.05) (0.06) (0.05) (0.06) Rating score -0.238*** -0.215*** -0.241*** -0.216*** -0.290*** -0.303*** -0.298*** -0.311*** -0.278*** -0.283*** -0.287*** -0.289*** (0.04) (0.04) (0.04) (0.04) (0.03) (0.03) (0.03) (0.03) (0.03) (0.04) (0.04) (0.04) Maturity -0.031 -0.042 -0.032 -0.042 -0.027** -0.027* -0.027** -0.027* -0.026 -0.036 -0.027 -0.037 (0.02) (0.03) (0.02) (0.03) (0.01) (0.01) (0.01) (0.01) (0.02) (0.03) (0.02) (0.03)
Enhancement -1.243*** -1.427*** -1.256*** -1.433*** -0.839*** -1.011*** -0.824*** -0.996*** -1.066*** -1.234*** -1.061*** -1.237*** (0.27) (0.27) (0.27) (0.27) (0.23) (0.25) (0.23) (0.25) (0.27) (0.29) (0.27) (0.29) Covenants -0.645*** -0.658*** -0.646*** -0.658*** -0.334* -0.230 -0.322* -0.211 -0.598*** -0.542** -0.593*** -0.538** (0.20) (0.22) (0.21) (0.22) (0.17) (0.18) (0.17) (0.19) (0.21) (0.22) (0.21) (0.23) Puttable -1.105** -1.530*** -1.220** -1.586*** -0.262 -0.227 -0.316 -0.275 -0.802 -1.453** -0.932* -1.550** (0.55) (0.46) (0.52) (0.45) (0.77) (0.91) (0.78) (0.92) (0.59) (0.64) (0.53) (0.61) Redeemable 0.221 0.329 0.241 0.342 -0.111 -0.057 -0.110 -0.054 0.082 0.177 0.095 0.193 (0.26) (0.26) (0.26) (0.26) (0.20) (0.20) (0.20) (0.20) (0.25) (0.26) (0.25) (0.26) Firmsize -0.240*** -0.245*** -0.231*** -0.240*** -0.159*** -0.120*** -0.145*** -0.104** -0.214*** -0.189*** -0.198*** -0.177***
(0.04) (0.04) (0.04) (0.04) (0.03) (0.04) (0.03) (0.04) (0.04) (0.04) (0.04) (0.05) ROA -2.568 -1.482 -2.347 -1.343 -3.274** -2.772* -3.211** -2.713* -3.677* -2.697 -3.498* -2.502 (1.92) (1.87) (1.85) (1.83) (1.44) (1.58) (1.44) (1.57) (1.95) (2.07) (1.93) (2.03) Leverage 1.382*** 1.355** 1.387*** 1.336** 0.774** 0.782* 0.795** 0.778* 1.515*** 1.607*** 1.540*** 1.585*** (0.47) (0.54) (0.47) (0.54) (0.39) (0.43) (0.39) (0.43) (0.50) (0.57) (0.50) (0.57) Tangibility -0.005 -0.174 0.023 -0.158 -0.195 -0.339 -0.145 -0.294 0.165 0.094 0.229 0.136 (0.35) (0.36) (0.35) (0.36) (0.28) (0.30) (0.29) (0.30) (0.37) (0.38) (0.37) (0.38) Ppenness -0.021*** -0.019*** -0.020*** -0.019*** -0.020*** -0.020*** -0.019*** -0.020*** -0.025*** -0.025*** -0.025*** -0.025***
(0.00) (0.00) (0.00) (0.00) (0.00) (0.00) (0.00) (0.00) (0.00) (0.00) (0.00) (0.00)
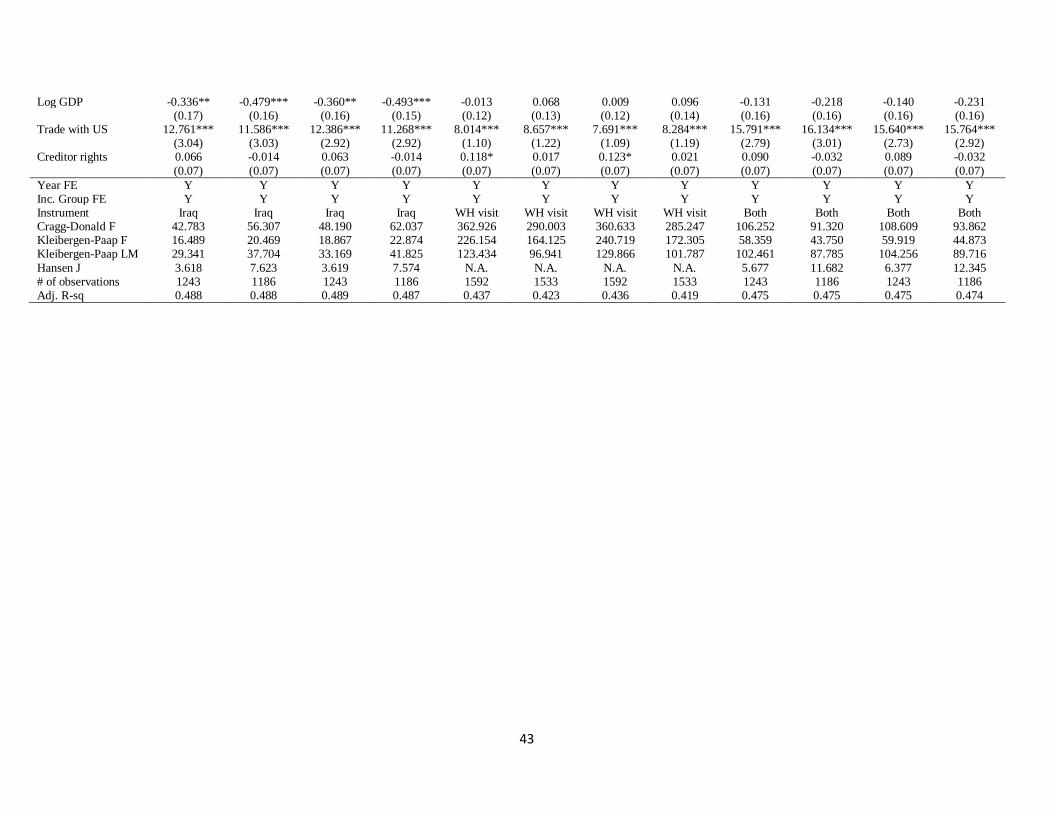
43
Log GDP -0.336** -0.479*** -0.360** -0.493*** -0.013 0.068 0.009 0.096 -0.131 -0.218 -0.140 -0.231 (0.17) (0.16) (0.16) (0.15) (0.12) (0.13) (0.12) (0.14) (0.16) (0.16) (0.16) (0.16) Trade with US 12.761*** 11.586*** 12.386*** 11.268*** 8.014*** 8.657*** 7.691*** 8.284*** 15.791*** 16.134*** 15.640*** 15.764*** (3.04) (3.03) (2.92) (2.92) (1.10) (1.22) (1.09) (1.19) (2.79) (3.01) (2.73) (2.92) Creditor rights 0.066 -0.014 0.063 -0.014 0.118* 0.017 0.123* 0.021 0.090 -0.032 0.089 -0.032
(0.07) (0.07) (0.07) (0.07) (0.07) (0.07) (0.07) (0.07) (0.07) (0.07) (0.07) (0.07)
Year FE Y Y Y Y Y Y Y Y Y Y Y Y Inc. Group FE Y Y Y Y Y Y Y Y Y Y Y Y Instrument Iraq Iraq Iraq Iraq WH visit WH visit WH visit WH visit Both Both Both Both Cragg-Donald F 42.783 56.307 48.190 62.037 362.926 290.003 360.633 285.247 106.252 91.320 108.609 93.862 Kleibergen-Paap F 16.489 20.469 18.867 22.874 226.154 164.125 240.719 172.305 58.359 43.750 59.919 44.873 Kleibergen-Paap LM 29.341 37.704 33.169 41.825 123.434 96.941 129.866 101.787 102.461 87.785 104.256 89.716
Hansen J 3.618 7.623 3.619 7.574 N.A. N.A. N.A. N.A. 5.677 11.682 6.377 12.345 # of observations 1243 1186 1243 1186 1592 1533 1592 1533 1243 1186 1243 1186 Adj. R-sq 0.488 0.488 0.489 0.487 0.437 0.423 0.436 0.419 0.475 0.475 0.475 0.474
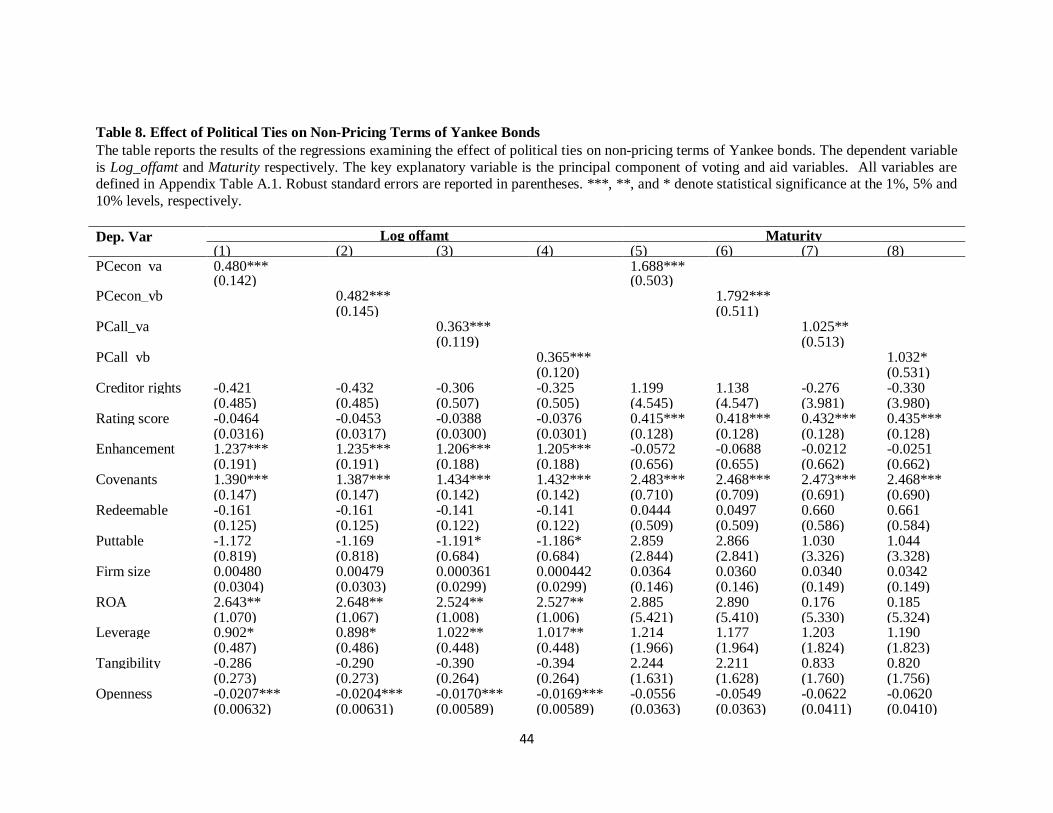
44
Table 8. Effect of Political Ties on Non-Pricing Terms of Yankee Bonds
The table reports the results of the regressions examining the effect of political ties on non-pricing terms of Yankee bonds. The dependent variable
is Log_offamt and Maturity respectively. The key explanatory variable is the principal component of voting and aid variables. All variables are defined in Appendix Table A.1. Robust standard errors are reported in parentheses. ***, **, and * denote statistical significance at the 1%, 5% and
10% levels, respectively.
Dep. Var Log offamt Maturity (1) (2) (3) (4) (5) (6) (7) (8)
PCecon_va 0.480*** 1.688*** (0.142) (0.503) PCecon_vb
0.482***
1.792***
(0.145)
(0.511)
PCall_va 0.363*** 1.025** (0.119) (0.513) PCall_vb 0.365*** 1.032* (0.120) (0.531) Creditor rights -0.421 -0.432 -0.306 -0.325 1.199 1.138 -0.276 -0.330 (0.485) (0.485) (0.507) (0.505) (4.545) (4.547) (3.981) (3.980) Rating score -0.0464 -0.0453 -0.0388 -0.0376 0.415*** 0.418*** 0.432*** 0.435*** (0.0316) (0.0317) (0.0300) (0.0301) (0.128) (0.128) (0.128) (0.128) Enhancement 1.237*** 1.235*** 1.206*** 1.205*** -0.0572 -0.0688 -0.0212 -0.0251
(0.191) (0.191) (0.188) (0.188) (0.656) (0.655) (0.662) (0.662)
Covenants 1.390*** 1.387*** 1.434*** 1.432*** 2.483*** 2.468*** 2.473*** 2.468***
(0.147) (0.147) (0.142) (0.142) (0.710) (0.709) (0.691) (0.690)
Redeemable -0.161 -0.161 -0.141 -0.141 0.0444 0.0497 0.660 0.661
(0.125) (0.125) (0.122) (0.122) (0.509) (0.509) (0.586) (0.584)
Puttable -1.172 -1.169 -1.191* -1.186* 2.859 2.866 1.030 1.044
(0.819) (0.818) (0.684) (0.684) (2.844) (2.841) (3.326) (3.328)
Firm size 0.00480 0.00479 0.000361 0.000442 0.0364 0.0360 0.0340 0.0342
(0.0304) (0.0303) (0.0299) (0.0299) (0.146) (0.146) (0.149) (0.149)
ROA 2.643** 2.648** 2.524** 2.527** 2.885 2.890 0.176 0.185
(1.070) (1.067) (1.008) (1.006) (5.421) (5.410) (5.330) (5.324)
Leverage 0.902* 0.898* 1.022** 1.017** 1.214 1.177 1.203 1.190
(0.487) (0.486) (0.448) (0.448) (1.966) (1.964) (1.824) (1.823)
Tangibility -0.286 -0.290 -0.390 -0.394 2.244 2.211 0.833 0.820
(0.273) (0.273) (0.264) (0.264) (1.631) (1.628) (1.760) (1.756)
Openness -0.0207*** -0.0204*** -0.0170*** -0.0169*** -0.0556 -0.0549 -0.0622 -0.0620
(0.00632) (0.00631) (0.00589) (0.00589) (0.0363) (0.0363) (0.0411) (0.0410)
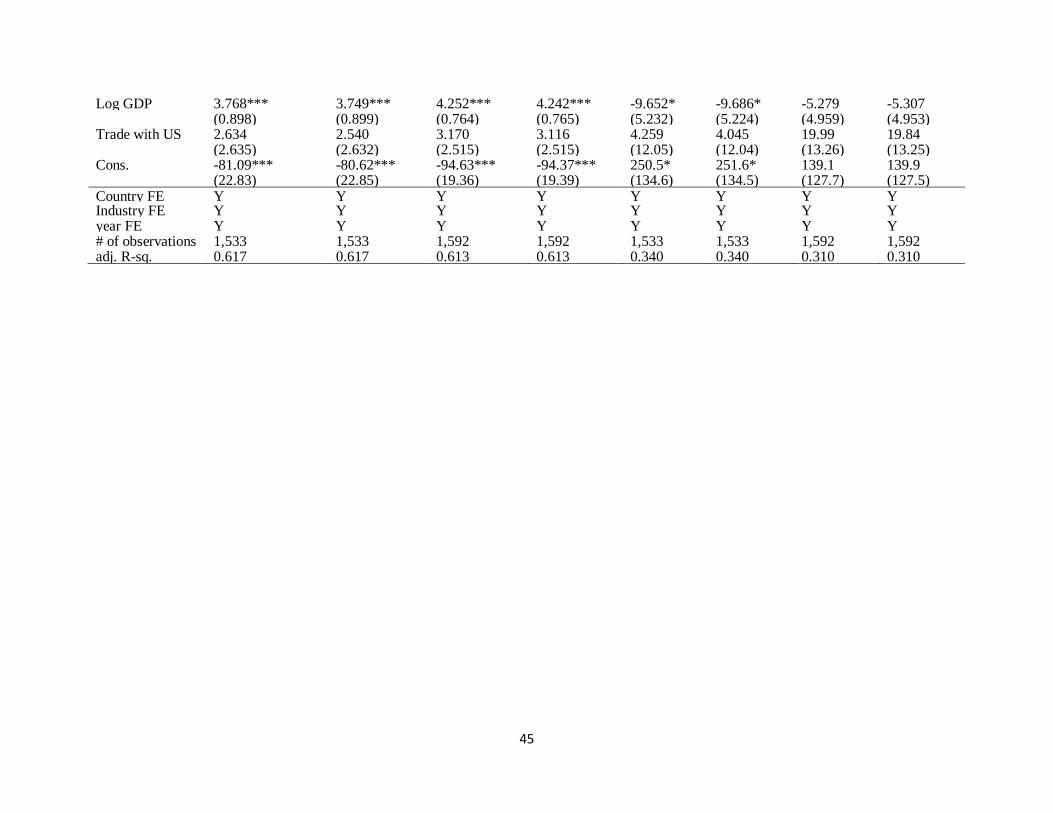
45
Log GDP 3.768*** 3.749*** 4.252*** 4.242*** -9.652* -9.686* -5.279 -5.307
(0.898) (0.899) (0.764) (0.765) (5.232) (5.224) (4.959) (4.953)
Trade with US 2.634 2.540 3.170 3.116 4.259 4.045 19.99 19.84
(2.635) (2.632) (2.515) (2.515) (12.05) (12.04) (13.26) (13.25)
Cons. -81.09*** -80.62*** -94.63*** -94.37*** 250.5* 251.6* 139.1 139.9
(22.83) (22.85) (19.36) (19.39) (134.6) (134.5) (127.7) (127.5)
Country FE Y Y Y Y Y Y Y Y Industry FE Y Y Y Y Y Y Y Y year FE Y Y Y Y Y Y Y Y # of observations 1,533 1,533 1,592 1,592 1,533 1,533 1,592 1,592 adj. R-sq. 0.617 0.617 0.613 0.613 0.340 0.340 0.310 0.310
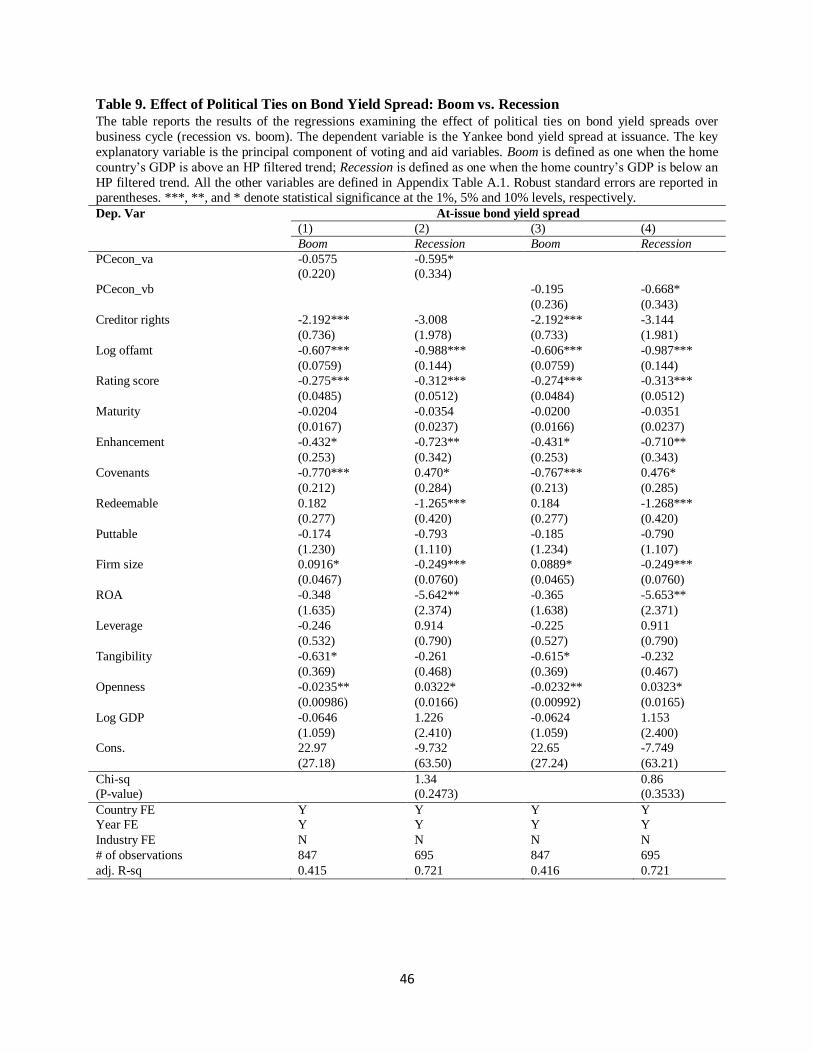
46
Table 9. Effect of Political Ties on Bond Yield Spread: Boom vs. Recession
The table reports the results of the regressions examining the effect of political ties on bond yield spreads over
business cycle (recession vs. boom). The dependent variable is the Yankee bond yield spread at issuance. The key
explanatory variable is the principal component of voting and aid variables. Boom is defined as one when the home
country’s GDP is above an HP filtered trend; Recession is defined as one when the home country’s GDP is below an
HP filtered trend. All the other variables are defined in Appendix Table A.1. Robust standard errors are reported in parentheses. ***, **, and * denote statistical significance at the 1%, 5% and 10% levels, respectively.
Dep. Var At-issue bond yield spread
(1) (2) (3) (4)
Boom Recession Boom Recession
PCecon_va -0.0575 -0.595*
(0.220) (0.334)
PCecon_vb
-0.195 -0.668*
(0.236) (0.343)
Creditor rights -2.192*** -3.008 -2.192*** -3.144
(0.736) (1.978) (0.733) (1.981)
Log offamt -0.607*** -0.988*** -0.606*** -0.987***
(0.0759) (0.144) (0.0759) (0.144)
Rating score -0.275*** -0.312*** -0.274*** -0.313***
(0.0485) (0.0512) (0.0484) (0.0512)
Maturity -0.0204 -0.0354 -0.0200 -0.0351
(0.0167) (0.0237) (0.0166) (0.0237)
Enhancement -0.432* -0.723** -0.431* -0.710**
(0.253) (0.342) (0.253) (0.343)
Covenants -0.770*** 0.470* -0.767*** 0.476*
(0.212) (0.284) (0.213) (0.285)
Redeemable 0.182 -1.265*** 0.184 -1.268***
(0.277) (0.420) (0.277) (0.420)
Puttable -0.174 -0.793 -0.185 -0.790
(1.230) (1.110) (1.234) (1.107)
Firm size 0.0916* -0.249*** 0.0889* -0.249***
(0.0467) (0.0760) (0.0465) (0.0760)
ROA -0.348 -5.642** -0.365 -5.653**
(1.635) (2.374) (1.638) (2.371)
Leverage -0.246 0.914 -0.225 0.911
(0.532) (0.790) (0.527) (0.790)
Tangibility -0.631* -0.261 -0.615* -0.232
(0.369) (0.468) (0.369) (0.467)
Openness -0.0235** 0.0322* -0.0232** 0.0323*
(0.00986) (0.0166) (0.00992) (0.0165)
Log GDP -0.0646 1.226 -0.0624 1.153
(1.059) (2.410) (1.059) (2.400)
Cons. 22.97 -9.732 22.65 -7.749
(27.18) (63.50) (27.24) (63.21)
Chi-sq 1.34 0.86
(P-value) (0.2473) (0.3533)
Country FE Y Y Y Y
Year FE Y Y Y Y
Industry FE
N N N N
# of observations 847 695 847 695
adj. R-sq 0.415 0.721 0.416 0.721

47
Table 10: Effect of Political Ties on Bond Yield Spread: the Impact of Government Debt
The table reports the results of the regressions examining the impact of government fiscal condition (total debt level)
on political ties and Yankee bond initial pricing. The dependent variable is the Yankee bond yield spread at issuance.
The key explanatory variable is the principal component of voting and aid variables. We split the bond sample using
the median value of Government debt/GDP of the country where the borrower is located. All the other variables are
defined in Appendix Table A.1. Robust standard errors are reported in parentheses. ***, **, and * denote statistical significance at the 1%, 5% and 10% levels, respectively.
Dep. Var At-issue bond yield spread
High debt Low debt High debt Low debt
(1) (2) (3) (4)
PCecon_va -2.220*** 0.174
(0.782) (0.186)
PCecon_vb -2.191*** 0.164
(0.764) (0.184)
Creditor rights -38.30*** -0.790 -38.72*** -0.785
(12.23) (0.577) (12.10) (0.576)
Log offamt -0.331*** -0.0200 -0.332*** -0.0199
(0.117) (0.0443) (0.117) (0.0444)
Rating score -0.258** -0.376*** -0.260** -0.375***
(0.109) (0.0283) (0.109) (0.0283)
Maturity -0.203*** 0.00125 -0.203*** 0.00130
(0.0440) (0.00886) (0.0440) (0.00886)
Enhancement -0.533 -0.112 -0.542 -0.113
(0.572) (0.182) (0.571) (0.182)
Covenants -1.443** -0.263* -1.436** -0.263*
(0.567) (0.150) (0.567) (0.150)
Redeemable 0.573 0.392** 0.575 0.392**
(0.446) (0.154) (0.446) (0.154)
Puttable - 0.0634 - 0.0638
- (0.418) - (0.419)
Firm size 0.296 -0.0220 0.292 -0.0219
(0.196) (0.0296) (0.194) (0.0296)
ROA 2.502 -2.148* 2.396 -2.157*
(5.058) (1.205) (5.064) (1.206)
Leverage -0.770 1.752*** -0.724 1.746***
(1.515) (0.435) (1.519) (0.434)
Tangibility 0.257 -0.696** 0.276 -0.694**
(1.148) (0.335) (1.147) (0.335)
Openness 0.132*** -0.00660 0.134*** -0.00662
(0.0452) (0.0113) (0.0445) (0.0113)
Trade with US -23.38** 7.772** -24.01** 7.794**
(10.87) (3.538) (10.64) (3.532)
Cons. 87.65*** 8.798*** 89.20*** 8.751***
(25.84) (2.638) (25.51) (2.627)
Chi-sq 9.67*** 9.79***
(P-value) (0.0019) (0.0018)
Country FE Y Y Y Y
Year FE Y Y Y Y
Industry FE
N N N N
# of observations 385 389 385 389
adj. R-sq 0.379 0.735 0.379 0.734

48
Table 11: Political Ties and Bond Spread: Top- vs. Non-top- rated Country
The table reports the results of the regressions examining the effect of political tie on Yankee bond pricing for high-
or low-rated countries. The dependent variable is the Yankee bond yield spread at issuance. The key explanatory
variable is the principal component of voting and aid variables. We split the sample into bonds issued by borrowers
in AAA-rated and non-AAA-rated countries. All the other variables are defined in Appendix Table A.1. Robust
standard errors are reported in parentheses. ***, **, and * denote statistical significance at the 1%, 5% and 10% levels, respectively.
Dep. Var At-issue bond yield spread
S&P ratings Fitch ratings
(1) (2) (3) (4) (5) (6)
Full sample AAA Non-AAA Full sample AAA Non-AAA
PCecon_va -0.543*** -1.198*** 0.342** -0.562*** -1.126*** -0.0380
(0.132) (0.306) (0.150) (0.137) (0.298) (0.181)
Rating spread -0.118*** -0.261*** -0.242*** -0.136*** -0.207*** -0.202***
(0.0274) (0.0630) (0.0282) (0.0267) (0.0690) (0.0314)
Covenants -0.713*** -0.315 -0.340** -0.749*** 0.247 -0.652***
(0.170) (0.302) (0.158) (0.172) (0.438) (0.190)
Creditor rights -0.0939 -0.0844 0.0712 -0.0832 -0.0871 -0.0691
(0.0688) (0.114) (0.101) (0.0688) (0.119) (0.0915)
Log affamt -0.825*** -0.697*** -0.345*** -0.816*** -0.885*** -0.562***
(0.0564) (0.0675) (0.115) (0.0566) (0.0737) (0.0874)
Maturity -0.0440*** -0.0983*** 0.00334 -0.0488*** -0.0318* -0.0351*
(0.0146) (0.0195) (0.0119) (0.0167) (0.0174) (0.0179)
Enhancement -1.278*** -1.126*** 0.128 -1.278*** -1.630*** -0.469*
(0.226) (0.294) (0.244) (0.226) (0.376) (0.252)
Redeemable 0.0636 0.104 -0.0998 0.0566 -0.618 0.480*
(0.205) (0.330) (0.175) (0.205) (0.416) (0.261)
Puttable -0.0899 0 0.238 -0.0347 0 0.0482
(0.927) (.) (0.550) (1.022) (.) (0.708)
Firm size -0.209*** 0.245** -0.128*** -0.204*** -0.281** -0.0667**
(0.0323) (0.113) (0.0297) (0.0322) (0.142) (0.0328)
ROA -1.744 0.699 -3.757*** -1.054 5.918 -3.516**
(1.391) (3.058) (1.291) (1.426) (3.629) (1.573)
Leverage 0.856 1.689* 1.701*** 0.811 2.197** 0.460
(0.551) (0.969) (0.538) (0.556) (0.966) (0.624)
Tangibility -1.047*** 0.176 -0.361 -1.072*** 1.478** -0.148
(0.362) (0.697) (0.331) (0.378) (0.706) (0.378)
Openness -0.0105*** -0.0108*** -0.0148*** -0.0111*** -0.0137*** -0.00769**
(0.00171) (0.00366) (0.00294) (0.00173) (0.00392) (0.00298)
Log GDP -0.316*** 0.946*** -0.139 -0.335*** 0.284 -0.0216
(0.0966) (0.359) (0.0976) (0.0977) (0.388) (0.111)
Trade with US 3.470*** 18.29*** 1.074 3.688*** 16.50*** 2.060**
(0.965) (3.585) (0.914) (0.979) (3.305) (1.001)
Cons. 23.82*** -19.65* 12.58*** 25.18*** 3.800 12.28***
(2.746) (10.41) (2.810) (2.730) (11.32) (3.234)
Chi-sq (PCecon_va) 21.87*** 10.42***
(P-value) (0.0000) (0.0012)
Chi-sq (Covenants) 0.04 3.75*
(P-value) (0.8480) (0.0529)
Country FE N N N N N N
Year FE Y Y Y Y Y Y
Industry FE
Y Y Y Y Y Y
# of observations 1,524 896 628 1,493 615 878
adj. R-sq 0.642 0.674 0.470 0.643 0.758 0.377
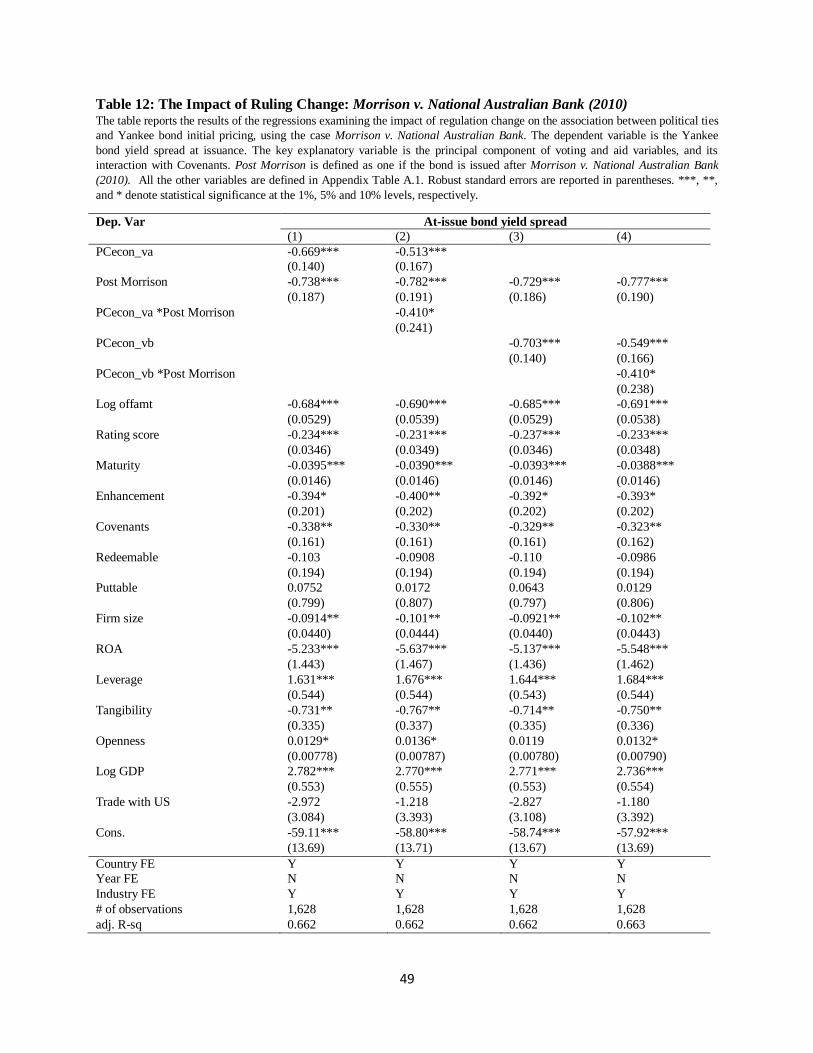
49
Table 12: The Impact of Ruling Change: Morrison v. National Australian Bank (2010) The table reports the results of the regressions examining the impact of regulation change on the association between political ties
and Yankee bond initial pricing, using the case Morrison v. National Australian Bank. The dependent variable is the Yankee
bond yield spread at issuance. The key explanatory variable is the principal component of voting and aid variables, and its
interaction with Covenants. Post Morrison is defined as one if the bond is issued after Morrison v. National Australian Bank
(2010). All the other variables are defined in Appendix Table A.1. Robust standard errors are reported in parentheses. ***, **,
and * denote statistical significance at the 1%, 5% and 10% levels, respectively.
Dep. Var At-issue bond yield spread
(1) (2) (3) (4)
PCecon_va -0.669*** -0.513***
(0.140) (0.167)
Post Morrison -0.738*** -0.782*** -0.729*** -0.777***
(0.187) (0.191) (0.186) (0.190)
PCecon_va *Post Morrison -0.410*
(0.241)
PCecon_vb -0.703*** -0.549***
(0.140) (0.166)
PCecon_vb *Post Morrison -0.410*
(0.238)
Log offamt -0.684*** -0.690*** -0.685*** -0.691***
(0.0529) (0.0539) (0.0529) (0.0538)
Rating score -0.234*** -0.231*** -0.237*** -0.233***
(0.0346) (0.0349) (0.0346) (0.0348)
Maturity -0.0395*** -0.0390*** -0.0393*** -0.0388***
(0.0146) (0.0146) (0.0146) (0.0146)
Enhancement -0.394* -0.400** -0.392* -0.393*
(0.201) (0.202) (0.202) (0.202)
Covenants -0.338** -0.330** -0.329** -0.323**
(0.161) (0.161) (0.161) (0.162)
Redeemable -0.103 -0.0908 -0.110 -0.0986
(0.194) (0.194) (0.194) (0.194)
Puttable 0.0752 0.0172 0.0643 0.0129
(0.799) (0.807) (0.797) (0.806)
Firm size -0.0914** -0.101** -0.0921** -0.102**
(0.0440) (0.0444) (0.0440) (0.0443)
ROA -5.233*** -5.637*** -5.137*** -5.548***
(1.443) (1.467) (1.436) (1.462)
Leverage 1.631*** 1.676*** 1.644*** 1.684***
(0.544) (0.544) (0.543) (0.544)
Tangibility -0.731** -0.767** -0.714** -0.750**
(0.335) (0.337) (0.335) (0.336)
Openness 0.0129* 0.0136* 0.0119 0.0132*
(0.00778) (0.00787) (0.00780) (0.00790)
Log GDP 2.782*** 2.770*** 2.771*** 2.736***
(0.553) (0.555) (0.553) (0.554)
Trade with US -2.972 -1.218 -2.827 -1.180
(3.084) (3.393) (3.108) (3.392)
Cons. -59.11*** -58.80*** -58.74*** -57.92***
(13.69) (13.71) (13.67) (13.69)
Country FE Y Y Y Y
Year FE N N N N
Industry FE
Y Y Y Y
# of observations 1,628 1,628 1,628 1,628
adj. R-sq 0.662 0.662 0.662 0.663

50
Table 13: Political Ties, Creditor Rights and Bond Contracting
The table reports the results of the regressions examining the association between political ties and creditor rights in
affecting Yankee bond initial pricing. The dependent variable is the Yankee bond yield spread at issuance. The key
explanatory variable is the principal component of voting and aid variables, and its interaction with Covenants. We
split the sample using the median value of creditor rights index. All the other variables are defined in Appendix
Table A.1. Robust standard errors are reported in parentheses. ***, **, and * denote statistical significance at the 1%, 5% and 10% levels, respectively.
Dep. Var At-issue bond yield spread
(1) (2) (3) (4) (5) (6)
Full sample High CR Low CR Full sample High CR Low CR
PCecon_va -0.979*** -0.674** -0.701***
(0.152) (0.334) (0.224)
Covenants -0.321* -0.865*** -0.0349 -0.311* -0.849*** -0.00904
(0.164) (0.295) (0.212) (0.165) (0.293) (0.214)
PCecon_va*Covenants 0.744*** -0.448* 1.016***
(0.191) (0.269) (0.270)
PCecon_vb -1.046*** -0.697** -0.811***
(0.153) (0.342) (0.227)
PCecon_vb *Covenants 0.724*** -0.442* 1.010***
(0.194) (0.266) (0.274)
Log offamt -0.643*** -0.407*** -0.856*** -0.644*** -0.408*** -0.858***
(0.0521) (0.0855) (0.113) (0.0522) (0.0854) (0.113)
Rating score -0.263*** -0.287*** -0.308*** -0.265*** -0.288*** -0.307***
(0.0322) (0.0594) (0.0456) (0.0321) (0.0595) (0.0455)
Maturity -0.0289** -0.0934*** -0.00207 -0.0285** -0.0937*** -0.00178
(0.0137) (0.0190) (0.0156) (0.0137) (0.0190) (0.0155)
Enhancement -0.491** -0.725** -0.0643 -0.485** -0.728** -0.0684
(0.194) (0.290) (0.288) (0.195) (0.291) (0.288)
Redeemable -0.0164 0.699* -0.809*** -0.0220 0.699* -0.807***
(0.198) (0.372) (0.243) (0.198) (0.372) (0.242)
Puttable 0.187 -1.654*** -0.225 0.202 -1.651*** -0.219
(0.714) (0.517) (0.916) (0.717) (0.513) (0.921)
Firm size -0.0841** 0.105 -0.0977** -0.0848** 0.103 -0.0998**
(0.0388) (0.103) (0.0461) (0.0390) (0.103) (0.0460)
ROA -4.370*** 2.418 -4.793** -4.369*** 2.435 -4.739**
(1.369) (2.787) (1.911) (1.364) (2.789) (1.901)
Leverage 1.168** 0.0329 1.883** 1.183** 0.0579 1.904**
(0.512) (0.919) (0.758) (0.511) (0.921) (0.757)
Tangibility -0.586* -0.469 -0.921** -0.567* -0.453 -0.888**
(0.315) (0.622) (0.418) (0.314) (0.623) (0.415)
Openness 0.00797 0.0254 -0.0310** 0.00793 0.0235 -0.0324**
(0.00803) (0.0166) (0.0140) (0.00799) (0.0166) (0.0141)
Log GDP -1.360 0.0180 -0.292 -1.332 -0.0728 -0.452
(0.991) (1.969) (1.327) (0.995) (1.959) (1.324)
Trade with US -0.888 -5.148 1.514 -0.851 -4.879 1.949
(3.437) (4.785) (6.378) (3.401) (4.740) (6.298)
Cons. 47.76* 7.822 29.78 46.85* 10.24 33.86
(25.13) (52.55) (34.19) (25.24) (52.27) (34.09)
Chi-sq 16.84*** 16.58***
(P-value) (0.0000) (0.0000)
Country FE Y Y Y Y Y Y
Year FE Y Y Y Y Y Y
Industry FE
Y Y Y Y Y Y
# of observations 1,628 633 900 1,628 633 900
adj. R-sq 0.682 0.469 0.766 0.683 0.469 0.766
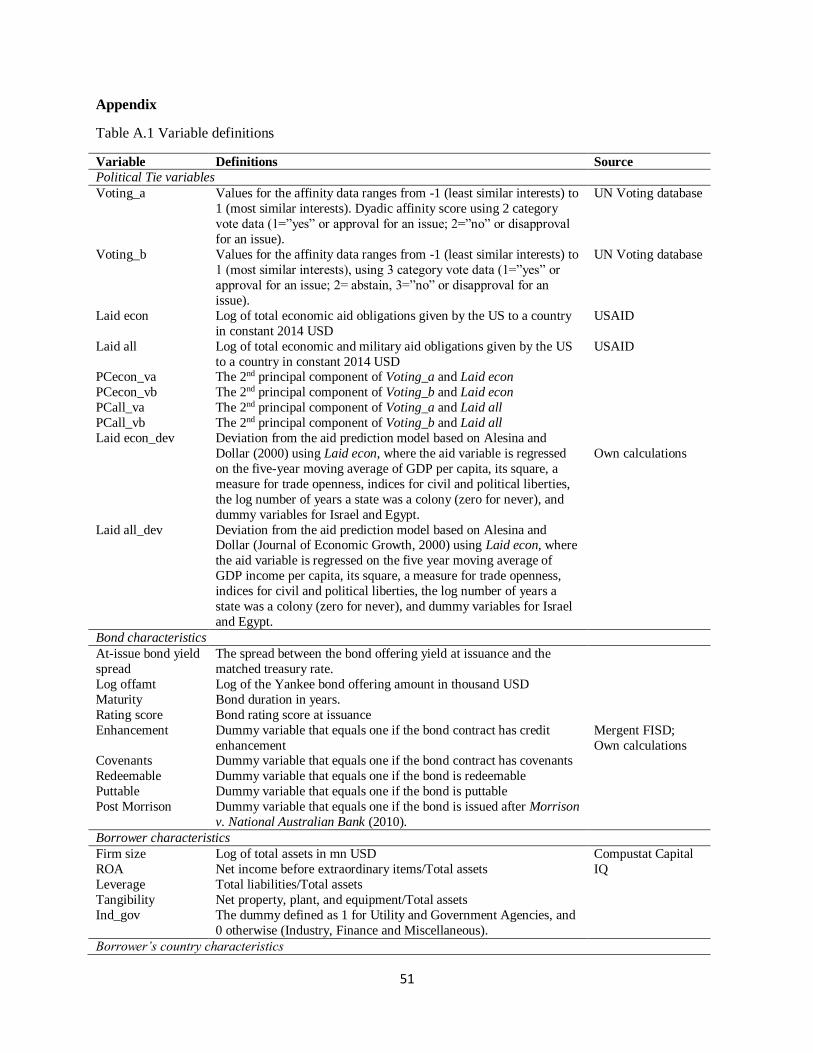
51
Appendix
Table A.1 Variable definitions
Variable Definitions Source
Political Tie variables
Voting_a Values for the affinity data ranges from -1 (least similar interests) to
1 (most similar interests). Dyadic affinity score using 2 category
vote data (1=”yes” or approval for an issue; 2=”no” or disapproval
for an issue).
UN Voting database
Voting_b Values for the affinity data ranges from -1 (least similar interests) to
1 (most similar interests), using 3 category vote data (1=”yes” or
approval for an issue; 2= abstain, 3=”no” or disapproval for an
issue).
UN Voting database
Laid econ Log of total economic aid obligations given by the US to a country
in constant 2014 USD
USAID
Laid all Log of total economic and military aid obligations given by the US
to a country in constant 2014 USD
USAID
PCecon_va The 2nd principal component of Voting_a and Laid econ
Own calculations
PCecon_vb The 2nd principal component of Voting_b and Laid econ
PCall_va The 2nd principal component of Voting_a and Laid all
PCall_vb The 2nd principal component of Voting_b and Laid all
Laid econ_dev Deviation from the aid prediction model based on Alesina and
Dollar (2000) using Laid econ, where the aid variable is regressed
on the five-year moving average of GDP per capita, its square, a
measure for trade openness, indices for civil and political liberties,
the log number of years a state was a colony (zero for never), and
dummy variables for Israel and Egypt.
Laid all_dev Deviation from the aid prediction model based on Alesina and Dollar (Journal of Economic Growth, 2000) using Laid econ, where
the aid variable is regressed on the five year moving average of
GDP income per capita, its square, a measure for trade openness,
indices for civil and political liberties, the log number of years a
state was a colony (zero for never), and dummy variables for Israel
and Egypt.
Bond characteristics
At-issue bond yield
spread
The spread between the bond offering yield at issuance and the
matched treasury rate.
Mergent FISD;
Own calculations
Log offamt Log of the Yankee bond offering amount in thousand USD
Maturity Bond duration in years.
Rating score Bond rating score at issuance
Enhancement Dummy variable that equals one if the bond contract has credit
enhancement Covenants Dummy variable that equals one if the bond contract has covenants
Redeemable Dummy variable that equals one if the bond is redeemable
Puttable Dummy variable that equals one if the bond is puttable
Post Morrison Dummy variable that equals one if the bond is issued after Morrison
v. National Australian Bank (2010).
Borrower characteristics
Firm size Log of total assets in mn USD Compustat Capital
IQ ROA Net income before extraordinary items/Total assets
Leverage Total liabilities/Total assets
Tangibility Net property, plant, and equipment/Total assets
Ind_gov The dummy defined as 1 for Utility and Government Agencies, and
0 otherwise (Industry, Finance and Miscellaneous).
Borrower’s country characteristics
52
Creditor rights The creditor rights index that measures (1) whether there are
restrictions, such as credit consent, when a debtor files for
reorganization; (2) whether secured creditors are able to seize their
collateral once reorganization is approved; (3) whether secured
creditors are paid first; (4) whether an administrator, not
management, is responsible for running the business during
reorganization. The value ranges from 0(weakest creditor protection) to 4 (strongest creditor protection).
Djankov et al.
(2007)
Political constraints The first political constraints index (political constraints_a)
measures the feasibility of political change, that is, the extent to
which a change in the preferences of any one actor may lead to a
change in government policy (Henisz, 2002). The second political
constraints index (political constraints_b) is a structurally-derived
internationally comparable measure of political constraints (Henisz,
2000).
POLCON Dataset
(2017)
Civil Civil liberties index, based on 1 to 7 scale, constructed according to
15 questions on free and independent press, religious and academic
freedom, freedom of expression and assembly, the well-functioning
of NGOs and unions, as well as the rule of law and personal rights.
Freedom House
(2017)
Democracy Political rights in the electoral process subcategory, based on 1 to 7
scale, constructed based on ten indicators measuring fair elections,
political pluralism and participation, safeguards against corruption
and the transparency and well-functioning of government.
Freedom House
(2017)
Openness Total trade volume/GDP
WDI
Log GDP Log of GDP in current mn USD
Trade with US Trade volume with the US/GDP
Government debt Level of government debt/GDP
Recession The dummy is defined as one when the GDP is below an HP
filtered trend, and zero otherwise
Country rating Numerical index of Sovereign Long Term (Foreign Currency) Credit Rating with AAA equal 22 and lower than C (in default) as
1.
S&P, and Fitch Ratings
Rating spread The spread between bond rating score at issuance and country
rating score.

53
Table A.2 Number of Yankee bonds by country and Mean Value of Political tie Variables
Country
# of Obs.
Mean of
Voting_a
Mean of
Voting_b
Mean of
Laid econ
Mean of
Laid all
Argentina 50 -0.23 -0.15 14.70 16.01
Australia 176 0.29 0.23 11.15 12.35
Austria 13 -0.11 -0.05 13.34 13.42
Bahamas 7 -0.45 -0.36 14.31 15.06
Belgium 3 -0.10 -0.04 16.88 16.88
Brazil 98 -0.51 -0.39 17.05 17.15
Canada 20 0.48 0.42 17.00 16.68
Chile 49 -0.40 -0.33 15.03 15.50
China 62 -0.63 -0.48 18.04 18.07 Colombia 18 -0.55 -0.41 19.66 20.02
Cyprus 1 0.31 0.31 12.55 12.55
Czech Republic 2 0.25 0.23 15.18 16.55
Dominican Republic 1 0.05 0.04 16.85 16.94
Fiji 1 -0.39 -0.17 14.47 14.47
France 156 0.20 0.19 13.56 13.18
Greece 6 -0.04 0.01 12.92 14.67
India 6 -0.71 -0.52 18.76 18.80
Indonesia 4 -0.62 -0.47 19.41 19.44
Ireland 14 -0.01 0.04 14.64 14.64
Israel 1 0.94 0.77 18.88 22.11 Japan 26 0.00 0.04 14.26 14.26
Kazakhstan 2 -0.61 -0.44 18.33 18.76
Malaysia 7 -0.43 -0.32 11.79 13.86
Marshall Islands 1 0.72 0.66 18.02 18.02
Mexico 152 -0.47 -0.37 18.70 19.09
Mongolia 1 -0.42 -0.34 16.89 17.07
Morocco 1 -0.52 -0.43 17.81 18.06
Netherlands 32 0.21 0.19 12.08 12.10
Nigeria 2 -0.43 -0.34 20.14 20.16
Norway 272 -0.26 -0.17 7.45 7.46
Panama 9 -0.41 -0.31 16.44 16.70 Peru 19 -0.47 -0.36 18.78 18.85
Philippines 12 -0.44 -0.32 18.32 18.43
Russia 8 -0.69 -0.47 20.78 21.04
Singapore 25 -0.57 -0.44 13.06 13.06
South Africa 3 -0.64 -0.48 19.95 19.96
South Korea 83 -0.12 -0.02 13.68 13.37
Spain 6 0.11 0.12 15.55 15.58
Sri Lanka 1 -0.67 -0.58 17.50 17.59
Sweden 30 0.04 0.07 11.31 10.87
Switzerland 9 -0.29 -0.19 10.11 10.11
Thailand 20 -0.47 -0.37 17.42 17.54
Turkey 28 -0.11 -0.04 17.42 17.64 Ukraine 3 -0.12 -0.06 19.22 19.35
United Arab Emirates 19 -0.72 -0.57 14.63 14.63
United Kingdom 834 0.32 0.29 12.87 13.00

54
Table A.3: Robustness checks: controlling for additional domestic institutional factors
The table reports the results of the regressions examining the effect of political ties on initial Yankee bond pricing when controlling for more domestic
institutional factors. The dependent variable is the Yankee bond yield spread at issuance. The key explanatory variable is the principal component of voting
affinity score and US aid. All variables are defined in Appendix Table A.1. Robust standard errors are reported in parentheses. ***, **, and * denote statistical
significance at the 1%, 5% and 10% levels, respectively.
Dep. Var At-issue bond yield spread
(1) (2) (3) (4) (5) (6) (7) (8)
PCecon_va -0.759*** -0.731*** -0.633*** -0.667***
(0.165) (0.167) (0.162) (0.161)
PCecon_vb
-0.861*** -0.836*** -0.719*** -0.750***
(0.169) (0.171) (0.167) (0.165)
Political constraints_a 0.772 0.795
(0.565) (0.564)
Political constraints_b -0.302 -0.219
(0.610) (0.608)
Civil -0.387* -0.359*
(0.202) (0.201)
Democracy -0.512*** -0.504***
(0.179) (0.178)
Creditor rights -1.915*** -1.730*** -1.729*** -1.800*** -1.899*** -1.741*** -1.677*** -1.763***
(0.582) (0.613) (0.475) (0.471) (0.580) (0.611) (0.474) (0.466)
Log offamt -0.723*** -0.726*** -0.724*** -0.720*** -0.721*** -0.725*** -0.723*** -0.719***
(0.0635) (0.0634) (0.0619) (0.0620) (0.0635) (0.0633) (0.0619) (0.0620)
Rating score -0.262*** -0.257*** -0.249*** -0.245*** -0.263*** -0.258*** -0.250*** -0.246***
(0.0348) (0.0347) (0.0330) (0.0332) (0.0348) (0.0347) (0.0329) (0.0332)
Maturity -0.0280** -0.0275* -0.0262* -0.0267** -0.0276* -0.0271* -0.0258* -0.0263*
(0.0142) (0.0140) (0.0136) (0.0135) (0.0141) (0.0140) (0.0135) (0.0135)
Enhancement -0.520** -0.548*** -0.559*** -0.587*** -0.513** -0.539*** -0.554*** -0.581***
(0.202) (0.200) (0.199) (0.199) (0.202) (0.201) (0.199) (0.199)
Covenants -0.392** -0.373** -0.390** -0.376** -0.389** -0.369** -0.384** -0.371**
(0.177) (0.177) (0.163) (0.163) (0.177) (0.177) (0.164) (0.163)
Redeemable -0.0628 -0.0627 -0.0847 -0.0862 -0.0660 -0.0665 -0.0887 -0.0902
(0.212) (0.212) (0.206) (0.206) (0.212) (0.212) (0.206) (0.206)
Puttable -0.0138 -0.0159 0.0873 -0.00396 -0.0122 -0.0114 0.0853 -0.00399
(0.769) (0.772) (0.755) (0.757) (0.771) (0.773) (0.757) (0.759)
Firm size -0.104** -0.103** -0.110*** -0.111*** -0.104** -0.103** -0.110*** -0.111***
(0.0445) (0.0450) (0.0411) (0.0408) (0.0444) (0.0448) (0.0411) (0.0408)
ROA -3.723** -3.548** -4.214*** -4.530*** -3.732** -3.566** -4.206*** -4.522***
(1.520) (1.525) (1.387) (1.413) (1.516) (1.521) (1.383) (1.409)

55
Leverage 1.149** 1.314** 1.306** 1.326** 1.186** 1.340** 1.326** 1.347**
(0.558) (0.547) (0.522) (0.524) (0.557) (0.546) (0.522) (0.524)
Tangibility -0.539 -0.575 -0.663** -0.689** -0.514 -0.550 -0.645** -0.669**
(0.358) (0.358) (0.325) (0.322) (0.357) (0.357) (0.325) (0.322)
Openness -0.00372 -0.00523 0.00640 0.00578 -0.00414 -0.00549 0.00603 0.00562
(0.0108) (0.0109) (0.00820) (0.00803) (0.0108) (0.0110) (0.00822) (0.00806)
Log GDP -0.334 -0.503 -0.559 -0.959 -0.334 -0.505 -0.567 -0.954
(1.062) (1.051) (0.987) (0.999) (1.066) (1.055) (0.990) (1.002)
Trade with US 1.081 0.557 -0.611 0.0326 1.213 0.739 -0.617 0.0485
(3.213) (3.235) (3.058) (3.047) (3.205) (3.234) (3.059) (3.049)
Cons. 26.59 31.05 34.26 45.87* 26.54 31.06 34.05 45.47*
(27.60) (27.28) (24.82) (25.15) (27.72) (27.41) (24.90) (25.24)
Country FE Y Y Y Y Y Y Y Y
Industry FE Y Y Y Y Y Y Y Y
year FE Y Y Y Y Y Y Y Y
# of observations 1,451 1,451 1,533 1,533 1,451 1,451 1,533 1,533
adj. R-sq. 0.673 0.673 0.678 0.678 0.674 0.674 0.678 0.679
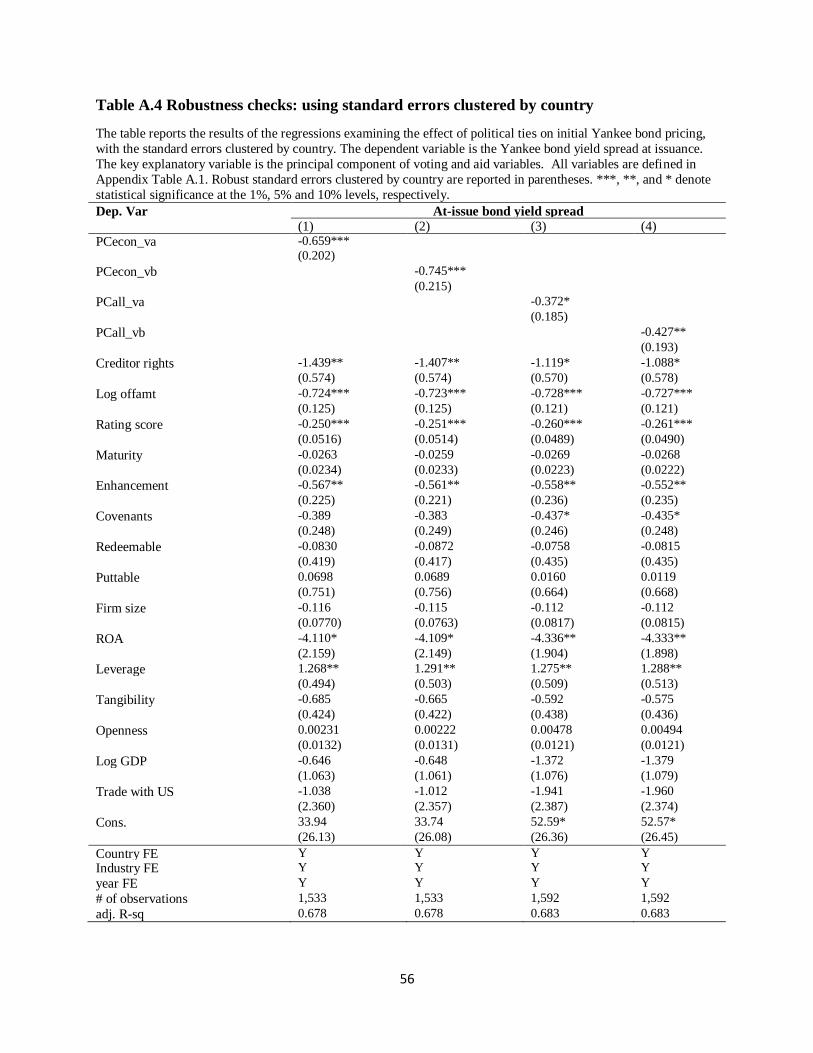
56
Table A.4 Robustness checks: using standard errors clustered by country
The table reports the results of the regressions examining the effect of political ties on initial Yankee bond pricing,
with the standard errors clustered by country. The dependent variable is the Yankee bond yield spread at issuance.
The key explanatory variable is the principal component of voting and aid variables. All variables are defined in
Appendix Table A.1. Robust standard errors clustered by country are reported in parentheses. ***, **, and * denote
statistical significance at the 1%, 5% and 10% levels, respectively.
Dep. Var At-issue bond yield spread (1) (2) (3) (4)
PCecon_va -0.659***
(0.202)
PCecon_vb
-0.745***
(0.215)
PCall_va -0.372*
(0.185)
PCall_vb -0.427**
(0.193)
Creditor rights -1.439** -1.407** -1.119* -1.088*
(0.574) (0.574) (0.570) (0.578)
Log offamt -0.724*** -0.723*** -0.728*** -0.727***
(0.125) (0.125) (0.121) (0.121)
Rating score -0.250*** -0.251*** -0.260*** -0.261***
(0.0516) (0.0514) (0.0489) (0.0490)
Maturity -0.0263 -0.0259 -0.0269 -0.0268
(0.0234) (0.0233) (0.0223) (0.0222)
Enhancement -0.567** -0.561** -0.558** -0.552**
(0.225) (0.221) (0.236) (0.235)
Covenants -0.389 -0.383 -0.437* -0.435*
(0.248) (0.249) (0.246) (0.248)
Redeemable -0.0830 -0.0872 -0.0758 -0.0815
(0.419) (0.417) (0.435) (0.435)
Puttable 0.0698 0.0689 0.0160 0.0119
(0.751) (0.756) (0.664) (0.668)
Firm size -0.116 -0.115 -0.112 -0.112
(0.0770) (0.0763) (0.0817) (0.0815)
ROA -4.110* -4.109* -4.336** -4.333**
(2.159) (2.149) (1.904) (1.898)
Leverage 1.268** 1.291** 1.275** 1.288**
(0.494) (0.503) (0.509) (0.513)
Tangibility -0.685 -0.665 -0.592 -0.575
(0.424) (0.422) (0.438) (0.436)
Openness 0.00231 0.00222 0.00478 0.00494
(0.0132) (0.0131) (0.0121) (0.0121)
Log GDP -0.646 -0.648 -1.372 -1.379
(1.063) (1.061) (1.076) (1.079)
Trade with US -1.038 -1.012 -1.941 -1.960
(2.360) (2.357) (2.387) (2.374)
Cons. 33.94 33.74 52.59* 52.57*
(26.13) (26.08) (26.36) (26.45)
Country FE Y Y Y Y
Industry FE Y Y Y Y
year FE Y Y Y Y
# of observations 1,533 1,533 1,592 1,592
adj. R-sq 0.678 0.678 0.683 0.683
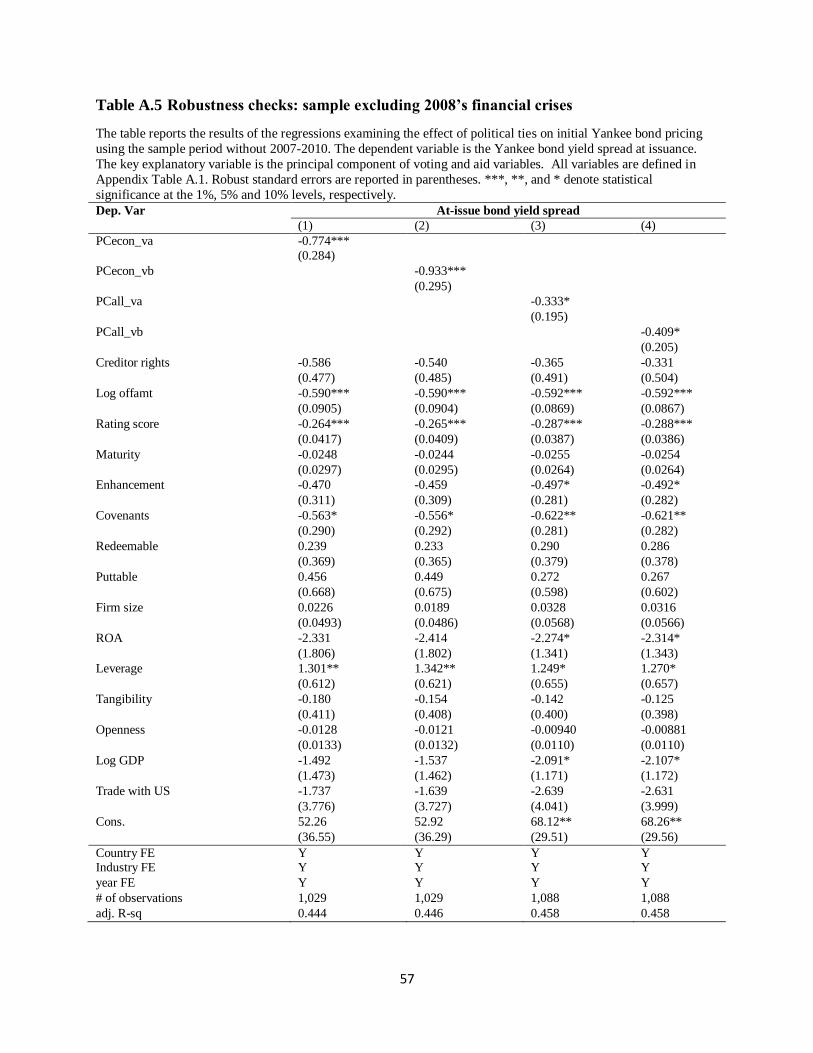
57
Table A.5 Robustness checks: sample excluding 2008’s financial crises
The table reports the results of the regressions examining the effect of political ties on initial Yankee bond pricing
using the sample period without 2007-2010. The dependent variable is the Yankee bond yield spread at issuance.
The key explanatory variable is the principal component of voting and aid variables. All variables are defined in
Appendix Table A.1. Robust standard errors are reported in parentheses. ***, **, and * denote statistical
significance at the 1%, 5% and 10% levels, respectively.
Dep. Var At-issue bond yield spread
(1) (2) (3) (4)
PCecon_va -0.774***
(0.284)
PCecon_vb
-0.933***
(0.295)
PCall_va -0.333*
(0.195)
PCall_vb -0.409*
(0.205)
Creditor rights -0.586 -0.540 -0.365 -0.331
(0.477) (0.485) (0.491) (0.504)
Log offamt -0.590*** -0.590*** -0.592*** -0.592***
(0.0905) (0.0904) (0.0869) (0.0867)
Rating score -0.264*** -0.265*** -0.287*** -0.288***
(0.0417) (0.0409) (0.0387) (0.0386)
Maturity -0.0248 -0.0244 -0.0255 -0.0254
(0.0297) (0.0295) (0.0264) (0.0264)
Enhancement -0.470 -0.459 -0.497* -0.492*
(0.311) (0.309) (0.281) (0.282)
Covenants -0.563* -0.556* -0.622** -0.621**
(0.290) (0.292) (0.281) (0.282)
Redeemable 0.239 0.233 0.290 0.286
(0.369) (0.365) (0.379) (0.378)
Puttable 0.456 0.449 0.272 0.267
(0.668) (0.675) (0.598) (0.602)
Firm size 0.0226 0.0189 0.0328 0.0316
(0.0493) (0.0486) (0.0568) (0.0566)
ROA -2.331 -2.414 -2.274* -2.314*
(1.806) (1.802) (1.341) (1.343)
Leverage 1.301** 1.342** 1.249* 1.270*
(0.612) (0.621) (0.655) (0.657)
Tangibility -0.180 -0.154 -0.142 -0.125
(0.411) (0.408) (0.400) (0.398)
Openness -0.0128 -0.0121 -0.00940 -0.00881
(0.0133) (0.0132) (0.0110) (0.0110)
Log GDP -1.492 -1.537 -2.091* -2.107*
(1.473) (1.462) (1.171) (1.172)
Trade with US -1.737 -1.639 -2.639 -2.631
(3.776) (3.727) (4.041) (3.999)
Cons. 52.26 52.92 68.12** 68.26**
(36.55) (36.29) (29.51) (29.56)
Country FE Y Y Y Y Industry FE Y Y Y Y
year FE Y Y Y Y
# of observations 1,029 1,029 1,088 1,088
adj. R-sq 0.444 0.446 0.458 0.458