political relations and overseas stock exchange listing...
TRANSCRIPT

Political Relations and Overseas Stock Exchange Listing: Evidence from Chinese State-owned Enterprises
Mingyi Hung Leventhal School of Accounting
Marshall School of Business University of Southern California
Los Angeles, CA 90089-0441
T.J. Wong School of Accountancy
The Chinese University of Hong Kong Shatin, NT, Hong Kong
Tianyu Zhang Department of Accountancy
City University of Hong Kong Kowloon Tong, Hong Kong
September 2007 First Draft
We acknowledge the financial support of the HKSAR Research Grant Council and USC-China Institute, as well as the Hong Kong Exchanges and Clearing Ltd. for providing data for the Hong Kong listed firms.

Political Relations and Overseas Stock Exchange Listing: Evidence from Chinese State-
owned Enterprises
Abstract Using a sample of Chinese listed firms that emerge in the global equity markets, this paper examines the decision to cross-listing and its consequences for the state-owned enterprises (SOEs). Contrary to prior research that examines mainly non-SOEs, we find that firms with stronger political relations are more likely to cross-list on overseas stock exchanges, but not those with greater need to fund growth and expand foreign sales. In addition, while we fail to find stronger law enforcement by the overseas regulators, we observe bonding through the adoption of international accounting and governance standards, and importantly, through improvement in analysts following. Finally, we find that cross-listed SOEs have lower earnings management, more professional board of directors, higher investment efficiency, and greater firm valuation than their domestically listed counterparts. Overall, our results suggest the cross-listing of Chinese SOEs is mainly politically motivated, but there is evidence of bonding effects on the SOEs due to increased scrutiny of reputational financial intermediaries.

1
Political Relations and Overseas Stock Exchange Listing: Evidence from Chinese State-owned Enterprises
1. Introduction
A growing literature has documented many factors affecting firms’ decisions to cross-list on
overseas stock exchanges. For example, firms with high growth prospects or foreign sales are
likely to cross-list on overseas stock exchanges for an increased ability to raise capital, improve
global visibility, and enhance firm valuation (Pagano et al., 2002; Doidge et al., 2004). While
these benefits may motivate firms to cross-list, research also shows that there are significant
costs deterring firms from seeking overseas listing. For example, firms with stronger political
connection or higher private benefits of control are unlikely to cross-list on overseas stock
exchanges because of greater disclosure requirements, stronger public scrutiny, and better law
enforcement associated with such listings (Doidge et al., 2006; Leuz and Oberholzer-Gee, 2006).
These prior studies, however, mainly focus on non-state firms and often exclude transitional
economies. Thus, they provide little insights on the cross-listing decisions for state firms in
transitional economies.
The purpose of this study is to investigate the influence of political factors on cross-listing
decisions for Chinese state-owned enterprises (SOEs) and the consequences of cross-listing.
China provides a unique setting to explore the relation between state ownership and political
factors in firms’ cross-listing decisions for the following reasons: (1) the prevalence of state
ownership and politically-connected Chief Executive Officers (CEOs) (Fan et al., 2007), (2) the
heavy government control over the cross-listing process, and (3) the significant capital raising
activities of her firms in global financial markets, which trigger a fierce competition among
global stock exchanges to seek new listings from Chinese companies (Kissel and Santini, 2004).

2
For example, China has been dominating the worldwide initial public offerings (IPO) in recent
years, notably for the world’s biggest IPO of Industrial & Commercial Bank of China Ltd.
(ICBC)’s $19 billion share issuance.
We conduct our investigation using a sample of all Chinese SOEs listed on worldwide stock
exchanges during the period of 1991 to 2005. Our empirical investigation comprises three basic
sets of analyses. Our first set of analysis examines the influence of political factors on Chinese
SOEs’ decisions to cross-list on overseas stock exchanges. We conjecture that Chinese
politicians have motivation to use cross-listing for pursuing national or private agendas (e.g.,
showcasing China’s economic power or fulfilling politicians’ self-interests). Consequently, we
hypothesize that these agendas will induce the politicians to choose protected firms or politically
connected firms to cross-list on overseas stock exchanges. We define protected firms as firms
controlled by the central government or belonging to the regulated industries (finance, natural
resources, or public utilities). These protected SOEs are typically state monopolies that are
directly under the supervision of the central ministries or the State Council. We define
politically connected firms as firms with CEO or Chairman being current or ex-government
bureaucrats.
To achieve the national agenda in promoting Chinese SOEs’ global reach, we argue that
politicians prefer firms with political ties or government protection because government support
such as granting and protection of monopoly rights, direct subsidies and bailout in times of
financial distress increases the likelihood of success for the international listing. Firms with
greater government protection or political ties can also be chosen by politicians for self-interest
purposes, because such listing will enable the politicians of these firms to circumvent
government regulations such as pay limits or enhance their political capital by expanding

3
overseas operations. Consistent with both of these arguments, the analysis finds that the decision
of Chinese SOEs to cross-list on overseas exchanges is politically motivated. The firms with
stronger political relations, either from government protection or top executives’ political
connections, are more likely to list on overseas stock exchanges. Economic considerations such
as the need to raise capital or strengthen the company’s overseas product market do not explain
the cross-listing decisions.
Our second set of analysis investigates the primary mechanisms in overseas markets that help
“bond” cross-listed Chinese SOEs not to take excessive private benefits (i.e., the bonding
mechanisms, as in Coffee, 2002 and Karolyi, 2006). Specifically, we analyze the existence of
the following three bonding mechanisms suggested in prior studies: (1) increased legal
requirements of financial disclosure and corporate governance (e.g., the use of internationally-
accepted accounting standards and independent board members), (2) strong enforcement powers
of overseas regulators against corporate wrong doings (e.g., corruption), and (3) improved
scrutiny by reputational intermediaries (e.g., analysts and media). Our analysis finds that
compared to their domestically listed counterparts, cross-listed Chinese SOEs use more
internationally-accepted accounting standards, have more independent board of directors, attract
higher number of analysts following the firm, but are not subject to an increase in law
enforcement against corruption. Our result is consistent with legal requirement and reputational
intermediaries in overseas markets, but not law enforcement by overseas regulators, being used
as bonding mechanisms for cross-listed Chinese SOEs.
Our third set of analysis examines if the bonding mechanisms previously identified result in
significant changes on Chinese SOEs’ corporate policies and valuation premium. On the one
hand, given that cross-listing of Chinese SOEs is mainly politically motivated, it is doubtful that

4
these firms would manifest substantial bonding effects. For example, managers of cross-listed
Chinese SOEs may care more about politicians’ private agenda than responding to minority
shareholders’ demand. They will be more interested in their political careers than companies’
business development. On the other hand, politicians who have incentives to showcase Chinese
SOEs in the global markets may be motivated to ensure that their firms follow higher
international governance and performance standards. Our analysis finds evidence suggesting
significant bonding effects for cross-listed Chinese SOEs. Specifically, we find that compared to
their domestically listed counterparts, cross-listed Chinese SOEs engage in less earnings
management (as captured by a decreased tendency to report small profits or an increased
tendency to report small losses), have more professional board of directors (as captured by a
higher percentage of board members serving industry associations, with banking experience, or
with law/accounting experience), enjoy higher investment efficiency (as captured by increased
sensitivity of capital expenditure to lagged Tobin’s q), and command greater valuation premium
(as captured by higher Tobin’s q using domestic share prices).
Our findings suggest that the bonding mechanisms of legal requirement and reputational
intermediaries induce the changes in corporate policies and firm valuation for cross-listed
Chinese SOEs. In an attempt to corroborate this conclusion, we perform additional analysis after
replacing the cross-listing dummy variable in our regressions of bonding effects with the
bonding mechanisms previously identified (i.e., the use of internationally-accepted accounting
standards, board independence, and number of analysts following the firm). Our analysis finds
that number of analysts following significantly explains the bonding effects manifested on
decreased earnings management, increased board professionalism, improved investment
efficiency, and enhanced valuation premium. It also finds that board independence significantly
5
explains all the bonding effects except valuation premium. However, we obtain mixed results
for the bonding effects from the adoption of internationally-accepted accounting standards.
Overall, the additional analysis finds further support suggesting bonding via greater scrutiny of
financial analysts and board independence.
Our study contributes to prior research in several ways. First, we add to the literature by
documenting the relation between political relations and cross-listing choices for state-owned
firms. Using a sample of Indonesian firms that have ties with the Soharto families, Leuz and
Oberholzer-Gee (2006) document that firms’ likelihood of cross-listing decreases when they
have political connections. Contrary to their finding, our evidence shows that Chinese SOEs
with stronger political relations are more likely to cross-list, but financing decisions and other
economic factors do not affect their global listing choices.
Second, our study adds to the recent debate on the impact of the Sarbanes-Oxley Act on the
flow of international listing in the U.S. Piotroski and Srinivasan (2007) find a shift of foreign
listing between U.S. and U.K. stock exchanges subsequent to the Sarbanes-Oxley Act (SOX).
More specifically, they find that after SOX the increase in likelihood of listing in the U.K. is
greater among smaller and less profitable firms from developed economies, while the increase in
likelihood of listing in the U.S. is mostly from profitable firms in emerging markets. However,
we document a decrease in U.S. listing among Chinese SOEs. Compared with the profitable
firms in emerging markets that increase their propensity to list in the U.S., Chinese SOEs
probably find that the expected costs such as higher political risks outweigh the expected benefits
from the new regulatory requirements of SOX, thereby decreasing their propensity to cross-list
on the U.S. stock exchange.

6
Third, the paper provides additional insights on the bonding mechanisms for SOEs. Our
results suggests that reputational intermediaries such as analysts provide significant bonding
effects for Chinese SOEs, consistent with Besley and Prat (2006) that independent media can
help curb the grabbing hand of the government and increase its accountability. In addition,
consistent with Siegel (2005), we find that overseas regulators are not more effective enforcers
for the cross-listed firms.
Finally, the paper adds to our understanding on the causes and consequences of cross-listing
for Chinese firms. While prior studies suggest that cross-listing on foreign stock exchanges is a
mechanism for controlling shareholders of companies in weak institutional environments to
commit consuming less private benefits in exchange for the ability to raise capital and increase
share liquidity (Stulz, 1999; Doidge, 2004), these studies typically do not include Chinese firms.
Our evidence suggests that while political factors rather than economic considerations dominate
Chinese SOEs’ decisions to cross-list on overseas stock exchanges, cross-listing does induce
better accounting disclosure, higher board professionalism, greater investment efficiency and a
cross-listing premium for these firms by subjecting them to increased scrutiny of international
investment communities.
The remainder of the paper is structured as follows. Section 2 discusses institutional
background and section 3 presents research methodology. Section 4 describes the sample and
empirical results. Section 5 summarizes our investigation.
2. Institutional Background
2.1 POLITICAL RELATIONS AND OVERSEAS LISTING FOR CHINESE SOES
Prior studies suggest that firms with strong political relations are less likely to tap into
foreign capital markets because these ties facilitate access to domestic capital and exacerbate
7
monitoring costs for accessing foreign capital (Leuz and Oberholzer-Gee, 2006). We argue that
such a relation may not hold for Chinese SOEs, because the overseas listing process is tightly
controlled in China and dominated by noncommercial factors. Specifically, an SOE seeking
overseas listing must first gain approval from CSRC (China Securities Regulatory Commission),
an executive branch of the State Council supervising the securities markets. It is commonly
believed that the CSRC’s selection process is subject to heavy political pressure. Anecdotal
evidence suggests that key motivations behind politicians’ selection of cross-listed firms are: (1)
pursuing national agenda at increasing Chinese firms’ international presence, and (2) fulfilling
politicians’ private agenda at enhancing their political and economic capital. To promote the
national agenda, politicians may use cross-listing on overseas stock exchanges as a way to
showcase the country’s economic power.1 An analogy for securing a listing on New York Stock
Exchange is winning Olympic medals because of the prestige and visibility such an achievement
can bring to the politicians and the government. In addition, to fulfill the private agenda,
politicians may use overseas listing to circumvent government regulations such as pay limits for
top executives (Ke et al., 2006; Charitou et al., 2007). The politicians may also use the
opportunity to expand the firms’ operations overseas as a way to enhance political capital.
To fulfill these objectives, we conjecture that the politicians are more likely to select firms
under their protection or with political connection to cross-list on overseas stock exchanges for
two reasons. First, we argue that the government is more likely to select firms under tight
government protection to cross-list because (1) the government can maintain control of the firms
even after global listing, and perhaps more importantly (2) the government can ensure the
success of the global listing of firms that enjoy stable monopoly profits and other privilege such
1 For example, see “Chinese industrial giant to launch HK share offer,” Reuters News, July 2, 1993.

8
as subsidies. Examples of firms that fit such a profile are those owned by the central government
or in regulated industries (finance, natural resources, or public utilities) because these firms are
under the direct supervision of State Council, constitute a major component to the central
government’s budget, and tend to be large state monopolies. Second, we argue that the
government is more likely to select firms with strong political connection to cross-list to ensure a
close cooperation with the government officials in global listing. Examples of firms with strong
political connection are those with executives being ex- or current government bureaucrats (or,
“politically-connected” executives, as in Fan et al., 2007).
Thus, while firms with stronger political relations have lower incentives to cross-list due to
easier access to domestic capital and greater monitoring costs, it is also possible that they are
more likely to cross-list due to their strong political incentives either for national pride or
politicians’ self interests. These political relations in the form of government protection and
political connection will enhance the preferential treatment to the favored SOEs in the selection
process. It is an empirical issue whether political relations will increase or decrease Chinese
SOEs’ chances of listing in overseas market.
2.2 OVERSEAS LISTING, BONDING MECHANISMS, AND BONDING EFFECTS
Prior studies such as Coffee (1999, 2002) propose that a foreign firm from a jurisdiction
featuring weak investor protection can commit to limit expropriation of minority shareholders by
bonding itself to a foreign securities regime through cross-listing (i.e., the bonding hypothesis).
These studies suggest three main bonding mechanisms via which the “bonding” of cross-listed
firms takes effect: (1) legal requirements mandated on overseas stock exchanges, (2) law
enforcement by overseas regulators, and (3) monitoring by financial intermediaries. While the
cross-listing literature generally supports the bonding hypothesis for U.S. exchange listing
9
(Doidge et al., 2004), it provides little evidence on bonding mechanisms or bonding effects for
state-owned firms or firms cross-listed on non-U.S. stock exchanges (Brockman and Chung,
2003; Guo and Tang, 2006).
It is an empirical issue whether cross-listed Chinese SOEs will exhibit any bonding effects.
On the one hand, the bonding effect may be minimum for Chinese SOEs cross-listed on foreign
stock exchanges because of ineffective bonding mechanisms or serious agency problems. The
legal bonding mechanisms are generally viewed as ineffective for Chinese SOEs. 2 For example,
it is often difficult for overseas regulators to take enforcement actions against Chinese SOEs due
to bureaucratic burden and government intervention.3 In addition, the state serving as the
controlling shareholder is generally perceived to give rise to agency problems in several ways.
First, the state is likely to soften the budget constraint of its SOE managers (Kornai, 1980, 1986),
creating a moral hazard problem of over-investments in negative NPV projects. Second,
government officials are likely to use state ownership as a vehicle to provide employment,
subsidies and other benefits to supporters in exchange for brides or votes (e.g., Shleifer and
Vishny, 1994; La Porta et al., 2002). Third, since the government officials who control the SOEs
never have residual claims of the firms, there is poor alignment between their interests and those
of the minority shareholders. Fourth, since the government retains key personnel and strategic
2 See “Chinese cos cast shadow on HK corporate governance” Dow Jones International News, September 13, 2004. In addition, cross-listed Chinese SOEs often do not voluntarily conform to corporate governance practices recommended by foreign stock exchange regulators. For example, the 2004 Annual Report of China Telecom states “the company, as a foreign private issuer, is not required to comply with all of the corporate governance rules of Section 303A of the NYSE Listed Company Manual…. the Company is not required to have a board with a majority of independent directors.” 3 The Securities and Futures Commission (SFC) in Hong Kong is alleged to abandon one in five investigations for mainland firms because suspects disappear across the border (see “Still tough catching crooks across the boarder,” Business Times Singapore, April 21, 2007). In addition, the investigation by overseas regulators could stall if the Chinese government does not allow the overseas regulators to contact executives in her state-owned firms (”Beijing shields executive in Hong Kong probe,” The Asian Wall Street Journal, December 8, 2003).

10
decisions, managers of Chinese SOEs are likely to care more about government’s political
agenda than responding to the demand of minority shareholders.
On the other hand, the bonding effect may be significant for Chinese SOEs due to increased
monitoring of foreign financial intermediaries. This is because international cross-listing attracts
greater coverage by financial analyst and press (Baker et al., 2002; Lang et al., 2003), an
important group with a significant monitoring function (Moyer et al., 1989; Miller, 2006). In
addition, anecdotal evidence suggests that foreign investors and financial intermediaries are
particularly concerned about government intervention when investing in Chinese SOEs because
the Chinese government has been frequently alleged to divert resources of listed SOEs for
social/political objectives (Moiseiwitsch, 2002). An example of the potential political risk
associated with government intervention is the recent U.S. lawsuit against China life Insurance
Co., which accuses the company for not adequately disclosing an audit report on accounting
irregularities related to use of funds at its state-owned predecessor firm.4 Thus, given the
increased monitoring by foreign media and investment professionals on cross-listed Chinese
SOEs, the government may constrain her intervention on cross-listed firms and promote greater
transparency to prevent negative publicity and political backlash in international markets. This is
likely to be the case when cross-listing is used politically for demonstrating China’s rising
economic power and her willingness to adhere to international standards.
3. Research Design
3.1 TESTS RELATED TO POLITICAL FACTORS AND CROSS-LISTING DECISIONS
We test the relation between cross-listing decisions and political relations by regressing a
dummy variable indicating whether a firm is cross-listed on foreign stock exchanges on the
following two variables: (1) protected firm, a dummy variable capturing whether the firm is 4 See “China Life stock slumps on accounting probe report,” Reuters News, April 2, 2004.

11
owned by the central government or in regulated industries, and (2) politically connected firm, a
dummy variable capturing whether the Chairman or CEO is an ex- or current government
bureaucrats. In addition, our regression analysis includes several economic factors that are
expected to affect cross-listing decisions based on prior studies (Pagano et al., 2002; Sarkissian
and Schill, 2004; Doidge et al., 2006). Specifically, we include the following variables to
capture the economic incentives for cross-listing: (1) firm size, to control for cross-listing
economies of scale, (2) capital expenditure, leverage, and sales growth, to control for financing
needs, (3) return on assets, to control for the possibility that higher quality firms may be more
likely to cross-list to signal their quality, and (4) tradable industry, to control for the possibility
that a firm with tradable goods is more likely to cross-list to strengthen the company’s product
market. Finally, we include a dummy variable indicating years following the passage of the
Sarbanes-Oxley Act of 2002 because recent studies suggest a decrease in U.S. foreign listing
subsequent to the Act (Piotroski and Srinivasan, 2007).
Our formal regression model is:
X-list = β0 + β1 (Protected firm)+ β2 (Politically connected firm)+β3(Firm size)+ β4(Capital expenditure)+ β5(Leverage)+ β6(Sales growth)+ β7(Return on assets)+β8(Tradable industry)+β9(Post-SOX) +ε (1)
where: X-list = A dummy variable equal to 1 if the firm is cross-listed on overseas stock exchanges, and
0 otherwise. Protected firm = A dummy variable equal to 1 if the firm is owned by the central government or
in a regulated industry (finance, natural resources, or public utilities), and 0 otherwise. Politically connected firm = A dummy variable equal to 1 if the Chairman or CEO is an ex- or
current officer of the central government, a local government, or the military; and 0 otherwise.
Firm size = Natural logarithm of total assets in thousand US dollar. Capital expenditure = Expenditure to acquire fixed assets, measured as change in fixed assets and in-process projects, divided by total assets. Leverage = Total debt divided by total owners’ equity. Sales growth = Growth in sales.

12
Return on assets = Net income divided by total assets. Tradable industry = A dummy variable equal to 1 if the firm’s industry belongs to chemicals,
consumer goods, electronics, manufacturing, healthcare, mining, oil and gas, and paper, and 0 otherwise (Sarkissian and Schill, 2004).
Post_SOX = A dummy variable equal to 1 for years subsequent to the passage of the 2002 Sarbanes-Oxley Act, and 0 otherwise.
We use a logistic regression because our dependent variable is a binary variable. In addition,
since each firm appears multiple times in our sample, we use robust standard errors clustered by
firm to control for the dependence among error terms.
3.2 TESTS RELATED TO BONDING MECHANISMS OF CROSS-LISTING
To test the mechanisms through which insiders of cross-listed Chinese SOEs may commit
themselves not to take excessive private benefits, we examine three main bonding devices: (1)
legal requirement on accounting standards and corporate governance imposed by overseas stock
exchanges, measured as the adoption of internationally-accepted accounting standards (IFRS or
U.S. GAAP) and appointment of independent directors, (2) law enforcement, measured as
securities regulators’ enforcement action against a firm’s top executives for corruption charges5,
and (3) monitoring by financial intermediaries, measured as number of analysts following the
firm. In addition, we include the following control variables: (1) political factors controlling
whether the firm is protected or politically connected, (2) firm characteristics controlling for size,
leverage, and growth, and (3) year dummies controlling for year effects. Our formal regression
model is as follows:
Bonding mechanism =β0+β1 (X-list)+β2 (Protected firm)+β3 (Politically connected firm)+ β4(Firm size)+β5(Leverage)+ β6(Sales growth)+βn(DYear)+ε (2)
5 We focus on corruption because of its economical significance – corruption often causes severe damage for shareholders and results in harsh penalty for the convicted executives. For example, Liu Jinbao, the former chief executive of Hong Kong-listed Bank of China Hong Kong Ltd. was given a suspended death sentence by a Chinese court after being convicted of embezzling 14.3 million yuan ($1.8 million US dollar) with others and 7.5 million yuan ($0.9 million US dollar) for himself (see “Bank of China ex-officer sentenced,” The Wall Street Journal Europe, August 15, 2005).

13
where: Bonding mechanism = A variable capturing legal requirement, enforcement action, and number
of analysts following. DYear = Dummies for years. For ease of presentation, year dummy coefficients are not
tabulated. The other variables are defined following equation (1).
We use OLS regression when the dependent variable is a continuous variable and logistic
regression when the dependent variable is a binary variable. In addition, we use robust standard
errors clustered by firm to control for the dependence in the error terms.
3.3 TESTS RELATED TO BONDING EFFECTS OF CROSS-LISTING
To test the bonding effect of cross-listing, we regress corporate policies and firm valuation
on a dummy variable indicating whether the firm is cross-listed on foreign stock exchanges and
several control variables. We explore potential bonding effects in the following three types of
corporate choices: accounting, governance, and investment. First, we examine accounting
choices as reflected in the propensity of earnings management. We use three variables to capture
the propensity of earnings management: small profit, small losses, and the magnitude of accrual
scaled by operating cash flows. All else equal, a lower frequency of reporting small profits,
higher tendency of reporting small losses, and lower magnitude of accruals are consistent with
less earnings management. Following Lang et al. (2003), we define small profit as net income
scaled by total assets between 0 and 0.01 and small loss as net income scaled by total assets
between -0.01 and 0. Second, we examine corporate governance choices as reflected in board
professionalism. Following Fan et al. (2007), we use three measures for the professionalism of
corporate board: the percentages of board members serving industry associations, with banking
experience, or with law/accounting experience. Third, we examine the choice of investment
policies as reflected in investment efficiency. Following prior studies (Lang et al., 1996; Fan et

14
al., 2005), we measure investment efficiency as the sensitivity of capital expenditure on lagged
Tobin’s q. Finally, we examine whether the bonding effect would reflect in firm valuation, using
Tobin’s q as our valuation measure (Doidge et al., 2004). The challenge for this test is that price
differences between cross-listed SOEs and their domestically listed counterparts are merely
driven by reduced agency costs as a result of bonding, but also by different market structure,
ownership composition, and investor recognition. For example, prior studies suggest that lack of
alternative investment opportunities drives much domestic Chinese savings into stock markets,
causing domestic shares (or, A-shares) of cross-listed Chinese firms to trade at a premium than
their foreign shares (Bailey et al., 1999).6 In addition, Baker et al. (2002) suggest that increased
investor recognition associated with cross-listing also affect firm valuation. Thus, to avoid the
confounding factors other than reduced agency costs on firm valuation, we restrict the sample to
domestically listed firms and cross-listed firms that have also issued shares domestically and test
the cross-listing valuation premium using only the A-share prices.
As in the tests for bonding mechanisms, we include the following control variables: (1) political
factors controlling whether the firm is protected or politically connected, (2) firm characteristics
controlling for size, leverage, and growth, 7 and (3) year dummies controlling for year effects. We use
OLS regression when the dependent variable is a continuous variable and logistic regression when the
dependent variable is a binary variable. In addition, we use robust standard errors clustered by firm.
Our formal regression model related to accounting policies, corporate governance, and firm valuation
is as follows:
Bonding effect =β0+β1 (X-list)+β2 (Protected firm)+β3 (Politically connected firm)+ β4(Firm size)+β5(Leverage)+β6(Sales growth)+βn(DYear)+ε (3)
6 Only mainlanders and selected foreign institutional investors are allowed to trade on the Renminbi-quoted A-shares of Chinese companies. 7 In the regression analyzing investment efficiency, we exclude sales growth as a control because the model includes lagged Tobin’s q, which also captures the growth prospect.

15
Our formal regression model related to investment efficiency is as follows:
Capital expenditure =β0+β1 (X-list*lTobin’s q)+β2 (lTobin’s q)+β3 (X-list)+β4 (Protected firm)+ β5 (Politically connected firm)+β6(Firm size)+β7(Leverage)+βn(DYear)+ε (4)
where: Bonding effect = A variable capturing a firm’s accounting properties, board professionalism, and
valuation premium. lTobin’s q = Lagged value of Tobin’s q, which equals the sum of market value of equity and
book value of liabilities divided by total assets. DYear = Dummies for years. For ease of presentation, year dummy coefficients are not tabulated. The other variables are defined following equation (1). 4. Sample and Empirical Results
4.1 SAMPLE AND DESCRIPTIVE STATISTICS
Our sample includes Chinese SOEs cross-listed on overseas stock exchanges worldwide, as
well as those listed on domestic Shanghai and Shenzhen stock exchanges. To identify overseas
stock exchanges with cross-listed Chinese firms, we use the information based on CSRC’s
website.8 Consistent with Yang and Lau (2006), we find four such markets -- Hong Kong,
Singapore, the U.K., and the U.S.
Table 1 presents a comparison of markets with listed Chinese SOEs in terms of country
characteristics, stock market characteristics, legal requirement, law enforcement, and financial
intermediaries. The table reports three main patterns. First, it shows that the Hong Kong market
has the highest similarity with domestic Chinese markets based on language and distance. Since
prior studies suggest that market proximity and familiarity play the dominant role in the choice
of overseas listing (Sarkissan and Schill, 2004), we expect Hong Kong to be the most popular
destination for Chinese firms’ cross-listing destinations. Second, the U.S. market has the largest
number of listed companies and biggest market capitalization, as well as the strongest rule of law
8 See http://www.csrc.gov.cn/n575458/index.html

16
tradition and the greatest monitoring capacity by financial intermediaries. Thus, we expect the
U.S. to be another popular destination for Chinese firms’ cross-listing if they would like to tap
into the largest pool of foreign capital or achieve the highest visibility and recognition in
worldwide capital markets. Third, compared to domestic Chinese markets, overseas markets (i.e.,
Hong Kong, Singapore, the U.K., and the U.S.) tend to require higher quality accounting
standards (as reflected in the use of internationally-accepted accounting standards) and greater
corporate governance (as reflected in the mandate of independent directors). In addition, the
overseas markets all offer higher investor protection, as measured by the rule of law tradition and
corruption index, and greater monitoring by financial intermediaries, as captured by press
freedom and average number of analysts following the firm.
After identifying the key overseas stock exchanges where Chinese SOEs cross-listed, we
collect initial company list from each stock exchange and supplement it with JP Morgan ADR
list for U.S.-listed companies. We then obtain necessary financial and stock price data for firms
listed in overseas markets from the Worldscope database and for those listed in domestic markets
from the China Security Market and Accounting Research (CSMAR) database. To mitigate the
influence of outliers, we winsorize all scaled variables at the top and bottom 1% of each
distribution. In addition, we hand collect data on ultimate ownership (i.e., whether the ultimate
owner is central government, local government, or private enterprise), as well as background
information on executives (i.e., whether the chairman or CEO is politically connected) and
boards (e.g., the percentage of directors that are independent or have law/accounting experience)
based on available annual reports closest to the year in which the company was cross-listed on
the overseas stock exchange. We obtain comparable information on executives and boards for
domestically listed firms from Fan et al. (2007). Finally, we gather data on number of analysts
17
following from the I/B/E/S International database and hand collect data on enforcement actions
against a firm’s top executives for corruption from the cnnewspaper database.9
We note that while we measure financial data each year, we are unable to do so for the data
on share ownership and management profile because it is prohibitively costly to manually collect
these data from annual reports every year. To the extent that these data are fairly stable over
time and it is unlikely that a firm will change its ownership from a non-SOE to a SOE after
cross-listing, this does not pose a significant problem in our empirical tests.
Another drawback of the data is that for the majority of our cross-listed firms, we only have
data after the firm is cross-listed. While certain variables such as industry membership is
unlikely to change after the firm is cross-listed, several financial characteristics such as firm size,
leverage, and returns on assets are likely to be affected as a result of listing on overseas stock
exchanges. Although we do not expect the changes in financial characteristics to affect our
inference on political relations, we note this limitation in interpreting certain financial
characteristics in testing the determinants of cross-listing decisions.
Our sample consists of 1,063 firms listed on domestic Chinese stock exchanges (Shenzhen
and Shanghai stock exchanges) and 134 firms listed on overseas stock exchanges (Hong Kong,
Singapore, U.K., or U.S. stock exchanges) from 1991 to 2005. We start our investigation period
in 1991 because Shenzhen and Shanghai stock exchanges are set up in 1990 and 1991,
respectively.
Table 2 reports the sample distribution of Chinese SOEs listed on stock exchanges
worldwide. Panel A of Table 2 reports the number and percentage of firms listed on each stock
9 The website address is www.cnnewspaper.com. The database provides more than 300 major journals and other sources dating as far back as 1991, including information sources from outside of Mainland China covering all subject areas related to business. We search for enforcement actions related to top executives including Chairman, CEO, vice CEO, and CFO.

18
exchange by year, as well as total market value of listed firms as of 2005. It shows that there is a
decrease in local exchange listing in recent years, which is likely due to unfavorable market
conditions after 2000. The table also shows that Hong Kong is the most popular destination,
which constitutes 98% (=131/134) of the Chinese SOEs’ overseas listing, consistent with
proximity and familiarity being the dominant factors in cross-listing decisions. In addition, the
U.S. is the second most popular destination next to Hong Kong. Consistent with the U.S. being
the most prestigious cross-listing choice for Chinese SOEs, we find that while there are only 19
firms listed in the U.S. (versus 131 firms listed in Hong Kong), the U.S.-listed firms are much
larger and have an aggregate market value of US$ 415 billion (versus US$ 635 billion for Hong
Kong-listed firms). Interestingly, we note that the 19 U.S. listed Chinese SOEs are all listed on
NYSE and also simultaneously listed on Hong Kong stock exchanges (not reported in the table).
Panel B of Table 2 reports the number and percentage of firms listed on each stock exchange
by industry sector, where the firms are classified by the industry categories as in Fan et al. (2007).
The results in this panel show that, while domestically listed firms concentrate on the
manufacturing sector and not on the public utilities sector, there are relatively fewer cross-listed
firms in the manufacturing sector and more in the public utilities sector. Specifically, while 73%
of the domestically listed firms are in the manufacturing sector and 7% are in the public utilities
sector, 42% of the cross-listed firms are in the manufacturing sector and 22% are in the public
utilities sector.
Table 3 presents descriptive statistics and correlation analysis for our firm-level variables
used in the test of cross-listing decisions. Panel A of Table 3 reports descriptive statistics
partitioned by whether a firm-year observation is cross-listed. The far right column shows p-
values for t-tests of the mean differences and for Wilcoxon two-sample tests of the median

19
differences between local versus cross-listed firms. The panel reports that on average, 30% of
the local firms and 52% of the cross-listed firms are protected, with the difference significant at
p<1% (two-tailed). In addition, it shows that on average, 27% of the local firms and 50% of the
cross-listed firms are politically connected, with the difference significant at p<1% (two-tailed).
Thus, the result from the univariate analysis is consistent with cross-listed Chinese SOEs having
stronger political relations than domestically listed Chinese SOEs.
Panel A of Table 3 also indicates that cross-listed SOEs tend to be bigger, consistent with
prior studies that larger firms are more likely to cross-list. However, the table also shows that
cross-listed Chinese SOEs make smaller capital expenditure, have lower leverage, and are less
likely to have tradable goods. This result is inconsistent with prior studies that find cross-listing
being driven by economic needs to fund growth and expand foreign sales. Thus, the result from
our univariate analysis casts doubt on the applicability of economic factors documented in prior
studies as drivers of the cross-listing decisions in the context of Chinese SOEs.
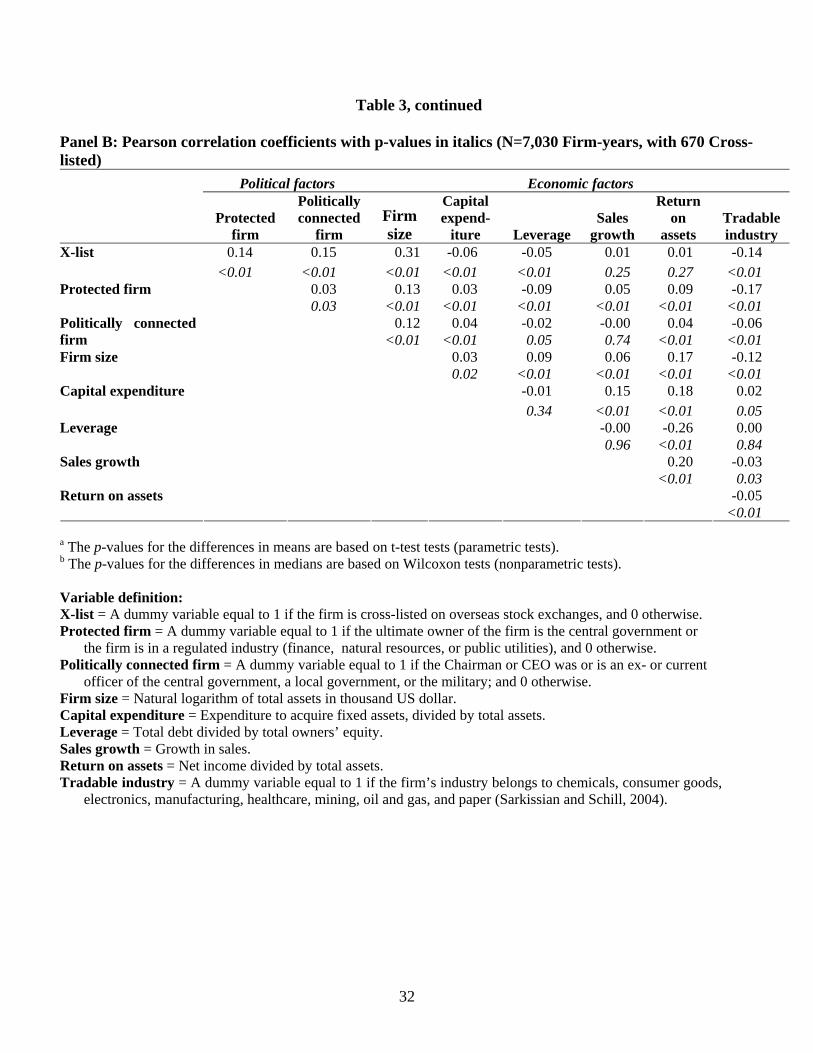
Panel B of Table 3 presents Pearson correlation coefficients for the associations among firm-
specific variables. It shows a significantly positive correlation between cross-listing and political
relations. In addition, we find that firms with stronger political relations tend to be larger, have
more capital expenditure, enjoy greater return on assets, have less leverage, and produce fewer
tradable goods.
4.2 EMPIRICAL RESULTS
Table 4 reports the results of the logistic regression that analyzes the determinants of cross-
listing decisions. Model One regresses a dummy variable indicating whether a firm is cross-
listed on any foreign stock exchange on our political factors and control variables. Model Two
(Model Three) explores whether the cross-listing decisions vary across Hong Kong and U.S.

20
listing, the two primary overseas listing destinations of Chinese SOEs, by changing the
dependent variable to a dummy variable indicating whether a firm is cross-listed on Hong Kong
stock exchanges (on U.S. stock exchanges).
Models One finds the coefficients on both political factors (i.e., protected firm and politically
connected firm) to be significantly positive at p<1% (two-tailed). In addition, it finds that cross-
listed Chinese SOEs are larger, make less capital expenditure, have lower leverage and return on
assets, and are less likely to be in an industry with tradable goods. Thus, the multivariate
analysis results confirm our univariate analysis results that cross-listing choices of Chinese SOEs
are driven by political consideration and not economic needs.
The result in Model Two is consistent with that in Model One. This is not surprising because
almost all firms cross-listed on any overseas stock exchange also cross-list on Hong Kong stock
exchanges. Finally, the result in Model Three indicates the following two differences between
Hong Kong listing (Model Two) and U.S. listing (Model Three). First, the signs of the
coefficients on capital expenditure, sales growth, and returns on assets turn into an opposite
direction in Model Three, with the difference significant at p<10% (two-tailed). While the result
in Model Three suggests that U.S.-listing is significantly associated with higher capital
expenditure, it also shows that U.S.-listing is associated with lower sales growth. Thus, Model
Three also yields mixed evidence on the influence of economic incentives for cross-listing
decisions. Second, the coefficient on the dummy variable indicating years subsequent to the
passage of the Sarbanes-Oxley Act is significantly more negative for U.S. listing at p<1% (two-
tailed). Thus, the evidence is consistent with that Chinese SOEs are less likely to cross-list on
U.S. stock exchanges after 2002, possibly due to the increased regulatory requirements of the
Sarbanes-Oxley Act on corporate governance and financial disclosure.

21
Table 5 reports the results of the analysis on three types of bonding mechanisms: (1) legal
requirement of accounting standards and corporate governance, (2) law enforcement against
corruption of top executives, and (3) financial analysts following the firm. Panel A of Table 5
provides descriptive statistics on additional variables used in this analysis. It shows, on average,
there is a low propensity of using internationally-accepted accounting standards and independent
directors among Chinese SOEs. In addition, the enforcement actions against a cross-listed firm’s
top executives for corruption are rare and mostly initiated by local Chinese regulators, not
overseas regulators.10 The lack of enforcement by overseas regulators against cross-listed firms
is consistent with Siegel (2005) that US SEC has not effectively enforced the law against cross-
listed foreign firms. Finally, the panel shows that the average number of analysts following is
less than one for Chinese SOEs.
Panels B, C, and D of Table 5 test the bonding mechanism related to legal requirement, law
enforcement, and monitoring by financial intermediaries, respectively. Panel B shows that cross-
listed Chinese SOEs are more likely to use internationally-accepted accounting standards and
have higher percentage of independent directors, with the coefficient on the cross-listing dummy
variable being significant at p < 10% (two-tailed).11 The result is not surprising because we
would expect cross-listed Chinese SOEs to conform to mandatory reporting and corporate
governance requirements in overseas markets, which are generally stricter than those in mainland
China. Panel C indicates little bonding via law enforcement on cross-listed firms, with the
10 Although rare, there are examples of anti-corruption enforcement of cross-listed firms by overseas regulators. For example, Hong Kong regulators sentenced a director of Hong Kong-listed Guangnan (Holdings) Ltd. to five years in prison for pilfering more than 53 million Hong Kong dollars ($6.8 million US dollars) in a credit scam (Associated Press Newswires, April 3, 2002). There is no enforcement action by overseas regulators against domestically listed firms in our sample. 11 The number of observation is smaller in our tests for legal requirement due to missing data on background information of board for domestically listed firms that are not covered in Fan et al. (2007).

22
coefficient on the cross-listing dummy variable being insignificant at conventional level.12 The
result is consistent with critics’ view that overseas regulators such as those in Hong Kong, fail to
uphold international standards against the Beijing government due to political pressure (Clifford,
2003). Finally, consistent with Yang and Lau (2006), Panel D shows a higher number of
analysts following for cross-listed firms, with coefficient on the cross-listing dummy variable
being significant at p < 1% (two-tailed). Overall, the analysis in Table 5 suggests that while
Chinese SOEs may commit themselves to less expropriation of minority shareholders due to
stricter legal requirement and greater monitoring of financial intermediaries in overseas markets,
they are unlikely to do so due to law enforcement by overseas regulators.
Table 6 reports the results of the analysis on bonding effects. Panel A of Table 6 provides
descriptive statistics on additional variables used in this analysis. We note that the numbers of
observations vary in this analysis because of additional data requirement for each test.13 The
panel shows an average of 14 percent of firm-years reporting small profits and an average of 0
percent of firm-years reporting small losses. In addition, it shows that the average percentage of
board serving in industry associations or with law/accounting experience is 5%. Finally, the
panel shows the average lagged Tobin’s q is 2.46 for Chinese SOEs.
Panels B, C, D, and E of Table 6 test the bonding effects related to earnings management,
board professionalism, investment efficiency, and firm valuation, respectively. Panel B shows
that, while cross-listed firms do not seem to have smaller magnitude of accruals, they are less
12 For cross-listed firms, we include enforcement action by both local and overseas regulators. Additional analysis (not tabled) finds the coefficient on the cross-listing dummy variable to be significantly negative at p < 5% (two-tailed) after including only enforcement action by overseas regulators for cross-listed firms. Thus, the additional evidence suggests that the enforcement by overseas regulators is significantly lower than that by local regulators, even though the rule of law tradition is higher in overseas markets. 13 For the test on valuation premium, the number of cross-listed firm-years is lower than the whole sample because not all cross-listed firms have corresponding domestic shares (recalled that the test is based on domestic shares of both cross-listed and domestically listed firms).

23
likely to report small profits and more likely to report small losses, with the coefficient on the
cross-listed dummy significant at p < 5% (two-tailed) in regressions with the dependent variable
being small profits or small losses. Panel C shows that cross-listed Chinese SOEs have
significantly more professional board of directors than their domestically listed counterparts,
with the coefficient on the cross-listed dummy significant at p < 1% (two-tailed) across
regressions where the dependent variables are percentage of boards serving industry associations,
with banking experience, and with law/accounting experience. Panel D shows that capital
expenditures of cross-listed firms are more sensitive to lagged Tobin’s q, with the coefficient on
the interaction term between the cross-listing dummy variable and lagged Tobin’s q variable
being significant at p < 5% (two-tailed). This result is consistent with greater investment
efficiency of cross-listed Chinese SOEs due to decreased government intervention on investment
policies. Finally, Panel E shows that cross-listed Chinese SOEs enjoy a higher valuation
premium than their domestically listed counterparts, with the coefficient on the cross-listed
dummy significant at p < 1% (two-tailed).14
An underlying assumption for our analysis is that our cross-listing variable is a reasonable
surrogate for mechanisms that bond firms to limit expropriation of minority shareholders. In an
14 Since the cross-listed firms do not represent a random selection of Chinese SOEs, it is possible that our results on bonding effects are affected by self-selection bias. To assess the impact of self-selection on our results, we implement the two-step estimation procedure in the Heckman treatment effects model for the analysis in the Table 6 (Greene, 1993). In the first stage, we model the decision to cross-list as in the Table 4 analysis. Specifically, we use a probit model to analyze our sample firms’ decisions to cross-list, where the dependent variable equals one for cross-listed firms and zero for domestically listed firms. We include all independent variables in our cross-listing decision regression as in the Table 4 analysis, except for the variable serving as the dependent variable in the second stage regression. In the second stage we include the Inverse Mills Ratio from the first stage as an additional explanatory variable in the regression analysis in Table 6. This analysis (not tabled) finds results consistent with those reported in Table 6, with the following exception: the coefficient on the cross-listing dummy variable becomes significantly positive in the regression where the dependent variable is small profit. Since we continue to find that cross-listed SOEs report more small loss, have more professional boards, exhibit higher investment efficiency, and enjoy greater valuation premium, our overall conclusion on boding effects does not seem to be severely affected by potential self-selection bias. We note that we do not use the treatment effect model in the main analysis because prior studies show that attempts to control for potential self-selection are problematic and may produce estimates that are inferior to OLS regressions (Larcker and Rusticus, 2005).

24
attempt to assess whether this is a reasonable assumption, we rerun the analysis on bonding
effect in Table 6 after replacing the cross-listing dummy variable with the bonding mechanisms
identified in the Table 5 analysis (i.e., the use of internationally-accepted accounting standards,
board independence, and analysts following). Panels A, B, C, and D of Table 7 report the result
related to the bonding effect on earnings management, board professionalism, investment
efficiency, and valuation premium, respectively.15 Consistent with the bonding mechanisms
being the underlying channels driving the cross-listing bonding effects for Chinese SOEs, the
analysis in Table 7 finds that number of analysts following significantly explain all the bonding
effects documented in Table 6 (i.e., decreased earnings management, increased board
professionalism, improved investment efficiency, and enhanced valuation premium), with the
coefficient on number of analysts following being significantly positive at p<10% (two-tailed) in
all panels. Table 7 also shows that board independence significantly explains all the bonding
effects except valuation premium. However, Table 7 reports mixed evidence on the effect of the
use of internationally-accepted accounting standards. While the coefficient on the use of
internationally-accepted accounting standards is significantly positive at p < 10% (two-tailed) in
the analysis related to valuation premium, the coefficient on the interaction term between that
variable and lagged Tobin’s q is significantly negative in the investment efficiency analysis.
Overall, our analysis in Table 7 provides further support on bonding via scrutiny of financial
analysts and board independence.
15 For the tests related to earnings management (board professionalism), we use an earnings management index (a board profession index) as the dependent variable. Specifically, we construct a combined index on earnings management, which equal to 1 if the firm-year reports a small profit, -1 if the firm-year reports a small loss, and 0 otherwise. We construct an index on board professionalism, which equals the sum of the percentage of board members serving industry association, with banking experiences, or with law/accounting experiences.

25
5. Conclusion and Future Research
This paper conducts three sets of analyses for the cross-listing of Chinese SOEs. First,
we examine how political factors affect SOEs’ decision to cross-list on overseas stock
exchanges. Second, we investigate the primary mechanisms through which the overseas
listing provides the bonding effect. Third, we examine how the bonding from cross-listing
affects SOEs’ accounting, governance and investment choices, as well as their valuation.
Our results show that SOEs’ political relations have significant impact on their cross-
listing decisions. Economic factors that are documented in prior research to be the primary
reasons for cross-listing do not play a strong role in their overseas listing choices.
Although the listing decision is primarily determined by political factors, we find evidence
in bonding through the significantly larger number of analysts following, and the adoption
of international standards in accounting and corporate governance. Finally, the results
suggest that cross-listing produces bonding effects in the form of significantly lower
earnings management, more board professionalism, higher capital investment efficiency,
and greater valuation premium.

26
References
Allen, F., Qian, J., and Qian, M., 2005. Law, finance, and economic growth in China. Journal of Financial Economics 77, 57-116.
Bailey, W., Chung, P., and Kang, J.K., 1999. Foreign ownership restrictions and equity price
premiums: What drives the demand for cross-border investments? Journal of Financial and Quantitative Analysis 34, 489-511.
Baker, H.K., Nofsinger, J.R., and Weaver, D.G., 2002. International cross-listing and visibility.
Journal of Financial and Quantitative Analysis 37, 495–521. Besley, T., Prat, A., 2006. Handcuffs for the grabbing hand? Media capture and government
accountability. American Economic Review 96, 720-736. Brockman, P., Chung, D., 2003. Investor protection and firm liquidity. The Journal of Finance
58, 921-937. Chang, J.J., Khanna, T., and Palepu, K.G., 2000. Analyst activity around the world. Working
paper, Harvard University. Charitou, A., Louca, C., and Panayides, S., 2007. Why do firms cross-list? The flip side of the
issue. Working paper, University of Cyprus. Clifford, M., 2003. The Bank of China’s real scandal. Business Week, June 20, 2003. Coffee, J., 1999. The future as history: the prospects for global convergence in corporate
governance and its implications. Northwestern University Law Review 93, 641-708. Coffee, J., 2002. Racing towards the top? The impact of cross-listings and stock market
competition on international corporate governance. Columbia Law Review 102, 1757-1831. Doidge, C., 2004. U.S. cross-listings and the private benefits of control: Evidence from dual-
class firms. Journal of Financial Economics 72, 519-553. Doidge, C., Karolyi, A., and Stulz, R., 2004. Why are foreign firms listed in the U.S. worth more?
Journal of Financial Economics 71, 205-238. Doidge, C., Karolyi, A., Lins, K., Miller, D., and Stulz, R., 2006. Private benefit of control,
ownership, and the cross-listing decision. Working paper, Ohio State University. Fan, J., Wong T., and Zhang, T., 2005. The emergence of China pyramids. Working paper, The
Chinese university of Hong Kong.

27
Fan, J., Wong, T., and Zhang, T., 2007. Politically-connected CEOs, corporate governance and post-IPO performance of China’s newly partially privatized firms. Journal of Financial Economics 84, 330-357.
Greene, W.E., 1993. Econometric Analysis. 2nd Edition, McMillan, New York, NY. Guo, L., Tang, L., 2006. Cost of capital and liquidity of cross-listed Chinese companies.
Working paper, Suffolk University.
Karolyi, G., 2006. The world of cross-listings and cross-listings of the world: Challenging conventional wisdom. Review of Finance 1, 99-152.
Ke, B., Rui, O., and Yu, W., 2006. The effect of cross listing on the sensitivity of managerial
compensation to firm performance. Working paper, Penn State University and the Chinese University of Hong Kong.
Kissel, M., Santini, L., 2004. Global stock exchanges vie for a slice of China's IPO pie. The
Wall Street Journal, December 2, 2004. Kornai, J., 1980. Economics and Shortage. Amsterdam: North Holland. Kornai, J., 1986. The soft budget constraint. Kylos 39(1), 3-20.
Lang, M.H., Lins, K.V., and Miller D.P., 2003. ADRs, analysts, and accuracy: Does cross-listing in the U.S. improve a firm's information environment and increase market value? Journal of Accounting Research 41, 317-345.
Lang, M.H., Raedy, J. S., and Yetman, M.H., 2003. How representative are firms that are cross-listed in the United States? An analysis of accounting quality. Journal of Accounting Research 41, 363-386.
Lang, L.H.P., Ofek, E., and Stulz, R., 1996. Leverage, investment and firm growth. Journal of Financial Economics 40, 3-29.
La Porta, R., Lopez-de-Silanes, R., and Shleifer, A., 2002. Government ownership of banks. Journal of Finance 57, 265-301.
La Porta, R., Lopez-de-Silanes, R., Shleifer, A., and Vishny, R.W., 1998. Law and finance.
Journal of Political Economy 106, 1113-1155. Larcker, D.F., Rusticus, T.O, 2005. On the use of instrumental variables in accounting research.
Working paper, University of Pennsylvania. Leuz, C., Oberholzer-Gee, F., 2006. Political relationships, global financing, and corporate
transparency: Evidence from Indonesia. Journal of Financial Economics 81, 411-439.

28
Miller, G., 2006. The press as a watchdog for accounting fraud. Journal of Accounting Research 44, 1001-1033.
Moiseiwitch, J., 2002. Sizing the x-factor, Government sweeteners to market the China Telecom IPO only raised investors’ sense of political risk. November 2002, CFO Asia.Com.
Moyer, C., Chatfield, R., and Sisneros, P., 1989. Security analyst monitoring activity: Agency
costs and information demands. The Journal of Financial and Quantitative Analysis 24, 503-512.
Pagano, M., Roell, A., and Zechner, J.. 2002, The geography of equity listing: Why do
companies list abroad? Journal of Finance, 2651-2694. Piotroski, J., Srinivasan, S., 2007. The Sarbanes-Oxley Act and the flow of international listing.
Working paper, University of Chicago. Sarkissian, S., Schill, M., 2004. The overseas listing decision: New evidence of proximity
preference. Review of Financial Studies 17, 769-809. Shleifer, A., Vishny, R., 1994. Politicians and firms. Quarterly Journal of Economics 109, 995-
1025. Siegel, J., 2005. Can foreign firms bond themselves effectively by renting U.S. securities laws?
Journal of Financial Economics 75, 319-359. Stulz, R., 1999. Globalization of equity markets and the cost of capital. Journal of Applied
Corporate Finance 12, 8-25.
Yang, T., Lau, S.T., 2006. Choice of foreign listing location: Experience of Chinese firms. Pacific-Basin Finance Journal14, 311-326.

29
Table 1 Comparison of Markets with Listed Chinese SOEs
China
(Mainland) China
(Hong Kong) Singapore U.K. U.S. Country characteristics -Official language Mandarin
Mandarin English
English Mandarin Malay Tamil
English English
-Distance to Shanghai n/a 1,213 3,810 9,233 11,895
Stock market characteristicsa -Main stock exchanges Shenzhen
/Shanghai Stock Exchange
Hong Kong Stock Exchange
Singapore Stock Exchange
London Stock Exchange
NYSE/ NASDAQ
-Number of listed companies in main stock exchanges
1,377 1,135 686 3,091 5,434
-Market cap. in main stock exchanges (in $USD billion)
402 1,055 257 3,058 16,915
Legal requirementb -Accounting standards Chinese GAAP in
general. Firms with B-shares (foreign shares) must also prepare statements using IFRS
Hong Kong GAAP or international standards (IFRS or US GAAP)
Singapore or international standards (IFRS or US GAAP)
International standards or equivalent (IFRS or US GAAP)
US GAAP reporting or reconciliation
-Board independence At least two independent directors by year 2002, at least 1/3 independent directors by year 2003
Three independent directors required
At least two independent directors required
n/a for foreign companies
n/a for foreign companies
Law enforcementc -Rule of law 5 8.22 8.57 8.57 10 -Corruption 2 8.52 8.22 9.10 8.63 Financial intermediariesd -Press freedom score/Freedom status, as of 2005
82/Not free 28/Free 66/Not free 18/Free 17/Free
-Ave. number of analysts following
10.33 25.00 20.90 20.10 30.23
Source: a World Federation of Exchanges, as of 2005. b PriceWaterHouseCoopers listing requirements as of June 2006: http://www.pwchk.com/home/eng/ipo_list_requirement.html c La Porta et al. (1998); Allen et al. (2005). d Freedom House: http://www.freedomhouse.org; Chang et al. (2000).

30
Table 2 Description of Chinese State-Owned Enterprises (SOE) Listed on Stock Exchanges Worldwide
Panel A: Distribution of firms by stock exchanges listed and listing year
Local firms X-list firms
Shenzhen/ Shanghai
Stock Exchange All x-listed
firms
Hong Kong Stock
Exchange Singapore Stock
Exchange
U.K. London Stock
Exchange U.S.
NYSE/NASDAQYear N % N % N % N % N % N %1991 5 0% 4 3% 4 3% 0 0% 0 0% 0 0%1992 33 3% 7 5% 7 5% 0 0% 0 0% 0 0%1993 98 9% 8 6% 8 6% 0 0% 0 0% 1 5%1994 81 8% 14 10% 13 10% 0 0% 0 0% 1 5%1995 17 2% 1 1% 1 1% 0 0% 0 0% 0 0%1996 160 15% 9 7% 9 7% 1 33% 0 0% 2 11%1997 175 16% 28 21% 26 20% 1 33% 3 50% 3 16%1998 88 8% 2 1% 3 2% 0 0% 0 0% 1 5%1999 81 8% 6 4% 6 5% 0 0% 0 0% 0 0%2000 112 11% 6 4% 6 5% 0 0% 2 33% 4 21%2001 59 6% 7 5% 6 5% 1 33% 0 0% 3 16%2002 54 5% 9 7% 9 7% 0 0% 0 0% 1 5%2003 43 4% 10 7% 10 8% 0 0% 0 0% 1 5%2004 51 5% 12 9% 12 9% 0 0% 1 17% 2 11%2005 6 1% 11 8% 11 8% 0 0% 0 0% 0 0% Total 1,063 100% 134 100% 131 100% 3 100% 6 100% 19 100% Total market value (in USD billion) of listed firms as of 2005: 286 636 635 1.5 55 415
Panel B: Distribution of firms by sector
Local firms X-list firms
Shenzhen/ Shanghai
Stock Exchange All x-listed
firms
Hong Kong Stock
Exchange
Singapore Stock
Exchange
U.K. London Stock
Exchange
U.S.
NYSE/NASDAQ
Sector N % N % N % N % N % N %
Finance and real estate 64 6% 11 8% 11 8% 0 0% 0 0% 1 5%Manufacturing 777 73% 56 42% 55 42% 2 67% 1 17% 3 16%Natural resources 62 6% 7 5% 7 5% 0 0% 0 0% 4 21%Public utilities 79 7% 30 22% 29 22% 0 0% 4 67% 10 53%Service and trade 81 8% 30 22% 29 22% 1 33% 1 17% 1 5% Total 1,063 100% 134 100% 131 100% 3 100% 6 100% 19 100%

31
Table 3 Descriptive Statistics and Correlation Analysis
Panel A: Descriptive statistics, local versus cross-listed firms (N=7,030 Firm-years, with 670 Cross-listed)
Variable
Mean Std. dev.
Median p-value for mean diff. a
p-value for median diff. bPolitical factors Protected firm Local firms 0.30 0.46 0.00 <0.01 X-list firms 0.52 0.50 1.00 <0.01 Politically connected firm Local firms 0.27 0.44 0.00 <0.01 X-list firms 0.50 0.50 0.00 <0.01 Economic factors Firm size Local firms 12.06 0.94 11.98 <0.01 X-list firms 13.20 1.68 13.11 <0.01 Capital expenditure Local firms 0.09 0.10 0.06 <0.01 X-list firms 0.07 0.09 0.04 <0.01 Leverage Local firms 0.65 0.80 0.45 <0.01 X-list firms 0.52 0.68 0.36 <0.01 Sales growth Local firms 0.21 0.52 0.13 0.30 X-list firms 0.23 0.59 0.13 0.99 Return on assets Local firms 0.02 0.08 0.03 0.38 X-list firms 0.03 0.10 0.04 <0.01 Tradable industry Local firms 0.67 0.47 1.00 <0.01 X-list firms 0.44 0.50 0.00 <0.01
32
Table 3, continued Panel B: Pearson correlation coefficients with p-values in italics (N=7,030 Firm-years, with 670 Cross-listed)
Political factors Economic factors
Protected
firm
Politically connected
firm Firm size
Capital expend-
iture Leverage Sales
growth
Return on
assets Tradable industry
0.14 0.15 0.31 -0.06 -0.05 0.01 0.01 -0.14 X-list <0.01 <0.01 <0.01 <0.01 <0.01 0.25 0.27 <0.01
0.03 0.13 0.03 -0.09 0.05 0.09 -0.17 Protected firm 0.03 <0.01 <0.01 <0.01 <0.01 <0.01 <0.01 0.12 0.04 -0.02 -0.00 0.04 -0.06 Politically connected
firm <0.01 <0.01 0.05 0.74 <0.01 <0.01 0.03 0.09 0.06 0.17 -0.12 Firm size 0.02 <0.01 <0.01 <0.01 <0.01 -0.01 0.15 0.18 0.02 Capital expenditure 0.34 <0.01 <0.01 0.05 -0.00 -0.26 0.00 Leverage 0.96 <0.01 0.84 0.20 -0.03 Sales growth <0.01 0.03 -0.05 Return on assets <0.01
a The p-values for the differences in means are based on t-test tests (parametric tests). b The p-values for the differences in medians are based on Wilcoxon tests (nonparametric tests). Variable definition: X-list = A dummy variable equal to 1 if the firm is cross-listed on overseas stock exchanges, and 0 otherwise. Protected firm = A dummy variable equal to 1 if the ultimate owner of the firm is the central government or
the firm is in a regulated industry (finance, natural resources, or public utilities), and 0 otherwise. Politically connected firm = A dummy variable equal to 1 if the Chairman or CEO was or is an ex- or current
officer of the central government, a local government, or the military; and 0 otherwise. Firm size = Natural logarithm of total assets in thousand US dollar. Capital expenditure = Expenditure to acquire fixed assets, divided by total assets. Leverage = Total debt divided by total owners’ equity. Sales growth = Growth in sales. Return on assets = Net income divided by total assets. Tradable industry = A dummy variable equal to 1 if the firm’s industry belongs to chemicals, consumer goods,
electronics, manufacturing, healthcare, mining, oil and gas, and paper (Sarkissian and Schill, 2004).

33
Table 4 The Association between Cross-listing Choices and Firm Characteristics. Models Regressing a Dummy Variable Indicating whether a Firm is Listed on Overseas Stock Exchanges on Political
Factors and Other variables. Logistic Regressions with p-values based on Robust Standard Errors Clustered by Firm
Model 1 Model 2 Model 3 Model 2 vs.
Model 3a X-list HK-list US-list HK vs. US
Coeff. Two-tailed p-values Coeff.
Two-tailed p-values Coeff.
Two-tailed p-values
Two-tailed p-values
Intercept -11.96 <0.01 -11.88 <0.01 -21.59 <0.01 Political factors Protected firm 0.62 0.01 0.60 0.02 1.81 0.05 0.20 Politically connected firm 0.85 <0.01 0.85 <0.01 -0.15 0.87 0.51 Economic factors Firm size 0.82 <0.01 0.81 <0.01 1.19 <0.01 <0.01 Capital expenditure -3.52 <0.01 -3.50 <0.01 3.35 0.02 <0.01 Leverage -0.44 <0.01 -0.43 <0.01 0.18 0.68 0.23 Sales growth 0.12 0.26 0.12 0.27 -1.21 0.10 0.05 Return on assets -3.09 <0.01 -3.25 <0.01 7.38 0.19 0.07 Tradable industry -0.56 0.02 -0.55 0.03 -0.34 0.61 0.75 Other variables Post_SOX -0.36 <0.01 -0.37 <0.01 -0.59 0.09 <0.01 Pseudo-R2 0.19 0.19 0.52 Firm-years with dep. var. =1 670 652 81
Total firm-years 7,030 7,030 7,030
aP-values for the differences in the coefficients between HK-list and US-list choices are based on a multivariate logistic regression model.
Variable definition: Post_SOX = A dummy variable equal to 1 for years subsequent to the passage of the 2002 Sarbanes-Oxley Act,
and 0 otherwise. See Table 3 for definition on other variables.

34
Table 5 Analysis of Bonding Mechanismsa
Panel A: Descriptive statistics on additional variables Variable Mean Std. dev. MedianLegal requirement (N=5,135 with 670 x-listed firms) Internationally-accepted accounting standards 0.07 0.25 0.00 Board independence 0.04 0.10 0.00 Law enforcement (N=7,030 with 670 x-listed firms) Enforcement action - by local regulators, local firms 0.01 0.11 0.00 - by local regulators, x-listed firms 0.01 0.08 0.00 - by overseas regulators, x-listed firms 0.00 0.05 0.00 Financial intermediaries (N=7,030 with 670 x-listed firms) Number of analysts following 0.53 2.95 0.00 Panel B: Bonding through legal requirement. Logistic regression when the dependent variable is the use of internationally-accepted accounting standards. OLS regressions when the dependent variable is board independence (N=5,135)
Internationally-accepted
accounting standards Board independence
Coeff. Two-tailed p-values Coeff.
Two-tailed p-values
Intercept -9.48 <0.01 -0.03 0.42 X-list 0.70 0.06 0.19 <0.01 Protected firm 0.23 0.49 0.00 0.97 Politically connected firm -0.08 0.79 -0.00 0.86 Firm size 0.49 0.01 0.00 0.20 Leverage 0.34 0.01 0.00 0.92 Sales growth -0.06 0.64 0.00 0.19 Year dummies yes yes Pseudo R2 /Adj.R2 0.10 0.43

35
Table 5, continued Panel C: Bonding through law enforcement. Logistic regression with the dependent variable being enforcement action (N=7,030)
Enforcement action
Coeff. Two-tailed p-values
Intercept -3.94 <0.01 X-list -0.53 0.21 Protected firm -0.14 0.54 Politically connected firm 0.24 0.28 Firm size 0.03 0.74 Leverage 0.08 0.55 Sales growth -1.04 <0.01 Year dummies yes Pseudo R2 0.04
Panel D: Bonding through financial intermediaries. OLS regression with the dependent variable being number of analysts following (N=7,030)
Number of analysts
following
Coeff. Two-tailed p-values
Intercept -9.52 <0.01 X-list 4.25 <0.01 Protected firm 0.25 0.10 Politically connected firm -0.07 0.69 Firm size 0.78 <0.01 Leverage -0.16 <0.01 Sales growth -0.02 0.71 Year dummies yes Adj.R2 0.36
a P-values based on robust standard errors clustered by firm. Variable definition: Internationally-accepted accounting standards = A dummy variable equal to 1 if financial statements
are based on IFRS or US GAAP. Board independence = Percentage of directors that is independent. Enforcement action = A dummy variable equal to 1 if a firm-year has an enforcement action against a
firm’s top executives for corruption from government agencies. Number of analysts following = The number of analysts making earnings forecasts for the firm-year. See Table 3 for definition on other variables.

36
Table 6 Analysis of Bonding Effects
Panel A: Descriptive statistics on additional variables Variable Mean Std. dev. MedianEarnings properties (N=6,895 with 550 x-listed firms) Small profits 0.14 0.35 0.00 Small losses 0.00 0.07 0.00 Magnitude of accruals 3.00 32.87 0.84 Board professionalism (N=5,135 with 670 x-listed firms) Average % serving industry association 0.05 0.11 0.00 Average % with banking experience 0.03 0.09 0.00 Average % with law/accounting experience 0.05 0.08 0.00 Investment efficiency (N=6,919 with 607 x-listed firms) lTobin’s q 2.46 1.35 2.11 Valuation premium, domestic shares (N=6,496 with 161 x-listed firms) Tobin’s q 2.35 1.97 1.32 Panel B: Earnings properties. Logistic regression when the dependent variable is small profits or small losses. OLS regressions when the dependent variable is magnitude of accruals (N=6,895) Small profits Small losses Magnitude of accruals
Coeff. Two-tailed p-values Coeff.
Two-tailed p-values Coeff.
Two-tailed p-values
Intercept -0.84 0.25 -3.49 0.04 6.09 0.09 X-list -0.55 0.02 1.80 <0.01 0.11 0.91 Protected firm -0.16 0.14 0.18 0.63 0.03 0.97 Politically connected firm -0.18 0.12 0.49 0.17 -1.02 0.09 Firm size -0.04 0.48 -0.20 0.13 -0.20 0.49 Leverage 0.25 <0.01 0.31 0.06 -0.39 0.20 Sales growth -0.45 <0.01 -0.02 0.97 -0.84 <0.01 Year dummies yes yes yes Pseudo R2 /Adj.R2 0.04 0.11 0.00
Panel C: Board professionalism. OLS regressions with the dependent variable being percentage of board members serving industry association, or with banking or law/accounting experience (N=5,135) Industry association Banking experience Law/accounting experience
Coeff. Two-tailed p-values Coeff.
Two-tailed p-values Coeff.
Two-tailed p-values
Intercept 0.04 0.41 -0.09 0.17 -0.03 0.52 X-list 0.15 <0.01 0.08 <0.01 0.10 <0.01 Protected firm 0.01 0.08 0.01 0.35 -0.01 0.14 Politically connected firm -0.01 0.08 0.00 0.59 0.00 0.63 Firm size 0.00 0.97 0.01 0.10 0.00 0.11 Leverage 0.00 0.47 -0.00 0.99 -0.00 0.28 Sales growth 0.01 0.08 -0.00 0.89 0.00 0.82 Year dummies yes yes yes Adj.R2 0.22 0.14 0.21

37
Table 6, continued Panel D: Investment efficiency. OLS regressions with the dependent variable being capital expenditure (N=6,919) Capital expenditure
Coeff. Two-tailed p-values
Intercept -0.07 <0.01 X-list*lTobin’s q 0.02 0.02 lTobin’s q 0.01 <0.01 X-list -0.06 <0.01 Protected firm 0.01 0.16 Politically connected firm 0.01 <0.01 Firm size 0.01 <0.01 Leverage 0.00 0.97 Year dummies yes Adj.R2 0.04
Panel E: Analysis of valuation premium based on stock prices of A shares. OLS regressions with the dependent variable being Tobin’s q (N=6,496) Tobin’s q
Coeff. Two-tailed p-values
Intercept 8.77 <0.01 X-list 0.62 <0.01 Protected firm 0.23 <0.01 Politically connected firm -0.07 0.17 Firm size -0.59 <0.01 Leverage -0.11 <0.01 Sales growth 0.13 <0.01 Year dummies yes Adj.R2 0.48
a P-values based on robust standard errors clustered by firm. Variable definition: Small profits = A dummy variable equal to 1 if net income scaled by total assets is between 0 and 0.01. Small losses = A dummy variable equal to 1 if net income scaled by total assets is between -0.01 and 0. Magnitude of accruals = |Acc/OCF|, magnitude of accruals divided by operating cash flows. lTobin’s q = Lagged value of Tobin’s q, which equals the sum of market value of equity and book value
of liabilities divided by total assets. See Table 3 for definition on other variables.

38
Table 7 Analysis after Replacing the Cross-listing Dummy Variable with Proxies Capturing
Bonding Mechanisms a Panel A: Earnings properties. OLS regressions with the dependent variable being the earnings management index Coeff. Two-tailed p-values Intercept 0.18 0.07 Bonding mechanisms Internationally-accepted accounting standards 0.06 0.10 Board independence -0.19 0.01 Number of analysts following -0.00 0.06 Other factors Protected firm -0.02 0.24 Politically connected firm -0.02 0.14 Firm size 0.00 0.92 Leverage 0.03 <0.01 Sales growth -0.06 <0.01 Year dummies yes Adj.R2 0.04 N 5,135
Panel B: Board professionalism. OLS regressions with the dependent variable being the board professionalism index Coeff. Two-tailed p-values Intercept -0.06 0.57 Bonding mechanisms Internationally-accepted accounting standards 0.01 0.68 Board independence 0.99 <0.01 Number of analysts following 0.01 0.01 Other factors Protected firm 0.02 0.18 Politically connected firm -0.00 0.98 Firm size 0.01 0.15 Leverage -0.01 0.31 Sales growth 0.00 0.48 Year dummies yes Adj.R2 0.35 N 5,135

39
Table 7, continued Panel C: Investment efficiency. OLS regressions with the dependent variable being capital expenditure Coeff. Two-tailed p-values Intercept -0.11 <0.01 Bonding mechanisms Internationally-accepted accounting standards* lTobin’s q -0.02 <0.01 Board independence* lTobin’s q 0.07 0.03 Number of analysts following* lTobin’s q 0.00 0.04 Other factors lTobin’s q 0.01 <0.01 Internationally-accepted accounting standards 0.01 0.53 Board independence -0.12 <0.01 Number of analysts following -0.00 0.03 Protected firm 0.00 0.71 Politically connected firm 0.01 0.21 Firm size 0.01 <0.01 Leverage 0.00 0.13 Year dummies yes Adj.R2 0.06 N 5,026
Panel D: Valuation premium. OLS regressions with the dependent variable being Tobin’s q Coeff. Two-tailed p-values Intercept 8.87 <0.01 Bonding mechanisms Internationally-accepted accounting standards 0.74 <0.01 Board independence -0.29 0.31 Number of analysts following 0.32 <0.01 Other factors Protected firm 0.28 <0.01 Politically connected firm -0.01 0.85 Firm size -0.61 <0.01 Leverage -0.11 0.01 Sales growth 0.16 <0.01 Year dummies yes Adj.R2 0.51 N 4,409
a P-values based on robust standard errors clustered by firm. Variable definition: Earnings management index= An index equal to 1 if net income scaled by total assets is between 0
and 0.01, equal to -1 if net income scaled by total assets is between -0.01 and 0, and zero otherwise. Board professionalism index= Sum of the percentage of board members serving industry associations,
with banking experience, or with law/accounting experience. See Tables 3, 5, and 6 for definition on other variables.