political machinery: automation anxiety and the … machinery: automation anxiety and the 2016 u.s....
TRANSCRIPT

Political Machinery: Automation Anxiety and the 2016U.S. Presidential Election∗
Carl Benedikt Frey Thor Berger Chinchih Chen
July 23, 2017
Abstract
Was the 2016 U.S. Presidential Election a riot against machines by democratic means? Through-
out history, technological breakthroughs have created new prospects of comfort and prosperity for
mankind at large but it has equally left plenty to “vegetate in the backwaters of the stream of progress.”
During the days of the British Industrial Revolution a sizable share of the workforce was left worse off
by almost any measure. The result was a series of riots against machines. In similar fashion, the Com-
puter Revolution has caused many workers in middle-income routine jobs to shift into low-income
jobs or non-employment. Against this background, we examine if groups in the labor market that have
lost to technological change are more likely to opt for radical political change. Pitching automation
against a host of alternative explanation—including workers exposure to globalization, immigration,
manufacturing decline, etc.—we find robust evidence of a relationship between electoral districts ex-
posure to automation and their share of voters supporting Donald Trump in the 2016 Presidential
Election. Additional estimates suggest that the support was particularly high in areas characterized by
low-educated males in routine jobs. These findings speak to the general perception that low-skilled
male workers in routine jobs have been the prime victims of the Computer Revolution, leading them
to rage against machines.
JEL: J23, J24, J31, N60, O14,Keywords: industrial revolution, labor markets, technological change, political economy
∗Berger: Department of Economic History, School of Economics and Management, Lund University & Oxford Mar-tin School, University of Oxford. (E-mail: [email protected]) Chen: Oxford Martin School, University of Ox-ford. (E-mail: [email protected]) Frey: Oxford Martin School, University of Oxford. (E-mail:[email protected]). Chen and Frey gratefully acknowledges funding from Citi. We are grateful to RobertAllen for kindly sharing his data.
1

1 Introduction
Was the outcome of the 2016 U.S. Presidential Election shaped by a growing automation anxiety? Ac-cording to a recent poll of unemployed American’s between the ages of twenty-five and fifty-four, 37percent stated automation as one of the prime reasons of their misfortunes (Hamel et al., 2014). Thecauses of the populist backlash in America and Europe are far from conclusive, yet parallels have beendrawn with the machinery riots of the British Industrial Revolution, when “Luddites” smashed powerlooms in fear of losing their jobs. A post-election article in The Wall Street Journal featuring the head-line “Trump’s focus on jobs, globalization and immigration tapped anxiety about technological change,”speaks to the frequent belief that automation was the real cause of voters economic concerns. Despitesuch beliefs, empirical efforts to examine the extent to which automation anxiety determined the outcomeof the U.S. Presidential Election have remained scant. What is clear is that the vote for Donald Trumpwas a vote against the status quo: according to the Exit Polls, 82 percent of voters believed that Trumpwould perform best in bringing about change, while the corresponding figure for Hillary Clinton was 14percent.
This paper examines the link between workers exposure to automation and voting patterns in the2016 U.S. Presidential Election through the lens of economic history. Our analysis builds on two setsof observations. First, job automation is rarely a Pareto improvement: since the Computer Revolutionof the 1980s, automation has left a sizable fraction of the workforce worse off. The sharp reduction inmiddle-income jobs in the U.S. economy cannot be explained without reference to the disappearanceof “routine jobs”—i.e., occupations mainly consisting of tasks following well-defined procedures thatcan easily be automated (Autor et al., 2003; Acemoglu and Autor, 2011). As traditional middle-incomejobs have dried up, many workers have shifted into low-income service occupations (Autor and Dorn,2013), while others have dropped out of the workforce altogether (Cortes et al., 2016a). Meanwhile, thefalling price of computing has increased the demand for skilled workers performing non-routine cognitivetasks, leading to an expansion of high-income jobs (Katz and Murphy, 1992; Acemoglu, 2002; Autor andDorn, 2013). The title Lousy and Lovely Jobs, of work by Goos and Manning (2007), thus captures thelabor market consequences of the Computer Revolution in America and elsewhere, where labor marketpolarization has created both winners and losers, as employment has shifted towards the top and bottomtails of the occupational wage distribution.
Second, the economics of automation cannot be separated from its politics. (As shown by Figure1, economic and political polarization in America has gone hand in hand; and the link has seeminglygrown stronger since the age of computers.) For ordinary workers, their skills constitute their capital;it is from their human capital that they derive their subsistence. Because automation is accompanied bycreative destruction in employment, which often comes with social costs—including vanishing incomes,forced migration, skill obsolescence, and episodes of unemployment—it threatens not only the incomesof incumbent producers but also the power of incumbent political leaders (Acemoglu and Robinson,2013). The reason is simple: if workers that have lost out to automation do not accept labor market
2

.2.3
.4.5
.6T
op
10
% I
nco
me
Sh
are
.2.5
.81
.11
.4P
ola
riza
tio
n o
f th
e C
on
gre
ssio
na
l P
art
ies
1920 1930 1940 1950 1960 1970 1980 1990 2000 2010
House Senate Top 10% Income Share
Notes: This figure shows the polarization of the U.S. House and Senate based on data on the distancebetween the parties on the first (liberal-conservative) dimension from Vote View (https://voteview.com)and the share of national income accruing to the top 10% obtained from the World Wealth & IncomeDatabase (http://wid.world/).
Figure 1: Income Inequality and the Polarization of the Congressional Parties.
3

55
60
65
70
Vote
s for
Tru
mp (
%)
40 45 50 55Routine jobs (%)
Notes: This figure shows the positive relationship between the share that voted for Trump in the 2016 PresidentialElection across 3,108 counties reported in the Atlas of the U.S. Presidential Election and the share of routine jobsin each county’s corresponding local labor market. We sort all observations into 25 equally sized groups with eachcircle corresponding to the mean value in each group, while the line corresponds to a fitted OLS regression basedon the underlying data.
Figure 2: Automation exposure and the support for Trump.
outcomes, they will resist the force of technology through non-market mechanisms, such as politicalactivism (Mokyr, 1990, 1998; Mokyr et al., 2015). The British Industrial Revolution provides a casein point. The downfall of the domestic system—which was gradually displaced by the mechanizedfactory—inflicted substantial social costs on workers, leading them to rage against the machines thatpioneers of industry marveled about: the 1779 riots in Lancashire and the Luddite risings of 1811 to1813, are only two of many attempts to bring the spread of machines to halt (Mantoux, 2013). Otheroptions of restricting automation were limited to the workers who feared losing their jobs. Even withthe Reform Acts of 1832 and 1867, property ownership remained a requirement for voting, meaningthat most Britons were politically disenfranchised. Although the Industrial Revolution began with thearrival of the factory, it came to a close not just with the construction of the railroads but also with thepublication of the Communist Manifesto—while the accelerating pace of technological progress pavedthe way to modernity, it also bred many political revolutionaries along the way.
Against this background, we ask the question: was the outcome of the 2016 U.S. Presidential Electionshaped by a growing automation anxiety? Figure 2 provides a first glance of our key finding, documentingthe positive relationship between the support for Trump and workers exposure to automation across U.S.counties. We show that this relationship holds also when controlling for a range of other economicfactors such as educational levels, exposure to trade competition, and manufacturing employment, aswell as differences in the age and ethnic composition of voters across electoral districts. Examining
4

differences in votes cast in the 2012 and the 2016 elections as well as differences in exposure within
states serves to show that similar patterns are also evident when factoring out historical divisions alongparty lines. Additional results that examine differences in the types of workers employed in routine jobsshow that the support for Trump mainly accrued from areas with a large share of low-educated males.These findings lend support to the general perception that low-skilled men have been the prime victimsof automation and are thus more likely to opt for radical political change.1
The remainder of this paper is structured as follows. We begin by discussing the political economy ofautomation, showing that economic history has not been a long tale of progress. Despite the technologicalwonders of the British Industrial Revolution, the first three generations did not experience its benefits.The absence of better paid jobs as the mechanized factory displaced the domestic system led workers toriot against the spread of machinery. In similar fashion, we show that a sizable share of the Americanworkforce has been left worse off in economic terms as a result of the Computer Revolution. Lastly,examine the political implications of the Computer Revolution in terms of its impacts on the outcome ofthe U.S. 2016 Presidential Election.
2 The Political Economy of Automation
Why have economic models failed to incorporate the resistance to new technology? One reason is thatstandard neoclassical theory typically treats automation as a Pareto improvement: in the event that work-ers are displaced by machines, new and better paid jobs become available for everyone. The irrelevanceof such models is evident from the historical record: technological change has always been accompaniedby what the great economist Joseph Schumpeter famously termed “creative destruction”. As new tech-nologies displace old ones, they also render the skills of parts of the workforce obsolete. This dilemma isprominently featured in James Joyce colorful novel Ulysses (1922), in which Leopold Bloom takes noteof the disruptive force of technology:
“A pointsman’s back straightened itself upright suddenly against a tramway standard by Mr.Bloom’s window. Couldn’t they invent something automatic so that the wheel itself muchhandier? Well but that fellow would lose his job then? Well but then another fellow wouldget a job making the new invention?”2
Bloom’s observation goes to the heart of creative destruction: as automation makes the jobs of someworkers redundant, it also creates new employment opportunities, but for a different breed of worker. Thesurge in child labor that accompanied the spread of the factory system during the early days of the BritishIndustrial Revolution bears witness to this view: the machines of the first factories were made simple
1As documented by Cortes et al. (2016a), for example, advances in automation has caused especially low-skilled youngand prime-aged men to leave routine occupations and shift into non-employment and low-income non-routine jobs.
2Cited in Akst (2013).
5

enough to be tended by children.3 As many of the old artisan skills were made obsolete by advances inmechanization, adult male workers lost out: the share of children rapidly expanded and reached about halfof the workforce employed in textiles during the 1830s (Tuttle, 1999). As noted by Andrew Ure (1835):“even in the present day [. . . ] it is found to be nearly impossible to convert persons past the age of puberty,whether drawn from rural or handicraft occupations, into useful factory hands.”4 In similar fashion, sincethe beginnings of the age of computers, machines have replaced repetitive assembly workers, machineoperatives, secretaries, paralegals and workers doing repetitive costumer service (Autor et al., 2003).Meanwhile, entirely new tasks have emerged, creating demand for a different set of skills, like those ofaudio-visual specialists, software engineers, database administrators, and computer support specialists(Berger and Frey, 2016). Consequently, workers without a college education, who have seen their jobsbeing automated away, have shifted into low-income jobs or non-employment (Cortes et al., 2016a).
This process of creative destruction, upon which long-run growth ultimately rests, has always createdboth winners and losers in the labor market. Because creative destruction comes with social costs—assome workers see their incomes disappear, are forced to migrate, and may experience episodes of unem-ployment—it is not unlikely to lead to social unrest, in turn threatening the power of incumbent politicalleaders. Thus, because resistance to new technology takes place outside the market, the economics andpolitics of automation are intimately connected. As forcefully argued by Mokyr (1998):
“Any change in technology leads almost inevitably to an improvement in the welfare of someand a deterioration in that of others. To be sure, it is possible to think of changes in productiontechnology that are Pareto superior, but in practice such occurrences are extremely rare.Unless all individuals accept the verdict of the market outcome, the decision whether toadopt an innovation is likely to be resisted by losers through non-market mechanism andpolitical activism.”
Ultimately, however, the extent of resistance to automation depends on how its benefits are being shared.During the twentieth century, railroad telegraphers, telephone operators, and longshoremen, all lost theirjobs to automation. Yet, the continued expansion of manufacturing and rising educational attainment inAmerica allowed most workers to switch into better paid jobs: the share of national income accruing tothe “middling sort” increased up until the 1970s (Lindert and Williamson, 2016; Gordon, 2016). Thisperiod, referred to by economists as the “great compression”, witnessed rapid advances in automationthat made the vast majority of workers better off, prompting President Kennedy to note that “a risingtide lifts all the boats.” All the same, there is no assurance that workers who see their jobs disappear willfind new and better paid employment opportunities. During times when a greater share of the workforceloses out to automation, it naturally follows that resistance to new technology will be more vehement.Figure 3 documents two such episodes: the British Industrial Revolution and the Computer Revolution in
3With the aid of machines, spinning was quickly learned and needed little strength: early spinning machines were simpleand smaller in size, making them perfectly suitable to be tended by children.
4Cited in Mokyr (2009).
6

70
80
90
100
110
0 20 40 60 80 100Year
A) Labor share
80
100
120
140
160
0 20 40 60 80 100Year
B) Real wages
United Kingdom (1780−) United States (1980−)
Notes: This figure shows the labor share of national income (panel A) and the trajectories of real wages(panel B) in the United Kingdom between 1780-1880 and in the United States between 1980-2015).U.S. real wages are calculated from BLS average weekly earnings of production and nonsupervisoryemployees deflated with a CPI index and labor share data based on the BLS labor share index. U.K. realwage and labor share data is taken from Allen (2009).
Figure 3: A tale of two industrial revolutions.
America. During the first six decades of the Industrial Revolution ordinary Englishmen did not see anyof the benefits from automation: as output expanded, real wages stagnated, leading to a sharp decline inthe share of national income accruing to labor. The trajectories of the American economy over the fourdecades following the Computer Revolution almost exactly mirror the first four decades of the IndustrialRevolution in Britain.
2.1 The Rise of the Luddites: Evidence from the British Industrial Revolution
The British Industrial Revolution was the defining episode that made technology the chief engine ofeconomic growth and eventually allowed mankind to escape the life that Thomas Hobbes described as“nasty, brutish, and short.” Eventually was nonetheless a long time. Between 1780 and 1840—the classic
period of the Industrial Revolution—the lives of ordinary workers got nastier, more brutish, and shorter.
7

The standard of living debate surrounding the Industrial Revolution will probably never settle for good,but the optimists have an increasingly difficult case to make as empirical evidence continues to accu-mulate.5 Almost by any measure, material standards and living conditions for the common Englishmandid not improve before 1840. Output expanded, yet the gains from growth did not trickle down to thevast majority of the population. The best estimates suggest that while output per worker increased by 46percent over the classic period (Crafts and Harley, 1992), real wages rose by a mere 14 percent (Fein-stein, 1998).6 Meanwhile, working hours increased by 20 percent (Voth, 2000), suggesting that hourlywages even declined in real terms.7 The main beneficiaries were industrialists who saw the profit shareof income double (Allen, 2009). The view of Friedrich Engels (1845), that industrialists “grow rich onthe misery of the mass of wage earners”, was thus largely accurate for the period he observed: as wagesdeclined and the profit share of national income doubled, the income share accruing to the top 5 percentin Britain almost doubled as well (Lindert, 2000).
Why did living standards during the days of the Industrial Revolution falter? As argued by Allen(2016), the issue of faltering standards of living was the result of the destruction of hand loom weavingand other manual trades. The displacement of the domestic system by the mechanized factory inflictedsubstantial pains on the workers that felt the force of the factory. The observation of Baines (1835), thathandloom weavers were in “deplorable condition”, cannot be explained without reference to the rise ofpower loom weaving. Comparing the wages of weavers to occupations left unaffected by technologicalchange, Allen (2016) has shown that poverty accompanies progress as the incomes of hand loom weaverscollapsed in response to the spread of the power loom. Not only did wage inequality grow rapidly; theearnings potential of weavers was reduced to barebones subsistence.
Where did workers who lost their jobs to the force of the factory end up? While we lack individual-level data to trace their fates, recent empirical evidence from Northamptonshire is illustrative (Shaw-Taylor and Jones, 2010). As factory mechanization in Britain left the local worsted cloth industry unableto compete, it flooded the agricultural labor market with former weavers for many decades. The workersthat shifted into agricultural jobs were left significantly worse off: the wages of agricultural laborers in
5Economic historians have made many attempts at measuring long-run trends in real wages during this period. The firstlandmark study was that of Lindert and Williamson (1983), showing that real wages in Britain increased already after theBattle of Waterloo (1815). Their findings were always controversial, however, especially since they did not concur withfindings about patterns of consumption and biological indicators of living standards. In fact, biological indicators suggest thatoverall material standards if anything declined: Floud et al. (1990) and Komlos (1998) show somewhat different temporalpatterns, but both find that men in 1850 were shorter than they had been in 1760. This finding is consistent with data on percapital calorie consumption, which was lower in 1850 relative to 1800 (Allen, 2005). Beyond food consumption, the share ofhouseholds with a surplus for non-essentials declined among low wage agricultural laborers and factory workers over the firsthalf of the nineteenth century (Horrell, 1996). New real wage series reflect these trends: based on an updated cost of livingindex, Feinstein (1998) largely confirmed what we know from patterns of consumption and biological indicators, showing thatreal wages were stagnant before 1840. Recently, however, Clark (2005) has developed a new price index. Although Clark’s(2005) estimates shows that real wages did not improve beyond their mid-eighteenth century level until the 1820s, they aremore optimistic than those of Feinstein (1998). All the same, reconciling the differences in the two price indexes, Allen (2009)largely confirms Feinstein’s (1998) picture of real wage trends up until 1860.
6The real wage index even fell from its base of 100 in 1780 to 84.9 in 1800, just before the outbreak of the NapoleonicWars, and only increased slightly thereafter.
7Voth (2000) documents the increase in working hours for the period 1760 to 1830.
8

Britain were just around twice of barebones subsistence, and significantly lower than those of weaversbefore their incomes collapsed due to mechanization (Allen, 2016). The flood of ex-weavers could notpossibly have been absorbed by the agricultural sector, suggesting that many were left unemployed sincethe industrial sector did not grow at a sufficient pace to replace the jobs lost in weaving (Shaw-Taylor andJones, 2010). The benefits of the Industrial Revolution in Northamptonshire was only felt generationsafter weaving had collapsed, as was also the case in Britain in general.
From an economics point of view, the faltering standards of living during the classic period of theIndustrial Revolution represent something of a dilemma: why would workers voluntarily agree to partic-ipate in the industrialization process if it reduced their utility? Yet, this is only a puzzle in the absence ofcoercion. Coercion was however far from absent. Clashes between workers and the British governmentover the adoption of machines were frequent. On May 10th in 1768, the first steam-powered sawmill inLimehouse was burned to the ground by sawyers claiming that it had deprived them of employment; in1772, a factory using Cartwright’s power loom in Manchester was similarly burnt down; and the riotsof 1779 in Lancashire, where machines had diffused most rapidly, were no less severe than previousepisodes.8 Workers rioted against the increasingly mechanized factory, but efforts to bring the spreadof machines to halt were unsuccessful as the British government took an increasingly stern view on anyattempts to hinder industrial and technological development, which it deemed critical to Britain’s com-petitive position in trade (Mokyr, 1990; Caprettini and Voth, 2017; Mantoux, 2013; Berg, 1982). Duringthe Luddite risings of 1811 to 1813, rioters achieved nothing more than their predecessors, except forcingthe British government to deploy an even larger army: the 12,000 troops sent to resolve the situation ex-ceeded the size of the army which Wellington took into the Peninsula War against Napoleon in 1808. Asargued by Mantoux (2013): “Whether their resistance was instinctive or considered, peaceful or violent,it obviously had no chance of success, as the whole trend of events was against it.”
2.2 Men Without Work: The Victims of the Computer Revolution
Like in the early days of the Industrial Revolution, growth has failed to trickle down to ordinary Amer-icans since the age of computers began in the early 1980s. Over the period 1979 to 2013, productivitygrowth was eight times faster than hourly compensation: as productivity grew by 64.9 percent, hourlycompensation for 80 percent of the American workforce grew only by 8.2 percent, while the top 1 percentof earners saw cumulative gains in annual wages of 153.6 percent (Bivens et al., 2014). Wages of the vastmajority of Americans thus stagnated or even declined. With the exception of a brief period in the late1990s, the wages of middle-income workers were either flat or in decline, while the wages of low-wageworkers fell by 5 percent. The greatest reversal of fortunes has taken place since the turn of the 21stcentury: between 2000 and 2013, hourly wages fell for the bottom 30 percent and were flat for the next
8Moreover, using newly-compiled data on the diffusion of threshing machines, Caprettini and Voth (2017) show that labor-saving technology was the key determinant of the probability of unrest during the “Captain Swing” riots of the 1830s. Wheremachines were adopted, the probability of riots was around 50 percent higher: machines themselves were the key cause oftheir concerns.
9

40 percent (Bivens et al., 2014). Like during the classic years of the Industrial Revolution, most growthhas accrued to owners of capital; the labor share of income in America fluctuated around 64 percentduring the postwar period, but has trended downward since the 1980s, reaching its lowest postwar levelafter the Great Recession, and is now averaging 6 percentage points below the level that prevailed duringthe first four decades of the postwar period (see Figure 3). Thus, a large segment of the workforce havebecome detached from the engine of growth. According to estimates by Summers (2015), the incomedistribution of 1979 would leave today’s top 1 percent with a $1 trillion less in annual income, whileadding on average $11,000 a year for a family in the bottom 80 percent.
Although the causes of this detachment are still being debated, a growing body of work has iden-tified automation as one of the prime forces driving the shifts in income shares along the occupationalwage distribution (Autor et al., 2003, 2006; Autor and Dorn, 2013; Graetz and Michaels, 2015; Michaelset al., 2014; David, 2015), and from labor and owners of capital (Karabarbounis and Neiman, 2013),downplaying alternative—albeit complementary—explanations emphasizing the role of globalization,immigration, deunionization, and manufacturing decline. Across geographies and industries, the trillion-fold secular decline in the price of computing (Nordhaus, 2007), has caused a sharp reduction in thedemand for routine jobs, such as those of machine operators, assembly workers, bookkeepers, paralegals,and secretaries (see Figure 4). In recent years, this process has speeded up: while the disappearance ofper capita employment in routine occupations has been a key feature of the U.S. labor market since the1980s, it has not been a gradual phenomenon. Most routine employment loss has happened during eco-nomic downturns and has more recently been accelerated by the Great Recession. Though employmentin high- and low-skill occupations has rebounded since 2009, the recovery for middle-income routineemployment has been jobless. Jobless recoveries were not observed in routine occupations prior to theage of computers, suggesting that joblessness has been driven by technology (Jaimovich and Siu, 2012).
Where have workers who lost their jobs to automation reallocated? An emerging literature suggeststhat advances in automation has caused workers to transition into either non-employment or non-routinemanual jobs (Cortes et al., 2016a). In tandem with routine jobs disappearing, Autor and Dorn (2013)document a structural shift in the labor market, with workers reallocating their labor supply to low-incomeservice occupations. Arguably, this is because the manual tasks of service occupations are less susceptibleto computerisation, as they require a higher degree of flexibility and physical adaptability (Acemogluand Autor; Autor et al.; Goos and Manning; Goos et al.; Goos et al.). Deteriorating median wages aredirectly linked to such shifts: routine occupations (e.g., machine operators, secretaries and administrativeassistants) tend to occupy the middle of the wage distribution, whereas manual non-routine occupations(e.g., janitors and building cleaners, personal and home care aides) cluster at the bottom (Autor and Dorn,2013; Goos and Manning, 2007).
In particular, the decline in routine employment has been driven by a declining propensity for low-skilled prime-aged in routine physical occupations and the decline of prime-aged women with interme-diate levels of education in routine cognitive occupations. As shown by Cortes et al. (2016a), these samegroups account for a substantial fraction of both the increase in non-employment and employment in
10

40
45
50
55
60
65
70
Routine jobs (
%)
1960
1970
1980
1990
2000
2010
2015
Notes: This figure shows the share of routine jobs in total US employment between 1960 and 2015 basedon data drawn from the IPUMS and ACS samples. Routine jobs are defined as in Jaimovich and Siu(2012) and are described in more detail in the main text.
Figure 4: Routine jobs in the United States, 1960-2015.
low-wage, non-routine manual occupations observed during the same time period. More direct evidenceof advances in automation leading to non-employment has recently been provided by Acemoglu and Re-strepo (2017), documenting a robust negative effects of robots on employment and wages. Yet, whilerobots affected both men’s and women’s jobs, the effect on male employment was up to twice as big.Greenstone and Looney (2011) further calculate that the median earnings of prime-aged men have fallenby 28 percent in real terms over the past four decades, while for those without a high school diploma, thedrop was 66 percent. According to Eberstadt (2016) timely book Men Without Work, 24 percent of menbetween twenty-five and fifty-four will be out of work by 2050 at current trend.
Moreover, the decoupling of average and median real wages can in part be explained by falling pricesof computing, contributing the substantial employment growth in occupations involving cognitive taskswhere skilled labor has a comparative advantage, as well as the persistent increase in returns to educa-tion (Katz and Murphy, 1992; Acemoglu, 2002; Autor and Dorn, 2013). While college educated menhave fared much better relative to their low-skilled counterparts, by shifting into high-income cognitiveoccupations, improvements in labor market outcomes were not experienced equally by both genders.Despite the rapid growth in employment in high-income cognitive occupations, the probability that acollege-educated male was employed in one of these jobs has fallen since the age of computers (Corteset al., 2016b). The relative prominence of college-educated women in such jobs can be explained by anincrease in the demand for social skills in such occupations, where the psychology and neuroscience lit-eratures that indicate that women have a comparative advantage. Thus, in short, the prime victims of theComputer Revolution have been low-skilled men in routine jobs; the winners has been college educated
11

020
40
60
80
Perc
ent of re
spondents
Discr
iminat
ion
Family
resp
onsibilities
Hea
lth p
roblem
s or
disab
ility
Jobs
being
replac
ed b
y te
chno
logy
Jobs
going
ove
rsea
s
Lack
of e
duca
tion
or skill
Lack
of g
ood
jobs
ava
ilable
You d
on?t
nee
d th
e inco
me
Notes: Each bar corresponds to the percent of respondents that are unemployed but able to work who state thateach factor is a major or minor reason why they are not working based on Hamel, Firth, and Brodie (2014).
Figure 5: Why are Americans out of work?
women.
2.3 The New Machinery Riots: Did the Computer Revolution Shape the Out-come of the 2016 U.S. Presidential Election?
Was the outcome of the 2016 U.S. Presidential Election driven by parts of the electorate more exposedto automation? Of course, Trump did not make any pledge to bring technological progress to halt duringhis election campaign. In fact, he barely mentioned technology at all. His pledge to bring back jobs inmining and manufacturing, which have long been automated away, bears with it an implicit promise torestrict automation although few voters will have noted this logic. All the same, it remains indisputablethat Trump represented a challenge to the political status quo; fully 82 percent of voters believed thatTrump was the candidate for change according to the Exit Polls.
Although many voters are unlikely to have recognized the true causes of their concerns, automationprominently features as one of the prime reasons American’s identify behind their struggle to find work(see Figure 5). While identifying the workers that have lost out to automation is empirically challenging,it is evident from a series of studies that workers employed in routine occupations have been most ex-posed to automation (Autor et al.; Acemoglu and Autor; Autor and Dorn; Goos and Manning; Goos et al.;Goos et al.; Jaimovich and Siu). Building on the intuition that these workers are more likely to opt forradical change, we explore the relationship between the support for Trump and the share of routine jobsacross electoral districts. Doing so, we take advantage of the variation in the exposure of the workforceto automation across locations. A growing body of work shows that U.S. cities have fared very differ-
12

ently from automation in the past: since the Computer Revolution of the 1980s, human capital abundantareas have created new jobs for software engineers, computer support specialists, data administrators andanalysts, etc. (Lin, 2011; Berger and Frey, 2016, 2017), while locations with a greater share of routineemployment have seen jobs being automated away (Autor and Dorn, 2013).
To examine the link between workers exposure to automation and the propensity of voters to optfor Trump, we match county-level data on the distribution of votes from the 2016 Presidential Elec-tion—using Dave Leip’s Atlas of U.S. Presidential Elections—with their corresponding local labor mar-ket, as defined by Autor and Dorn (2013). This approach yields voting patterns for a total of 3,108counties and the employment structure of the corresponding 722 local labor markets—which we refer toas “Commuting Zones (CZs)”—that cover the U.S. mainland. For each CZs, we draw on individual-leveldata from the 2015 American Community Survey (ACS) that provide a 1 percent sample of the U.S.population to identify the share of the labor force employed in routine jobs.9 Routine jobs are definedfollowing the approach in Jaimovich and Siu (2012), where jobs in Sales, Office/Administration staff,Production/Craft/Repair, Operators/Fabricators/Labours are classified as routine, which aligns with theoccupational groups identified in Autor and Dorn (2013).10 Throughout our analysis the central variableis the share of a CZs labor force that is employed in routine occupations in 2015, which we decomposeinto demographic subgroups in some specifications.
As shown in Figure 2, there is a positive relationship between the support for Trump in the 2016 elec-tion and the degree of specialization in routine work across the United States. Although this correlationis highly suggestive, we next proceed to analyze the persistence of this relationship when controlling fora variety of factors. Our specifications match the share of Republican two-party vote at the county-levelto economic conditions in CZs:
Vczs = αs +δRJz + γXz + ecs, (1)
where the outcome variable Vcs is Trump’s share of the total votes in the 2016 election in county c, in CZz, located in state s. The variable of interest is the share of employment of routine occupations RJz. Xz is avector of CZ-level control variables including a variety of demographic and labor market characteristicsbased on information provided in the ACS samples. Additional estimates also include state fixed effects(αs) to examine whether a link between support for Trump and the share employed in routine jobs alsoexist when factoring out traditional state-level divisions along party lines. All regressions are weightedby their total number of votes in the 2016 Presidential Election and standard errors are clustered at theCZ-level throughout.
Table 1 presents a variety of estimates based on equation (1). As shown in column 1, the share ofroutine employment alone has considerable explanatory power, accounting for more than a third of the
9To match the voting age restriction, we restrict our samples to workers aged between 18 and 64, excluding unpaid familyworkers and workers living in institutions.
10Jaimovich and Siu (2012)provide details comparing different definitions of routine occupations in their Appendix B.1showing that their definition is identical to the occupation groups which are derived from Autor and Dorn (2013).
13

(1) (2) (3) (4) (5) (6) (7)
% routine jobs 2.106*** 1.495*** 1.169*** 0.576*** 0.150** 0.554*** 0.587***(0.127) (0.222) (0.172) (0.146) (0.061) (0.157) (0.154)
% low-educated in routine jobs -0.106 -0.079(0.207) (0.207)
% low-educated men in routine jobs 0.377***(0.130)
Labor market controls No Yes Yes Yes Yes Yes YesDemographic controls No No Yes Yes Yes Yes YesState FE No No No Yes Yes Yes YesObservations 3,108 3,108 3,108 3,108 3,108 3,108 3,108R-squared 0.366 0.414 0.513 0.567 0.642 0.567 0.568
Notes: This table presents OLS estimates of equation (1) in the main text. The outcome in all columns expectcolumn 5 is the percentage share of votes for Trump in the 2016 Presidential Election. In column 5, the outcome isthe difference between the percentage of votes for Trump and the percentage of votes cast for Mitt Romney in the2012 Presidential Election. Additional controls are described in more detail in the main text. Statistical significancebased on standard errors clustered at the CZ-level is denoted by: *** p<0.01, ** p<0.05, * p<0.10.
Table 1: Routine jobs and the support for Trump: OLS estimates.
variation in support for Trump. Moreover, an increase in a CZs share of routine jobs is associated with aconsiderable increase in the support for Trump: a 5 percentage point increase in the share of routine jobs(roughly one standard deviation) is associated with an increase in the share voting for Trump in 2016by roughly 10 percentage points. Of course, this relationship may reflect the fact that the distribution ofroutine employment is likely correlated with a variety of factors that may drive the relationship docu-mented in column 1: CZs that specialize in routine occupations, for example, also typically exhibit lowereducational attainment, more manufacturing jobs, and are more likely to be rural.
To account for these potentially omitted variables, column 2 adds a set of labor market controls,including the share of the population with a college degree, the share that is unemployed, the manufac-turing employment share, the exposure of the workforce to Chinese imports—as defined in Autor et al.
(2013, 2014) and—as well as an indicator reflecting whether or not a CZ is located in a rural or urbanarea.11 Because voting patterns are reported to have varied substantially along a variety of demographicdimensions, column 3 further adds controls for the share of a CZs population that is foreign born, aswell as female, and the black and hispanic shares, respectively.12 Although the estimated magnitude de-clines when adding these additional controls, a positive and highly statistically significant link betweenthe share of routine jobs and support for Trump persists, which is also evident when factoring out state-
11Autor et al. (2016b) and Autor et al. (2016a) further document the impacts of import competition on political polarizationin the United States as well as the 2016 Presidential Election.
12For brevity we do not report the estimates for these additional covariates, but note that they generally align with popularperceptions of the areas that supported Trump: the support was significantly lower in areas with a more educated population,that are urban, or where blacks or hispanics constituted a large share of the population.
14

level differences, thus only exploiting the variation in votes for Trump and specialization in routine workwithin states (column 4).
An additional concern is that our estimates reflect some omitted factor that is correlated with supportfor the Republican party. To alleviate such concerns, column 5 replaces the outcome variable with thedifference in the percentage of votes accruing to Trump and the percentage of votes cast in favor of MittRomney in the 2012 U.S. Presidential Election. These estimates reveal that the growing support for theRepublican party candidate between 2012 and 2016 was particularly evident in areas with high shares ofroutine employment.
We next proceed to examine how the support for Trump varied across subgroups employed in routinejobs. Column 6 adds a variable denoting the share of routine jobs that are low-skilled, revealing norelationship between the educational background of workers in routine jobs and their support for Trump.As discussed above, however, the main group that has been adversely affected by the onrushing waveof automation has been low-skilled males. Column 7 adds a variable corresponding to the percent ofroutine jobs held by low-skilled males, showing that the support for Trump was indeed considerablyhigher in areas characterized by a large share of the prime victims to automation, echoing the perceptionthat dissatisfaction is largest among the groups hit hardest by the force of technology.
A remaining identification challenge is that the distribution of routine jobs across present-day Amer-ica may be correlated with a variety of factors that stem from the dramatic decline in routine jobs since the1980s, in areas that specialized in routine work before the days of the Computer Revolution (Autor andDorn, 2013). To identify the component of present-day specialization in routine jobs that is determinedprior to the era of rapid computerization, we exploit historical differences in routine employment acrossCZs to instrument for the share of jobs that are routine today. More specifically, we use the variationin the share employed in routine jobs in 1980, which largely precedes the recent era of automation, toinstrument for the share of routine jobs in 2015.
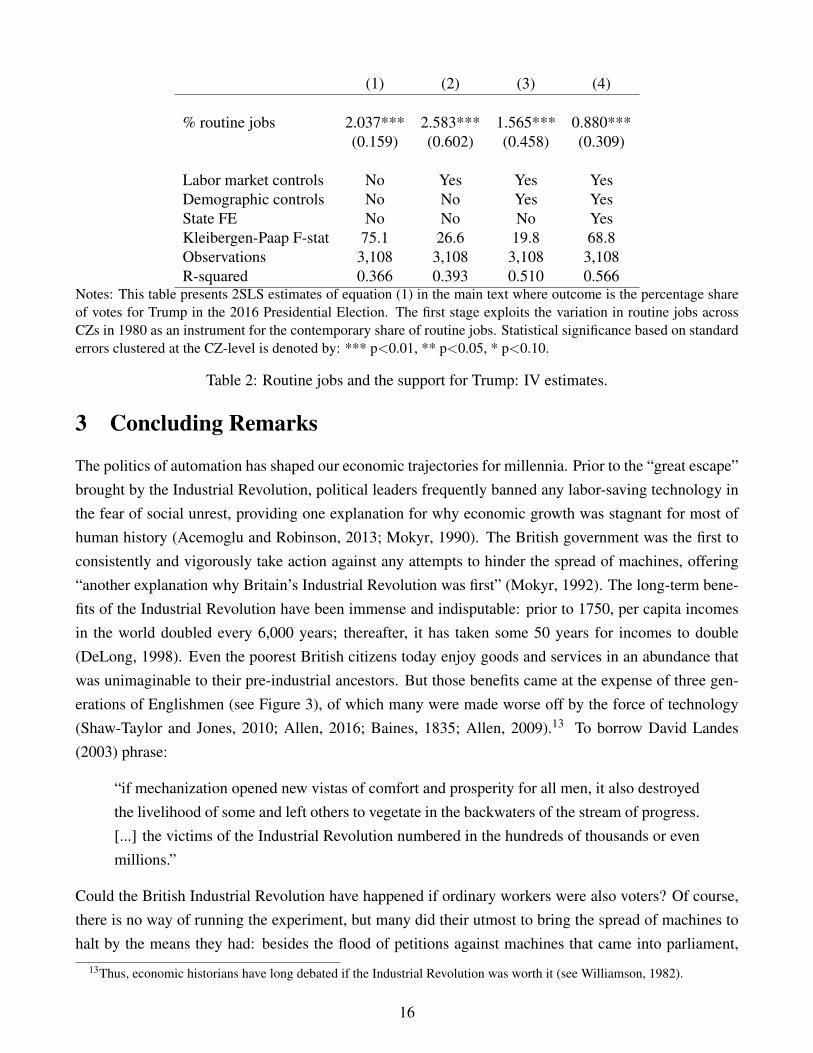
Table 2 reports IV estimates using the variation in routine jobs across CZs driven by long-run differ-ences in routine employment shares. Table 2 documents a strong first-stage correlation between routineemployment in 1980 and the share of routine jobs in 2015, which reflects the persistence in occupationalspecialization across local labor markets. We can reject a 10 percent IV bias in all instances, since theKleibergen-Paap F-statistics all exceed the conventional critical values, which reduces concerns that ourestimates are affected by weak instrument problems. A comparison of the IV estimates with the abovereported OLS estimates consistently show that IV estimates are larger in magnitude. As CZs specializedin routine prior to the Computer Revolution have seen the most rapid adoption of computer technologiesand the most rapid decline in routine employment (Autor and Dorn, 2013), the larger IV estimates areconsistent with an interpretation that an important source of the support for Trump accrued from voterswith a high exposure to automation, both presently and historically.
15
(1) (2) (3) (4)
% routine jobs 2.037*** 2.583*** 1.565*** 0.880***(0.159) (0.602) (0.458) (0.309)
Labor market controls No Yes Yes YesDemographic controls No No Yes YesState FE No No No YesKleibergen-Paap F-stat 75.1 26.6 19.8 68.8Observations 3,108 3,108 3,108 3,108R-squared 0.366 0.393 0.510 0.566
Notes: This table presents 2SLS estimates of equation (1) in the main text where outcome is the percentage shareof votes for Trump in the 2016 Presidential Election. The first stage exploits the variation in routine jobs acrossCZs in 1980 as an instrument for the contemporary share of routine jobs. Statistical significance based on standarderrors clustered at the CZ-level is denoted by: *** p<0.01, ** p<0.05, * p<0.10.
Table 2: Routine jobs and the support for Trump: IV estimates.
3 Concluding Remarks
The politics of automation has shaped our economic trajectories for millennia. Prior to the “great escape”brought by the Industrial Revolution, political leaders frequently banned any labor-saving technology inthe fear of social unrest, providing one explanation for why economic growth was stagnant for most ofhuman history (Acemoglu and Robinson, 2013; Mokyr, 1990). The British government was the first toconsistently and vigorously take action against any attempts to hinder the spread of machines, offering“another explanation why Britain’s Industrial Revolution was first” (Mokyr, 1992). The long-term bene-fits of the Industrial Revolution have been immense and indisputable: prior to 1750, per capita incomesin the world doubled every 6,000 years; thereafter, it has taken some 50 years for incomes to double(DeLong, 1998). Even the poorest British citizens today enjoy goods and services in an abundance thatwas unimaginable to their pre-industrial ancestors. But those benefits came at the expense of three gen-erations of Englishmen (see Figure 3), of which many were made worse off by the force of technology(Shaw-Taylor and Jones, 2010; Allen, 2016; Baines, 1835; Allen, 2009).13 To borrow David Landes(2003) phrase:
“if mechanization opened new vistas of comfort and prosperity for all men, it also destroyedthe livelihood of some and left others to vegetate in the backwaters of the stream of progress.[...] the victims of the Industrial Revolution numbered in the hundreds of thousands or evenmillions.”
Could the British Industrial Revolution have happened if ordinary workers were also voters? Of course,there is no way of running the experiment, but many did their utmost to bring the spread of machines tohalt by the means they had: besides the flood of petitions against machines that came into parliament,
13Thus, economic historians have long debated if the Industrial Revolution was worth it (see Williamson, 1982).
16

UZBLTU MLT
LVAKGZ
MNGCYPSYCTJK BGRDOMGEO URYHRVPRYPSE UKR ARGNGA PANNIC SRB
ZAFBOL MUSMYSMKD CRIECU ROUIND
THA ALBAGO
SLVGTMBGD CHN
KHMNPL
ETH
USA SWEGBR
IRLNLDBEL DNKFRA
FINDEULVA MLTLTU
SVNAUTCZEEST
HUN SVKESPGRC ITA POL
BGRHRV
PRT
ROU
50
60
70
80
90
Exposure
to a
uto
mation (
%)
−2 −1 0 1Political Stability and Absence of Violence/Terrorism 2015
Notes: This figure shows the percentage of employment that is at “high risk” of automation over the next decadesbased on data from WDR (2016) and the World Bank’s Political Stability and Absence of Violence/Terrorismindex where higher values correspond to more stability.
Figure 6: Automation exposure and political stability around the world.
workers voted against machines with sticks and stones (Mantoux, 2013).14 As an analogy, WassilyLeontief (1983) famously suggested that, “If horses could have joined the Democratic party and voted,what happened on farms might have been different.”15 Instead, the proliferation of automobiles, tractorand trucks caused the annihilation of the horse as a prime mover on farms and as a mean of moving goodsand people around. While the Computer Revolution has not rendered the workforce redundant, a largeshare of American’s have lost the race to technology, which is reflected in the reallocation of millions ofworkers from middle-income jobs to low-income occupations or non-employment as their jobs have beenautomated away (Autor and Dorn, 2013; Cortes et al., 2016a). This paper has shown that the victims ofthe Computer Revolution have a higher propensity to opt for radical political change: electoral districtswith a higher share of jobs exposed to automation were significantly more likely to support Trump. The2016 U.S. Presidential Election can thus be described as a riot against machines by democratic means.
Looking forward, automation is likely to become a growing political challenge.16 Recent devel-opments in artificial intelligence and mobile robotics are widely regarded the beginnings of a “SecondMachine Age”; computers are now able to perform even a wider range of non-routine tasks, such as med-ical diagnostics, translation work, and driving a car (Brynjolfsson and McAfee, 2014). As a result, Frey
14Most citizens lacked voting rights, for which property ownership remained a prerequisite; even with the Reform Acts of1832 and 1867.
15Cited in Curtis (1983).16As forcefully argued by Crafts (2015), “fears about long-term ‘secular stagnation’, based on the end of innovation as we
have known it, seem overdone. The problem is much more likely to be the factor-saving bias of technological progress basedon computerization of jobs than a drying-up of productivity growth.”
17
and Osborne (2017) estimate that 47 percent of U.S. employment is at “high risk” of automation over theforthcoming decades, with a substantial share falling into non-tradable sectors of the economy, to whichmost workers have already reallocated: 98 percent of total U.S. employment growth between 1990 and2008 accrued in sectors where jobs are unaffected by import competition (Spence and Hlatshwayo, 2012).While this shields many workers from the adverse impacts of trade (Acemoglu et al., 2016), it does notconstitute a safeguard against automation—indeed, as President Obama noted when leaving office: “Thenext wave of economic dislocations won’t come from overseas. It will come from the relentless pace ofautomation that makes a lot of good, middle-class jobs obsolete.”
The political challenges stemming from automation are by no means confined to the United States:in fact, low- and middle-income countries exhibit a higher relative exposure to emerging technologies.Using the Frey and Osborne (2017) methodology, the World Bank has estimated 77 percent of jobs inChina are at “high risk” of automation, with similar shares being reported for India, South Africa, andBrazil (WDR, 2016). Worryingly, countries with a greater exposure to automation also typically ranklower in terms of political stability: Figure 6 shows a negative correlation between countries exposureto emerging technologies and their political stability index (the outliers being Nigeria, Ukraine, and theWest Bank and Gaza). It stands to reason that leaders in politically unstable countries are particularlylikely to view automation as a destabilizing factor, which they might seek to restrict.
Of course, over the very long-run automation has always been an engine of comfort and prosperity:after six decades of stagnant wage growth during the British Industrial Revolution, ordinary workerseventually became the prime beneficiaries of automation as they adapted and acquired new skills (Bessen,2015; Galor and Moav, 2004). Between 1840 and 1900, real wages in Britain grew by 123 percent,considerably faster than output per worker (Allen, 2009) Could history repeat itself? Perhaps so; so far,the economic trajectories of the Computer Revolution closely resembles those of the British IndustrialRevolution. But any future benefits from automation hinges upon its politics. To avoid further populistrebellion and a looming backlash against technology itself, governments must find ways of making thebenefits from automation more widely shared.
References
Acemoglu, D. (2002). Technical change, inequality, and the labor market. Journal of Economic Litera-
ture, 40(1), 7–72.
Acemoglu, D. and Autor, D. (2011). Skills, tasks and technologies: Implications for employment andearnings. Handbook of labor economics, 4, 1043–1171.
Acemoglu, D. and Restrepo, P. (2017). Robots and Jobs: Evidence from US labor markets.
Acemoglu, D. and Robinson, J. A. (2013). Why nations fail: The origins of power, prosperity, and
poverty. Crown Business.
18

Acemoglu, D., Autor, D., Dorn, D., Hanson, G. H., and Price, B. (2016). Import competition and thegreat U.S. employment sag of the 2000s. Journal of Labor Economics, 34(S1), S141–S198.
Akst, D. (2013). What can we learn from past anxiety over automation? The Wilson Quarterly.
Allen, R. (2016). The hand-loom weaver and the power loom: A schumpeterian perspective. Technicalreport, University of Oxford, Department of Economics.
Allen, R. C. (2005). English and Welsh agriculture, 1300-1850: outputs, inputs, and income.
Allen, R. C. (2009). Engels pause: Technical change, capital accumulation, and inequality in the Britishindustrial revolution. Explorations in Economic History, 46(4), 418–435.
Autor, D., Levy, F., and Murnane, R. J. (2003). The skill content of recent technological change: Anempirical exploration. The Quarterly Journal of Economics, 118(4), 1279–1333.
Autor, D., Dorn, D., Hanson, G., and Majlesi, K. (2016a). Importing political polarization? The electoralconsequences of rising trade exposure. Technical report, National Bureau of Economic Research.
Autor, D., Dorn, D., Hanson, G., and Majlesi, K. (2016b). A note on the effect of rising trade exposureon the 2016 presidential election. Technical report, Mimeo, MIT.
Autor, D. H. and Dorn, D. (2013). The Growth of Low-Skill Service Jobs and the Polarization of theU.S. Labor Market. American Economic Review, 103(5), 1553–97.
Autor, D. H., Katz, L. F., and Kearney, M. S. (2006). The Polarization of the U.S. Labor Market.American Economic Review, 96(2), 189–194.
Autor, D. H., Dorn, D., Hanson, G. H., and Song, J. (2014). Trade adjustment: Worker-level evidence.The Quarterly Journal of Economics, 129(4), 1799–1860.
Autor, David, H., Dorn, D., and Hanson, G. H. (2013). The China syndrome: Local labor market effectsof import competition in the United States. The American Economic Review, 103(6), 2121–2168.
Baines, E. (1835). History of the Cotton Manufacture in Great Britain. Londres, Fischer and Jackson.
Berg, M. (1982). The machinery question and the making of political economy 1815-1848. Technicalreport, Cambridge University Press.
Berger, T. and Frey, C. B. (2016). Did the Computer Revolution shift the fortunes of U.S. cities? Tech-nology shocks and the geography of new jobs. Regional Science and Urban Economics, 57, 38–45.
Berger, T. and Frey, C. B. (2017). Industrial renewal in the 21st century: evidence from US cities.Regional Studies, 51(3), 404–413.
19

Bessen, J. (2015). Learning by doing: the real connection between innovation, wages, and wealth. YaleUniversity Press.
Bivens, J., Gould, E., Mishel, E., and Shierholz, H. (2014). Raising Americas Pay. Economic Policy
Institute Briefing Paper, 378.
Brynjolfsson, E. and McAfee, A. (2014). The Second Machine Age: Work, Progress, and Prosperity in a
Time of Brilliant Technologies. WW Norton & Company.
Caprettini, B. and Voth, H.-J. (2017). Rage Against the Machines: Labour-Saving Technology and Unrestin England, 1830-32.
Clark, G. (2005). The condition of the working class in England, 1209–2004. Journal of Political
Economy, 113(6), 1307–1340.
Cortes, G. M., Jaimovich, N., and Siu, H. E. (2016a). Disappearing routine jobs: Who, how, and why?Technical report, National Bureau of Economic Research.
Cortes, G. M., Jaimovich, N., and Siu, H. E. (2016b). The end of men and rise of women in the high-skilled labor market.
Crafts, N. (2015). Economic growth: onwards and upwards? Oxford Review of Economic Policy, 31(2),217–241.
Crafts, N. F. and Harley, C. K. (1992). Output growth and the British industrial revolution: a restatementof the Crafts-Harley view. The Economic History Review, 45(4), 703–730.
Curtis, C. (1983). Machines vs. workers. The New York Times.
David, H. (2015). Why are there still so many jobs? the history and future of workplace automation. The
Journal of Economic Perspectives, 29(3), 3–30.
DeLong, J. B. (1998). Estimating world GDP, one million BC–present. Berkeley, California.
Eberstadt, N. (2016). Men Without Work: America’s Invisible Crisis. Templeton Foundation Press.
Engels, F. (1845). The Condition of the Working Class in England. Collected Works. London: Lawrence
& Wishart, page 4.
Feinstein, C. H. (1998). Pessimism perpetuated: real wages and the standard of living in Britain duringand after the industrial revolution. The Journal of Economic History, 58(3), 625–658.
Floud, R., Gregory, A., and Wachter, K. (1990). Height, health and history: nutritional status in the
United Kingdom, 1750-1980. Number 9. Cambridge University Press.
20

Frey, C. B. and Osborne, M. A. (2017). The future of employment: how susceptible are jobs to comput-erisation? Technological Forecasting and Social Change, 114, 254–280.
Galor, O. and Moav, O. (2004). From physical to human capital accumulation: Inequality and the processof development. The Review of Economic Studies, 71(4), 1001–1026.
Goos, M. and Manning, A. (2007). Lousy and lovely jobs: The rising polarization of work in Britain.The Review of Economics and Statistics, 89(1), 118–133.
Goos, M., Manning, A., and Salomons, A. (2009). Job polarization in Europe. The American Economic
Review, 99(2), 58–63.
Goos, M., Manning, A., and Salomons, A. (2014). Explaining job polarization: Routine-biased techno-logical change and offshoring. The American Economic Review, 104(8), 2509–2526.
Gordon, R. J. (2016). The rise and fall of American growth: The US standard of living since the civil
war. Princeton University Press.
Graetz, G. and Michaels, G. (2015). Robots at work. CEP Discussion Paper No 1335.
Greenstone, M. and Looney, A. (2011). Trends: Reduced earnings for men in America. The Milken
Institute Review, pages 32–37.
Hamel, L., Firth, J., and Brodie, M. (2014). Kaiser Family Foundation/New York Times/CBS NewsNon-Employed Poll. Kaiser Family Foundation, Menlo Park, CA.
Horrell, S. (1996). Home demand and british industrialization. The Journal of Economic History, 56(3),561–604.
Jaimovich, N. and Siu, H. E. (2012). Job polarization and jobless recoveries. NBER Working Paper
18334.
Karabarbounis, L. and Neiman, B. (2013). The global decline of the labor share. The Quarterly Journal
of Economics, 129(1), 61–103.
Katz, L. F. and Murphy, K. M. (1992). Changes in relative wages, 1963–1987: supply and demandfactors. The Quarterly Journal of Economics, 107(1), 35–78.
Komlos, J. (1998). Shrinking in a growing economy? the mystery of physical stature during the industrialrevolution. The Journal of Economic History, 58(3), 779–802.
Landes, D. S. (2003). The unbound Prometheus: technological change and industrial development in
Western Europe from 1750 to the present. Cambridge University Press.
21

Lin, J. (2011). Technological Adaptation, Cities, and New Work. Review of Economics and Statistics,93(2), 554–574.
Lindert, P. H. (2000). When did inequality rise in Britain and America? Journal of Income Distribution,9(1), 11–25.
Lindert, P. H. and Williamson, J. G. (1983). English workers living standards during the industrialrevolution: a new look. The Economic History Review, 36(1), 1–25.
Lindert, P. H. and Williamson, J. G. (2016). Unequal Gains: American Growth and Inequality since
1700. Princeton University Press.
Mantoux, P. (2013). The industrial revolution in the eighteenth century: An outline of the beginnings of
the modern factory system in England. Routledge.
Michaels, G., Natraj, A., and Reenen, J. V. (2014). Has ICT Polarized Skill Demand? Evidence fromEleven Countries over Twenty-Five Years. The Review of Economics and Statistics, 96(1), 60–77.
Mokyr, J. (1990). The lever of riches: Technological creativity and economic progress. Oxford UniversityPress.
Mokyr, J. (1992). Technological inertia in economic history. The Journal of Economic History, 52(2),325–338.
Mokyr, J. (1998). The Political Economy of Technological Change: Resistance and Innovation in Eco-
nomic History, pages 39–64. Edward Elgar Publishers.
Mokyr, J. (2009). The Enlightened Economy: An Economic History of Britain 1700-1850. Yale Univer-sity Press.
Mokyr, J., Vickers, C., and Ziebarth, N. L. (2015). The history of technological anxiety and the future ofeconomic growth: Is this time different? The Journal of Economic Perspectives, 29(3), 31–50.
Nordhaus, W. D. (2007). Two centuries of productivity growth in computing. The Journal of Economic
History, 67(01), 128–159.
Shaw-Taylor, L. and Jones, A. (2010). The male occupational structure of Northamptonshire 1777-1881:A case of partial de-industrialization? Cambridge University Working Paper, 5.
Spence, M. and Hlatshwayo, S. (2012). The evolving structure of the American economy and the em-ployment challenge. Comparative Economic Studies, 54(4), 703–738.
Summers, L. (2015). Focus on growth for the middle class. The Washington Post.
22
Tuttle, C. (1999). Hard at work in factories and mines: the economics of child labor during the British
industrial revolution. Westview Press.
Ure, A. (1835). The Philosophy of Manufactures; or, An Exposition of the Scientific, Moral, and Com-
mercial Economy of the Factory System of Great Britain. C. Knight.
Voth, H.-J. (2000). Time and work in England 1750-1830. Clarendon Press Oxford.
WDR (2016). World development report 2016: Digital dividends.
Williamson, J. G. (1982). Was the industrial revolution worth it? Disamenities and death in 19th centuryBritish towns. Explorations in Economic History, 19(3), 221–245.
23