political economy of reform: dynasties, poverty …...political economy of reform: dynasties,...
TRANSCRIPT
Political Economy of Reform: Dynasties, Poverty and the RH Law
Ronald Umali Mendoza, PhD
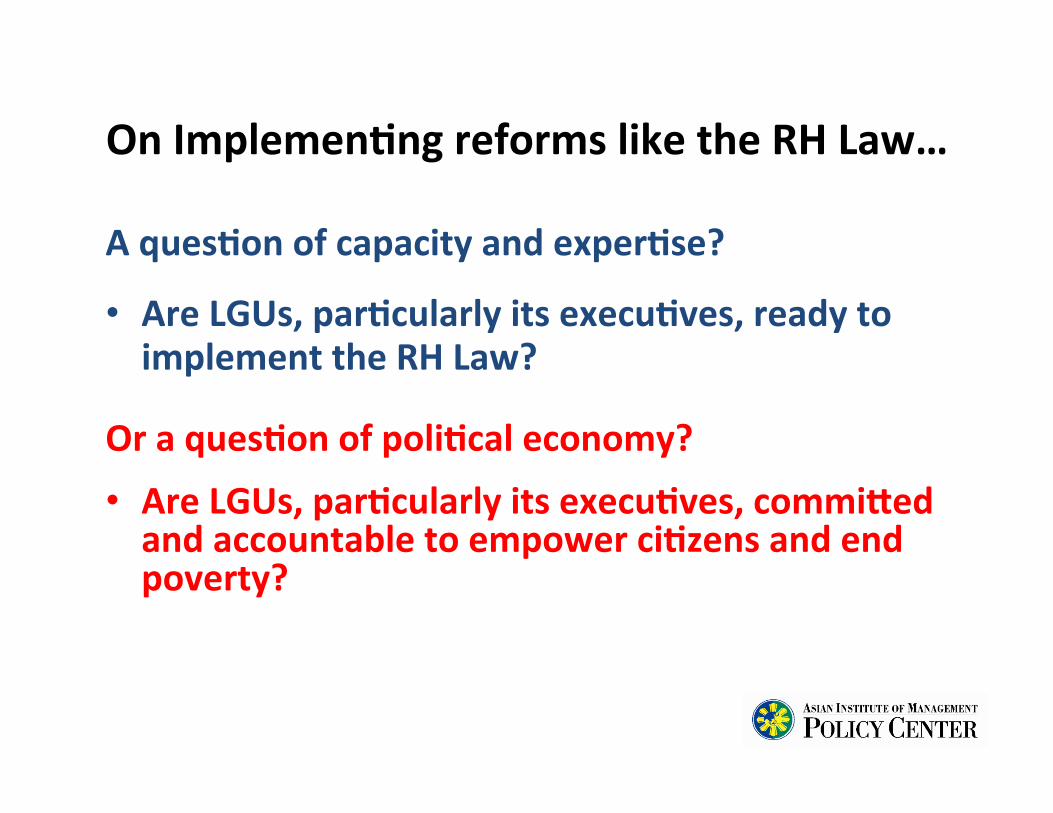
On Implemen)ng reforms like the RH Law…
A ques)on of capacity and exper)se?
• Are LGUs, par)cularly its execu)ves, ready to implement the RH Law?
Or a ques)on of poli)cal economy?
• Are LGUs, par)cularly its execu)ves, commiEed and accountable to empower ci)zens and end poverty?
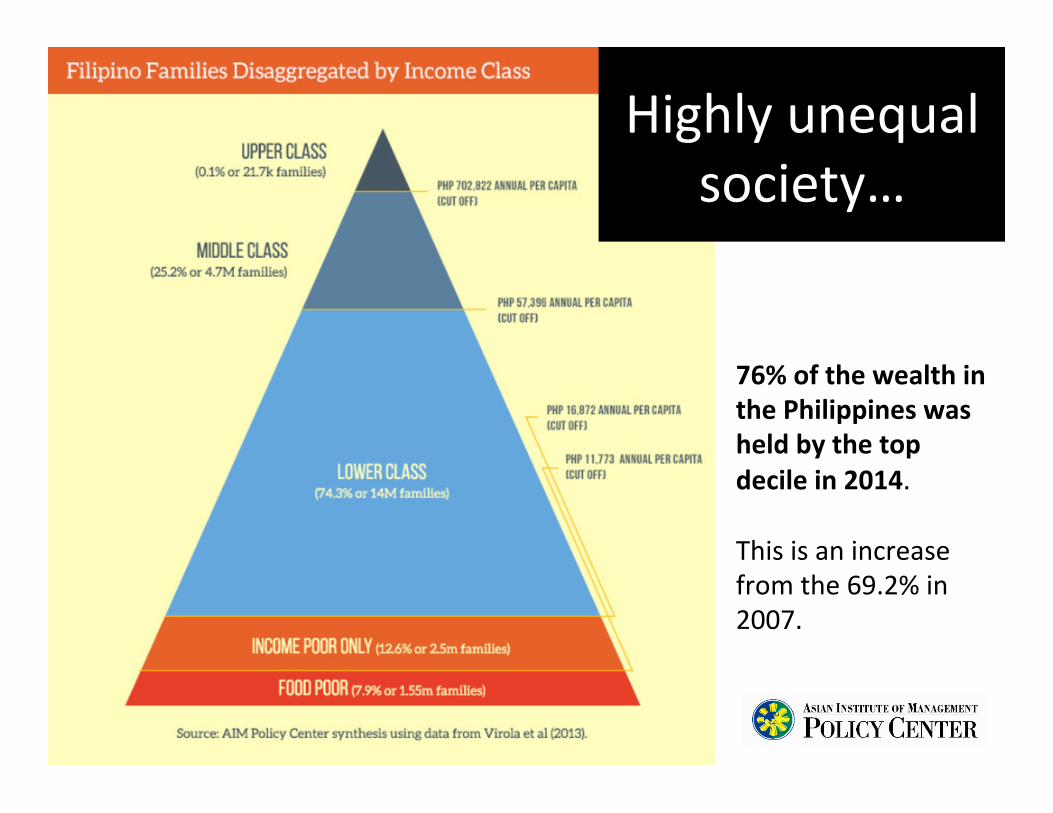
Highly unequal society…
76% of the wealth in the Philippines was held by the top decile in 2014. This is an increase from the 69.2% in 2007.
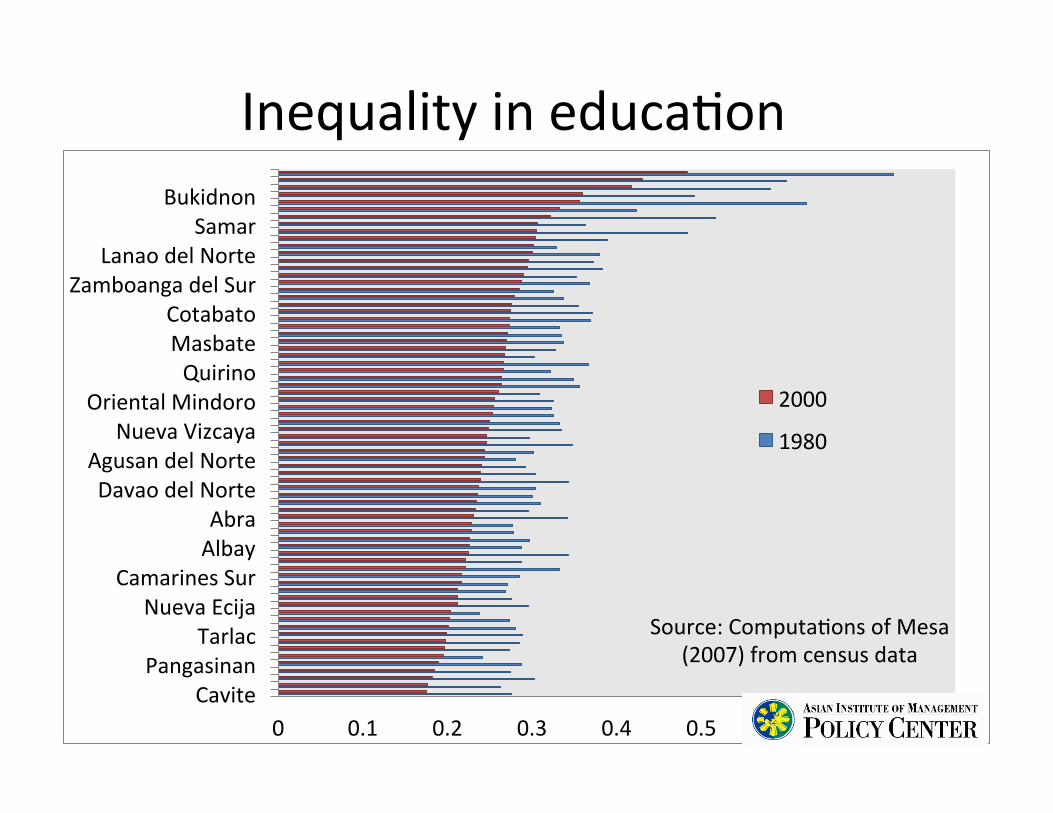
Inequality in educa?on
0 0.1 0.2 0.3 0.4 0.5 0.6 0.7 0.8 Cavite
Pangasinan Tarlac
Nueva Ecija Camarines Sur
Albay Abra
Davao del Norte Agusan del Norte
Nueva Vizcaya Oriental Mindoro
Quirino Masbate Cotabato
Zamboanga del Sur Lanao del Norte
Samar Bukidnon
2000
1980
Source: Computa?ons of Mesa (2007) from census data
STRUCTURAL REFORMS TO ADDRESS POVERTY AND INEQUALITY
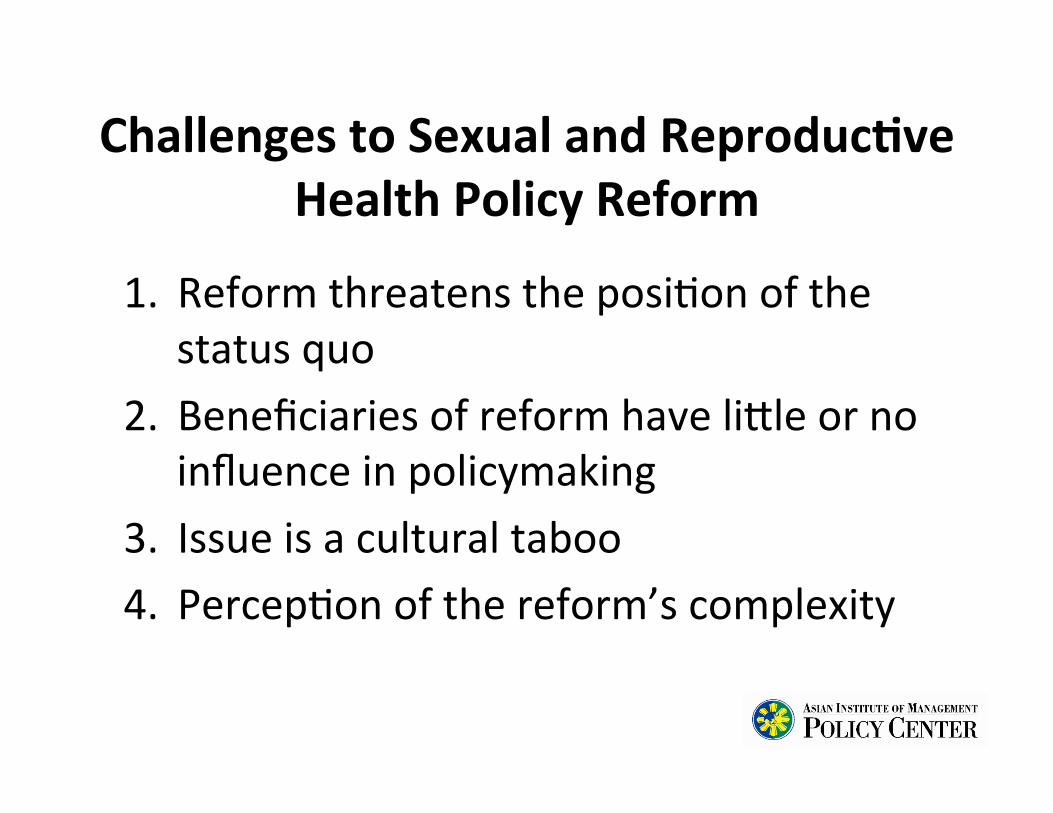
Challenges to Sexual and Reproduc)ve Health Policy Reform
1. Reform threatens the posi?on of the status quo
2. Beneficiaries of reform have li^le or no influence in policymaking
3. Issue is a cultural taboo 4. Percep?on of the reform’s complexity
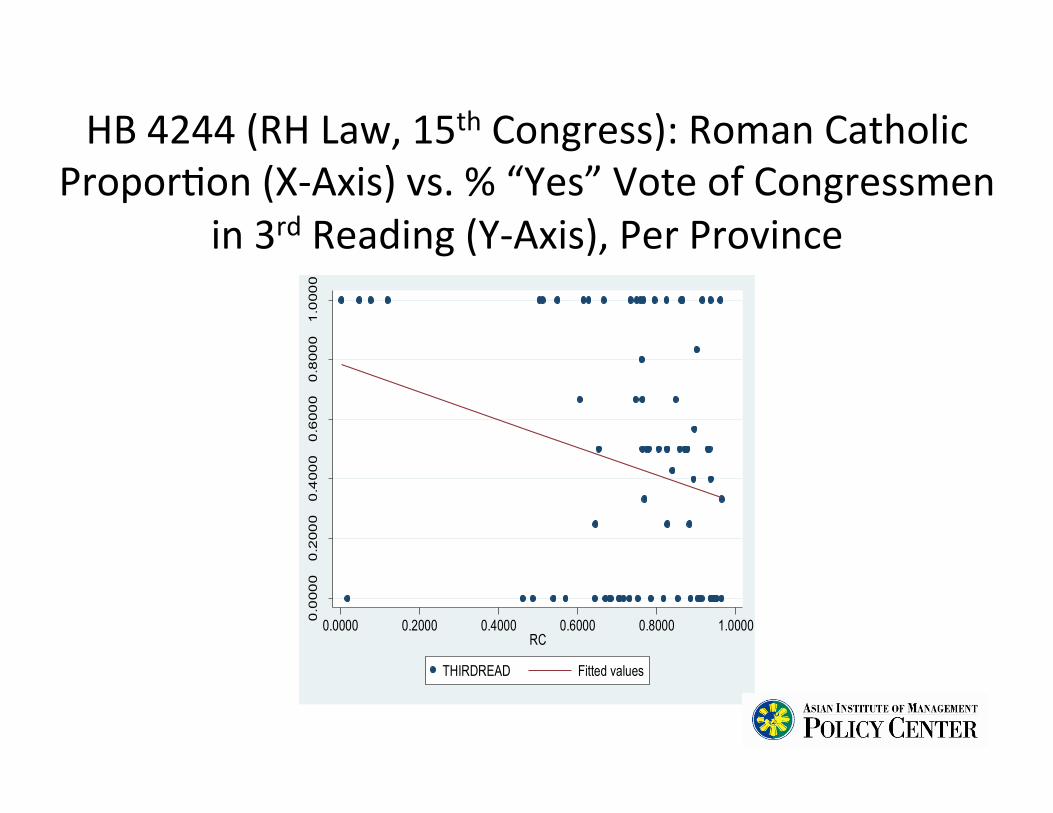
HB 4244 (RH Law, 15th Congress): Roman Catholic Propor?on (X-‐Axis) vs. % “Yes” Vote of Congressmen
in 3rd Reading (Y-‐Axis), Per Province 0
.000
00
.200
00
.400
00
.600
00
.800
01
.000
0
0.0000 0.2000 0.4000 0.6000 0.8000 1.0000RC
THIRDREAD Fitted values
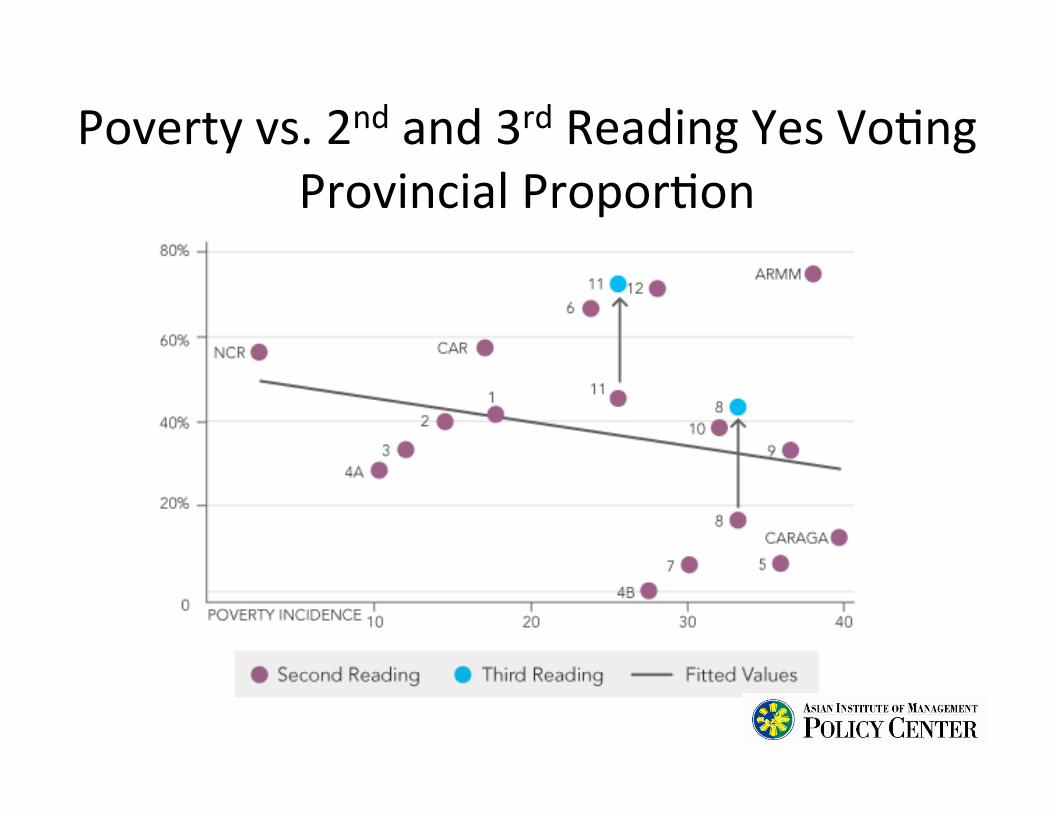
Poverty vs. 2nd and 3rd Reading Yes Vo?ng Provincial Propor?on
MALFUNCTIONING PARTY SYSTEM: DYNASTIES
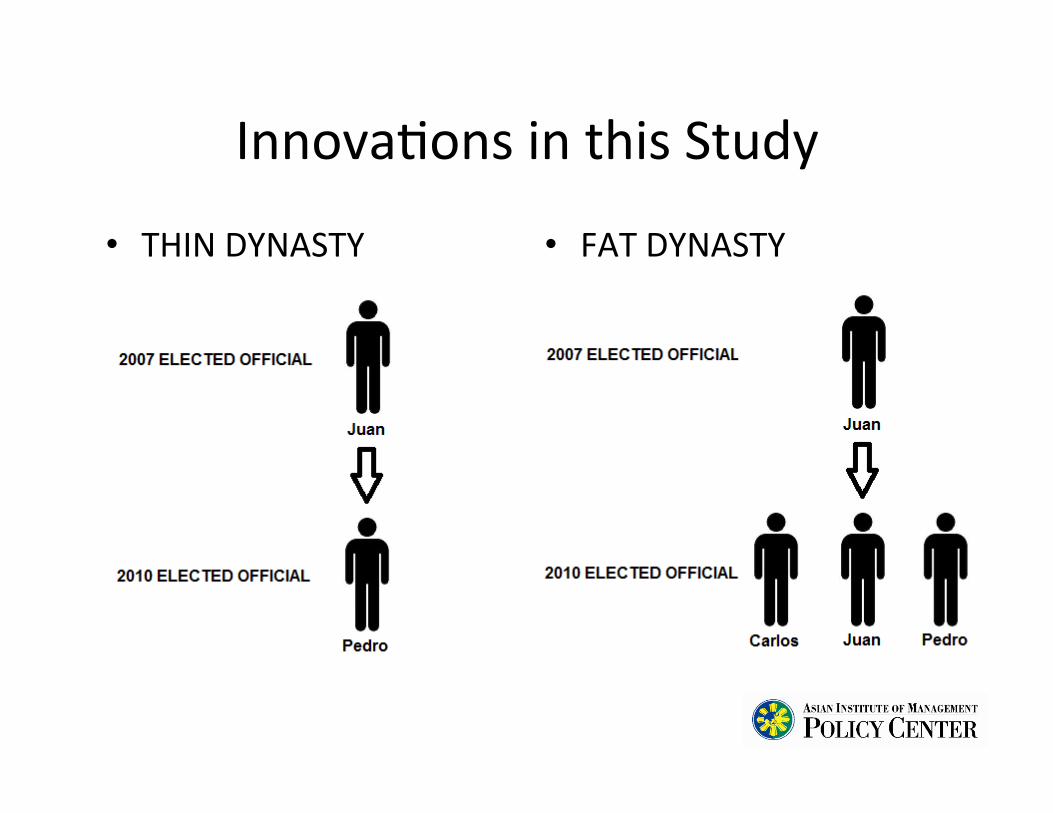
Innova?ons in this Study
• THIN DYNASTY • FAT DYNASTY
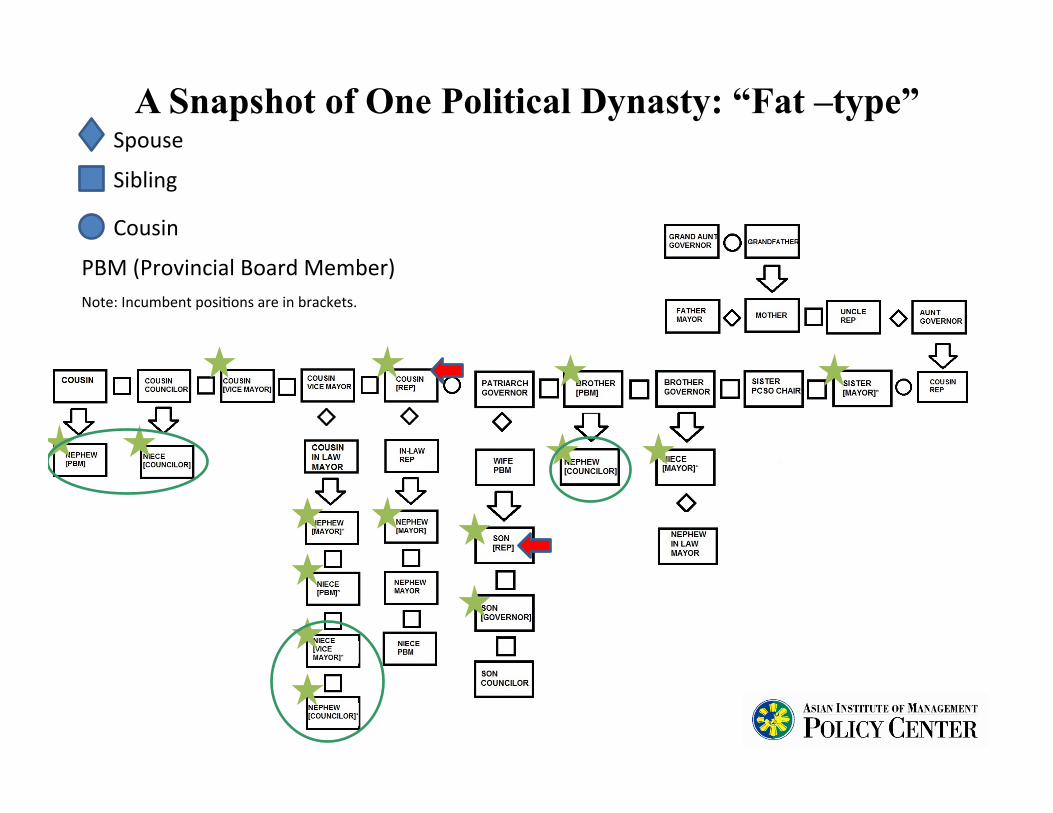
A Snapshot of One Political Dynasty: “Fat –type”
Sibling
Spouse
Cousin
PBM (Provincial Board Member) Note: Incumbent posi?ons are in brackets.
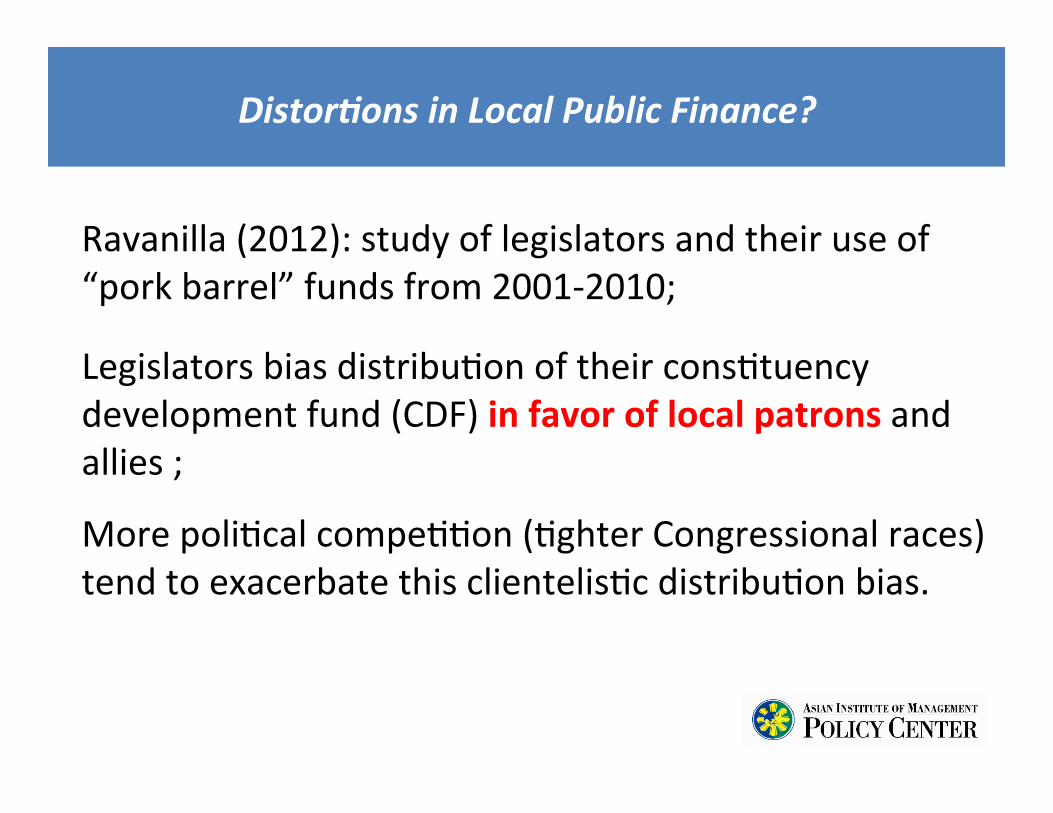
Distor'ons in Local Public Finance?
Ravanilla (2012): study of legislators and their use of “pork barrel” funds from 2001-‐2010;
Legislators bias distribu?on of their cons?tuency development fund (CDF) in favor of local patrons and allies ;
More poli?cal compe??on (?ghter Congressional races) tend to exacerbate this clientelis?c distribu?on bias.
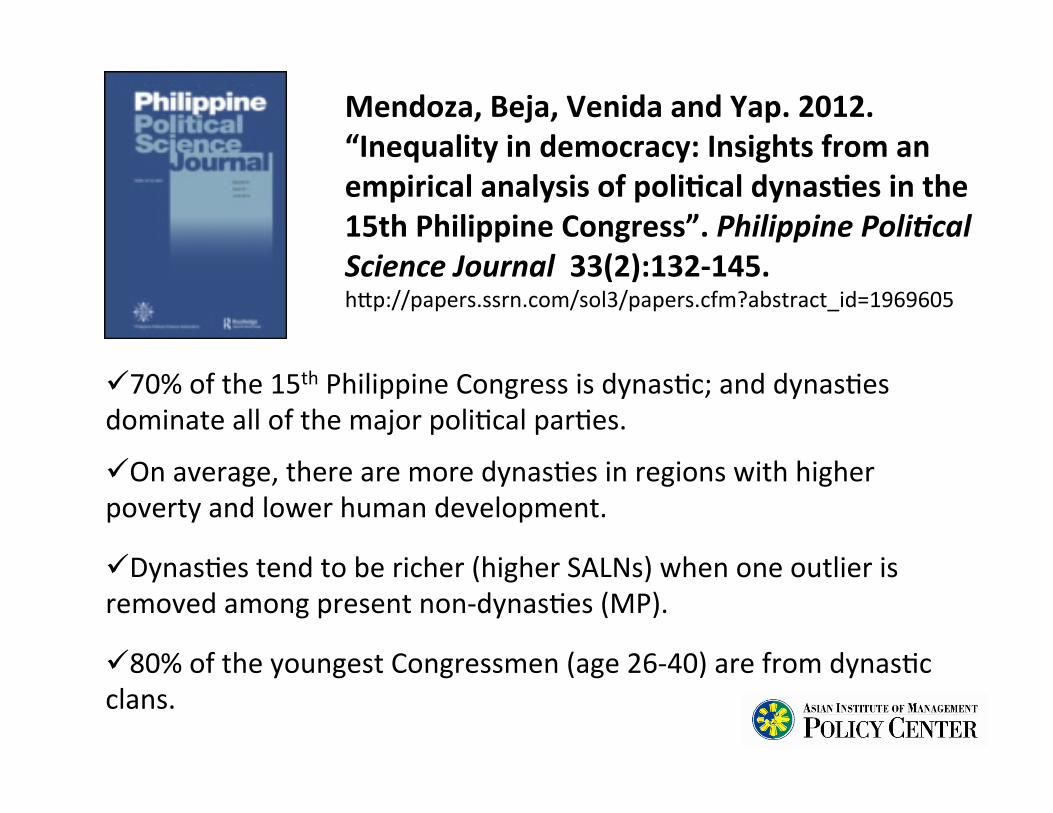
Mendoza, Beja, Venida and Yap. 2012. “Inequality in democracy: Insights from an empirical analysis of poli)cal dynas)es in the 15th Philippine Congress”. Philippine Poli'cal Science Journal 33(2):132-‐145. h^p://papers.ssrn.com/sol3/papers.cfm?abstract_id=1969605
ü 70% of the 15th Philippine Congress is dynas?c; and dynas?es dominate all of the major poli?cal par?es.
ü On average, there are more dynas?es in regions with higher poverty and lower human development.
ü Dynas?es tend to be richer (higher SALNs) when one outlier is removed among present non-‐dynas?es (MP).
ü 80% of the youngest Congressmen (age 26-‐40) are from dynas?c clans.
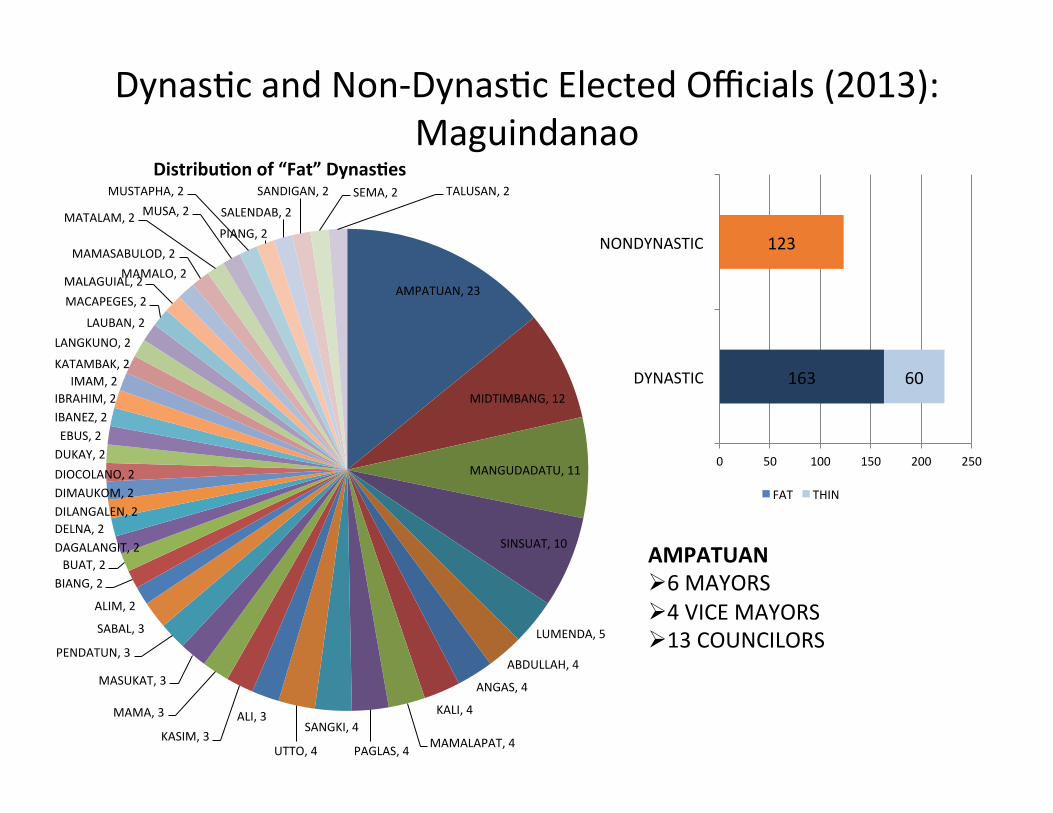
Dynas?c and Non-‐Dynas?c Elected Officials (2013): Maguindanao
AMPATUAN Ø 6 MAYORS Ø 4 VICE MAYORS Ø 13 COUNCILORS
Distribu)on of “Fat” Dynas)es
NOTE: AMPATUANS WERE TRIMMED. THE NUMBER OF AMPATUANS ON ALL LEVELS THEY PREVIOUSLY OCCUPIED DECREASED. 163
123
60
0 50 100 150 200 250
DYNASTIC
NONDYNASTIC
FAT THIN
AMPATUAN, 23
MIDTIMBANG, 12
MANGUDADATU, 11
SINSUAT, 10
LUMENDA, 5
ABDULLAH, 4
ANGAS, 4
KALI, 4
MAMALAPAT, 4 PAGLAS, 4
SANGKI, 4
UTTO, 4
ALI, 3 KASIM, 3
MAMA, 3
MASUKAT, 3
PENDATUN, 3
SABAL, 3
ALIM, 2
BIANG, 2 BUAT, 2
DAGALANGIT, 2 DELNA, 2 DILANGALEN, 2 DIMAUKOM, 2 DIOCOLANO, 2 DUKAY, 2 EBUS, 2 IBANEZ, 2 IBRAHIM, 2
IMAM, 2 KATAMBAK, 2
LANGKUNO, 2 LAUBAN, 2
MACAPEGES, 2 MALAGUIAL, 2 MAMALO, 2 MAMASABULOD, 2
MATALAM, 2 MUSA, 2 MUSTAPHA, 2
PIANG, 2
SALENDAB, 2
SANDIGAN, 2 SEMA, 2 TALUSAN, 2
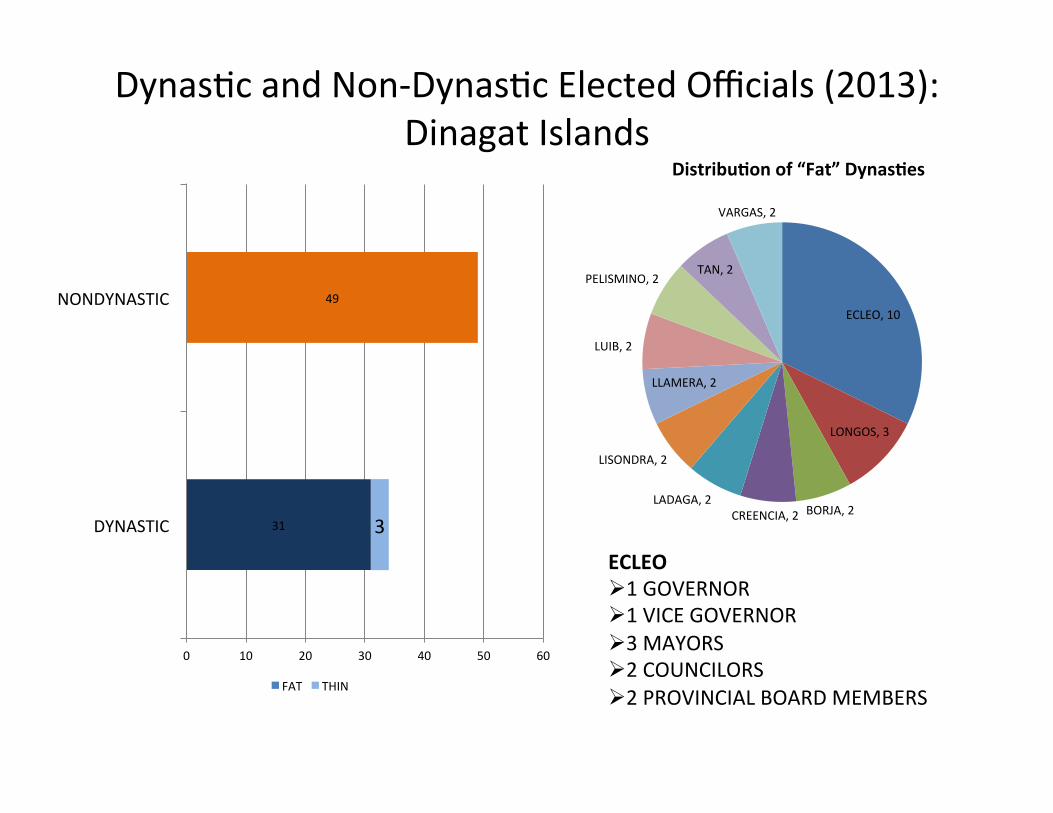
Dynas?c and Non-‐Dynas?c Elected Officials (2013): Dinagat Islands
ECLEO Ø 1 GOVERNOR Ø 1 VICE GOVERNOR Ø 3 MAYORS Ø 2 COUNCILORS Ø 2 PROVINCIAL BOARD MEMBERS
Distribu)on of “Fat” Dynas)es
ECLEO, 10
LONGOS, 3
BORJA, 2 CREENCIA, 2 LADAGA, 2
LISONDRA, 2
LLAMERA, 2
LUIB, 2
PELISMINO, 2 TAN, 2
VARGAS, 2
31
49
3
0 10 20 30 40 50 60
DYNASTIC
NONDYNASTIC
FAT THIN
NOTE: NON DYNASTICS DECREASED FROM 2010 TO 2013 IN ALL THREE PROVINCES SHOWN. NOTE: MOTHER ECLEO FOUGHT AND DEFEATED HER OWN DAUGHTER.
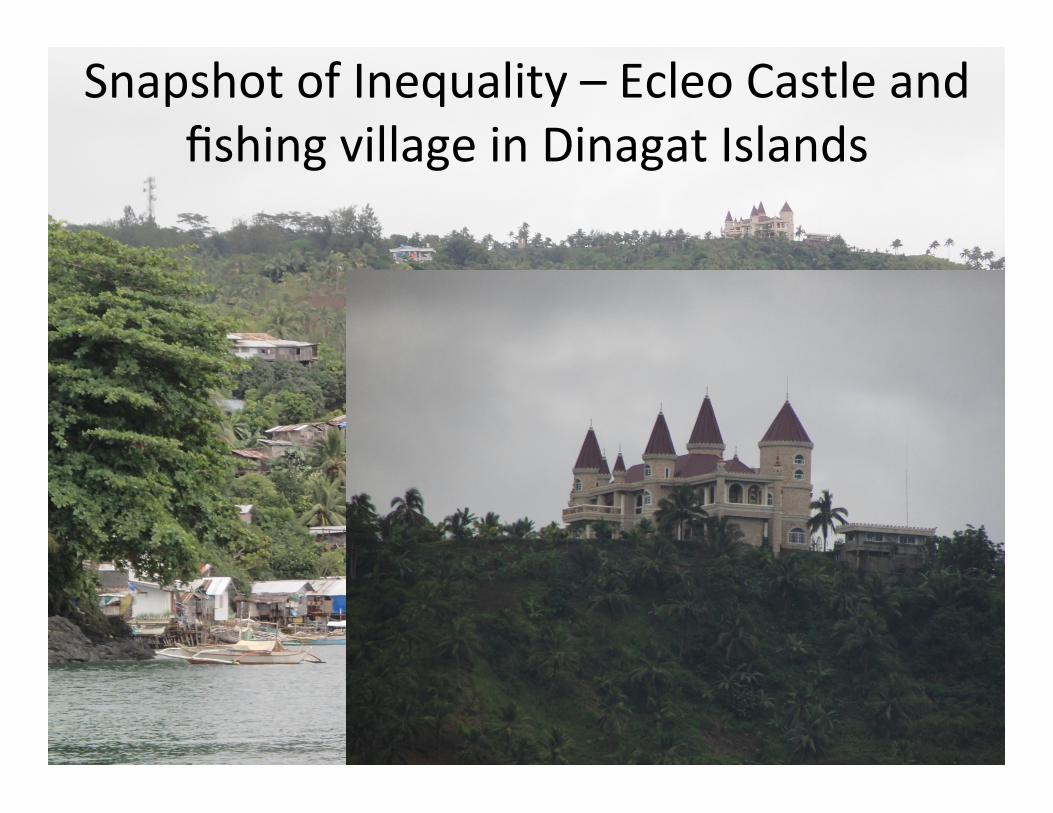
Snapshot of Inequality – Ecleo Castle and fishing village in Dinagat Islands
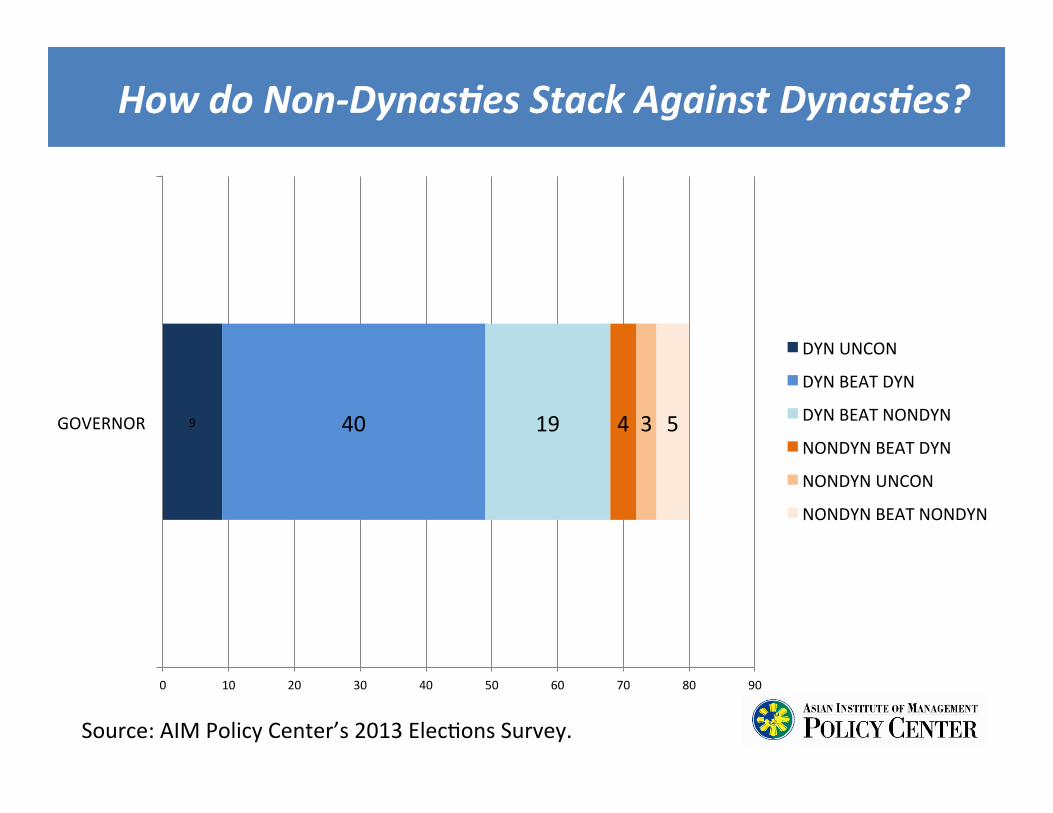
How do Non-‐Dynas'es Stack Against Dynas'es?
Source: AIM Policy Center’s 2013 Elec?ons Survey.
9 40 19 4 3 5
0 10 20 30 40 50 60 70 80 90
GOVERNOR
DYN UNCON
DYN BEAT DYN
DYN BEAT NONDYN
NONDYN BEAT DYN
NONDYN UNCON
NONDYN BEAT NONDYN
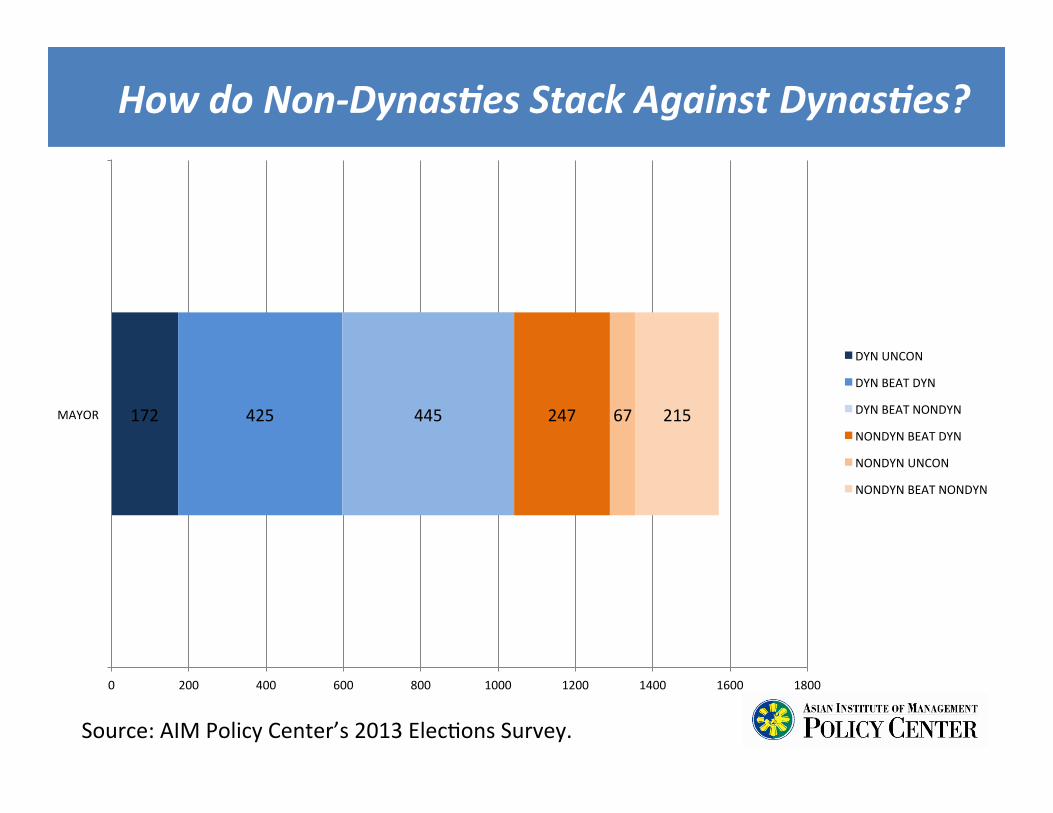
Source: AIM Policy Center’s 2013 Elec?ons Survey.
How do Non-‐Dynas'es Stack Against Dynas'es?
172 425 445 247 67 215
0 200 400 600 800 1000 1200 1400 1600 1800
MAYOR
DYN UNCON
DYN BEAT DYN
DYN BEAT NONDYN
NONDYN BEAT DYN
NONDYN UNCON
NONDYN BEAT NONDYN

MALFUNCTIONING PARTY SYSTEM: TURNCOATISM
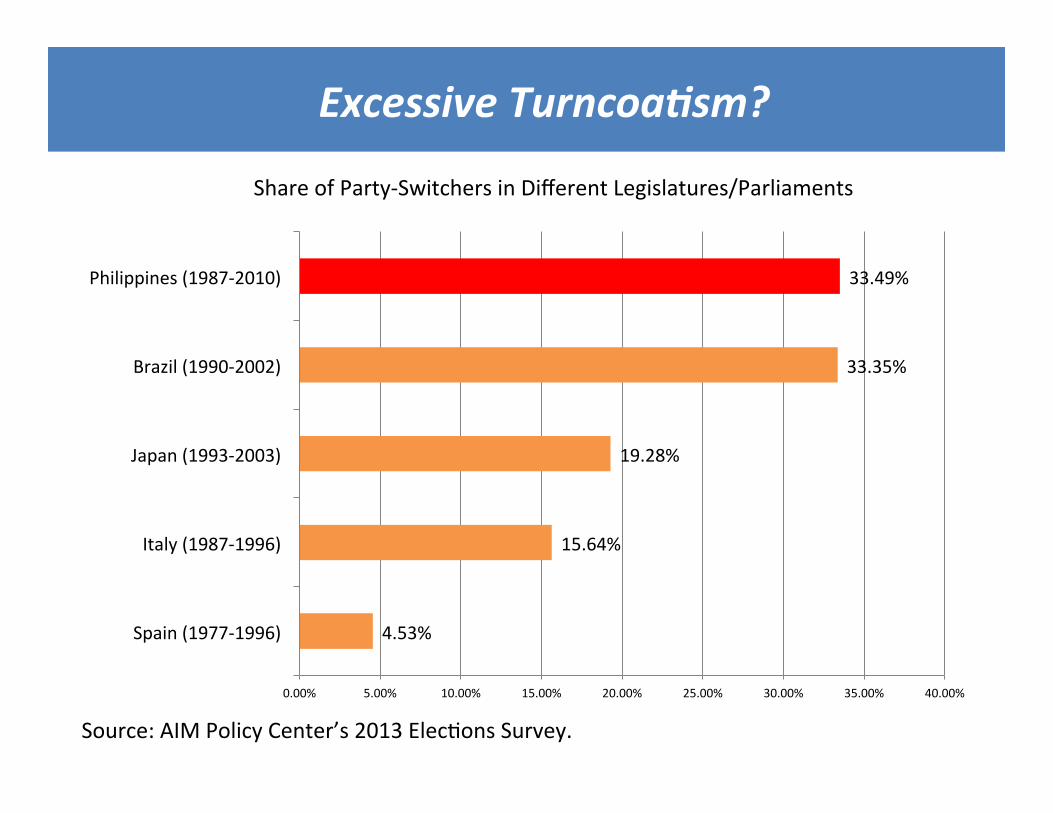
Excessive Turncoa'sm?
Source: AIM Policy Center’s 2013 Elec?ons Survey.
Share of Party-‐Switchers in Different Legislatures/Parliaments
4.53%
15.64%
19.28%
33.35%
33.49%
0.00% 5.00% 10.00% 15.00% 20.00% 25.00% 30.00% 35.00% 40.00%
Spain (1977-‐1996)
Italy (1987-‐1996)
Japan (1993-‐2003)
Brazil (1990-‐2002)
Philippines (1987-‐2010)
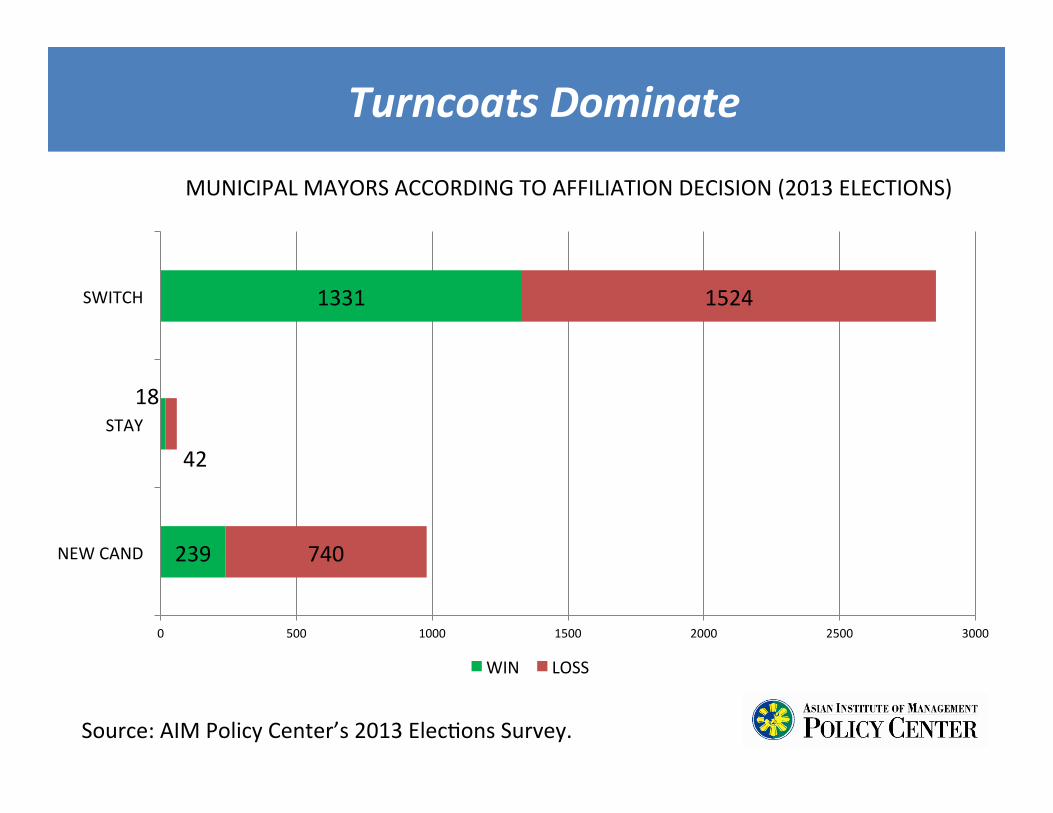
Turncoats Dominate
Source: AIM Policy Center’s 2013 Elec?ons Survey.
MUNICIPAL MAYORS ACCORDING TO AFFILIATION DECISION (2013 ELECTIONS)
239
18
1331
740
42
1524
0 500 1000 1500 2000 2500 3000
NEW CAND
STAY
SWITCH
WIN LOSS
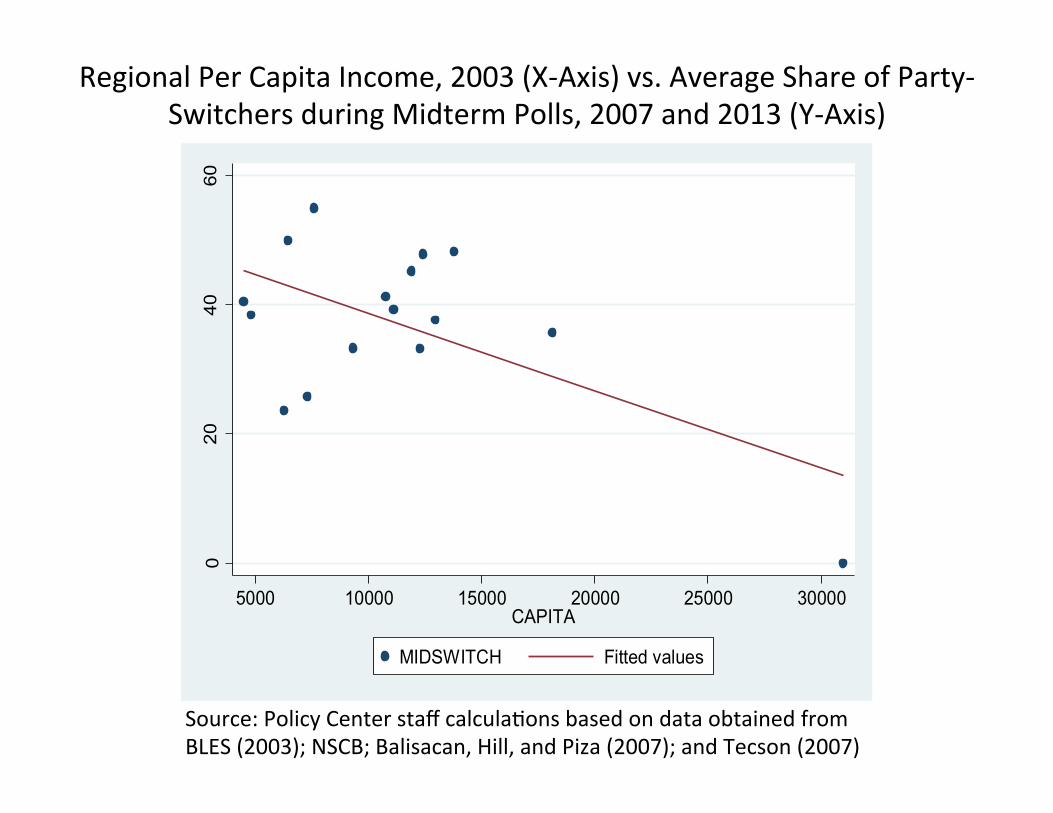
020
4060
5000 10000 15000 20000 25000 30000CAPITA
MIDSWITCH Fitted values
Regional Per Capita Income, 2003 (X-‐Axis) vs. Average Share of Party-‐Switchers during Midterm Polls, 2007 and 2013 (Y-‐Axis)
Source: Policy Center staff calcula?ons based on data obtained from BLES (2003); NSCB; Balisacan, Hill, and Piza (2007); and Tecson (2007)
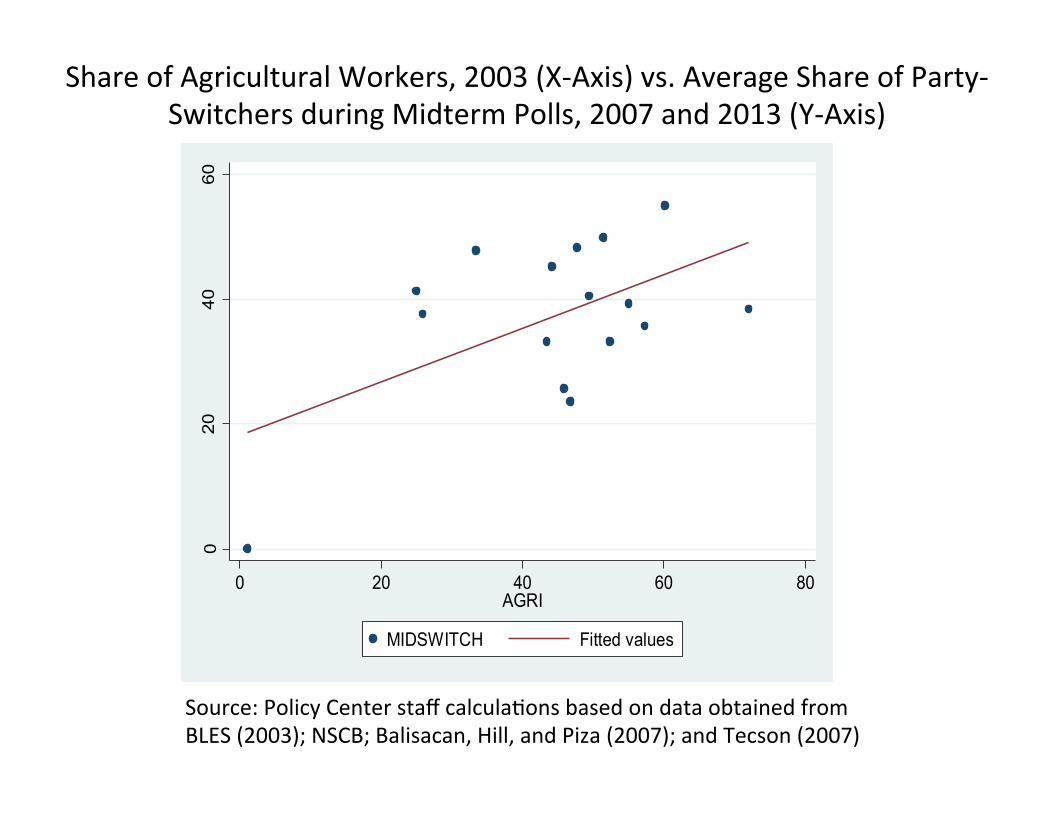
Share of Agricultural Workers, 2003 (X-‐Axis) vs. Average Share of Party-‐Switchers during Midterm Polls, 2007 and 2013 (Y-‐Axis)
020
4060
0 20 40 60 80AGRI
MIDSWITCH Fitted values
Source: Policy Center staff calcula?ons based on data obtained from BLES (2003); NSCB; Balisacan, Hill, and Piza (2007); and Tecson (2007)
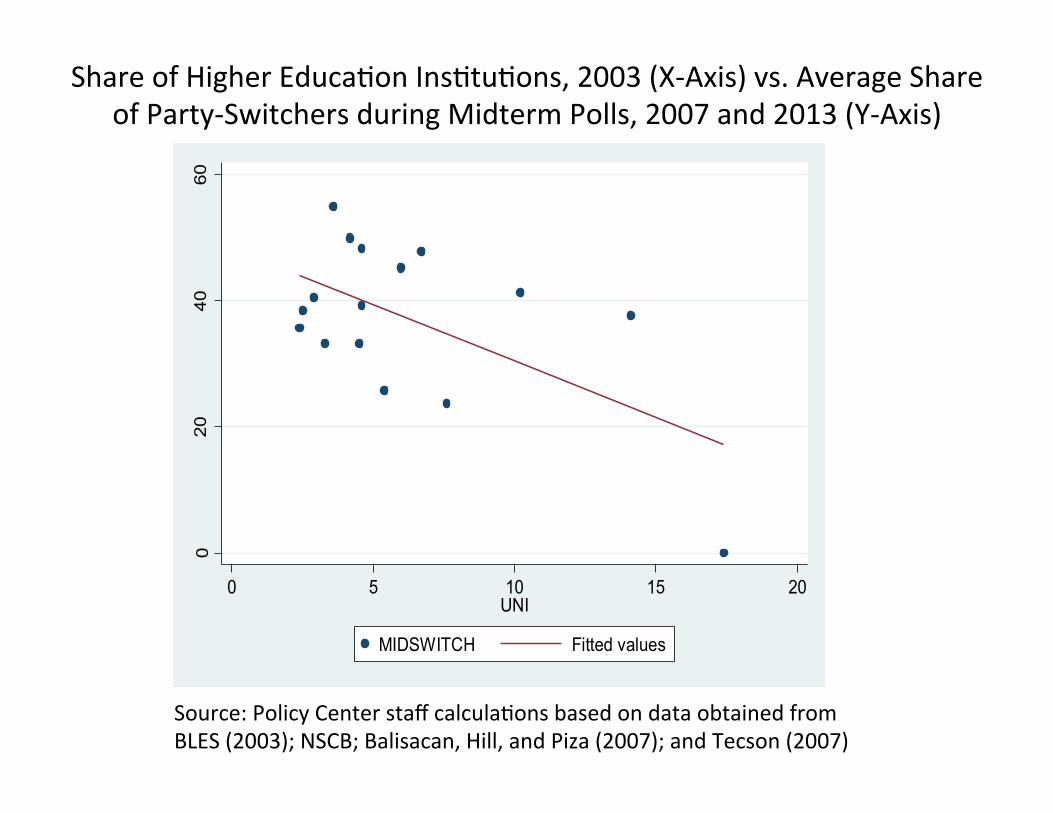
020
4060
0 5 10 15 20UNI
MIDSWITCH Fitted values
Share of Higher Educa?on Ins?tu?ons, 2003 (X-‐Axis) vs. Average Share of Party-‐Switchers during Midterm Polls, 2007 and 2013 (Y-‐Axis)
Source: Policy Center staff calcula?ons based on data obtained from BLES (2003); NSCB; Balisacan, Hill, and Piza (2007); and Tecson (2007)
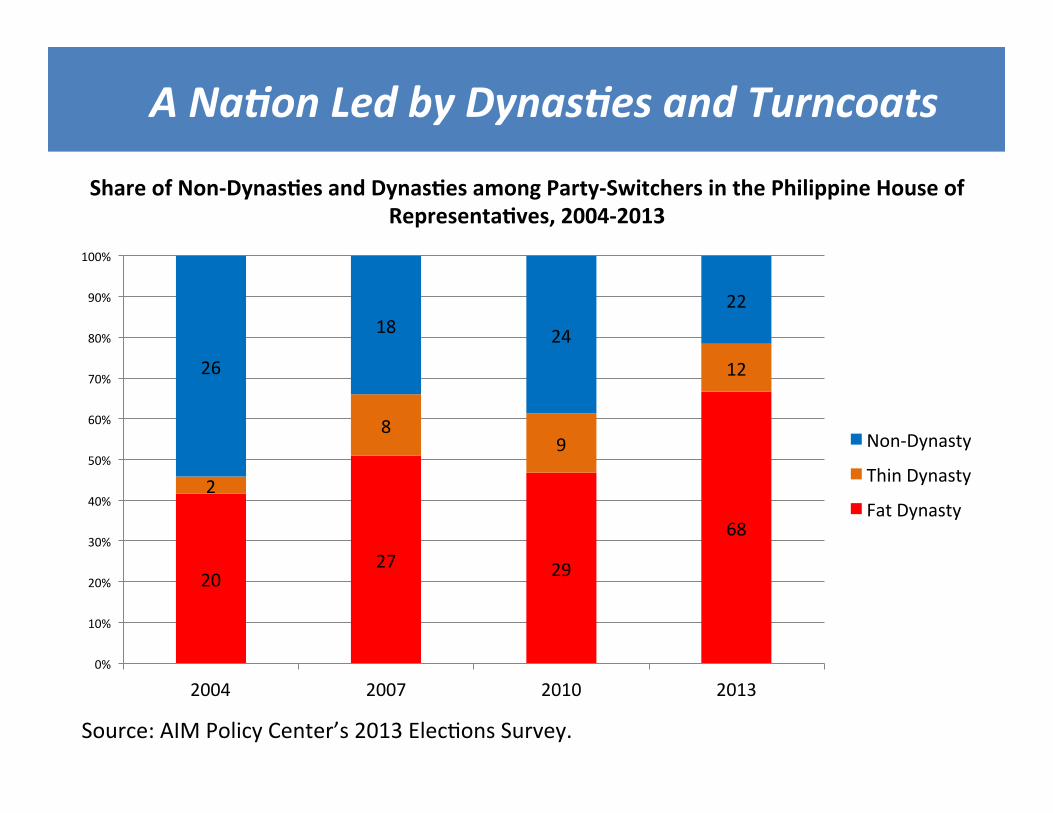
A Na'on Led by Dynas'es and Turncoats
Source: AIM Policy Center’s 2013 Elec?ons Survey.
Share of Non-‐Dynas)es and Dynas)es among Party-‐Switchers in the Philippine House of Representa)ves, 2004-‐2013
20 27 29
68
2
8 9
12 26
18 24
22
0%
10%
20%
30%
40%
50%
60%
70%
80%
90%
100%
2004 2007 2010 2013
Non-‐Dynasty
Thin Dynasty
Fat Dynasty
This presenta?on builds on: Mendoza, R.U., E.Beja, V.Venida and D.Yap. 2012. “An Empirical Analysis of Poli?cal Dynas?es in the 15th Congress.” Philippine Poli*cal Science Journal 33(2):132-‐145. This study is conducted with the support of the Asian Ins?tute of Management Scien?fic Research Founda?on and the Konrad Adenauer Founda?on. The views expressed herein are the authors’ and these do not necessarily reflect the views and policies of the Asian Ins?tute of Management, and the Konrad Adenauer Founda?on.
DEMOCRACY AND INCLUSIVE GROWTH
AIM Policy Center / hEp://Policy.aim.edu
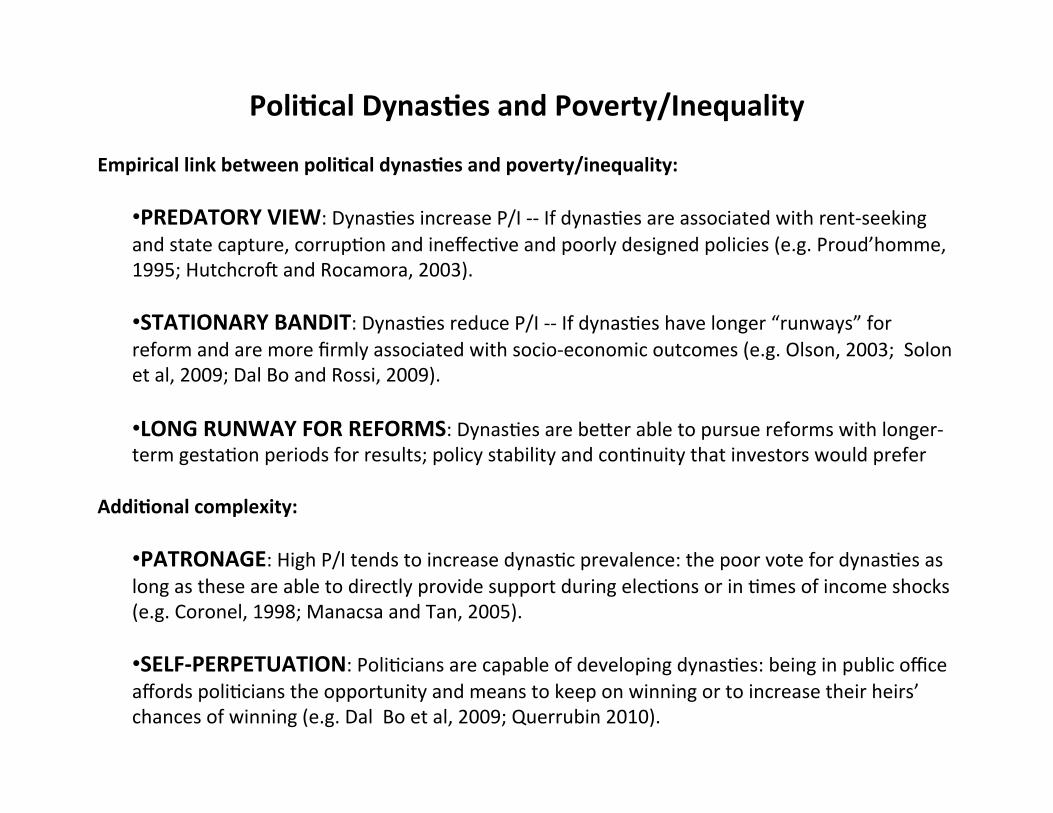
Poli)cal Dynas)es and Poverty/Inequality Empirical link between poli)cal dynas)es and poverty/inequality:
• PREDATORY VIEW: Dynas?es increase P/I -‐-‐ If dynas?es are associated with rent-‐seeking and state capture, corrup?on and ineffec?ve and poorly designed policies (e.g. Proud’homme, 1995; Hutchcrow and Rocamora, 2003).
• STATIONARY BANDIT: Dynas?es reduce P/I -‐-‐ If dynas?es have longer “runways” for reform and are more firmly associated with socio-‐economic outcomes (e.g. Olson, 2003; Solon et al, 2009; Dal Bo and Rossi, 2009).
• LONG RUNWAY FOR REFORMS: Dynas?es are be^er able to pursue reforms with longer-‐term gesta?on periods for results; policy stability and con?nuity that investors would prefer
Addi)onal complexity:
• PATRONAGE: High P/I tends to increase dynas?c prevalence: the poor vote for dynas?es as long as these are able to directly provide support during elec?ons or in ?mes of income shocks (e.g. Coronel, 1998; Manacsa and Tan, 2005).
• SELF-‐PERPETUATION: Poli?cians are capable of developing dynas?es: being in public office affords poli?cians the opportunity and means to keep on winning or to increase their heirs’ chances of winning (e.g. Dal Bo et al, 2009; Querrubin 2010).
Reproduc)ve Health Law
• The core thrust of the Reproduc?ve Health Law is freedom of choice. The law is designed to provide Filipinos with opportuni)es to avail of quality reproduc)ve health care services, methods, devices, and supplies. The law intends to promote, first and foremost, responsible parenthood.
• The law is underpinned by the desire to promote gender equality, further empower Filipino women, and guarantee the welfare of Filipino children.
• The law places emphasis on responsible parenthood. The law is not meant to constrain the freedom of individuals to have children or limit popula?on growth.
0.52
0.7
0.7
0.71
0.75
0.76
0.79
0.81
0 0.1 0.2 0.3 0.4 0.5 0.6 0.7 0.8 0.9
REPUBLIC OF KOREA
INDONESIA
CHINA
VIETNAM
CAMBODIA
PHILIPPINES
THAILAND
MONGOLIA
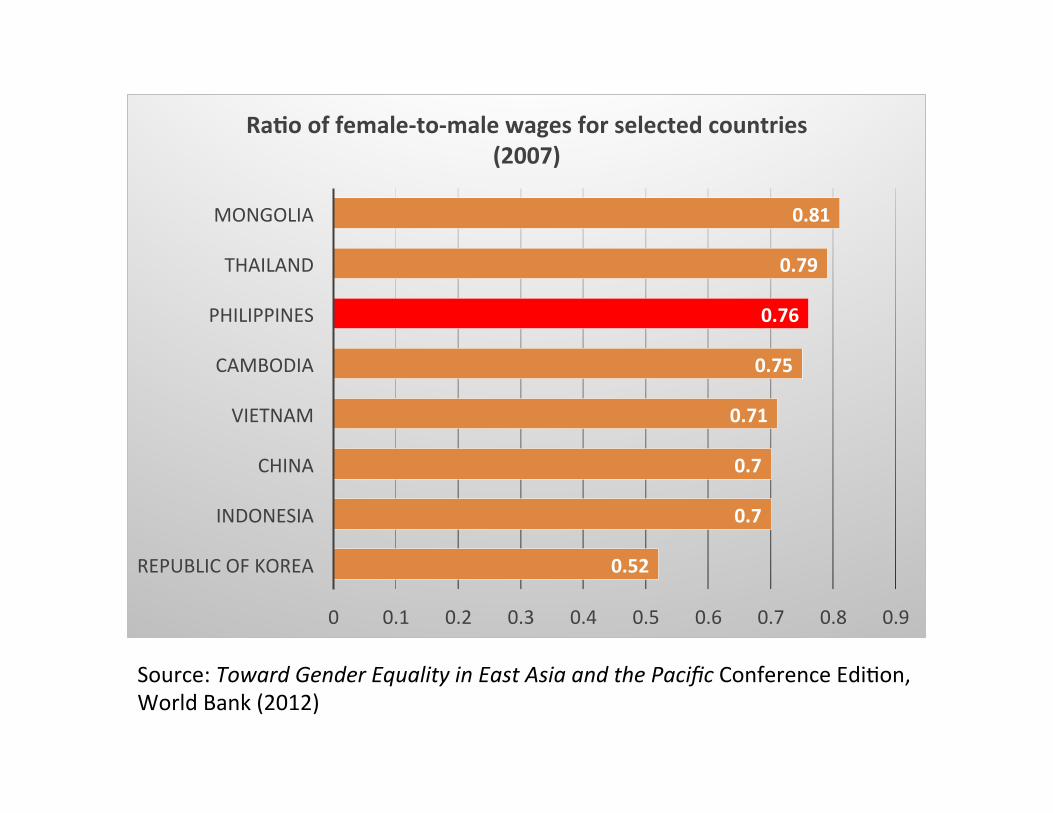
Ra)o of female-‐to-‐male wages for selected countries (2007)
Source: Toward Gender Equality in East Asia and the Pacific Conference Edi?on, World Bank (2012)
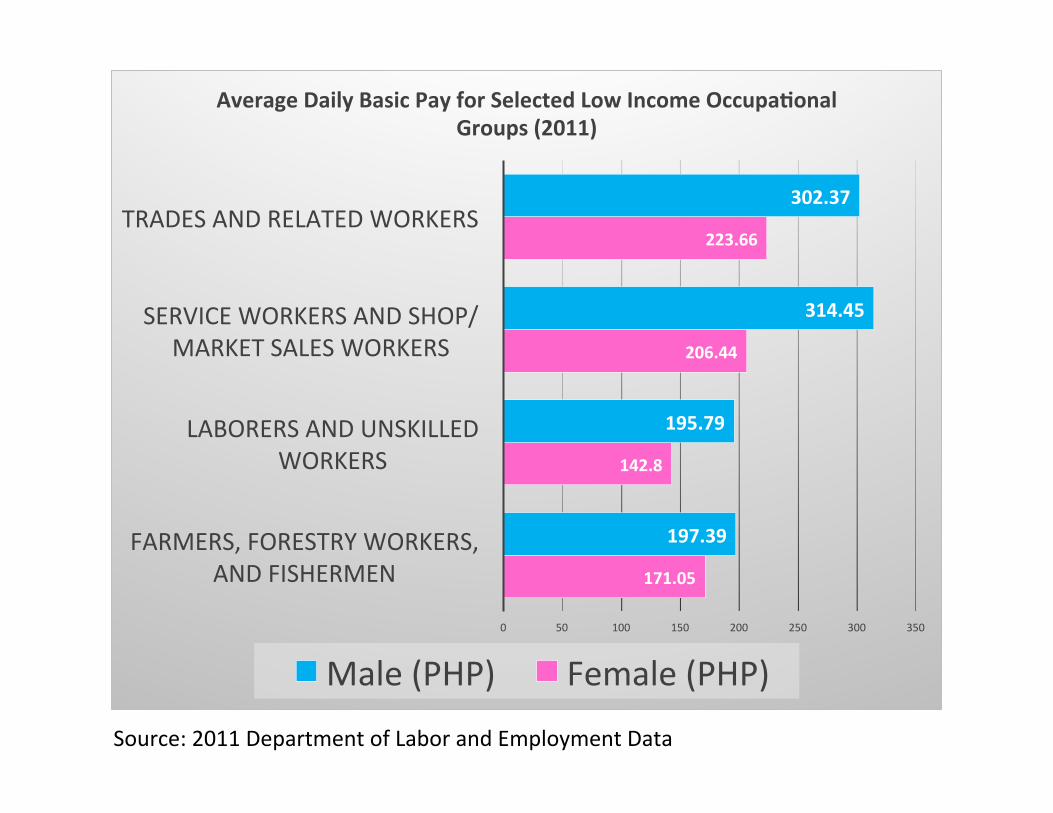
171.05
142.8
206.44
223.66
197.39
195.79
314.45
302.37
0 50 100 150 200 250 300 350
FARMERS, FORESTRY WORKERS, AND FISHERMEN
LABORERS AND UNSKILLED WORKERS
SERVICE WORKERS AND SHOP/MARKET SALES WORKERS
TRADES AND RELATED WORKERS
Average Daily Basic Pay for Selected Low Income Occupa)onal Groups (2011)
Male (PHP) Female (PHP)
Source: 2011 Department of Labor and Employment Data