political campaigns and church contributions
TRANSCRIPT

NBER WORKING PAPER SERIES
POLITICAL CAMPAIGNS AND CHURCH CONTRIBUTIONS
Daniel M. HungermanKevin Rinz
Tim WeningerChungeun Yoon
Working Paper 24374http://www.nber.org/papers/w24374
NATIONAL BUREAU OF ECONOMIC RESEARCH1050 Massachusetts Avenue
Cambridge, MA 02138March 2018
A special thanks to excellent research assistance from Kathleen Ryan and Eric Fein. Mackenzie Jones and Mitchell Murphy also provided helpful assistance. This project was funded by the FRSP program in the Office of Research at Notre Dame. The project was developed while professor Hungerman was working on a project funded by the John Templeton Foundation, but this paper was not funded by Templeton. The authors declare that they have no relevant or material interests that relate to the research described in this paper. The views expressed herein are those of the authors and do not necessarily reflect the views of the National Bureau of Economic Research.
NBER working papers are circulated for discussion and comment purposes. They have not been peer-reviewed or been subject to the review by the NBER Board of Directors that accompanies official NBER publications.
© 2018 by Daniel M. Hungerman, Kevin Rinz, Tim Weninger, and Chungeun Yoon. All rights reserved. Short sections of text, not to exceed two paragraphs, may be quoted without explicit permission provided that full credit, including © notice, is given to the source.
Political Campaigns and Church ContributionsDaniel M. Hungerman, Kevin Rinz, Tim Weninger, and Chungeun YoonNBER Working Paper No. 24374March 2018JEL No. D72,H41,Z12
ABSTRACT
We combine a new dataset of weekly Catholic church donations with a new dataset of presidential-election campaign stops to explore the impact of stops on donations. We find that stops increase donations, with a campaign stop generating 2 percent more donations in the following week. Our results suggest that this effect is of short duration. Further, it does not appear to vary based on the political language used by the parish in its own church bulletins. However, the effect does appear to vary based on the religiosity of the candidates themselves, with Catholic candidates generating the largest increases.
Daniel M. HungermanDepartment of EconomicsUniversity of Notre Dame3056 Jenkins-Nanovic HallsNotre Dame, IN 46556-5602and [email protected]
Kevin Rinz3060 Jenkins Nanovic HallsUniversity of Notre DameNotre Dame, IN [email protected]
Tim Weninger353 Fitzpatrick HallUniversity of Notre DameNotre Dame, IN [email protected]
Chungeun Yoon3060 Jenkins Nanovic HallsUniversity of Notre DameNotre Dame, IN [email protected]
1. Introduction
The scale of US presidential campaigns has become dramatically larger than even a
generation ago; in the past 20 years expenditures on presidential campaigns have increased
nearly 5-fold.1 How do these campaigns impact individuals and communities? A large body
of scholarship has taken up this question. Work has especially focused on how campaigns
affect political participation (see Green and Schwam-Baird, 2016, for a recent review), but
scholars have also investigated whether campaigns affect communities’ social engagement
outside of political participation, with mixed conclusions (e.g., Rahn, Brehm, and Carlson,
2004; Banducci and Karp, 2017; Coleman and Manna, 2000).
In this paper, we explore how the electoral process impacts pro-social behavior, and in
particular how campaign stops made by candidates impact religious donations. Some prior
work has considered the effects of campaign activity on donations, for example, Barton,
Castillo, and Petrie (2015) and Perez-Truglia and Cruces (2017). More generally, recent
work in economics has considered the importance of social context (such as “the power of the
ask”) in motivating giving (DellaVigna, List, Malmendier, 2012; Andreoni, Rao, Trachtman,
2017). We depart from this work by exploring an example of how social context created by
a political event (here, a campaign stop), affects non-political activity.
Exploring religious activity is a natural extension of prior work in several ways. First,
religiosity remains an important form of social participation, with most Americans professing
a belief in God and attending worship with some frequency (Lipka, 2013, 2015), and with
religion continuing to make up by far the largest component of all charitable giving. Second,
religion appears to be an institution closely related to political participation. Individuals’
religiosity is an extremely strong predictor of a person’s likelihood to vote and their political
attitudes (Cohen-Zada, Margalit, and Rigbi, 2016; Chen and Lind, 2016); and some work
1Using data from the Federal Election Committee, Galka (2016) reports the 2016 campaign involved $857million in expenditures, while the 1996 campaign had $182 million, an increase of about 470%. Barton,Castillo, and Petrie (2014) report that expenditures for the 2010 US federal election (presidential and non-presidential) were nearly $4 billion.
1

(Gerber, Gruber, Hungerman, 2016) has concluded that the effect of religion on voting
behavior is causal.
Further, religious activity is not only relevant for both charitable giving and political
participation, but it is also involves unique policy considerations. The relationship between
politicking and religiosity has come under renewed discussion in regards to the current presi-
dential administration’s proposed enforcement of the Johnson Amendment, which threatens
the tax-exempt status of churches if they endorse or oppose particular political candidates.
Religious groups’ enthusiasm for eliminating this amendment appears mixed, with some
“thrilled” by the idea but many religious groups opposing it (Goodstein and Sheer, 2017).
This conflicted response mirrors the inherent uncertainty in whether campaign activity
could benefit churches. The implications of past work are not entirely clear: on the one
hand, if campaigns (for instance) promote tastes for social participation, or let individuals
acquire information or social contacts conducive to future religiosity, then campaign activity
could increase religious participation. On the other hand, as mentioned above, studies have
found mixed results (including small or zero effects) of campaigns on pro-social attitudes.
Campaigns could lower religious participation if, for example, individuals have limited time
for socially-focused activities and campaign participation “crowds out” religious participa-
tion.2 Moreover, recent studies have shown that other activities such as education, while
itself likely important for promoting social capital, may lower religious participation (Becker
and Woessman, 2017; Hungerman, 2014a; Cesur and Mocan, 2014; Mocan and Pogoreova,
2014). But in truth all of this work is tangential to our topic; we know of no extant work
that explores the issue we consider here.3
2Even the authority Alexis de Tocqueville, whose extensive and nuanced writings often emphasized thebeneficial aspects of religion for democracy, warns that the democratic process could undermine certainaspects of religious practices: “Another truth seems clear to me: religions must attend less to externalpractices in democratic times than in all others.” He argues that during these times men “are naturally ledto attach only a secondary importance to the details of worship” (de Tocqueville, 2012; pg 750). Tocqueville’sobservation specifically concerns external practices or “small observances” of faith, and whether his argumentwould apply to religious participation in the present day is an open question.
3However, we do know of important work relating relating religious participation to electoral outcomes,(e.g., Meyersson, 2014; Bhalotra, Cassan, Clots-Figueras, Iyer, 2014).
2
This may in part be explained by data limitations. Churches and other congregations
typically do not report information to any federal census or survey. While well-known surveys
such as the General Social Survey ask individuals questions on their religiosity, the annual
periodicity and relatively small sample sizes of these surveys make them not ideal for our
topic. Further, perhaps surprisingly, we also know of no available dataset with detailed
information on national campaign activity even for the most recent presidential elections.
We overcome these challenges by constructing two new datasets. First, we construct
a dataset of weekly church donations from a sample of hundreds of Catholic churches from
across the United States. This data was obtained from the weekly service bulletins published
by these churches on their websites over a period of several years. Importantly, along with
a church’s exact location, these bulletins almost always include weekly donations collected,
which we use as our measure of religious activity. Further, they include as a potential
datasource the text of the bulletin itself. Our data includes both donations made to each
parish and also a measure of the political content of the words in each bulletin. We discuss
this dataset more below.
Using a wide variety of sources, we then construct a dataset of presidential-campaign stops
during the fall of 2015. Fortunately, the campaign featured a large number of candidates,
giving us a very high amount of variation in stops across communities and across time. Our
data includes all stops made by the top 11 candidates in the presidential race from September
1st, 2015, through December 31st of that year. Overall, we identify a total of 864 distinct
campaign stops, where we observe the location, exact date, and candidate at the stop.
Of course, campaign stops are not randomly made but rather reflect (presumably) careful
strategic thinking by candidates and campaign managers. If certain communities are more
likely to get campaign stops than others, which is obviously true, then care should be taken
that differences in religious behavior observed in towns receiving campaign stops are driven
by the campaign stops and not the underlying characteristics of the towns. We exploit
the high-frequency and years-long availability of our data to non-parametrically control for
3
differences between the observations that see a campaign stop and those that do not. We
find evidence that campaign stops tend to occur in communities with naturally lower levels
of donations, all else equal. This difference appears to be driven by cross sectional (rather
than temporal) variation, and to primarily be driven by differences across states, rather than
within them. We describe our methodology and these differences more below.
Controlling for these differences, we find that a campaign stop made by a presidential
candidate leads to an increase in collections for nearby churches the following week. The
typical increase is moderately large: about 2% of total collected weekly revenue for each
campaign stop. The result does not appear to be driven by churches in any particular state.
We also look at the political language used within the church bulletins, but do not find
strong effects across parishes with differing political content (e.g., using words favored by
Democrats or Republicans) in their bulletins. However, we do find evidence that effects vary
by religiosity of the candidate, with Catholic candidates generating the largest increases in
donations.
Our findings are relevant for past and future work in several ways. First, our results
support the conclusion that campaigns in the short-run promote social participation beyond
political participation. This matters for prior work on the effects of campaigns, and also for
work on how social contexts can affect charitable behavior. Most recent work in economics
in this latter area (Trachtman et al, 2015; Knutsson et al, 2013; Andreoni, Rao, Trachtman,
2017; DellaVigna, List, Malmendier, 2012) explores the costs individuals incur to avoid
solicitation. But our study considers how campaign activity affects donations to a non-
campaign charity, where the induced donations likely occur days afterwards and could easily
be avoided. Our findings suggest that future work should consider the importance of social
context in settings beyond those typically considered when studying “the power of the ask.”
That said, we note that the nature of our study does not allow us to identify what it is
about campaigns that increases donations, although we find evidence against some plausible
explanations suggested by prior work.
4

For example, we find little evidence that this effect endures. In this sense, our findings
do not fit the same conclusions as those reached by the excellent work of Madestam, Shoag,
Veuger, and Yanagizawa-Drott (2013). Their paper shows that attendance at a Tea Party
rally on Tax Day (April 15), 2009, had important impacts on social behavior. They con-
clude that the local, enduring effects from rallies fits Zuckerman’s (2005) “social logic of
politics” wherein the rallies’ effects depend upon social networks, mobilization, and/or habit
formation that lead to enduring effects over time. In contrast, our effects appear to be quite
short-lived and become imprecise and statistically insignificant in a matter of weeks. This
result also suggests that studies on campaign events and public-goods contributions (such
as DellaVigna, 2010, which looks at events in the 2008 presidential campaign and monthly
organ donations) should be sure to use sufficiently high-frequency data.
Beyond this, our work makes several contributions to research on campaigns and on
church/state relations. First, while scholars as noted above have shown an interest in how
campaigns effect social capital, we do not know of any work that looks at religious partic-
ipation as an outcome; our novel focus on religion is useful to work on elections and social
outcomes given the critical role of churches in fostering social cohesion and important social
outcomes.4 Second, many prior studies have focused on campaigns and self-reported mea-
sures of trust, an outcome that is certainly quite important but one that may not accurately
reflect observed (rather than self-reported) outcomes. Third, we focus on an aspect of cam-
paigns that is quite well-known to citizens but is to our knowledge typically overlooked in
the vast elections literature: campaign stops. Fourth, we take both our bulletin data and
our campaign data as unique and potentially useful new resources that may be of interest
to scholars in the future.
The next section discusses our bulletin and campaign data. Section 3 describes our
empirical methodology. Section 4 lays out results, and section 5 concludes.
4Examples of the important social role played by churches include Frank and Iannaccone (2014), Bentzen(2015), Dills and Hernandez-Julian (2014), Gill (2004), Hungerman (2014b), Pope, Price, and Lillard (2014),Chen and Lind (2016); see Iyer, 2016 for a discussion.
5

2. Bulletin and Campaign Data
2.1 Bulletin Data
Our bulletin data provides weekly information on church donations to a national sample
of Catholic churches, or parishes. The term parish, which will be used repeatedly in what
follows, refers to a local Catholic church as well as any related facilities, such as a school,
under the supervision of a particular pastor.
We are aware of a small amount of research using weekly church data, most notably the
studies by Olson (2008) and by Iannaccone and Everton (2004); the former tracks Protestant
churches in one Midwestern city in 2004 and the latter tracks attendance at four churches
for several years in the 1990s and early 2000s. Moreover, while a large literature has focused
on the social importance of parishes, even annual Catholic data with financial information
is difficult to find in prior scholarship.5
To construct our dataset, we first obtained a list of US Parish Web sites from www.
masstimes.org and www.thecatholicdirectory.com. From these lists we identified 11,322
URLs for US parishes and crawled their Web sites to a depth of 3, ie, we downloaded the
Parish’s homepage, visited all the links on the page, all of the links of links, and all of the
links-of-links-of-links. This process collected millions of Web pages but also videos, images,
and pdf documents. To keep from downloading enormous files we limited restricted files to
be less than 5MB in size, and discarded all non-pdf files. We ran this Web crawling process
once every four weeks through January 2016, at which point our server ran out of disk space
for storing documents. In total we collected 836,458 pdf documents comprising 947GBs.
Further, not all Web sites had pdfs, and not all pdfs collected from Web sites were church
bulletins. Non-bulletin files collected included general school/event forms, flyers, passages
5Much of this literature has focused on the notably better outcomes produced by Catholic schools (Evansand Schwab, 1995; Altonji, Elder, and Taber, 2005) and schools’ impacts on economic diversity (see section 5of Black, and Sokoloff, 2006). Other work has considered the impact of parishes on charitable activity moregenerally, such as Bottan and Perez-Truglia (2015). For a discussion of the challenges of obtaining Parishfinancial data, see Hungerman, Rinz, and Frymark (2017).
6

from the Bible, and speeches from pastors. It is often easy for a person to distinguish
bulletins from non-bulletins, but harder for a machine to do so. We threw out pdfs that did
not contain the word ‘bulletin’ in the filename. This resulted in 79,560 parish bulletins.
Figure 1 shows an example of a church bulletin. Names and contact information have
been redacted. The figure shows the first two pages (this bulletin was in total four pages).
As in this figure, most bulletins are weekly, contain parish address information, and contain
information on total donations. These are the key pieces of information we required for our
study. Bulletins often contain other interesting pieces of donation information, such as (here)
the weekly target collection amount. Other items frequently reported include the fraction
of money budgeted towards a particular project, such as a capital campaign, or the total
collected throughout the year to date. However, there is little uniformity in the reporting of
these other items across parishes, and so we focus on the total collected for all purposes by
the parish in a given week for our variable. Also, bulletins do not typically report attendance,
so that the total donations number we focus on could be driven by the number of people
attending worship changing, or by the same number of people changing how much they give.
We will not be able to separate these two behaviors.
Collecting information from these bulletins presented some challenges. While easy to
view, the collection amount in Figure 1 is in a table that could be difficult to identify
as the object of interest using machine reading.6 To deal with these challenges, we hired
workers from Amazon Mechanical Turk (ie, turkers) to extract donation amounts and bulletin
metadata. Based on our available funding, we began with a random sample of about 1500
bulletins and asked 75 turkers to extract information from 20 bulletins each. Entries were
checked for accuracy by a research assistant prior to paying for data entry.7 From the initial
6Note also that there could be two “dates” in the bulletin; the date the bulletin was published, and thedate the collection was taken, which typically is from the week before. Figure 1 shows the date of collectionbut we have omitted the date of publication from the figure (which in this case was reported on page 3).When writing our instructions for data extraction, we paid special care to explicitly clarify how date shouldbe recorded. We further subsequently checked entries to ensure that the “correct” date was entered. Webelieve virtually all bulletins in our study do not confuse these dates.
7We particularly thank our research assistant Kathleen Ryan for her work on this.
7

extraction effort we identified parish URLs with usable bulletins; we then crowdsourced all
bulletins found from these parish URLs.
This left us with a “raw” dataset of 40,950 observations. We next dropped the following
observations: bulletins that did not report the amount of donations, that reported donations
from multiple parishes or from multiple locations within a single parish, and those that did
not report weekly donations. We then re-verified the location of each parish, the dates and
the donations in our data. We finally identified 712 unique parishes in 25,775 observations
between May 2008 and Jan 2016.8 For the main regression sample, we will (as discussed
more below) restrict our data to a date range from 2014 and September through December
of 2015 (but we report results from a larger range as well). This provides us with a dataset
of 10,187 observations with 549 unique parishes.
Figure 2 shows the locations of parishes in our dataset. This sample includes 49 states,
excluding only Montana. It should be kept in mind that our results come from a sample
of all US parishes, and in particular from parishes that have websites (although almost all
parishes have websites). Further, as discussed below, for some estimates we focus on a subset
of 237 of these parishes, although we report results for the full sample as well. But whether
our results would extend to other religious faiths we cannot say.
Table 1 shows some descriptive statistics by counties for (a) the entire United States, (b)
the 712 parishes in the data with usable bulletins and (c) the subsample of these parishes
observed in 2014 and the fall of 2015. The means are taken from the 2010 Decennial Census,
and (excepting the last row) are unweighted. Standard deviations are in brackets. The first
few rows show that the counties included in our sample are reasonably close to the average
county in the United States in terms of the percent white, Hispanic, under 18, or over 65. The
average county population of our sample is greater than the average population in the whole
U.S. This is unsurprising in that larger-population counties are more likely to have more
parishes and thus more likely to be sampled. The last row of means weights by population,
8Our dataset is an unbalanced panel dataset; not all weeks within a date range are necessarily reportedfor every parish.
8

thus comparing the population for the average individual in each type of county. Here the
differences are a bit closer, but again suggest that the average person in the parish-sample
counties lives in a more populous county than does the average person overall.
We will also explore whether campaign effects vary by the political content in the bulletins
themselves. First, we converted the pdf bulletins to text files using “pdftotext” which is a
command line tool for Linux/Mac. Then, we searched each file for occurrences of highly
political words, as given in Gentzkow and Shapiro (2010).9 Aside from being well-known,
Gentzkow and Shapiro’s list has the benefit of being produced independently of the current
project; lessening concerns that we selected words for study with an eye to procuring a
particular result. Out of 150 phrases used more often by Democrats and 150 phrases used
more often by Republicans as identified by Gentzkow and Shapiro, we identified 118 political
phrases in our bulletins in the full sample, 51 democratic and 67 republican. In the Appendix,
we give a list of the 10 most commonly observed democratic and republican phrases in our
bulletins.
2.2 Campaign Data
Our goal is to see how weekly collections reported in church bulletins change when a
presidential candidate visits a community. Perhaps surprisingly, we know of no rigorous
effort that tracked and collated the campaign stops of presidential candidates in the most
recent election. Given this, we undertook our own collection effort.10
The campaign featured a large number of prospective Republican candidates and rela-
tively few Democratic candidates. We focused on campaign stops made by any Republican
candidate that polled in the top 5 of the republican field during the time period of September
1, 2015 to December 31, 2015.11 On the Democratic side, only Hillary Clinton and Bernie
9Gentzkow and Shapiro identify political words by examining the text of speeches given by congressionalRepublicans and Democrats, identifying words that are frequently used by one party’s politicians but notthe other.
10We specifically thank our research assistant Eric Fein for his effort here.11This was determined using the site realclearpolitics.com. Real Clear Politics compiles polling data from
9

Sanders were included as no other candidate drew significant polling numbers. In total, we
use nine Republican and two Democratic candidates.12 Here, the term “campaign stop”
typically refers to public events held by one of these 11 candidates: speeches, town hall
meetings, and meet and greet sessions.13
As no single central repository of campaign stops exists, we instead used a wide variety
of sources to assemble our data. First, some regional news sources reported all stops in a
given area. The New England Cable News kept track of all campaign stops made in New
Hampshire, the Des Moines Register kept track of stops in Iowa, and the Governing Under
the Influence Website14 tracked all stops in both Iowa and New Hampshire. The South
Carolina Republican Party Website tracked stops in South Carolina, and the Reno Gazette-
Journal tracked campaign visits throughout Nevada. In a few instances we also consulted
Google News to verify the locations of a particular stop on a particular day.
Next, for each candidate we also used information sources specific to that candidate’s
campaign to track events. Different campaigns reported their campaign stops in different
ways, and in a few cases a particular form of social media was most helpful: YouTube
(Trump), Instagram (Bush and Rubio), a campaign website (Clinton and Sanders), or Twit-
ter (Christie, Paul and Fiorina). We also made candidate-specific searches in search engines
and in some instances directly communicated with individuals working on campaigns to ver-
ify the details of a campaign stop. Our use of a variety of sources allowed us to cross check
our efforts with the regional cites above to verify the comprehensiveness of each individual
source.
Our resultant campaign database, which is reported in its entirety in the Appendix,
contains 864 stops, covering 34 states and the District of Columbia. The first four states
8 sources including CNN, USA Today, Suffolk, Pew Research and Quinnipiac.12The Republican candidates included are Jeb Bush, Ben Carson, Chris Christie, Ted Cruz, Carly Fiorina,
John Kasich, Rand Paul, Marco Rubio, and Donald Trump.13Candidates also sometimes made stops at the homes of private citizens (for example, wealthy potential
donors). We typically did not include visits to private homes unless these visits included events that wereopen to a large audience.
14This is a non-partisan education project of the American Friends Service Committee (a Quaker Organi-zation that promotes lasting peace with justice as a practical expression of faith in action).
10

to hold primaries or caucuses, all of which took place in February 2016, saw the most visits
from presidential candidates during the last four months of 2015. By far the most visited
states were Iowa and New Hampshire, with 262 and 326 events, respectively. South Carolina
(75) and Nevada (40) were the next most visited states. The places candidates visited most
outside of this group were the District of Columbia (20) and Florida (18). This raises the
issue of how the effect of campaign stops can best be studied methodologically. We turn to
that question next.
3. Methodology
To motivate our methodology, suppose that parish donations could be described as:
lngivepwc = α+ βcampaignwc + γXc + δXw + ρw + φc + θp + f(Xc, Xw, µc, ρw) + εpwc (1)
where lngivepwc is the log of total donations made to parish p in week w in community c.
The variable campaignwc is a measure of campaign activity, such as the number of campaign
stops made in community c in the prior week. The matrices Xc and Xw represent observable
attributes of a community and week in the year that may be relevant for donations, such
as population characteristics (in Xc) or an indicator for whether a certain week includes the
observance of a holiday (in Xw), and the vectors γ and δ are coefficients. Beyond controlling
for the linear effects of observables, there may be unobserved determinants of church activity
across communities and at different times of the year, captured by the effects ρw and φc,
as well as a fixed-effect and a time-varying residual for the parish, respectively denoted by
θp and εpwc. The term f(Xc, Xw, µc, ρw) represents the possibility that community and
week-of-the year characteristics, both observed and unobserved, could interact in complex
ways.15 If these interactions impact both religious donations and candidates’ decisions to
15These interactions could further depend on parish characteristics φ in our methodology; this is omittedfrom the function f in 1 for brevity.
11

visit, then in a regression of donations on campaign activity and the observables Xc and Xw,
the coefficient β would be biased. Note that because of the f term, even with a full set of
fixed effects β could still be biased if f were not controlled for. But the functional form of
f is unknown.
To address this concern, we take the 52-week difference of our data, so that outcomes in
a given week one year are subtracted from the same week the next year. Letting ∆ denote
the 52-week difference, equation 1 then becomes:
∆lngivepwc = β∆campaignwc + ∆εpwc (2)
where all other terms are differenced out, so that we can estimate β in a way that allows
for variation related to a given week, and to a given parish and community, and even to
potentially complex interactions between these variables. Equation 2 represents our baseline
estimation model, although we consider several extensions. These include a non-differenced
OLS estimation of 2, an estimation of 2 that allows for time trends, and non-differenced
fixed-effect estimation.
While we take equation 2 as a strong starting point, we note several concerns that could
persist in its estimation. First, some “intermediate” time effects could be longer than a
week but shorter than a year in duration during the sample. For example, if a factory
opens 6 months after our first observation, and a candidate arrives 6 months later to tout
the factory’s successful start, and the factory raises the incomes (and hence donations) of
parish-goers, then the observed campaign effect could be driven in part by the factory. For
our analysis, we can further exploit the week-by-week variation in our data to see if campaign
stops especially matter in the weeks closest to the stop. Enduring anticipatory increases in
donations before a stop, or enduring increases after a stop, could raise the concern that
our estimates are driven by intermediate dynamic effects. (Although such results could also
fit certain depictions of how campaigns could impact religious behavior.) If our effects are
12

strongest immediately before or after a campaign stop, however, it is evidence against this
sort of effect.
A related concern is that there is an unobserved transitory effect on a certain week that
drives donations and campaigns. For example, perhaps a state fair is held in a given week,
and this both increases donations in a parish and increases the likelihood of a candidate
arriving.16 Since such events are, by assumption, never observed to the econometrician, we
cannot nor could we ever entirely rule out the possibility of their occurrence. In response
to this, we first note that a result of our analysis below is that the effects of campaigns
are short-lived, and this story would likely only strengthen this conclusion. Additionally,
several factors give us confidence that our results are not driven by this “state-fair” type of
story. First, our qualitative observation from constructing our campaign data is that most
campaign stops are not timed to coincide with other standalone events.17 Next, we observe
important differences in response to candidate characteristics, for example, as shown below,
Catholic candidates have stronger effects than non-Catholic candidates, for whom we often
get effects indistinguishable from zero, so that our results do not seem to be driven by a
general pattern wherein stops coincide with other phenomena. One could instead wonder
whether the candidates we observe driving our estimates ran their campaigns differently
than other candidates. We further note that we find similar estimates for candidates (in
particular, for Hillary Clinton and Donald Trump) whose entire campaign strategies appear
to have been extraordinarily different (e.g., Bloomberg News, 2016; Sheridan, 2016). Taken
together, the immediate and dynamic effects of campaign stops, the pattern of results ob-
16Related to this point is the issue that campaign stops could affect donations “mechanically” if they areheld on Sundays (although plausibly this would work against the positive effect we find), as Sunday is akey day for worship (and making donations) for many churchgoers. In fact, almost none of the campaignstops happen on Sundays. Below we show results varying the temporal “distance” of the campaign stop toworship.
17We also attempted in a limited away to quantify this qualitative impression. Two of our campaign-stopsources, the Des Moines Register and the New England Cable News, provided brief descriptions of the natureof each campaign stop. While only for two states, these two sources include a large number of stops (over500) and so we used their descriptions to identify stops that appeared to be held as part of a larger event(e.g., a parade). The vast majority of events–over 80 percent–were not described as related to any otherevent.
13
served across candidates and campaigns, and the qualitative nature of most campaign stops
work in combination to support the robustness of our results.
To estimate equation 2, we need to combine our two datasets. In so doing, we define
campaign stops as close by if they occur within 25 miles of a given parish. The pattern
of results presented in our baseline estimates is not sensitive to this choice, though using
shorter distances does lead to larger point estimates.
In combining our two datasets and employing the specification in equation 2, our esti-
mates will necessarily be driven by parishes with bulletins available 52 weeks apart that see
a campaign stop. Further, since our campaign data covers September through December
of 2015, but not the earlier months of 2015, we omit observations from the earlier months
of 2015 as we do not have campaign information. The resulting sample consists of 2,375
bulletins, from 237 parishes. The distribution of parishes in this sample is close to our
larger sample–in Appendix Figure 1, we replicate the map from Figure 1 using just these
237 parishes; the two figures are similar. We also can use a larger sample by checking our
results in non-52-week differenced data and we do so below.
The total number of campaign stops in the baseline sample is 349. There are 60 parishes
in this sample that see at least one campaign stop, and a total of 142 parish/weeks in the
data where at least one campaign stop occurs. In weeks in which a campaign stop occurs, the
median number of nearby stops is 1, and the mean is about 2.45. The stops are reasonably
widespread, covering 20 states, including several events in states not typically regarded as
“critical” primary battlegrounds.18 We also observe a number of stops for almost all of
our different candidates.19 In the next section we discuss how these stops affect reported
18The likelihood we observe a stop depends upon the likelihood of a stop as well as the likelihood thatwe observe a parish in a community. States with observed stops include Arizona (1 stop), California (6),Connecticut (1), Florida (1), Georgia (3), Iowa (9), Illinois (19), Indiana (1), Massachusetts (19), Maryland(22), New Hampshire (155), New Jersey (23), New York (43), Ohio (2), Pennsylvania (3), South Carolina(12), Tennessee (2), Texas (6), Virginia (15), and Wisconsin (6). We discuss below the sensitivity of ourresults to dropping different states; our results are not driven by any one state.
19An exception is Ben Carson; we only observe 4 stops by Carson in our matched data. We observe 38 forTrump, 25 for Bush, 18 for Rubio, 11 for Cruz, 100 for Clinton, 54 for Sanders, 24 for Christie, 11 for Paul,37 for Kasich, and 27 for Fiorina. Again, we discuss effects for different candidates more below.
14

donations.
4. Results
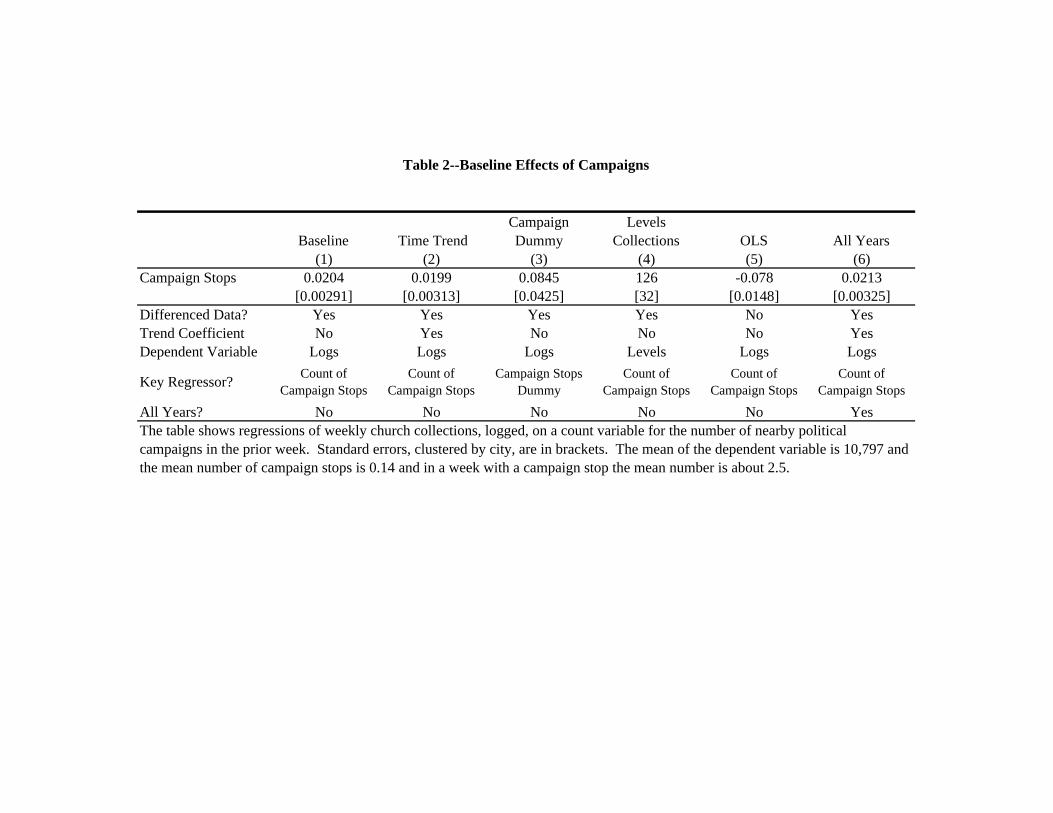
Table 2 presents our baseline estimates. The dependent variable in the initial columns
is logged donations, the unit of observation is a parish bulletin (ie, a parish/week), the
specification is given by equation 2, and robust standard errors, clustered by city, are reported
in brackets. The sample includes all parish data from 2014 and from September through
December of 2015. The key dependent variable is the number of nearby campaign stops in
the week prior to the Sunday when donations were made.
The coefficient suggests that, for each presidential campaign stop, donations increase by
about 2 percent. The mean collection amount in the sample is 10,760 so the implied effect
is a little over $200. As mentioned above, in weeks where a stop occurs the mean number
of stops is about 2.5, so in the average campaign-stop week a parish’s donations increase by
about 5 percent or $500, a moderate but non-trivial effect. As mentioned before, this effect
reflects both changes in the number of attenders and per-attender donation generosity.20
The next column allows for a time trend by adding back the α constant to equation 2;
the results are essentially the same as before (we report more aggressive trend control results
momentarily). Column 3 simply uses a dummy variable for whether any campaign stop
occurred, rather than the number of stops, as the key regressor. The coefficient is slightly
larger in its implied effect. In Column 4, the dependent variable is now donations in levels,
rather than logs; the result is slightly smaller but nonetheless qualitatively similar to the
baseline estimate, suggesting that each campaign stop raises donations by about $130.
In column 5, we report OLS results using non-differenced data. This regression returns
to using total campaign stops and using logged donations (although the results are similar
with levels donations). The estimates now are negative and significant. This indicates that
20We also of course lack information on the number of worshippers involved in any way with a campaignstop, so that we cannot interpret this result as a “treatment on the treated” style effect. In this analysis theunit of observation is best understood as a parish, rather than an individual.
15
campaign stops are more likely to occur near parishes with below-average donation amounts,
but that this is driven by fixed differences in parish donations over time. Returning to the
specification used in column 2, in the final column we redo the estimate in column 2 but
now include all available years of data before 2014. (Redoing this estimate on the baseline
specification yields the same result.) Observations observed in 2013 are differenced off of
2012 bulletins, so that these new observations are taken from bulletins available online several
years after they were produced. There are relatively few such observations (854, raising the
total sample size to 3,229) and they may come from a non-random subsample of our parishes.
However, including these years does not alter our estimates.
Table 2 thus suggests that campaign stops lead to higher donations at worship the fol-
lowing week. Table 3 produces a number of different robustness tests for these results. In
the first panel we redo the baseline estimate but show that the results are robust to dropping
Iowa and New Hampshire, the two states whose primaries receive outsize political attention
and who get a high number of campaign stops. As shown in the table, our results are sim-
ilar, and in fact slightly larger, if we drop these estimates. (The increase in the coefficient
would be consistent, e.g., with a “campaign fatigue” scenario for these states where the large
volume of campaigns diminishes the impact of the marginal campaign on donations.) In the
Appendix we present a histogram where we drop each state in our sample in turn; we find
that our results are not driven by any one state with nearly all estimates staying quite close
to our baseline 0.02 coefficient.
In Panel B of Table 3, we include a variety of fixed-effect controls. (As our data is
differenced, these controls of course have a different interpretation than with non-differenced
data.) The results use all years of data to help in identifying the fixed effects separately.21
Even when including aggressive city, year, and month dummies, our result is qualitatively
close to before. (Note city and year controls would subsume the state and year controls in
column 2, and that the month effects are identified separately from year effects since we have
21Results using the baseline sample are qualitatively similar, although smaller and less precise in columns3 and 4.
16
multiple years.)
In the last panel, we redo the specifications in panel B but now we report estimates from
non-differenced data. The first column shows a negative coefficient, which is unsurprising
given the OLS estimate shown in Table 2 earlier. Once a geographic fixed effect is included,
even a state fixed effect as in column 2, the coefficient becomes positive. The similarity
of column 1 to the earlier OLS, the change from column 1 to column 2, and the slightly
smaller effects in columns 3 and 4, indicate that (a) campaign stops happen in places with
naturally lower donations, that (b) the fixed component driving this lower donation amount
is geographical rather than temporal (else column 1 here would not be negative), and that (c)
this geographic variation is primarily across states, rather than within states (else the final
columns would be larger in size than column 2).22 Overall, the main takeaway from Table
3 is that the positive effect documented in the baseline is robust to a number of different
samples and specifications.
All of these results have used campaign stops in the prior week as the key regressor.
While a week is a natural timespan to consider, Table 4 presents results using alternate
measures of time. The first row for comparison’s sake presents results using the prior week.
Row 2 uses stops from the past 5 days, row 3 uses 10, and row 4, 15. The first column uses
the standard sample, column 2 includes a trend control, and column 3 uses all years. In
all cases, the table shows a clear pattern: the strongest results are observed from stops in
the past 5 days, and the results grow steadily weaker as stops from further back in time are
added. This suggests that the effects of campaign stops diminish over time.
Table 5 develops the possibility of dynamic effects of campaign stops further, here includ-
ing dummies for pre-stop and post-stop. For many observations, stops may occur several
weeks in a row; raising a conceptual question of how to handle, e.g., a bulletin observed two
weeks before a stop and two weeks after an earlier stop. The table takes several approaches
22The smaller coefficients in the last two columns suggest that while states are negatively selected forcampaigns, communities within states are positively selected, else city effects would make the coefficientslarger still. Clearly, the negative-across-state effect dominates, so that when both effects are controlled forthe coefficient remains positive, unlike the OLS result.
17

in light of this issue. The first column reports coefficients on the lead number of campaign
stops in the weeks leading up to the first stop observed by a parish, and also reports coef-
ficients on the lag number of campaign stops in the weeks following the last campaign stop
observed by a parish; “in between” treatment observations are omitted from the sample. In
column 2, we include “in between” weeks and the coefficients now simply report the the lead
and lag number of campaign stops, e.g., the “four weeks before” coefficient is the coefficient
for a variable for observed campaign stops four weeks in the future. The difference in the
columns will be driven by the inclusion of “in between” observations in column 2. The last
column reports estimates from the column 1 specification, but now dummies rather than
campaign-stop counts are used. (Several coefficients match across these columns, that is
because there are a few weeks before the first campaign stop where all observed parishes will
see one stop the first week a campaign stop occurs.) For readability, here we use * markers
to denote standard statistical significance.
The story told across the columns is similar: we consistently see a significant and positive
effect from “contemporaneous” campaign stops, where the “contemporaneous” week refers
to stops in the 7 days before a collection is taken (as defined in the earlier tables). There
are no statistically significant effects observed either before or after the week of a campaign
stop, and indeed several of the post-stop coefficients are negative. Some results are highly
imprecise, so that we cannot reject (for example) that the four-weeks-after coefficient in
column 1 equals the contemporaneous-coefficient value. But together the results in Table 5
fail to provide any evidence that campaign effects endure over time, and instead suggest that
our observed effects are short lived. This contrasts with the Tea-Party effects observed in
Madestam, Shoag, Veuger, and Yanagizawa-Drott (2013), who document strongly persistent
effects over time. We discuss this more in the conclusions.
One might wonder whether the political leanings of a congregation, or of a candidate,
matter for these effects. We begin our investigation of this in Table 6. The three columns
of Table 6 shows results by the inferred political leaning of the parish, which we base,
18

as described earlier, on whether a parish (a) uses a democratic word and never uses a
republican word (“democratic” parishes, for short) or ever uses a republican word and never
uses a democratic work (“republican” parishes).23 Overall, the first three columns show little
evidence that the appearance of politically-loaded language in a bulletin is related to how
donations respond to campaign stops.
The last three columns redo this analysis but break apart campaign stops by the political
party of the candidate. Column 4 uses all stops; the coefficient is somewhat bigger for
democratic candidates but not significantly so. Turning to the last two columns, we again
fail to find any clear or compelling pattern for how political language in bulletins corresponds
to the affects of campaign stops. It is perhaps noteworthy that the republican parishes have a
positive coefficient for republican stops while democratic parishes have a negative coefficient,
but none of these coefficients is significant and we take this observation as suggestive at best.
It is possible, however, that within political party some candidates have different effects
than others. Table 7 investigates this by reporting regressions (including a time trend, as
in column 2 of Table 2) where campaign stops are specific to a particular candidate. As
mentioned earlier, we observe several campaign stops for most candidates, allowing this
comparison across many politicians.24 The top panel in Table 7 begins with the eventual
nominees, Trump and Clinton. Although these candidates were markedly different in their
policy positions, demeanor, campaign strategies, and the details of many of their campaign
stops, both produce similar (and statistically insignificant) coefficients. The next three
candidates in the top panel (Christie, Rubio, Bush) report the largest coefficients of all
candidates, and in all three cases they are at least marginally significant.
Do these three candidates have anything in common? Yes –they are all Catholic, and they
are the only Catholic candidates. The fact that the three Catholic candidates have the largest
23We also considered results using alternate definitions of Democratic and Republican bulletins, suchas whether a parish ever uses a democratic word or ever uses a republican word. Those results are alsostatistically insignificant.
24Since Carson was only observed four times, we omit him from the table. The coefficient on Carson’sstops is 0.248 [se = 0.005].
19

effects on Catholic donations suggests that, beyond particular political positions, campaign
themes, or secular characteristics, the religiosity of a candidate could matter particularly
for galvanizing religious activity. Returning the Johnson Amendment discussion mentioned
in the Introduction, Table 7 also suggests that allowing the promotion of political activity
within churches could particularly benefit faiths with a disproportionate share of political
candidates, at least in the short term.
Overall the results of Tables 2, 3, 4, 5, 6, and 7 show that a campaign stop leads to
an immediate, moderately-sized, and short-lived increase in church donations the following
week. Political words in bulletins do not appear to strongly predict responses to campaign
stops (although this result is tempered by our smaller sample sizes), but we find that our
results are the strongest for Catholic candidates. We take these results are notable for both
future scholarship and policy; we turn to implications in the conclusion.
6. Conclusion
Combining a new dataset of parish donation activity with a new dataset on presidential-
election campaign stops for the fall of 2015, this paper explores the impact of stops on
church donations. We find that stops increase donations, with each campaign stop leading
to 2 percent more donations in the following week. Our results suggest that this effect is of
short duration, does not appear to vary based on the political language used by the parish,
but does appear to vary based on the religiosity of the candidates themselves.
As mentioned above, our results have several implications. First, they highlight the need
for further discussion of the dynamic effects of political activity on other forms of social cap-
ital. The dynamic effects identified here appear different than the strongly persistent effects
identified for Tea Party rallies in Madestam, Shoag, Veuger, and Yanagizawa-Drott’s work.
However, the rally they study was intended to foster a long-term political movement, while
the effect we identify is incidental to the campaign stop, so that the results are potentially
20
harmonious. Our results do raise the possibility, however, that commonly-used outcomes
such as post-election surveys of self-reported trust in the government may quickly dissipate.
Whether they do, or instead endure, we cannot say but our results indicate that scholars
investigating the effects of campaigns in the future should take care to consider dynamic
effects.
Next, our work suggests that policy changes to allow political activity within churches
could benefit some faiths more than others. Also, our results mirror at least some findings
showing that election activity can increase, at least in the short term, social capital, but
while prior findings often use self-reported measures we use donations collected by parishes.
Our results thus suggest that self-reported results, to the extent they match the findings
here, may reflect actual behavior.
Our work also highlights the possibility that, with increasingly sophisticated campaigns
and the policy-driven potential for greater campaign activities within churches, candidates in
the future might more closely organize their campaign activity in conjunction with religious
observance. Whether religious endorsements would matter for candidates is unclear although
prior work (e.g., Garthwaite and Moore, 2012) has explored the potential importance of non-
political endorsements of candidates.
Next, our results document the importance of social context in affecting giving, but differs
from most prior work in this area. Rather than studying how consumers avoid solicitations
to give, we study how one social event affects charitable activity days later (but not weeks
later). Our results suggest that further research is needed to understand the various ways that
social contexts can influence charitable giving. Future work could also refine the charitable
activities considered. Our results here cannot distinguish increased donations from greater
attendance versus greater donative generosity of churchgoers. Moreover, while donations
are obviously a critical aspect of religious life, one might wonder whether campaigns affect
other, more qualitative measures of inherent religiosity. This topic, as well as the above
implications, represent excellent areas for future work.
21

References
[1] Altonji, Joseph, Todd Elder, and Christopher R. Taber. 2005. “Selection On Observed
And Unobserved Variables: Assessing The Effectiveness Of Catholic Schools” Journal
of Political Economy 113: 151-184.
[2] Andreoni, James, Justin Rao, Hannah Trachtman. 2017. “Avoiding the Ask: A Field
Experiment on Altruism, Empathy, and Charitable Giving” Journal of Political Econ-
omy 125: 625-653.
[3] Banducci, Susan, and Jeffrey Karp. 2003. “How Election Change the Way Citizens View
the Political System: Campaigns, Media Effects and Electoral Outcomes in Comparative
Perspective,” British Journal of Political Science 33(3) 443-467.
[4] Barton, Jared, Marco Castillo, and Ragan Petrie. 2016. “Negative Campaigning,
Fundraising, and Voter Turnout: A Field Experiment,” Journal of Economic Behavior
Organization 121: 99-113.
[5] Barton, Jared, Marco Castillo, and Ragan Petrie. 2013. “What Persuades voters? A
Field Experiment on Political Campaigning,” The Economic Journal 124: F293-F325.
[6] Becker, Sascha and Markus Woessman, 2017. “Education and religious participation:
city-level evidence from Germany’s secularization period 1890–1930” Journal of Eco-
nomic Growth, March. 1-39.
[7] Bentzen, Jeanet. 2016. “Acts of God? Religiosity and Natural Disasters Across Subna-
tional World Districts,” Working Paper.
[8] Bhalotra, Sonia, Guilhem Cassan, Irma Clots-Figueras, and Lakshmi Iyer. 2014. “Reli-
gion, Politician Identity and Development Outcomes: Evidence from India,” Journal of
Economic Behavior and Organization. 104, 4-17.
22

[9] Black, Sandra E., and Kenneth L. Sokoloff. 2006. “Long-Term Trends in Schooling: The
Rise and Decline (?) of Public Education in the United States.” in Hanushek and Welch
(eds.) Handbook of the Economics of Education, Volume 1. Elsevier.
[10] Bloomberg News. 2017. “Clinton and Trump Have Very Different Strategies for the
Final Stretch,” Accessed May 10 2017 at https://www.bloomberg.com/graphics/2016-
clinton-trump-campaign-strategies/
[11] Bottan, N. and Perez-Truglia, R. (2015), “Losing my Religion: The Effects of Reli-
gious Scandals on Religious Participation and Charitable Giving,” Journal of Public
Economics 129 106–119
[12] Cesur, Resul, and Naci Mocan. 2014. “Does Secular Education Impact Religiosity, Elec-
toral Participation and the Propensity to Vote for Islamic Parties? Evidence from an
Education Reform in a Muslim Country.” Working paper.
[13] Chen, Daniel, and Jo Thori Lind. 2016. “The Political Economy of Beliefs: Why Fiscal
and Social Conservatives/Liberals (Sometimes) Come Hand-in-Hand.” Working paper.
[14] Cohen Zada, Danny, Yotam Margalit, and Oren Rigbi. 2016. “Does Religiosity Affect
Support for Political Compromise?” International Economic Review 57(3) 1085-1106.
[15] Coleman, John, and Paul Manna. 2000. “Congressional Campaign Spending and the
Quality of Democracy.” The Journal of Politics 62(3), 757-789.
[16] DellaVigna, Stefano. 2010. “The Obama Effect on Economic Outcomes: Evidence from
Event Studies,” Working paper.
[17] DellaVigna, Stefano, John List, and Ulrike Malmendier. 2012. “Testing for Altruism
and Social Pressure in Charitable Giving,” Quarterly Journal of Economics 127, 1-54.
[18] Dills, Angela, and Hernandez-Julian. 2014. “Religiosity and State Welfare,” Journal of
Economic Behavior & Organization 104: 37-51.
23
[19] Enos, Ryan and Anthony Fowler. 2016. “Aggregate Effects of Large-Scale Campaigns
on Voter Turnout,” Political Science Research and Methods 1-19.
[20] Evans, William N. and Robert M. Schwab. 1995. “Finishing High School and Starting
College: Do Catholic Schools Make a Difference?” Quarterly Journal of Economics 110:
941-974.
[21] Franck, Raphael and Laurence Iannaccone. 2014. “Religious Decline in the 20th Century
West: Testing Alternative Explanations,” Public Choice, 159(3): 385-414.
[22] Galka, Max. 2016. “How 2016 Compares to 56 Years of Presidential Campaign Spending,
” Huffington Post November 7, accessed May 10 2017 at http://www.huffingtonpost.
com/entry/56-years-of-presidential-campaign-spending-how-2016_us_
5820bf9ce4b0334571e09fc1
[23] Garthwaite, Craig, and Timothey Moore. 2012. “Can Celebrity Endorsements Affect
Political Outcomes? Evidences from the 2008 US Democratic Presidential Primary,”
The Journal of Law, Economics, & Organization 29(2) 255-384.
[24] Gentzkow, Matthew, and Jesse M. Shapiro. 2010. “What Drives Media Slant? Evidence
from U.S. Daily Newspapers,” Econometrica 78(1): 35-71.
[25] Gerber, Alan, Jonathan Gruber, and Daniel Hungerman. “Does Church Attendance
Cause People to Vote? Using Blue Laws’ Repeal to Estimate the Effect of Religiosity
on Voter Turnout,” British Journal of Political Science, January (2016), 1-20
[26] Gill, Anthony. 2004. “State Welfare Spending and Religiosity A Cross-National Analy-
sis,” Rationality and Society 16: 399-436.
[27] Goodstein, Laurie and Michael Shear. 2017. “Trump’s Order on Religious Liberty
Pleases a Few, but Lets Down Many Conservatives” The New York Times, May 4.
24
[28] Green, Donald, and Michael Schwam-Baird. 2016. “Mobilization, Participation, and
American Democracy: a retrospective and Postscript.” Party Politics 22(2), 158-164.
[29] Hungerman, Daniel. 2014a. “The Effect of Education on Religion: Evidence from Com-
pulsory Schooling Laws” Journal of Economic Behavior & Organization, 104, 52-63
[30] Hungerman, Daniel. 2014b. “Do Religious Proscriptions Matter? Evidence from a
Theory-Based Test,” Journal of Human Resources 49 (4) 1053-1093.
[31] Hungerman, Daniel, Kevin Rinz, and Jay Frymark. 2017. “Beyond the Classroom: the
Implications of School Vouchers for Church Finances,” NBER working paper 23159.
[32] Iannaccone, Laurence, and Sean F. Everton. 2004. “Never on Sunny Days: Lessons from
Weekly Attendance Counts,” Journal for the Scientific Study of Religion 43(2) 191-207.
[33] Iyer, Sryia. 2016. “The New Economics of Religion,” The Journal of Economic Litera-
ture, June, 395-441.
Knutsson, Mikael, Peter Martinsson, and Conny Wollbrant. 2013. “Do People Avoid
Opportunities to Donate? A Natural Field Experiment on Recycling and Charitable
Giving,” Journal of Economic Behavior Organization 93:71-77.
[34] Lipka, Machael. 2013. “What Surveys Say about Worship Attendance–and Why Some
Stay Home.” Pew Research Center Report.
[35] Lipka, Machael. 2015. “Americans Faith in God may be Eroding.” Pew Research Center
Report.
[36] Madestam, Andreas, Daneil Shoag, Stan Veuger, and David Yanagizawa-Drott. 2013.
“Do Political Protests Matter? Evidence from the Tea Party Movement.” Quarterly
Journal of Economics, 1633-1685.
[37] Mocan, Naci, and Luiza Pogorelova. 2014. ”Mandatory Schooling Laws and Formation
of Beliefs: Education, Religion and Superstition,” NBER Working Paper No: 20557.
25

[38] Meyersson, Erik. 2014. “Islamic Rule and the Empowerment of the Poor and Pious,”
Econometrica 82(1), 229-269.
[39] Olson, Paul. 2008. “Any Given Sunday: Weekly Church Attendance in a Midwestern
City,” Journal for the Scientific Study of Religion 47(3), 443-461.
[40] Perez-Truglia, Ricardo, and Guillermo Cruces. 2017. “Partisan Interactions: Evidence
from a Field Experiment in the United States” Journal of Political Economy 125(4):
1208-1243.
[41] Pope, Bryson; Joseph Price and Dean Lillard. 2014. “The Impact of Religion on Youth
Outcomes” Journal of Business Inquiry 13(1): 48-60.
[42] Rahn, Wendy, John Brehm, and Neil Carlson. 2004. “National Elections as Institu-
tions for generating Social Capital,” in: Skoopol, Theda and Morris Fiorina (eds) Civic
Engagement in American Democracy. Brookings Institution Press.
[43] Sheridan, Chris. 2016. “Why Donald Trump Draws Crowds, Hillary Clinton Doesn’t,”
Aljazeera News, accessed May 10 2017 at http://www.aljazeera.com/blogs/
americas/2016/11/hillary-clinton-donald-trump-rallies-161104233413813.
html.
[44] Trachtman, Hannah, Andrew Steinkruger, Mackenzie Wood, Adam Wooster, James
Andreoni, James Murphy, Justin Rao. 2015. “Fair Weather Avoidance: Unpacking the
Costs and Benefits of ‘Avoiding the Ask’” Journal of the Economic Science Association
1: 8-14.
[45] de Tocqueville, Alexis. 2012. Democracy in America Volume 2. Eduardo Nolla, ed.
Liberty Fund Press, Indianapolis.
[46] Zuckerman, Alan. 2005. The Social Logic of Politics. Temple University Press.
26

Figure 1: Sample Church Bulletin
The above shows the first two pages from a sample bulletin. Specific names and contact information have been redacted.
Location
Church Name
Collection

Figure 2:

Whole U
.S.Parishes w
ith Usable
Data
Parishes Observed in
2014 & Fall of 2015
Average %
Population of Whites
82.8879.68
78.24[16.85]
[15.01][15.51]
Average %
Population of Hispanics
8.2811.05
11.66[13.19]
[12.31][12.48]
Average %
Population of Persons under 18 years23.42
23.5723.65
[3.38][2.97]
[2.97]
Average %
Population of Persons 65 years and over15.88
13.9313.76
[4.19][3.76]
[3.55]
Average Population
98,233422,526
473,013[312901]
[749225][813604]
Weighted A
verage Population1,094,601
1,747,7001,868,129
[1891638][2334891]
[2402593]
Num
ber of Counties
3,143396
324
Table 1: D
escriptive Statistics
The source for Table 1 is 2010 U.S. C
ensus Summ
ary File 1, a 100 percent sample of the w
hole population of the U.S.,
provided by the U.S. C
ensus Bureau. Standard deviations are presented in brackets below
the means. In our sam
ple, we
identified 396 unique counties where 712 parishes are located for the usable-data sam
ple presented in Colum
n 2 and 324 unique counties from
549 parishes for the main-period-of-study sam
ple presented in Colum
n 3. The White population here
refers to a person who m
arked only the White category on the questionnaire. The H
ispanic population refers to a person of H
ispanic or Latino origins regardless of race. The averages are the (unweighted) average of each county's population
except for the final row, w
hich is weighted by county's population.
Baseline Time TrendCampaign Dummy
Levels Collections OLS All Years
(1) (2) (3) (4) (5) (6)Campaign Stops 0.0204 0.0199 0.0845 126 -0.078 0.0213
[0.00291] [0.00313] [0.0425] [32] [0.0148] [0.00325]Differenced Data? Yes Yes Yes Yes No YesTrend Coefficient No Yes No No No YesDependent Variable Logs Logs Logs Levels Logs Logs
Key Regressor? Count of Campaign Stops
Count of Campaign Stops
Campaign Stops Dummy
Count of Campaign Stops
Count of Campaign Stops
Count of Campaign Stops
All Years? No No No No No Yes
Table 2--Baseline Effects of Campaigns
The table shows regressions of weekly church collections, logged, on a count variable for the number of nearby political campaigns in the prior week. Standard errors, clustered by city, are in brackets. The mean of the dependent variable is 10,797 and the mean number of campaign stops is 0.14 and in a week with a campaign stop the mean number is about 2.5.

Panel A: Dropping Iowa and New Hampshire
From Table 2 No New Hampshire No IowaNo New Hampshire &
No Iowa(1) (2) (3) (4)
Campaign Stops 0.0204 0.0283 0.0205 0.0294[0.00291] [0.0158] [0.00297] [0.0167]
Panel B: Alternate Controls
Month DummiesMonth & State
DummiesCity & Year
DummiesMonth, City & Year
Dummies(1) (2) (3) (4)
Campaign Stops 0.0176 0.02 0.0201 0.0173[0.00301] [0.00359] [0.0115] [0.0113]
Panel C: Alternate Controls on Undifferenced Data
Month DummiesMonth & State
DummiesCity & Year
DummiesMonth, City & Year
Dummies(1) (2) (3) (4)
Campaign Stops -0.0366 0.0543 0.016 0.015[0.0194] [0.0103] [0.00925] [0.00917]
Table 3--Alternate Specifications
The tables shows regressions of weekly church collections on a count variable for the number of nearby political campaigns in the prior week. Standard errors, clustered by city, are in brackets. The first panel shows results from the baseline regression in Table 2, dropping Iowa and/or New Hampshire. In panel B, month, state, and year dummies are added (as the data is 52-week differenced, these variables have a different interpretation than in levels data). In the final panel these specifications are repeated for data that is not differenced.

2015-2014 2015-2014, with Trend All Years, with Trend(1) (2) (3)
Campaigns Stops 0.0204 0.0199 0.0213[0.00291] [0.00313] [0.00325]
Campaigns Stops-past 5 days 0.0231 0.0225 0.0241[0.00319] [0.00335] [0.00346]
Campaigns Stops--Past 10 days 0.0168 0.0166 0.0175[0.00182] [0.00204] [0.00213]
Caompaigns Stops--past 15 days 0.0143 0.0141 0.0149[0.00122] [0.00148] [0.00151]
Table 4--Alternate Durations for Campaigns
The table shows regressions of weekly church collections on different count variables for the number of nearby political campaigns in the prior week. Standard errors, clustered by city, are in brackets. Each coefficient is from a separate regression. Row 1 reports the basline results using total compaign stops in the prior week.

(1) (2) (3)4 Weeks Before 0.106 0.0185 0.106
[0.0852] [0.0393] [0.0852]
3 Weeks Before -0.00375 -0.00359 -0.00375[0.0558] [0.0338] [0.0558]
2 Weeks Before -0.028 -0.0244 -0.028[0.0582] [0.0352] [0.0582]
1 Week Before 0.0431 0.0194 0.0353[0.0374] [0.0317] [0.0398]
Campaign Stops 0.0167*** 0.0107*** 0.0845**[0.00326] [0.00376] [0.0425]
1 Week After -0.0238 0.0223 0.0713[0.0441] [0.0326] [0.0556]
2 Weeks After -0.0602 0.0432 0.0376[0.0533] [0.0481] [0.108]
3 Weeks After -0.000434 0.0305 -0.0184[0.0490] [0.0368] [0.0540]
4 Weeks After -0.00831 0.0148 -0.00178[0.0643] [0.0390] [0.0558]
Table 5--Before and After Campaign Stops
The first column reports the lead and lag number of campaign stops in the weeks leading up to the first campaign stop observed by a parish and the weeks following the last campaign stop observed. In column two, lead and lag number of campaign stops are used for all weeks and all campaign stops, eg., the “four weeks before” coefficient is the coefficient for a variable for observed campaign stops four weeks in the future. The difference in the columns will be driven by the inclusion off “in between” observations in column 2. The last column uses a set of dummies for the weeks before the first campaign stop observed at a parish, and a set of dummies for the weeks following the last campaign stop (rather than a variable for the number of stops). For ease of interpretation, stars are included to denote 10 (*), 5(**), and 1 (***) percent significance.

All Bulletins Democratic Bulletin Republican Bulletin All Bulletins Democratic Bulletin Republican Bulletin(1) (2) (3) (4) (5) (6)
Campaign Stops 0.0204 -0.0315 0.0154 - - -[0.00291] [0.0849] [0.0102]
Democratic Stops - - - 0.0326 0.00136 0.0168[0.0189] [0.141] [0.0189]
Republican Stops - - - 0.0168 -0.069 0.0125[0.00286] [0.0585] [0.0157]
Observations 2,375 180 581 2,375 180 581In columns 1, 2, and 3, each coefficient is from a different regression where logged donations is th dependent variable. In each column, the sample changes based on whether all bulletins are used (column 1), from parishes that use democratic words but never use republican words (2), or ever use republican but never democratic (3). In the last three columns the regressions are repeated but now the coefficient on campaign stops is broken apart by whether stops were made by a democratic candidate or republican candidate.
Table 6--Effects by Political Words in Bulletins and Political Party of Candidate

Trump Clinton Christie Rubio BushCampaign Stops 0.0329 0.05 0.16 0.122 0.0815
[0.0420] [0.0305] [0.00674] [0.0750] [0.00833]
Cruz Sanders Kasich Paul FiorinaCampaign Stops 0.0319 0.0618 0.0544 0.00857 0.0394
[0.0385] [0.0265] [0.00607] [0.0443] [0.00654]The table shows the effects of campaign stops on parish collections by specific candidate. Each cell is from a separate regression. Results are differenced as in other tables and standard errors are in brackets. The top panel includes the two eventual nominees, Trump (a Presbyterian), Clinton (Methodist), the three Catholic candidates. The bottom panel includes other non-Catholic and non-nominee candidates.
Table 7--Results by Candidate

Rank Democratic Words Frequency Republican Words Frequency1 senior citizens 1150 boy scouts 16002 credit card 696 human life 15153 african american 296 ten commandments 2364 low income 243 post office 2155 poor people 140 third time 1086 civil rights 107 stem cell 957 living in poverty 57 natural gas 788 million americans 36 embryonic stem 759 child labor 33 immigration reform 7210 minimum wage 32 food program 68
Appendix Table 1: Political Phrases used Most Often in Bulletins

Appendix Table 2--Campaign Stops by Candidate, Date, and LocationDate Trump Trump2 Bush Bush2 Bush3 Rubio Rubio2 Rubio3 Date
9/1/2015 Norwood, NH Carson City, NV Fallon, NV Yerrington, NV 9/1/20159/2/2015 Oklahoma City, OK 9/2/20159/3/2015 Hampton, NH Laconia, NH Chattenooga, TN 9/3/20159/4/2015 9/4/20159/5/2015 San Juan, Puerto Rico 9/5/20159/6/2015 9/6/20159/7/2015 Charleston, SC Milford, NH 9/7/20159/8/2015 Hooksett, NH Keene, NH 9/8/20159/9/2015 Washington, DC 9/9/2015
9/10/2015 Exeter, NH Salem, NH 9/10/20159/11/2015 Manohester, NH Londonderry, NH Ankeny, IA 9/11/20159/12/2015 Boone, IA Iowa City, IA Ames, IA 9/12/20159/13/2015 9/13/20159/14/2015 Dallas, TX 9/14/20159/15/2015 9/15/20159/16/2015 Simi Valley, CA (Debate) Simi Valley, CA (Debate) 9/16/20159/17/2015 Rochester, NH 9/17/20159/18/2015 Mackinac Island, MI 9/18/20159/19/2015 Des Moines, IA Athens, GA Mackinac Island, MI 9/19/20159/20/2015 9/20/20159/21/2015 Mason City, IA Atlanta, GA 9/21/20159/22/2015 Cedar Falls, IA Cedar Rapids, IA 9/22/20159/23/2015 Columbia, SC Gladbrook, IA 9/23/20159/24/2015 9/24/20159/25/2015 Oklahoma City, OK Washington, DC Washington DC 9/25/20159/26/2015 9/26/20159/27/2015 9/27/20159/28/2015 New York, NY The Villages, FL 9/28/20159/29/2015 Portsmouth, NH 9/29/20159/30/2015 Keene, NH Manchester, NH Bedford, NH 9/30/201510/1/2015 Cedar Falls, IA 10/1/201510/2/2015 Greenville, SC Dubuque, IA 10/2/201510/3/2015 Franklin, TN 10/3/201510/4/2015 Dubuque, IA 10/4/201510/5/2015 10/5/201510/6/2015 Davenport, IA Bedford, NH Manchester, NH 10/6/201510/7/2015 Waterloo, IA Oskaloosa, IA Wolfeboro, NH Dover, NH 10/7/201510/8/2015 Indianola, IA Las Vegas, NV Summerlin, NV 10/8/201510/9/2015 Las Vegas, NV Enterprise, NV 10/9/2015
10/10/2015 Norcross, GA Knoxville, TN North Las Vegas, NV Boulder City, NV 10/10/201510/11/2015 Knoxville, TN 10/11/201510/12/2015 Manchester, NH 10/12/201510/13/2015 Manchester, NH Keene, NH 10/13/201510/14/2015 Richmond, VA Concord, NH Lebanon, NH Derry, NH Porsmouth, NH 10/14/201510/15/2015 Concord, NH Philedelphia, PA Pittsburg, PA 10/15/201510/16/2015 Tyngsborough, MA Salem, OH 10/16/201510/17/2015 Portsmouth, NH Portsmouth, NH 10/17/201510/18/2015 10/18/201510/19/2015 Anderson, SC 10/19/201510/20/2015 Salt Lake City, UT 10/20/201510/21/2015 Burlington, IA Reno, NV North Las Vegas, NV 10/21/201510/22/2015 10/22/201510/23/2015 Miami, FL Mount Pleasant, SC 10/23/201510/24/2015 Jackson, FL 10/24/201510/25/2015 10/25/201510/26/2015 Atkinson, NH 10/26/201510/27/2015 Sioux City, IA El Dorado Springs, CO 10/27/201510/28/2015 Boulder, CO (Debate) Boulder, CO (Debate) Boulder, CO (Debate) 10/28/201510/29/2015 Reno, NV New London, NH Portsmouth, NH 10/29/201510/30/2015 Portsmouth, NH Orange City, IA Sioux City, IA 10/30/201510/31/2015 Norfolk, VA Des Moines, IA Des Moines, IA Mason City, IA 10/31/2015
11/1/2015 Wolfboro, NH 11/1/201511/2/2015 Orlando, FL 11/2/201511/3/2015 New York, NY Rye, NH Raymond, NH 11/3/201511/4/2015 Concord, NH Manchester, NH Hollis, NH Wolfeboro, NH Nashua, NH Manchester, NH 11/4/201511/5/2015 North Conway, NH Somersworth, NH Concord, NH 11/5/201511/6/2015 11/6/201511/7/2015 11/7/201511/8/2015 11/8/201511/9/2015 Springfleild, IL Burlington, WI 11/9/2015
11/10/2015 Milwaukee, WI (Debate) Milwaukee, WI (Debate) 11/10/201511/11/2015 Manchester, NH Johnston, IA Atlantic, IA Waukee, IA Davenport, IA 11/11/201511/12/2015 Fort Dodge, IA Tuftonboro, NH Columbia, SC 11/12/201511/13/2015 Orlando, FL Franklin, NH Orlando, FL Orlando, FL 11/13/201511/14/2015 Beaumont, TX 11/14/201511/15/2015 11/15/201511/16/2015 Knoxville, TN 11/16/201511/17/2015 Florence, SC Charleston, SC 11/17/201511/18/2015 Bedford, NH 11/18/201511/19/2015 Newton, IA Manchester, NH Londonderry, NH 11/19/201511/20/2015 Spartanburg, SC Des Moines, IA 11/20/201511/21/2015 Birmingham, AL Des Moines, IA 11/21/201511/22/2015 11/22/201511/23/2015 Columbus, OH 11/23/201511/24/2015 Myrtle Beach, SC Gaffney, SC 11/24/201511/25/2015 Charleston, SC 11/25/201511/26/2015 11/26/201511/27/2015 11/27/201511/28/2015 Sarasota, FL Starkville, MS 11/28/201511/29/2015 11/29/201511/30/2015 Macon, GA Goose Lake, IA Laconia, NH Rye, NH 11/30/201512/1/2015 Waterville Valley, NH Waterloo, IA Guntersville, AL 12/1/201512/2/2015 Manassas, VA Goose Lake, IA 12/2/201512/3/2015 New York, NY Waterloo, IA Newton, IA 12/3/201512/4/2015 Raleigh, NC Dubuque, IA Greenland, NH Concord, NH 12/4/201512/5/2015 Davenport, IA Spencer, IA 12/5/201512/6/2015 12/6/201512/7/2015 Mount Pleasant, SC 12/7/201512/8/2015 Hooksett, NH Manchester, NH 12/8/201512/9/2015 Manchester, NH 12/9/2015
12/10/2015 Portsmouth, NH Milford, NH Ames, IA West Des Moines, IA 12/10/201512/11/2015 Des Moines, IA Iowa City, IA 12/11/201512/12/2015 Aiken, SC Derry, NH Greenville, SC 12/12/201512/13/2015 12/13/201512/14/2015 Las Vegas, NV Green Valley, NV 12/14/201512/15/2015 12/15/201512/16/2015 Mesa, AZ Ankeny, IA Manchester, NH 12/16/201512/17/2015 Knoxville, IA Muscatine, IA 12/17/201512/18/2015 Dubuque, IA 12/18/201512/19/2015 Cedar Rapids, IA Exeter, NH Contoocook, NH Windham, NH Spartanburg, SC Anderson, SC 12/19/201512/20/2015 Nashua, NH 12/20/201512/21/2015 Grand Rapids, MI Alton, NH Bartlett, NH Rochester, NH 12/21/201512/22/2015 Conway, MA Berlin, NH Littleton, NH Berlin, NH North Conway, NH 12/22/201512/23/2015 Littleton, NH Franklin, NH 12/23/201512/24/2015 12/24/201512/25/2015 12/25/201512/26/2015 12/26/201512/27/2015 12/27/201512/28/2015 Nashua, NH Ocala, FL 12/28/201512/29/2015 Council Bluffs, IA Clinton, IA Waterloo, IA 12/29/201512/30/2015 Hilton Head, SC Lexington, SC Newton, IA 12/30/201512/31/2015 Biloxi, MS 12/31/2015
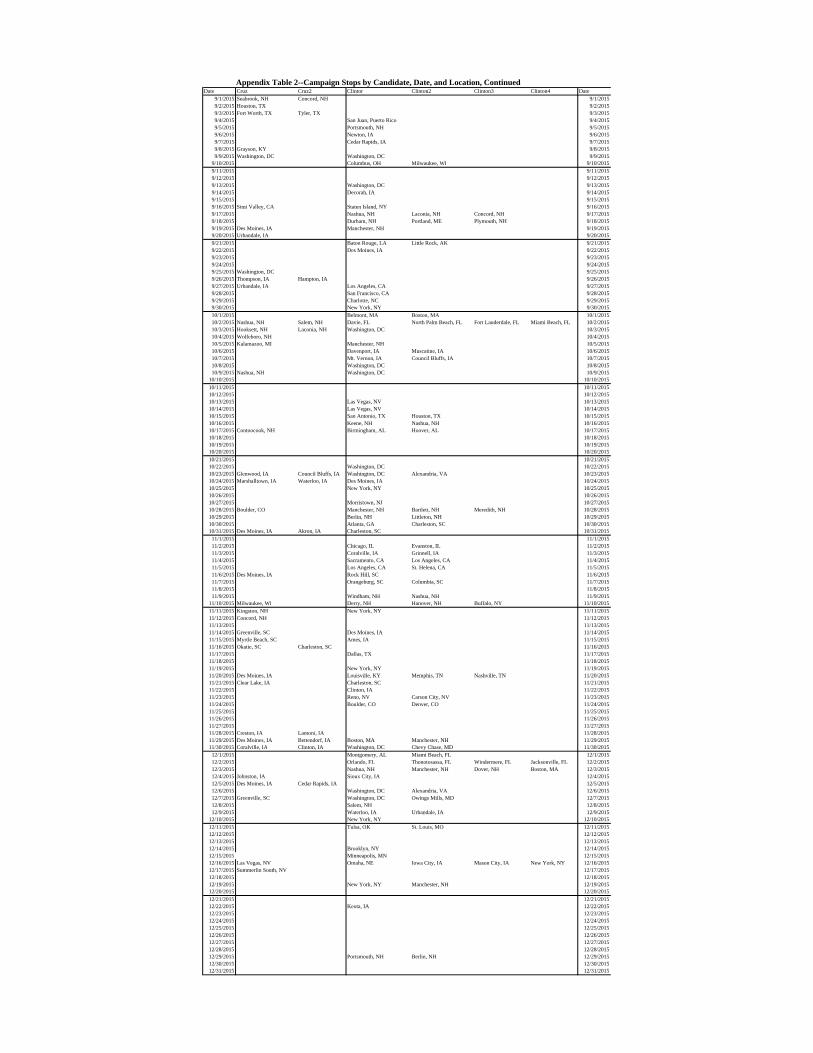
Appendix Table 2--Campaign Stops by Candidate, Date, and Location, ContinuedDate Cruz Cruz2 Clinton Clinton2 Clinton3 Clinton4 Date
9/1/2015 Seabrook, NH Concord, NH 9/1/20159/2/2015 Houston, TX 9/2/20159/3/2015 Fort Worth, TX Tyler, TX 9/3/20159/4/2015 San Juan, Puerto Rico 9/4/20159/5/2015 Portsmouth, NH 9/5/20159/6/2015 Newton, IA 9/6/20159/7/2015 Cedar Rapids, IA 9/7/20159/8/2015 Grayson, KY 9/8/20159/9/2015 Washington, DC Washington, DC 9/9/2015
9/10/2015 Columbus, OH Milwaukee, WI 9/10/20159/11/2015 9/11/20159/12/2015 9/12/20159/13/2015 Washington, DC 9/13/20159/14/2015 Decorah, IA 9/14/20159/15/2015 9/15/20159/16/2015 Simi Valley, CA Staten Island, NY 9/16/20159/17/2015 Nashua, NH Laconia, NH Concord, NH 9/17/20159/18/2015 Durham, NH Portland, ME Plymouth, NH 9/18/20159/19/2015 Des Moines, IA Manchester, NH 9/19/20159/20/2015 Urbandale, IA 9/20/20159/21/2015 Baton Rouge, LA Little Rock, AK 9/21/20159/22/2015 Des Moines, IA 9/22/20159/23/2015 9/23/20159/24/2015 9/24/20159/25/2015 Washington, DC 9/25/20159/26/2015 Thompson, IA Hampton, IA 9/26/20159/27/2015 Urbandale, IA Los Angeles, CA 9/27/20159/28/2015 San Francisco, CA 9/28/20159/29/2015 Charlotte, NC 9/29/20159/30/2015 New York, NY 9/30/201510/1/2015 Belmont, MA Boston, MA 10/1/201510/2/2015 Nashua, NH Salem, NH Davie, FL North Palm Beach, FL Fort Lauderdale, FL Miami Beach, FL 10/2/201510/3/2015 Hooksett, NH Laconia, NH Washington, DC 10/3/201510/4/2015 Wolfeboro, NH 10/4/201510/5/2015 Kalamazoo, MI Manchester, NH 10/5/201510/6/2015 Davenport, IA Muscatine, IA 10/6/201510/7/2015 Mt. Vernon, IA Council Bluffs, IA 10/7/201510/8/2015 Washington, DC 10/8/201510/9/2015 Nashua, NH Washington, DC 10/9/2015
10/10/2015 10/10/201510/11/2015 10/11/201510/12/2015 10/12/201510/13/2015 Las Vegas, NV 10/13/201510/14/2015 Las Vegas, NV 10/14/201510/15/2015 San Antonio, TX Houston, TX 10/15/201510/16/2015 Keene, NH Nashua, NH 10/16/201510/17/2015 Contoocook, NH Birmingham, AL Hoover, AL 10/17/201510/18/2015 10/18/201510/19/2015 10/19/201510/20/2015 10/20/201510/21/2015 10/21/201510/22/2015 Washington, DC 10/22/201510/23/2015 Glenwood, IA Council Bluffs, IA Washington, DC Alexandria, VA 10/23/201510/24/2015 Marshalltown, IA Waterloo, IA Des Moines, IA 10/24/201510/25/2015 New York, NY 10/25/201510/26/2015 10/26/201510/27/2015 Morristown, NJ 10/27/201510/28/2015 Boulder, CO Manchester, NH Bartlett, NH Meredith, NH 10/28/201510/29/2015 Berlin, NH Littleton, NH 10/29/201510/30/2015 Atlanta, GA Charleston, SC 10/30/201510/31/2015 Des Moines, IA Akron, IA Charleston, SC 10/31/2015
11/1/2015 11/1/201511/2/2015 Chicago, IL Evanston, IL 11/2/201511/3/2015 Coralville, IA Grinnell, IA 11/3/201511/4/2015 Sacramento, CA Los Angeles, CA 11/4/201511/5/2015 Los Angeles, CA St. Helena, CA 11/5/201511/6/2015 Des Moines, IA Rock Hill, SC 11/6/201511/7/2015 Orangeburg, SC Columbia, SC 11/7/201511/8/2015 11/8/201511/9/2015 Windham, NH Nashua, NH 11/9/2015
11/10/2015 Milwaukee, WI Derry, NH Hanover, NH Buffalo, NY 11/10/201511/11/2015 Kingston, NH New York, NY 11/11/201511/12/2015 Concord, NH 11/12/201511/13/2015 11/13/201511/14/2015 Greenville, SC Des Moines, IA 11/14/201511/15/2015 Myrtle Beach, SC Ames, IA 11/15/201511/16/2015 Okatie, SC Charleston, SC 11/16/201511/17/2015 Dallas, TX 11/17/201511/18/2015 11/18/201511/19/2015 New York, NY 11/19/201511/20/2015 Des Moines, IA Louisville, KY Memphis, TN Nashville, TN 11/20/201511/21/2015 Clear Lake, IA Charleston, SC 11/21/201511/22/2015 Clinton, IA 11/22/201511/23/2015 Reno, NV Carson City, NV 11/23/201511/24/2015 Boulder, CO Denver, CO 11/24/201511/25/2015 11/25/201511/26/2015 11/26/201511/27/2015 11/27/201511/28/2015 Creston, IA Lamoni, IA 11/28/201511/29/2015 Des Moines, IA Bettendorf, IA Boston, MA Manchester, NH 11/29/201511/30/2015 Coralville, IA Clinton, IA Washington, DC Chevy Chase, MD 11/30/2015
12/1/2015 Montgomery, AL Miami Beach, FL 12/1/201512/2/2015 Orlando, FL Thonotosassa, FL Windermere, FL Jacksonville, FL 12/2/201512/3/2015 Nashua, NH Manchester, NH Dover, NH Boston, MA 12/3/201512/4/2015 Johnston, IA Sioux City, IA 12/4/201512/5/2015 Des Moines, IA Cedar Rapids, IA 12/5/201512/6/2015 Washington, DC Alexandria, VA 12/6/201512/7/2015 Greenville, SC Washington, DC Owings Mills, MD 12/7/201512/8/2015 Salem, NH 12/8/201512/9/2015 Waterloo, IA Urbandale, IA 12/9/2015
12/10/2015 New York, NY 12/10/201512/11/2015 Tulsa, OK St. Louis, MO 12/11/201512/12/2015 12/12/201512/13/2015 12/13/201512/14/2015 Brooklyn, NY 12/14/201512/15/2015 Minneapolis, MN 12/15/201512/16/2015 Las Vegas, NV Omaha, NE Iowa City, IA Mason City, IA New York, NY 12/16/201512/17/2015 Summerlin South, NV 12/17/201512/18/2015 12/18/201512/19/2015 New York, NY Manchester, NH 12/19/201512/20/2015 12/20/201512/21/2015 12/21/201512/22/2015 Keota, IA 12/22/201512/23/2015 12/23/201512/24/2015 12/24/201512/25/2015 12/25/201512/26/2015 12/26/201512/27/2015 12/27/201512/28/2015 12/28/201512/29/2015 Portsmouth, NH Berlin, NH 12/29/201512/30/2015 12/30/201512/31/2015 12/31/2015

Appendix Table 2--Campaign Stops by Candidate, Date, and Location, ContinuedDate Sanders Sanders2 Sanders3 Sanders4 Christie Christie2 Christie3 Paul Paul2 Paul3 Paul4 Date
9/1/2015 Jefferson, NH Berlin, NH North Conway, NH 9/1/20159/2/2015 Freedom, NH Wolfboro, NH Laconia, NH 9/2/20159/3/2015 Grinnell, IA Ottuma, IA West Burlington, IA Littleton, NH Lancaster, NH Berlin, NH Manchester, NH 9/3/20159/4/2015 Muscatine, IA Cedar Rapids, IA North Conway, NH Contoocook, NH Concord, NH 9/4/20159/5/2015 Altoona, IA 9/5/20159/6/2015 9/6/20159/7/2015 Manchester, NH Amherst, NH Milford, NH 9/7/20159/8/2015 Rye, NH 9/8/20159/9/2015 9/9/2015
9/10/2015 9/10/20159/11/2015 Atlanta, GA Indianola, IA Ames, IA 9/11/20159/12/2015 Columbia, SC Rockhill, SC Marshalltown, IA Nevada, IA Ames, IA 9/12/20159/13/2015 Greensboro, NC Hampton, NH Dover, NH 9/13/20159/14/2015 Lynchburg, VA Manassas, VA Manchester, NH 9/14/20159/15/2015 9/15/20159/16/2015 9/16/20159/17/2015 Carson City, NV Las Vegas, NV Reno, NV Ely, NV 9/17/20159/18/2015 New York, NY Henderson, NV 9/18/20159/19/2015 Manchester, NH Goffstown, NH 9/19/20159/20/2015 Seabrook, NH Portsmouth, NH Exeter, NH Durham, NH 9/20/20159/21/2015 9/21/20159/22/2015 9/22/20159/23/2015 Rock Hill, SC Columbia, SC Spartanburg, SC 9/23/20159/24/2015 9/24/20159/25/2015 Portsmouth, NH Nashua, NH Manchester, NH Hudson, NH Salem, NH 9/25/20159/26/2015 Des Moines, IA Newton, IA Loudon, NH Concord, NH Derry, NH Henniker, NH Brookline, NH 9/26/20159/27/2015 Waukee, IA Des Moines, IA Fort Dodge, IA Mason City 9/27/20159/28/2015 Chicago, IL Alden, IA 9/28/20159/29/2015 Des Moines, IA 9/29/20159/30/2015 9/30/201510/1/2015 10/1/201510/2/2015 10/2/201510/3/2015 Springfield, MA Boston, MA 10/3/201510/4/2015 10/4/201510/5/2015 10/5/201510/6/2015 10/6/201510/7/2015 Hampstead, NH Raymond, NH 10/7/201510/8/2015 Manchester, NH Belmont, NH 10/8/201510/9/2015 Tucson, AZ Henniker, NH Manchester, NH Nashua, NH 10/9/2015
10/10/2015 Boulder, CO 10/10/201510/11/2015 10/11/201510/12/2015 Henderson, NV Manchester, NH Cedar Rapids, IA Mt. Vernon, IA Iowa City, IA 10/12/201510/13/2015 Las Vegas, NV Davenport, IA Dubuque, IA West Des Moines, IA Cedar Falls, IA 10/13/201510/14/2015 Los Angeles, CA Sioux City, IA Storm Lake, IA Des Moines, IA 10/14/201510/15/2015 Newport, NH 10/15/201510/16/2015 Manchester, NH Bedford, NH Manchester, NH 10/16/201510/17/2015 Hooksett, NH Contoocook, NH Ashland, NH 10/17/201510/18/2015 Iowa City, IA Fort Madison, IA Dalton, NH 10/18/201510/19/2015 Oskaloosa, IA 10/19/201510/20/2015 10/20/201510/21/2015 Newton, IA Des Moines, IA 10/21/201510/22/2015 10/22/201510/23/2015 Washington, DC Davenport, IA 10/23/201510/24/2015 Des Moines, IA 10/24/201510/25/2015 Des Moines, IA 10/25/201510/26/2015 New York, NY 10/26/201510/27/2015 New York, NY 10/27/201510/28/2015 Fairfax, VA Washington, DC 10/28/201510/29/2015 10/29/201510/30/2015 Manchester, NH Nashua, NH Derry, NH Council Bluffs, IA Orange City, IA Des Moines, IA 10/30/201510/31/2015 Concord, NH Warner, NH Lebanon, NH Des Moines, IA Newton, IA Des Moines, IA 10/31/2015
11/1/2015 11/1/201511/2/2015 Durham, NH 11/2/201511/3/2015 11/3/201511/4/2015 11/4/201511/5/2015 Concord, NH Nashua, NH Somersworth, NH 11/5/201511/6/2015 Rock Hill, SC Concord, NH Hanover, NH Spartanburg, Sc 11/6/201511/7/2015 Rock Hill, SC Columbia, SC Aiken, SC Plymouth, NH Bedford, NH 11/7/201511/8/2015 Las Vegas, NV 11/8/201511/9/2015 Las Vegas, NV 11/9/2015
11/10/2015 11/10/201511/11/2015 Lebanon, NH Bettendorf, IA Muscatine, IA Coralville, IA Council Bluffs, IA Des Moines, IA Ames, IA 11/11/201511/12/2015 Cedar Rapids, IA Anamosa, IA Robins, IA Johnston, IA Altoona, IA Winterset, IA 11/12/201511/13/2015 Cedar Falls, IA Johnston, IA Nevada, IA Concord, NH Somersworth, NH Portsmouth, NH 11/13/201511/14/2015 11/14/201511/15/2015 Des Moines, IA Indianola, IA Des Moines, IA 11/15/201511/16/2015 Cleveland, OH 11/16/201511/17/2015 11/17/201511/18/2015 11/18/201511/19/2015 Washington, DC 11/19/201511/20/2015 Charleston, SC Des Moines, IA 11/20/201511/21/2015 Charleston, SC Columbia, SC Orangeburg, SC Stratham, NH Windham, NH Manchester, NH Iowa City, IA 11/21/201511/22/2015 St. Helena, SC Savannah, GA Bedford, NH 11/22/201511/23/2015 Atlanta, GA 11/23/201511/24/2015 11/24/201511/25/2015 11/25/201511/26/2015 11/26/201511/27/2015 11/27/201511/28/2015 11/28/201511/29/2015 Manchester, NH 11/29/201511/30/2015 Concord, NH Loudon, NH 11/30/2015
12/1/2015 Londonderry, NH Concord, NH 12/1/201512/2/2015 12/2/201512/3/2015 12/3/201512/4/2015 West Des Moines, IA Jefferson, IA Fort Dodge, IA Waukee, IA Fort Dodge, IA Mason City, IA Cedar Falls, IA 12/4/201512/5/2015 Keene, NH Plymouth, NH Mason City, IA Iowa Falls, IA Waterloo, IA Cedar Falls, IA Cedar Rapids, IA 12/5/201512/6/2015 Washington, DC 12/6/201512/7/2015 12/7/201512/8/2015 Baltimore, MD 12/8/201512/9/2015 12/9/2015
12/10/2015 12/10/201512/11/2015 Wolfeboro, NH Keene, NH Rindge, NH 12/11/201512/12/2015 Anamosa, IA Clinton, IA Dubuque, IA Waterloo, IA Weare, NH Nashua, NH Concord, NH Manchester, NH 12/12/201512/13/2015 Waterloo, IA Mount Vernon, IA Davenport, IA 12/13/201512/14/2015 Nashua, NH Hollis, NH 12/14/201512/15/2015 Rochester, NH Hampton, NH Dover, NH 12/15/201512/16/2015 Washington, DC Reno, NV Las Vegas, NV 12/16/201512/17/2015 12/17/201512/18/2015 12/18/201512/19/2015 Manchester, NH Exeter, NH Derry, NH Bedford, NH 12/19/201512/20/2015 Manchester, NH Peterborough, NH 12/20/201512/21/2015 Sioux City, IA Hollis, NH Pelham, NH New London, NH 12/21/201512/22/2015 Storm Lake, IA Carroll, IA Harlan, IA Council Bluffs, IA Portsmouth, NH 12/22/201512/23/2015 Chicago, IL 12/23/201512/24/2015 12/24/201512/25/2015 12/25/201512/26/2015 12/26/201512/27/2015 Reno, NV 12/27/201512/28/2015 North Las Vegas, NV 12/28/201512/29/2015 Muscatine, IA Davenport, IA Muscatine, IA Iowa City, IA 12/29/201512/30/2015 Burlington, IA Keokuk, IA Ottumwa, IA 12/30/201512/31/2015 Knoxville, IA Des Moines, IA 12/31/2015

Appendix Table 2--Campaign Stops by Candidate, Date, and Location, ContinuedDate Carson Carson2 Carson3 Carson4 Kasich Kasich2 Kasich3 Kasich4 Fiorina Fiorina2 Fiorina3 Fiorina4 Date
9/1/2015 9/1/20159/2/2015 Henniker, NH New London, NH West Lebanon, NH 9/2/20159/3/2015 9/3/20159/4/2015 9/4/20159/5/2015 Amherst, NH Manchester, NH Sandown, NH 9/5/20159/6/2015 Derry, NH Bedford, NH 9/6/20159/7/2015 Rye, NH Milford, NH Salem, NH Concord, NH Milford, NH Salem, NH 9/7/20159/8/2015 Concord, NH Brookline, NH 9/8/20159/9/2015 9/9/2015
9/10/2015 9/10/20159/11/2015 9/11/20159/12/2015 Aiken, SC Manchester, NH Raymond, NH Dover, NH Stratham, NH Chichester, NH Stratham, NH Dover, NH 9/12/20159/13/2015 Alton, NH Pembroke, NH Glen, NH 9/13/20159/14/2015 9/14/20159/15/2015 9/15/20159/16/2015 9/16/20159/17/2015 9/17/20159/18/2015 9/18/20159/19/2015 9/19/20159/20/2015 9/20/20159/21/2015 9/21/20159/22/2015 Charleston, SC Myrtle Beach, SC 9/22/20159/23/2015 Lexington, SC Rock Hill, SC 9/23/20159/24/2015 Spartanburg, SC 9/24/20159/25/2015 Hilton Head Island, SC Davenport, IA Dubuque, IA 9/25/20159/26/2015 Sioux City, IA Council Bluffs, IA Iowa City, IA Arlington, IA 9/26/20159/27/2015 9/27/20159/28/2015 9/28/20159/29/2015 9/29/20159/30/2015 Exeter, NH Durham, NH Portsmouth, NH New Castle, NH Davenport, IA Cedar Rapids, IA 9/30/201510/1/2015 West Des Moines, IA 10/1/201510/2/2015 Des Moines, IA Ankeny, IA Concord, NH Goffstown, NH Manchester, NH Aiken, SC Mt Pleasant, SC 10/2/201510/3/2015 Hooksett, NH Hudson, NH Portsmouth, NH 10/3/201510/4/2015 Rye, NH Windham, NH 10/4/201510/5/2015 Manchester, NH Nashua, NH Bedford, NH 10/5/201510/6/2015 10/6/201510/7/2015 10/7/201510/8/2015 10/8/201510/9/2015 Stratham, NH 10/9/2015
10/10/2015 Columbia, SC 10/10/201510/11/2015 10/11/201510/12/2015 Manchester, NH 10/12/201510/13/2015 Bow, NH Tilton, NH Littleton, NH 10/13/201510/14/2015 Plymouth, NH Tuftonboro, NH 10/14/201510/15/2015 Nashua, NH Spencer, IA Windsor Heights, IA 10/15/201510/16/2015 Pleasant Hill, IA Grinnell, IA 10/16/201510/17/2015 Cedar Rapids, IA Waterloo, IA Monticello, IA 10/17/201510/18/2015 10/18/201510/19/2015 10/19/201510/20/2015 10/20/201510/21/2015 10/21/201510/22/2015 Hanover, NH Newport, NH 10/22/201510/23/2015 Manchester, NH Milford, NH Concord, NH Beaufort, SC Hilton Head, SC 10/23/201510/24/2015 Ames, IA West Des Moines, IA Waterloo, IA Dubuque, IA 10/24/201510/25/2015 10/25/201510/26/2015 10/26/201510/27/2015 10/27/201510/28/2015 10/28/201510/29/2015 10/29/201510/30/2015 Orange City, IA 10/30/201510/31/2015 Sioux City, IA Des Moines, IA Indianola, IA 10/31/201511/1/2015 Oskaloosa, IA 11/1/201511/2/2015 Des Moines, IA Oskaloosa, IA 11/2/201511/3/2015 Dubuque, IA 11/3/201511/4/2015 11/4/201511/5/2015 Durham, NH Londonderry, NH Concord, NH Newport, NH 11/5/201511/6/2015 Concord, NH Hopkinton, NH Manchester, NH Milford, NH Dover, NH 11/6/201511/7/2015 Franklin, NH Bedford, NH Londonderry, NH 11/7/201511/8/2015 11/8/201511/9/2015 11/9/2015
11/10/2015 11/10/201511/11/2015 West Columbia, SC Hilton Head Island, SC 11/11/201511/12/2015 Exeter, NH Concord, NH Onawa, IA Harlan, IA 11/12/201511/13/2015 Greenville, SC Hudons, NH Laconia, NH Council Bluffs, IA Corning, IA Greenfield, IA 11/13/201511/14/2015 11/14/201511/15/2015 Las Vegas, NV 11/15/201511/16/2015 Green Valley, NV Plymouth, NH 11/16/201511/17/2015 Concord, NH 11/17/201511/18/2015 Henniker, NH Keene, NH 11/18/201511/19/2015 Columbia, SC Spartanburg, SC Charleston, SC 11/19/201511/20/2015 Concord, NH Hollis, NH Des Moines, IA 11/20/201511/21/2015 Des Moines, IA Tipton, IA Wilton, IA Davenport, IA Berlin, NH Sanbornville, NH Dover, NH Dike, IA 11/21/201511/22/2015 Wilton, IA 11/22/201511/23/2015 Pahrump, NV Des Moines, IA Council Bluffs, IA Sioux City, IA 11/23/201511/24/2015 11/24/201511/25/2015 11/25/201511/26/2015 11/26/201511/27/2015 11/27/201511/28/2015 11/28/201511/29/2015 11/29/201511/30/2015 Ames, IA Cedar Rapids, IA Greenville, SC Anderson, SC 11/30/201512/1/2015 Columbia, SC West Columbia, SC Charleston, SC 12/1/201512/2/2015 Rock Hill, SC Spartanburg, SC 12/2/201512/3/2015 Salem, NH 12/3/201512/4/2015 Manchester, NH Lebanon, NH 12/4/201512/5/2015 Waterloo, IA Cedar Rapids, IA Claremont, NH New London, NH Cedar Rapids, IA 12/5/201512/6/2015 Coon Rapids, IA 12/6/201512/7/2015 Cedar Rapids, IA 12/7/201512/8/2015 Myrtle Beach, SC Des Moines, IA 12/8/201512/9/2015 Lebanon, NH 12/9/2015
12/10/2015 Manchester, NH Merrimack, NH Concord, NH Bedford, NH Derry, NH 12/10/201512/11/2015 Burlington, IA Moravia, IA Keene, NH Peterborough, NH Bedford, NH Manchester, NH Nashua, NH Exeter, NH 12/11/201512/12/2015 12/12/201512/13/2015 12/13/201512/14/2015 12/14/201512/15/2015 12/15/201512/16/2015 Elko, NV Las Vegas, NV Carson City, NV Ankeny, IA Reno, NV 12/16/201512/17/2015 McGregor, IA Mason City, IA Waterloo, IA Des Moines, IA 12/17/201512/18/2015 Storm Lake, IA Orange City, IA Sioux City, IA Clinton, IA Dubuque, IA Davenport, IA 12/18/201512/19/2015 Carroll, IA Harlan, IA Council Bluffs, IA Burlington, IA Washington, IA 12/19/201512/20/2015 Nashua, NH Manchester, NH Portsmouth, NH 12/20/201512/21/2015 Manchester, NH Concord, NH Greenland, NH Rochester, NH Concord, NH Mt. Pleasant, SC Pawleys Island, SC 12/21/201512/22/2015 Summerville, SC Florence, SC 12/22/201512/23/2015 12/23/201512/24/2015 12/24/201512/25/2015 12/25/201512/26/2015 12/26/201512/27/2015 12/27/201512/28/2015 Manchester, NH Derry, NH 12/28/201512/29/2015 Nashua, NH Keene, NH 12/29/201512/30/2015 12/30/201512/31/2015 12/31/2015
Note: this list contains all recorded campaign including those not matched to our own sample of parish bulletins. There are multiple columns for candidates as candidates sometimes made more than one stop in a day.

Appendix Figure 1: Distribution of Parishes in Baseline Estimates

0
2
4
6
8
10
12
14
16
18
20
.018-.0185 .0185-.019 .019-.0195 .0195-.020 .020-.0205 .0205-.021 .021-.0215 .0215-.022 .022-.0225
Appendix Figure 2: Results Dropping Each State, Except New Hampshire
The figure presents a histogram of coefficients from a regression of church collections on campaigns with each state dropped. All regressions difference data and include bulletins from 2014 and 2015 and include a constant. The y axis shows the number of regressions that produced a campaign coefficient in a given bin. The baseline coefficient, including all states, is0.0204. All coefficients from this exercise are statistically significant. Results dropping New Hampshire are reported in Table 3 and produce a coefficient of 0.0273, which would be to the right of the above picture.