political budget cycles and the indonesian simultaneous regional … · political budget cycles and...
TRANSCRIPT

Political Budget Cycles and the Indonesian Simultaneous Regional Direct
Elections in 2015
A Research Paper presented by:
Setyo Hari Priyono
4463118sp
in partial fulfillment of the requirements for obtaining the degree of
MASTER OF ARTS IN DEVELOPMENT STUDIES
Major:
Economic of Development
(ECD)
Members of Examining Committee:
Dr. Matthias Rieger [Supervisor]
Dr. Natascha Wagner [Reader]
The Hague, The Netherlands
September 2017

i
Contents
List of Tables ..................................................................................................................... iii
List of Figures .................................................................................................................... iii
List of Acronym .................................................................................................................. iv
Acknowledgment ................................................................................................................. v
Abstract ............................................................................................................................... vi
Chapter 1 Introduction ......................................................................................................... 1
Chapter 2 Theoretical Framework and Literature Review .................................................. 9
2.1 Political Budget Cycles Theory ............................................................................... 9
2.2 Fiscal Decentralisation .......................................................................................... 12
2.3 Political Budget Cycles in Local Government ...................................................... 14
3.1 Regional Elections in Indonesia ............................................................................ 18
3.1.1 A Brief History of Regional Elections in Indonesia .......................................... 18
3.1.2 Simultaneous Regional Direct Election in Indonesia ........................................ 20
3.2 Fiscal Decentralisation and Regional Public Expenditure in Indonesia ................ 22
Chapter 4 Data and Methodology ...................................................................................... 26
4.1 Data ........................................................................................................................ 26
4.2 Hypothesis ............................................................................................................. 26
4.2.1. Budget Balance .................................................................................................. 27
4.2.2. Total Expenditures ............................................................................................. 28
4.2.3. Investment Expenditures .................................................................................... 28
4.2.4. Discretionary Expenditures ................................................................................ 29
4.2.5. Probability being re-elected ............................................................................... 29
4.3 Variables and Specification ................................................................................... 30

ii
4.3.1. Dependent Variables .......................................................................................... 32
4.3.1.1. Fiscal Policy Variables ................................................................................... 32
4.3.2. Independent Variables ....................................................................................... 35
4.3.2.1. Political Variables .......................................................................................... 35
4.3.2.2. Control Variables ........................................................................................... 36
Chapter 5 Result and Analysis ........................................................................................... 38
5.1 Descriptive Analysis .............................................................................................. 38
5.2 Panel Data Model Selection .................................................................................. 41
5.3 Regression Result .................................................................................................. 43
5.3.1 The Political Budget Cycle Behaviour Existence .............................................. 43
5.3.2 The Probability of Being Re-elected .................................................................. 45
5.4 Discussion Result ..................................................................................................... 46
5.4.2 The PBC existences in 2015 Concurrence Regional Direct Election ................ 46
5.4.2 The Probability of Winning the Election ........................................................... 49
Chapter 6 Conclusion ......................................................................................................... 51
References .......................................................................................................................... 53
Appendices ......................................................................................................................... 60

iii
List of Tables
Table 1. The Implementation of Simultaneous Local Direct Head Election Phases ............... 20
Table 2 Variables and Definition Operational ......................................................................... 36
Table 3. Descriptive Statistics .................................................................................................. 38
Table 4. Hausman Test for Dependent Variables .................................................................... 42
Table 5. Regression Result of The Existence of PBC Behaviour ............................................ 43
Table 6. Winning The Election Probablity ............................................................................ 455
List of Figures
Figure 1. Simultaneous Regional Head-Direct Election 2015 Result ........................................ 4
Figure 2. Conceptual Framewok .............................................................................................. 17
Figure 3. The Evolution of Decentralization Regulation in Indonesia .................................... 22
Figure 4. Intergovernmental and Village Transfer Funds 2010-2016 ..................................... 23

iv
List of Acronym
APBN : Central Government Budget
APBD : Regional Government Budget
BPS : Statistics Indonesia
DAU : General Allocation Subsidiary
DAK : Specific Allocation Funds
DBH : Revenue Sharing (includes tax, customs, and natural resources share)
DJPK : Directorate General of Fiscal Balance, MoF
KPU : General Election Commission
MoHA : Ministry of Home Affairs
MoF : Ministry of Finance
PAD : Local Government Owned Revenues
PBC : Political Budget Cycles
Pemilukada : Regional Direct Election
Perludem : the Association for Elections and Democracy
Seknas FITRA : National Secretariat - Indonesian Forum for Budget Transparency
Susenas : National Socio-Economic Survey

v
Acknowledgment
Writing this research paper was very challenging for me as a public servant. There was a
circumstance that I felt like lost in space, full of doubt, and thinking whether I could make it
or not. Fortunately, I have an amazing supporting system, my family, friends, superior, and
also SPIRIT-BAPPENAS who has assisted and supported me during my study. Without their
help and support I doubt this paper would ever have become reality. Alhamdulillah, Praise to
God.
First of all, I would like to express my sincere gratitude to my supervisor, Dr. Matthias
Rieger. Thank you for your encouragement, support to develop ideas and translate it into
framework model, and select the appropriate analysis. My deepest special gratitude and
thanks also to my second reader, Dr. Natascha Wagner, for imparting her enthusiasm,
knowledge, and proficiency in this paper.
I also would like to thank to Ibu Dr. Arie Damayanti, Director at Graduate Program in
Economics, University of Indonesia. She is an inspiring figure from whom I have learnt a lot
during my first-year study at UI. She also has kindly guided me at the early stage of this
paper.
I would like to give much appreciation to all ISS teaching staffs for their warm academic
environment, encouragement and noteworthy point of view. It has been an honour to study in
very diverse campus with international reputation at the International Institute of Social
studies, Erasmus University of Rotterdam (ISS-EUR).
My very special thanks are due to my family, my beloved parents, my sincere mother in law,
my lovely wife, my children (Mas Azzam and Dedek Alesha). They have continually prayed
for me, and encouraged me for keeping my sanity, and for chasing my dream.
Lastly, to all my beloved friends in PPIE-UI and ISS, colleagues at Ministry of Development
Planning/Bappenas, and also fellow students for the support and helps. Your contributions
are meaningful to this paper.

vi
Abstract
There is an assumption that incumbent candidates often try maximizing their influence as the
heads of regional government to increase their probability of being re-elected in the second
period. Related to this assumption, this study examines the existence of local budget
utilization behaviour by incumbents who have politically interested policies. This study also
aims to analyse the probability of these incumbents of being re-elected.
This study focuses on 254 provincial and districts/cities in Indonesia which held
simultaneous regional head direct election in 2015 and examines regional heads’ fiscal policy
and how it is induced by political motivation. It analyses certain expenditures such as budget
deficits, total spending, and investment spending. The “other” budget category namely
discretionary funds, with which regional officials have discretionary power to allocate and
distribute, will also be observed. The funds consist of grants aid, social assistance
expenditures, and financial aid. All these local government spending are examined, in
particular related to the election year in 2015.
According to the results obtained, there is no indication of politically driven fiscal policy by
incumbent candidates in almost all spending categories. However, there is a positive and
significant relationship between the regions that have incumbents and grant expenditure
subcategory behaviour. This finding indicates that this subcategory expenditure is still
popular among incumbents to stimulate citizens and gain sufficient vote-share later on.
Surprisingly, the opposite effect of the cyclical behaviour appears in terms of the possibility
of winning the election. The total expenditure disbursement policy around election year will
be affect negative and significantly decrease the incumbents’ winning re-election.
Keywords: Political Budget Cycles, Fiscal Spending Policy, Simultaneous Regional Direct
Elections, Regional Elections in Indonesia

1
Chapter 1 Introduction
1.1 Background of the Study
There is an assumption that politicians who run government tend to reduce revenues
or increase spending particularly if they are running for elections for the second time. This
phenomenon is called the political budget cycle. One of the reasons for political budget
cycles is the incumbents’ desire to be re-elected by attracting voters (Nordhaus 1976; and
Baskaran et al. 2016). Budget cycles usually appear in earlier elections of the democratic
electoral transition system, and there is much more evidence for developing countries than in
developed countries (Shi and Svensson 2006; Brender and Drazen 2005; and Drazen 2008).
Political budget cycle appears because of lack of information so that the political
leaders can utilize the budget aligned with their vested interests. Rogoff (1990) argues that
asymmetric information is one of the factors why political budget cycles may occur since the
electorates have difficulties to monitor the incumbents’ performance. Apparently, this
circumstance leads the current government to maximize its influence to describe its positive
side by using fiscal policy in particular prior to election period. Therefore, political budget
cycles reflect a cyclical fluctuation behaviour in economic policies induced by the timing of
elections in emerging democratic countries that feature asymmetric information among
voters.
There is a series of empirical studies showing the importance of budget spending
when re-election is possible. Galli and Rossi (2002) and Klein and Sakurai (2014) show that
government expenditure increases around election time, in particular, if the incumbents run
for the second term. Incumbents will attempt to increase their popularity with voters by
employing the budget strategically. Moreover, other empirical support studies on political
budget cycles confirm on a link between the effort to enhance budget spending with people
and voting preferences behaviour (Brender and Drazen 2005; Balaguer-Coll 2015; and
Chortareas et al. 2016). These studies found the influence of the elections to the budget
utilization in a variety of government levels from across countries level to sub-national level.
In election years, budget spending tends to increase, especially some type of expenditures
such as donation, social assistance, education, health, roads, and so on (Kein 2010; Benitto et

2
al. 2012; and Sjahrir et al. 2013). In other words, incumbent politicians may try to increase
their re-election probability through budget spending in certain budget lines.
Specifically, in Indonesia, the local leaders who run re-election are thought to
increase budget spending. Several studies find that the political budget cyclical behaviour is
present in direct elections and relate to expenditure discretion categories such as donations
and social assistance that need mayors or regents’ discretionary control (Ritonga and Alam
2010; Sjahrir et al. 2013). These studies also noticed it has relation with the regions that has
incumbent and run re-election for the second term. Therefore, the political budget cycle
studies are relevant due to the regional political system that has changed from a formerly
strong centralized government structure to become a decentralized since 2001.
This research will focus on the regional public expenditure policy instead of revenue
side, that indicated has a relationship with election time. The decentralization process in
Indonesia has had many political and economic consequences, for instance, power was
transferred from the central government to regional governments including fiscal powers.
The local government has however remained reliant on the central government as evidenced
by substantial intergovernmental transfer funds. In 2015, the intergovernmental transfer
budget was 700,4 trillion rupiah, seeing a significant increase from 322,4 trillion rupiahs in
20101. According to the Law 23 of 2014 regarding Regional Government, there are three
types of the fiscal transfer budget in Indonesia, which are revenue sharing (DBH), general
allocation subsidiary (DAU), and specific allocation funds (DAK).
Brodjonegoro (2001) and Blondal (2009) also argue that the fiscal decentralization
process in Indonesia focuses on expenditure decentralization rather than the revenue side.
Blondal (2009) also mentioned that local governments still have a substantial dependency on
transfers from the central government, which approximately 90 percent of their total budget.
Therefore, this research will give more emphasizes on spending behaviour of the local
government in election years.
One of the motivations for decentralization is the belief that it will promote good
governance by enabling citizen participation and democratic elections. However, there was a
lack of checks and balances in the local government process, initially because legislature
1Ministry of Finance, Republic Indonesia (2015) Informasi APBN 2016 (Central Budget of 2016
Information). Accessed on 25th August 2017 <https://www.kemenkeu.go.id/sites/default/files/ bibfinal.pdf>.
3
members elected the local executives. The election process will lead to an allegation that a
candidate tends to buy votes from local parliament to win election (Choi 2007). The elected
local leader also will feel inferiority instead of have equal authority in front parliament
members. As a result, they tend to have more responsibility to the legislature that voted them
instead of serves their citizens (Surbakti 2014). Therefore, by 2005 the election system was
changed and the first direct elections held in all municipalities. The incumbents are allowed
to complete their terms which ended at different time and years. After conducting and
evaluating direct elections process for ten years, in 2015 Indonesian government and the
House of Representatives agreed to promote regional elections simultaneously.2
Unfortunately, money politics, patronages, and political dynasties are still widespread
in local politics and fuel corruption. Many scholars suggest that the regional elections were
still stained by transactional politics, ranging from the selection process of candidates to party
until the voting period (Aspinall 2014; and Henderson and Kuncoro 2011). Data from the
Ministry of Home Affairs until December 2015 revealed that there are 343 of the head of
municipalities that involved a legal case whether General Attorney, Police Office, or KPK
(www.kompas.com 04/02/2015).3 Moreover, many incumbents' family members such as
brothers, sisters, children, relatives, and even wives are running in elections that allegedly to
extend family control (www.news.detik.com 22/01/2017). 4
After conducting direct elections for ten years since 2005, Indonesian agreed to
promote regional elections simultaneously in 2015 which involved 269 regions. It was 278
incumbent or public officials regional head who is re-nominating in simultaneous elections
2015. There are 150 of 278 incumbent candidates are as regional head, meanwhile, 128 of
them are regional vice head (Sadikin 2016). According to Indonesian regional elections result
in 2015, from 140 provincial and regions/municipalities that incumbents involved elections,
showed that 68.6 percent of incumbents won, whether this phenomenon is a political budget
2 Brief story of the Indonesia election transition history from the independence era until after reformation
can be viewed on Pratama and Maharddhika (2016) Prospek Pemerintahan Hasil Pemilukada 2015 (Prospect of
Government Result of Pemilukada 2015). Jakarta: Yayasan Perludem. 3 Arsil, Sabrina (2015) Mendagri: 343 Kepala Daerah Tersangkut Kasus Hukum (Minister of Home
Affairs: 343 Heads of District Cases of Legal Cases). Accessed 4 June 2017
<http://nasional.kompas.com/read/2015/02/04/21114211/Mendagri.343.Kepala.Daerah.Tersangkut.
Kasus.Hukum>. 4 Ul Haq, M.F. (2017) ICW Ungkap Keterkaitan Dinasti Politik, Pilkada, dan Korupsi (ICW Discloses the
Linkage of Political Election, and Corruption Dynasties) Accessed 4 June 2017
<https://news.detik.com/berita/d-3395110/icw-ungkap-keterkaitan-dinasti-politik-pilkada-dan-korupsi>.

4
cycles presence or not still need further exploration. Moreover, the evidence of the possibility
of the incumbent leaders’ re-election due to the political budget cycles effect in Indonesia has
not been discussed yet. In a related study, Sjahrir et al. (2013) only focus on the existence of
political budget cycles in Indonesia through the local government behaviour due to their
budget expenditure policies at the district level.
Figure 1. Simultaneous Regional Head-Direct Election 2015 Result
Source: Analysis Result
It is important to analyse the sub-national levels of political budget cycles in
Indonesia since regional governments particularly districts and cities are the closest
administration to citizens who directly get the impact of their policies. However, although
some beneficial effect of Indonesian fiscal decentralization on public services delivery
(Simatupang 2009 as cited in Muttaqin 2017), another recent literature found that regional
head direct election of local government decreased local government responsiveness in terms
of public service provision (Kis-Katos and Sjahrir 2014).
Another assumption is a politically driven of local budget utilization. It means, local
budget misuse spending in some categories by the local head government often occurs
approaching election year (Sjahrir, et al. 2013). They tend to use the budget in particular in
“discretionary budget subcategory” without regard to performance background and reliable
benchmarks but depends on their vested interests (Ritonga and Alam 2010). According to
Ministry of Home Affairs, the regional elections must be funded by regional budget
themselves whether from grants expenditure subcategory or ‘other’ post of the budget

5
(www.tempo.co 17/04/2015).5 This circumstance can give beneficial effect for the candidates
that will compete for the second period of tenure.
This study observes the occurrence of the cyclical economic behaviour in local
government budget in a simultaneous direct election in 2015 and the possibility of the
incumbents to win the election. The study focuses on 254 provinces, districts and
municipalities in Indonesia which held simultaneous direct local elections in 2015. Other 108
regions are added to examine whether the political-economical cyclical also occurs in these
regions regardless there is no simultaneous regional head direct election was held in 2015.
The variety of local elections time implementation in each subnational level (provincial,
districts and municipalities) expected to enhance interaction and identification of politically
driven fiscal policies (Sjahrir et al. 2013). Meanwhile, in the simultaneous local election, the
politically induces cycles might overlap with other time effects.
1.2 Research Objectives and Questions
1.2.1 Research Objectives
This study will examine the existence of the political budget cycle in 2015 during the
simultaneous regional head election. Besides that, this study also analyses the possibility of
political budget cycles induced by incumbent candidates on the likelihood of being re-elected
for a second term.
1.2.2 Research Questions
The two main research questions are as follows:
1) How does the opportunity for incumbent candidate affect political budget cycle
especially in the election year?
2) If Political Budget Cycle exists in 2015 simultaneous regional head election, how
will the political budget cycle behaviour affect the probability of the incumbents
to be re-elected?
1.3 Limitations of Study
5 Adityowati, P. (2015) Kemendagri: Daerah Wajib Anggaran Dana Pilkada (MoHA: Local Governments
have to finance the regional elections). Accessed 14 September 2017.
<https://m.tempo.co/read/news/2015/04/17/078658512/kemendagri-daerah-wajib-anggarkan-dana-pilkada>

6
1. This study excludes the results of previous regional elections because of limited data
availability (2010-2011 regional election result depends on the region). The previous
result would have been beneficial to have to study its impact on the simultaneous
regional elections in 2015.
2. This study also uses other municipalities which did not conduct the simultaneous
elections in 2015 (as a control case) to analyse the relationship between election year
and certain regional budget spending. However, there is no data regarding the
incumbents in those regions.
3. This study does not have data on the relatives of regional heads. The Supreme
Constitutional Court number 100/PUU-XIII/2015 mentioned the prohibition of
incumbent’s relatives is against the constitution and human right. It means, by
regulation, the families of the current head regions (who already had two tenure
periods) allows to run in the local elections, which may lead to political dynasty
regimes. Allegedly, incumbents who will not run anymore but who have family
members up for election may act similarly as incumbents who run re-election. As a
result, the cyclical budget behaviour between incumbent regions and non-incumbent
regions will be similar and cause the insignificant result of the PBC analyses.
4. This study does not present the political affiliation of candidates whether nominated
by political parties or as an independent. Furthermore, this study also regardless the
coalition fragmentation of the candidate that nominated by the political party. This is
important to measure whether electoral budget cycles in concurrent regional direct
election 2015 also influenced by political interaction factor.
1.4 Contribution to the Literature
In spite of the growing literatures in developing countries on fiscal budget policy that
is induced by political purposes, there are still limited studies related to political budget cycle
in Indonesia. There are several studies on political budget cycles on Indonesia. First of all,
Rahman and Alam (2010) focused on grant, social assistance, and financial assistance
expenditure between 2009-2010 and found that there was a higher spending on these budget
lines during the election time compared to the year before regional election. Sjahrir et al.
(2013) focused on the existence of political budget cycles in Indonesia during indirect or
direct elections at the district level. Their studies found that the behaviour exists on direct
local election compared to representative local election. In contrast, Winoto and Falikhatun

7
(2015) who focused on the political budget cycles precedence prior to local head direct
election in 2015 confirm there is no indication of grant expenditure, social assistance
spending fund for the sake of their political interest.
This study will emphasise the incumbents’ behaviour comparison on local
government budget spending before and in election year in 2015, and also the winning
election possibility of the incumbent. This study also will strengthen the recent studies on
political budget cycles presences by analysing the possibility of the incumbent leaders to be
re-elected due to the political budget cycles effect.
1.5 Organization of Research Paper
In order to determine whether political budget cycles behaviour exists or not during
the Indonesian simultaneous regional direct election in 2015, the research paper will be
divided into six chapters.
Chapter 1. Introduction
The first section will discuss the importance of political budget cycles studies and some brief
fundamental arguments on underlying mechanisms. Some economic indicators are also
presented to give a basic justification of the proposed research. Eventually, this chapter will
present the objectives of the study and the main research questions.
Chapter 2. Theoretical Framework and Literature Review
This chapter will discuss the conceptual framework of political budget cycles and its link
with re-election probability. The presented theories are also supported by some empirical
findings to build the model and its hypothesis used in this thesis.
Chapter 3. Overview
In this chapter, we will provide a brief explanation on regional elections in Indonesia, the
fiscal decentralisation process in Indonesia, and the implementation of the simultaneous
direct regional head election in Indonesia in 2015. This chapter will provide more
information regarding the nature of regional elections and its relationship with fiscal
utilisation by the heads of regional governments.
Chapter 4. Data and Methodology

8
This chapter will detail variables used in the study including sources of the data. The author
will also present the model used to answer research questions.
Chapter 5. Analysis of Empirical Results
Chapter 5 presents the main empirical results and how they relate to the theoretical
background exposed in the earlier chapter.
Chapter 6. Conclusion
The final chapter will summarize the findings and also try to give some suggestion for
improving work in the future.

9
Chapter 2 Theoretical Framework and Literature Review
2.1 Political Budget Cycles Theory
Political Budget Cycles (henceforth PBC) has referred with different terms. There are
several terminologies that have close definition due to budget cycles topics, such as political
business cycles, political budget cycles, and electoral budget cycles. Political budget cycles
are cycles in some component of the government budget coinciding with elections. Other
terms include electoral budget cycles and political business cycles (Drazen 2008; and Klein
2010). These terms refer to increases in government spending or decreases in revenue in an
election year. Those terms capture the political incumbent’s desire to be re-elected.
However, there is a different focus discussion between political business cycles,
political budget cycles, and electoral budget cycles. Political business cycles give more
attention to macroeconomic variables such as output or growth, unemployment, and inflation,
while the electoral budget cycles and the political budget cycles focus only on government
budget activity (Nordhaus 1974; and Drazen 2008). In the former case, the cyclical behaviour
is influenced by the finding that good macroeconomic conditions prior to the elections could
increase the possibility of an incumbent when he run for re-election. In the latter case, and
similar to political budget cycles, the electoral budget cycles focus upon the question of
electoral cycles in government budget discretion policies due to electoral cycles (Blais and
Nadeau 1993).
Nordhaus (1975) initially introduced a theory of political business cycles by
proposing a model in which incumbents would utilize the macroeconomic policy (balance
deficits policy, unemployment policy, and inflation policy) in order to gain electoral
advantages. This early model emphasizes that the incumbent intentionally would secure re-
election by optimizing the vote share expectation. The model also assumes that the voters
will record and evaluate the incumbent’s past performance. Therefore, the incumbents
attempt to create the most desirable economic conditions before elections by applying
expansionary fiscal policies to stimulate economy growth and create “constructive”
circumstances (Nordhaus 1975). The literature on Political Business Cycles (such as
Lindbeck (1976) and Allesina (1987) also discussed the extraordinary economic cycles in
western countries as a function of political dynamics.

10
Another terminology was introduced by Rogoff and Sibart (1988) and Rogoff (1990):
‘the political budget cycle’ is used instead of ‘political business cycle’ when narrowing the
scope of discussion from macroeconomic perspective to only fiscal policy. This strand of the
literature assumes that political budget cycles can be shown by given an equilibrium
signalling interpretation from the electorate to describe unobserved current government
performance. This literature assumes that voters have rational expectations, but have
difficulties to monitor the incumbent’s competency level due to asymmetric information
(Rogoff and Sibart 1988). In other words, in these models, signalling is the driving force
behind political budget cycles. Incumbents use government spending to increase fiscal policy
performance prior to election time to signal competence to the electorate.
Shi and Svensson (2006) also argue that candidates may act opportunistically
regardless of the fact that most electorates know the government’s policy, since some
electorates are uninformed. The larger the number of electorates that fail to distinguish
between election-induced fiscal policy manipulations and the incumbent’s competence, the
more incumbents may profit from boosting expenditures prior to an election. In equilibrium,
expenditures targeted to particular electorates are higher in an election period than in a non-
election period. Swing voters will rationally vote for incumbents who provide more targeted
expenditures even when they know that such expenditures may be electorally motivated.
Numerous empirical studies have been done to support the notion that political budget cycles
indeed occur, even though, opinions still differ as to whether political budget cycles are more
likely to happen in less developed economies compared to developing ones (Persson and
Tabellini 2002; Brender and Drazen 2005; Shi and Svensson 2006).
A recent literature mentioned that PBC occurrence is conditional instead of universal.
Dubois (2016) studies on various of literatures after Nordhaus’ studies on Political Business
Cycles argued in terms of institutional context, there are three variables that influenced PBC
existences: election time period system; the state system, regime, and rule; and the economic
policy limitation. The first feature related on the political economic cycle behaviour
appearances closely related to the length of electoral term. In matter of term period many
scholars study found that time constraint as well as alleviate the term period of election of the
survey will decreased a possibility of PBC behaviour result (Klein 2010; Benito et al. 2013;
and Sjahrir et al. 2013). Meanwhile, other study result showed the opposite such as Shi and
Svensonn (2006) neglected the time effect of election with the expansionary fiscal policy
implementation by the government.

11
The next element of PBC constraint discussed on PBC appearances in “authoritarian
versus democratic system”, and newly-transitional democratic countries, well-established
democratic countries, presidential and parliament countries, and regarding electoral
regulation (Dubois 2016). In recent years, political budget cycles existence in terms of
different political and institutional contexts have been explored to know whether it has
contribution to pre-electoral deficits behaviour or not. Brender and Drazen (2005) work that
concentrated on the level of democracy of countries, has made a very important place in the
political budget cycles studies. They found evidence supporting political budget cycles, and
underlined that these results are largely driven by “new democracies” instead of well-
established democracy countries. Fiscal manipulation may work in “newer democracies”,
because the institution is inexperienced with electoral politics and may lack of information to
assess and evaluate fiscal manipulation (Brender & Drazen 2005, Klomp and de Haan 2013).
In other words, democratic political institutions would provide political incentive structures
able to induce better policy choices.
The length of time of a country live under democracy system also will affect the
public spending policy that conducted before the elections. Another argument also mentioned
that eventually, an increasing level of democracy is likely to increase the country’s level of
transparency (Efthyvoulou 2012, and Akhmedov and Zhuravskaya 2004). This condition may
reduce the incumbent’s incentive to commit to do cyclical behaviour in pre-electoral periods.
The latest variable concerned on the central bank independency, financial institution
includes monetary instruments, and fiscal policies spending behaviour by the government
that allegedly has the electoral motivation (Dubois 2016). This argument in line with many
existing kinds of literature that mentioned some particular components of the state budget are
influenced by the electoral cycle. As a consequence, there is an increase in government
spending or decrease in revenues in an election year, leading to the larger fiscal deficit is
called political budget cycles theory. This incumbent’s rational behaviour of fiscal
manipulation is a tool that governments keep to increase their chance for re-election (Drazen
2008; Efthyvoulou 2010; Baskaran 2016).
In sum up, PBC reflect a cyclical fluctuation behaviour in fiscal policies induced by
the timing of elections, in order to attract citizen’s vote preferences. This behaviour
particularly occurs in emerging democratized countries that still have asymmetric of
information.

12
2.2 Fiscal Decentralisation
Theoretically, decentralisation is the power transfer process from the central
government to the lower level government. The territory that has given the authority transfer
called autonomous regions. According to Cheema and Rondinelli (2007), the definition of
decentralization also has changed not only about political matters but also related to resources
authority, including the fiscal matters. The power of financial distribution includes the
transfer of public revenue, fiscal delegation both in revenue side increasing in amount and
expenditure allocation, as well as fiscal autonomy to all regional government level.6
Fiscal power decentralisation crucial in order to ensure that it process can be done
continuously. By implementing fiscal decentralisation, regional government not only able to
learn how to make a good decision-making to raise and manage their budget to improve their
citizen prosperity (Cheema 2007). However, Smoke (2007) emphasized that considering on
the nature of fiscal decentralization implementation is one of vital effectiveness factors. The
structural characteristics of the country can be both opportunity and weaknesses of the
decentralisation process.
Another spirit of the fiscal decentralization implementation is to reduce the fiscal gap
between central and local government (vertical imbalance), reducing the fiscal gap between
one region and others (horizontal imbalance). Stoke (2001) argues the appliance of fiscal
transfer authority to regional government in developing countries will reduce horizontal
imbalance, improving the quality of public services in the region and reducing the inter-
regional public service gap at the same time, and improving the efficiency of national
resource utilization.
Specifically, to Indonesia, after Authoritarian era has implemented decentralisation
under Law number 22/1999 has reduced ‘hierarchical relationship’ between local government
to the central government and revised by 32/2004 that strengthen provincial government as a
6 Political decentralization focused on organization and procedures, while financial decentralization
includes the sharing mechanism and autonomy budget allocation. Look at Cheema, G.S. and D.A., Rondinelli
(2007) ‘From government decentralization to decentralizing governance’, in Cheema, G.S. & Rondinelli, D.A.
(eds) Decentralising governance: emerging concepts and practices, pp. 1-20. Washington: The Brookings
Institution Press. Page 7.

13
representative of the central government to supervise the districts level, including regarding
fiscal decentralisation policy implementation (Cheema 2007).7
A decentralized government will not implement properly without the contribution of
the transfer funds from the central government to local governments. This component
become one of other important factors regarding fiscal decentralization in decentralised
government system as the central government attention. According to Broadway and Shah
(2007), there are there are two categories of inter-government transfer funds, which are
transfers for general purposes and transfers for specific purposes. Transfer for public
purposes is provided as a statute of local autonomy protection and may increase inter-
jurisdictional equity. The latter transfer purpose is intended to provide intensive for the
government in implementing the program or certain activities implementation of fiscal
transfers. The specific intergovernmental transfer funds in Indonesia is better known as fund
balance. These funds become a critical component for local governments in carrying out its
responsibilities for the provision of public services. Components of balance funds include
general allocation fund (DAU), Special allocation fund (DAK) and revenue sharing
allocation and natural resources (DBH).8
According to the Law No. 33/2004 on Fiscal Decentralisation, the criterion of central
to regional allocation should be to meet the needs of the region as measured by the regional
expenditure chapter. At the meantime, the function of the given authority (fiscal needs)
should be able to safeguard efforts to explore local revenue (regional income) in the region,
and it also should be fair in applying its weighting formulation and should be transparent or
open and stable (Government of Indonesia 2004).
Recent studies on fiscal decentralization funds in Indonesia have mixed of the result.
Eckardt (2008) studies confirm the implementation of fiscal decentralization in Indonesia has
improved public services delivery educational facilities, as well decision making process.
Another studies by Simanjuntak (2009) as cited in Muttaqin (2017) also mentioned that
quality of public services has raised particularly in educational outcomes. However, other
7 Smoke, P. (2007) ‘Fiscal Decentralisation and Intergovernmental Fiscal Relations: Navigating a Viable
Path to Reform’, in Cheema, G.S. & Rondinelli, D.A. (eds) Decentralising governance: emerging concepts and
practices, pp. 1-20. Washington: The Brookings Institution Press. Page 141-142. 8 World Bank Indonesia (2010) Laporan Penelitian Dana Transfer Pusat ke Daerah: Penyempurnaan Grand
Design Desentralisasi Fiskal 2010. Decentralisation Support Facility. Jakarta: Indonesia.
http://documents.worldbank.org/curated/en/640961468038947914/pdf/687640ESW0P1190sfer0Pusat0ke0Daer
ah.pdf Accessed on 27th September 2017.

14
literatures showed on the contrary result, as Kes-Katos and Sjahrir (2014) studies found an
initial improvement on local public financing not directly affect to the regional leaders
accountability particularly related to public service delivery. Finally, recent empirical studies
in Indonesia showed that fiscal decentralisation process does not always align positively with
local government performance. Nasution (2016) studies indicated that fiscal authority transfer
has not increased local government capability to enhance their economic productivity. This
failure potentially will cause fiscal imbalances later on.
2.3 Political Budget Cycles in Local Government
While recent studies identify several PBC determinants at the national level; there are
also growing academic documentations that observed political budget cycles at the sub-
national level where greater similarity in government structure, policy instruments
availability, and uniformity in electoral rules and dates are present (Chortareas et al. 2016).
Furthermore, local governments study in the same country also allows to hold constant series
of cultural and institutional characteristics that can potentially affect the causal effects
identification that occurs in a cross-country analysis (Alesina and Paradisi 2014). The studies
to examine the political budget cycles behaviour existence on local election has generated
mixed results (Klomp and Haan 2013; Balaguer-Coll et.al 2015). Brender (2003) does not
find a significant result using data for Israel, while Drazen and Eslava (2010) find evidence in
Columbian municipalities that a pre-electoral increase in targeted expenditures affects
electorates behaviour. Another study in several transitions democratized country such as
Rusia after the fall of communism and Germany after unification find the similar evidence
with Columbian municipalities (Akhmedov and Zhuravskaya 2004; and Foremny and Riedel
2014). The evidence is there is an exceed transfer fund to the citizens was consistently
upwards while the revenue reduced approaching the election year.
Most political budget cycles studies in particular subnational level, the dependent
variable is a measure of fiscal policies, whether local government spending or revenues.
Klein (2010) stated that the variable Y of political budget cycles study is fiscal policy (total
government spending or expenditures on development projects), and the explanatory variable
is a dummy reflecting an election period. Likewise, Chortareas et al. (2016) and Benito, et al.
(2012) who have used fiscal variables (capital and current spending, and revenues) as their
dependent variables to examine the political budget cycles existences in Greece and Spain
municipalities respectively. The voters have preferences for high level of spending in

15
particular the public goods or related to their welfare such roads, transport systems, schools,
and hospitals (Klein 2010). In addition, Sjahrir et al. (2013) models showed that donation and
social assistance budget spending would increase the incumbent leader’s popularity among
the voters. Moreover, it also will enhance their probability when the political budget cycles
presence (Klomp and Haan 2013; and Ballaguer-Coll et al. 2015).
Chortareas et al. (2016) approach model that adapted from many scholars to examine
political budget cycles existence through fiscal variables that include total expenditures and
revenues, and other vector variables such as a number economic (government subsidies),
demographic (population) and political (party’s ideology) explanatory variables. Similarly,
Klein (2010) offers model to examine the existence of political budget cycle through the real
government spending per capita. He also accounting other control variables for other political
determinants of public expenditure, such as the former election result of the local head’s
political party vote-share, the party dummies indicators whether the incumbent’s party is the
same as the former leaders not only local but also national, and the log population. He also
proposes the probability of the local incumbent leaders being re-elected through the variation
in real government spending per capita, and other control variables such as the variation of
per capita revenues, and the fiscal deficit measurement (Klein 2010).
Specifically to the local governments in Indonesia, Ritonga and Alam (2010) find that
the allocation of grant and society support expenditure in incumbent regions during the
election year is higher than prior the elections. Sjahrir et al. (2013) analyze the political
budget cycles effect for indirect and direct elections in Indonesia and find that significant
political budget cycles exist in Indonesian districts only for direct election, and that the
political budget cycles are significantly stronger when incumbents run for re-election. Winoto
and Falikhatun (2015) investigate the possibility of misuse of discretionary funds in local
governments’ budget, but found no indication of misuse of grant and social aid before the
local election in 2015.
In sum up discussions above, Political Budget Cycles theory exists prior to some
conditional followed instead of as a universal phenomenon. These conditional variables have
been offered in order to explain the differences between one country to others, such as
developing and developed countries; emerging and established democracies; constitutional
rules (legal); and cultural, geographical (include demographic circumstance), and other
societal characteristics of the country (education rate, information access).

16
Theoretically, this study was built from the Sjahrir et al. (2013) and Chortareas
(2016) study perspective. The first study captured political budget cycles behaviour in direct
local elections in Indonsia compared to indirect local election, and by examining model
dummies for two years around the election and election time. They also captured an
incumbent’s region behaviour in budget spending when running re-election. The latter study
observed politically motivated fiscal policy in Greeks municipalities and their probability to
be re-elected.
In their study, Sjahrir et al. (2013) try to disaggregate the administrative expenditure
to separate the discretionary and non-discretionary components, and hypothesize that
incumbents raise their discretionary funds in election years (donation and social assistance
sub category budget) in order to improve their popularity and has beneficial effect to be re-
elected. Total expenditure, investment expenditure also put into model since in previous
studies it goes upwards around the election years (Klein 2010; Vergas 2009; Chortareas
2016). Meanwhile, budget balance also important whether the exceed fiscal spending affect
positively the deficit in particular at the late period of incumbent’s duty time (Klein 2010;
and Chortareas 2016).
The control variables in this study are population size, the log of real GDP per capita,
and the literacy rate as the proxy of education rate of the voters. The population is to ensure
that the size of citizen affects the political induced behaviour or not. Education variable is
necessary to capture election behaviour of the voters, which has consistently been found to
increase political participation and affect the voting preferences (Burden 2009). Another
study by Milligan et al. (2004) finds that the people education rate has positive effect related
to political participation in the US and UK, and it also will affect people awareness as well
their rationality to vote. The study also found that the higher of education level among citizen
will affect the ability to gain more information whether related to candidates or their
programs (Milligan et al. 2004).

17
Figure 2. Conceptual Framewok
Source:
Constructed by Author

18
Chapter 3 Overview
3.1 Regional Elections in Indonesia
3.1.1 A Brief History of Regional Elections in Indonesia
Theoretically, there are three main goals of the election, which are to get legitimate
government, to reach social and political integration, and to get an effective government. The
first aim comes from political representatives from political party that elected from election,
social and political cohesion as a result of public participation during election, and the latter
is a result of a trusted election (Webb et al. 2015).9
Indonesian is a decentralized country, which has transferred not only political but also
fiscal into local government since 2001. According to Ministry of Home Affairs, it has 542
autonomous regions consist of 34 Provinces and 508 municipalities (regencies/cities).10
Regional elections in Indonesia has been implemented since the colonial period Dutch with
different mechanisms with some pattern appointment followed. Each pattern is heavily
dependent on the holder power at that time. The replacement of power holders, as well as the
entry of new regimes within a power has an influence over the elections implementation
during these respective rulers or regimes take those policies (King, D.Y. 2003).11
In new
order era, the head of regions are appointed by central government, but after post-Soeharto
era (after1998), they are elected through the local parliament's process mechanism. Finally,
direct election mechanism in 2005 was implemented as an evaluation result of the former
representative system implementation that allegedly neglected people needs (Vidi 2017; BTI
2016; Choi 2017; and Harahap 2017).12
9 Webb et.al (2015), Election, https://www.britannica.com/topic/election-political-science/Functions-of-
elections, accessed on 15th July 2017, Encyclopædia Britannica, inc. 10 Directorate General of Regional Autonomy, MoHA (2014). The Formation of Autonomous Regions until
2014. Accessed on 22th July 2017. < http://otda.kemendagri.go.id/CMS/Images/SubMenu/totalDOB.pdf>. 11 The history of Indonesian political reformation including elections process on the early of post-
authoritarian era can be found at King, Y.D. (2003) Half-Hearted Reform: electoral Institutions and the Struggle
for Democracy in Indonesia. Wesport: Praeger Publishing. 12Batlolone, Vidi (2014), Lika liku Sejarah Pilkada. Accessed on 1st August 2017.
<http://www.sinarharapan.co/news/read/141007082/lika-liku-sejarah-pilkada->.
.
19
The local direct election is an alternative solution to tackle both conflict and
ineffectiveness implementation of the regional election indirectly result based on a legislative
member under Law Number 22/1999 regarding Regional Government. Local election
immediately becomes an urgent need to correct as soon as possible any flaws in the
representative local election which implemented through the local legislatures. The election
will directly be beneficial to people as the uphold sovereignty which have been lost since the
election through the parliament member. The new system that was introduced in 2005
claimed will create a good state of democracy in the government management (governance)
as well as in the social environment (civil society) because the people's sovereignty has been
fully restored (Surbakti 2005).
All formal elections whether national or sub-national direct elections, are organized
by the Indonesian election commission. Previously, regional head elections were done
separately with vary of tenures depends on its region, and occurs during the year. However,
in 5 special status regions in provincial level (Aceh, Capital Region of Jakarta, Special
Region of Yogyakarta, Papua, and West Papua) there are special autonomous regions, which
have specific, unique, and exceptional requirements. For instance, in Aceh Province, there is
a local political party (namely as Aceh Party) which has involved into the elections and
currently becomes the strongest political party. For Jakarta, as a special capital region, the
autonomy is only for the provincial level while in the district level are not being elected.
Another special region is Yogyakarta, which has regulation that Yogyakarta’s king also
appointed as the governor. Lastly, Papua and West Papua province has special autonomy
(www.mediaindonesia.com 24/06/2016).13
All regional elections are held throughout the year, and mostly there are postponed
election in some regions. These regions election occur infrequent among areas rely on the
period time, it can be held on the same day but mostly in the different day along years
(rumahpemilu.org). As mentioned previously, most of the candidates as a pair are elected for
a five-year period and can be re-elected on the second term with votes number no less than 30
percent. Exceptionally, for Jakarta there is a special requirement, the winner should gain
13 Micom (2016) Pilkada Serentak dengan Aturan Berbeda (Simultaneous Pilkada with different
regulations). Accessed on 30th July 2017 <http://mediaindonesia.com/news/read/52907/pilkada-serentak-
dengan-aturan-berbeda-hanya-jakarta-50-plus-satu/2016-06-24>.

20
minimum 50 percent of votes number. As if such a sufficient number is not achieved, there
will be a second-round election among the top two candidate pairs.14
3.1.2 Simultaneous Regional Direct Election in Indonesia
The idea of a simultaneous regional election is to reduce the risk of disruption and
disturbance from areas that do not hold elections on that day. Moreover, simultaneous
regional elections are more efficient economically, more focused to capture what local people
needs, and easier to be assessed compared to separate elections elections (www.idea.int
14/02/2017); www.globalindonesianvoices.com 26/11/2015; www.netralnews.com
09/01/2017).15
During ten years of direct regional head election implementation since 2005,
around 1,500 regional elections conducted in Indonesia with various completion tenure
periods of head of regions leading to high cost and inefficiency
(http://www.thejakartapost.com 09/09/2014).16
Law No. 8 of 2015 mandates that from 2015 to 2018, local elections have to be
implemented every 5 (five) years simultaneously on the same date throughout the territory of
the Republic of Indonesia (Republic of Indonesia 2015). The election on 9 December 2015
was only one of the three rounds of simultaneous regional elections in Indonesia covering
269 regions in Indonesia. Based on data from the Directorate General of Regional Autonomy,
MoHA, regional head elections will be implemented simultaneously in 269 regions which
consist of 170 districts, 26 cities and eight provinces in Indonesia on 9 December 2015
(Ministry of Home Affairs 2014). Following the first event in 2015, there have been other
two rounds after regional direct elections in 2015, which was held on February 2017 in 101
regions, and followed by the third round which will be held in June 2018 in 171 regions
(General Elections Commission 2015).
14 Specifically, regarding Special Region of Jakarta’s election is ruled by The Law No. 29/2007 article 11
on Capital Region of Jakarta that stated ‘the pair of governor candidate who votes more than 50% (fifty percent)
is designated as elected governor and vice governor. 15
Tamang ,L.R. (2017), Five things you may not know about Indonesia’s Regional Elections. Accessed on
15 July 2017 < http://www.idea.int/news-media/news/five-things-you-may-not-know-about-
indonesia%E2%80%99s-regional-elections>.
Arham, M. (2015) Simultaneous Regional Elections for a Better Democracy. Accesed 15 July 2017
<http://www.globalindonesianvoices.com/23701/simultaneous-regional-elections-for-a-better-democracy/>.
Wiseno (2017), Simultaneous Regional Elections Expected to Boost Economic Growth. Accesed 15th July
<http://www.en.netralnews.com/news/business/read/108/simultaneous.regional.elections.expected.to.boost.econ
omic.growth> 16 Wardhani. D.A. (2014), Ahok defends direct elections, slams coalition. Accessed 20 August 2017.
<http://www.thejakartapost.com/news/2014/09/09/ahok-defends-direct-elections-slams-coalition.html>

21
Table 1. The Implementation of Simultaneous Local Direct Head Election Phases
The End of Tenures Simultaneous Local Direct Head Election Phases Implementation
First Transition Second Transition Third Transition
The year of 2015 and
between January-June
2016
December 2015 2020 2027
Between June-December
2016 and the year of
2017
February 2017 2022
The year of 2018 and
2019
June 2018 2023
Source: Ministry of Home Affairs 2015
The current local leaders, whether the governor, the mayor, and the regent can be re-
elected for the second period, and called as incumbent. However, there is an unclear
definition regarding incumbent in Act on Regional Elections in Indonesia.17
Formally, the
only explanation of incumbent terminology comes from the KPU Regulation No. 9 of 2015
on Governor, Regent, and Mayor Nomination. Article 1 section (19) states: “The Incumbent
is the Governor or Vice Governor, Regent or Vice Regent, and Mayor or Deputy Mayor who
is currently serving.” However, The Supreme Constitutional Court has canceled the Law by
Decision of The Supreme Constitutional Court number 100/PUU-XIII/2015 mentioning the
prohibition of incumbent’s relatives is against the constitution and human right.
Moreover, there is a further explanation on Formal Letter of KPU No.
302/VI/KPU/2015 stating that the current regional heads who have terminated tenure period,
have resigned, or could not serve before the end of tenure and before the election registration
time, cannot be called as an incumbent. These regulations have been criticized by political
practitioners and experts since it will allow the relatives of the incumbents to enrol into the
election that is forbidden by law and will allegedly form political dynasties. Regarding the
incumbent terminology, this research will use the KPU regulation No. 1 section (19)
definition instead of the further explanation from the KPU formal letter, to analyse the
relations between incumbencies to local budget expenditure behaviour particularly in an
election year.
17 The only article that mention on “Incumbent” is on article 7 section (f) that stated “The nominee has no
conflict of interest with the incumbents at least for 1 (one) period of election.” Republic of Indonesia (2015).
The Law No. 8 of 2015 on Amendment to Law No. 1 of 2015 on Stipulation of Government Regulation No. 1
of 2014 on the Election of the Governor, Regent, and Mayor be Liable.

22
3.2 Fiscal Decentralisation and Regional Public Expenditure in Indonesia
Decentralization process in Indonesia has changed over time reflected by regulation
amendment on regional government. In contrast with a regional government regulation that
has been revised for the third time, the last regulation related to fiscal decentralisation is Law
No. 33 of 2004.18
The revision of the regulations does not have big differences with its
forerunner, in term of fiscal autonomy. The change of the rules decentralization in Indonesia
can be seen as the figure below.
Figure 3. The Evolution of Decentralization Regulation in Indonesia
Source: Author Analysis based on Ministry of Home Affairs.
The decentralisation implementation in Indonesia, particularly fiscal decentralisation
program, has not been free of flaws. There are some obstacles, not only budget efficiency
management and usage, but also fiscal resources. Many regions have rich natural resources,
and this has affected their revenue. On the other hand, there are also regions with less natural
resources, and it affects their revenue as well. According to Blöndal, et al. (2009), the local
government rely on central government subsidiary through transfer fund around 90 percent to
fulfill their budget needs. They argue that one of the reasons is due the tax authority in
Indonesia which remains centrally weighted instead of collected locally by local
governments. There are three key elements of the fiscal transfer budget in Indonesia: revenue
sharing, general allocation subsidiary, and specific allocation funds (Blondal 2009).
18 The Law of regional government are The Act number 22 of 1999, that was revised by The Act number 33
of 2004, and finally was replaced by The Act number 23 of 2014 on regional government. However, the
regulation related fiscal decentralization are The Act number 23 of 1999, and replaced by The Act number 33 of
2004 on fiscal decentralization or already has been implementing for almost 14 years.
Regulation Aspect
•Regional Government Decentralisation
•Fiscal Decentralization
Implemented in 2001
•Law No. 22/1999
•Law No. 25/1999
Implemented in 2004
•Law No. 32/2004
•Law No. 33/2004
Implemented in 2014
•Law 23/2014
23
0
100
200
300
400
500
600
700
800
2010 2011 2012 2013 2014 APBNP2015
APBN 2016
( I N T R I L L I O N R U P I A H S )
Transfer Funds Special Autonomy Region Funds
Others Transfer Fund Yogyakarta Special Funds
Regions Insentive Funds Village Transfer Funds
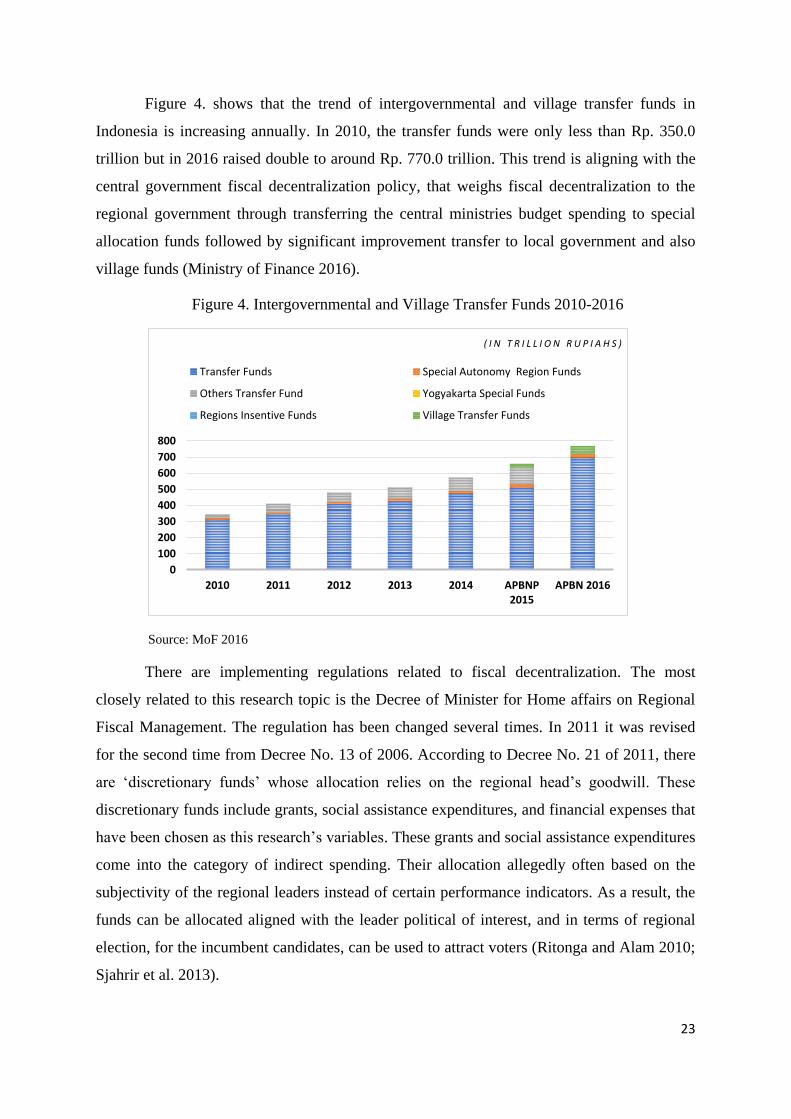
Figure 4. shows that the trend of intergovernmental and village transfer funds in
Indonesia is increasing annually. In 2010, the transfer funds were only less than Rp. 350.0
trillion but in 2016 raised double to around Rp. 770.0 trillion. This trend is aligning with the
central government fiscal decentralization policy, that weighs fiscal decentralization to the
regional government through transferring the central ministries budget spending to special
allocation funds followed by significant improvement transfer to local government and also
village funds (Ministry of Finance 2016).
Figure 4. Intergovernmental and Village Transfer Funds 2010-2016
Source: MoF 2016
There are implementing regulations related to fiscal decentralization. The most
closely related to this research topic is the Decree of Minister for Home affairs on Regional
Fiscal Management. The regulation has been changed several times. In 2011 it was revised
for the second time from Decree No. 13 of 2006. According to Decree No. 21 of 2011, there
are ‘discretionary funds’ whose allocation relies on the regional head’s goodwill. These
discretionary funds include grants, social assistance expenditures, and financial expenses that
have been chosen as this research’s variables. These grants and social assistance expenditures
come into the category of indirect spending. Their allocation allegedly often based on the
subjectivity of the regional leaders instead of certain performance indicators. As a result, the
funds can be allocated aligned with the leader political of interest, and in terms of regional
election, for the incumbent candidates, can be used to attract voters (Ritonga and Alam 2010;
Sjahrir et al. 2013).

24
In order to prevent the local budget spending misallocation, the government stipulates
MoHA Decree No. 32 of 2011 on Guidelines for Grant and Social Assistance sourced from
APBD, which is amended to Decree No. 39 of 2012. After the issuance of the MoHA Decree
No. 39 of 2012, there is an improved method. The grant expenditure, social assistance, and
financial assistance expenditure are no longer using a lump sum system package, but it must
be provided with recipient’s name, recipient’s address and the amount of aid (whether grants,
social assistance, and financial assistance). This new regulation is mentioned in Annex III
Regional Head Regulation on Translation of Regional Revenue and Expenditure Budget
(APBD).
According to the Decree of Minister for Home Affairs No. 32 of 2011, as amended by
Decree No. 39 of 2012, the grant is a gift money, goods or services from local government to
the government or local government or others local companies, communities and community
organizations, which are explicitly as a non-mandatory and non-binding donation (accidental/
or not routine), as well as not continuously. This kind of expenditures aims to support the
administration and office affairs of local government.
Another subcategory expenditure is social assistance, which is another type of
donation aid whether financial or other things from the government to individuals, families,
groups, or communities that are not in a manner continuously and with the selective purpose
to prevent any possible social risks occurrence (BPS 2017). Social risk is defined as an event
or many events that can potentially generate social vulnerability borne occurrence, whether
by individuals, families, groups and / or society as the impact of any social crisis, economic
crisis, political crisis, natural phenomenon, and natural disasters. This crisis, if not tackled by
social assistance spending will be worse off, or even cannot live under normal conditions
(BPS 2017).
The Decree of Minister for Home Affairs No. 32 of 2011 that has been changed to the
Decree No. 39 of 2012 on article (4) and article (22) mentions that local governments can
provide grants, social assistance, and financial aid. The facility support related to the ability
of regional finances after prioritizing fulfilment of obligatory budget expenses after
considering the principles of justice, propriety, rationality, and the benefits of the aid for the
society itself. In general, stages and mechanisms of the formulation process between grants,
social assistance, and financial aid there is no fundamental difference among them (Winoto
and Falikhatun 2015).

25
The previous literatures in Indonesia conclude that there are significant indication of
the grant, social, and financial assistance funds utilization to approaching election (Ritonga
and Alam 2010; Sjahrir et al. 2013). In contrast, Winoto and Falikhatun (2015) studies found
that there is no significant relationship between allocation in discretionary fund subcategory
(donation and social assistance spending) with the political interest approaching the
simultaneous regional election in 2015. However, in this study, there is an indication of fiscal
capacity and political issues influenced to the amount of discretional subcategory allocation.

26
Chapter 4 Data and Methodology
4.1 Data
This research uses a panel data set of public spending and deficits of districts and
municipalities in Indonesia which held simultaneous direct head local elections over the
period 2010-2015. The unit of observation is the municipality level in Indonesia. This study
used secondary data that includes three types of data: economic (GRDP and local government
budget), demographic (population and adult literacy rate), and political matters (election
years, incumbency, and win the election). Fiscal data include budget balance, total
expenditures, investment expenditures, donation expenditures, social assistance expenditures,
and financial assistance expenditure of 254 Indonesia’s regions (regencies/cities, and
provinces) that involve simultaneous regional election in 2015 between the period of 2011-
2015.19
We also add 107 regions which had no election in 2015 in order to analyse whether
the local budget spending behaviour motivated by election period.
Data related to local government expenditures was obtained from Directorate General
of Fiscal Balance, Ministry of Finance report and Government Financial Statistics
Regency/City from Statistics Indonesia (Central Statistics Agency/ BPS). The demographic
data for control variables includes population and adult literacy rate, also obtained from 2010
Indonesia Population Census and its projection, and National Socioeconomy Survey
(Susenas) respectively. Both data are gathered from BPS. Finally, political data consisting of
timing and results of each local elections, the incumbents running for re-election, were
obtained from various sources, including KPU, MoHA, and Perludem.
4.2 Hypothesis
19 The proliferation regions whether districts or provinces, which result from regional expansion between
the year of 2010-2014 are excluded. Initially, there are 269 regions held the simultaneous election in 2015. The
assumption is it considered that the newly-formed regions have no motive regarding opportunistic fiscal policy
manipulation in terms of vested interest of the candidates.

27
This study’s hypothesis is constructed based on several previous studies as follow.
First of all, Chortareas et al. (2016) studied that use the fiscal policy variables including
budget balance, borrowing revenues, total expenditures, and investment expenditures to
examine the presence of political budget cycles in Greece Municipalities. Ballaguer-Coll et
al. (2015) also reviewed the re-election determinant factors of Spanish municipalities by
analysing fiscal variables (total and current expenditures; and tax, grants, and debt revenues)
and political variables as control.
Another research observed Indonesia at district level, where Sjahrir et al. (2013) used
overall district expenditures, administrative expenditures, and subcategory “other” of
administrative expenditures. This “other” administrative spending included unspecified
spending, unpredictable spending, interest payment, financial assistance to lower regions
(sub-districts or villages), social assistance spending, and also donations (grants) expenditure.
Hence, in this study, the presence of pre-electoral manipulation can be assessed through an
increase of government spending by reviewing budget balance, total expenditures, investment
expenditures, and discretionary expenditures in sum and its each subcategory including
grants, social assistance, and financial assistance expenditure during an election year.
4.2.1. Budget Balance
The fundamental assumptions on the politically-motivated budget cycle theoretical
framework is that an incumbent’s re-election chances can be increased by expansionary fiscal
policy in general, and in election years in particular (Brender and Drazen 2008; and
Chortareas et al. 2016). A good economic performance has a beneficial effect to boost
incumbent’s re-election extension prospects. They can use expansionary fiscal policy to
manipulate macroeconomic outcomes and provide sufficient growth, to pronounce signal
competence and sequentially, to maximize vote share for the candidates. Rogoff (1990)
argued that expansionary fiscal policy around election years could lead electorates to vote for
incumbents who produce them because it signals that the current official leaders have high
competence and have high performance as well.
An empirical study by Veiga and Veiga (2007) in Portuguese municipalities also
found that elections have adverse effect on the budget balance through the decrease of local
tax collection and the increase of municipal expenditures. Moreover, they showed that before
elections, opportunistic incumbents changed the composition expenditures toward observable

28
investment items, such as construction of overpasses and street works (Chortareas et al.
2016).
Based on above explanation, in this study, an election year with the incumbent
candidate is expected to be negatively related to the budget balance.
H1: Election year in region with incumbent has negative impacts on budget balance
4.2.2. Total Expenditures
The theoretical model developed by Rogoff and Sibert (1988) explains the existence
of political budget cycles with rational electorates who suffer from asymmetric information
regarding the competencies of elected officials. In this context, incumbents would engage in
electoral cycles by manipulating economic policy variables, such as taxes and government
expenditures, to produce a given level of public services with a lesser amount of revenue as a
way to signal competence to electorates.
Vergne (2009), which uses a panel of developing countries from 1975-2001, finds
evidence that election-year public spending shifts toward more visible current expenditures,
in particular wages and subsidies. Meanwhile, other studies focusing on the analysis of sub-
national level identified a decrease in budget balance and an increase in total expenditures
and various spending categories such as healthcare, educational, and road construction in
election years (Veiga and Veiga, 2007; Drazen and Eslava 2010; Chortareas 2016).
Therefore, in this study, an election year with the incumbent candidate is expected to
have a positive relation to total expenditures.
H2: Election year in a region that has incumbent has positive impacts on total
expenditures.
4.2.3. Investment Expenditures
On the study of the political budget cycle in municipal level, Veiga and Veiga (2007)
and Chortareas et al. (2016) identified increases in government expenditures in election years
in Portueges and Brazil municipalities respectively, especially investment expenditures.
Another study evidence in Columbia municipalities also found that investment spending
particularly infrastructure construction (school building, highway, electricity plants, and so
on) also intensively raised around election time (Drazen and Eslava 2010).

29
In this study, an election year with the incumbent candidate is expected to be
positively related to investment expenditures.
H3: Election in year region with incumbent has positive impacts on investment
expenditures.
4.2.4. Discretionary Expenditures
Donation expenditures, along with social assistance and financial assistance
expenditures belong to discretionary expenditures category. This expenditures category can
be spent relatively freely in contrast to other items and have displayed a strongly cyclical
behaviour in direct elections, especially if the incumbent running for re-election (Sjahrir et al.
2013). In terms of the political budget cycles study in Indonesian municipalities, few studies
have been conducted regarding the possible misuse of discretionary expenditures by
incumbent government. Ritonga and Alam (2010) investigated the allocation of donation and
social assistance expenditures between incumbent and non-incumbent candidates and found
that the distribution of donation and social assistance expenditure in incumbent regions
during the election year was higher compared to approaching the election time.
Therefore, in this study, an election year with incumbent candidates is expected to be
positively related to donation expenditures, social assistance expenditures, and financial
assistance expenditures.
H4: Election year in year region with incumbent has positive impacts on
discretionary funds.
H5: Election year in year region with incumbent has positive impacts on grants
expenditures.
H6: Election year in year region with incumbent has positive impacts on social
assistance expenditures.
4.2.5. Probability being re-elected
There is a link between political budget cycles behaviour to an increase of the
likelihood of being re-elected. However, the incumbent behaviour to maximize their
influence to use local budget expenditure not solely induced by opportunistic reason for being
re-elected, but also concerns on their welfare later on. Drazen and Eslava (2010) studies on
Columbian local government election founds that an increase in certain expenditures will
affect the voter to respond positively. Breder and Drazen (2012) also found that the more
periods time of the current officials will influence the opportunistic behaviour of spending
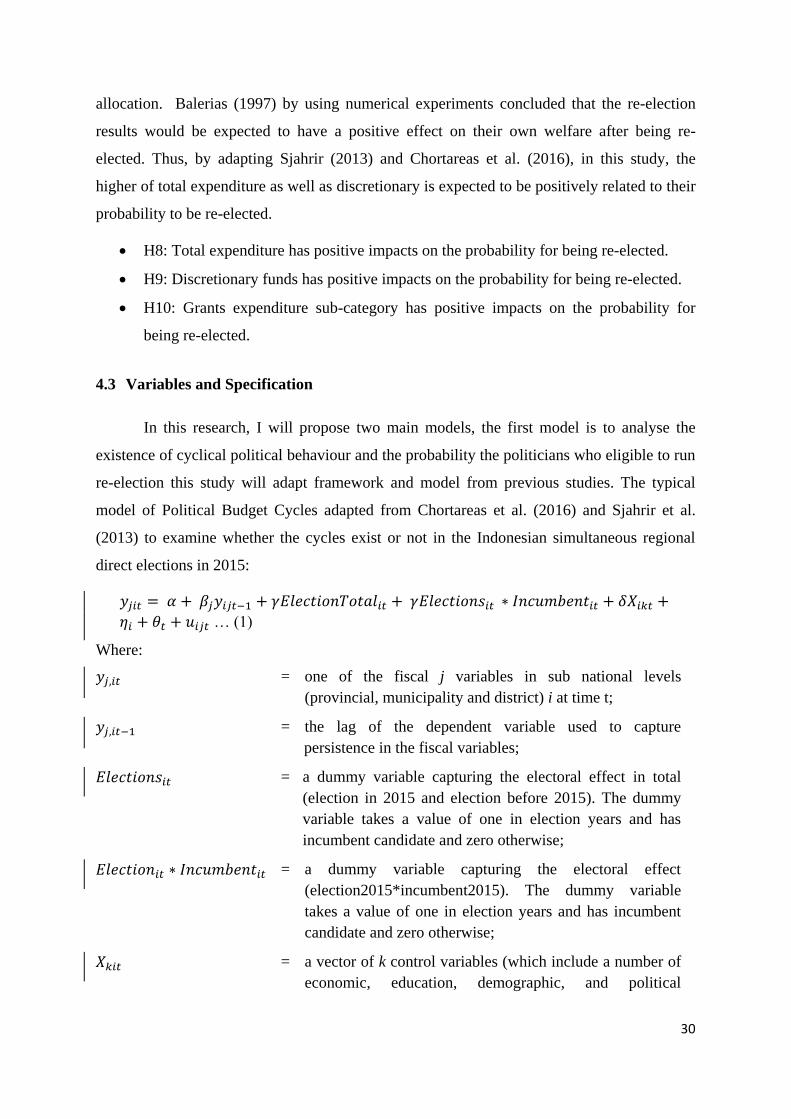
30
allocation. Balerias (1997) by using numerical experiments concluded that the re-election
results would be expected to have a positive effect on their own welfare after being re-
elected. Thus, by adapting Sjahrir (2013) and Chortareas et al. (2016), in this study, the
higher of total expenditure as well as discretionary is expected to be positively related to their
probability to be re-elected.
H8: Total expenditure has positive impacts on the probability for being re-elected.
H9: Discretionary funds has positive impacts on the probability for being re-elected.
H10: Grants expenditure sub-category has positive impacts on the probability for
being re-elected.
4.3 Variables and Specification
In this research, I will propose two main models, the first model is to analyse the
existence of cyclical political behaviour and the probability the politicians who eligible to run
re-election this study will adapt framework and model from previous studies. The typical
model of Political Budget Cycles adapted from Chortareas et al. (2016) and Sjahrir et al.
(2013) to examine whether the cycles exist or not in the Indonesian simultaneous regional
direct elections in 2015:
𝑦𝑗𝑖𝑡 = 𝛼 + 𝛽𝑗𝑦𝑖𝑗𝑡−1 + 𝛾𝐸𝑙𝑒𝑐𝑡𝑖𝑜𝑛𝑇𝑜𝑡𝑎𝑙𝑖𝑡 + 𝛾𝐸𝑙𝑒𝑐𝑡𝑖𝑜𝑛𝑠𝑖𝑡 ∗ 𝐼𝑛𝑐𝑢𝑚𝑏𝑒𝑛𝑡𝑖𝑡 + 𝛿𝑋𝑖𝑘𝑡 +
𝜂𝑖 + 𝜃𝑡 + 𝑢𝑖𝑗𝑡 … (1)
Where:
𝑦𝑗,𝑖𝑡 = one of the fiscal j variables in sub national levels
(provincial, municipality and district) i at time t;
𝑦𝑗,𝑖𝑡−1 = the lag of the dependent variable used to capture
persistence in the fiscal variables;
𝐸𝑙𝑒𝑐𝑡𝑖𝑜𝑛𝑠𝑖𝑡 = a dummy variable capturing the electoral effect in total
(election in 2015 and election before 2015). The dummy
variable takes a value of one in election years and has
incumbent candidate and zero otherwise;
𝐸𝑙𝑒𝑐𝑡𝑖𝑜𝑛𝑖𝑡 ∗ 𝐼𝑛𝑐𝑢𝑚𝑏𝑒𝑛𝑡𝑖𝑡 = a dummy variable capturing the electoral effect
(election2015*incumbent2015). The dummy variable
takes a value of one in election years and has incumbent
candidate and zero otherwise;
𝑋𝑘𝑖𝑡 = a vector of k control variables (which include a number of
economic, education, demographic, and political

31
explanatory variables);
𝜂𝑖 = the unobserved municipality specific effects;
𝜃𝑡 = the time effect at time t; and
𝑢𝑖𝑡 = error term
The fiscal policy variables include the total expenditures, budget deficits, and the
highly visible to the electorate are discretionary expenditures (include grants, financial
assistance, and social aid spending) fluctuation. All variables are expressed in logarithms.
The vector 𝑋𝑘𝑖𝑡 (control variables) are the economic variables include revenues from central
government or direct transfers funds which also reflect on the amount of revenues from
municipalities (Total Income); education rate of the people which is proxy by literacy rate;
and population size (Pop Size), by constructing a variable in logarithms as well.
The log population is added since the adoption of the political budget cycle strategy
should become less effective as the size of the district's increase (Chortareas et al. 2016). In
other words, the smaller districts reduce the distance between voters and its representatives
and will which facilitate the flow of information and improve accountability. Regarding
literacy rate, we exclude a demographic variable that represents the percentage of the
population under 15 years old (% Pop < 15), which is not eligible to vote in any elections. In
other words, it represents adult literacy rate.
In addition, in order to testing whether incumbents who adopt political budget cycles
have a beneficial effect regarding the possibility of being re-elected or not, we use model
adapted from Chortareas et al. (2016) as follows:
𝑍𝑖𝑡 = 𝛼 + 𝛽𝜒𝑖𝑡 + 𝜂𝑖𝑡 + 𝑢𝑖𝑗𝑡 … (2)
Where:
𝑍𝑡 = the dichotomuous dependent variable (Won) taking a value of
one if the mayor is re-elected and zero otherwise;
𝑋𝑘𝑖𝑡 = a vector of k control variables (which include a number of
economic, education, and demographic);
𝜂𝑖𝑡 = the fixed municipality specific effects
𝑢𝑖𝑡 = error term
The set of independent variables includes the fiscal variables under the control of the
demographic variables such as population size and literacy rate. In this study, we focus on the
effects of three budget expenditure variables, which are total budget spending, discretionary

32
budget funds, and grant expenditure sub-category over the full term as well as the effect of
opportunistic increases that occur during election years.
In order to examine the model (1), Chortareas et al. (2016) all steps estimation
procedures are adapted. The equation is a standard dynamic panel data specification.
However, the presence of a lagged dependent variable and regional specific effects reduces
the OLS estimator biased and inconsistent. On the other hand, to examine the model (2) about
the re-election probability, we use linear square dummy variable (LSDV) estimation
procedures.
Furthermore, the steps of data analysis in this study as follows.
a) Descriptive Statistics
Descriptive statistics analysis is a tool that aims to describe the data including sum,
mean, median, maximum, minimum, standard deviation, and variance. Descriptive statistics
analysis can form the data that make them more convenient to be interpreted by
rearrangingand ordering data to generate descriptive information.
b) Panel Data Regression
Panel data is define as a data that contain cross section and time series data combined
together to be observed over time. To estimate the panel data regression models, there are
several methods that can be used: Common Effect Model, Fixed Effect Model, and Random
Effect Model. Common Effect Model is the simplest model. This model assume that the
behaviour of each individuals would be the same for every period. This model simply
combines the time-series and cross-section data in the form of a pooled data, and estimate the
data using least square approximation (pooled least square) (Nachrowi and Usman 2006).
4.3.1. Dependent Variables
4.3.1.1. Fiscal Policy Variables
The fiscal policy variables used in this study follow the variables used by Chortareas
et al. (2016) and Klein (2010) which include the Budget Balance, Total Expenditures, and
Investment Expenditures, with add another discretionary expenditure category from Sjahrir et
al. (2013) namely as Grants, Social Assistance Expenditure, and Financial Assistance
Expenditures.
1) Budget Balance

33
Budget balance is the differences between total revenue and expenditure that describe
whether regional budget has sufficient fiscal policy and/or the healthiness of local budget
indicator. An exceed policy in expenditures to revenue is called deficit budget, meanwhile a
higher proportion of revenue expenditures policy is can be called as a surplus circumstance.
On the other word, the local government identify has a budget deficit circumstance when the
current expenses exceed higher compared to the amount of income being received through
standard operations. In terms of variable Budget Balance in this study, will express in
percentage of regional Gross Domestic Product (Brender and Drazen 2008; and Chortareas et
al. 2016).
2) Total Expenditures
Pass and Davies (2005) defined government expenditure as the act of spending by the
government includes current, investment, and transfer of payment in terms of public goods
and services fulfilment (health, education, health, roads, soon), private sector oriented goods
and services (mining, mailing services, etc.) and transfer of payments (personnel payment,
retirement fund, etc.).
In this study, regional government expenditure expressed as Total Expenditure. Total
Expenditures include all indirect (part of employees expenditure, interest expenditure,
subsidies, grants, social assistanc, sharing fund, financial assistance, and unforeseen
expenditure and direct expenditure) which not related straight to the government program and
activities implementation; and direct (part of personnel expenditure, goods and services
expenditure, and capital expenditures) that has close relationship with government daily
activities (Blondal 2009 and Statistics Indonesia 2017).Total Expenditures are expressed in
natural logarithm.
3) Investment Expenditures
This type of expenditure refers to the purchasing whether goods or services for
existing utilisation, to fulfill the community needs directly, is classified as government final
consumption expenditure. The act of government purchasing is to have fixed asset (long-term
acquisition) and still have beneficial in the future. For example, infrastructure investment or
machinery spending can be classified as Investment Expenditure. These two types of
government spending together constitute one of the major components of gross domestic
product expenses used for purchasing or procurement of a tangible fixed asset (durable

34
goods) that worth more than a year (Statistics Indonesia 2017). Investment Expenditures are
also stated in natural logarithm.
4) Discretionary Expenditures
Discretionary expenditures are the type of government’s spending that has no
essential direct influence to daily government activities, allocated after obligatory spending
are paid, and the distribution relatively closed to the government officials themselves. Curto-
Grau and Zudenkova (2016) defined this kind of expenditure as flexible donations that
closely has relationship with “a partisan bias” and has purposive beneficiaries target.20
These
items of budget category closed to local head decision matters in provision of financial
assistance, program assistance that has beneficial to the citizens. These spending categories
consist of grants, social assistance, and financial assistance expenditure. Grant expenditures
are donation in the form of money, goods or services from the local government to
government or other regional governments, regional government’s companies, communities,
and community organizations, which have specific use allocation, is not mandatory and not
binding, and not continuously given, that aim to support the implementation of local
government affairs (Statistics Indonesia 2017).
The second sub category is social assistance expenditures are social assistance in the
form of money or goods from the local government to individual, family, groups and/or
communities that are non-continuous and selectively given that aim to protect from the
possibility of social risk. The last of discretionary funds sub category is financial assistance
expenditures defined as financial/goods or services from the local government to other local
governments (from provincial government to district government) or villages that aim to
address the fiscal gap or assist in the implementation of government affairs (Statistics
Indonesia 2017).21
These discretionary budget categories are regulated on The Decree of Minister for
Home Affairs No. 14/2016 on Second Amendment to regulation of the Minister of The
Republic of Indonesia No. 32/2011 regarding Guidelines for Granting and Social Assistance
20 They also switch frequently ”the discretionary spending” and “pork-barrel spending” terminology, since
they observed the legislature members behaviour in the U.S. 21 All definition of discretionary funds sub category adapted from BPS (2017). Financial Statistics of
Regency/ Municipality Government 2015-2016.

35
that Funded from Regional Budget. All the discretionary expenditures are articulated in
natural logarithm.
4.3.2. Independent Variables
4.3.2.1. Political Variables
1) Election Year
To examine the existence of opportunistic election cycles, this study follows Sjahrir
et al. (2013) and Chortareas et al. (2016) where the election variables takes the timing of an
election year. It takes the value of one in election years and zero otherwise.
2) Incumbent
To capture the effect of prolonged incumbency, we also use variable incumbent.
Chartoreas et al. (2016) suggests that a prolonged incumbency may be expected to affect the
magnitude of political budget cycle. An incumbent who has served for a prolonged period
may have greater ability to manipulate local finances, as he become familiar with the relevant
budgetary process or incentives for pre-electoral manipulation. However, their study in
Greece municipalities did not found any effect of years as office-holder to the magnitude of
the political budget cycles. In this study, we prefer to use incumbent instead of tenure (years
as mayors) since we only capture the current ruling government officials in one period of
tenure or between period 2011-2015. The incumbents tend to attract the electorates by using
any specific category expenditure to enhance their popularity among them (Sjahrir et al.
2013; Ballaguer-Coll et al. 2015; Chortareas et al. 2016).
3) Win
In order to know the probability of the political budget cycle existence, we also
capture it by using variable “won”, whether the incumbents lost and won the election.
Trounstine (2011) studies indicated that the current holder government seems to have a
higher possibility to re-run and win the election stem from the advantageous of their
incumbency. In this study, we focus on the effects of fiscal variables, mainly adapted from
Chortareas et al. (2016) and Sjahrir et al. (2013). We will analyse the prospect over the full
term as well as the effect of opportunistic increases that occur during election years.

36
4.3.2.2. Control Variables
This study use other control variables adapted from Sjahrir et al. (2013), Klomp and
Haan (2013), and Chortareas et al. (2016). The number of population needed to reflect
regions characteristics of economy scale that affect the government program and activities as
a whole system (Chortareas et al. 2016; Sjahrir 2013). Furthermore, since a higher of
education rate will enhance people participation as well as knowledge to be more rational
when they vote the candidates during election, this study also use literacy rate for people
above 15 years (Sjahrir et al. 2013). The assumption is the minimum election age is 17 years
old, and people who already married at least 15 years old above can vote as well.
Table 2. Variables and Definition Operational
Variables Variable
Name Definition Sources
Economic Growth Regional
GDP per
Capita
Regional GDP is used to reflect the economic
performance in sub national level. Regional
GDP per Capita is expressed in natural logarithm
BPS
Expenditure Total
Expenditure Total expenditure per capita is direct and indirect
expenditure. Total Expenditures are expressed in
natural logarithm
DGFB, MoF
BPS
Investment
Expenditure The expenses variable used for
purchasing/procurement of a tangible fixed asset
that worth more than a year (durable
goods/assets): transportation, road, land,
furniture, etc. Investment Expenditures are
expressed in natural logarithm
DGFB, MoF
BPS
Grants
Expenditure The support aid can be as money, properties, or
services other local governments, village
government, regional corporate/state/enterprises.
Grant Expenditures are expressed in natural
logarithm
DGFB, MoF
BPS
Social
Assistance Social assistance are given to civil society
organizations, political parties and others with
the aim to improve the welfare of the
community. Social Assistance Expenditures are
expressed in natural logarithm
DGFB, MoF
BPS
Financial
Assistance Financial assistance is a general or specific
assistance from the provincial to the
regency/municipality government, village
government, or other local governments to
equalize and balance financial capacity.
Financial Assistance Expenditures are expressed
in natural logarithm
DGFB, MoF
BPS
Discretionary
Funds Sum up of Grants, Social Assistance, and
Financial Assistance Expenditures DGFB, MoF
BPS
Economic Revenue Total Income Local government owned revenues (local taxes,
retribution, income of regional government
corporate, etc); Balanced budget from central
DGFB, MoF
BPS
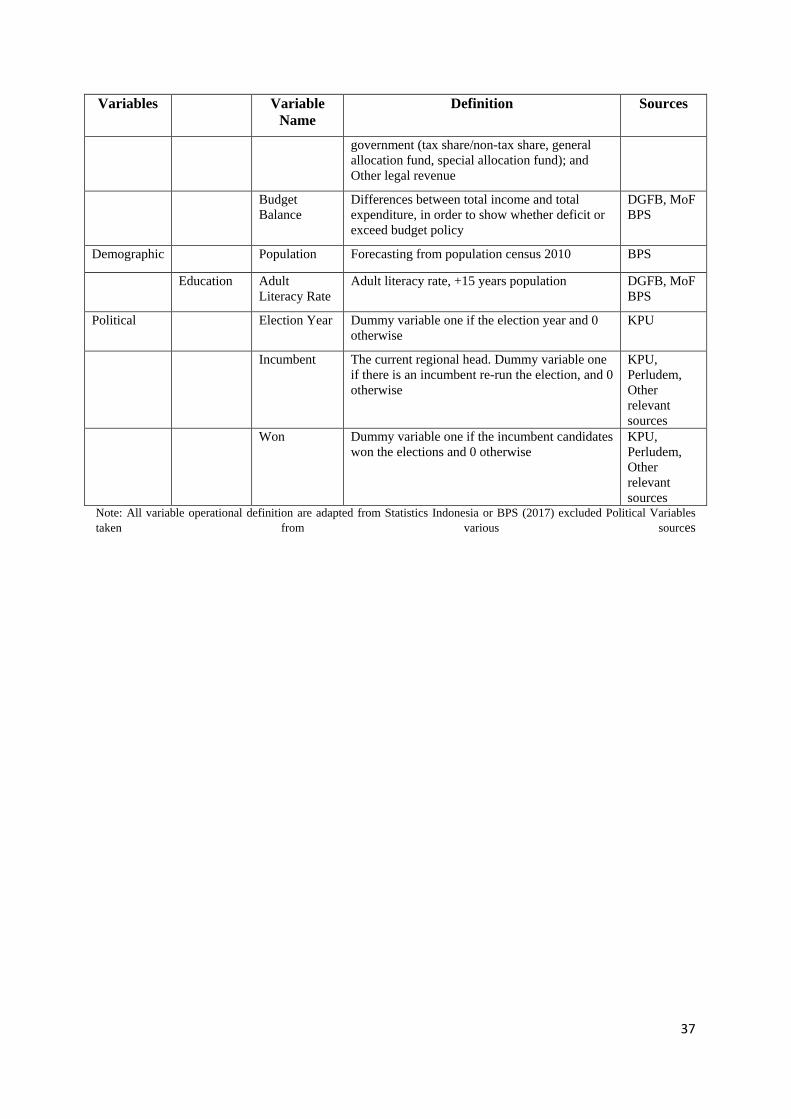
37
Variables Variable
Name Definition Sources
government (tax share/non-tax share, general
allocation fund, special allocation fund); and
Other legal revenue
Budget
Balance Differences between total income and total
expenditure, in order to show whether deficit or
exceed budget policy
DGFB, MoF
BPS
Demographic Population Forecasting from population census 2010 BPS
Education Adult
Literacy Rate Adult literacy rate, +15 years population DGFB, MoF
BPS
Political Election Year Dummy variable one if the election year and 0
otherwise KPU
Incumbent The current regional head. Dummy variable one
if there is an incumbent re-run the election, and 0
otherwise
KPU,
Perludem,
Other
relevant
sources
Won Dummy variable one if the incumbent candidates
won the elections and 0 otherwise KPU,
Perludem,
Other
relevant
sources Note: All variable operational definition are adapted from Statistics Indonesia or BPS (2017) excluded Political Variables
taken from various sources

38
Chapter 5 Result and Analysis
5.1 Descriptive Analysis
Descriptive analysis provides an overview of the basic features of the data that used in the
research. This analysis also describes the modest synopses related to the observation
(population or sample) as well as its measures. The descriptive statistics of this study is
presented in Table 3.
Table 3. Descriptive Statistics
Variable Mean Std. Dev. Min Max Obs.
GRDP Per Cap overall 33.265 41.965 2.540 378.530 N= 1810
between 41.847 2.602 369.844 n= 362
within 3.707 2.135 93.277 T= 5
GRDP Per Cap* overall 3.159 0.743 0.932 5.936 N = 1810
between 0.739 0.956 5.913 n = 362
within 0.082 2.723 4.118 T = 5
Budget
Balance*
overall 10.517 1.306 3.714 15.611 N = 1330
between 0.995 7.285 14.640 n = 360
within 0.890 6.393 13.945 T- bar = 3.694
Total Income* overall 13.774 0.608 11.915 17.604 N = 1810
between 0.573 12.763 17.446 n = 362
within 0.205 11.735 15.245 T = 5
Total
Expenditure*
overall 13.742 0.607 12.208 17.577 N = 1810
between 0.568 12.725 17.369 n = 362
within 0.216 12.941 15.255 T = 5
Grant
Expenditure*
overall 12.264 0.667 10.726 16.185 N = 1809
between 0.581 11.234 16.056 n = 362
within 0.328 10.730 14.107 T-bar = 4.997
Investment
Expenditure*
overall 9.879 1.342 4.605 14.547 N = 1771
between 1.092 7.625 14.232 n = 362
within 0.780 6.274 12.571 bar = 4.892
Social
Assistance
Expenditure*
overall 8.599 1.623 1.609 14.551 N = 1718
between 1.271 5.000 12.817 n = 362
within 1.029 3.776 12.239 T- bar = 4.745
Financial
Expenditure*
overall 9.715 1.786 3.912 14.258 N = 1544
between 1.516 5.245 14.007 n = 362
within 1.071 4.297 14.526 T-bar = 4.265

39
Variable Mean Std. Dev. Min Max Obs.
Discretionary
Funds*
overall 10.937 1.101 5.533 15.245 N = 1809
between 0.924 8.722 14.588 n = 362
within 0.602 6.678 13.216 T- bar = 4.997
Population
Size*
overall 12.591 1.097 9.485 16.297 N = 1810
between 1.098 9.501 16.253 n = 362
within 0.029 12.140 12.746 T = 5
Adult Literacy
Rate
overall 92.918 10.960 10.930 100.000 N = 1810
between 9.987 21.280 99.836 n = 362
within 4.540 43.792 157.869 T = 5
Won Election* overall 0.694 0.461 0.000 1.000 N = 720
between 0.462 0.000 1.000 n = 144
within 0.000 0.694 0.694 T = 5
Incumbent* overall 0.571 0.495 0.000 1.000 N = 1270
between 0.496 0.000 1.000 n = 254
within 0.000 0.571 0.571 T = 5
Source: Dataset constructed by the author
Note: * in natural logarithm
The table shows a summary of all variables descriptive statistics that used in this
study in panel data form. According to STATA estimation of this study uses unbalanced
panel data, the number of each observation will be varying in samples and variables. Total
observations are 1,810 observations that include 254 regions (provinces, districts, and cities)
over the years 2011-2015 held a simultaneous direct head election in 2015, and 108 regions
which no held the simultaneous direct election in 2015.
First of all, statistical descriptive above shows that the mean value of incumbent is
0.57, which means the regions held a simultaneous direct election that has incumbent run re-
election is 57.1 percent or around 145 regions. Another fact is the incumbent that have
eligibility to run re-election majority won the first simultaneous regional head direct election
in 2015. The percentage of the incumbents winning the election is around 69.4 percent or
about 100 candidates.
In terms of Regional GDP Per Capita, the mean value of GRDP per capita is 33.265
(in million rupiahs) and the standard deviation is 41.965 (in million rupiahs). However, the
minimum value is 2.540 (in million rupiahs) in Nunukan in 2011, and the maximum value is
378.53 (in million rupiahs) for Teluk Bintuni in 2015. It means, by average per person who
lives in this observation regions have income almost 33.3 million rupiahs. According to the
table, Nunukan district is the poorest region with every individual only gain 2.5 million

40
rupiahs. Meanwhile, Teluk Bintuni people have the highest income with approximately 378.5
million rupiah.
The mean value of budget balance is 10.51, and the standard deviation is 1.38.
However, the maximum amount of budget balance is or 15.61 or 6,024,636 (in million
rupiahs) for DKI Jakarta in 2014, and the minimum value is 3.71 or -1,861,615 (in million
rupiahs) for Bengkalis in 2015. It means, in 2015 Capital Region of Jakarta Government
budget cannot disburse around 6,02 trillion rupiahs, while Bengkalis district has deficit for
almost 2,0 billion rupiahs. In terms of total revenue, the mean value is 13,77, and the standard
deviation is 0,61. The minimum amount of total revenue is 11.92 or 149,499 (in million
rupiahs) for Tangerang Selatan in 2014; whereas Capital Region of Jakarta has the highest
number of total revenue with 17.6 or 44,209,238 (in million rupiahs) in 2015. It means, the
Central Region of Jakarta has gained the highest income in 2015 around 44,2 trillion rupiahs,
and Tangerang Selatan has the lowest revenue in 2014 for almost 150,0 billion rupiahs.
According to the table for total expenditures, the mean value is 13.74 with standard
deviation of 1.34. The minimum value was 12.21 or 200,431 (in million rupiahs) for Sabu
Raijua in 2014, and the maximum value is 17.58 or 43,031,323 (in million rupiahs) in Capital
Region of Jakarta in 2015. It means that Sabu Raijua district had spent 200,3 billion rupiahs
in 2015, while consistent with their highest income also spent around 43,0 trillion rupiahs in
2015.
Regarding the investment, expenditure has a mean value of 9.9 and the standard
deviation is 1.3. The maximum value of investment expenditure is 14.6 or 10,696,012 (in
million rupiahs) for Special Region of Jakarta in 2013, and the minimum value was 4.6 or
0,00 (in million rupiahs) for Aceh Singkil in 2011. It means Capital Region of Jakarta spent
their capital budget around 10,7 trillion rupiahs, while Aceh Singkil district in 2011 did not
allocate any amount in capital expenditure category.
The summary of discretionary funds category for regions held a simultaneous direct
election in 2015 are as follows. The discretionary funds per se have the mean value 10.94,
and the standard deviation is 1.10. It also has the minimum amount of 5.53 or 0.00 (in million
rupiahs) for Tebing Tinggi in 2013 and has the highest value of 15.24 or 4,175,705 (in
million rupiahs) in Capital Region of Jakarta in 2015. It means, Jakarta Government allocated
more than 4,0 trillion rupiahs in “flexible” category budget, in opposite way, Tebing Tinggi
district did not have a budget allocation in this sector budget.

41
Specifically, in each discretionary fund subcategory, the mean value of grant
expenditures is 12.26, and the standard deviation is 0.67. It has the minimum value of 10.73
or 0.00 (in million rupiahs) in many regions in various years and the maximum value of
16.19 or in 2,078,164 for Aceh Province in 2015. Although did hold the election in 2015,
Aceh Province allocated almost 2,1 trillion rupiahs, while many regions did not have any
allocation in donation expenditure subcategory. On the other hand, for social assistance
expenditure subcategory has a mean value of 8.60 and standard deviation of 1.62. It also has
minimum value 1.61 or 0,00 (in million rupiahs) in many regions and the maximum value of
14.55 or 2,087,123 (in million rupiahs) for Capital Region of Jakarta in 2015. Finally, for
financial assistance expenditures have a mean value of 9.72 and standard variation of 1.79,
while minimum value is 3.91 or 0.00 (in million rupiahs) in many regions, and the maximum
value was 14.26 or 1,556,057 (in million rupiahs) for Papua Barat in 2015.
Other variables description is about borrowing revenue, population and adult literacy
rate. Firstly, the mean value of borrowing revenue is 7.35, and the standard deviation is 2.75.
It has a minimum value of 0.00 or 0.00 (in million rupiahs) in some regions and the
maximum value of 11.61 or 109,699 (in million rupiahs) in Keerom in 2015. Regarding
population variable, it has a mean value of 12.59 and standard deviation of 1.10. It also has
minimum value 9.49 or 13,163 people in Tambrauw in 2011 and has a maximum value of
16.30 or 11,955,243 for citizens in Banten Province in 2015. Lastly, for literacy rate feature,
it has a mean value of 92.40 and standard variation of 12.94. The minimum value is 10.93
percent in Nduga and Kaimana in 2013 (all districts in Papua Provinces), and the maximum
value reaches almost 100 percent in Maluku Tenggara and Kabupaten Tasikmalaya in 2014.
It means, in average, regarding education rate observation regions has sufficient high rate of
more than 90 percent.
5.2 Panel Data Model Selection
This study will use panel data, which is a multi-dimensional data that combines cross-
section and time series data. Three models are broadly used to analyse panel data set,
Common Effect Model which uses Ordinary Least Square, Fixed Effect Model which uses
least square dummy variable (LSDV) regression, and Random Effect Model which uses
generalized least squares (GLS). However, since this study will choose only two models,
whether Fixed Effect Model or Random Effect Model, Hausman Test can be used to estimate

42
the appropriate method for data in this study. The table below the result of Hausman Test for
dependent variables used in this study
Table 4. Hausman Test for Dependent Variables
Dependent Variables Chi-Sq.
Statistic
P-
value.
Total Expenditure 163.07 0.0000
Budget Balance 46.680 0.0000
Investment Expenditure 979.810 0.0000
Discretionary Funds 102.91 0.0000
Grant Expenditure 36.59 0.0000
Social Assistance Expenditure 76.60 0.0000
Financial Assistance
Expenditure 99.76 0.0000
Source: Data Analysis
The Table 4. above describes the result of Hausman test for the dependent variable
Financial Assistance Expenditure. Hypothesis used for Hausman Test is H0: Random Effect
Model; and H1: Fixed Effect Model. For H0 to be accepted, the p-value should be >0,05. The
result of Hausman Test for all dependent variables shows that the p-value is 0,0000 or
significant in 1% which is <0,05. Therefore, H0 (Random Effect Model) is rejected, and H1
(Fixed Effect Model) cannot be rejected.
The Hausman test result for those variables in line with Borenstein, et al. (2009),
which stated there are two circumstances should happen so that Fixed Effect Model can be
used. The first condition is if it is believed that all the studies included in the analysis are
identical. Another requirement is if the goal of the study is to examine the effect of the
identified population over time, regardless we generalizing to other population.22
This study utilizes panel data, in which each object (provinces and districts/cities) has
one annual budget analysed each year. The unit of analysis is all regions that held a
simultaneous direct election in 2015, excluding 15 newly-formed regions. The studies are
also identical because every variable can have an impact on the outcome are the same across
the five years analysis. Furthermore, the analysis is conducted using the same method each
year which makes the studies share the same effect. Previous studies that focused on political
budget cycles such as Sjahrir (2013), Ballaguel-Coll (2015) and Chortareas et al. (2016) also
22 For further explanation look at Borenstein, Michael et al. (2009). Introduction to Meta-Analysis. John
London: Willay and Sons. Page 83 discuss on Fixed Effect Model versus Random Effect Model.

43
used Fixed Effect Model. Therefore, Fixed Effect Model is seen appropriate to use in this
study.
5.3 Regression Result
5.3.1 The Political Budget Cycle Behaviour Existence
The first regression result will discuss the occurrence of the political budget cycles in
Simultaneous Regional Direct Election in 2015. In general, most of the expenditure variables
are an insignificant relationship between Election in 2015 and incumbent who run re-election,
only grant expenditure has a positive and significant effect on the election in 2015 and
incumbency. Table 5. is the regression result of the occurrence of the PBC.
Table 5. Regression Result of The Existence of PBC Behaviour
Variables
Total
Expend.
Budget
Balance
Invest.
Expend.
Discretionary
Funds
Grant
Expend.
Social
Assist.
Expend.
Financial
Assist.
Expend.
b/se b/se b/se b/se b/se b/se b/se
Lagged
Dependent
Variables*
0.041 -0.307*** 0.049 -0.061 -0.129*** -0.056 -0.056
(0.099) (0.072) (0.042) (0.053) (0.045) (0.057) (0.079)
Election Total -0.044*** -0.254 -0.161*** 0.218*** 0.706*** -0.177 -0.211
(0.013) (0.199) (0.032) (0.067) (0.087) (0.149) (0.141)
Incumbent 2015
* Election 2015
0.004 0.383 0.017 0.004 0.278** -0.083 0.203
(0.026) (0.351) (0.047) (0.100) (0.139) (0.210) (0.260)
GRDP Per
Capita*
0.223** 0.235 0.195 0.336 -0.349 -0.341 2.062**
(0.101) (0.756) (0.163) (0.304) (0.596) (0.657) (0.856)
Adult Literacy
Rate
0.001 0.014 0.001 -0.002 -0.001 0.002 -0.002
(0.001) (0.016) (0.002) (0.003) (0.006) (0.005) (0.012)
Population
Size*
-0.046 -11.372* -0.729 -1.728 -1.904 1.000 0.834
(0.484) (5.986) (0.893) (1.655) (2.493) (3.880) (3.654)
2012.year 0.000 0.000 0.000 0.000 0.000 0.000 0.000
(.) (.) (.) (.) (.) (.) (.)
2013.year 0.110*** 0.074 0.164*** 0.187*** 0.290*** 0.225* 0.043
(0.016) (0.175) (0.027) (0.051) (0.074) (0.124) (0.116)
2014.year 0.212*** 0.600** 0.294*** 0.445*** 0.644*** 0.202 -0.039
(0.030) (0.241) (0.041) (0.072) (0.123) (0.168) (0.185)
2015.year 0.379*** 0.325 0.521*** 0.953*** 0.566*** -0.122 1.006***
(0.045) (0.366) (0.060) (0.112) (0.180) (0.238) (0.265)
Constant 12.897** 156.418** 20.041* 32.064 35.792 -2.798 -6.753
(6.159) (76.522) (11.221) (20.897) (31.769) (48.935) (46.157)

44
Variables
Total
Expend.
Budget
Balance
Invest.
Expend.
Discretionary
Funds
Grant
Expend.
Social
Assist.
Expend.
Financial
Assist.
Expend.
b/se b/se b/se b/se b/se b/se b/se
N 1448.000 844.000 1447.000 1446.000 1390.000 1331.000 1123.000
Source: Data Analysis
*) In nature logarithm
Denote significance at the ***1% ; **5; *10% levels.
As stated by the table above, shows the regression result of panel data. Firstly, we
will explain hypothesis test result based on the data analysis as the table above.
H1: Election year with incumbent candidate has negative and significant impacts on
Budget Balance.
Hypothesis testing from the result in Table 4 shows that election in total has no effect
on budget balance related to incumbent and election in 2015 at any significance level.
Therefore, the first hypothesis is not supported.
H2: Election year with incumbent candidate has positive impacts on Total
Expenditures.
Table above shows that that election in total has a negative and significant effect on
the Total Expenditure at the 5% significance level. The evidence suggests that in election
years (2015 and before 2015) the total expenditure decreases by 4.4 percent. On the other
hand, there is no effect between the incumbent and an election year in 2015. The result of the
analysis suggested that total expenditure and GRDP has positive and significant relationship.
One unit of total expenditure change increases GRDP by 22%. It is significant at 5% level.
However, refers to the result hypothesis is rejected.
H3: Election year with incumbent has positive impacts on Investment Expenditures.
Regression result shows that that election in total has a negative and significant effect
on the Investment Expenditure at the 5% significance level. The evidence suggests that in an
election year (2015 and before 2015) the investment expenditure decreases by 16.1 per cent.
On the other hand, there is no effect between the incumbent and election year in 2015.
Therefore, as a result hypothesis is rejected.
H4: Election year and the incumbent has positive impacts on Discretionary Funds.

45
Based on hypothesis testing result shows that the discretionary funds have positive
and significant effect at 10% significance level, which allocation of the discretionary fund
increases 22 percent approaching the total election. However, there is no effect on
incumbency in election 2015. Thus, the fourth hypothesis is rejected.
H5: Election year and incumbency have positive impacts on Grant Expenditures Funds.
Hypothesis testing result shows that in election total year the grant expenditure sub-
category spending has positive and significant at 10% significance level which increases by
71 percent. The evidence also confirms that it also has positive and significant effect at 5
percent and rose 28 percent approaching election 2015 in incumbents’ regions. Thus, the fifth
hypothesis is supported.
H6: Election year and incumbency has positive impacts on Social Assistance
Expenditures.
The result reported that social assistance expenditure spending has no effect both in
an election year in total and related incumbency and election in 2015. Thus, the sixth
hypothesis is rejected.
H7: Election year and incumbency has positive impacts on Financial Assistance
Expenditures.
The result reported that social assistance expenditure spending has no effect both in
election year in total and related incumbency and election in 2015. Thus, the seventh
hypothesis is not supported.
5.3.2 The Probability of Being Re-elected
Results analysis for the second model in order to know how the probability of
spending behaviour induced by political purposes to win election are presented in Table 6.
below.
Table 6. Winning the Election Probability
Dependent
Variable: Won (1) (2) (3) (4) (5) (6) (7)
Total
Expenditure* -0.190*
(0.113)
Budget Balance -0.003

46
Dependent
Variable: Won (1) (2) (3) (4) (5) (6) (7)
(0.039)
Investment
Expenditure* -0.023
(0.079)
Discretionary
Expenditure* -0.033
(0.054)
Grant
Expenditure*
-0.006
(0.061)
Social
Expenditure* 0.019
(0.025)
Financial
Expenditure* -0.001
(0.019)
GRDP Per Cap* 0.067 0.152 0.025 0.021 0.027 0.047 0.031
(0.060) (0.106) (0.060) (0.053) (0.056) (0.058) (0.054)
Population Size* 0.176*** 0.040 0.100** 0.107** 0.098** 0.081** 0.082**
(0.060) (0.048) (0.042) (0.041) (0.047) (0.039) (0.036)
Adult Litaracy
Rate -0.000 -0.006 0.002 0.001 0.002 0.001 0.002
(0.005) (0.006) (0.005) (0.005) (0.006) (0.006) (0.005)
Constant 0.945 0.414 -0.518 -0.473 -0.751 -0.749 -0.612
(1.158) (0.769) (0.936) (0.737) (0.703) (0.653) (0.669)
N 144.000 69.000 144.000 144.000 140.000 128.000 136.000
Source: Data Analysis
Denote significance at the ***1%; **5; *10% levels.
The result indicates that total spending in the election year 2015 has a negative and
significant at 10% level, which -19%. It means the evidence find that the increment in local
government’s total expenditure negatively affect the incumbent candidate’s winning election
probability.
On the other hand, the rest of expenditure budget spending does not affect on the
election winning prospects. Interestingly, the result also capturing population control
variable, which affect positively the re-election prospects of incumbents in all expenditure
variables. The corresponding coefficient is positive at various significant level, indicating that
incumbents winning re-election closely related to the number of people at observation
regions.
5.4 Discussion Result
5.4.2 The PBC existences in 2015 Concurrence Regional Direct Election

47
Table 5. reports the result of PBC behaviour appearances in the Indonesian
simultaneous regional direct election by examining certain budget expenditures. According to
the table, in total spending budget shows a negative and statistically significant at 10% level
related to the election year in total, but does not have effect with the interaction between
incumbent 2015 and election year 2015. This indicates approaching election time (before
2015 and 2015); the local government tends to decrease their aggregate expenditure
allocation. However, this finding does not mean the low number of total spending stem from
election time activity. According to MoF data (2017), there is a raised trend of the ‘idle’ local
government budget from Rp78.5 trillion in 2011 to Rp101.6 trillion in 2015 yet was allocated
as a deposit in commercial banks.23
Allegedly, this trend also occurs in regional governments
sample of this study, which they tend to accumulate their budget as saving than allocate it as
public spending.
Similar cyclical behaviour also appears in investment expenditure category has
negative and statistically significant at 10% level approaching election year in total, and falls
in an amount by 0.16 rupiah (in per capita terms, 2010 constant price). However, this cyclical
has no regards to incumbent regions that held a simultaneous election in 2015. This result
suggests that all regions government, whether they have incumbents or not, to reduce their
investment spending allocation. This result aligns with Klein and Sakurai (2015) studies in
Brazil municipalities. They state that the current holder officials adopt “shifting in terms of
the expenditure proportion approach”. In this study, it means that the local government might
change the investment budget allocation to other more “visible” and attractable to the voters’
budget category, such as discretionary funds category including donation, social assistance,
and financial assistance expenditures subcategory. However, the politically induced
behaviour was not appeared in budget spending category in both election year in total and
interaction between incumbency and election 2015.
If we differentiate discretionary funds, it would reveal that the positive and significant
effect at 10% level also occurs only on election year in total. The discretionary funds
increased almost 22.0 percent approaching election time. The rational reason why
discretionary in election total time has positive and significant stem from grant expenditure
23 The comprehensive analysis of the idle regional budget can be seen on Kementerian Keuangan (2017).
Fiscal Policy Report. Accessed 4 September 2017. < http://www.fiskal.kemenkeu.go.id/data/document/2017/
kajian/ Kajian%20SiLPA.pdf.>

48
subcategory in election time has very large positive and significant effect on election, which
is s71 percent at 10% significant level. On the other hand, in the incumbent regions who are
running election in 2015, grant expenditure sub category increases almost 28 percent at 5%
siginificant level. This evidence in line with Ritonga and Alam (2010) and Sjahrir (2013)
study that incumbent who run election for second term period tend to utilize “other” category
budget that needs discretionary power approaching election time. Oppositely, two latter
discretionary sub-group both does not affect both election year in total and related to
incumbency and election 2015
The grant expenditure regression result indicates that grant subcategory budget is still
a favorite source to attract the electorate approaching the voting year. Another possibility
reason why grant subcategory increases in the election time in 2015, is because the local
governments have to finance the local election. The budget spending category for financing
election is from donations or grants expenditure subcategory. In this way, an increase of
amount in the grant expenditure in election year is inevitabile. The regulation that mentions
management of election activities fund sourced from APBD is the Decree of MoHA No. 44
of 2015 on Fund Management of Governor and Vice Governor, Regent and Vice Regent, and
Mayor and Vice Mayor as amended by the Decree the Minister of Home Affairs No.
51/2015. This regulation regulates budgeting, implementation and administration, reporting
and the accountability of budget utilisation.24
However, the central government through Ministry of Home Affairs has revised the
regulation by stipulating MoHA Decree 39 of 2012 to prevent the misuse the discretionary
budget spending particularly donation and social assistant. For instance, initially, the
beneficiaries’ identity difficult to be traced, but now the recipients must be stated by name by
address. Regarding to election 2015 result, although the effect of grant allocation is still
positive and significant, the level has decreased.
Regarding time effect, it is confirmed that almost all expenditures category have
positive and significant effect, particularly in the year when election held. For instance, in
Total Expenditure category the budget expenditure has increased from 11 percent to 40
percent in 2015. Similar behaviour also occurs in investment expenditures, discretionary
24 This regulation is the implementation of Article 166 paragraph (3) of Law Number 8 of 2015 on
Amendment to Law Number 1 of 2015 regarding Stipulation of Perpu Number 1 Year 2014.

49
expenditure and grant expenditure. Meanwhile, budget balance category, social assistance
expenditure category and financial assistance expenditure have positively increased but
insignificant.
5.4.2 The Probability of Winning the Election
We present the regression results related to the greater winning election possibility in
Table 6. The evidence shows that the total expenditure has a negative and significant effect
on winning the election possibility. The amount of total expenditure allocation during an
election year (2015) are subject to diminishing the possibility of the incumbents to win the
election in 2015 by 19.0 percent. This finding is interesting since it is against several existing
literatures that found the pre-electoral expanding expenditure behaviour by the incumbent
candidates will secure their vote-share. Chortareas et al. (2016) argued that higher
expenditure around election year and “election year opportunistic deviations” has positive
effect in terms of winning election. Similar argument also stated by several scholars that
studied in municipalities, such as Akhmedove and Zhuravskaya (2004) who observed
Russian municipalities, and Veiga and Veiga (2007) who investigated Portuegese
municipalities.
Lucardi and Rosas (2016) studies in developing countries found there are four factors
that called as “incumbents’ curse” that affect re-election prospect. First, the challengers are
able to explore the weaknesses of the incumbents during their tenure, especially those related
to cases of corruption, collusion and nepotism. Secondly, the society behaviour preferences
tend to choose median (not left wings or right wing) candidates. Thirdly, swing voters has
delayed the preferences until the day of voting time. Finally, the intervention from the higher
level of officer leads to decreased of level of trust from the people to vote them. They feel the
incumbents’ only the “puppet” of the higher politicians.
Specifically, in Indonesia local election, the openness of information that align with
Vicente et al. (2015) can prevent the incumbents to do the bad things. At the same time, it
also can lead the people, mostly the wing voters to “wait and see” to give their vote until the
day of election. The frailty of the incumbents not only about corruption that happened with

50
Bengkalis incumbent’s (www.okezone.com 16/12/2015),25
but also their “hidden” issue such
as their religions or ethnicity background. The case of Kalimantan Tengah can be an example
how the governor always maintains the ethnicity to maximize the vote-share (Hatriani and
Wardani 2014).
Furthermore, the result also explaining the effect of population control variable on
incumbent re-election prospect. The regression result shows that population has a positive
and significant effect to the winning the election with various percentage around 10-80
percent at various significant level in all expenditure variables. The positive coefficient and
significant at various significant levels, indicating that incumbents winning re-election
closely related to the number of people at observation regions. In other words, the incumbent
regions who has more population (city) can gain more change to be re-elected compared to
the less population area.
The evidence regarding population confirms the factual data of the Pemilukada 2015
result. According to www.kompas.com (07/01/2006) the incumbent candidate who can
reclaim their position as head of the region more prevalent in the city area than the district. In
the city, the mayor who managed to maintain his position reached 47.1 percent, while in the
district only 28.1 percent regents who regained the position as regional head.26
25 Tanjung, B.H. (2015) Petahana Kalah Telak di Pilkada Bengkalis (The Incumbents Heavily Lost in
Bengkalis. Accessed 19 September 2017. <https://news.okezone.com/read/2015/12/16/340/1269004/petahana-
kalah-telak-di-pilkada-bengkalis> 26 Setiawan, Bambang (2006) Petahana Tetap Kuat di Pilkada 2015 (The Incumbents Have Won in the
Regional Election in 2015). Accessed 18 September 2017.
<http://nasional.kompas.com/read/2016/01/07/02205431/Petahana.Tetap.Kuat.di.Pilkada.2015>

51
Chapter 6 Conclusion
This study aims to prove empirically whether there is an existence of the politically
induced budget spending behaviour in the Indonesian simultaneous regional direct election in
2015. Another question is how this spending cyclical behaviour affects the incumbents’
winning the election probability. The regression results present the incumbent’s region
approaching election year in 2015 has positive and significant effect on grants expenditure,
which 28.0 percent. Meanwhile, in almost all expenditures there are vary of positive and
significant relationship regarding time effect.
However, interestingly, the evidence shows opposite result regarding fiscal
manipulation and re-election prospect of the incumbents. The regression result shows that the
amount of total expenditure spending in 2015 are subject to diminishing the probability of the
incumbents to win the re-election in 2015 by 19.0 percent. These findings, however, can
partly describes the occurrence of budget cycles in particular in Indonesian local government.
The rational explanations are: 1) There are improvement of the discretionary fund
allocation and distribution regulation by the central government. It has increased
accountability and has possibly reduced the current local government’s ability to manipulate
budget spending later on. It can be seen in the result of election 2015; although the effect of
grant allocation is still positive and significant, the level has decreased compared to an
election year in total; 2) The grant expenditure allocation in election time 2015, also related
to the fact that regional government has to fund the local election; 3) The negative effect on
total expenditure and a decrease re-election probability confirms that people tends to
“punish” the incumbent who has less competency, wasteful or even “corrupt”, for budget
utilization. Other possibility reasons such as religion and political ethnicity matters could be
as a trigger people to divert their votes; and 4) According to the election result, the incumbent
candidate from the city area can have more chance to win and regain the election compare to
those who live in regents. This finding aligns with the population control variables in model 2
result, that the incumbents’ region which are more populated can enhance the possibility of
incumbent being re-elected.

52
The future research is also necessary to pay attention to the previous election result to
know the effect on the incumbents’ vote-share; the relatives of the incumbents’ that involve
the election; and political affiliation when it comes to PBCs and re-election probability, since
the behaviour might be affect the result. A further qualitative research is also needed, to do a
more in-depth investigation on the rational reason why the opportunistic fiscal policy by the
incumbents are not associated with enhancement of the probability of being re-elected.
Another study related to Indonesian concurrence regional direct election in 2017 is also
strongly suggested to examine the sequence of the PBC behaviour.
Hence, this study results may encourage some policy recommendation. Firstly, the
fact shows that a high level of budget transparency at municipality will reduce PBC
occurrence in some certain expenditure. Thus, in order to minimize ineffectiveness of budget
utilization, we should improve transparency of budget management in all levels. At the
meantime, restricted and improved the regulation is needed, not only related to the executive
local government, but also donations allocation for political organisation including political
party. Another policy initiative is the election regulation should be revised. The election
financing should be facilitated by central government instead of local government to prevent
conflict of interest. The existing condition can lead abuse of power, since the local head
possibly can also as candidates who re-run election.

53
References
Adityowati, P. (Last updated 17 April 2015) 'Kemendagri: Daerah Wajib Anggarkan Dana
Pilkada' (a webpage of Tempo Media Group). Accessed August/20 2017
<https://m.tempo.co/read/news/2015/04/17/078658512/kemendagri-daerah-wajib-anggarkan-
dana-pilkada>.
Akhmedov, A. and E. Zhuravskaya (November 2004) 'Opportunistic Political Cycles: Test in
a Young Democracy Setting', Quarterly Journal of Economics 119(4).
Alesina, A. (1987) 'Macroeconomic Policy in a Two-Party System as a Repeated Game',
Quarterly Journal of Economics 102(3): 651-678.
Alesina, A. and M. Paradisi (2014) 'Political Budget Cycles: Evidence from Italian Cities',
Working paper series. (20570): ALL.
Alt, J.E. and D.D. Lassen (2006) 'Transparency, Political Polarization, and Political Budget
Cycles in OECD Countries', American Journal of Political Science 50(3): 530-550.
Arham, M. (Last updated 2015)) 'Simultaneous Regional Elections for a Better Democracy.'.
Accessed 07/15 2017 <http://www.globalindonesianvoices.com/23701/simultaneous-
regional-elections-for-a-better-democracy/>.
Aronsson, T. and D. Granlund (2017) 'Federal Subsidization of State Expenditure to Reduce
Political Budget Cycles', International Tax and Public Finance 24(3): 536-545.
Arsil, S. (2015) 'Mendagri: 343 Kepala Daerah Tersangkut Kasus Hukum (Minister of Home
Affairs: 343 Heads of District Cases of Legal Cases)' Kompas.com, 04/02/2015, .
Aspinall, E. (2014) 'Democratic Deepening in Indonesia: Challenges for the New
Administration', Strategic Review .
Balaguer-Coll, M.T., M.I. Brun-Martos, A. Forte and E. Tortosa-Ausina (2015) 'Local
Governments' Re-Election and its Determinants: New Evidence Based on a Bayesian
Approach', European Journal of Political Economy 39: 94-
108http://www.sciencedirect.com/science/article/pii/S0176268015000348.
Baskaran, T., A. Brender, S. Blesse and Y. Reingewertz (2016) 'Revenue Decentralization,
Central Oversight and the Political Budget Cycle: Evidence from Israel', European Journal of
Political Economy 42(1–2): 1-16.
Batlolone, V. (2014) 'Lika Liku Sejarah Pilkada. Accessed on 1st August 2017'
sinarharapan.com,.

54
Bee, C.A. and S.R. Moulton (2015) 'Political Budget Cycles in U.S. Municipalities',
Economics of Governance 16(4): 379-403.
Benito, B., F.J.B. Albaladejo and C. Vicente (September 2012) 'Political Budget Cycles in
Local Governments', Lex Localis 4(4): 341-361.
Bertelsmann Stiftung’s Transformation Index (BTI) (2016) 'BTI 2016: Indonesia Country
Report'. Gütersloh: Bertelsmann Stiftung.
Blöndal, e.a. (2009) 'Budgeting in Indonesia', OECD Journal on Budgeting 2009(2).
Borenstein, M.e.a. (2009) Introduction to Meta-Analysis. London: John Willay and Sons.
Brender, A., A. Drazen and National Bureau of Economic Research. (2004) Political Budget
Cycles in New Versus Established Democracies. Cambridge, Mass. : National Bureau of
Economic Research,.
Brender, A., A. Drazen and National Bureau of Economic Research. (2004) Political Budget
Cycles in New Versus Established Democracies. Cambridge, Massasuchete: National Bureau
of Economic Research,.
Brender, A. and A. Drazen (2005) 'Political Budget Cycles in New Versus Established
Democracies'. <http://www.sciencedirect.com/science/article/pii/S0304393205000887> (ID:
271711).
Brodjonegoro, B. (2001) 'Indonesian Intergovernmental Transfer in Decentralization Era:
The Case of General Allocation Fund.', An International Symposium on Intergovernmental
Transfers in Asian Countries : Issues and Practices Asian Tax and Public Policy Program,
Hitotsubashi University. Tokyo. .
Burden, B.C. (2009) 'The Dynamic Effects of Education on Voter Turnout', Electoral Studies
28(4): 540-549.
C. Pass, B. and L.D. Lowes (Last updated 2005) 'Collins Dictionary of Economics, 4th Ed.
S.v. "Government Expenditure."'. Accessed July 29 2017 <http://financial-
dictionary.thefreedictionary.com/government+expenditure>.
Cheema, G.S. and R. D.A. (2007) '‘From Government Decentralization to Decentralizing
Governance’', in Cheema, G.S. & Rondinelli, D.A. (ed.) Decentralising Governance:
Emerging Concepts and Practices, pp. 1-20. Washington: The Brookings Institution Press.
Choi, N. (2007) 'Elections, Parties and Elites in Indonesia's Local Politics', South East Asia
Research 15(3): 325-354.
Chortareas, G., V. Logothetis and A.A. Papandreou (2016) 'Political Budget Cycles and
Reelection Prospects in Greece's Municipalities', European Journal of Political Economy 43:
1-13.

55
Director Generale of Regional Autonomy and Ministry of Home Affairs (Last updated 2015)
'Ministry of Home Affairs Letters no. 120/4474/OTDA on Confirmation of the Last Term of
Office of the Head of the Region in 2015' 28/08/2016 .
Directorate General Fiscal Balaance, MoF (Last updated 2017) 'Sistem Informasi Keuangan
Daerah 2011-2017' (a webpage of Ministry of Finance). Accessed 06/06 2017
<http://www.djpk.depkeu.go.id/?page_id=316>.
Directorate General of Regional Autonomy, MoHA (Last updated 2014) 'The Formation of
Autonomous Regions Until 2014. Accessed on 22th July 2017'. Accessed 07/22 2017
<http://otda.kemendagri.go.id/CMS/Images/SubMenu/totalDOB.pdf>.
Drazen, A. (2008) 'Political Budget Cycles', in S.N. Durlauf and L.E. Blume (eds) The New
Palgrave Dictionary of Economics, (Second Edition edn). Palgrave MacMillan.
Drazen, A. and M. Eslava (2010) 'Electoral Manipulation Via Voter-Friendly Spending:
Theory and Evidence', Journal of Development Economics 92(1): 39-52.
Drazen, A. and M. Eslava (2010) 'Electoral Manipulation Via Voter-Friendly Spending:
Theory and Evidence', Journal of Development Economics 92(1): 39.
Dubois, E. (2016) 'Political Business Cycles 40 Years After Nordhaus', Public Choice
166(1): 235-259.
Efthyvoulou, G. (2012) 'Political Budget Cycles in the European Union and the Impact of
Political Pressures', Public Choice 153(3): 295-327.
Foremny, D. and N. Riedel (2014) 'Business Taxes and the Electoral Cycle', Journal of
Public Economics 115(4): 48-61.
Galli, E. and S.P.S. Rossi (2002) 'Political Budget Cycles: The Case of the Western German
Länder', Public Choice 110(3): 283-303.
Gibbins, R. and P.D. Webb (Last updated 2015) 'Election , accessed on , .' (a webpage of
Encyclopædia Britannica, inc). Accessed 07/15 2017
<https://www.britannica.com/topic/election-political-science/Functions-of-elections>.
Gonzalez, P. and Centre for Economic Policy Research (Great Britain) (2006) Political
Budget Cycles and Fiscal Decentralization. London : Centre for Economic Policy Research,.
Gujarati, D.N. (2003) Basic Econometrics. (4th edn) Boston: McGraw Hil.
Hafidz, M. and U.H. Sadikin (2017) Penyelenggaraan Pilkada Serentak 2015 Dan 2017 .
Jakarta: KPU-RI.
Hanusch, M. and D.B. Magleby (2014) 'Popularity, Polarization, and Political Budget
Cycles', Public Choice 159(3): 457-467.
Hartriani, J. (2014) Wardani, S.B.E. 'Politik Etnis Pada Masa Pemerintahan Gubernur
Cornelis Di Kalimantan Barat Tahun 2007 Hingga 2013 (Ethnic Politics in the Governor

56
Cornelis s Governance in West Kalimantan 2007-2013)'. (Bachelor). Jakarta: University of
Indonesia.
Henderson, J.V. and A. Kuncoro (2011) 'Corruption and Local Democratization in Indonesia:
The Role of Islamic Parties', Journal of Development Economics 94(2): 164.
International Foundation for Electoral System (Last updated n.d.) 'Indonesia’s 2015 Regional
Elections'. Accessed 01/30 2016 <ww.ifes.org/news/indonesias-2015-regional-elections>.
King, Y.D. (2003) Half-Hearted Reform: Electoral Institutions and the Struggle for
Democracy in Indonesia. Wesport: Praeger Publishing.
Kis-Katos, K. and B.S. Sjahrir (2014) 'The Impact of Fiscal and Political Decentralization on
Local Public Investments in Indonesia', IZA Duscussion Paper Series IZA DP No. 7884: 12
July 2017<http://ftp.iza.org/dp7884.pdf>.
Klein, F.a. (2010) 'Reelection Incentives and Political Budget Cycle: Evidence from Brazil',
Revista de Administracao Publica : 283-337.
Klein, F.A. and S.N. Sakurai (2015) 'Term Limits and Political Budget Cycles at the Local
Level: Evidence from a Young Democracy'.
<http://www.sciencedirect.com/science/article/pii/S0176268014001013> (ID: 271678).
Klomp, J. and J. de Haan (2013) 'Political Budget Cycles and Election Outcomes', Public
Choice 157(1): 245-267.
Lindbeck, A. (1976) 'Stabilization Policy in Open Economies with Endogenous Politicians',
American Economic Review 66(2): 1-19.
Lucardi, A. and G. Rosas (2016) 'Is the Incumbent Curse the Incumbent's Fault? Strategic
Behavior and Negative Incumbency Effects in Young Democracies', Electoral Studies
44(Supplement C): 66-
75http://www.sciencedirect.com/science/article/pii/S026137941630060919/09/2019.
McRae, D. 'Why Direct Local Elections Matter to Indonesia's Democracy', 2014 .
Micom (2016) 'Micom (2016) Pilkada Serentak Dengan Aturan Berbeda (Simultaneous
Pilkada with Different Regulations). ' mediaindonesia.com, 20/06, .
Milligan, K., E. Moretti, P. Oreopoulos and National Bureau of Economic Research. (2003)
Does Education Improve Citizenship? Evidence from the U.S. and the U.K. Cambridge,
Mass. : National Bureau of Economic Research,.
Ministry of Finance, Republic Indonesia (2015) Informasi APBN 2016 (Central Budget of
2016 Information).
Ministry of Home Affairs (2012) 'Regulation of the Minister of Home Affairs of the Republic
of Indonesia no. 39/2012 about Amendment to Regulation of the Minister of Home
Affairs/2011 on Grants, Social Aid Guidlines Funded by APBD'.

57
Muttaqin, T., M. van Duijn, L. Heyse and R. Wittek (2016) 'The Impact of Decentralization
on Educational Attainment in Indonesia', in R.L. Holzhacker, R. Wittek and J. Woltjer (eds)
Decentralization and Governance in Indonesia, pp. 79-103. Cham: Springer International
Publishing.
Nachrowi, D.N. and H. Usman (2006) Pendekatan Populer Dan Praktis Ekonometrika Untuk
Analisis Ekonomi Dan Keuangan (Popular and Practical Approach of Econometrics for
Economic and Finance Analysis) . Jakarta: Lembaga Penerbit Fakultas Ekonomi Universitas
Indonesia.
Nadeau, R. and A. Blais (1993) 'Accepting the Election Outcome: The Effect of Participation
on Losers' Consent', British Journal of Political Science 23(4): 553-
563https://www.cambridge.org/core/article/accepting-the-election-outcome-the-effect-of-
participation-on-losers-consent/E16721F53BB41E303495BA6FF5339A9C2017/04/12.
Nasution, A. (2016) 'Government Decentralization Program in Indonesia', ADBI Working
Paper 601.
Nordhaus, W.D. (1975) 'The Political Business Cycle', Review of Economic Studies 2: 169-
190.
Ostwald K, Tajima Y, Samphantharak K. (2016) 'Indonesia's Decentralization Experiment:
Motivations, Successes, and Unintended Consequences. ', Journal of Southeast Asian
Economies 33(2): 139-56.
Persson, T. and G. Tabellini (2002) 'Political Economics and Public Finance', in A.J.
Auerbach and M. Feldstein (eds) Handbook of Public Economics, Vol. 3. pp. 1549-1659.
Elsevier.
Philips, A.Q. (2016) 'Seeing the Forest through the Trees: A Meta-Analysis of Political
Budget Cycles', Public Choice 168(3): 313-341.
Republic of Indonesia (2015) 'The Law no. 8 of 2015 on Amendment to Law no. 1 of 2015
on Stipulation of Government Regulation no. 1 of 2014 on the Election of the Governor,
Regent, and Mayor be Liable'.
Republic of Indonesia (2014) 'The Law no. 33/2014 regarding Regional Election'.
Ritonga, I.T. and M.I. Alam (2010) 'Apakah Incumbent Memanfaatkan Anggaran Pendapatan
Belanja Daerah (APBD) Untuk Mencalonkan Kembali Dalam Pemilihan Umum Kepala
Daerah (PEMILUKADA)', Simposium Nasional Akutansi XIII: 27 July 2017. Accessed
tiepena.ac.id/wp-content/uploads/2011/11/ASP_05.pdf <http://stiepena.ac.id/wp-
content/uploads/2011/11/ASP_05.pdf>.
Rogoff, K. and A. Sibert (Jan., 1988) 'Elections and Macroeconomic Policy Cycles', The
Review of Economic Studies 55(1): 1-16.
Rosenberg, J. (1992) 'Rationality and the Political Business Cycle: The Case of Local
Government', Public Choice (1986-1998) 73(1): 71.

58
Sadikin, U.H. (April 2016) 'Menyerentakan Pemilu, Memusatkan Anggaran Pilkada', Jurnal
Pemilu dan Demokrasi 8.
Sakurai, S.N. and N. Menezes-Filho (2011) 'Opportunistic and Partisan Election Cycles in
Brazil: A New Evidence at the Municipal Level', Public Choice 148(1): 233-247.
Setiawan, B. (2006) 'Petahana Tetap Kuat Di Pilkada 2015 (the Incumbents have Won in the
Regional Election in 2015)' 07/01/2016, .
Shi, M. and J. Svensson (2006) 'Political Budget Cycles: Do they Differ Across Countries
and Why?', Journal of Public Economics 90(8-9): 1367-1389.
Sjahrir, B.S., K. Kis-Katos and G.G. Schulze (2013) 'Political Budget Cycles in Indonesia at
the District Level'. <http://www.sciencedirect.com/science/article/pii/S0165176513002449>
(ID: 271682).
Smoke, P. (2007) '‘Fiscal Decentralisation and Intergovernmental Fiscal Relations:
Navigating a Viable Path to Reform’', in Cheema, G.S. & Rondinelli, D.A. (ed.)
Decentralising Governance: Emerging Concepts and Practices, pp. 141-142. Washington:
The Brookings Institution Press.
Statistics Indonesia (2017) 'Financial Statistics of Regency/Municipality Government 2015-
2016 Book 1 and 2', Financial Statistics Regional Government, No. 06310.1703. Jakarta:
BPS.
Streb, J.M., D. Lema and G. Torrens (2009) 'Checks and Balances on Political Budget
Cycles: Cross Country Evidence', Kyklos 62(3): 426-447.
Surbakti, R. (January-March 2014) 'Understanding the Flaws in Indonesia's Electoral
Democracy', Strategic Review .
Tamang , L.R. (Last updated 2017) 'Five Things You may Not Know about Indonesia’s
Regional Elections'. Accessed 07/05 2017 <http://www.idea.int/news-media/news/five-
things-you-may-not-know-about-indonesia%E2%80%99s-regional-elections>.
Tanjung, B.H. (2015) 'Petahana Kalah Telak Di Pilkada Bengkalis (the Incumbents Heavily
Lost in Bengkalis)' www.okezone.com,.
The Supreme Constitutional Court Republic of Indonesia (2015) 'The Supreme Constitutional
Court Stipulation Number 100/PUU-XIII/2015'.
(http://ppid.kpu.go.id/?download=20151215085544).
Ul Haq, M.F. (2017) 'ICW Ungkap Keterkaitan Dinasti Politik, Pilkada, Dan Korupsi (ICW
Discloses the Linkage of Political Election, and Corruption Dynasties)' detiknews.com,
22/01/2017, .
Veiga, L.G. and F.J. Veiga (2007) 'Does Opportunism Pay Off?', Economics Letters 96(2):
177-182.

59
Vergne, C. (2009) 'Democracy, Elections and Allocation of Public Expenditures in
Developing Countries'.
<http://www.sciencedirect.com/science/article/pii/S0176268008000748> (ID: 271678).
Vicente, C., B. Benito and F. Bastida (2013) 'Transparency and Political Budget Cycles at
Municipal Level', Swiss Political Science Review 19(2): 139-156.
Wardhani, D.A. (2014) 'Ahok Defends Direct Elections, Slams Coalition. Accessed 20
August 2017' www.thejakartapost.com, 09/09/2014.
Winoto, A.H. and Falikhatun (Juni 2015) 'Indikasi Penyalahgunaan Discretionary Fund
Dalam Anggaran Pendapatan Dan Belanja Daerah Menjelang Pemilukada 2015', Jurnal
Akuntansi dan Keuangan Indonesia 12(1): 75 - 91.
Wiseno (Last updated 2017) 'Simultaneous Regional Elections Expected to Boost Economic
Growth' 07/15
<http://www.en.netralnews.com/news/business/read/108/simultaneous.regional.elections.exp
ected.to.boost.economic.growth>.

60
Appendices
1. Simultaneous Reginal Head Election in 2015
The Regions Map of The Indonesian Concurrence Regional Head Election in 2015
Source: KPU 2017

61
2. Descriptive Statistics
within 0 .6944444 .6944444 T = 5
between .4622502 0 1 n = 144
won overall .6944444 .4609626 0 1 N = 720
within 0 .5708661 .5708661 T = 5
between .4959297 0 1 n = 254
incumb~t overall .5708661 .4951475 0 1 N = 1270
within 4.53959 43.79248 157.8685 T = 5
between 9.986856 21.28 99.836 n = 362
litera~e overall 92.91848 10.96014 10.93 100 N = 1810
within 29220.87 62545.58 1074007 T = 5
between 1016307 13370 1.15e+07 n = 362
popsize overall 569761.4 1015603 13163 1.20e+07 N = 1810
within 1.071024 4.296899 14.52628 T-bar = 4.26519
between 1.515575 5.244838 14.00746 n = 362
ln_fin~p overall 9.715049 1.78636 3.912023 14.25767 N = 1544
within 1.028554 3.775931 12.23929 T-bar = 4.74586
between 1.270727 4.999605 12.81673 n = 362
ln_soc~p overall 8.599424 1.622985 1.609438 14.5513 N = 1718
within .7796149 6.273742 12.57058 T-bar = 4.89227
between 1.092437 7.625477 14.23176 n = 362
ln_gra~p overall 9.879219 1.341617 4.60517 14.547 N = 1771
within .3278914 10.72988 14.10685 T-bar = 4.99724
between .5810588 11.23412 16.05601 n = 362
ln_inv~p overall 12.26448 .6667138 10.72567 16.18538 N = 1809
within .2157391 12.94118 15.25453 T = 5
between .5682182 12.72456 17.36868 n = 362
ln_tot~p overall 13.7416 .6072079 12.20823 17.57744 N = 1810
within .2048348 11.73475 15.24542 T = 5
between .5733442 12.76303 17.44646 n = 362
ln_tot~e overall 13.77375 .6082384 11.91504 17.60444 N = 1810
within .8898623 6.393041 13.94541 T-bar = 3.69444
between .9948948 7.284821 14.64022 n = 360
ln_bud~e overall 10.51722 1.305643 3.713572 15.61137 N = 1330
within .0819481 2.722738 4.117907 T = 5
between .7391249 .955997 5.912918 n = 362
ln_re~ap overall 3.159236 .7428413 .9321641 5.936296 N = 1810
within 1.41e+07 -3.19e+08 3.79e+08 T = 5
between 8.87e+07 106424 1.56e+09 n = 362
region~p overall 2.17e+07 8.97e+07 94100 1.92e+09 N = 1810
Variable Mean Std. Dev. Min Max Observations

62
3. Hausman Test
- Total Expenditure
- Discretionary Funds
(V_b-V_B is not positive definite)
Prob>chi2 = 0.0000
= 163.07
chi2(4) = (b-B)'[(V_b-V_B)^(-1)](b-B)
Test: Ho: difference in coefficients not systematic
B = inconsistent under Ha, efficient under Ho; obtained from xtreg
b = consistent under Ho and Ha; obtained from xtreg
ln_reggdpcap 1789342 1283468 505874.1 125167.5
literacyrate 1289.702 4601.87 -3312.168 519.1895
ln_popsize 3852185 886180.9 2966004 445337.5
electtotal 21504.73 112416.2 -90911.45 4736.362
Fixed Random Difference S.E.
(b) (B) (b-B) sqrt(diag(V_b-V_B))
Coefficients
(V_b-V_B is not positive definite)
Prob>chi2 = 0.0000
= 102.91
chi2(4) = (b-B)'[(V_b-V_B)^(-1)](b-B)
Test: Ho: difference in coefficients not systematic
B = inconsistent under Ha, efficient under Ho; obtained from xtreg
b = consistent under Ho and Ha; obtained from xtreg
ln_reggdpcap 312292.1 111685.6 200606.5 30377.62
literacyrate -69.77213 161.2007 -230.9728 232.179
ln_popsize 440016 92555.98 347460 93017.91
electtotal 24370.33 44708.88 -20338.55 1541.984
Fixed Random Difference S.E.
(b) (B) (b-B) sqrt(diag(V_b-V_B))
Coefficients

63
- Budget Balance
- Investment Expenditure
(V_b-V_B is not positive definite)
Prob>chi2 = 0.0000
= 46.68
chi2(4) = (b-B)'[(V_b-V_B)^(-1)](b-B)
Test: Ho: difference in coefficients not systematic
B = inconsistent under Ha, efficient under Ho; obtained from xtreg
b = consistent under Ho and Ha; obtained from xtreg
ln_reggdpcap 197092.6 29402.3 167690.3 64411.52
literacyrate 751.3256 -742.3478 1493.673 819.7829
ln_popsize -1221039 45274.1 -1266313 185460.2
electtotal -45215.77 -58085.55 12869.78 3981.43
Fixed Random Difference S.E.
(b) (B) (b-B) sqrt(diag(V_b-V_B))
Coefficients
(V_b-V_B is not positive definite)
Prob>chi2 = 0.0000
= 979.81
chi2(4) = (b-B)'[(V_b-V_B)^(-1)](b-B)
Test: Ho: difference in coefficients not systematic
B = inconsistent under Ha, efficient under Ho; obtained from xtreg
b = consistent under Ho and Ha; obtained from xtreg
ln_reggdpcap 1.323371 .522118 .8012531 .0893448
literacyrate .0018415 .0028005 -.000959 .0004323
ln_popsize 4.741348 .2573047 4.484043 .2707594
electtotal -.0663662 .0775176 -.1438839 .
Fixed Random Difference S.E.
(b) (B) (b-B) sqrt(diag(V_b-V_B))
Coefficients

64
- Grants Expenditure
- Social Assistance Expenditure
(V_b-V_B is not positive definite)
Prob>chi2 = 0.0000
= 36.59
chi2(4) = (b-B)'[(V_b-V_B)^(-1)](b-B)
Test: Ho: difference in coefficients not systematic
B = inconsistent under Ha, efficient under Ho; obtained from xtreg
b = consistent under Ho and Ha; obtained from xtreg
ln_reggdpcap 1.227087 .5593372 .6677497 .2572407
literacyrate .0018561 -.0067019 .008558 .0030222
ln_popsize 2.274147 .6241274 1.650019 .7432967
electtotal .6710892 .7566857 -.0855965 .0165167
Fixed Random Difference S.E.
(b) (B) (b-B) sqrt(diag(V_b-V_B))
Coefficients
(V_b-V_B is not positive definite)
Prob>chi2 = 0.0000
= 76.60
chi2(4) = (b-B)'[(V_b-V_B)^(-1)](b-B)
Test: Ho: difference in coefficients not systematic
B = inconsistent under Ha, efficient under Ho; obtained from xtreg
b = consistent under Ho and Ha; obtained from xtreg
ln_reggdpcap -1.344307 .1931616 -1.537469 .3786274
literacyrate .0082771 -.0168771 .0251542 .0040135
ln_popsize -4.675834 .2000965 -4.875931 1.071781
electtotal -.4688461 -.6146449 .1457989 .0189431
Fixed Random Difference S.E.
(b) (B) (b-B) sqrt(diag(V_b-V_B))
Coefficients
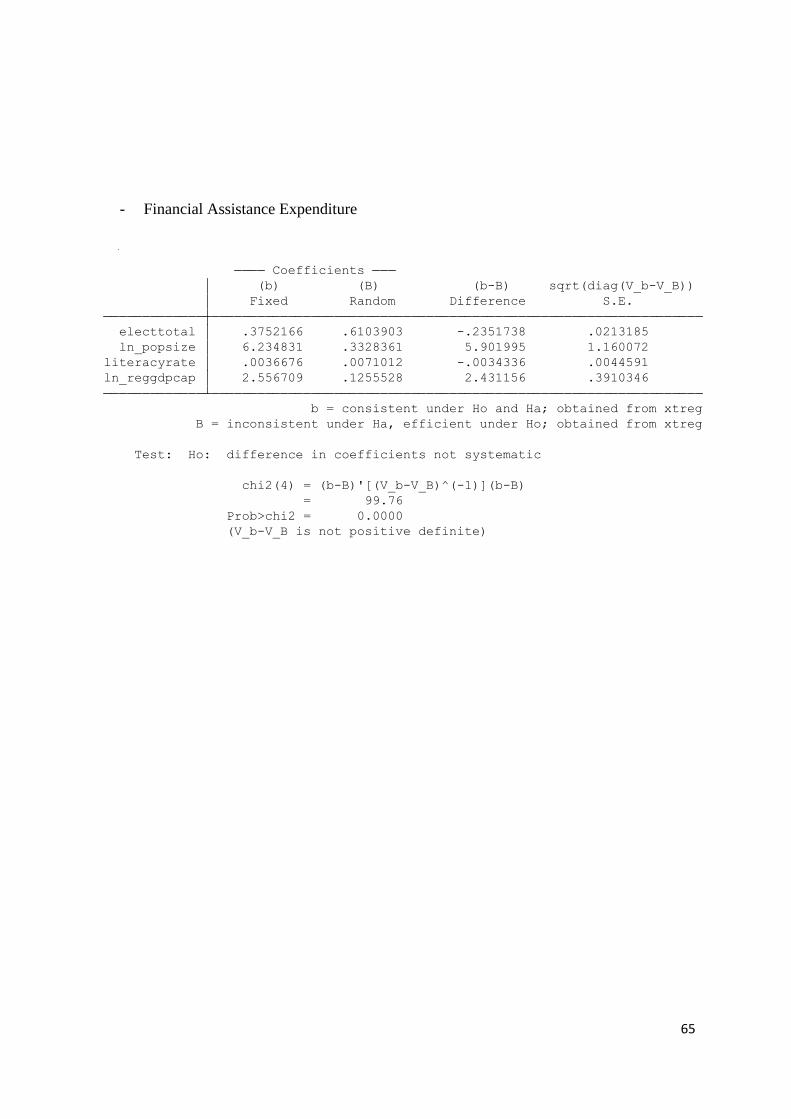
65
- Financial Assistance Expenditure
(V_b-V_B is not positive definite)
Prob>chi2 = 0.0000
= 99.76
chi2(4) = (b-B)'[(V_b-V_B)^(-1)](b-B)
Test: Ho: difference in coefficients not systematic
B = inconsistent under Ha, efficient under Ho; obtained from xtreg
b = consistent under Ho and Ha; obtained from xtreg
ln_reggdpcap 2.556709 .1255528 2.431156 .3910346
literacyrate .0036676 .0071012 -.0034336 .0044591
ln_popsize 6.234831 .3328361 5.901995 1.160072
electtotal .3752166 .6103903 -.2351738 .0213185
Fixed Random Difference S.E.
(b) (B) (b-B) sqrt(diag(V_b-V_B))
Coefficients

66
4. Regression Result
a. Model 1: The PBC Bheaviour in 2015’s Concurrence Regional Election
- T
otal
Exp
end
itur
e
municipalities absorbed (362 categories)
_cons 12.89718 6.159238 2.09 0.037 .7846909 25.00968
2015 .3788905 .0446883 8.48 0.000 .2910084 .4667726
2014 .2122228 .0298824 7.10 0.000 .1534573 .2709882
2013 .110073 .0164596 6.69 0.000 .0777042 .1424418
year
ln_popsize -.0463627 .4838517 -0.10 0.924 -.9978847 .9051593
literacyrate .0005839 .0007031 0.83 0.407 -.0007988 .0019666
ln_reggdpcap .2232887 .1013278 2.20 0.028 .0240218 .4225556
incumbent~2015 .004113 .025537 0.16 0.872 -.046107 .054333
electtotal -.0439187 .0126563 -3.47 0.001 -.0688081 -.0190293
L1. .0412501 .098705 0.42 0.676 -.1528591 .2353592
ln_totalexp
ln_totalexp Coef. Std. Err. t P>|t| [95% Conf. Interval]
Robust
(Std. Err. adjusted for 362 clusters in municipalities)
Root MSE = 0.1261
Adj R-squared = 0.9563
R-squared = 0.9675
Prob > F = 0.0000
F( 9, 361) = 151.90
Linear regression, absorbing indicators Number of obs = 1,448

67
- Budget Balance
- Invesment Expenditure
- D
i
s
c
r
e
t
i
o
n
a
r
y
F
u
municipalities absorbed (336 categories)
_cons 156.4178 76.52167 2.04 0.042 5.894263 306.9413
2015 .3248569 .3661601 0.89 0.376 -.3954059 1.04512
2014 .5995353 .2413604 2.48 0.013 .1247624 1.074308
2013 .0741306 .174717 0.42 0.672 -.26955 .4178113
year
ln_popsize -11.37235 5.985627 -1.90 0.058 -23.1465 .4017981
literacyrate .0141103 .0160662 0.88 0.380 -.0174931 .0457136
ln_reggdpcap .2349901 .7557989 0.31 0.756 -1.25172 1.7217
incumbent~2015 .3830571 .350878 1.09 0.276 -.3071447 1.073259
electtotal -.2542133 .1989757 -1.28 0.202 -.6456125 .1371859
L1. -.3073165 .0723979 -4.24 0.000 -.4497282 -.1649048
ln_budgetbal~e
ln_budgetbal~e Coef. Std. Err. t P>|t| [95% Conf. Interval]
Robust
(Std. Err. adjusted for 336 clusters in municipalities)
Root MSE = 0.9941
Adj R-squared = 0.4409
R-squared = 0.6691
Prob > F = 0.0000
F( 9, 335) = 6.19
Linear regression, absorbing indicators Number of obs = 844
municipalities absorbed (362 categories)
_cons 20.04082 11.22119 1.79 0.075 -2.026299 42.10793
2015 .5210446 .0603631 8.63 0.000 .4023372 .639752
2014 .2943887 .0406322 7.25 0.000 .2144831 .3742943
2013 .1640887 .0267149 6.14 0.000 .1115524 .2166251
year
ln_popsize -.7292231 .8925197 -0.82 0.414 -2.484414 1.025968
literacyrate .0007884 .0015858 0.50 0.619 -.0023302 .003907
ln_reggdpcap .1945861 .1633167 1.19 0.234 -.1265856 .5157578
incumbent~2015 .0170989 .0467655 0.37 0.715 -.0748681 .1090659
electtotal -.1613442 .0320069 -5.04 0.000 -.2242877 -.0984008
L1. .0487931 .0423957 1.15 0.251 -.0345805 .1321667
ln_investmen~p
ln_investmen~p Coef. Std. Err. t P>|t| [95% Conf. Interval]
Robust
(Std. Err. adjusted for 362 clusters in municipalities)
Root MSE = 0.2534
Adj R-squared = 0.8541
R-squared = 0.8914
Prob > F = 0.0000
F( 9, 361) = 46.50
Linear regression, absorbing indicators Number of obs = 1,447

68
nds
- Grants Expenditure
municipalities absorbed (362 categories)
_cons 35.79163 31.76928 1.13 0.261 -26.68446 98.26773
2015 .5655669 .1800629 3.14 0.002 .2114628 .9196709
2014 .6437545 .1228332 5.24 0.000 .4021961 .885313
2013 .2897675 .0740341 3.91 0.000 .1441752 .4353598
year
ln_popsize -1.903801 2.492541 -0.76 0.445 -6.805525 2.997923
literacyrate -.0005141 .0057361 -0.09 0.929 -.0117945 .0107663
ln_reggdpcap -.349161 .5963414 -0.59 0.559 -1.5219 .8235784
incumbent~2015 .2783755 .1388118 2.01 0.046 .0053942 .5513567
electtotal .7057357 .0869737 8.11 0.000 .534697 .8767744
L1. -.1287163 .0449185 -2.87 0.004 -.2170512 -.0403815
ln_grantexp
ln_grantexp Coef. Std. Err. t P>|t| [95% Conf. Interval]
Robust
(Std. Err. adjusted for 362 clusters in municipalities)
Root MSE = 0.7392
Adj R-squared = 0.7205
R-squared = 0.7949
Prob > F = 0.0000
F( 9, 361) = 26.82
Linear regression, absorbing indicators Number of obs = 1,390

69
- Social Assistance Expenditure
-
- Financial Assistance Expenditure
municipalities absorbed (358 categories)
_cons -2.797636 48.93537 -0.06 0.954 -99.03547 93.44019
2015 -.1224727 .2383 -0.51 0.608 -.5911209 .3461754
2014 .2018076 .1679651 1.20 0.230 -.1285178 .5321331
2013 .2245001 .1243221 1.81 0.072 -.0199956 .4689958
year
ln_popsize .9997699 3.880258 0.26 0.797 -6.631266 8.630806
literacyrate .0019773 .0049815 0.40 0.692 -.0078194 .011774
ln_reggdpcap -.3411276 .6574451 -0.52 0.604 -1.63408 .9518244
incumbent~2015 -.0825377 .2096608 -0.39 0.694 -.4948632 .3297877
electtotal -.1770562 .1489274 -1.19 0.235 -.4699414 .115829
L1. -.0557954 .0566999 -0.98 0.326 -.1673032 .0557124
ln_socialass~p
ln_socialass~p Coef. Std. Err. t P>|t| [95% Conf. Interval]
Robust
(Std. Err. adjusted for 358 clusters in municipalities)
Root MSE = 1.0412
Adj R-squared = 0.6083
R-squared = 0.7161
Prob > F = 0.0000
F( 9, 357) = 5.22
Linear regression, absorbing indicators Number of obs = 1,331
municipalities absorbed (334 categories)
_cons -6.753361 46.15654 -0.15 0.884 -97.5485 84.04178
2015 1.006126 .2650457 3.80 0.000 .4847506 1.5275
2014 -.0387284 .1848003 -0.21 0.834 -.4022516 .3247949
2013 .0425497 .1162499 0.37 0.715 -.186127 .2712264
year
ln_popsize .8342518 3.654058 0.23 0.820 -6.353695 8.022198
literacyrate -.0018179 .012 -0.15 0.880 -.0254233 .0217875
ln_reggdpcap 2.061842 .8557144 2.41 0.017 .3785544 3.745129
incumbent~2015 .2030135 .2598941 0.78 0.435 -.3082277 .7142546
electtotal -.2112619 .141494 -1.49 0.136 -.4895965 .0670728
L1. -.0561694 .0788225 -0.71 0.477 -.2112222 .0988833
ln_financial~p
ln_financial~p Coef. Std. Err. t P>|t| [95% Conf. Interval]
Robust
(Std. Err. adjusted for 334 clusters in municipalities)
Root MSE = 1.0870
Adj R-squared = 0.6246
R-squared = 0.7391
Prob > F = 0.0000
F( 9, 333) = 16.05
Linear regression, absorbing indicators Number of obs = 1,123

70

71
-
b. The Winning Election Prospects
- Total Expenditure
- Budget Balance
_cons .9447675 1.158327 0.82 0.416 -1.345452 3.234987
literacyrate -.0003282 .0054662 -0.06 0.952 -.0111359 .0104796
ln_popsize .1758629 .0597027 2.95 0.004 .05782 .2939057
ln_reggdpcap .0666542 .0601642 1.11 0.270 -.0523011 .1856096
ln_totalexp -.1900024 .1125351 -1.69 0.094 -.4125044 .0324996
won Coef. Std. Err. t P>|t| [95% Conf. Interval]
Total 30.5555556 143 .213675214 Root MSE = .45092
Adj R-squared = 0.0484
Residual 28.2626139 139 .203328158 R-squared = 0.0750
Model 2.29294164 4 .573235411 Prob > F = 0.0275
F(4, 139) = 2.82
Source SS df MS Number of obs = 144
_cons .4138827 .768826 0.54 0.592 -1.122024 1.949789
literacyrate -.0062905 .0061623 -1.02 0.311 -.018601 .0060201
ln_popsize .0398684 .0477681 0.83 0.407 -.0555594 .1352962
ln_reggdpcap .1521681 .1056054 1.44 0.154 -.0588029 .363139
ln_budgetbal~e -.0034177 .0394865 -0.09 0.931 -.082301 .0754657
won Coef. Std. Err. t P>|t| [95% Conf. Interval]
Total 12.2898551 68 .180733163 Root MSE = .42705
Adj R-squared = -0.0091
Residual 11.6716548 64 .182369606 R-squared = 0.0503
Model .618200264 4 .154550066 Prob > F = 0.5004
F(4, 64) = 0.85
Source SS df MS Number of obs = 69
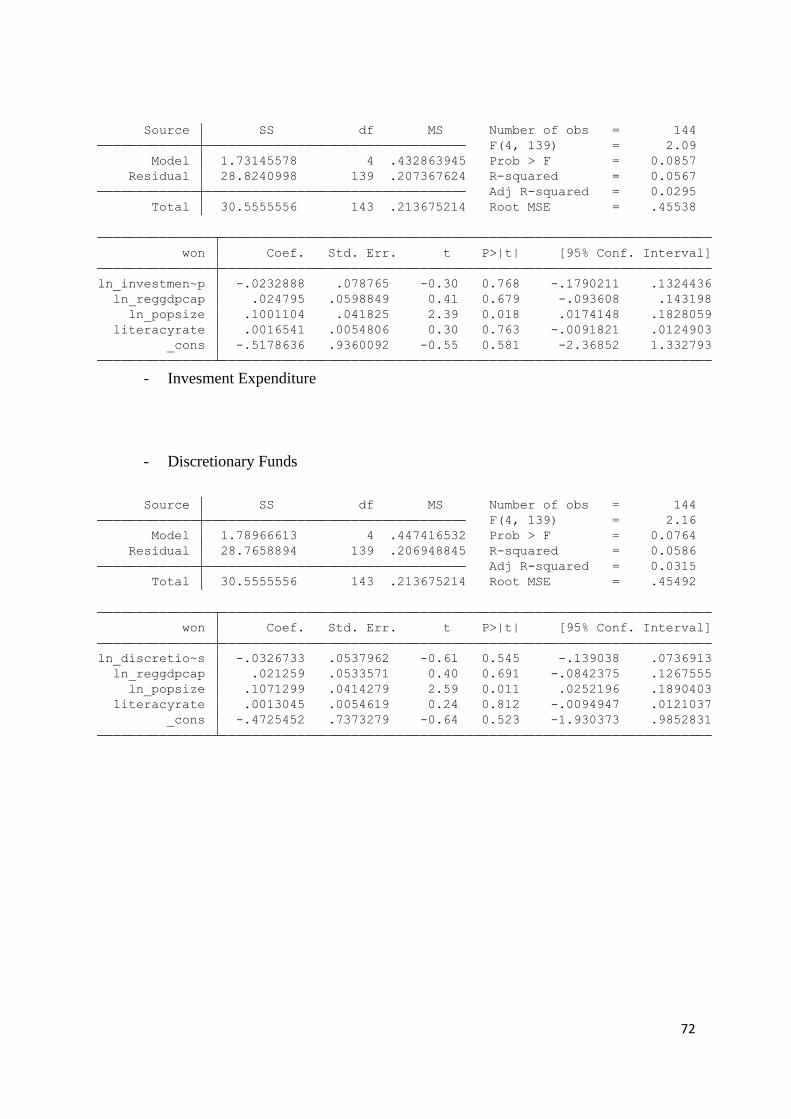
72
- Invesment Expenditure
- Discretionary Funds
_cons -.4725452 .7373279 -0.64 0.523 -1.930373 .9852831
literacyrate .0013045 .0054619 0.24 0.812 -.0094947 .0121037
ln_popsize .1071299 .0414279 2.59 0.011 .0252196 .1890403
ln_reggdpcap .021259 .0533571 0.40 0.691 -.0842375 .1267555
ln_discretio~s -.0326733 .0537962 -0.61 0.545 -.139038 .0736913
won Coef. Std. Err. t P>|t| [95% Conf. Interval]
Total 30.5555556 143 .213675214 Root MSE = .45492
Adj R-squared = 0.0315
Residual 28.7658894 139 .206948845 R-squared = 0.0586
Model 1.78966613 4 .447416532 Prob > F = 0.0764
F(4, 139) = 2.16
Source SS df MS Number of obs = 144
_cons -.5178636 .9360092 -0.55 0.581 -2.36852 1.332793
literacyrate .0016541 .0054806 0.30 0.763 -.0091821 .0124903
ln_popsize .1001104 .041825 2.39 0.018 .0174148 .1828059
ln_reggdpcap .024795 .0598849 0.41 0.679 -.093608 .143198
ln_investmen~p -.0232888 .078765 -0.30 0.768 -.1790211 .1324436
won Coef. Std. Err. t P>|t| [95% Conf. Interval]
Total 30.5555556 143 .213675214 Root MSE = .45538
Adj R-squared = 0.0295
Residual 28.8240998 139 .207367624 R-squared = 0.0567
Model 1.73145578 4 .432863945 Prob > F = 0.0857
F(4, 139) = 2.09
Source SS df MS Number of obs = 144

73
- Grants Expenditure
- Social Assistance Expenditure
- Financial Assistance Expenditure
_cons -.750972 .7031358 -1.07 0.287 -2.141558 .6396143
literacyrate .0018875 .0056435 0.33 0.739 -.0092736 .0130485
ln_popsize .0977521 .0466498 2.10 0.038 .0054932 .1900111
ln_reggdpcap .0265118 .0560363 0.47 0.637 -.0843107 .1373344
ln_grantexp -.0062213 .0611193 -0.10 0.919 -.1270965 .1146539
won Coef. Std. Err. t P>|t| [95% Conf. Interval]
Total 30.1714286 139 .217060637 Root MSE = .45836
Adj R-squared = 0.0321
Residual 28.3623159 135 .210091229 R-squared = 0.0600
Model 1.80911264 4 .45227816 Prob > F = 0.0777
F(4, 135) = 2.15
Source SS df MS Number of obs = 140
_cons -.7490844 .6532128 -1.15 0.254 -2.042079 .5439104
literacyrate .0010925 .0055701 0.20 0.845 -.0099332 .0121182
ln_popsize .0812925 .0389626 2.09 0.039 .0041683 .1584167
ln_reggdpcap .0473297 .057976 0.82 0.416 -.0674302 .1620895
ln_socialass~p .0187707 .0252179 0.74 0.458 -.0311465 .0686879
won Coef. Std. Err. t P>|t| [95% Conf. Interval]
Total 27.5 127 .216535433 Root MSE = .45882
Adj R-squared = 0.0278
Residual 25.8933152 123 .210514758 R-squared = 0.0584
Model 1.60668482 4 .401671205 Prob > F = 0.1133
F(4, 123) = 1.91
Source SS df MS Number of obs = 128
_cons -.6120726 .6689273 -0.92 0.362 -1.93537 .7112253
literacyrate .0017639 .0054819 0.32 0.748 -.0090806 .0126084
ln_popsize .0823057 .0358366 2.30 0.023 .0114123 .153199
ln_reggdpcap .0305886 .0543407 0.56 0.574 -.0769102 .1380874
ln_financial~p -.0005991 .0191435 -0.03 0.975 -.0384695 .0372713
won Coef. Std. Err. t P>|t| [95% Conf. Interval]
Total 29.0294118 135 .21503268 Root MSE = .45943
Adj R-squared = 0.0184
Residual 27.6506111 131 .211073367 R-squared = 0.0475
Model 1.37880064 4 .34470016 Prob > F = 0.1697
F(4, 131) = 1.63
Source SS df MS Number of obs = 136

74