policy paper global food price shocks transmission to local markets
TRANSCRIPT

POLICY PAPER
GLOBAL FOOD PRICE SHOCKS TRANSMISSION TO
LOCAL MARKETS AND WELFARE IMPLICATIONS FOR
GEORGIAN HOUSEHOLDS
The research is conducted in the framework of the project “Policy Research
for Sustainable Growth”, implemented by Konrad Adenauer Foundation in
cooperation with PMC Research Center
The content does not necessarily reflect the view of PMC Research Center or Konrad Adenauer Foundation
Author: Aleqsandre Bluashvili
Reviewer: Shushanik Safaryan

Contents
Abstract ............................................................................................... 3
Introduction ......................................................................................... 3
I. Global Food Prices and Domestic Market ............................................. 6
Domestic food production and consumption structure ............................ 9
II. Literature Review ........................................................................... 13
III. Data and Methodology .................................................................... 15
IV. Results of the VAR Analysis ............................................................. 18
V. Welfare Impact of Global Price Shock to domestic consumers .............. 20
Conclusion ......................................................................................... 23
Food Security Policy Recommendations ................................................. 24
Food Security Information Systems ................................................... 25
Early Warning Systems .................................................................... 26
Implementation of Food Subsidy Schemes .......................................... 27
References ......................................................................................... 29
Appendix ........................................................................................... 30

3
Abstract
Paper examines influence of global price shocks of wheat and sugar on the domestic
prices using reduced form VAR model. Analysis suggests close correlations between
global and domestic prices of sugar and wheat products. Namely, 1 percentage point
shock of global sugar prices results in 0.32 percentage point increase in domestic sugar
prices, for the case of wheat products effect is 0.13 percentage point. This research also
assesses welfare impacts of 2007-08 and 2010-11 food crises. As suggested by the
findings, if 2010-11 food price shock repeated in 2013, rural as well as urban
households will be harmed more compared to 2007-08 price shock mainly due to the
fact that during 2010-11 food crises price of almost all types of food products increased,
as opposed to a less widespread impact on domestic prices of 2007-08 food crises. In
case of repetition of 2010-11 crises households with incomes lower than GEL 400 would
require on average approximately 10% more expenses to maintain their consumption at
2013 year levels.
Introduction
In the period of 2003 - 2013, real growth of GDP averaged 6.3% in Georgia, however the
benefits of the growth has not been equally shared among different groups of population.
Despite the robust growth over the past ten years, as of 2013, 9.3% of total population
remains below the poverty line. This poses significant challenges to the food security policy
in Georgia. According to the Global Hunger Index1 (GHI) measured by the International
Food Policy Research Institute, Georgia lags behind most of the countries in the region in
terms of food security.
1 IFPRI, http://www.ifpri.org/book-8018/ourwork/researcharea/global-hunger-index

4
Table 1: Global Hunger Index (GHI)
GHI represents simple weighted average of three components:
Share of inadequately nourished people in total population
Share of underweight children under 5 years
Children mortality
Higher the index, more vulnerable the country is towards the hunger. In terms of last two
components of the index, Georgia scores better than countries given in the table 1.
However, it has the highest share of inadequately nourished people among peer countries,
standing at 24.7% as of 2013. With the score of 9.3 Georgia enters the group of countries
with “moderate” risk of hunger, however, this score for Georgia is only slightly lower than
for countries with “serious” risk of hunger as classified by the IFPRI.
Global hunger index once more demonstrates the need for well-tailored food security policy
in Georgia. The main goal of this paper is to call attention of the relevant stakeholders, and
particularly, policy makers about the vulnerability of different socio-economic groups
towards hunger in Georgia.
This study is focused on the food price on global markets and the influence of global price
shocks on domestic consumers. Along with the deeper integration of world markets, global
trade in food products has been on a steady growth path over the last several decades. In
2002, global trade in food products stood at USD 176 billion2, ten years after, in 2012, trade
in food products was almost tripled and reached USD 516 billion. Big chunk of the growth
was on the account of developing countries, which increased imports of food products from
USD 41 billion, in 2002, to over USD 150 billion, in 2012. Increasing reliance on imported
2 Worldbank, Comtrade database
GHI index 1995 2000 2005 2013
Georgia 16.6 9.2 11.3 9.3
Armenia 10.2 8.2 <5 <5
Azerbaijan 14.5 11.9 5.4 <5
Moldova 7.7 8.8 7.3 9.2
Uzbekistan 10.3 9.3 6.6 5.3

5
foodstuff on one hand helps to diversify menu in developing countries, however, on the
other hand food markets in developing countries become more exposed to global food price
shocks.
This global trend is even more pronounced in case of Georgia. In 2002, import of food
products from the rest of the world was USD 85 million, while, in 2012, it reached USD 685
million. Nowadays total food consumption heavily relies on imported products, according to
data from 2012, self-sufficiency ratios for main food products in Georgian consumer basket -
wheat, meat and pork - were 9%, 36% and 36%, respectively. At the same time, share of
food in total consumption stood at around 33% for average Georgian household3, meaning
that significant portion of household consumption consists of imported food products.
Therefore, impact of international price fluctuation might have a significant direct impact on
the well-being of Georgian households. This paper aims to test this hypothesis and estimate
the impact of global food price shocks on local prices, as well as explore welfare implications
of these fluctuations.
The transmission of global food price shocks to local markets has been extensively
researched (Godsway et al. 2008, Minot 2011), especially for developing countries, where
food expenditures of households occupy significant portion of total expenditures. However
there has been no comprehensive study on this subject for the case of Georgia. In this
paper, we will try to make first step to fill this gap. The paper is organized as follows:
first chapter will present the analysis of food price trends on local and global
markets, as well as the description of the food production and consumption
patterns in Georgia;
second chapter will review the relevant literature; third chapter will present the
empirical analysis of global food price transmission into Georgian market;
Findings of the empirical analyses will be employed in the next part of the paper
which will examine the welfare implications of global food price shocks for the
domestic households.
Paper concludes with the summary of findings and recommendation for food
safety policy design in Georgia.
3 http://geostat.ge/?action=page&p_id=184&lang=geo

6
I. Global Food Prices and Domestic Market
Global food crisis in 2007-08 affected prices of almost all food products; increases were
especially notable in case of prices of grains and dairy products. As FAO4 food price index5
clearly demonstrates, food prices not only increased during 2007-08 crisis, but also became
more volatile since then. Producers of the staple foods increased production as a response
to price increase in 2007-2008 and, consequently, prices quickly returned to the levels
before the crises. Another sharp increase in food prices happened in 2010-2011. This time
price increase was more broadly based across different food products. As estimated by
Maros Ivanic et al6, for the sample of 28 low and middle income countries, 2010-11 food
price shock had much more stronger and sizeable negative welfare impact, compared to the
food price shock in 2007-08, mainly due to the fact that during 2010-11 crises price of
almost all food commodities.
In 2007 and 2008, FAO’s food price index increased by 26.9% and 24.8% annually – biggest
increase of food prices since 1974 food crises. As can be seen from the Figure 1, till 2007-
2008 crises, global prices of cereals, dairy and other food products were more stable with
few spikes along the way.
Underlying reason for the 2007-2008 spike in food prices was related to the famine and low
production of cereals globally, effect of which was aggravated by protectionist policies of
main cereals exporters, who were trying to protect domestic consumers by restricting
exports and consequently fuelling more increase in prices globally. Export restrictions were
imposed by major grain providers – Argentina, Russia, Kazakhstan and Ukraine (Joachim
von Braun et al. 2012).
Another frequently named reason behind the more volatile food prices, especially cereals
prices, is speculations on stock markets, which feeds in to the higher volatility of overall
food price index. Hoping that increasing price trend will continue in the future, investors, in
search of bigger gains on the stock markets, invested more in grain stocks. As a result,
increased demand for grain stocks created a sudden jump in main food commodity prices on
global markets.
4 FAO- Food and Agriculture Organization of the United Nations: http://www.fao.org/home/en/
5 Food Price Index: consists of the average of six commodity group price indices weighted with the average export
share of each of the groups for 1998-2000: in total, 55 commodity quotations considered by FAO commodity
specialists as representing the international prices of the food commodities are included in the overall index 6 “Estimating the Short-Run Poverty Impacts of the 2010-11 Surge in Food Prices”, Maros Ivanic, Will Martin,
Hassan Zaman, 2011

7
Source: FAOSTAT
In 2007-08 along with the grain products, prices were up for dairy and cereal products as
well. Meat product prices also increased, but to a lesser extent. Overall, food prices are
projected to increase over the coming years. By 2020 cereal prices are forecasted to
increase by 20% and meat products prices by 50% (OECD-FAO, 2011).
During the price transmission analysis paper mainly focuses on the prices of sugar and
wheat due to several reasons:
Wheat and sugar represent comparatively homogenous products and it is easier to
find comparable domestic and international prices for these food commodities
As it will be shown in section 3, wheat and sugar are among the most important food
products in the menu of the average Georgian consumer
Georgia heavily depends on the imports of wheat and sugar, which makes prices of
these commodities particularly vulnerable to global price shocks and thus interesting
for the purposes of this paper
Prices of other food commodities like meat and dairy products are also important for the
domestic consumers, although due to the lack of comparable data on domestic and global
Figure 1 Food Prices on International Markets (monthly, 2002-2004=100)

8
markets these commodities are omitted from the analysis. As Figure 2 shows domestic
prices of wheat flour and maize flour react to the changes in international prices of cereals.
Figure 2: International and Domestic Monthly Price Indices for Cereals
Source: FAOSTAT, GEOSTAT
As demonstrated on the Figure 2, spike in 2007-08 was experienced on Georgian market as
well – in response to global price increase, also domestic producers of wheat and maize
increased prices. It is worth mentioning that maize flour price in Georgia exhibits more
volatility compared to wheat flour prices. One of the reasons to that is the fact that Georgia
accumulates stocks of wheat in order to avoid excessive volatility in wheat flour and bread
prices, through enabling importers of the wheat to smooth out minor spikes in international
prices. Prices of storable commodities are characterized by long periods of stability which is
interrupted by short lived but intense spikes (Deaton and Laroque, 1992). This observation
seems to be valid in case of the price of wheat products in Georgia, too.
Similar analysis reveals even more significant co-movement between international and
domestic prices of sugar, which represents important part of the consumer’s diet in Georgia
2007-08 food
crises
2010-11 food
crises

9
(Figure 3). Unlike wheat, price of which is comparably stable with only several spikes, sugar
prices reveal excessive volatility and closely follow prices of sugar on international markets.
Figure 3: International and Domestic Prices for Sugar
Source: FAOSTAT, GEOSTAT
Thus, visual inspection gives a room for deeper analysis in order to give conclusive answer
about the degree of transmission of global prices to domestic markets, which will be
presented below.
Domestic food production and consumption structure
Structure of the domestic food production also influences the extent to which global prices
are transmitted to local markets. Food prices in countries that are largely self-sufficient in
staple food production tend to respond less to global price shocks (Godsway et al, 2008).
As Figure 4 demonstrates, Georgia is self-sufficient in potatoes, maize, eggs and milk
products7. For these commodities, more than 90% of domestic consumption is satisfied with
7 It is important to mention that self-sufficiency in milk products is achieved mainly by using imported milk powder
in the domestic production of dairy products

10
local production. Yet wheat, poultry meat and pork consumption mainly relies on imports
from other countries.
Figure 4: Self-Sufficiency Ratios, 2013 (%)
Source: GEOSTAT
Based on self-sufficiency ratios, we will to select the list of food products on which paper will
focus on during price transmission analysis. Also selection will based on the share of these
products in the consumer expenditure of average Georgian household, as a proxy of
importance of particular food product in consumer basket.
Food products given below (Table 2) make a big chunk of the consumption of average
Georgian household. In 2014, food products together with beverages and tobacco account
for 35% of consumer basket. White bread, dairy product, meat products, vegetables and
sugar represent main sources of calories for average Georgian consumer. As of 20128, main
food products had following weights in total consumer basket:
8 No significant revision of the weights in consumer basket has taken place since 2012

11
Table 2: Weights of staple food products in Consumer Basket, 2012 (%)
Food Products Share in 2012 Consumer Basket (%)
Bread and Wheat 5.69
Cheese 2.55
Other Dairy 2.16
Beef 2.14
Poultry Meat 1.3
Pork 0.28
Other Meat Products 1.49
Sugar 1.2
Other Grain Products 0.92
Total 17.73
Source: GEOSTAT
As evident from the table 2, wheat products represent the most important food product for
average Georgian household – 5.69% of total expenses of average household is allocated
for wheat products. Given the importance of wheat products as well as high dependency on
imports of wheat, paper will devote particular attention to the price transmission analysis for
wheat products.
Cheese and other dairy products taken together also occupy around 5% of total expenses of
average Georgian household. Given the importance of dairy products in daily consumption,
it is also interesting to study if there is a link between global and local or regional and local
prices. However, as Georgia mainly relies on imported milk powder, it is harder to find
comparable global and domestic prices for this commodity, which makes analysis impossible
within the scope of this paper.
Meat products also occupy sizeable share in the consumption basket of the average
Georgian household. On top of that, domestic consumption significantly relies on the imports
of pork and poultry meat. Given the high dependency on imported pork and poultry meat,
as well as considerable share of these commodities in the consumption basket, it would be

12
important to study global to local transmission of prices for these products. Although due to
the non-homogenous nature of meat products, we could not identify relevant global and
local prices to be analyzed in the context of the study.
Weights of different food products, given in the table above are calculated for the average
consumer; however, consumption structure varies across households with different socio-
economic characteristics. Poorer households usually tend to spend higher portion of their
expenditures on the food consumption. There are also differences between rural and urban
households in terms of the amount they spend for buying food. Majority of the rural
households produce food for own consumption, while urban households primarily depend on
the purchased food. Analysis of the consumption patterns for different income groups in
rural and urban areas separately, gives a better idea about the degree of dependence on
food price fluctuation of households with different socio-economic characteristics.
Expenditures on food products as a share of total expenses vary across the different income
groups of Georgian households.
Table 3: Shares of Food Expenses in Total Expenses of Different Income
Share of food expenditures in total expenditures in 2013 (%)
Total Income Urban Rural
<100 56.9 59.8
100-150 51.2 51.2
150-200 47.9 45.6
200-250 46.5 41.4
250-300 44.4 37.9
300-400 42.6 36.5
400-500 38.3 31.0
500-600 37.9 28.4
600-700 34.7 27.4
Source: GEOSTAT, Household Survey Database

13
Food expenses at the low end of income distribution reaches 60% for rural as well as urban
households, as income increases, less portion of the expenditures goes for the foodstuff. It
can be noted from the table 3, that urban households usually spend more on food as
compared to the rural households from the same income group. This difference must be
explained by the production of food products in the villages for own consumption.
Initial analyses suggest that low income consumers from urban areas are likely to be more
vulnerable to food prices shocks, urban households are net buyers of food and thus they will
be hit harder by the food prices shocks. As opposed to the urban families, some of the rural
families can insulate themselves from the price fluctuation by accumulating reserves of
domestically produced food products.
II. Literature Review
2007-2008 food crises triggered new wave of research on the topic of food prices
transmission from global to local markets. Post crises research significantly contributed to
the exploring characteristics of food prices transmission mechanisms and implication of
global shocks for local markets. The issue of price transmission has been researched
especially well for sub-Saharan countries, where the poverty is more widespread and
spending on food accounts for the major portion of consumer spending. Share of food
spending in total consumer spending falls in between 50-70% for most of the sub-Saharan
countries.
Nicholas Minot in his paper “Transmission of World Food Price Changes to Markets in Sub-
Saharan Africa” investigated the implications of 2007-2008 world food crises for 11 African
countries. Research analyzed 62 price series using Vector Error Correction model (VECM).
Research showed significant variations in the size of food prices transmission across
different countries and different food products. Countries that heavily depended on imports
of particular goods showed higher degree of sensitivity towards global shocks. In addition,
geographical factors also influenced the degree of the food prices shock transmission.
Landlocked countries experienced global shocks more heavily and price responses were
more persistent, compared to the coastal countries. Overall, research identified statistically
significant relationships between local and global prices for 13 out of analyzed 62 food price
series. Research also suggests that protectionist policies exacerbated the response of local
prices in some of the analyzed countries.

14
Food price shocks can have dual effect on the welfare of households, on the one hand, net
consumers of the food products will be harmed by increased expenditures, however, on the
other hand, net producers of food might benefit if prices of the goods they sell on the
market will be up, given that cost of production will not increase. Which of these two effects
dominates depends on the characteristics of the households and their
consumption/production patterns. As demonstrated by Maros Ivanic and Will Martin (2008),
poor families from developing countries are especially vulnerable to the food prices
fluctuations. Global price shocks can have serious malnutrition effects for poor in developing
countries. Higher the transmission of global shocks to local markets, more the poor
households will be harmed by global price shocks.
Analyzing short-run poverty impacts of the 2010-2011 global food price increase was a
primary focus for Maros Ivanic et al9. Study assessed poverty impacts for 28 middle and low
income countries. Authors estimated that as a result of 2010-2011 food crises additional 44
million people fell below the extreme poverty line of USD 1.25 per day. Poverty impact of
the food crises was different for low and middle income countries. On average, poverty
increased by 1.1 percentage points for low and 0.7 for middle income countries. Positive
income effect for net sellers of the food products was vastly dominated by the negative
impact of food price increase for net buyers of the food products.
For the assessment of poverty impacts of a food price shock paper takes into account
households’ net buyer/seller status, authors also allow for substitution of more expensive
foods by cheaper substitutes. Calibration of substitution effects is made possible by using
Constant Difference of Elasticities (CDE) demand system estimated for 112 countries.
Above mentioned study also includes several post-soviet countries, which make it
particularly interesting for the purposes of this research. Headcount poverty in Armenia was
estimated to have increased by 0.67 percentage points. Increasing prices of potatoes,
sugar, oils and fats were main reason for increasing headcount poverty in Armenia. As most
of the poor families in Armenia are net buyers of the food products, positive impact
experienced by net sellers of these goods could not offset the negative impact for poor
households significantly. Unfortunately, study excludes Georgia, however due to many
similarities between Armenia and Georgia, we can hypothesize that poverty impacts for
Georgia could have been similar to what was estimated for Armenia.
9 “Estimating Short-run Poverty Impact of 2010-2011 Surge in Food Prices”, Maros Ivanic, Will Martin and Hassan
Zaman, World Bank, 2011

15
The only country, which benefited from the food prices surge in 2010-2011 appeared to be
Vietnam, Many of the families in Vietnam are net sellers of the food products (mostly rice).
III. Data and Methodology
Time series for domestic food prices is retrieved from the database of National Statistics
Office of Georgia (Geostat). Geostat collects monthly price series for all types of food
products that are included in the consumer basket. Dataset covers monthly series starting
from January 2004 till May 2014, 125 entries for each series of prices. Data on international
prices is obtained from the World Bank datasets. Dataset includes US wheat price series,
World sugar prices, prices of crude oil10, beef, pork and chicken meat prices. All prices are
normalized so that December 2013=100 for all domestic and international prices.
The most common problem about the prices data is the non-stationarity of series11, which
means that price series usually have increasing trend overtime. Non-stationary price series
might lead to a spurious regression and significantly distort the results of econometric
analysis. There are several ways to cope with the non-stationary data: if price series are
integrated of the order one, than difference of the series will give stationary data, Vector
Error Correction model represents another way to deal with the non-stationary data if the
series contain unit root.
First step in price transmission analysis is to check whether the domestic and global prices
have long-run relationship that is to check if prices are co-integrated. Table 4 summarizes
Johansen cointegration test results for different food products
10
Average of Brent and Dubai crude oil prices 11
Graphical Description of the data can be found in Appendix 1

16
Table 4: Summary of Johansen Unrestricted Cointegration Rank Test (Trace, linear
deterministic trend allowed)
Pair of Prices Number of CEs at 5% significance
level
Domestic White Bread Price and US wheat Price 1
Domestic Wheat Flour Price and US Wheat Price 2
Domestic Sugar Price and World Sugar Price 2
Domestic Maize Price and World Maize Price 2
Domestic Beef Price and World Beef Price 0
Domestic pork price and USA frozen pork export
Price
0
Domestic chicken price and Brazil chicken export
Price
0
Johansen cointegration test results show significant long-run relationship between domestic
price of white bread and US price of wheat, as well as for the prices of sugar and maize.
Test could not reveal significant long-run relationships between global and domestic prices
of beef pork and chicken, which implies that in the long run prices of meat product locally
are determined by factors other than global meat product prices. These other factors might
be domestic regulations for meat production (sanitary standards etc.), trade regulations as
well as other trade and transport related regulations. For this reason study leaves out prices
of beef, pork and chicken from further analysis.
In order to analyze short-term transmission of global food prices to domestic markets, paper
will employ Unrestricted VAR model. As already mentioned VAR rests on the assumption of
stationary data series, however all of the price series are integrated of order one. For this
reason VAR methodology cannot be directly applied to the price series.
To deal with the non-stationary of the series, we choose to use first differences in the VAR
analysis. Differencing the price series removes long-run trend from the data and allows
capturing short-run co-movement of local and global prices in a more robust way.
On top of that, we had to take account of the fact that domestic prices are denominated in
GEL and foreign prices are denominated in USD. To make the domestic and international
data comparable, we multiply all domestic prices by the monthly average USD/GEL

17
exchange rate and transform all prices in USD. This way study manages to control for the
effects of the exchange fluctuations in determining domestic prices of imported food
commodities.
In addition, to analyze month-on-month growth rates of prices, series are transformed to
logarithms and first-differenced. Therefore, coefficients from obtained from the regression
represent elasticity of domestic prices to changes in global prices.
In order to investigate international-domestic price transmission more thoroughly, paper
employs Vector Auto Regression Model (VAR), which is most widely used in the relevant
literature. VAR model has following specification:
Where:
- Vector of endogenous variables
- Vector of intercepts
- Matrix of coefficients of endogenous variables
- Vector of residuals
Using the above specification of the VAR model first will be estimated price transmission for
the cereal products and sugar. Endogenous variables include: domestic and world price
indices for sugar, US wheat price index, price index for wheat products12 on domestic
market, price index for other cereal products13.
Model satisfies stability condition, which is crucial to ensure that after the initial shock is
introduced in the model all variables gradually return to their initial levels.
12
Wheat flour and white bread 13
Other cereal products include: pasta, buckwheat, maize flour
18
IV. Results of the VAR Analysis
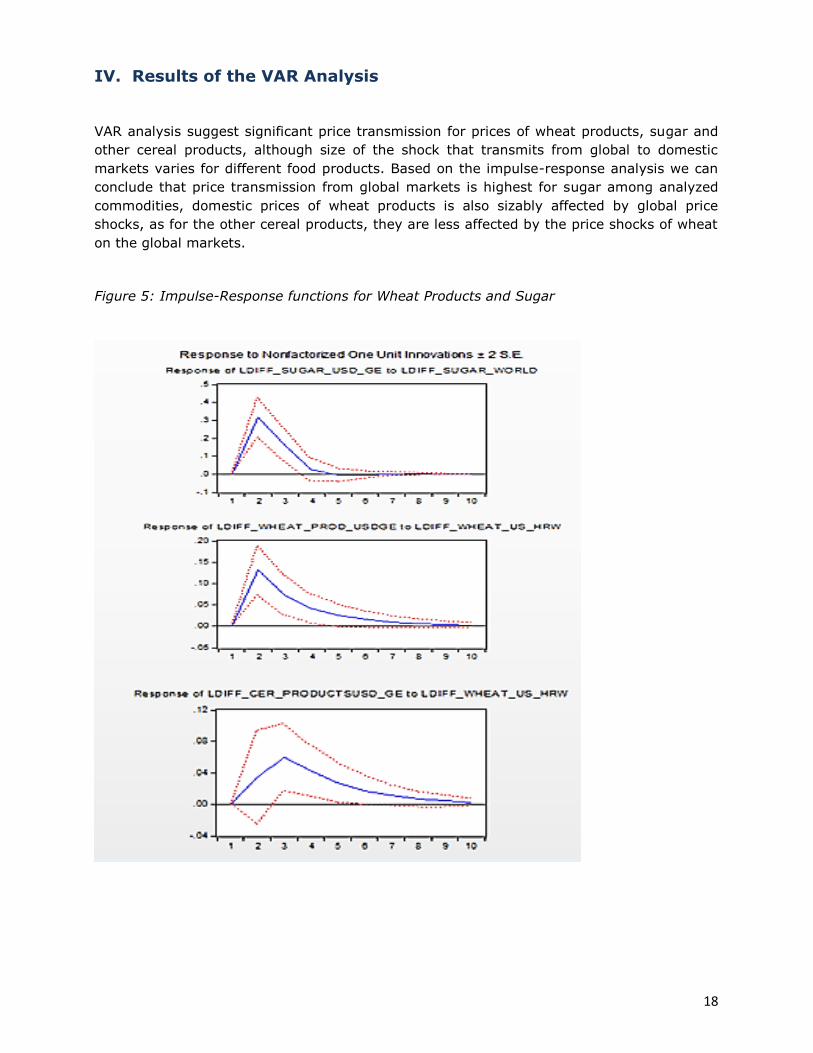
VAR analysis suggest significant price transmission for prices of wheat products, sugar and
other cereal products, although size of the shock that transmits from global to domestic
markets varies for different food products. Based on the impulse-response analysis we can
conclude that price transmission from global markets is highest for sugar among analyzed
commodities, domestic prices of wheat products is also sizably affected by global price
shocks, as for the other cereal products, they are less affected by the price shocks of wheat
on the global markets.
Figure 5: Impulse-Response functions for Wheat Products and Sugar

19
Figure 5 shows the reaction of domestic prices to the shocks in international prices. Shock is
equivalent to 1 percentage point increase in international prices. Red dotted lines depict
95% confidence interval around the reaction function of domestic prices.
As impulse-response functions suggest local prices of wheat products respond positively to
increases in the international prices of wheat (left lower chart). Domestic wheat products
prices reaction reaches its maximum 2 months after the initial shock and this effect is
statistically significant at 95% confidence level. 1 percentage point increase in US prices of
wheat translates into 0.13 percentage point increase in domestic prices for wheat products.
Transmission is much more pronounced in case of sugar (left upper chart), 1 pp shock in
international prices increases domestic price of sugar by 0.32 pp. effects reaches its
maximum after 2 months and then it starts to vanish after 3 periods.
Transmission of global wheat price shock to the prices of cereal products is also statistically
significant. Composite price of cereal products, such as pasta, rice, buckwheat and maize
flour, increase by 0.06 percentage points 3 months after the initial shock in global wheat
prices(right lower chart). Transmission of global wheat price shocks to cereal products is
quite moderate in size, which might be due to other factors that are more important for the
determination of these prices or low substitution effect between wheat products and other
cereal products in Georgia.
VAR analysis confirms initial hypothesis about the higher global to local transmission of price
shocks for the products which are mostly imported on domestic market. Study finds
significant and sizeable global to local price transmission for wheat products and sugar,
which represent most important food commodities for the average household living in
Georgia. We found statistically significant, although very low transmission of prices for other
cereal products (pasta, buckwheat, maize flour), which suggests that prices of these
commodities are not significantly influenced by the global shocks of wheat prices.

20
V. Welfare Impact of Global Price Shock to domestic consumers
Given high share of food expenditures in total expenditures of poor families in rural as well
as in urban areas, food price shocks are likely to significantly worsen the economic
conditions for most vulnerable part of Georgian population. According to the IFPRI’s Global
Hunger Index14, designed to assess food security vulnerabilities in different countries,
Georgia lags behind all of the post-soviet countries with the exception of Tajikistan. As of
2013, according to the GHI index Georgia entered in the group of countries with “Moderate”
risk of hunger and scored only slightly better than the countries with “Serious” risk of
hunger. Although, food security situation in Georgia is not alarming, it is still worse than in
all of the Eastern European countries and most of the Post-Soviet states according to the
GHI index. Even short term increase in food prices, as it happened in 2007-08 and 2010-
11, can result in malnutrition of children and nursing mothers with potential negative long
term impact on children’s physical and mental development. In order to have a better
understanding of potential negative monetary impacts of potential future food prices shock
over the expenditures of Georgian households with different socio-economic characteristics,
paper will try to replicate 2008-07 and 2010-11 food prices shocks and quantify possible
increase in households’ expenditures were these shocks to repeat in the future.
In order to estimate the impact of the food price increases on the expenditures of
households with different socio-economic characteristics, paper imposes food price shock,
similar to the food crises in 2007-2008 and 2010-2011 food crises.
Detailed data on expenditures for different foodstuff for Georgian households is obtained
from Geostat’s household survey databases. To assess the welfare implication of the two
global price shock that occurred in previous years paper proceeds the following way:
First, expenditures of households from different income groups in rural and
urban families for different food products is obtained
Next, increase of domestic prices for different food products during the two
food crises period (2007-08 and 2010-11) is calculated
Finally, we measure by how much expenditures of household would have been
increased, were they to maintain similar level of food consumption as they had
in 2013 if prices of different foodstuff increased by as much as during two
previous crises episodes
14
http://www.ifpri.org/book-8018/ourwork/researcharea/global-hunger-index

21
This approach has several limitations that may influence results of the analysis in a
significant way. Paper only analyses the losses suffered as a result of price increase,
however households that are net sellers of food products may benefit from the increased
prices. Analysis also cannot account for the substitution effect between different food
products. Increased prices of meat products might force households to switch to alternative
products; however, due to the insufficient data, analysis ignores substitution effect. This
might lead to an overestimation of negative welfare impact for households.
Numbers given in the tables below are calculated based on the assumptions above.
Interpretation of the findings presented in the table below is following: if prices of different
food products changed as much as they did over the period from 04.2007 to 04.2008 and
04.2010-04.2011 by how much the expenditures of household with different socio-economic
characteristics would increase in 2013, were they to maintain identical consumption basket.
Source: Geostat source: Author’s calculations
Source: Geostat Source: author’s calculation
Income
group
Increase in expenses
(GEL, 2007-2008 food
crises)
Increase in expenses (%
of total expenses, 2007-
2008 food crises)
Urban Rural Urban Rural
0-150 5.4 14.7 3.3 7.8
150-200 7.2 14.6 3.4 7.9
200-250 5.8 15.5 2.3 5.8
250-300 3.8 13.8 1.3 4.5
300-400 6.0 18.5 1.6 4.7
400-500 10.0 16.3 2.2 3.4
500-600 10.3 18.7 1.9 3.1
600-700 9.9 16.8 1.5 2.4
Table 5: Increase of price on food in the
period of 2007.04 -2008.04
Table 7: Additional expenditures of domestic households
of crises of 2007-08 repeats
price increase from
2007.04 till 2008.04
Bread and flour 37%
Meat products 12%
Seafood -3%
Dairy products 17%
Oil 83%
Vegetables -59%
Sugar -5%

22
Source: Geostat Source: Author’s calculations
Several conclusions can be made from the findings given in the tables above:
If crisis of 2007-08 were to repeat, rural households will suffer more than urban
households. Cost of the crises similar to 2007-2008 will be negligible for urban
households. This finding is partly influenced by the fact that over the period from
04.2007-04.2008 prices of vegetables drastically declined (-58.5%) in Georgia.
Positive impact on expenditures coming from the reduced prices of vegetables
balanced negative impact of rising wheat products prices. Balancing effect was more
pronounced for urban households, as they spend higher share of their total food
expenses on vegetables, rural households mainly produce vegetables for their own
consumption.
If crisis identical to the 2010-2011 will be repeated households both in rural and
urban areas will be harmed more. As already mentioned, 2010-2011 food crisis was
more broadly based and it affected prices of almost all food products.
If prices of food products will be increased as much as during 2010-2011 rural
households with monthly income below 200 GEL will be harmed most, these
households will require additional 12% of their incomes to maintain the same level of
Table 7. Price Increase in food
products from 2010.04 till 2011.04
Table 8. Additional expenditures of domestic
households if crises of 2010-11 repeat price increase from
2010.04 till 2011.04
Bread and flour 22%
Meat products 36%
Seafood 10%
Dairy products 24%
Oil 42%
Vegetables 10%
Sugar 20%
Income
group
Increase in expenses
(GEL, 2007-2008
food crises)
Increase in expenses
(% of total expenses,
2007-2008 food
crises)
Urban Rural Urban Rural
0-150 17.0 22.3 10.3 11.8
150-200 20.7 22.4 9.7 12.1
200-250 27.6 23.8 10.8 8.9
250-300 29.1 25.6 9.7 8.4
300-400 36.2 31.1 9.5 8.0
400-500 39.8 31.0 8.8 6.4
500-600 47.8 32.8 8.8 5.5
600-700 50.4 37.5 7.9 5.4

23
food consumption as in 2013. For the higher income groups, urban households will
have to spend more additionally to maintain the levels of consumption similar to the
levels in 2013
Analysis also reveals that, urban households are more vulnerable to the vegetable and
dairy price shocks as compared to the rural households, which are in most cases self-
sufficient in these food products and can partially insulate themselves from vegetable
price shocks. On the other hand, rural households are more vulnerable to the price
shocks of fats, oils and sugar price shocks.
Conclusion
Food prices transmission from global to local markets has been extensively studied following
the two food crises in 2007-08 and 2010-11. Most of the research was focused on exploring
welfare implications of global shocks for the local households to elaborate policy
recommendations to mitigate damage of these shocks. For the case of Georgia, price
analysis for wheat products, sugar and other cereals revealed significant transmission of
global shocks to local prices. 1 PP increase in global wheat prices results in 0.13 PP increase
in prices of domestic wheat products (bread and wheat flour). Prices transmission is
significant for the case of sugar as well – 1 PP global shock in sugar prices results in a 0.32
PP increase in domestic prices of sugar. In other words, almost third of the global price
shock of sugar is transmitted to local markets. Global wheat prices also significantly
transmit to local prices of other cereal products (pasta, buckwheat etc). However the size of
the transmission is limited, probably due to many other factors, which play role in the price
formation process of these food products. Price transmission of the above mentioned
products reaches its maximum in two-three months after the global shock.
Simulation of 2007-08 and 2010-11 price shocks revealed that Georgian households will be
harmed more if the crises similar to 2010-11 repeats. Quantitative analysis, based on the
Household Survey data from National Statistics Office showed that, Georgian rural
households with monthly income less than 200 GEL will require around 12% more spending
on food consumption to maintain the pre-crises consumption levels. The same figure is
about 10% in case of urban households with less than 200 GEL of monthly income. For the
higher income groups, urban households will be harmed more than rural households as a
result of a crisis. Analysis also showed that urban households are more vulnerable to the
price shocks of vegetable and dairy products, whereas rural households will be harmed more
by sugar and oil products prices shock.
24
Food Security Policy Recommendations
In a world with volatile food prices, there is an urgent need for well-designed food security
policy, which will envisage short term as well as long term policy responses to food security
challenges in Georgia. As demonstrated by IFPRI’s Global Hunger Index, Georgian
population is one of the most vulnerable to hunger risks among Eastern Europe and Central
Asian countries.
Despite the tangible risks related to the food security of the population, current food
security policy of the state is very general and does not define possible reaction of the state
if the food crisis happens in the country. As reported by the Ministry of Agriculture of
Georgia, food security will be one of the components of the “Agricultural Development
Strategy for 2014-2020”15, however the exact design of the strategy is not known yet.
When talking about the food security policy, it is essential to distinguish between short term
and long term measures. In the long term, best response to the food security vulnerabilities
is the strong growth of agricultural production and increasing productivity of agro-workers
as well as robust economic growth in general. Long term food security is a complex issue,
related to almost all types of economic policies of the government. In the scope of this
study, we will discuss policies that are essential to strengthen food security in the short
term.
Short term challenges of food security are often overlooked by the government policies,
however the consequences of the short term crises are no less severe. Malnutrition caused
by short term adverse shocks threatens proper mental and physical development of
underage children, and can create significant long term consequences for development.
Moreover, it might lead to the permanent poverty of poor families because often they begin
to sell their assets to finance their increased current consumption expenditures.
For the effective short term policy design, it is of crucial importance to understand better
the vulnerabilities of different groups of population. The paper provided first idea of which
types of families are more vulnerable to short term price fluctuation. For the future
research, more narrow analysis will provide evidence to produce quantitative
recommendations for effective short term policies. Based on the findings of this study
together with the survey of international best practices, recommendations for the effective
food security policy can be summed up in three main points:
15
http://moa.gov.ge/index.php?menuid=17&lang=1&id=209#.VAwDwfmSyyo

25
Establishment of comprehensive food security information system
Development of early warning systems
Implementation of aid programs for most vulnerable groups of population
Food Security Information Systems
In most of the EU countries, food security policy was built on the basis of information
systems16. These instruments provided timely and accurate information regarding the
structure of food expenditures of households across regions and income groups, as well as
information on prices, exports, imports and stocks of food products. International practice17
suggests to ground food security information systems on three basic pillars:
data on availability of domestic food products;
data on stability of food provision;
data on access to food products.
Data on availability of domestic production of food products should contain information
on production levels (plant, animal, fisheries), on availability of agricultural inputs
(seed, fertilizer, pesticides, agricultural equipment) as well as areas of production
surplus and deficit. This information is regularly collected and reported by National
Statistics Office, so it will not take additional resources to incorporate these data into
the food security information system.
Data on stability of food provision should contain information on food prices from
domestic as well as from global food markets. In addition to that, countries that
represent main trade partners of Georgia in food products should be surveyed on
regular basis to keep track of food price developments in these countries. Data on
export/import of food products as well as supplies for food production and their
breakdown across main trade partners should constitute main part of the second pillar
of the food information systems. Several countries (Chad, Senegal, Cameroon) also
include information regarding commercial and trade regulations in main trade partner
16
WHO, Comparative Analysis of Nutrition Policies in EU Member States, 1996 17
Handbook for Defining and Setting up a Food Security Information and Early Warning System (FSIEWS), FAO,
2000

26
countries, which might provide a valuable input for the possible developments in trade
volumes and prices of foodstuff on domestic markets.
Data on nutritional status of population with highest vulnerabilities (poorest families in
rural as well as urban areas, children and women from economically deprived families
etc) and dietary habits of these groups of population. Data on food expenditures,
which should be the part of the first pillar of food security information system, might
not adequately reflect nutritional status of vulnerable families, for this reason
additional information regarding the calories intake should be included in the third
pillar of food security information system. This type of information is not readily
available in Georgia and thus having it will require additional surveys to be conducted
among risk groups. It is also of crucial importance to collect and analyze information
regarding dietary habits of vulnerable groups of population, in order to understand how
families adjust their menu in times of various food supply shocks.
Once the food security information in complies with this standards is in place, it will give the
possibility to carefully forecast price developments on domestic markets as well as to
identify groups of population which will be harmed most in case of adverse developments on
food markets.
Early Warning Systems
Based on the information systems it will be possible to generate several indicators, which
will serve as an early warning against the possible adverse developments in food production
(global as well as local) and price trends on domestic markets. Possible indicators for early
warning systems, as suggest by the FAO, might include for example 25% increase in price
or 25% decline in production levels of various food products. These indicators and
benchmark levels of indicators vary country by country and selecting the particular
benchmark levels of prices or production completely depends on the country characteristics.
The exact design of early warning systems must be the subject of further discussion in order
to come up with the appropriate indicators and benchmark levels of those indicators.
As shown by the VAR analysis above, it takes around two months until global price shocks
on staple foods fully transmit to domestic markets. This finding suggests that if price
fluctuations are identified in a timely manner on global as well as on main trading partner
country markets, it will be possible to use it as an early warning and assess the influence on
domestic food markets beforehand. Having information in advance will enable to conduct

27
proactive food security policy and plan possible steps ahead to alleviate adverse influence on
most vulnerable households.
Implementation of Food Subsidy Schemes
As a response to food price shock in 2008-07, 23 countries increased cash transfers, 19
countries activated food support programs and 16 countries introduced other measures
targeted to increasing disposable income of population (FAO, 2009). There is no “one-size-
fits-all” approach when talking about food assistance schemes, each of the method has its
own shortcomings and advantages. Despite the wide variety of measures that can be
applied to assist vulnerable population in case of sharp shocks on food markets, there is a
widely agreed consensus, government should take active role when the most vulnerable
groups of population are at risk of hunger, in order to avoid possible negative long term
consequences for health and development. There are three main types of assistance
programs that can be used in Georgia in times of food crises:
cash transfers,
food vouchers,
food price subsidies.
Cash transfer is a very widely used tool of food assistance because of low administration
costs and more flexibility beneficiaries of assistance programs. Usually cash transfers are
conditional upon complying certain predefined rules. For example, government can make
participation in health or education programs necessary precondition for receiving cash
transfers, thus, achieving certain human development goals along with the increased food
security. It is important to note, that cash transfers are effective only if food markets
function properly. If there is a shortage of particular good in the food market, then cash
assistance might result in higher food inflation.
Food vouchers have advantage against direct cash transfers. They can be targeted better
and can be restricted to certain types of food products in order to ensure appropriate caloric
intake. Yet food voucher programs are more costly to plan and administer, compared to
cash transfers.
Food price subsidies usually are not recommended, because they are costly, difficult to
remove and not well targeted to the poorest groups of population. (WB 2008)

28
FAO generated list of lessons learned as well as recommendations for design of effective
food security programs, based on the experience from 2007-08 food crises:
Evidence shows that households receiving social transfers spend more on food and
tend to experience less hunger, leading to increase in food security. In particular,
vulnerable categories, such as children tend to be better nourished (Samson et al.
2006; Adato and Basset 2008). Moreover, transfers may increase productive
activities of the households.
It is beneficial to make short-term social protection measures accessible to meet
immediate needs of vulnerable households and to improve their access to food and
nutrition support. However, in order to build long-term resilience and fully address
the food crisis, it is necessary to develop, in parallel, sound safety net systems,
strengthening national design and implementation capacity for social protection (WB
2008; UN HTLF 2008). Previous experience can be basis for effective food security
policy to address the potential short-term crises.
Targeting the most vulnerable groups is essential for ensuring well designed safety
net programs. However, costs and benefits of accurate targeting need to be
carefully considered, particularly during a crisis (Ravallion 2008).
It is important to define monitoring and evaluation systems to assess the
performance of safety net programs for scaling up on larger social groups, as well as
setup good accountability and control mechanisms.
Safety net programs need to be flexible in the use of tools and resources, thus
enabling them to adapt rapidly to changing circumstances and improve coverage to
allow more people to benefit from them during a crisis.
It is important to consider the interactions between safety nets and agricultural and
rural development interventions to build on potential synergies and to avoid having
either type of intervention undermine the other. Specific nutrition and health
interventions, as a complement to social protection programs, might be needed, as
well as safety net measures envisaged in favor of producers (FAO 2011; WB 2008).

29
References
Cudjoe, Godsway, Clemens Breisinger, and Xinshen Diao. "Local Impacts of a Global Crises:
Food Price Transmission and Poverty Impacts in Ghana." IFPRI, no. 00842 (2008). Accessed
July 12, 2014.
Ivanic, Maros, Will Martin, and Hassan Zaman. "Estimating the Short-Run Poverty Impacts
of the 2010–11 Surge in Food Prices." World Development, 2011, 2302-317.
Von Braun, Joachim, and Getaw Tadesse. "Global Food Price Volatility and Spikes: An
Overview of Costs, Causes, and Solutions." ZEF Discussion Papers on Development Policy
161 (2012). Accessed July 1, 2014.
Minot, Nicholas. "Transmission of World Food Price Changes to Markets in Sub-Saharan
Africa." IFPRI Discussion Paper 01059 (2011). Accessed June 1, 2014.
Martin Ravallion, 2008. "Global Poverty Reassessed: A Reply to Reddy," One Pager 66,
International Policy Centre for Inclusive Growth.
William H. Meyers, Jadwiga R. Ziolkowska, Monika Tothova, and Katerina Goychuk, 2012.
“Issues Affecting the Future of Agriculture and Food Security for Europe and Central Asia.”
Policy Studies on Rural Transmission

30
.30
.35
.40
.45
.50
.55
.60
.65
.70
04 05 06 07 08 09 10 11 12 13 14
Domestic Price of Bread (USD)
40
60
80
100
120
140
160
04 05 06 07 08 09 10 11 12 13 14
US price of wheat
0.2
0.3
0.4
0.5
0.6
0.7
0.8
0.9
1.0
04 05 06 07 08 09 10 11 12 13 14
Domestic Price of Sugar (USD)
80
100
120
140
160
180
200
220
04 05 06 07 08 09 10 11 12 13 14
US price of sugar
.1
.2
.3
.4
.5
.6
.7
04 05 06 07 08 09 10 11 12 13 14
Domestic price of beef (USD)
2,800
3,200
3,600
4,000
4,400
4,800
5,200
5,600
6,000
6,400
04 05 06 07 08 09 10 11 12 13 14
BEEF_US
.2
.3
.4
.5
.6
.7
.8
04 05 06 07 08 09 10 11 12 13 14
Domestic Price of Pork (USD)
Appendix
1,600
1,800
2,000
2,200
2,400
2,600
2,800
3,000
3,200
04 05 06 07 08 09 10 11 12 13 14
US price of pork

31
KONRAD-ADENAUER-STIFTUNG Regional Program Political
Dialogue South Caucasus
Tel.: +995 32 2 45 91 11 Fax: +995 32 2 24 01 03 E-Mail: [email protected]
E.Akhvledianis Agmarti 9a
0103 Tbilisi Georgia
http://www.kas.de/suedkaukasus/
Policy and Management Consulting Group – PMCG
Tel: (+99532) 2982 495, 2921 171
Fax: (+99532) 2921 181
E-mail: [email protected]
57 Uznadze Street, 4th floor
Tbilisi 0102, Georgia
http://www.pmcg-i.com/