policy-level improvement and institutionalization of … · policy-level improvement and...
TRANSCRIPT
306
Policy-level Improvement and Institutionalization of Field-level Trials:
Achievement of Third Elementary Education Project in the Philippines
Izuru Kimura1
Japan Bank for International Cooperation (JBIC)2
July 2008
Abstract: This paper introduces key devices to sustain impacts of development assistance by taking
a case study on a Third Elementary Education Project (TEEP) in the Philippines. TEEP targeted
twenty-three poverty-affected provinces to improve quality of elementary schools. Through
TEEP’s implementation, students’ academic achievement and the completion rate of the target
provinces were significantly improved. Department of Education recognized TEEP as a
“nationwide laboratory,” after its mid-term review, to improve the entire elementary education.
Among TEEP’s various trials in the field, some significant devices, such as School Based
Management, were institutionalized at the policy level at the end of the project.
Key Words: East Asia, Philippines, elementary education, student achievement, development
assistance, institution
1. Introduction
1.1 TEEP as a “Nationwide Laboratory”
Third Elementary Education Project (TEEP) is a nine-year public investment program
(1998-2006) of the Department of Education (DepEd) in the Philippines with external financing
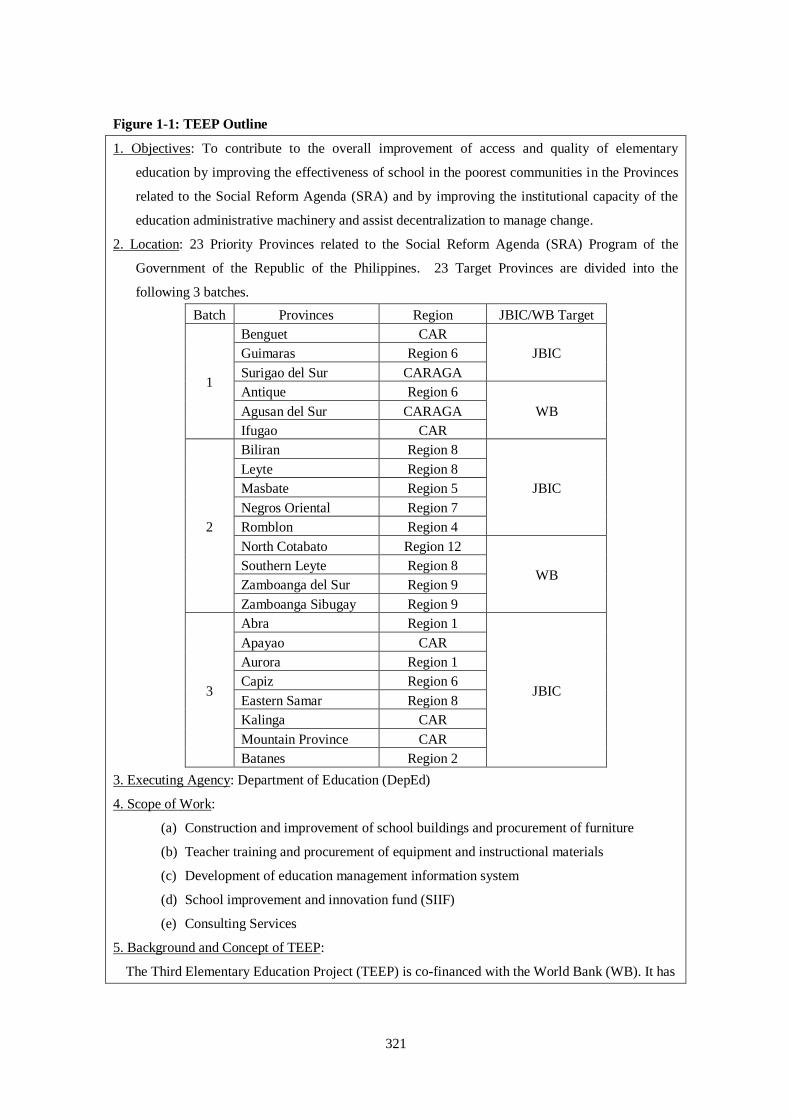
from the World Bank and the Japan Bank for International Cooperation (JBIC) (Figure 1-1). TEEP
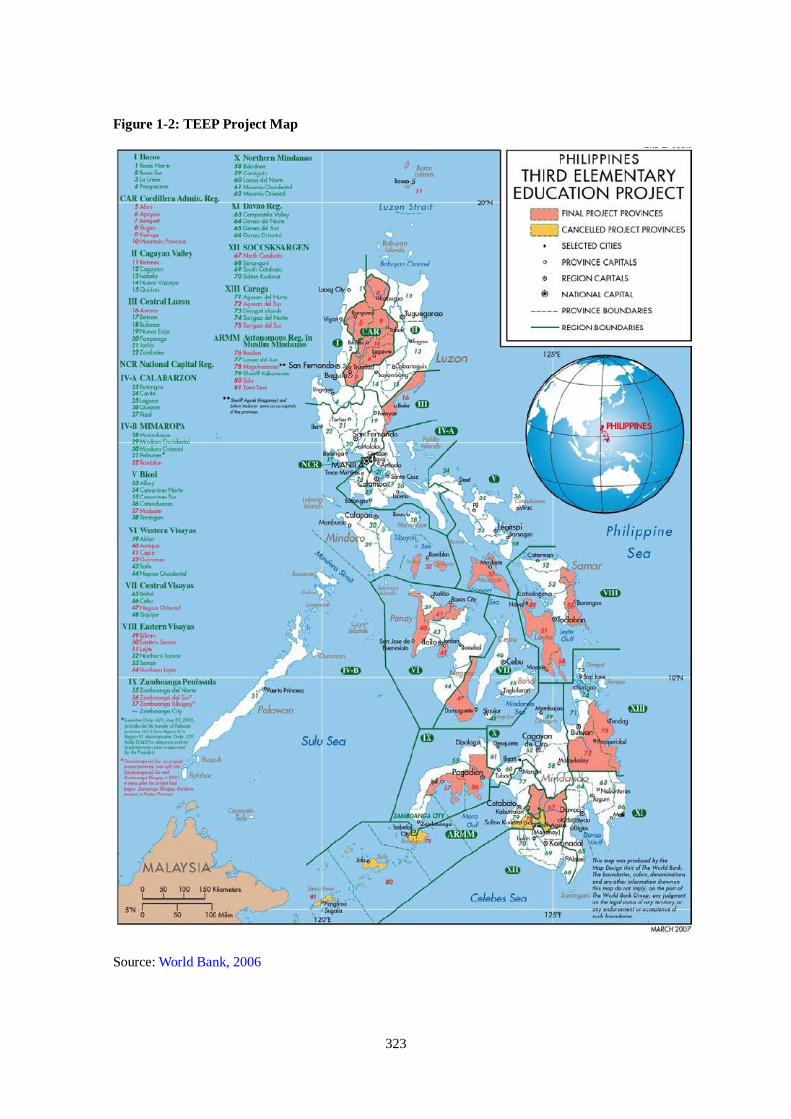
targets twenty-three poverty-affected provinces3, out of seventy-nine provinces in the country, with
full participation of the Local Government Units (LGUs) (Figure 1-2). The main goal of TEEP is
to improve the education quality through decentralization by providing multiple school inputs such
as classroom facilities, textbooks, teacher training, and school management enhancement.
1 Japan Bank for International Cooperation (JBIC)、1-4-1 Ohtemachi, Chiyoda-ku, Tokyo, 100-8144, JAPAN. (Tel)
+81-3-5218-3585, (Fax) +81-3-5218-3969, e-mail: [email protected]. 2 This paper is based on the findings and discussions of the author. The views
expressed in this paper are those of the author and do not necessarily represent the official position of the JBIC.
3 20 target provinces of TEEP were the prioritized provinces under the Social Reform Agenda (SRA)
set by the Ramoz Administration, and the rest were selected by TEEP taking into consideration the
provincial socio-economic indicators. The number of target provinces was originally 26, but finally
23 provinces were covered since 3 WB-target provinces were excluded during the implementation.
307
Specifically, TEEP aimed to (i) improve learning achievements, completion rates, and access to
quality elementary education; (ii) build institutional capacity of Department of Education (DepEd) to
manage change; and (iii) actively involve the community and local government in a large-scale
effort to attain quality education (DepEd, 2005).
Moreover, TEEP was intended to be a “nationwide laboratory” for reforms that involves
planning by the stakeholders, social targeting, decentralization, and school focused and
information-based decision making. In other words, DepEd tried to make institutional change by
developing capacity of stakeholders through TEEP. In 2006, TEEP was completed with many
development outcomes and rich implications on both policy and field practice. With such results,
TEEP is considered not only as a “nationwide laboratory” but also as a “catalytic device” for
elementary educational development.
It was from 2001 to 2005 that TEEP was accelerated much with strong ownership and
leadership of the management of DepEd. In 2001, the mid-term review of TEEP was conducted.
Based on the findings of the review, TEEP’s design, in terms of project management, and some
components were correctively restructured. The then Undersecretary of DepEd was the one who
recognized TEEP as a “catalytic devics” as well as a “nationwide laboratory,” considering TEEP’s
coverage and potential impact, and kept encouraging the staff to fully activate all the stakeholders
through implementation of TEEP. Consequently, this paper picks up TEEP, mainly focusing on the
period of 2001-2005, as a case study to examine effective devices to enhance and to sustain the
impact of development by identifying some key aspects that contributed to the policy improvement
and institutional change.
1.2 What Did TEEP Change?
TEEP’s approach was to improve comprehensively the educational environment in the
target provinces by providing various inputs. Aiming to improve quality, access, and management
of elementary education, TEEP’s inputs were categorized into three major components: (i) education
development; (ii) civil works; and (iii) finance and administration. In concrete, each component
had the following inputs:
(i) Education Development Component: This component provided (a) in-service training of
education staff (school head, teacher, DepEd administrative staff), (b) the School Improvement
Innovation Facility (SIIF), a grant facility for funding specific school improvement initiatives, (c)
textbooks and supplementary materials, (d) school kits, (e) equipment, (f) and furniture. After the
mid-term review in 2001, School-Based Management (SBM) was added to this component.
(ii) Civil Works Component: This component provided classroom and DepEd administrative office
facilities. Almost all schools in the target provinces were planned to have at least one classroom
facility constructed or repaired by TEEP. TEEP required ten-percent of LGUs’ equity for the
school building program.
308
(iii) Finance and Administration Component: This component provided teachers and staff of DepEd
and LGUs with technical assistance to improve their management of procurement, finance, and
project monitoring. It also provided the Education Management Information System (EMIS) to
strengthen the monitoring and evaluation function of DepEd.
After the completion of TEEP, it was reported by the World Bank (2007) that 5,397
classrooms were constructed, 17,110 classrooms were repaired, and 62,251 teachers, school heads,
and district supervisors underwent various in-service training. Physical accomplishment of TEEP
is visible everywhere in the target provinces, but more remarkable result was the impact on students’
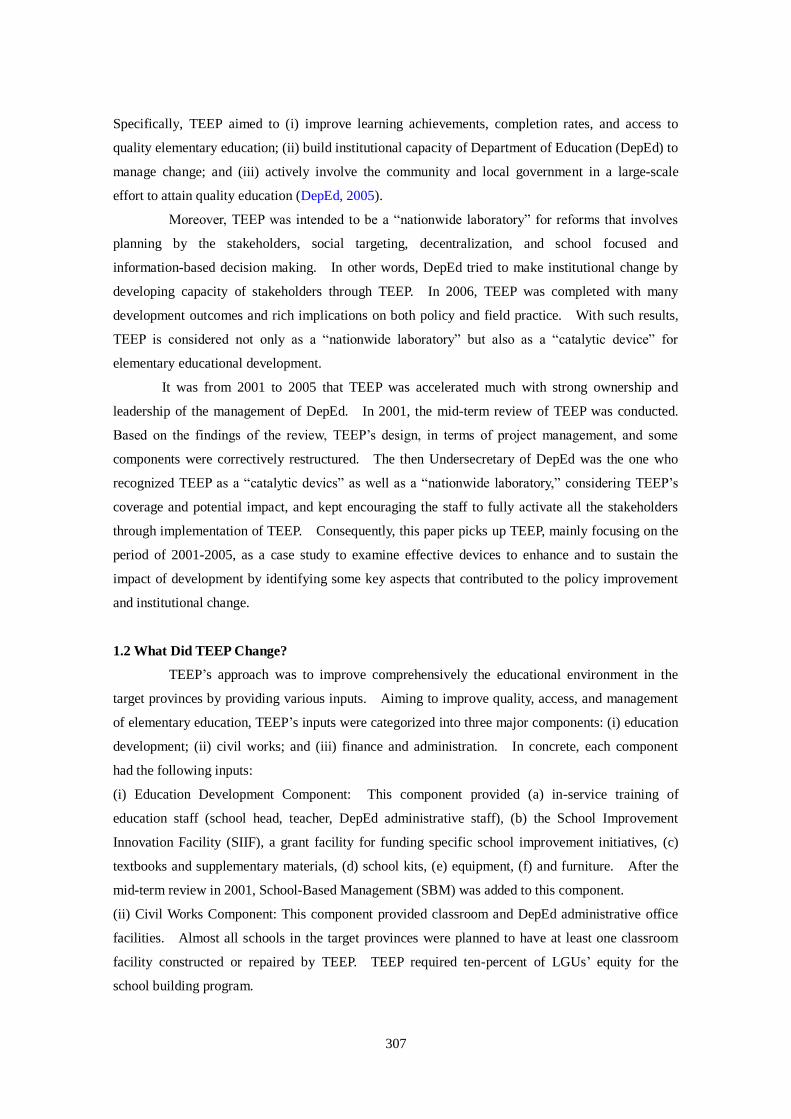
academic achievement and completion. TEEP schools performance in the learning areas tested
(English, Math, Science, Filipino) in Grades 2, 4 & 6 improved significantly as measured in the
National Sample-Based Assessment (NSBA) between its baseline year (1999) and final year of
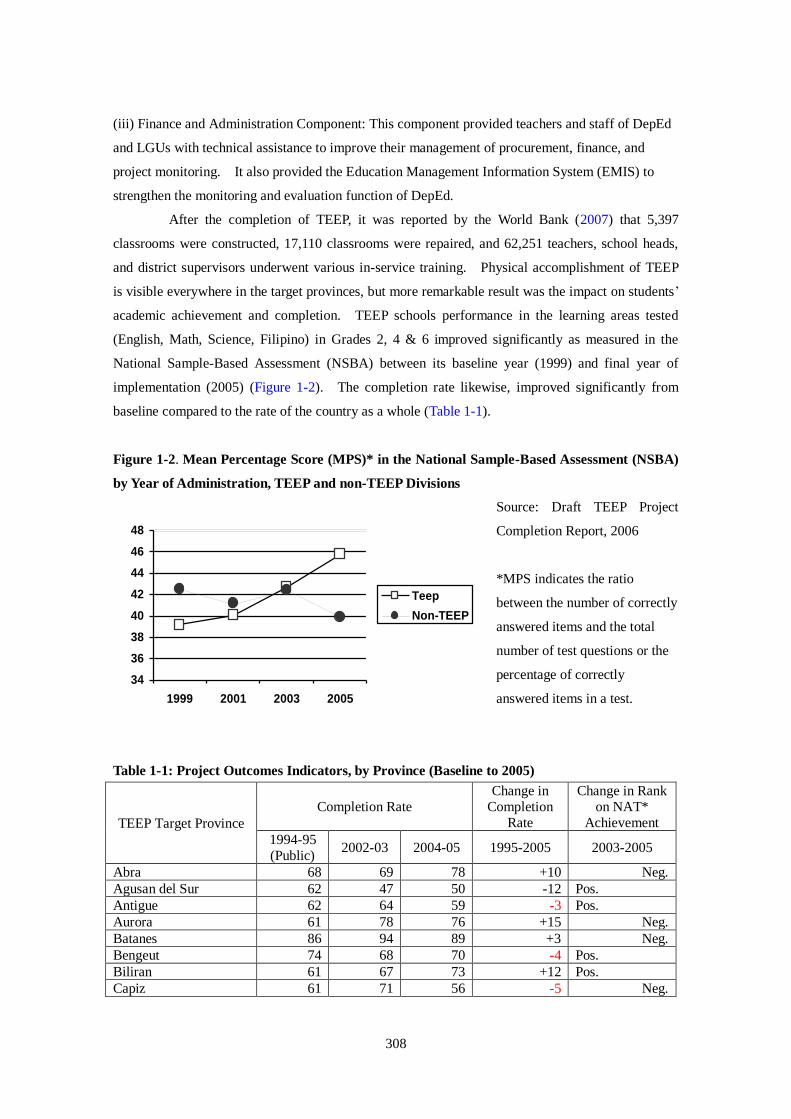
implementation (2005) (Figure 1-2). The completion rate likewise, improved significantly from
baseline compared to the rate of the country as a whole (Table 1-1).
Figure 1-2. Mean Percentage Score (MPS)* in the National Sample-Based Assessment (NSBA)
by Year of Administration, TEEP and non-TEEP Divisions
Source: Draft TEEP Project
Completion Report, 2006
*MPS indicates the ratio
between the number of correctly
answered items and the total
number of test questions or the
percentage of correctly
answered items in a test.
Table 1-1: Project Outcomes Indicators, by Province (Baseline to 2005)
TEEP Target Province
Completion Rate
Change in
Completion
Rate
Change in Rank
on NAT*
Achievement
1994-95
(Public) 2002-03 2004-05 1995-2005 2003-2005
Abra 68 69 78 +10 Neg.
Agusan del Sur 62 47 50 -12 Pos.
Antigue 62 64 59 -3 Pos.
Aurora 61 78 76 +15 Neg.
Batanes 86 94 89 +3 Neg.
Bengeut 74 68 70 -4 Pos.
Biliran 61 67 73 +12 Pos.
Capiz 61 71 56 -5 Neg.
34
36
38
40
42
44
46
48
1999 2001 2003 2005
Teep
Non-TEEP
309
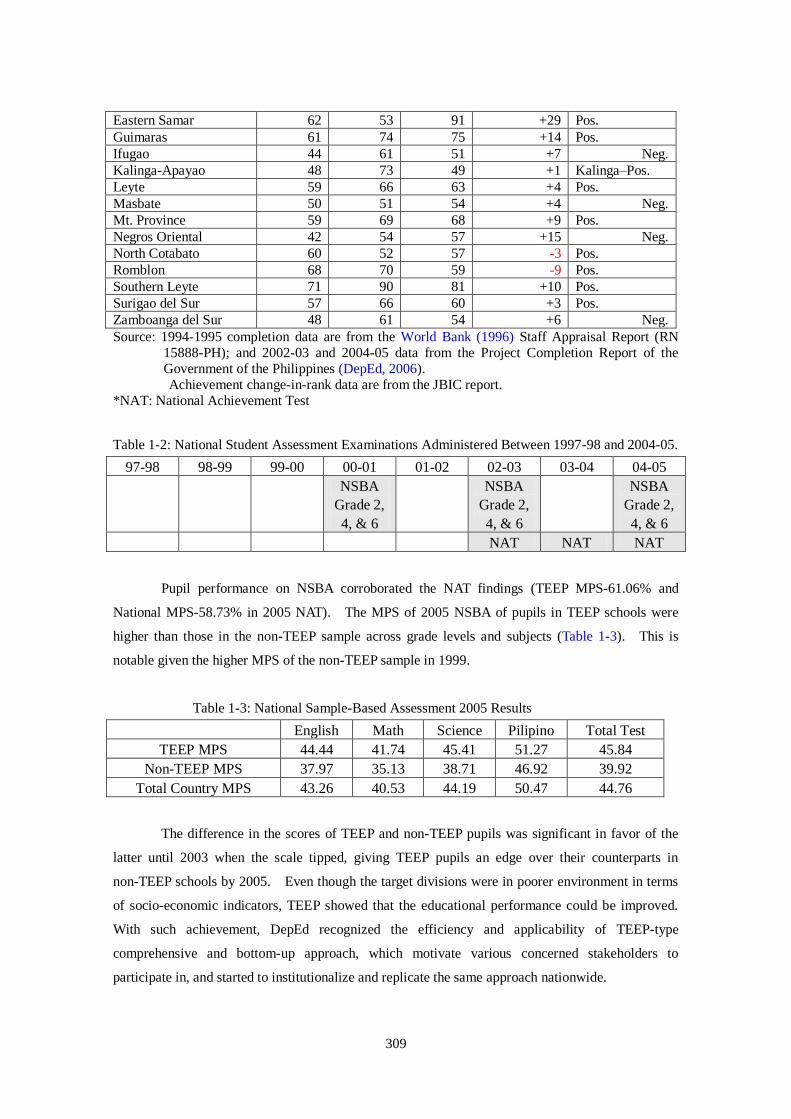
Eastern Samar 62 53 91 +29 Pos.
Guimaras 61 74 75 +14 Pos.
Ifugao 44 61 51 +7 Neg.
Kalinga-Apayao 48 73 49 +1 Kalinga–Pos.
Leyte 59 66 63 +4 Pos.
Masbate 50 51 54 +4 Neg.
Mt. Province 59 69 68 +9 Pos.
Negros Oriental 42 54 57 +15 Neg.
North Cotabato 60 52 57 -3 Pos.
Romblon 68 70 59 -9 Pos.
Southern Leyte 71 90 81 +10 Pos.
Surigao del Sur 57 66 60 +3 Pos.
Zamboanga del Sur 48 61 54 +6 Neg.
Source: 1994-1995 completion data are from the World Bank (1996) Staff Appraisal Report (RN
15888-PH); and 2002-03 and 2004-05 data from the Project Completion Report of the
Government of the Philippines (DepEd, 2006).
Achievement change-in-rank data are from the JBIC report.
*NAT: National Achievement Test
Table 1-2: National Student Assessment Examinations Administered Between 1997-98 and 2004-05.
97-98 98-99 99-00 00-01 01-02 02-03 03-04 04-05
NSBA
Grade 2,
4, & 6
NSBA
Grade 2,
4, & 6
NSBA
Grade 2,
4, & 6
NAT NAT NAT
Pupil performance on NSBA corroborated the NAT findings (TEEP MPS-61.06% and
National MPS-58.73% in 2005 NAT). The MPS of 2005 NSBA of pupils in TEEP schools were
higher than those in the non-TEEP sample across grade levels and subjects (Table 1-3). This is
notable given the higher MPS of the non-TEEP sample in 1999.
Table 1-3: National Sample-Based Assessment 2005 Results
English Math Science Pilipino Total Test
TEEP MPS 44.44 41.74 45.41 51.27 45.84
Non-TEEP MPS 37.97 35.13 38.71 46.92 39.92
Total Country MPS 43.26 40.53 44.19 50.47 44.76
The difference in the scores of TEEP and non-TEEP pupils was significant in favor of the
latter until 2003 when the scale tipped, giving TEEP pupils an edge over their counterparts in
non-TEEP schools by 2005. Even though the target divisions were in poorer environment in terms
of socio-economic indicators, TEEP showed that the educational performance could be improved.
With such achievement, DepEd recognized the efficiency and applicability of TEEP-type
comprehensive and bottom-up approach, which motivate various concerned stakeholders to
participate in, and started to institutionalize and replicate the same approach nationwide.
310
2. Basis Education Settings in the Philippines
2.1 Issues of Elementary Education
The World Education Forum in 2000 advocated a new strategy “(Quality) Education for
All” together in the Millennium Development Goals and affirmed that qualitative improvement
should be attempted equally with quantity expansion. In the Philippines, enrolment rates at all
education levels were relatively higher compared to those of countries with equivalent and/or higher
income levels. In basic education, universal access has been almost achieved at Grade 1, and net
enrolment rate was 96.4% in 2004.
However, dropout and repetition rates were high, survival rate was still as low as 69.8%,
and academic achievement was low. Overall academic scores did not reach 50% on average in
2004. Moreover, in the 2004 High School Readiness Test, only 0.64% attained the passing score of
75% or better. Therefore, the problems of education quality were very serious.
As for secondary school, since 1990 of free compulsory high school education, there has
been a rapid increase in enrolment, and net enrolment rate is as high as 72.3%. However, dropout
rate is still high, survival rate is as low as 66%, and completion rate of high school for children who
entered grade 1 is below 50%. Compared to the rest of the East Asian countries, education
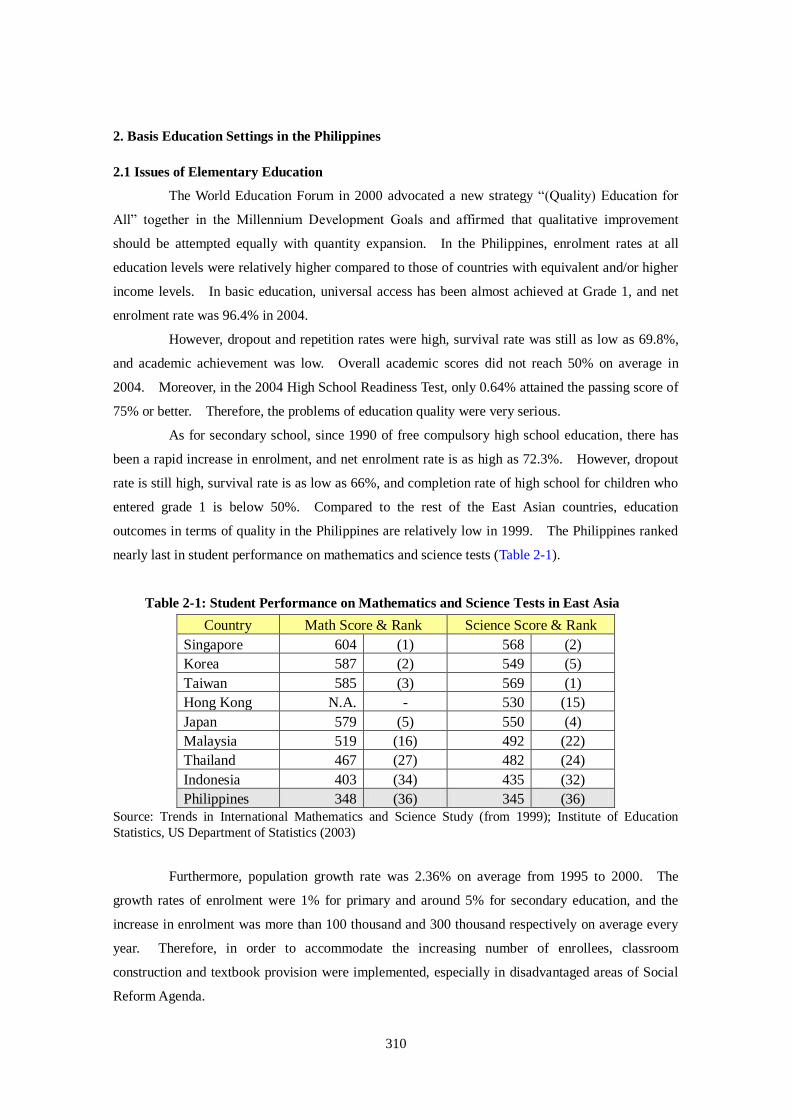
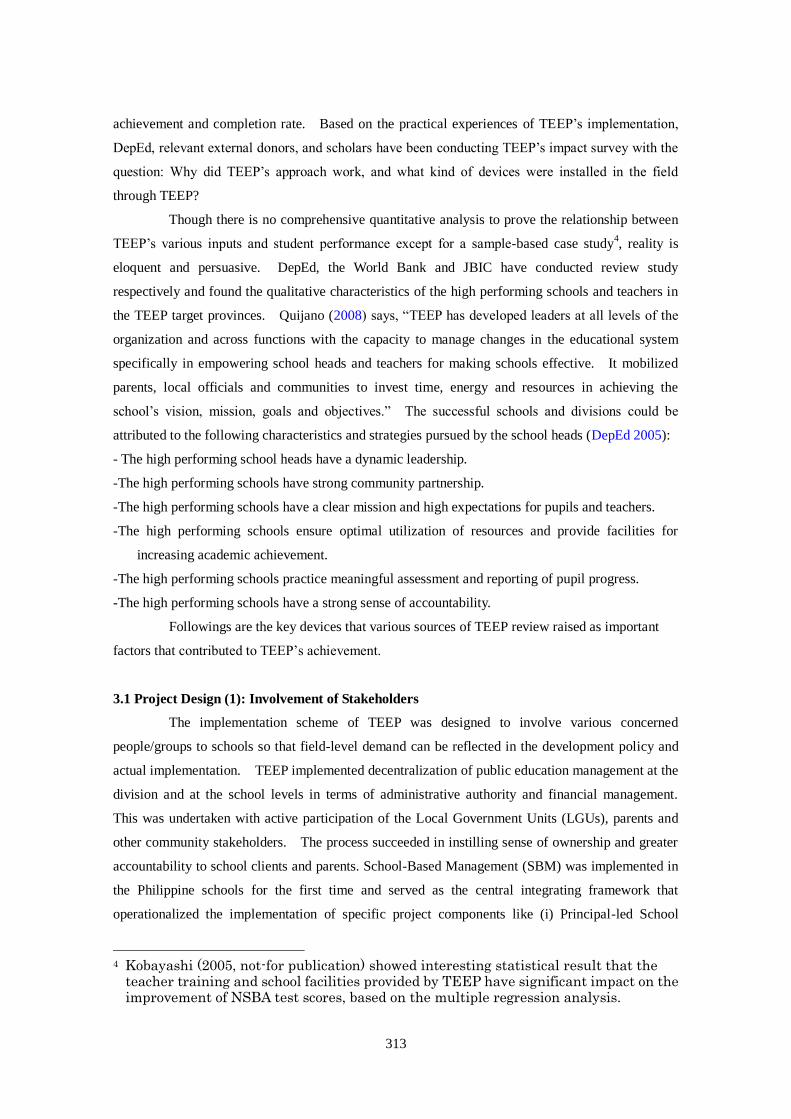
outcomes in terms of quality in the Philippines are relatively low in 1999. The Philippines ranked
nearly last in student performance on mathematics and science tests (Table 2-1).
Table 2-1: Student Performance on Mathematics and Science Tests in East Asia
Country Math Score & Rank Science Score & Rank
Singapore 604 (1) 568 (2)
Korea 587 (2) 549 (5)
Taiwan 585 (3) 569 (1)
Hong Kong N.A. - 530 (15)
Japan 579 (5) 550 (4)
Malaysia 519 (16) 492 (22)
Thailand 467 (27) 482 (24)
Indonesia 403 (34) 435 (32)
Philippines 348 (36) 345 (36)
Source: Trends in International Mathematics and Science Study (from 1999); Institute of Education
Statistics, US Department of Statistics (2003)
Furthermore, population growth rate was 2.36% on average from 1995 to 2000. The
growth rates of enrolment were 1% for primary and around 5% for secondary education, and the
increase in enrolment was more than 100 thousand and 300 thousand respectively on average every
year. Therefore, in order to accommodate the increasing number of enrollees, classroom
construction and textbook provision were implemented, especially in disadvantaged areas of Social
Reform Agenda.
311
In dealing with the problems of educational access including dropout and repetition issues
and those of education quality, it is crucial for all the levels of education administration units (central,
region, division, district and school), to work together in analyzing current conditions, setting
objectives, planning concrete measures to achieve those objectives, setting indicators to measure the
degree of achievement, and carrying out activities. Since these series of analysis processes
currently lack in a decision-making process at all levels, it was necessary to improve education
management including teacher deployment, teacher development planning and budget allocation.
At both primary and secondary levels, there exist regional disparities and public-private
disparities in student- classroom and student- teacher ratios, teachers’ teaching quality and students’
academic performance.
Accordingly, it is considered that the issues to be addressed in primary and secondary
education in the Philippines are how to improve (i) education access including dropout and repetition
issues, (ii) education quality including teachers’ teaching capability and (iii) education management,
in consideration of regional disparities. Table 2-2 shows the summary of the status and issues of
basic education in the Philippines.
2.2 Decentralization: Opportunity or Threat
Decentralization policy gave strong impact on the basic education in the Philippines. In
line with the “Local Government Code 1990”, the government of the Philippines have made gradual
shift of major responsibilities of basic education from the central Department of Education (DepEd)
to the Local Government Units (LGUs) (GOP, 1990). The Code devolved service responsibilities
and revenue authority to LGUs, placing them at the forefront of development and poverty alleviation
(Nolledo, 1991). The Code stipulated that the Local School Boards shall be established in every
province, city and municipality. The provincial school board shall be composed of the provincial
governor and the division superintendent of DepEd as co-chairmen. The municipal school board
shall be composed of the municipal mayor and the district supervisor of schools as co-chairmen. In
this way, the structure of the school board was organized to constantly involve both the local
political leader and the local administrative head of DepEd, and the Code requires to have the Local
School Board meeting at least once a month or as often as may be necessary.
This decentralization policy made some significant change in LGUs. Remarkable
outcome of the Code has been the emergence of good models of LGUs performance and service
delivery under dynamic local leadership. Successful and well-managed LGUs have become a
visible example of good governance. These LGUs not only inspired neighboring LGUs, but in a
few cases they also achieved a track-record of performance across several administrations, thus
showing some signs of institutionalization of good governance. Successful LGUs serve as
replicable models for an emerging culture of service delivery and a stronger social contract. TEEP
helped streamline and structure the government’s broader policy approach towards all LGUs,

312
including relatively weaker ones, in order to create conditions for them to join the ranks of the
stronger and well-managed LGUs. (World Bank, 2005)
On the other hand, lack of social inclusion was a serious obstacle to development, one that
is closely linked to the country’s economic and social challenges. Inequality certainly remained
high in the Philippines. Coupled with low growth over the longer term, this translated into slow
progress on poverty reduction. The richest five percent of households account for nearly one third
of national income, while the poorest twenty percent accounts for only six percent (Figure 2-1).
Figure 2-1: Distribution of Income
Poorest 20%6%
75%
64%
Richest 5%
30%
0%
10%
20%
30%
40%
50%
60%
70%
80%
90%
100%
National Income Household Population
Source: Philippines Statistical Yearbook 2003
As a result of unequal distribution of incomes and opportunities, many people in the
Philippines, especially the poor, are skeptical of economic reforms since they are unable to reap the
benefits of growth. School enrollment rates are twenty-eight percent lower in the poorest group
compared to the richest; similarly, female literacy rates (age 15-49) are nine percent lower for the
poorest group compared to the richest. Geographic disparities in health and education outcomes
also remain high. Moreover, they are not involved in the decision-making process. Thus the
ability of the central government to take collective decisions and to provide public goods and
services is impaired (World Bank, 2005).
Based upon the understanding of major issues of basic education, considering not only
elementary but also secondary education, and taking into account the difficult transition period of
decentralization, TEEP was implemented to tackle the relevant bottlenecks.
3. Key Devices to Maximize the Impact
In spite of hard socio-economic conditions, TEEP target provinces could significantly
improve their elementary education environment, as is indicated in the student academic
313
achievement and completion rate. Based on the practical experiences of TEEP’s implementation,
DepEd, relevant external donors, and scholars have been conducting TEEP’s impact survey with the
question: Why did TEEP’s approach work, and what kind of devices were installed in the field
through TEEP?
Though there is no comprehensive quantitative analysis to prove the relationship between
TEEP’s various inputs and student performance except for a sample-based case study4, reality is
eloquent and persuasive. DepEd, the World Bank and JBIC have conducted review study
respectively and found the qualitative characteristics of the high performing schools and teachers in
the TEEP target provinces. Quijano (2008) says, “TEEP has developed leaders at all levels of the
organization and across functions with the capacity to manage changes in the educational system
specifically in empowering school heads and teachers for making schools effective. It mobilized
parents, local officials and communities to invest time, energy and resources in achieving the
school’s vision, mission, goals and objectives.” The successful schools and divisions could be
attributed to the following characteristics and strategies pursued by the school heads (DepEd 2005):
- The high performing school heads have a dynamic leadership.
-The high performing schools have strong community partnership.
-The high performing schools have a clear mission and high expectations for pupils and teachers.
-The high performing schools ensure optimal utilization of resources and provide facilities for
increasing academic achievement.
-The high performing schools practice meaningful assessment and reporting of pupil progress.
-The high performing schools have a strong sense of accountability.
Followings are the key devices that various sources of TEEP review raised as important
factors that contributed to TEEP’s achievement.
3.1 Project Design (1): Involvement of Stakeholders
The implementation scheme of TEEP was designed to involve various concerned
people/groups to schools so that field-level demand can be reflected in the development policy and
actual implementation. TEEP implemented decentralization of public education management at the
division and at the school levels in terms of administrative authority and financial management.
This was undertaken with active participation of the Local Government Units (LGUs), parents and
other community stakeholders. The process succeeded in instilling sense of ownership and greater
accountability to school clients and parents. School-Based Management (SBM) was implemented in
the Philippine schools for the first time and served as the central integrating framework that
operationalized the implementation of specific project components like (i) Principal-led School
4 Kobayashi (2005, not-for publication) showed interesting statistical result that the
teacher training and school facilities provided by TEEP have significant impact on the improvement of NSBA test scores, based on the multiple regression analysis.

314
Building Program, (ii) School-Based Procurement of Furniture, and (iii) School Innovation and
Improvement Facility, or School Grant with equity or fund counterpart from several stakeholders.
Local Government Units at the provincial, municipal and barangay (village) levels, congressmen,
parents, non-government organizations and people in the community all acted as key agents to
improve educational environment through implementing TEEP.
Likewise, TEEP empowered the divisions and schools together with their stakeholders to
make them key agents in creating and supporting effective schools that focus on learning and
teaching. It was significant that DepEd documented and published the best practices of schools in a
book “Transforming Schools on the Ground, Fifty Studies of School-Based Management under
TEEP,” in 2005 (DepEd, 2005).
3.2 Project Design (2): Decentralized Local-Oriented Management
TEEP’s strategies and interventions to improve key performance indicators of schools
were always selected based on the needs identified by the school staff together with the community,
the LGUs and other stakeholders. In this process, all stakeholders ensured active support to
achieve the needed results.
Roles and functions of the central, regional and division offices of DepEd were clearly
identified to have simple delineations in terms of training, material development, procurement,
monitoring and technical assistance, and assessment and evaluation for quality assurance, to avoid
duplication of functions and instead maximize the technical assistance or expertise that are provided
to schools.
Resource allocation varied from division to division or school to school but most favored
the depressed, disadvantaged and underserved. In pursuance of the decentralization policy,
divisions and schools were allowed to manage their own funds based on their development plans.
Several in-service activities had already been conducted at the school level. Clusters of
schools with the same training needs conducted their own training. Peer coaching and mentoring
usually followed the formal in-service training. This strategy ensured that in-service trainings
respond to needs of teachers and students, and were conducted with minimal cost.
3.3 Added Value (1): Making Achievement Visible for Further Understanding
Advocacy and information campaigns and activities were undertaken in offices, schools
and communities nationwide to achieve awareness and common understanding of the educational
innovations. They brought about positive changes in the way the schools delivered the services.
This kind of advocacy was done through various media: print and non-print. Distribution of
“TEEPstar” was one of the successful examples. DepEd central office collected information of
good practices under TEEP schools, made it into a monthly newsletter and distributed to all the
school heads including non-TEEP provinces.
The award of “Brigada Eskwela (School Obligation)” also worked. This was an award
system to encourage school-community partnership which required no cost. When a school

315
improved its educational environment with mobilizing local resources, DepEd division office
recommended the school to DepEd central, and the honor was provided by the Secretary. Then the
panel of acknowledgement was displayed in the school so that the community members could keep
supporting the educational environment.
The unique color of classrooms constructed or repaired by TEEP unexpectedly worked to
show the progress. In 2000, the then Education Secretary decided to differentiate the color of
classrooms between the normal ones and TEEP contributed ones. TEEP classrooms were colored
in blue for the roofs and in yellow for the walls, while the national standard classrooms had green
roof and white wall. Since almost all the schools had at least one classroom constructed or repaired
by TEEP, the color strongly appealed to the local people as well as the congressmen, and this
contributed to increase the social awareness.
3.4 Added Value (2): School-Based Management
After the mid-term review of TEEP in 2001, School-Based Mangement (SBM) was added
to the project component. TEEP had defined SBM as the decentralization of decision-making
authority from central, regional, and division levels to individual school sites, uniting school heads,
teachers, students as well as parents, the LGUs and the community in promoting effective schools.
Its main goal is to improve school performance and student achievement, where decision-making is
made by all those who are closely involved with resolving the challenges of the individual schools so
that the specific needs of the students could be served more effectively.
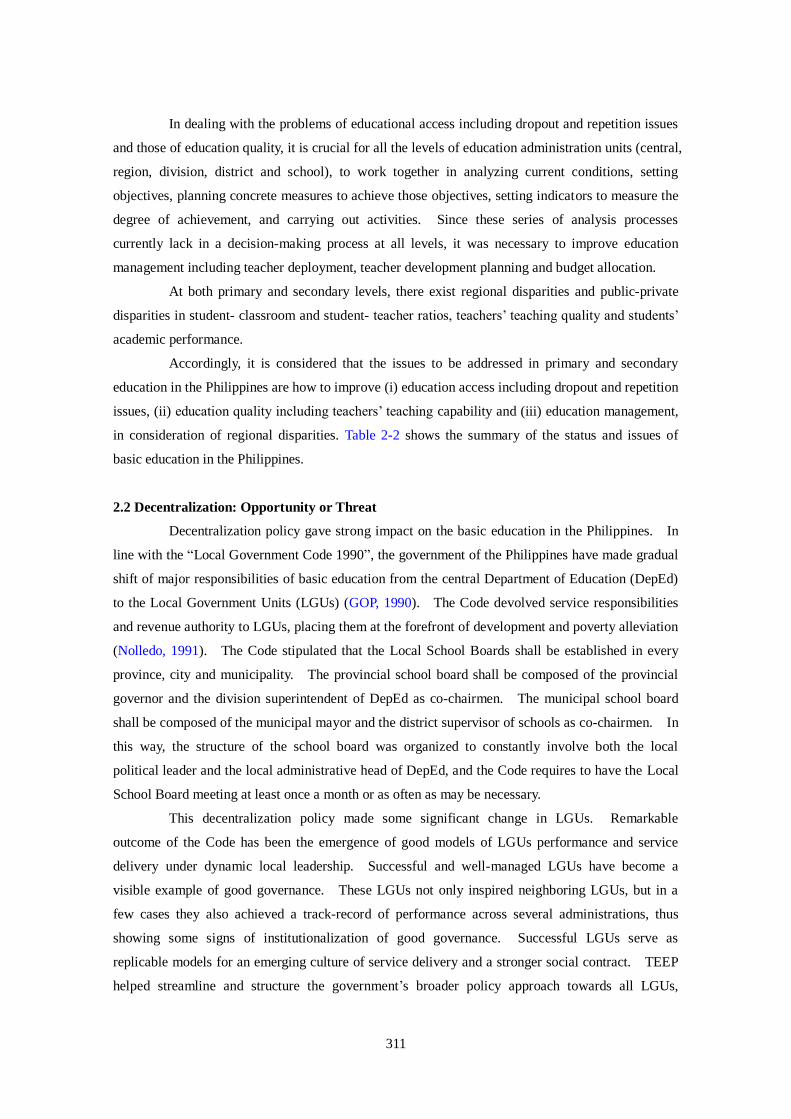
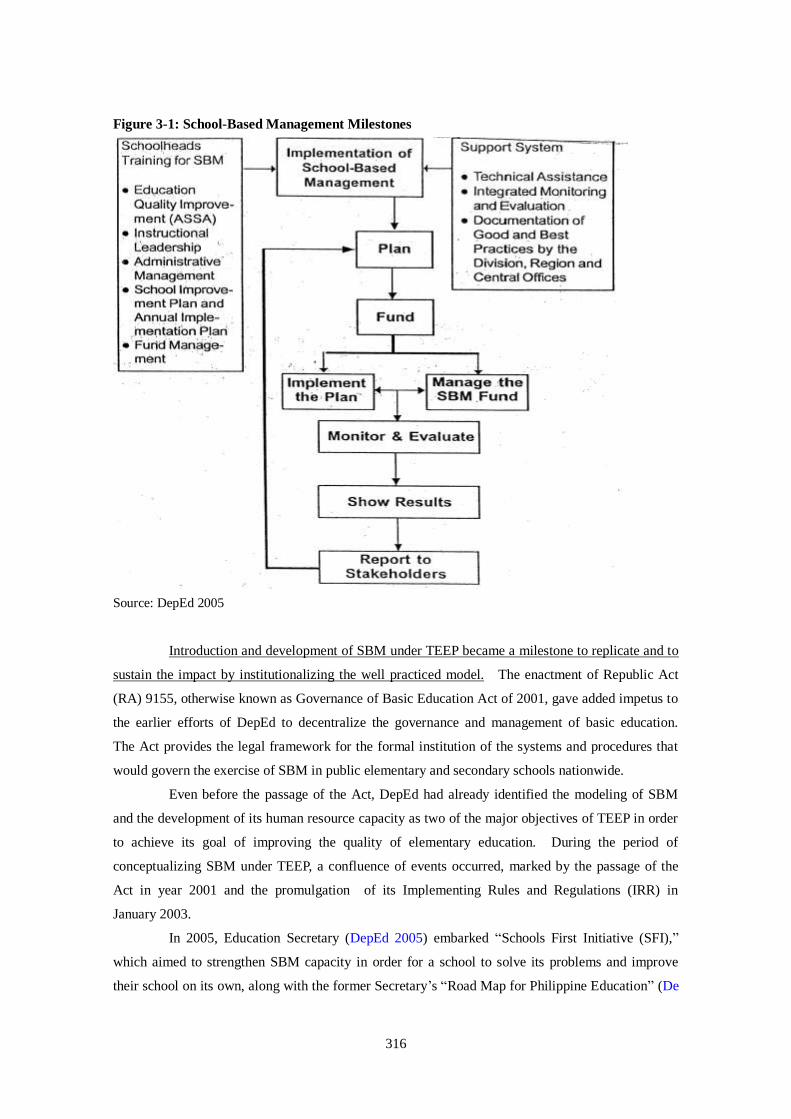
The objectives of SBM are to (i) empower the school heads to lead their teachers and
students through reforms which lead to higher learning outcomes; (ii) bring resources, including
funds, down to the control of schools to spur change; (iii) strengthen partnership with communities
as well as local government units to invest time, money and effort in making the school a better
place to learn and (iv) integrate school management and instructional reform for making the school
effective (Figure 3-1) (DepEd, 2006).
316
Figure 3-1: School-Based Management Milestones
Source: DepEd 2005
Introduction and development of SBM under TEEP became a milestone to replicate and to
sustain the impact by institutionalizing the well practiced model. The enactment of Republic Act
(RA) 9155, otherwise known as Governance of Basic Education Act of 2001, gave added impetus to
the earlier efforts of DepEd to decentralize the governance and management of basic education.
The Act provides the legal framework for the formal institution of the systems and procedures that
would govern the exercise of SBM in public elementary and secondary schools nationwide.
Even before the passage of the Act, DepEd had already identified the modeling of SBM
and the development of its human resource capacity as two of the major objectives of TEEP in order
to achieve its goal of improving the quality of elementary education. During the period of
conceptualizing SBM under TEEP, a confluence of events occurred, marked by the passage of the
Act in year 2001 and the promulgation of its Implementing Rules and Regulations (IRR) in
January 2003.
In 2005, Education Secretary (DepEd 2005) embarked “Schools First Initiative (SFI),”
which aimed to strengthen SBM capacity in order for a school to solve its problems and improve
their school on its own, along with the former Secretary’s “Road Map for Philippine Education” (De
317
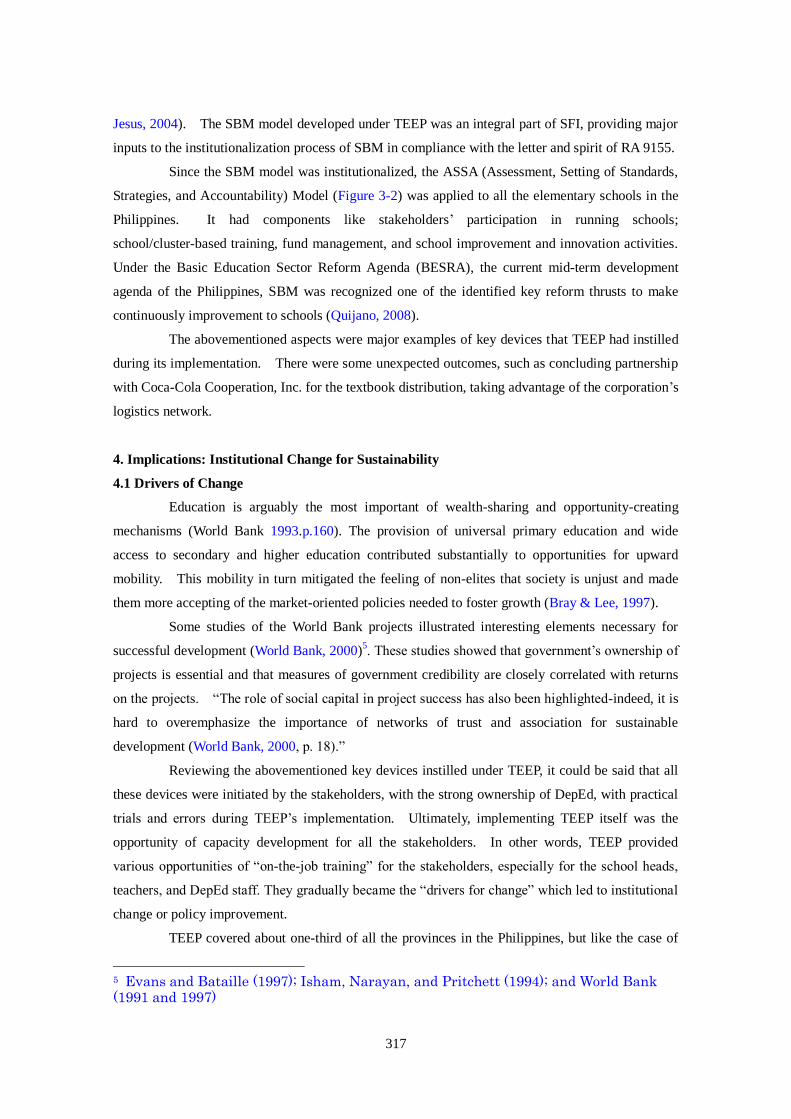
Jesus, 2004). The SBM model developed under TEEP was an integral part of SFI, providing major
inputs to the institutionalization process of SBM in compliance with the letter and spirit of RA 9155.
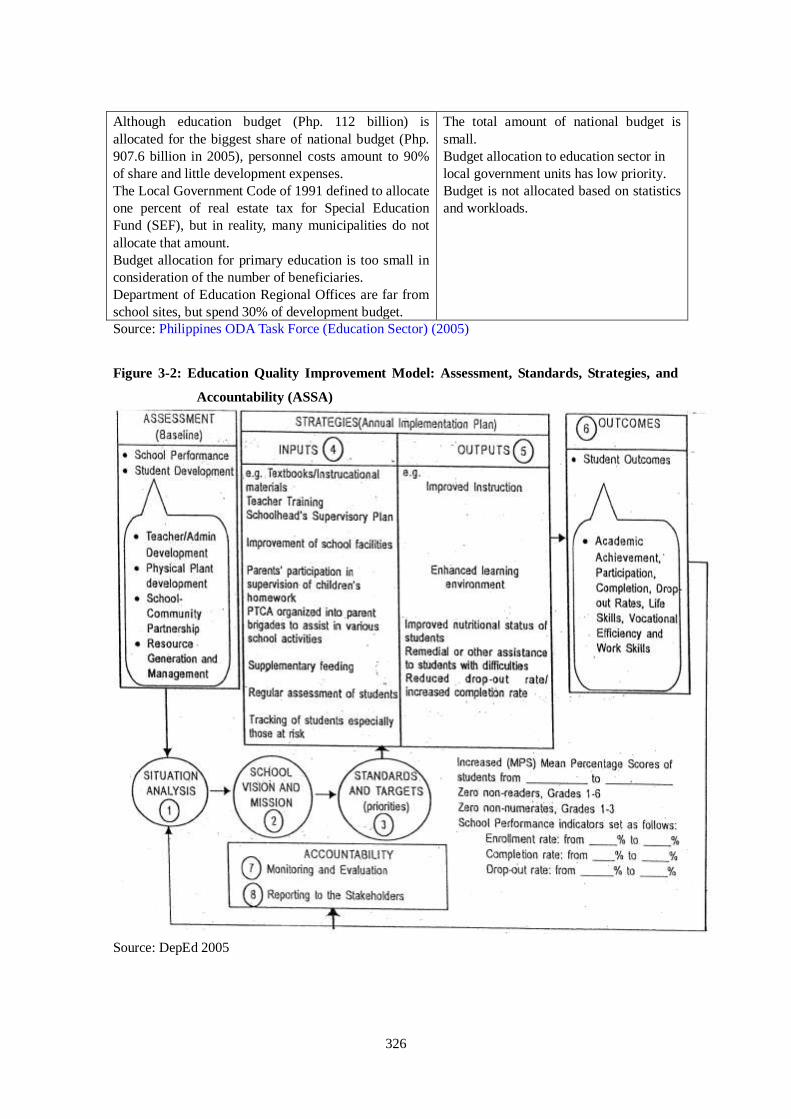
Since the SBM model was institutionalized, the ASSA (Assessment, Setting of Standards,
Strategies, and Accountability) Model (Figure 3-2) was applied to all the elementary schools in the
Philippines. It had components like stakeholders’ participation in running schools;
school/cluster-based training, fund management, and school improvement and innovation activities.
Under the Basic Education Sector Reform Agenda (BESRA), the current mid-term development
agenda of the Philippines, SBM was recognized one of the identified key reform thrusts to make
continuously improvement to schools (Quijano, 2008).
The abovementioned aspects were major examples of key devices that TEEP had instilled
during its implementation. There were some unexpected outcomes, such as concluding partnership
with Coca-Cola Cooperation, Inc. for the textbook distribution, taking advantage of the corporation’s
logistics network.
4. Implications: Institutional Change for Sustainability
4.1 Drivers of Change
Education is arguably the most important of wealth-sharing and opportunity-creating
mechanisms (World Bank 1993.p.160). The provision of universal primary education and wide
access to secondary and higher education contributed substantially to opportunities for upward
mobility. This mobility in turn mitigated the feeling of non-elites that society is unjust and made
them more accepting of the market-oriented policies needed to foster growth (Bray & Lee, 1997).
Some studies of the World Bank projects illustrated interesting elements necessary for
successful development (World Bank, 2000)5. These studies showed that government’s ownership of
projects is essential and that measures of government credibility are closely correlated with returns
on the projects. “The role of social capital in project success has also been highlighted-indeed, it is
hard to overemphasize the importance of networks of trust and association for sustainable
development (World Bank, 2000, p. 18).”
Reviewing the abovementioned key devices instilled under TEEP, it could be said that all
these devices were initiated by the stakeholders, with the strong ownership of DepEd, with practical
trials and errors during TEEP’s implementation. Ultimately, implementing TEEP itself was the
opportunity of capacity development for all the stakeholders. In other words, TEEP provided
various opportunities of “on-the-job training” for the stakeholders, especially for the school heads,
teachers, and DepEd staff. They gradually became the “drivers for change” which led to institutional
change or policy improvement.
TEEP covered about one-third of all the provinces in the Philippines, but like the case of
5 Evans and Bataille (1997); Isham, Narayan, and Pritchett (1994); and World Bank (1991 and 1997)
318
School-Based Management, its impact was replicated to non-TEEP provinces, and it was sustained
by institutionalization as a policy. Looking back the nine-year implementation period, an
implication is left that the stakeholders’ capacity gradually developed mainly through their own
struggles to participate in the project and to move things forward practically. Such field–level trials
made the grounded successful practices which led to the institutional change, and the bundle of
institutions lead to policy-level improvement.
In each development project, this kind of positive spiral should be considered carefully,
with medium- to long-term perspectives, to replicate and to sustain the valuable outcomes.
4.2 Philosophical Meaning
Philosophical implication is reminded from the case study of TEEP. Among various
philosophers who left profound thoughts on the roles of education, TEEP’s case reminds Paulo
Freire. The generative themes of Freire (2000) are liberation and literacy. According to Freire’s
philosophy, education is the key to revolution, to reversing relations between the oppressed and the
oppressors, and to creating a radically new philosophy. Freire puts importance on literacy in his
philosophy of education. He explains that reading the word is a reading of the world, and it can
raise individual consciousness followed by revolution against the oppressed social structure.
His philosophy reflects his personal background. He experienced poverty as a youth in a
poor region of Northern Brazil, and grew up in depression. He was influenced by critical and
dialectical humanism such as the thoughts of Helgel, Marx, Che, and Fromm. Freire (2000)
introduces the class structure as well as politics in thinking about pedagogy. Freire considers a
pedagogy and politics of the oppressed, revolution, and transformation of the world. Freire’s
contribution is to provide the distinction between being a “subject” and an “object.” He explains
how to become a “subject” in order to participate in one’s own development and social
transformation and thus to realize the full humanity. The keys are to grasp and to overcome the
contradictions, and to gain conscientizacao. A “subject” is an actor and has consciousness. On
the other hand, an “object” is capital and is used or oppressed.
In this distinction, teacher-student structure is denied and equal dialect and form of
emancipation are recommended. “Consistent with the liberating purpose of dialogical education,
the object of the investigation is not persons, but rather the thought-language with which men and
women refer to reality (pp. 77-78).” The characteristic of Freire’s proposal is wholly dialectical so
that his pedagogy allows a range of interpretation and application.
In the context of TEEP, significant achievement could be seen in the “unit of subject.”
TEEP does not focus only on students and schools, but also on communities surrounding elementary
schools, recognizing that communities should have consciousness and act as a “subject” with its own
will for development. This approach worked for improving the awareness of education among
community members, and for sustainable model of school management, even without external
donors’ assistance.
319
References
Bray, Mark & W. O. Lee. ‘Education and Political Transitions in East Asia: Diversity and
Commonality’ in Bray, Mark & W. O. Lee. (eds.), Education and Political Transition:
Themes and Experiences in East Asia. Hong Kong: Comparative Education Research Centre.
2001.
Evans, Alison and William Bataille. Annual review of development effectiveness. Washington D. C.:
The World Bank. 1997.
De Jesus, E. A Roadmap for Education. Manila: DepEd. 2004
Department of Education (DepEd), Philippines. Mid-Term Review Report of the Third Elementary
Education Project. Manila: DepEd. 2000.
_______. A Primer on School-Based Management and Its Support Systems. Manila: DepEd. 2005.
_______. School First Initiative Strategy Document. Manila: DepEd. 2005
_______. Transforming Education On The Ground: Fifty Studies of School Based Management
under the Third Elementary Education Project (TEEP). Manila: DepEd. 2006.
_______. Technical Report: NSBA 2005. Third Elementary Education Project. Manila: DepEd. 2006
Freire, Paulo. Pedagogy of the oppressed, 30th anniversary edition. New York: Continuum. 2000.
Government of the Philippines (GOP). The local government code 1990. Manila: GOP. 1990.
_______. Philippines Statistical Yearbook 2003. Manila: GOP. 2003.
Isham, Jonathan, Deepa Narayan, and Lant Pritchett. ‘Does participation improve performance?
Empirical evidence from project data.’ In Policy research working paper 1357. Washington
D. C.: The World Bank. 1994.
Japan Bank for International Cooperation. External Review of TEEP (Draft Final). Manila: not for
publication. 2006.
Kobayasi, Lin, Beyond the Numbers: An Analysis of the Effectiveness of the Filipino Education
Project. Monograph of School of Education. Stanford: not-published. 2005
Nolledo, Jose N. The Local Government Code with Basic Features. Manila: National Book Store.
1991.
Philippines ODA Task Force (Education Team). Position Paper on Primary and Secondary
Education. Manila: not-published. 2005

320
Quijano, Yolanda S. Message Regarding TEEP for Publication in JBIC’s ODA Loan Project News.
Manila: (draft not for publication). 2008
World Bank. World development report 1991: the challenge of development. New York: Oxford
University Press. 1991
_______. Staff Appraisal Report 1588-PH, Washington D.C.: The World Bank. 1996.
_______. World Development Report 1997: the state in a changing world. New York: Oxford
University Press. 1997.
_______. Country Assistance Strategy for the Republic of the Philippines 2006-2008. Washington
D.C.: The World Bank. 2005
_______. Implementation Completion and Results Report (IBRD-41080) on a Loan to the Republic
of the Philippines for a The Third Elementary Education Project. Washington D.C.: The
World Bank. 2007
321
Figure 1-1: TEEP Outline
1. Objectives: To contribute to the overall improvement of access and quality of elementary
education by improving the effectiveness of school in the poorest communities in the Provinces
related to the Social Reform Agenda (SRA) and by improving the institutional capacity of the
education administrative machinery and assist decentralization to manage change.
2. Location: 23 Priority Provinces related to the Social Reform Agenda (SRA) Program of the
Government of the Republic of the Philippines. 23 Target Provinces are divided into the
following 3 batches.
Batch Provinces Region JBIC/WB Target
1
Benguet CAR
JBIC Guimaras Region 6
Surigao del Sur CARAGA
Antique Region 6
WB Agusan del Sur CARAGA
Ifugao CAR
2
Biliran Region 8
JBIC
Leyte Region 8
Masbate Region 5
Negros Oriental Region 7
Romblon Region 4
North Cotabato Region 12
WB Southern Leyte Region 8
Zamboanga del Sur Region 9
Zamboanga Sibugay Region 9
3
Abra Region 1
JBIC
Apayao CAR
Aurora Region 1
Capiz Region 6
Eastern Samar Region 8
Kalinga CAR
Mountain Province CAR
Batanes Region 2
3. Executing Agency: Department of Education (DepEd)
4. Scope of Work:
(a) Construction and improvement of school buildings and procurement of furniture
(b) Teacher training and procurement of equipment and instructional materials
(c) Development of education management information system
(d) School improvement and innovation fund (SIIF)
(e) Consulting Services
5. Background and Concept of TEEP:
The Third Elementary Education Project (TEEP) is co-financed with the World Bank (WB). It has
322
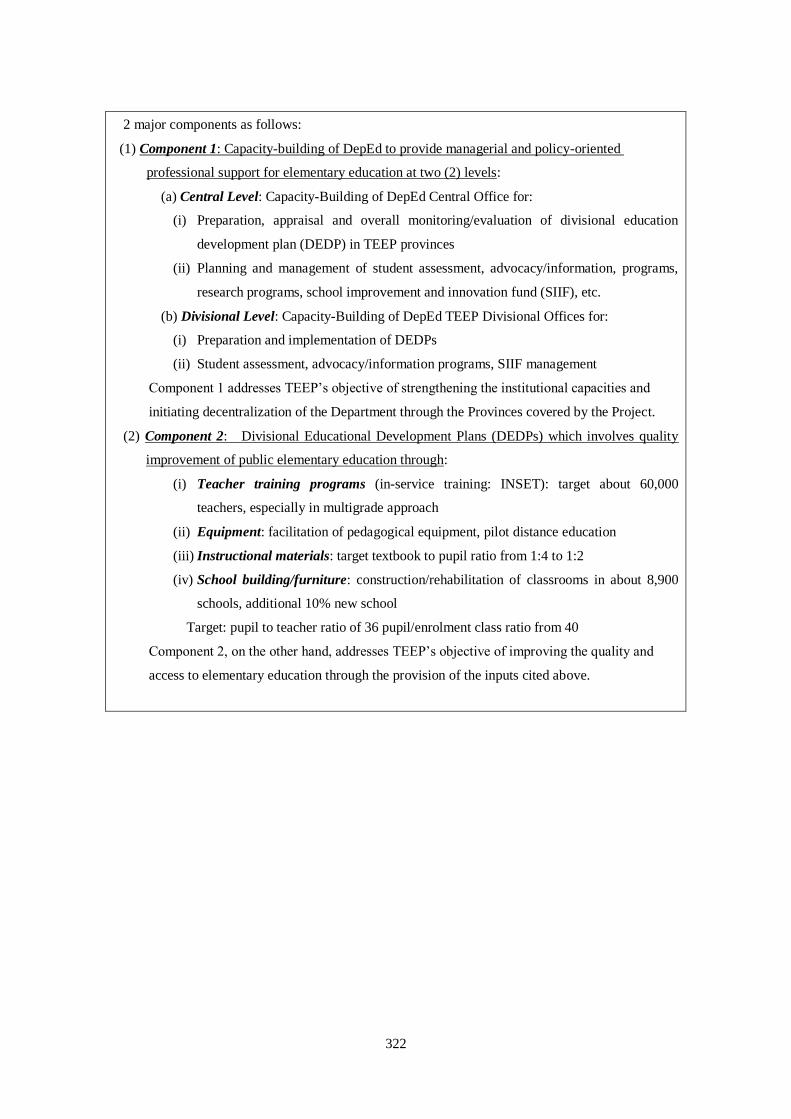
2 major components as follows:
(1) Component 1: Capacity-building of DepEd to provide managerial and policy-oriented
professional support for elementary education at two (2) levels:
(a) Central Level: Capacity-Building of DepEd Central Office for:
(i) Preparation, appraisal and overall monitoring/evaluation of divisional education
development plan (DEDP) in TEEP provinces
(ii) Planning and management of student assessment, advocacy/information, programs,
research programs, school improvement and innovation fund (SIIF), etc.
(b) Divisional Level: Capacity-Building of DepEd TEEP Divisional Offices for:
(i) Preparation and implementation of DEDPs
(ii) Student assessment, advocacy/information programs, SIIF management
Component 1 addresses TEEP’s objective of strengthening the institutional capacities and
initiating decentralization of the Department through the Provinces covered by the Project.
(2) Component 2: Divisional Educational Development Plans (DEDPs) which involves quality
improvement of public elementary education through:
(i) Teacher training programs (in-service training: INSET): target about 60,000
teachers, especially in multigrade approach
(ii) Equipment: facilitation of pedagogical equipment, pilot distance education
(iii) Instructional materials: target textbook to pupil ratio from 1:4 to 1:2
(iv) School building/furniture: construction/rehabilitation of classrooms in about 8,900
schools, additional 10% new school
Target: pupil to teacher ratio of 36 pupil/enrolment class ratio from 40
Component 2, on the other hand, addresses TEEP’s objective of improving the quality and
access to elementary education through the provision of the inputs cited above.
323
Figure 1-2: TEEP Project Map
Source: World Bank, 2006

324
Table 2-2. Current Status and Issues of Basic Education in the Philippines
Status and Issues Factors Affecting Problems
1) Access to Education Opportunity
(1) Survival rate improvement
Net enrolment rates for elementary and secondary
education are as high as 96.4% and 72.3% respectively;
however, survival rates are as low as 69.8% and 66% in
2000-01.
There exist compound factors both from
supply side (access, quality, management)
and demand side (household’s economic
hardship, values toward education).
(2) Quantitative expansion of facilities, desks and chairs
There lack in 13,527 classrooms and 2,241,643 desks
and chairs for elementary schools, 38,420 classrooms
and 2,319,906 desks and chairs for high schools, 109
barangays without elementary schools, especially in
Central and Southern Luzon including NCR and in
Mindanao including ARMM. On the other hand, there
exist excesses of 75,682 classrooms and 684,340 desks
and chairs for elementary schools, and 3,999 classrooms
and 48,377 desks and chairs for high schools.
In big cities, an average student-classroom ratio is more
than 60, and classes are operated in two/three shifts
from early in the morning to late at night.
Construction and distribution are not
carried out based on accurate data and
statistics.
Education budget is not enough for
construction and purchase.
2) Education Quality
Quality of teachers, teaching skills and curriculum, etc
(1) Quality improvement of teaching skills
Eighty percent of questions asked by teachers during
lessons and of lesson objectives are related to
confirmation of simple knowledge. Teachers tend to
conduct lessons in transmissive approach due to lack of
basic knowledge on subject matter and teaching skills,
although they realize the necessities of student-centered
inquiry approach.
Training with highly economic
dependency on assistance from
international organizations and training
which participants need to shoulder own
expenses are prevalent, and a nationwide
training system which teachers
continuously attend (such as induction
training and training for functional
development) has not been established.
Training sessions tend to focus on review
of subject matter contents rather than on
teaching skills to facilitate students to
acquire subject contents.
In pre-service teacher education
curriculum, only 24 units and 40 units are
allocated for knowledge on subject
content and teaching skills (especially for
science and mathematics) respectively for
primary and secondary teacher education
curricula (around 70 units in Japan).
(2) Analysis and improvement of curriculum
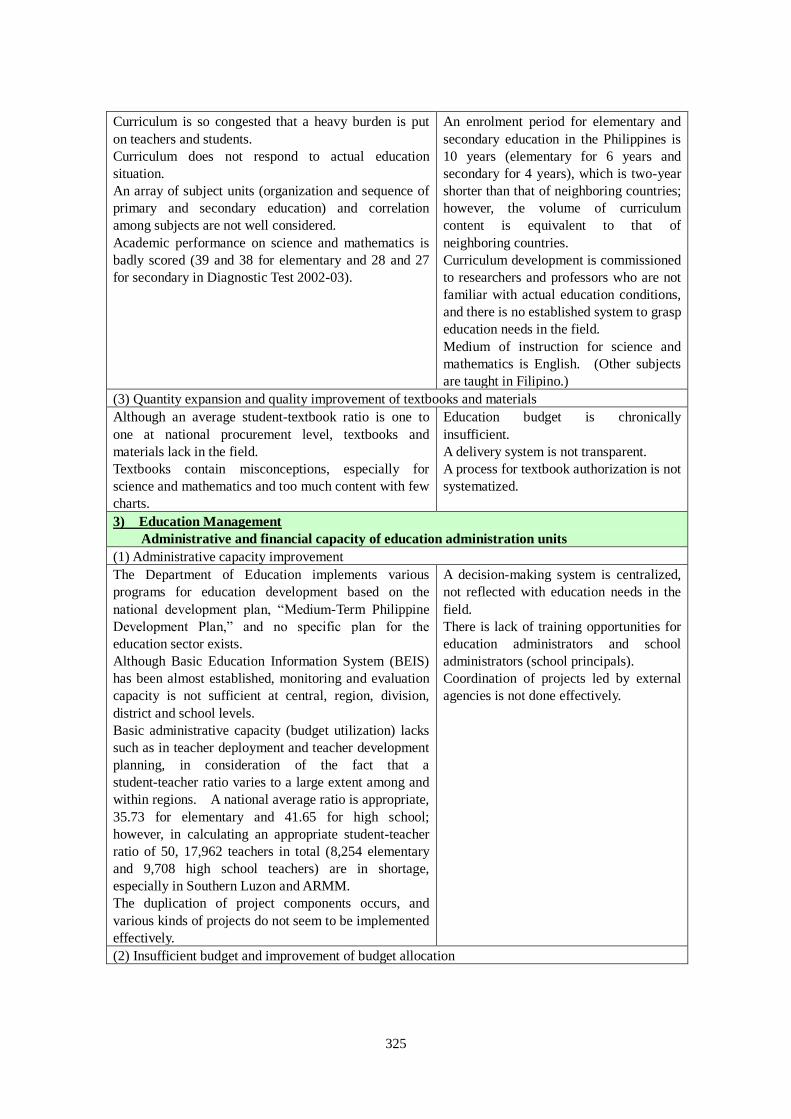
325
Curriculum is so congested that a heavy burden is put
on teachers and students.
Curriculum does not respond to actual education
situation.
An array of subject units (organization and sequence of
primary and secondary education) and correlation
among subjects are not well considered.
Academic performance on science and mathematics is
badly scored (39 and 38 for elementary and 28 and 27
for secondary in Diagnostic Test 2002-03).
An enrolment period for elementary and
secondary education in the Philippines is
10 years (elementary for 6 years and
secondary for 4 years), which is two-year
shorter than that of neighboring countries;
however, the volume of curriculum
content is equivalent to that of
neighboring countries.
Curriculum development is commissioned
to researchers and professors who are not
familiar with actual education conditions,
and there is no established system to grasp
education needs in the field.
Medium of instruction for science and
mathematics is English. (Other subjects
are taught in Filipino.)
(3) Quantity expansion and quality improvement of textbooks and materials
Although an average student-textbook ratio is one to
one at national procurement level, textbooks and
materials lack in the field.
Textbooks contain misconceptions, especially for
science and mathematics and too much content with few
charts.
Education budget is chronically
insufficient.
A delivery system is not transparent.
A process for textbook authorization is not
systematized.
3) Education Management
Administrative and financial capacity of education administration units
(1) Administrative capacity improvement
The Department of Education implements various
programs for education development based on the
national development plan, “Medium-Term Philippine
Development Plan,” and no specific plan for the
education sector exists.
Although Basic Education Information System (BEIS)
has been almost established, monitoring and evaluation
capacity is not sufficient at central, region, division,
district and school levels.
Basic administrative capacity (budget utilization) lacks
such as in teacher deployment and teacher development
planning, in consideration of the fact that a
student-teacher ratio varies to a large extent among and
within regions. A national average ratio is appropriate,
35.73 for elementary and 41.65 for high school;
however, in calculating an appropriate student-teacher
ratio of 50, 17,962 teachers in total (8,254 elementary
and 9,708 high school teachers) are in shortage,
especially in Southern Luzon and ARMM.
The duplication of project components occurs, and
various kinds of projects do not seem to be implemented
effectively.
A decision-making system is centralized,
not reflected with education needs in the
field.
There is lack of training opportunities for
education administrators and school
administrators (school principals).
Coordination of projects led by external
agencies is not done effectively.
(2) Insufficient budget and improvement of budget allocation
326
Although education budget (Php. 112 billion) is
allocated for the biggest share of national budget (Php.
907.6 billion in 2005), personnel costs amount to 90%
of share and little development expenses.
The Local Government Code of 1991 defined to allocate
one percent of real estate tax for Special Education
Fund (SEF), but in reality, many municipalities do not
allocate that amount.
Budget allocation for primary education is too small in
consideration of the number of beneficiaries.
Department of Education Regional Offices are far from
school sites, but spend 30% of development budget.
The total amount of national budget is
small.
Budget allocation to education sector in
local government units has low priority.
Budget is not allocated based on statistics
and workloads.
Source: Philippines ODA Task Force (Education Sector) (2005)
Figure 3-2: Education Quality Improvement Model: Assessment, Standards, Strategies, and
Accountability (ASSA)
Source: DepEd 2005