policy, legislation, economic analysis and … · persons from 15 to 64 years-of-age with at least...
TRANSCRIPT
1
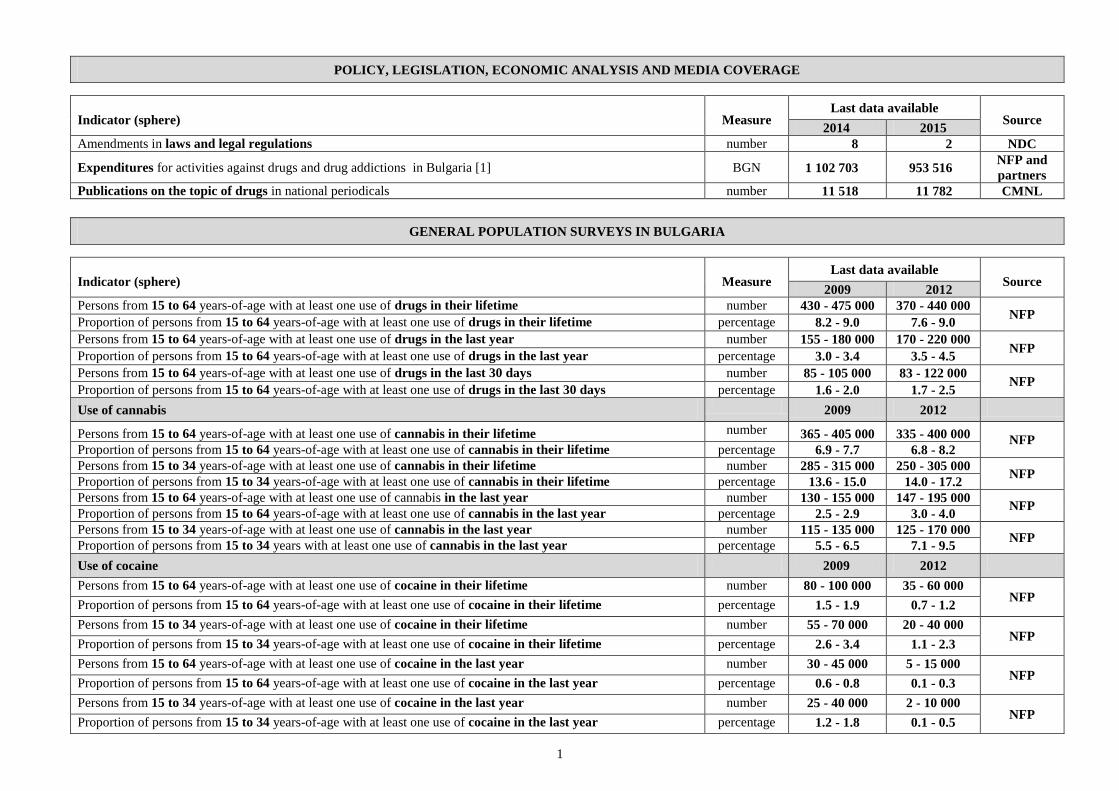
POLICY, LEGISLATION, ECONOMIC ANALYSIS AND MEDIA COVERAGE
Indicator (sphere) Measure Last data available
Source 2014 2015
Amendments in laws and legal regulations number 8 2 NDC
Expenditures for activities against drugs and drug addictions in Bulgaria [1] BGN 1 102 703 953 516 NFP and
partners
Publications on the topic of drugs in national periodicals number 11 518 11 782 CMNL
GENERAL POPULATION SURVEYS IN BULGARIA
Indicator (sphere) Measure Last data available
Source 2009 2012
Persons from 15 to 64 years-of-age with at least one use of drugs in their lifetime number 430 - 475 000 370 - 440 000 NFP
Proportion of persons from 15 to 64 years-of-age with at least one use of drugs in their lifetime percentage 8.2 - 9.0 7.6 - 9.0
Persons from 15 to 64 years-of-age with at least one use of drugs in the last year number 155 - 180 000 170 - 220 000 NFP
Proportion of persons from 15 to 64 years-of-age with at least one use of drugs in the last year percentage 3.0 - 3.4 3.5 - 4.5
Persons from 15 to 64 years-of-age with at least one use of drugs in the last 30 days number 85 - 105 000 83 - 122 000 NFP
Proportion of persons from 15 to 64 years-of-age with at least one use of drugs in the last 30 days percentage 1.6 - 2.0 1.7 - 2.5
Use of cannabis 2009 2012
Persons from 15 to 64 years-of-age with at least one use of cannabis in their lifetime number 365 - 405 000 335 - 400 000 NFP Proportion of persons from 15 to 64 years-of-age with at least one use of cannabis in their lifetime percentage 6.9 - 7.7 6.8 - 8.2
Persons from 15 to 34 years-of-age with at least one use of cannabis in their lifetime number 285 - 315 000 250 - 305 000 NFP
Proportion of persons from 15 to 34 years-of-age with at least one use of cannabis in their lifetime percentage 13.6 - 15.0 14.0 - 17.2
Persons from 15 to 64 years-of-age with at least one use of cannabis in the last year number 130 - 155 000 147 - 195 000 NFP
Proportion of persons from 15 to 64 years-of-age with at least one use of cannabis in the last year percentage 2.5 - 2.9 3.0 - 4.0
Persons from 15 to 34 years-of-age with at least one use of cannabis in the last year number 115 - 135 000 125 - 170 000 NFP
Proportion of persons from 15 to 34 years with at least one use of cannabis in the last year percentage 5.5 - 6.5 7.1 - 9.5
Use of cocaine 2009 2012
Persons from 15 to 64 years-of-age with at least one use of cocaine in their lifetime number 80 - 100 000 35 - 60 000 NFP
Proportion of persons from 15 to 64 years-of-age with at least one use of cocaine in their lifetime percentage 1.5 - 1.9 0.7 - 1.2
Persons from 15 to 34 years-of-age with at least one use of cocaine in their lifetime number 55 - 70 000 20 - 40 000 NFP
Proportion of persons from 15 to 34 years-of-age with at least one use of cocaine in their lifetime percentage 2.6 - 3.4 1.1 - 2.3
Persons from 15 to 64 years-of-age with at least one use of cocaine in the last year number 30 - 45 000 5 - 15 000 NFP
Proportion of persons from 15 to 64 years-of-age with at least one use of cocaine in the last year percentage 0.6 - 0.8 0.1 - 0.3
Persons from 15 to 34 years-of-age with at least one use of cocaine in the last year number 25 - 40 000 2 - 10 000 NFP
Proportion of persons from 15 to 34 years-of-age with at least one use of cocaine in the last year percentage 1.2 - 1.8 0.1 - 0.5

2
Use of amphetamines 2009 2012
Persons from 15 to 64 years-of-age with at least one use of amphetamines in their lifetime number 100 - 120 000 45 - 75 000 NFP
Proportion of persons from 15 to 64 years-of-age with at least one use of amphetamines in their lifetime percentage 1.9 - 2.3 0.9 - 1.5
Persons from 15 to 34 years-of-age with at least one use of amphetamines in their lifetime number 85 - 100 000 35 - 60 000 NFP
Proportion of persons from 15 to 34 years-of-age with at least one use of amphetamines in their lifetime percentage 4.0 - 4.8 2.0 - 3.4
Persons from 15 to 64 years-of-age with at least one use of amphetamines in the last year number 40 - 55 000 20 - 40 000 NFP
Proportion of persons from 15 to 64 years-of-age with at least one use of amphetamines in the last year percentage 0.8 - 1.0 0.4 - 0.8
Persons from 15 to 34 years-of-age with at least one use of amphetamines in the last year number 40 - 50 000 15 - 35 000 NFP
Proportion of persons from 15 to 34 years-of-age with at least one use of amphetamines in the last year percentage 1.8 - 2.4 0.8 - 1.8
Use of ecstasy 2009 2012
Persons from 15 to 64 years-of-age with at least one use of ecstasy in their lifetime number 80 - 100 000 80 - 120 000 NFP
Proportion of persons from 15 to 64 years-of-age with at least one use of ecstasy in their lifetime percentage 1.5 - 1.9 1.6 - 2.4
Persons from 15 to 34 years-of-age with at least one use of ecstasy in their lifetime number 65 - 85 000 65 - 95 000 NFP
Proportion of persons from 15 to 34 years-of-age with at least one use of ecstasy in their lifetime percentage 3.2 - 4.0 3.5 - 5.3
Persons from 15 to 64 years-of-age with at least one use of ecstasy in the last year number 30 - 45 000 20 - 40 000 NFP
Proportion of persons from 15 to 64 years-of-age with at least one use of ecstasy in the last year percentage 0.6 - 0.8 0.4 - 0.8
Persons from 15 to 34 years-of-age with at least one use of ecstasy in the last year number 25 - 40 000 40 - 65 000 NFP
Proportion of persons from 15 to 34 years-of-age with at least one use of ecstasy in the last year percentage 1.3 - 1.9 2.2 - 3.6
SPECIAL POPULATION SURVEYS
Индикатор (сфера) Measure Last data available Source
Употреба на наркотични вещества сред учениците 2011 2013
Schoolchildren from 9th to 12th grade with at least one use of drugs in their lifetime number 100 - 105 000 70 - 90 000 NFP
Proportion of schoolchildren from 9th to 12th grade with at least one use of drugs in their lifetime percentage 30.4 28.2 NFP
Proportion of schoolchildren from 9th to 12th grade with at least one use of cannabis in their lifetime percentage 27.1 26.2 NFP
Proportion of schoolchildren from 9th to 12th grade with at least one use of amphetamines in their lifetime percentage 8.0 6.3 NFP
Proportion of schoolchildren from 9th to 12th grade with at least one use of cannabis in the last 30 days percentage 12.0 10.8 NFP
Proportion of schoolchildren from 9th to 12th grade with at least one use of ecstasy in the last 30 days percentage 1.8 1.9 NFP
2011 2015
Schoolchildren of 15-16 with at least one use of drugs in their lifetime number 17 - 18 000 20 - 22 000
ESPAD
Proportion of schoolchildren of 15-16 with at least one use of drugs in their lifetime percentage 26.0 30.0
Proportion of schoolchildren of 15-16 with at least one use of cannabis in their lifetime percentage 24.3 27.0
Proportion of schoolchildren of 15-16 with at least one use of amphetamines in their lifetime percentage 8.3 6.0
Proportion of schoolchildren of 15-16 with at least one use of cannabis in the last 30 days percentage 11.1 12.0

3
Drug use among university students in Bulgaria 2010 2014
Students with at least one use of drugs in their lifetime number 70 - 72 000 66 - 68 000
NFP
Proportion of students with at least one use of drugs in their lifetime percentage 38.4 - 39.4 36.1
Students with at least one use of drugs in the last 30 days number 25 - 27 000 25 - 27 000
Proportion of students with at least one use of drugs in the last 30 days percentage 13.7 - 14.5 13.8
Proportion of students with at least one use of cannabis in the last 30 days percentage 11.5 11.8
Proportion of students with at least one use of amphetamines in the last 30 days percentage 3.0 1.8
Drug use among detainees in Bulgaria 2011 2013
Detainees with at least one use of drugs in their lifetime number 3 400 - 3 500 3 300-3 400
GDES, NFP
Proportion of detainees with at least one use of drugs in their lifetime percentage 36.7 35.2
Proportion of detainees with at least one use of cannabis in their lifetime percentage 27.8 33.2
Proportion of detainees with at least one use of heroin in their lifetime percentage 23.5 20.6
Detainees with at least one use of drugs in the last year number 2 000 - 2 100 2 000-2 100
Proportion of detainees with at least one use of drugs in the last year percentage 21.6 21.6
Proportion of detainees with at least one use of cannabis in the last year percentage 11.8 17.0
Proportion of detainees with at least one use of heroin in the last year percentage 13.4 9.2
Drug use in recreational settings 2010 2014
Proportion of university students attended parties where were taken drugs in the last year percentage 40.3 41.2 NFP Proportion of university students went to disco where were taken drugs in the last year percentage 35.4 35.4 NFP Proportion of university students who have used cannabis in disco or other recreational setting in the last year percentage 8.1 12.1 NFP
PROBLEM DRUG USE IN BULGARIA
Indicator (sphere) Measure Last data available
Source 2009
Persons from 15 to 64 years-of-age who are problem drug users number 31 316
(23 - 43 000)
NFP
Proportion of problem drug users in the population from 15 to 64 years-of-age per mills 6 (4 - 8)
Persons from 15 to 64 years-of-age who are problem opioid users number 26 000
(19 - 35 000)
Proportion of problem opioid users in the population from 15 to 64 years-of-age per mills 5 (4 - 7)
Persons from 15 to 64 years-of-age who are problem amphetamine/ecstasy users number 5 000
(3 500-6 300)
Proportion of problem amphetamine/ecstasy users in the population from 15 to 64 years-of-age per mills 1 (0.7 - 1.3)
Persons from 15 to 34 years-of-age with intensive use of cannabis number 36 000
(32 - 40 000)
4
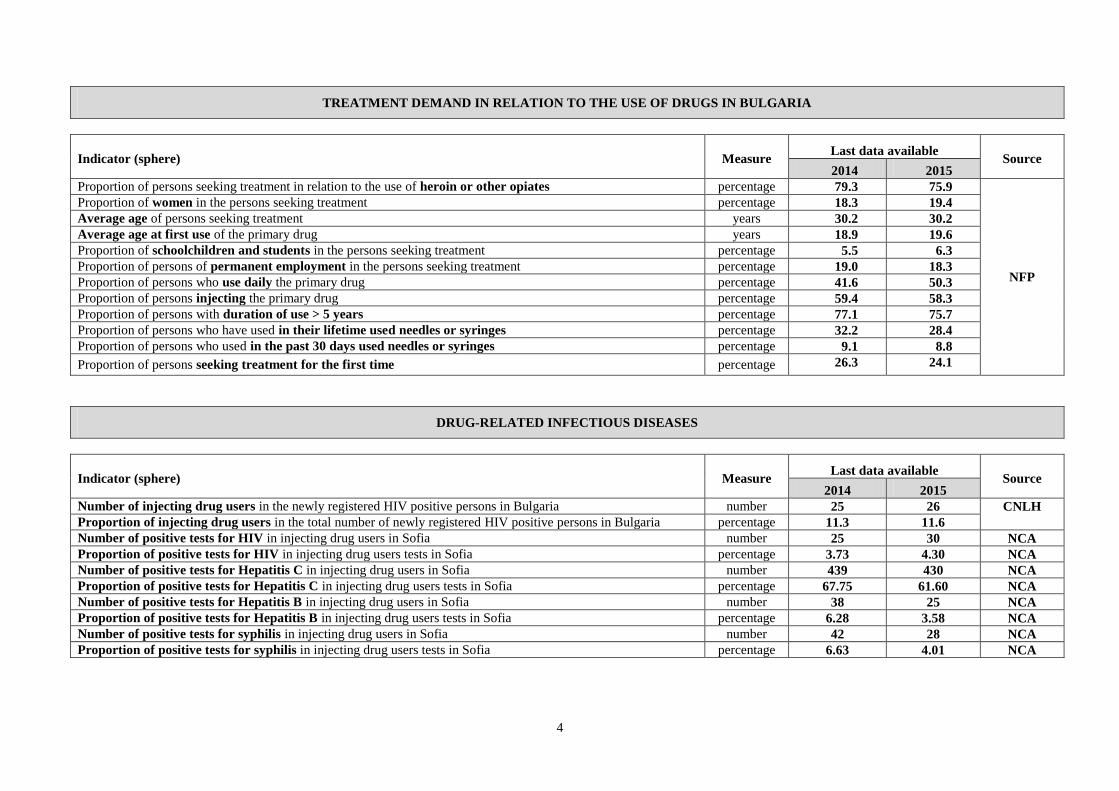
TREATMENT DEMAND IN RELATION TO THE USE OF DRUGS IN BULGARIA
Indicator (sphere) Measure Last data available
Source 2014 2015
Proportion of persons seeking treatment in relation to the use of heroin or other opiates percentage 79.3 75.9
NFP
Proportion of women in the persons seeking treatment percentage 18.3 19.4
Average age of persons seeking treatment years 30.2 30.2
Average age at first use of the primary drug years 18.9 19.6
Proportion of schoolchildren and students in the persons seeking treatment percentage 5.5 6.3
Proportion of persons of permanent employment in the persons seeking treatment percentage 19.0 18.3
Proportion of persons who use daily the primary drug percentage 41.6 50.3
Proportion of persons injecting the primary drug percentage 59.4 58.3
Proportion of persons with duration of use > 5 years percentage 77.1 75.7
Proportion of persons who have used in their lifetime used needles or syringes percentage 32.2 28.4
Proportion of persons who used in the past 30 days used needles or syringes percentage 9.1 8.8
Proportion of persons seeking treatment for the first time percentage 26.3 24.1
DRUG-RELATED INFECTIOUS DISEASES
Indicator (sphere) Measure Last data available
Source 2014 2015
Number of injecting drug users in the newly registered HIV positive persons in Bulgaria number 25 26 CNLH
Proportion of injecting drug users in the total number of newly registered HIV positive persons in Bulgaria percentage 11.3 11.6
Number of positive tests for HIV in injecting drug users in Sofia number 25 30 NCA
Proportion of positive tests for HIV in injecting drug users tests in Sofia percentage 3.73 4.30 NCA Number of positive tests for Hepatitis C in injecting drug users in Sofia number 439 430 NCA Proportion of positive tests for Hepatitis C in injecting drug users tests in Sofia percentage 67.75 61.60 NCA Number of positive tests for Hepatitis B in injecting drug users in Sofia number 38 25 NCA Proportion of positive tests for Hepatitis B in injecting drug users tests in Sofia percentage 6.28 3.58 NCA Number of positive tests for syphilis in injecting drug users in Sofia number 42 28 NCA Proportion of positive tests for syphilis in injecting drug users tests in Sofia percentage 6.63 4.01 NCA

5
DRUG-RELATED DEATHS
Indicator (sphere) Measure Last data available
Source 2014 2015
Drug poisoning-induced deaths in Bulgaria number 15 17
NSI
Average age of drug poisoning-induced deaths in Bulgaria years 27.7 34.7
Proportion of male drug poisoning-induced deaths in Bulgaria percentage 93.3 88.2
Proportion of drug poisoning-induced deaths aged 20-39 in Bulgaria percentage 93.3 88.2
Proportion of deliberate drug self-poisoning-induced deaths in Bulgaria percentage 6.6 0
Proportion of accidental drug poisoning-induced deaths in Bulgaria percentage 66.7 88.2
Proportion of deliberate self-poisoning-induced deaths with sedatives, hypnotics or psychotropic substances in
Bulgaria
percentage 0 0
Proportion of accidental self-poisoning-induced deaths with sedatives, hypnotics or psychotropic substances in
Bulgaria
percentage 0 0
Proportion of mental and behavioral disorders-induced deaths related to drug use percentage 0 5.88
Drug-induced deaths or deaths under the influence of drugs [2] number 36 42
CFMD
Average age of drug-induced deaths or deaths under the influence of drugs [2] years 30.6 31.0
Proportion of male drug poisoning-induced deaths or deaths under the influence of drugs [2] percentage 83.3 80.9
Proportion of drug poisoning-induced deaths [2] percentage 33.3 21.4
Proportion of heroin poisoning-induced deaths [2] percentage 30.6 11.9
EARLY WARNING SYSTEM
Indicator (sphere) Measure Last data available
Source 2014 2015
Uncontrolled psychoactive substances registered in the Early Warning System in Bulgaria number 26 14
NIC,
Customs Uncontrolled psychoactive substances registered for the first time in the Early Warning System in Bulgaria number 5 5
Quantity of uncontrolled psychoactive substances registered in the Early Warning System in Bulgaria kg 9,9159 4,0739
New psychoactive substances placed on the list of the prohibited substances number 0 6
6
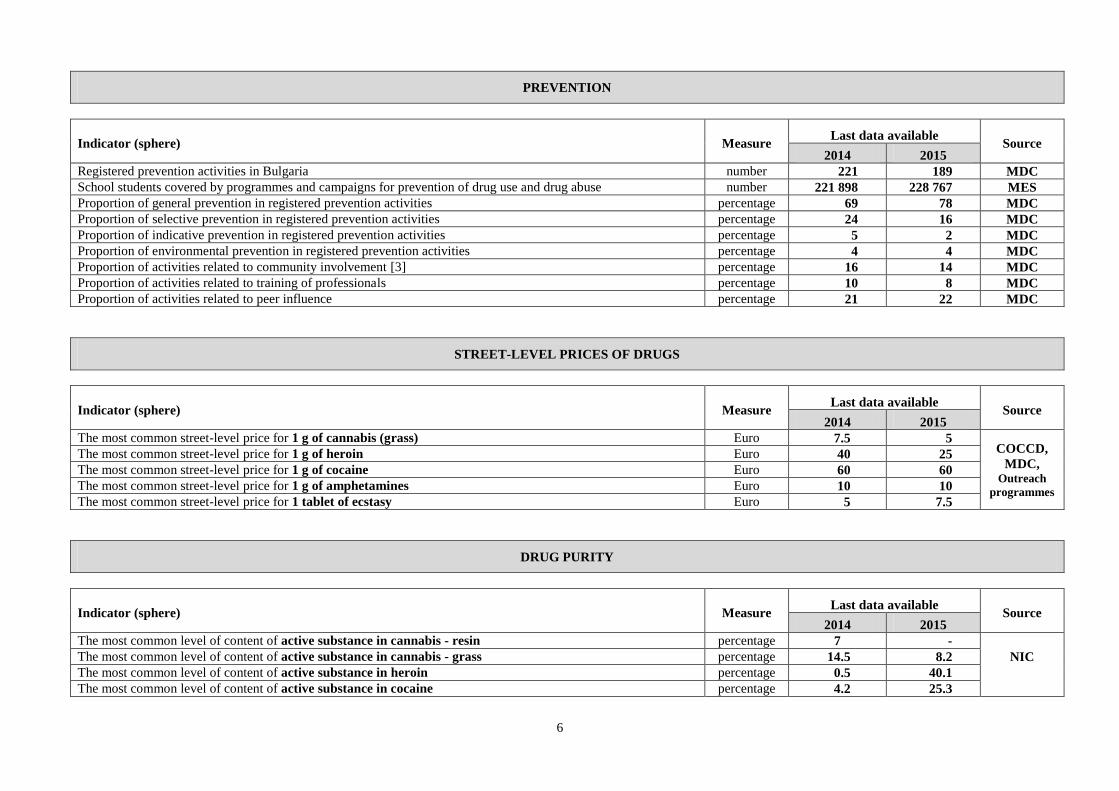
PREVENTION
Indicator (sphere) Measure Last data available
Source 2014 2015
Registered prevention activities in Bulgaria number 221 189 MDC
School students covered by programmes and campaigns for prevention of drug use and drug abuse number 221 898 228 767 MES
Proportion of general prevention in registered prevention activities percentage 69 78 MDC Proportion of selective prevention in registered prevention activities percentage 24 16 MDC Proportion of indicative prevention in registered prevention activities percentage 5 2 MDC Proportion of environmental prevention in registered prevention activities percentage 4 4 MDC Proportion of activities related to community involvement [3] percentage 16 14 MDC Proportion of activities related to training of professionals percentage 10 8 MDC Proportion of activities related to peer influence percentage 21 22 MDC
STREET-LEVEL PRICES OF DRUGS
Indicator (sphere) Measure Last data available
Source 2014 2015
The most common street-level price for 1 g of cannabis (grass) Euro 7.5 5 COCCD,
MDC, Outreach
programmes
The most common street-level price for 1 g of heroin Euro 40 25
The most common street-level price for 1 g of cocaine Euro 60 60
The most common street-level price for 1 g of amphetamines Euro 10 10
The most common street-level price for 1 tablet of ecstasy Euro 5 7.5
DRUG PURITY
Indicator (sphere) Measure Last data available
Source 2014 2015
The most common level of content of active substance in cannabis - resin percentage 7 -
NIC The most common level of content of active substance in cannabis - grass percentage 14.5 8.2
The most common level of content of active substance in heroin percentage 0.5 40.1
The most common level of content of active substance in cocaine percentage 4.2 25.3

7
TREATMENT SYSTEM
Indicator (sphere) Measure Last data available
Source 2014 2015
Seats in the wards for the treatment of addictions [4] number 154 154
NCPHA
Persons under dispensary observation in hospitals with a diagnosis of mental and behavioral disorders due to use
of psychoactive substances number 1 374 1 379
Hospitalized case (discharged persons) in hospitals with a diagnosis of mental and behavioral disorders due to use
of psychoactive substances number 935 1 005
Substitution and maintenance programmes for the treatment of addictions number 30 30
NCA and
partners
Seats in the substitution and maintenance programmes for the treatment of addictions number 4 632 4 258
Occupied seats in the substitution and maintenance programmes for the treatment of addictions number 3 404 3 423
Proportion of occupied seats in methadone programmes in the total number of all occupied seats in substitution
and maintenance programmes for the treatment of addictions percentage 96.0 95.4
Programmes for psychosocial rehabilitation and reintegration number 11 11
Seats in programmes for psychosocial rehabilitation and reintegration number 203 215
Clients who passed through programmes for psychosocial rehabilitation and reintegration number 472 416
Clients who completed programmes for psychosocial rehabilitation and reintegration number 211 230
DRUG SUPPLY REDUCTION
Indicator (sphere) Measure Last data available
Source 2014 2015
Detained persons by the authorities of the Ministry of Interior under "Drugs" number 5 127 4 195 MI
Realized specialized police operations by the authorities of the Ministry of Interior under "Drugs" number 2 376 2 182 MI
Identified new drug gatherings and places for selling drugs number 240 193 MI
Pre-trial proceedings for drug-related crimes number 5 404 6 001 SCP
Closed pre-trial proceedings for drug-related crimes number 5 592 6 022 SCP
Registered drug-related crimes (under Article 242 (2) and (3) and Articles 354а-354c of the Criminal Code) number 1 594 1 772 NSI
Convicted persons for drug-related crimes [5] number 1 427 1603 NSI
Underage and juveniles persons, perpetrators of drug-related crimes number 356 406 NSI
Cases of drug seizures number 147 88
Customs
Total amount of drugs seized in Bulgaria
kg 3 824 1 329
tablets 4 939 109
units - 2
Persons detained in the country and abroad in relation to seized drugs number 4 813 - COCCD
8
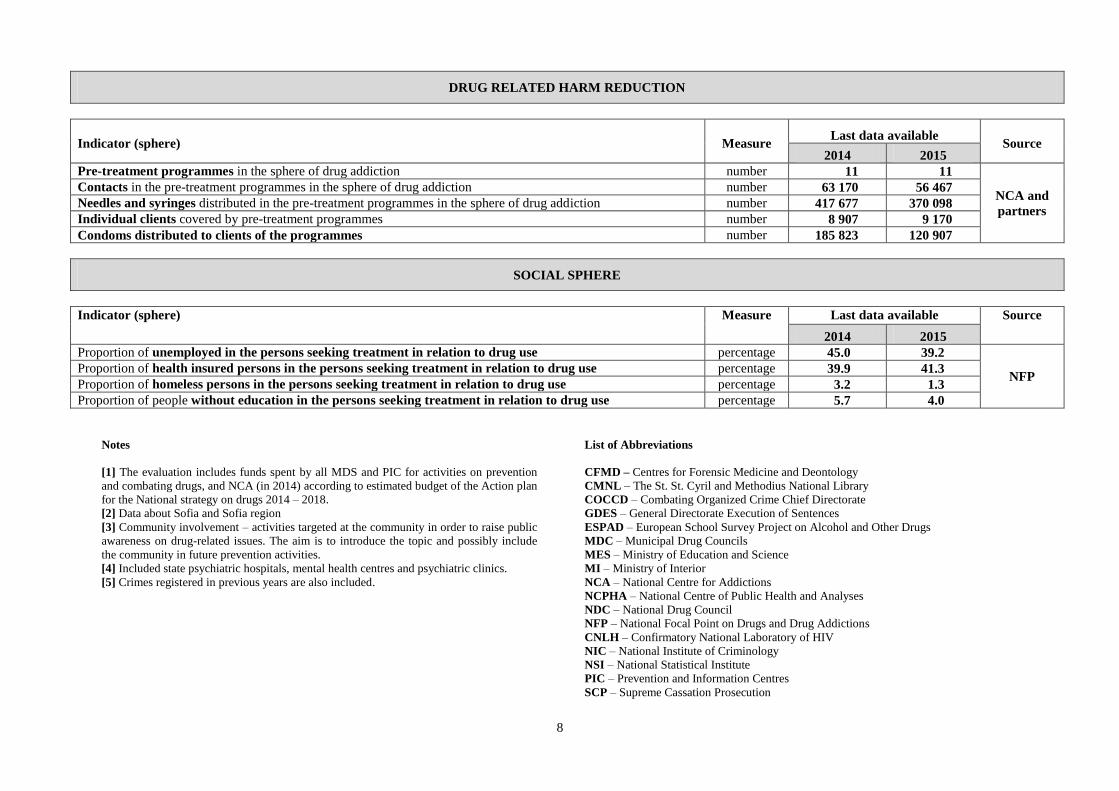
DRUG RELATED HARM REDUCTION
Indicator (sphere) Measure Last data available
Source 2014 2015
Pre-treatment programmes in the sphere of drug addiction number 11 11
NCA and
partners
Contacts in the pre-treatment programmes in the sphere of drug addiction number 63 170 56 467
Needles and syringes distributed in the pre-treatment programmes in the sphere of drug addiction number 417 677 370 098
Individual clients covered by pre-treatment programmes number 8 907 9 170
Condoms distributed to clients of the programmes number 185 823 120 907
SOCIAL SPHERE
Indicator (sphere) Measure Last data available Source
2014 2015
Proportion of unemployed in the persons seeking treatment in relation to drug use percentage 45.0 39.2
NFP Proportion of health insured persons in the persons seeking treatment in relation to drug use percentage 39.9 41.3
Proportion of homeless persons in the persons seeking treatment in relation to drug use percentage 3.2 1.3
Proportion of people without education in the persons seeking treatment in relation to drug use percentage 5.7 4.0
Notes
[1] The evaluation includes funds spent by all MDS and PIC for activities on prevention
and combating drugs, and NCA (in 2014) according to estimated budget of the Action plan
for the National strategy on drugs 2014 – 2018.
[2] Data about Sofia and Sofia region
[3] Community involvement – activities targeted at the community in order to raise public
awareness on drug-related issues. The aim is to introduce the topic and possibly include
the community in future prevention activities.
[4] Included state psychiatric hospitals, mental health centres and psychiatric clinics.
[5] Crimes registered in previous years are also included.
List of Abbreviations
CFMD – Centres for Forensic Medicine and Deontology
CMNL – The St. St. Cyril and Methodius National Library
COCCD – Combating Organized Crime Chief Directorate
GDES – General Directorate Execution of Sentences
ESPAD – European School Survey Project on Alcohol and Other Drugs
MDC – Municipal Drug Councils
MES – Ministry of Education and Science
MI – Ministry of Interior
NCA – National Centre for Addictions
NCPHA – National Centre of Public Health and Analyses
NDC – National Drug Council
NFP – National Focal Point on Drugs and Drug Addictions
CNLH – Confirmatory National Laboratory of HIV
NIC – National Institute of Criminology
NSI – National Statistical Institute
PIC – Prevention and Information Centres
SCP – Supreme Cassation Prosecution

9
NUMBER OF PUBLICATIONS RELATED TO DRUGS AND DRUG ADDICTIONS
IN THE CENTRAL PRINT AND ELECTRONIC MEDIA
(2014 – 2015)
Thematic headings 2014 2015
Total 11 518 11 782
Supply and distribution of drugs 8 283 9 464
Prevention of drug use 324 507
Presentation of drug reports 353 252
Urgent nonfatal cases related to drug use 136 243
Drug-related deaths and mortality 260 145
Treatment availability of drug use 107 135
New psychoactive substances and new routes of
administration of drugs
118 104
Epidemiological studies 55 92
Drug-related infectious diseases 73 41
Other 1 809 799
Source: Internet-based electronic publications monitoring system on the topic of drugs and drug addictions, National Library “St. St. Cyril and Methodius” and National Focal Point on Drugs and Drug Addictions

10
UNDERAGE AND JUVENILES PERSONS, PERPETRATORS OF DRUG-RELATED CRIMES
IN STATISTICAL REGIONS AND DISTRICTS
(2010 – 2015)
(number)
Statistical regions and districts
Underage and juveniles persons, perpetrators
of drug-related crimes (under Article 354а-354c of Criminal Code)
2010 2011 2012 2013 2014 2015
Total for the country 217 244 277 342 356 406
North-West Region 8 11 9 18 22 14
Vidin - - - 1 1 2
Vratsa 3 2 1 - - 1
Lovech - 1 1 2 6 1
Montana 5 3 4 7 9 3
Pleven - 5 3 8 6 7
North-Central Region 17 20 30 49 33 49
Veliko Tarnovo 10 9 16 23 14 28
Gabrovo 5 7 10 23 6 5
Razgrad 1 3 - 1 7 4
Ruse - 1 4 2 2 6
Silistra 1 - - - 4 6
North-East Region 13 21 14 24 17 32
Varna 12 12 10 11 11 26
Dobrich - 1 3 6 3 3
Targovishte - - - - 3 2
Shumen 1 8 1 7 - 1
South-East Region 21 35 39 59 61 75
Burgas 10 21 24 29 39 55
Sliven - 3 7 13 5 6
Stara Zagora 10 10 8 13 15 13
Yambol 1 1 - 4 2 1
South-West Region 133 137 139 154 179 198
Blagoevgrad 4 9 11 4 2 6
Kyustendil 2 5 10 11 4 8
Pernik - - - 3 2 -
Sofia 4 4 5 1 - 6
Sofia-city 123 119 113 135 171 178
South-Central Region 25 20 46 38 44 38
Kardzhali - 1 4 2 1 -
Pazardzhik 1 2 2 7 5 13
Plovdiv 17 8 22 23 17 19
Smolyan - 3 5 2 2 5
Haskovo 7 6 13 4 19 1
Source: National Statistical Institute

11
NUMBER OF DISTRIBUTED STERILE SETS (SYRINGE WITH 2 NEEDLES) OVER THE PERIOD 2005 – 2015
Source: National Centre for Addictions and partners
INDIVIDUAL CLIENTS REACHED BY THE HARM REDUCTION PROGRAMMES
OVER THE PERIOD 2010 – 2015
8057 7983
10497
7779
8907 9170
1899 2018 1713 1430898 1019
0
2000
4000
6000
8000
10000
12000
2010 2011 2012 2013 2014 2015
Total number ofindividual
clients
New individualclients
Source: National Centre for Addictions and partners

12
PROPORTION OF PERSONS SEEKING TREATMENT
WHO EVER SHARED A NEEDLE OR SYRINGE (2000 – 2015)
Source: Survey of treatment demand related to drug use, National Focal Point on Drugs and Drug Addictions
PROPORTION OF PERSONS SEEKING TREATMENT
WITH DURATION OF PROBLEM DRUG USE OVER 5 YEARS (2001 – 2015)
Source: Survey of treatment demand related to drug use, National Focal Point on Drugs and Drug Addictions

13
PROPORTION OF PERSONS SEEKING TREATMENT RELATED TO USE OF HEROIN OR OTHER OPIOIDS, REGISTERED IN TREATMENT DEMAND SYSTEM IN BULGARIA
(1994 – 2015)
Source: National Monitoring System for Treatment Demand Related to Drug Use in Bulgaria, Survey of treatment demand related to drug use, National Focal Point on Drugs and Drug Addictions
14
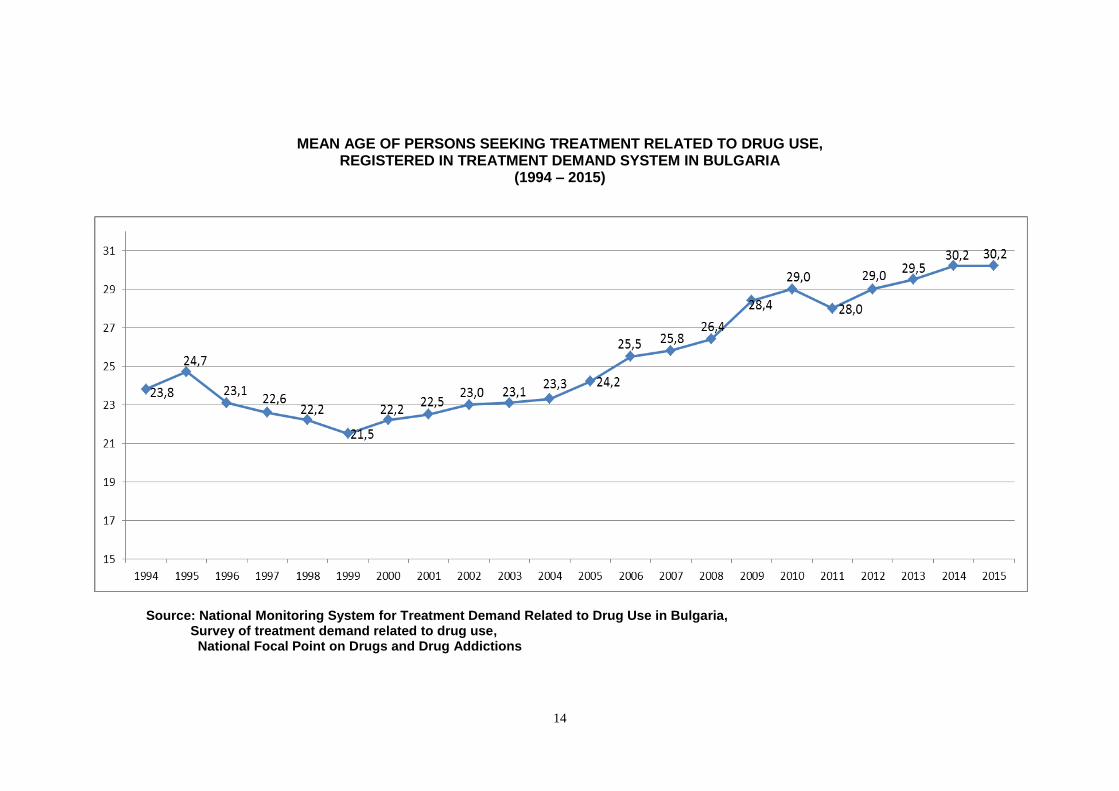
MEAN AGE OF PERSONS SEEKING TREATMENT RELATED TO DRUG USE, REGISTERED IN TREATMENT DEMAND SYSTEM IN BULGARIA
(1994 – 2015)
Source: National Monitoring System for Treatment Demand Related to Drug Use in Bulgaria, Survey of treatment demand related to drug use, National Focal Point on Drugs and Drug Addictions

15
NUMBER OF PATIENTS DIAGNOSED WITH F11-F19 ACCORDING TO ICD-10 IN DISPENSARIES
(2008 – 2015)
Source: Survey of treatment demand related to drug use, National Focal Point on Drugs and Drug Addictions
NUMBER OF PATIENTS DIAGNOSED WITH F11-F19 ACCORDING TO ICD-10 DISCHARGED FROM DISPENSARIES
(2008 – 2015)
Source: Survey of treatment demand related to drug use, National Focal Point on Drugs and Drug Addictions

16
DRUG PRICES AT STREET LEVEL (2010 – 2015)
Source: Study “Drug prices at street level”, National Focal Point on Drugs and
Drug Addictions, Ministry of Interior, MDC's, PIC, NGOs, 2010 – 2015
-5,5