policy competition for foreign direct investment in the
TRANSCRIPT
SERIE DESARROLLO PRODUCTIVO 49
POLICY COMPETITION FOR FOREIGN DIRECT INVESTMENTIN THE CARIBBEAN BASIN: COSTA RICA,
THE DOMINICAN REPUBLICAND JAMAICA
Michael Mortimore and Wilson Peres
January 1998
Michael Mortimore ([email protected]) is the Officer-in-Charge of the Unit onInvestment and Corporate Strategies. Wilson Peres ([email protected]) is the Chief of theJoint ECLAC/UNIDO Industrial and Technological Development Unit. Both units are inthe United Nations Economic Commission for Latin America and the Caribbean (ECLAC)headquarters in Santiago, Chile. Zaida Soto (ECLAC) and María de los Llanos Martínezprepared the tables based on the Competitive Analysis of Nations (CANPLUS) software.
2
CONTENTS
Page
ABSTRACT ............................................................................................ 5
RESUMEN ............................................................................................ 7
1. INTRODUCTION .............................................................................. 9
2. THE CARIBBEAN BASIN IN A GLOBAL CONTEXT ................................ 11
3. THE SECTORAL AND COMPANY LEVELS ........................................... 21
4. POLICY COMPETITION: HOW COUNTRIES COMPETE........................... 33
4.1 THE LEGAL FRAMEWORK FOR FOREIGN DIRECTINVESTMENT ......................................................................... 33
4.2 SELLING A COUNTRY’S IMAGE ................................................ 364.3 INVESTMENT IN EXPORT PLATFORMS...................................... 394.4 COMPETITIVENESS POLICIES................................................... 44
5. MEASURING POLICY COMPETITION .................................................. 49
6. THE DYNAMICS OF POLICY COMPETITION AND THE LIMITSOF NATIONAL POLICY..................................................................... 53
6.1 THE EXTENT OF POLICY COMPETITION .................................... 536.2 IS POLICY COMPETITION INTENSIFYING?.................................. 556.3 THE IMPACT OF POLICY COMPETITION .................................... 566.4 POLICY IMPLICATIONS............................................................ 59
7. CONCLUSIONS ............................................................................... 63
8. BIBLIOGRAPHY ............................................................................... 67
TABLES AND FIGURE
Table 1: Caribbean basin countries: economic indicators, 1994 .................. 10Table 2: OECD total imports, by source regions, 1980-1994........................ 12Table 3: OECD imports of natural resources, by source regions,
1980-1994 ............................................................................... 13Table 4: OECD imports of manufactures, by source regions, 1980-1994 ....... 14Table 5: Western European imports of manufactures, by source regions,
1980-1994 ............................................................................... 15Table 6: North American imports of manufactures, by source regions,
1980-1994 ............................................................................... 16
3
Page
Table 7: Japanese imports of manufactures, by source regions,1980-1994 ............................................................................... 17
Table 8: The Caribbean basin’s international competitiveness, in theNorth American market, 1980, 1985, 1990 and 1994.................... 18
Table 9: United States imports for consumption from developing countriesunder HTS provision 9802.00.80, 1989 and 1993......................... 20
Table 10: Structure of North American imports of garments (SITC 84), bysource regions, 1980-1994 ...................................................... 22
Table 11: Dominican Republic: aspects of its international competitivenessin the North American market 1980, 1985, 1990 and 1994.......... 23
Table 12: Costa Rica: aspects of its international competitiveness inthe North American market 1980, 1985, 1990 and 1994 ............. 24
Table 13: Jamaica: aspects of its international competitiveness in theNorth American market 1980, 1985, 1990 and 1994 ................. 25
Table 14: Structure of North American imports of men’s and boys’ outergarments of textile fabrics, by source regions, 1980-1994 .............. 27
Table 15: Structure of North American imports of knitted or crochetedundergarments, by source regions, 1980-1994 .............................. 28
Table 16: Foreign investment regimes in Latin America and the Caribbean ..... 32Table 17: Export incentives in Costa Rica, 1997........................................ 38Table 18: Variables included in the capability to attract investment
(CAI) index............................................................................. 48Table 19: The main components of Caribbean basin countries’ CAI............... 49Table 20: The climate for foreign investment in Caribbean basin countries .... 50Table 21: Real exchange rate for exports .................................................. 52
Figure: Real exchange rate for exports .................................................. 52

5
ABSTRACT
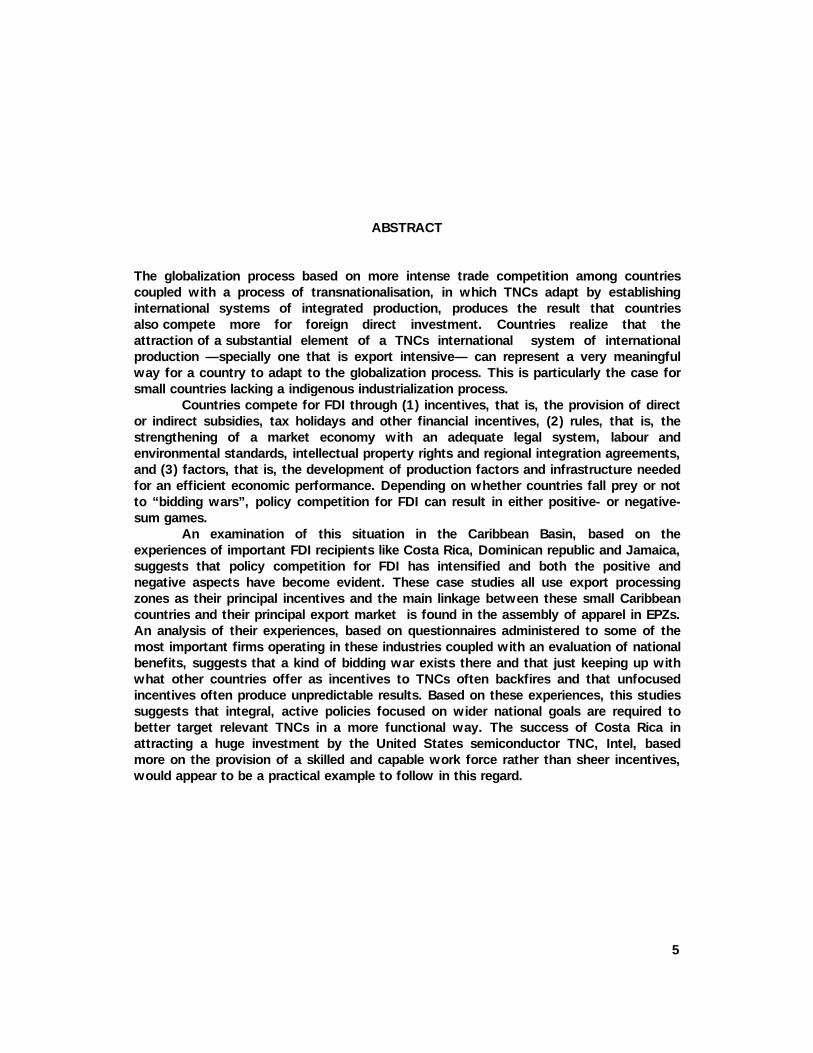
The globalization process based on more intense trade competition among countriescoupled with a process of transnationalisation, in which TNCs adapt by establishinginternational systems of integrated production, produces the result that countriesalso compete more for foreign direct investment. Countries realize that theattraction of a substantial element of a TNCs international system of internationalproduction —specially one that is export intensive— can represent a very meaningfulway for a country to adapt to the globalization process. This is particularly the case forsmall countries lacking a indigenous industrialization process.
Countries compete for FDI through (1) incentives, that is, the provision of director indirect subsidies, tax holidays and other financial incentives, (2) rules, that is, thestrengthening of a market economy with an adequate legal system, labour andenvironmental standards, intellectual property rights and regional integration agreements,and (3) factors, that is, the development of production factors and infrastructure neededfor an efficient economic performance. Depending on whether countries fall prey or notto “bidding wars”, policy competition for FDI can result in either positive- or negative-sum games.
An examination of this situation in the Caribbean Basin, based on theexperiences of important FDI recipients like Costa Rica, Dominican republic and Jamaica,suggests that policy competition for FDI has intensified and both the positive andnegative aspects have become evident. These case studies all use export processingzones as their principal incentives and the main linkage between these small Caribbeancountries and their principal export market is found in the assembly of apparel in EPZs.An analysis of their experiences, based on questionnaires administered to some of themost important firms operating in these industries coupled with an evaluation of nationalbenefits, suggests that a kind of bidding war exists there and that just keeping up withwhat other countries offer as incentives to TNCs often backfires and that unfocusedincentives often produce unpredictable results. Based on these experiences, this studiessuggests that integral, active policies focused on wider national goals are required tobetter target relevant TNCs in a more functional way. The success of Costa Rica inattracting a huge investment by the United States semiconductor TNC, Intel, basedmore on the provision of a skilled and capable work force rather than sheer incentives,would appear to be a practical example to follow in this regard.

7
RESUMEN
Las empresas transnacionales (ETs) se han adaptado a la globalización de los mercadosmundiales estableciendo sistemas internacionales de producción, lo que ha llevado quelos países en desarrollo compitan por captar mayores afluencias de inversión extranjeradirecta (IED). Esos países son conscientes que lograr que una ET los incluya en susistema de producción internacional puede representar una vía importante paraincorporarse al proceso de globalización, siendo este mecanismo especialmenteimportante para países pequeños.
La competencia por IED opera mediante: i) subsidios directos e indirectos,incentivos financieros y exención tributaria; ii) el desarrollo de una economía de mercadocon un marco regulatorio adecuado, estándares laborales y ambientales, derechos depropiedad intelectual y acuerdos de integración regional; y iii) la creación de factores deproducción y de infraestructura para un desempeño económico eficiente. Dependiendo silos países optan por una “guerra de incentivos” o por fortalecer la creación de factoresproductivos, las políticas para competir por la IED pueden resultar en juegos de sumanegativa o positiva.
La revisión de la competencia por IED en la Cuenca del Caribe, basada en lasexperiencias de Costa Rica, República Dominicana y Jamaica, indica que las políticaspara atraer la IED se han vuelto más intensivas en incentivos, siendo uno de losprincipales la posibilidad de operar en zonas de procesamiento de exportación (ZPE).Considerando que el principal nexo entre esos países y su mayor mercado deexportación (el de Estados Unidos) se encuentra en ensamblar prendas de vestir en ZPE,se evalua esa industria en cada uno de ellos. Un análisis de estas experiencias, basadasen encuestas realizadas a algunas de las empresas más importantes que operan en esaactividad, junto con una evaluación de costos y beneficios a nivel nacional, permiteconcluir que el mero equiparar lo que otros países ofrecen no necesariamente trae losbeneficios deseados y que incentivos poco claros generalmente producen resultadosimprevisibles. Para mejorar la eficacia de la política para atraer a ETs particulares, esnecesario ubicarla en el de marco políticas activas e integrales enfocadas hacía metasnacionales de competitividad. El éxito de Costa Rica en atraer inversiones en particularde Intel, empresa líder en microprocesadores se ha basado más en ofrecer una fuerzalaboral competente y capacitada que en igualar los incentivos ofrecidos por suscompetidores. En este sentido es un ejemplo a seguir.

9
1. INTRODUCTION
Policy competition is rapidly becoming a relevant issue in Latin America and theCaribbean in the mid-1990s. Renewed interest in active government policies whichfoster industrial and economic competitiveness in the region has naturally given rise to agrowing interest in the impact those policies will have and in whether policiesundertaken by different countries, or regions within a country, complement or competewith each other (Peres, 1996). Consequently, there is a growing concern about theeffects that potential or actual “bidding wars” may have, particularly in larger countries,while considerations to prevent unfair policy competition and to benefit from synergy areat least incipient in most free-trade agreements.
This paper considers three main categories of policy competition for foreigninvestment: (a) competition through the provision of direct and indirect subsidies, taxholidays and other similar financial incentives (incentives-based competition),(b) competition through the strengthening of a market economy with an adequate legalsystem, labour and environmental standards, intellectual property rights and regionalintegration agreements (rules-based competition) and (c) competition through thedevelopment of production factors and infrastructure needed for an efficient economicperformance (factor-creation competition).1 Each of these forms of policy competitionmay result in positive- or negative-sum games.
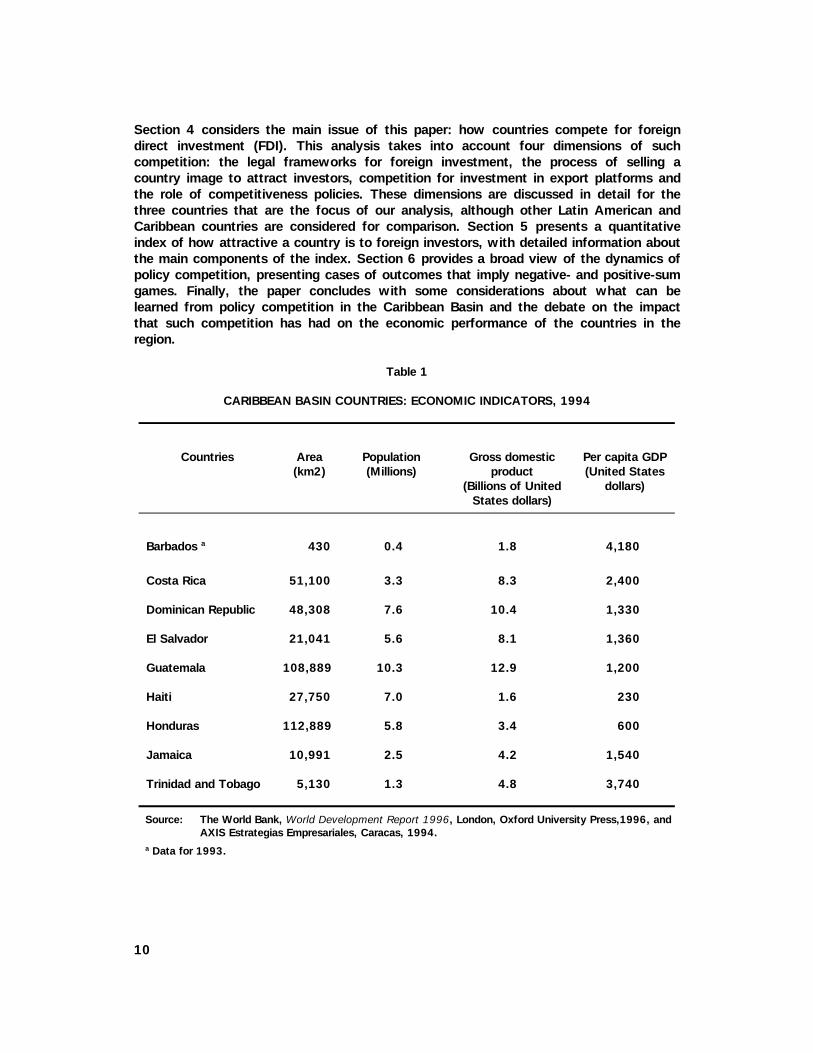
Studying the main characteristics of policy competition for foreign investment inthe Caribbean Basin countries enables us to see such competition at work among smallcountries with relatively similar economic structures and performances in the lastdecades.2 The paper focuses on Costa Rica, Jamaica and the Dominican Republic. Thesethree countries are among the largest in the area and are quickly shifting away fromnatural resource enclaves (e.g., bananas, coffee, sugar and metallic ores) to morediversified economies, increasingly based on export processing zones (EPZs),3 tourismand a somewhat significant domestic market, at least for basic food products and othernon-durable consumer goods. Table 1 presents some of the main economic indicators forthose countries.
This paper is divided into seven sections. After the introduction, section 2presents the main characteristics of the Caribbean Basin integration into the globaleconomy. This is followed in section 3 by an analysis at the sectoral and company levelswhich shows how that integration has shaped enterprise and industry development.
1 These categories are based in Oman (1996), but they include more components in rules-based competition (the strengthening of a market economy and an independent judiciary) anddevelop the new category of factor-creation competition, which is pertinent for countries withactive competitiveness policies.
2 The Caribbean Basin countries include the 24 Central American and Caribbean countrieswhich are beneficiaries of the United States Caribbean Basin Economic Recovery Act (USITC,1995a). Cuba is not included.
3 In 1995, EPZs accounted for 71% of total exports in the Dominican Republic, 30% inJamaica and 20% in Costa Rica. The corresponding figure for Mexico was 47%.
10
Section 4 considers the main issue of this paper: how countries compete for foreigndirect investment (FDI). This analysis takes into account four dimensions of suchcompetition: the legal frameworks for foreign investment, the process of selling acountry image to attract investors, competition for investment in export platforms andthe role of competitiveness policies. These dimensions are discussed in detail for thethree countries that are the focus of our analysis, although other Latin American andCaribbean countries are considered for comparison. Section 5 presents a quantitativeindex of how attractive a country is to foreign investors, with detailed information aboutthe main components of the index. Section 6 provides a broad view of the dynamics ofpolicy competition, presenting cases of outcomes that imply negative- and positive-sumgames. Finally, the paper concludes with some considerations about what can belearned from policy competition in the Caribbean Basin and the debate on the impactthat such competition has had on the economic performance of the countries in theregion.
Table 1
CARIBBEAN BASIN COUNTRIES: ECONOMIC INDICATORS, 1994
Countries Area(km2)
Population(Millions)
Gross domesticproduct
(Billions of UnitedStates dollars)
Per capita GDP(United States
dollars)
Barbados a 430 0.4 1.8 4,180
Costa Rica 51,100 3.3 8.3 2,400
Dominican Republic 48,308 7.6 10.4 1,330
El Salvador 21,041 5.6 8.1 1,360
Guatemala 108,889 10.3 12.9 1,200
Haiti 27,750 7.0 1.6 230
Honduras 112,889 5.8 3.4 600
Jamaica 10,991 2.5 4.2 1,540
Trinidad and Tobago 5,130 1.3 4.8 3,740
Source: The World Bank, World Development Report 1996, London, Oxford University Press,1996, andAXIS Estrategias Empresariales, Caracas, 1994.
a Data for 1993.
11
2. THE CARIBBEAN BASIN IN A GLOBAL CONTEXT
The major changes in the economic situation of the Caribbean Basin are betterunderstood by placing them in a global context, because for the most part they havebeen induced by the globalization process rather than by national policy initiatives. Theglobalization process is characterized by the intensification of international competitionand by the transnationalization of the process via foreign direct investment ortechnology transfer. In this context, corporations with global sourcing strategies are theeconomic agents which most influence trade outcomes (Mortimore, 1995a). Thesituation is clearest with regard to the international competitiveness of countries, asmeasured by their foreign trade performance. This can best be depicted by makingreference to a number of tables based on results of the Competitive Analysis of Nations(CANPLUS) software.4 The principal objective of these tables is to demonstrate majorchanges in the international competitiveness of the distinct regions or countries, basedon international the dynamic of their market shares.
The member countries of the Organization of Economic Cooperation andDevelopment (OECD) account for about 70 percent of total world imports. Table 2indicates that the source countries for OECD imports changed significantly in 1980-1994.5 A first observation is that the OECD countries imported more from each otherduring this period (reaching almost three-quarters of their total imports in 1990),although there was a relative decline in 1990-1994. Evidently, if the OECD memberstraded more among themselves, their imports from developing countries and transitioneconomies declined in relative terms. That is evident in table 2 with regard to LatinAmerica (from 5.3% to 4.8% of OECD imports), Africa (from 5.9% to 2.2%) andEastern Europe (from 1.3% to 0.9%). However, it is definitely not the case fordeveloping Asia (from 7.8% to 14.1%) or Turkey (from 0.2% to 0.4%). Thus, amongdeveloping countries, market share gains were very much concentrated in developingAsia.6
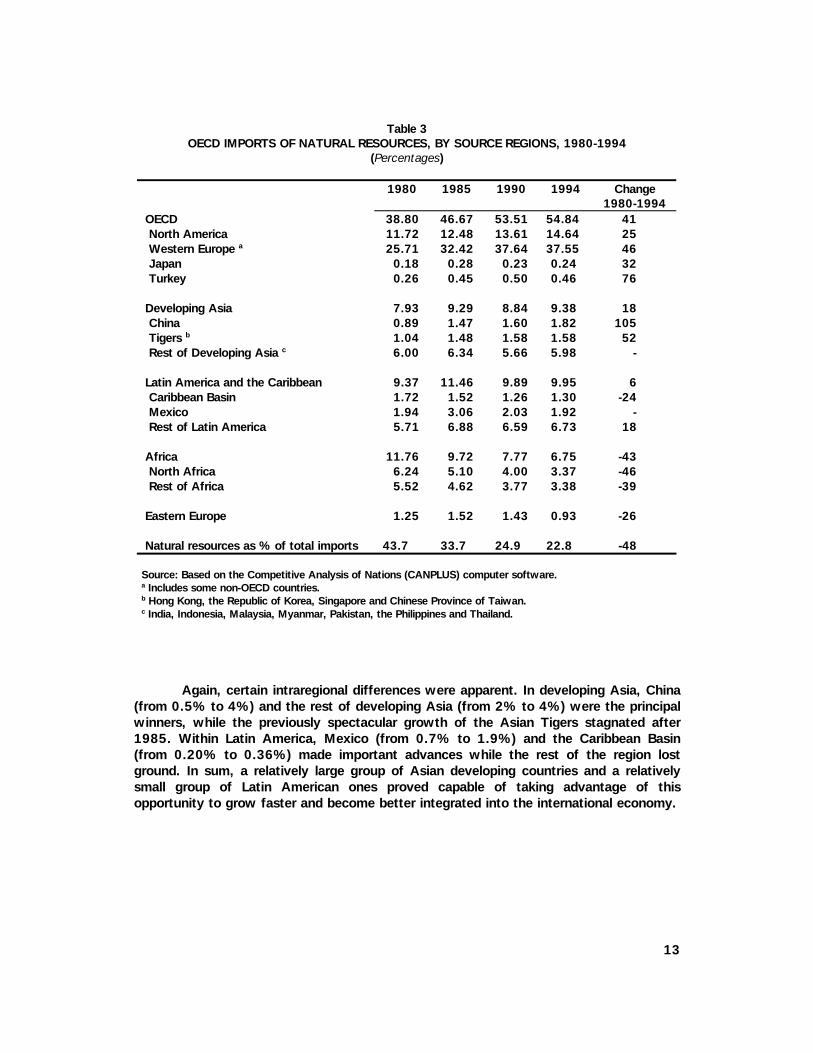
This phenomenon can be further elaborated by distinguishing the situation ofnatural resources from that of manufactures. Table 3 demonstrates that naturalresources are definitely not dynamic elements of world trade. As a proportion of allOECD imports, they declined about one-half over 1980-1994, from 44% to 23% of thetotal. The developing countries varied somewhat in their performance: developing Asiagained OECD import market shares (from 8% to 9%), Latin America maintained its share
4 The Competitive Analysis of Nations (CANPLUS) software has been developed by the
Division of Production, Productivity and Management of the United Nations EconomicCommission for Latin America and the Caribbean (ECLAC). For an example of its potential, seeMortimore (1995b).
5 Data for 1994 do not include Mexico as an OECD member country.6 Developing Asia includes China, the Republic of Korea, Hong Kong, India, Indonesia,
Malaysia, Myanmar, Pakistan, the Philippines, Singapore, Taiwan (Province of China) andThailand.
12
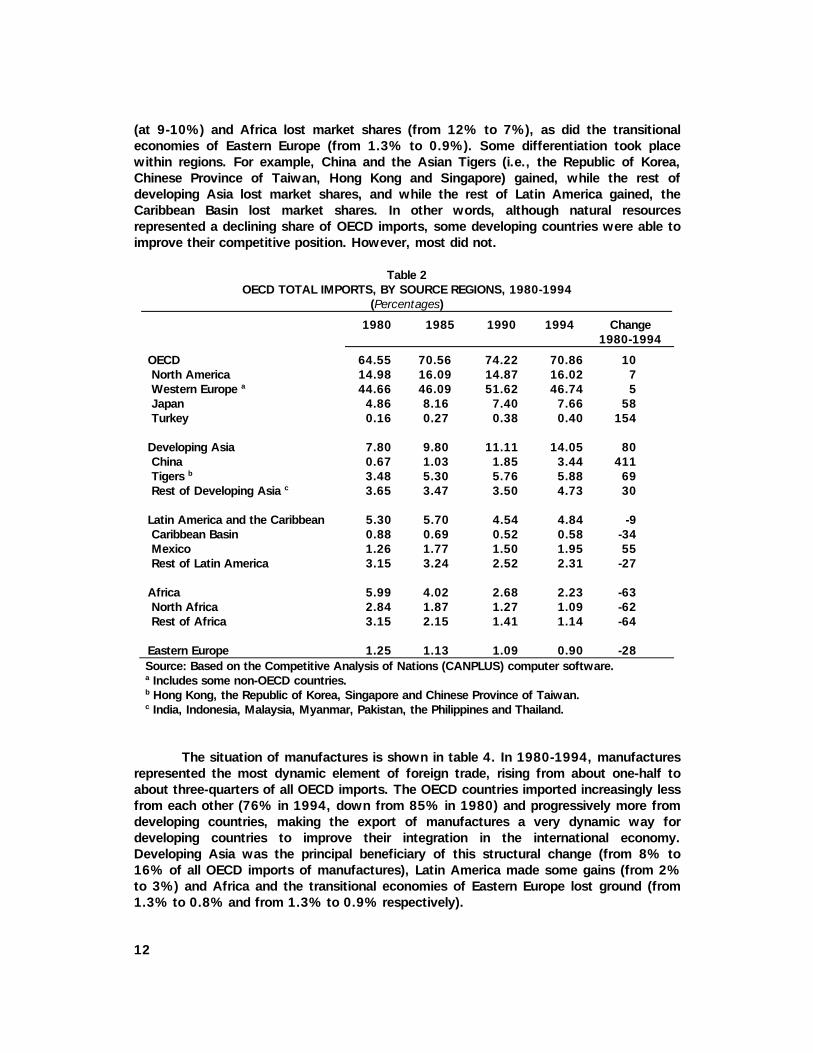
(at 9-10%) and Africa lost market shares (from 12% to 7%), as did the transitionaleconomies of Eastern Europe (from 1.3% to 0.9%). Some differentiation took placewithin regions. For example, China and the Asian Tigers (i.e., the Republic of Korea,Chinese Province of Taiwan, Hong Kong and Singapore) gained, while the rest ofdeveloping Asia lost market shares, and while the rest of Latin America gained, theCaribbean Basin lost market shares. In other words, although natural resourcesrepresented a declining share of OECD imports, some developing countries were able toimprove their competitive position. However, most did not.
Table 2OECD TOTAL IMPORTS, BY SOURCE REGIONS, 1980-1994
(Percentages)
1980 1985 1990 1994 Change1980-1994
OECD 64.55 70.56 74.22 70.86 10 North America 14.98 16.09 14.87 16.02 7 Western Europe a 44.66 46.09 51.62 46.74 5 Japan 4.86 8.16 7.40 7.66 58 Turkey 0.16 0.27 0.38 0.40 154
Developing Asia 7.80 9.80 11.11 14.05 80 China 0.67 1.03 1.85 3.44 411 Tigers b 3.48 5.30 5.76 5.88 69 Rest of Developing Asia c 3.65 3.47 3.50 4.73 30
Latin America and the Caribbean 5.30 5.70 4.54 4.84 -9 Caribbean Basin 0.88 0.69 0.52 0.58 -34 Mexico 1.26 1.77 1.50 1.95 55 Rest of Latin America 3.15 3.24 2.52 2.31 -27
Africa 5.99 4.02 2.68 2.23 -63 North Africa 2.84 1.87 1.27 1.09 -62 Rest of Africa 3.15 2.15 1.41 1.14 -64
Eastern Europe 1.25 1.13 1.09 0.90 -28Source: Based on the Competitive Analysis of Nations (CANPLUS) computer software.a Includes some non-OECD countries.b Hong Kong, the Republic of Korea, Singapore and Chinese Province of Taiwan.c India, Indonesia, Malaysia, Myanmar, Pakistan, the Philippines and Thailand.
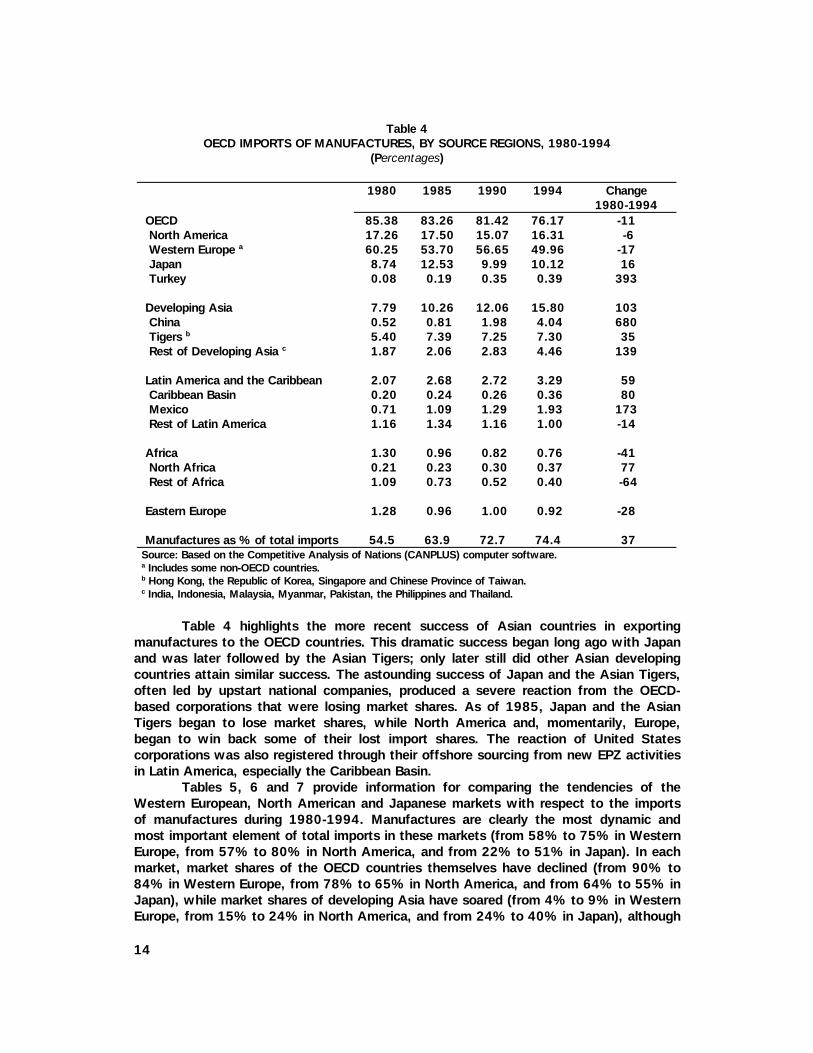
The situation of manufactures is shown in table 4. In 1980-1994, manufacturesrepresented the most dynamic element of foreign trade, rising from about one-half toabout three-quarters of all OECD imports. The OECD countries imported increasingly lessfrom each other (76% in 1994, down from 85% in 1980) and progressively more fromdeveloping countries, making the export of manufactures a very dynamic way fordeveloping countries to improve their integration in the international economy.Developing Asia was the principal beneficiary of this structural change (from 8% to16% of all OECD imports of manufactures), Latin America made some gains (from 2%to 3%) and Africa and the transitional economies of Eastern Europe lost ground (from1.3% to 0.8% and from 1.3% to 0.9% respectively).
13
Table 3OECD IMPORTS OF NATURAL RESOURCES, BY SOURCE REGIONS, 1980-1994
(Percentages)
1980 1985 1990 1994 Change1980-1994
OECD 38.80 46.67 53.51 54.84 41 North America 11.72 12.48 13.61 14.64 25 Western Europe a 25.71 32.42 37.64 37.55 46 Japan 0.18 0.28 0.23 0.24 32 Turkey 0.26 0.45 0.50 0.46 76
Developing Asia 7.93 9.29 8.84 9.38 18 China 0.89 1.47 1.60 1.82 105 Tigers b 1.04 1.48 1.58 1.58 52 Rest of Developing Asia c 6.00 6.34 5.66 5.98 -
Latin America and the Caribbean 9.37 11.46 9.89 9.95 6 Caribbean Basin 1.72 1.52 1.26 1.30 -24 Mexico 1.94 3.06 2.03 1.92 - Rest of Latin America 5.71 6.88 6.59 6.73 18
Africa 11.76 9.72 7.77 6.75 -43 North Africa 6.24 5.10 4.00 3.37 -46 Rest of Africa 5.52 4.62 3.77 3.38 -39
Eastern Europe 1.25 1.52 1.43 0.93 -26
Natural resources as % of total imports 43.7 33.7 24.9 22.8 -48
Source: Based on the Competitive Analysis of Nations (CANPLUS) computer software.a Includes some non-OECD countries.b Hong Kong, the Republic of Korea, Singapore and Chinese Province of Taiwan.c India, Indonesia, Malaysia, Myanmar, Pakistan, the Philippines and Thailand.
Again, certain intraregional differences were apparent. In developing Asia, China(from 0.5% to 4%) and the rest of developing Asia (from 2% to 4%) were the principalwinners, while the previously spectacular growth of the Asian Tigers stagnated after1985. Within Latin America, Mexico (from 0.7% to 1.9%) and the Caribbean Basin(from 0.20% to 0.36%) made important advances while the rest of the region lostground. In sum, a relatively large group of Asian developing countries and a relativelysmall group of Latin American ones proved capable of taking advantage of thisopportunity to grow faster and become better integrated into the international economy.
14
Table 4OECD IMPORTS OF MANUFACTURES, BY SOURCE REGIONS, 1980-1994
(Percentages)
1980 1985 1990 1994 Change1980-1994
OECD 85.38 83.26 81.42 76.17 -11 North America 17.26 17.50 15.07 16.31 -6 Western Europe a 60.25 53.70 56.65 49.96 -17 Japan 8.74 12.53 9.99 10.12 16 Turkey 0.08 0.19 0.35 0.39 393
Developing Asia 7.79 10.26 12.06 15.80 103 China 0.52 0.81 1.98 4.04 680 Tigers b 5.40 7.39 7.25 7.30 35 Rest of Developing Asia c 1.87 2.06 2.83 4.46 139
Latin America and the Caribbean 2.07 2.68 2.72 3.29 59 Caribbean Basin 0.20 0.24 0.26 0.36 80 Mexico 0.71 1.09 1.29 1.93 173 Rest of Latin America 1.16 1.34 1.16 1.00 -14
Africa 1.30 0.96 0.82 0.76 -41 North Africa 0.21 0.23 0.30 0.37 77 Rest of Africa 1.09 0.73 0.52 0.40 -64
Eastern Europe 1.28 0.96 1.00 0.92 -28
Manufactures as % of total imports 54.5 63.9 72.7 74.4 37Source: Based on the Competitive Analysis of Nations (CANPLUS) computer software.a Includes some non-OECD countries.b Hong Kong, the Republic of Korea, Singapore and Chinese Province of Taiwan.c India, Indonesia, Malaysia, Myanmar, Pakistan, the Philippines and Thailand.
Table 4 highlights the more recent success of Asian countries in exportingmanufactures to the OECD countries. This dramatic success began long ago with Japanand was later followed by the Asian Tigers; only later still did other Asian developingcountries attain similar success. The astounding success of Japan and the Asian Tigers,often led by upstart national companies, produced a severe reaction from the OECD-based corporations that were losing market shares. As of 1985, Japan and the AsianTigers began to lose market shares, while North America and, momentarily, Europe,began to win back some of their lost import shares. The reaction of United Statescorporations was also registered through their offshore sourcing from new EPZ activitiesin Latin America, especially the Caribbean Basin.
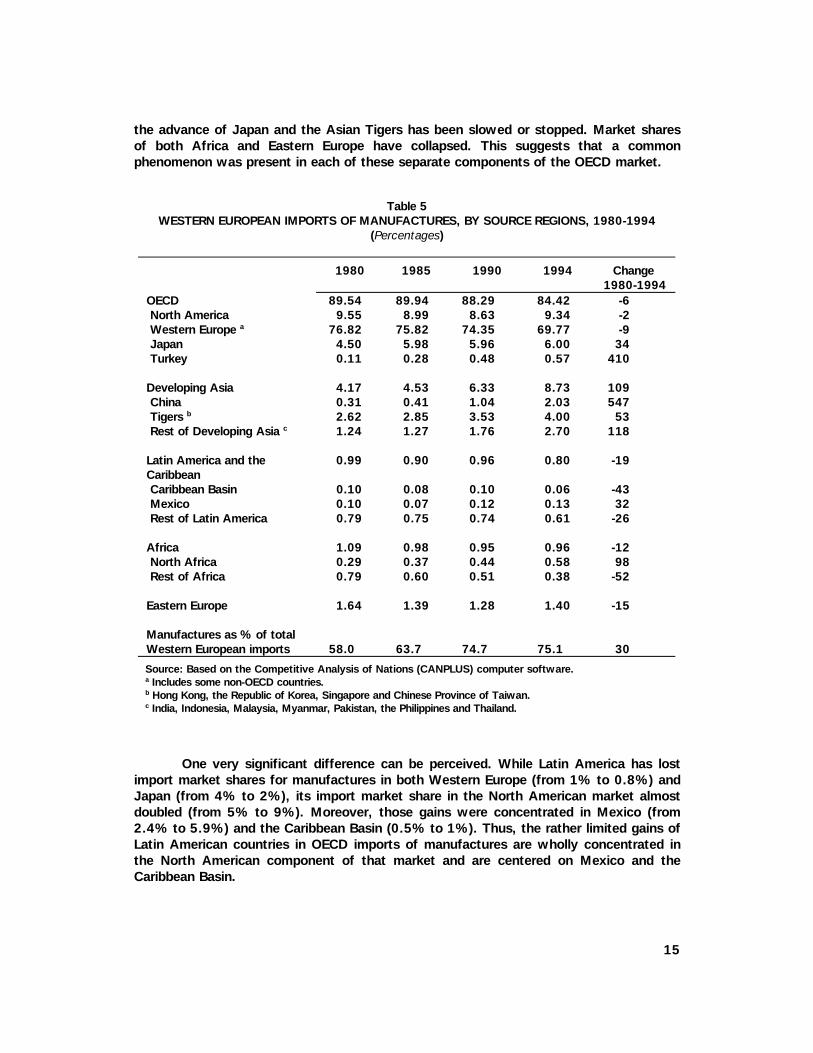
Tables 5, 6 and 7 provide information for comparing the tendencies of theWestern European, North American and Japanese markets with respect to the importsof manufactures during 1980-1994. Manufactures are clearly the most dynamic andmost important element of total imports in these markets (from 58% to 75% in WesternEurope, from 57% to 80% in North America, and from 22% to 51% in Japan). In eachmarket, market shares of the OECD countries themselves have declined (from 90% to84% in Western Europe, from 78% to 65% in North America, and from 64% to 55% inJapan), while market shares of developing Asia have soared (from 4% to 9% in WesternEurope, from 15% to 24% in North America, and from 24% to 40% in Japan), although
15
the advance of Japan and the Asian Tigers has been slowed or stopped. Market sharesof both Africa and Eastern Europe have collapsed. This suggests that a commonphenomenon was present in each of these separate components of the OECD market.
Table 5WESTERN EUROPEAN IMPORTS OF MANUFACTURES, BY SOURCE REGIONS, 1980-1994
(Percentages)
1980 1985 1990 1994 Change1980-1994
OECD 89.54 89.94 88.29 84.42 -6 North America 9.55 8.99 8.63 9.34 -2 Western Europe a 76.82 75.82 74.35 69.77 -9 Japan 4.50 5.98 5.96 6.00 34 Turkey 0.11 0.28 0.48 0.57 410
Developing Asia 4.17 4.53 6.33 8.73 109 China 0.31 0.41 1.04 2.03 547 Tigers b 2.62 2.85 3.53 4.00 53 Rest of Developing Asia c 1.24 1.27 1.76 2.70 118
Latin America and theCaribbean
0.99 0.90 0.96 0.80 -19
Caribbean Basin 0.10 0.08 0.10 0.06 -43 Mexico 0.10 0.07 0.12 0.13 32 Rest of Latin America 0.79 0.75 0.74 0.61 -26
Africa 1.09 0.98 0.95 0.96 -12 North Africa 0.29 0.37 0.44 0.58 98 Rest of Africa 0.79 0.60 0.51 0.38 -52
Eastern Europe 1.64 1.39 1.28 1.40 -15
Manufactures as % of totalWestern European imports 58.0 63.7 74.7 75.1 30
Source: Based on the Competitive Analysis of Nations (CANPLUS) computer software.a Includes some non-OECD countries.b Hong Kong, the Republic of Korea, Singapore and Chinese Province of Taiwan.c India, Indonesia, Malaysia, Myanmar, Pakistan, the Philippines and Thailand.
One very significant difference can be perceived. While Latin America has lostimport market shares for manufactures in both Western Europe (from 1% to 0.8%) andJapan (from 4% to 2%), its import market share in the North American market almostdoubled (from 5% to 9%). Moreover, those gains were concentrated in Mexico (from2.4% to 5.9%) and the Caribbean Basin (0.5% to 1%). Thus, the rather limited gains ofLatin American countries in OECD imports of manufactures are wholly concentrated inthe North American component of that market and are centered on Mexico and theCaribbean Basin.
16
Table 6NORTH AMERICAN IMPORTS OF MANUFACTURES, BY SOURCE REGIONS, 1980-1994
(Percentages)
1980 1985 1990 1994 Change1980-1994
OECD 77.80 74.96 69.54 64.86 -17 North America 33.69 28.41 26.91 26.65 -21 Western Europe a 24.37 23.16 21.19 18.68 -23 Japan 19.99 23.44 21.23 19.35 3 Turkey 0.01 0.08 0.14 0.16 1163
Developing Asia 14.52 17.62 21.60 24.28 67 China 0.53 1.03 3.34 6.09 1048 Tigers b 11.00 13.64 13.84 11.61 6 Rest of Developing Asia c 2.99 2.95 4.42 6.58 120
Latin America and the Caribbean 4.74 5.52 7.11 8.57 81 Caribbean Basin 0.49 0.53 0.74 1.03 110 Mexico 2.38 2.87 4.49 5.89 147 Rest of Latin America 1.87 2.12 1.88 1.65 -12
Africa 1.66 0.76 0.45 0.40 -76 North Africa 0.03 0.02 0.05 0.07 144 Rest of Africa 1.63 0.74 0.41 0.33 -80
Eastern Europe 0.54 0.34 0.23 0.20 -62
Manufactures as % of total NorthAmerican imports 57.3 73.5 76.9 80.2 40
Source: Based on the Competitive Analysis of Nations (CANPLUS) computer software.a Includes some non-OECD countries.b Hong Kong, the Republic of Korea, Singapore and Chinese Province of Taiwan.c India, Indonesia, Malaysia, Myanmar, Pakistan, the Philippines and Thailand.
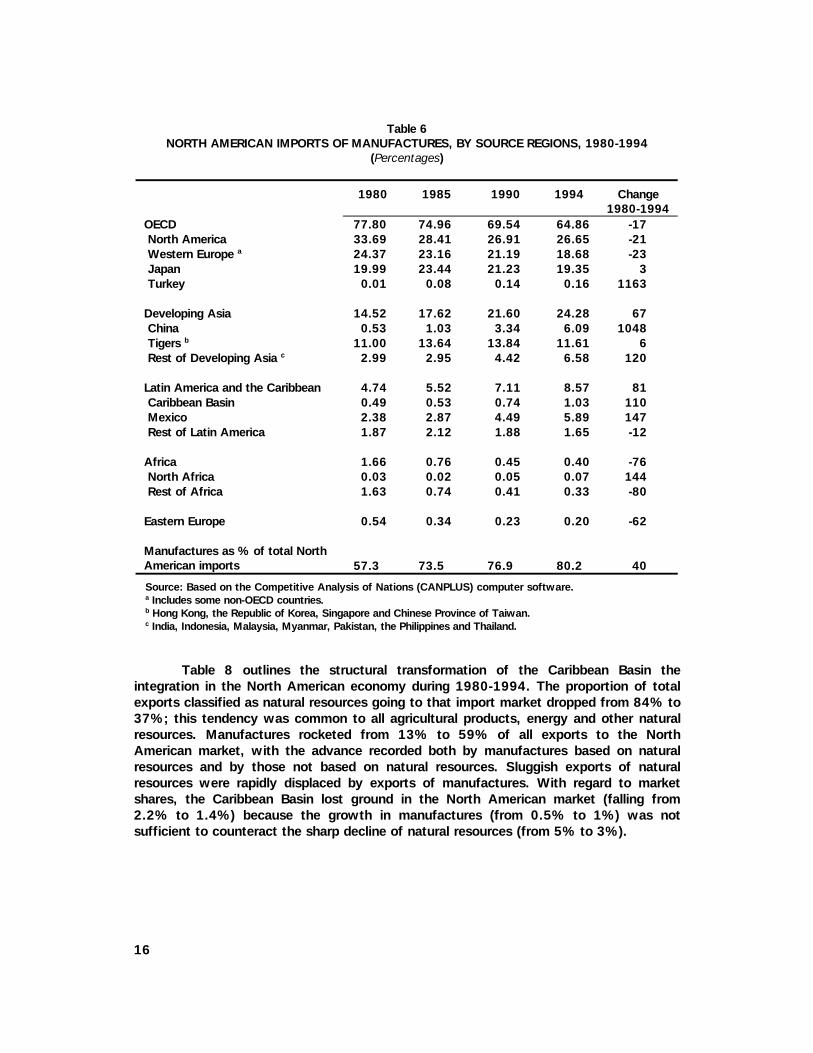
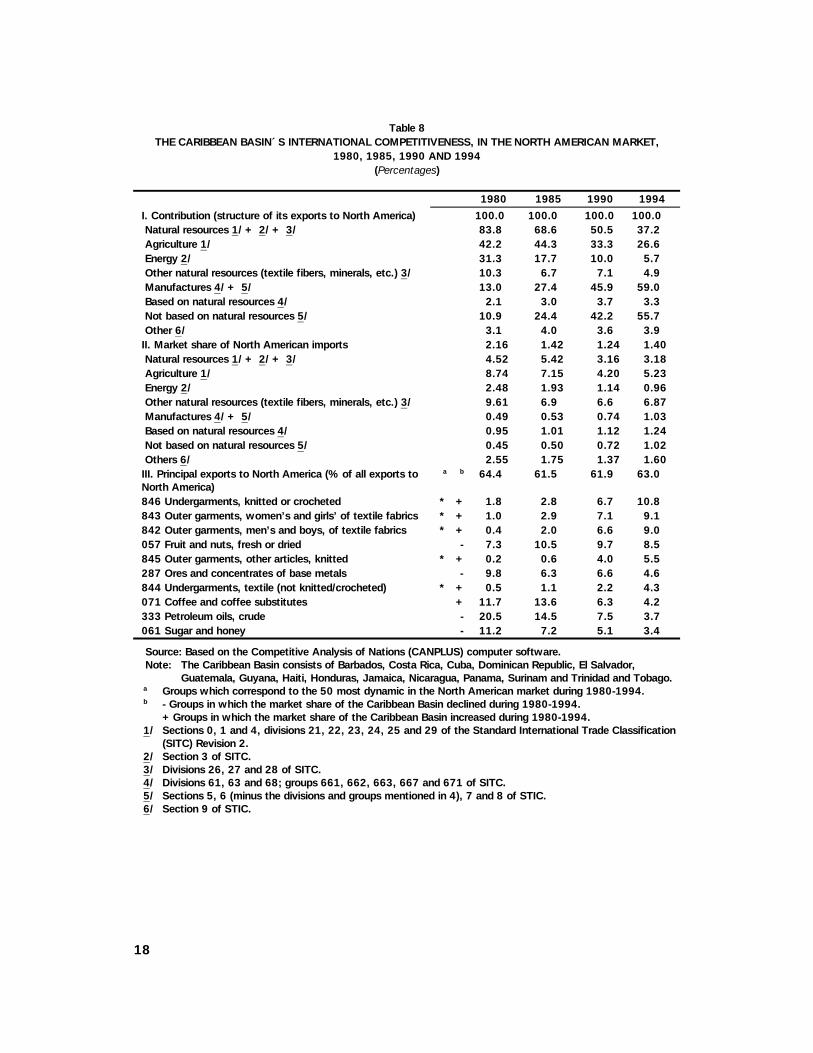
Table 8 outlines the structural transformation of the Caribbean Basin theintegration in the North American economy during 1980-1994. The proportion of totalexports classified as natural resources going to that import market dropped from 84% to37%; this tendency was common to all agricultural products, energy and other naturalresources. Manufactures rocketed from 13% to 59% of all exports to the NorthAmerican market, with the advance recorded both by manufactures based on naturalresources and by those not based on natural resources. Sluggish exports of naturalresources were rapidly displaced by exports of manufactures. With regard to marketshares, the Caribbean Basin lost ground in the North American market (falling from2.2% to 1.4%) because the growth in manufactures (from 0.5% to 1%) was notsufficient to counteract the sharp decline of natural resources (from 5% to 3%).

17
Table 7JAPANESE IMPORTS OF MANUFACTURES, BY SOURCE REGIONS, 1980-1994
(Percentages)
1980 1985 1990 1994 Change1980-1994
OECD 64.27 64.89 60.88 54.76 -15 North America 35.86 37.21 29.46 28.65 -20 Western Europe a 28.03 26.76 30.15 25.09 -11 Japan n.a. n.a. n.a. n.a. n.a. Turkey - 0.04 0.15 0.07 1478
Developing Asia 23.88 24.87 31.41 39.51 65 China 3.43 4.12 6.04 12.64 268 Tigers b 15.16 15.39 17.78 16.15 7 Rest of Developing Asia c 5.29 5.36 7.59 10.72 103
Latin America and the Caribbean 4.43 3.94 3.08 1.95 -56 Caribbean Basin 0.22 0.20 0.07 0.06 -75 Mexico 0.77 0.47 0.35 0.26 -66 Rest of Latin America 3.44 3.26 2.66 1.63 -53
Africa 3.29 2.46 1.24 0.94 -71 North Africa 0.07 0.03 0.03 0.03 -54 Rest of Africa 3.21 2.44 1.22 0.91 -72
Eastern Europe 0.62 0.66 0.46 0.16 -74
Manufactures as % of totalJapanese imports 21.8 29.4 47.0 50.8 133Source: Based on the Competitive Analysis of Nations (CANPLUS) computer software.a Includes some non-OECD countries.b Hong Kong, the Republic of Korea, Singapore and Chinese Province of Taiwan.c India, Indonesia, Malaysia, Myanmar, Pakistan, the Philippines and Thailand.
During 1980-1994, almost two-thirds of the Caribbean Basin’s exports to theNorth American market were made up of the ten product groups listed in table 8 (atthree digits of the Standard International Trade Classification or SITC). Five were naturalresources and five were manufactures. In 1980, natural resources (crude petroleum,coffee, sugar, metallic ores and bananas) were the most important export products,while by 1994 manufactures (without exception, garments) made up almost 40% of thetotal. By 1994, the only sectors in which the Caribbean Basin countries were gainingexport shares and which represented dynamic elements of the North American importmarket were garments.
18
Table 8THE CARIBBEAN BASIN´S INTERNATIONAL COMPETITIVENESS, IN THE NORTH AMERICAN MARKET,
1980, 1985, 1990 AND 1994(Percentages)
1980 1985 1990 1994
I. Contribution (structure of its exports to North America) 100.0 100.0 100.0 100.0 Natural resources 1/ + 2/ + 3/ 83.8 68.6 50.5 37.2 Agriculture 1/ 42.2 44.3 33.3 26.6 Energy 2/ 31.3 17.7 10.0 5.7 Other natural resources (textile fibers, minerals, etc.) 3/ 10.3 6.7 7.1 4.9 Manufactures 4/ + 5/ 13.0 27.4 45.9 59.0 Based on natural resources 4/ 2.1 3.0 3.7 3.3 Not based on natural resources 5/ 10.9 24.4 42.2 55.7 Other 6/ 3.1 4.0 3.6 3.9II. Market share of North American imports 2.16 1.42 1.24 1.40 Natural resources 1/ + 2/ + 3/ 4.52 5.42 3.16 3.18 Agriculture 1/ 8.74 7.15 4.20 5.23 Energy 2/ 2.48 1.93 1.14 0.96 Other natural resources (textile fibers, minerals, etc.) 3/ 9.61 6.9 6.6 6.87 Manufactures 4/ + 5/ 0.49 0.53 0.74 1.03 Based on natural resources 4/ 0.95 1.01 1.12 1.24 Not based on natural resources 5/ 0.45 0.50 0.72 1.02 Others 6/ 2.55 1.75 1.37 1.60III. Principal exports to North America (% of all exports toNorth America)
a b 64.4 61.5 61.9 63.0
846 Undergarments, knitted or crocheted * + 1.8 2.8 6.7 10.8843 Outer garments, women’s and girls’ of textile fabrics * + 1.0 2.9 7.1 9.1842 Outer garments, men’s and boys, of textile fabrics * + 0.4 2.0 6.6 9.0057 Fruit and nuts, fresh or dried - 7.3 10.5 9.7 8.5845 Outer garments, other articles, knitted * + 0.2 0.6 4.0 5.5287 Ores and concentrates of base metals - 9.8 6.3 6.6 4.6844 Undergarments, textile (not knitted/crocheted) * + 0.5 1.1 2.2 4.3071 Coffee and coffee substitutes + 11.7 13.6 6.3 4.2333 Petroleum oils, crude - 20.5 14.5 7.5 3.7061 Sugar and honey - 11.2 7.2 5.1 3.4
Source: Based on the Competitive Analysis of Nations (CANPLUS) computer software.Note: The Caribbean Basin consists of Barbados, Costa Rica, Cuba, Dominican Republic, El Salvador,
Guatemala, Guyana, Haiti, Honduras, Jamaica, Nicaragua, Panama, Surinam and Trinidad and Tobago.a Groups which correspond to the 50 most dynamic in the North American market during 1980-1994.b - Groups in which the market share of the Caribbean Basin declined during 1980-1994.
+Groups in which the market share of the Caribbean Basin increased during 1980-1994.1/ Sections 0, 1 and 4, divisions 21, 22, 23, 24, 25 and 29 of the Standard International Trade Classification
(SITC) Revision 2.2/ Section 3 of SITC.3/ Divisions 26, 27 and 28 of SITC.4/ Divisions 61, 63 and 68; groups 661, 662, 663, 667 and 671 of SITC.5/ Sections 5, 6 (minus the divisions and groups mentioned in 4), 7 and 8 of STIC.6/ Section 9 of STIC.
19
For centuries the main link between the Caribbean Basin and the internationaleconomy was the extraction and export of natural resources such as sugar, bananas andcoffee, which was later complemented by minerals such as bauxite and nickel. Thisresulted in a slow-growth trajectory for the countries because these are not dynamicgoods in world trade. Moreover, a dissonance or duality was created by the mainlyenclave-type activities, with severe instability from the boom and bust cycles associatedwith the international prices of most natural resource commodities. The fact that theregion finally began to generate other forms of integration into the international economythus represented a significant structural innovation. Export of manufactures, specificallygarments, and the tourism industry proved to be the most dynamic new sectors. Theseadvances resulted less from national policy initiatives of the Caribbean Basin countriesthemselves than from international market factors, new strategies on the part of mainlyUnited States corporations and United States national policy to assist thosecorporations. Moreover, several Asian companies also established apparel assemblyoperations to gain access to the United States market using export quotas of Caribbeancountries since quotas of the country in their region were used up.
The process of change began when United States corporations responded to theAsian challenge in their own national market, searching for the means to remaincompetitive. Many United States corporations altered their strategies to take advantageof existing United States legislation which permitted companies based in the UnitedStates to export locally made components to be assembled into finished productsoutside the country; duties or taxes on the re-imported goods were assessed only on thevalue added outside of the country. This was originally known as TSUS 807 regime andis now known as HTS 9802.7 Many Caribbean Basin countries faced a severeinternational debt crisis during the 1980s, and part of their reaction to thatmacroeconomic problem involved steep devaluations of the national currency, therebydrastically cheapening national labour costs measured in dollars. They also offered verysignificant incentives to foreign investors in terms of EPZ conveniences and tax relief.The result was a virtual explosion of the export of assembled goods to the United Statesmarket.
Excluding offshore financial centers, FDI flows to the Caribbean Basin in the1990s have been concentrated in just three countries: Costa Rica, the DominicanRepublic and Jamaica.8 Most of this investment came from the United States, while FDIfrom Japan and Western Europe has been rather small (IRELA and IDB, 1996). Solidstatistical information on the sectoral distribution of this FDI is not available; however,most of it has apparently been channeled to three basic activities: capital-intensivenatural resource projects, tourism projects, and a very large number of assemblyactivities usually located in export processing zones.
7 All 807 imports into the United States which originate from Caribbean Basin countries aresubject to the quotas applied under the Multifiber Arrangement and other quantitative restrictionsaffecting imports of shoes and leather goods. A special regime enacted in 1986 (known as Super807 or 807A) freed qualifying-nation exports from all quota agreements if the fabric wasproduced and cut in the United States or in other qualifying nations. Since 1987, the CaribbeanBasin Initiative II Bill allows the use of materials sourced outside the United States if the materialis not produced in the United States or is in short supply, and it permits the cutting and layout ofmaterials in qualifying Caribbean Basin Initiative (CBI) countries. However, it excludes the mostimportant contributors to value-added: cloth, design, grading and marketing (Kaplinski, 1993;USITC, 1995a).
8 According to balance-of-payments figures from the International Monetary Fund (IMF)quoted in ECLAC (1995), table 12, page 82.
20
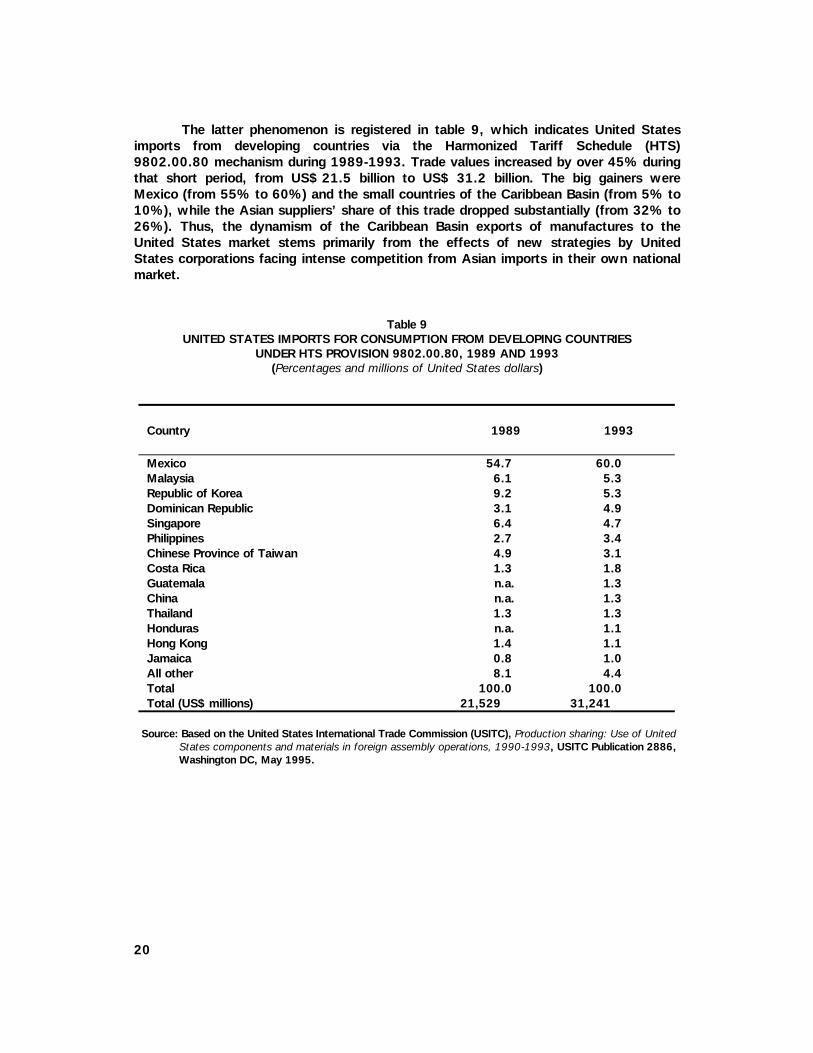
The latter phenomenon is registered in table 9, which indicates United Statesimports from developing countries via the Harmonized Tariff Schedule (HTS)9802.00.80 mechanism during 1989-1993. Trade values increased by over 45% duringthat short period, from US$ 21.5 billion to US$ 31.2 billion. The big gainers wereMexico (from 55% to 60%) and the small countries of the Caribbean Basin (from 5% to10%), while the Asian suppliers’ share of this trade dropped substantially (from 32% to26%). Thus, the dynamism of the Caribbean Basin exports of manufactures to theUnited States market stems primarily from the effects of new strategies by UnitedStates corporations facing intense competition from Asian imports in their own nationalmarket.
Table 9UNITED STATES IMPORTS FOR CONSUMPTION FROM DEVELOPING COUNTRIES
UNDER HTS PROVISION 9802.00.80, 1989 AND 1993(Percentages and millions of United States dollars)
Country 1989 1993
Mexico 54.7 60.0Malaysia 6.1 5.3Republic of Korea 9.2 5.3Dominican Republic 3.1 4.9Singapore 6.4 4.7Philippines 2.7 3.4Chinese Province of Taiwan 4.9 3.1Costa Rica 1.3 1.8Guatemala n.a. 1.3China n.a. 1.3Thailand 1.3 1.3Honduras n.a. 1.1Hong Kong 1.4 1.1Jamaica 0.8 1.0All other 8.1 4.4Total 100.0 100.0Total (US$ millions) 21,529 31,241
Source: Based on the United States International Trade Commission (USITC), Production sharing: Use of UnitedStates components and materials in foreign assembly operations, 1990-1993, USITC Publication 2886,Washington DC, May 1995.

21
3. THE SECTORAL AND COMPANY LEVELS
The garment industry is one of the most internationalized manufacturing industries andone in which developing countries have made the greatest gains in OECD import marketshares. Three distinct new sourcing tendencies became evident during 1980-1984:(i) developing Asian competitors held significant and growing market shares in garmentimports of the OECD countries (46% in 1994); (ii) of these developing Asiancompetitors, the Tigers are experiencing a dramatic collapse in their import marketshares (from 30% to 16%) while China and other developing Asian competitors aremaking impressive gains (together from 8% to 30%); and (iii) each component of theOECD market has a common sourcing element (developing Asia) and a new regionalfocus, that is, the Caribbean Basin and Mexico in the case of North America (from 7%to 15% of that market), North Africa, Turkey and Eastern Europe in the case of WesternEurope (from 7% to 18% of that market), and solely developing Asia in the case ofJapan (from 74% to 79% of that market). As can be appreciated in the previoussection, the garment industry is at the forefront of the Caribbean Basin’s newintegration into the North American economy. This section of the paper focuses on thatsector.
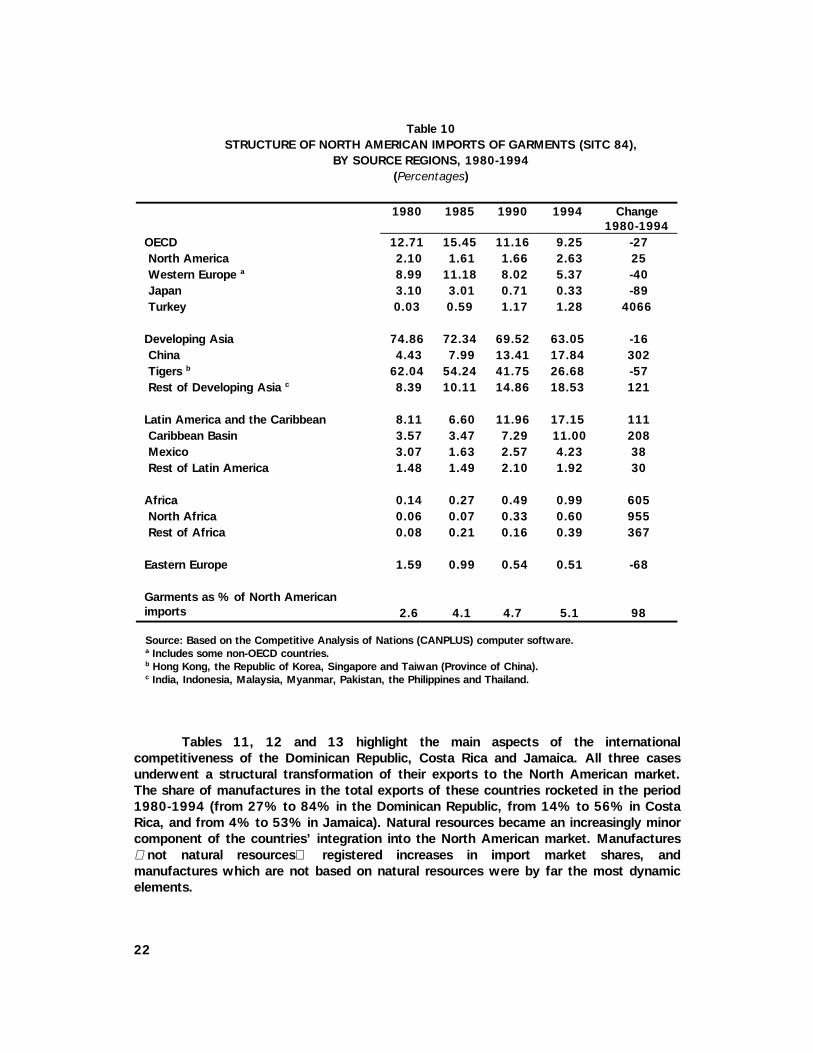
Table 10 demonstrates the principal source regions of garment (SITC 84)imports in North America (i.e., the United States and Canada). This market was verydynamic, with garment imports doubling in importance during 1980-1994 (from 2.6% to5.1% of all North American imports). While developing Asian competitors continued todominate that market (together possessing 63% of North American garment imports in1994), their share declined (down from 75% in 1980). Moreover, the Asian Tigers sharecollapsed (from 62% to 27%), while that of China (from 4% to 18%) and others (from8% to 19%) grew strongly. The Caribbean Basin and Mexico became the mostcompetitive of the non-Asian source countries in this industry, reaching a joint 15%share in the North American market by 1994.
Referring strictly to the United States market, garment imports through the HTS9802 mechanism rose from 6% of total garment imports in 1987 to 15% in 1994.Almost three-quarters of these imports in 1994 came from only two principal sources:the Caribbean Basin (62%) and Mexico (11%). These countries were clearly playing acentral role in the attempts by United States garment corporations to meet the Asianchallenge in their own national market by taking advantage of United States policymeasures, as well as the incentives and other benefits offered by the Latin Americancountries.
22
Table 10STRUCTURE OF NORTH AMERICAN IMPORTS OF GARMENTS (SITC 84),
BY SOURCE REGIONS, 1980-1994(Percentages)
1980 1985 1990 1994 Change1980-1994
OECD 12.71 15.45 11.16 9.25 -27 North America 2.10 1.61 1.66 2.63 25 Western Europe a 8.99 11.18 8.02 5.37 -40 Japan 3.10 3.01 0.71 0.33 -89 Turkey 0.03 0.59 1.17 1.28 4066
Developing Asia 74.86 72.34 69.52 63.05 -16 China 4.43 7.99 13.41 17.84 302 Tigers b 62.04 54.24 41.75 26.68 -57 Rest of Developing Asia c 8.39 10.11 14.86 18.53 121
Latin America and the Caribbean 8.11 6.60 11.96 17.15 111 Caribbean Basin 3.57 3.47 7.29 11.00 208 Mexico 3.07 1.63 2.57 4.23 38 Rest of Latin America 1.48 1.49 2.10 1.92 30
Africa 0.14 0.27 0.49 0.99 605 North Africa 0.06 0.07 0.33 0.60 955 Rest of Africa 0.08 0.21 0.16 0.39 367
Eastern Europe 1.59 0.99 0.54 0.51 -68
Garments as % of North Americanimports 2.6 4.1 4.7 5.1 98
Source: Based on the Competitive Analysis of Nations (CANPLUS) computer software.a Includes some non-OECD countries.b Hong Kong, the Republic of Korea, Singapore and Taiwan (Province of China).c India, Indonesia, Malaysia, Myanmar, Pakistan, the Philippines and Thailand.
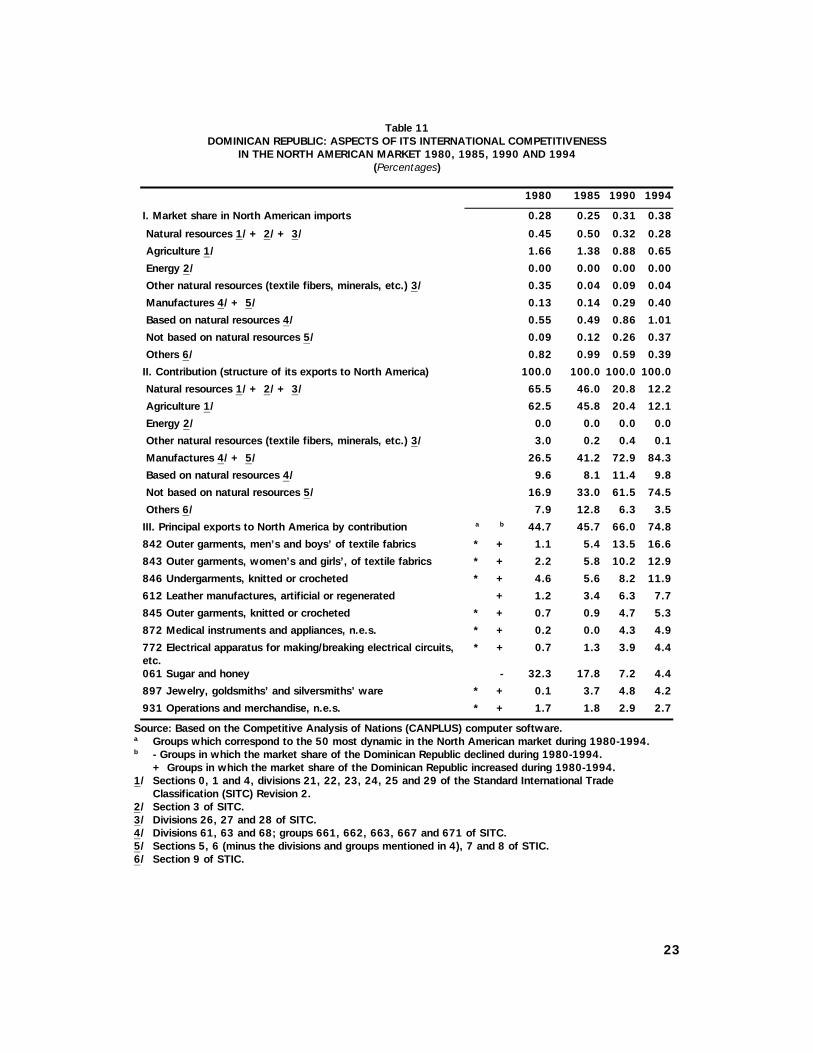
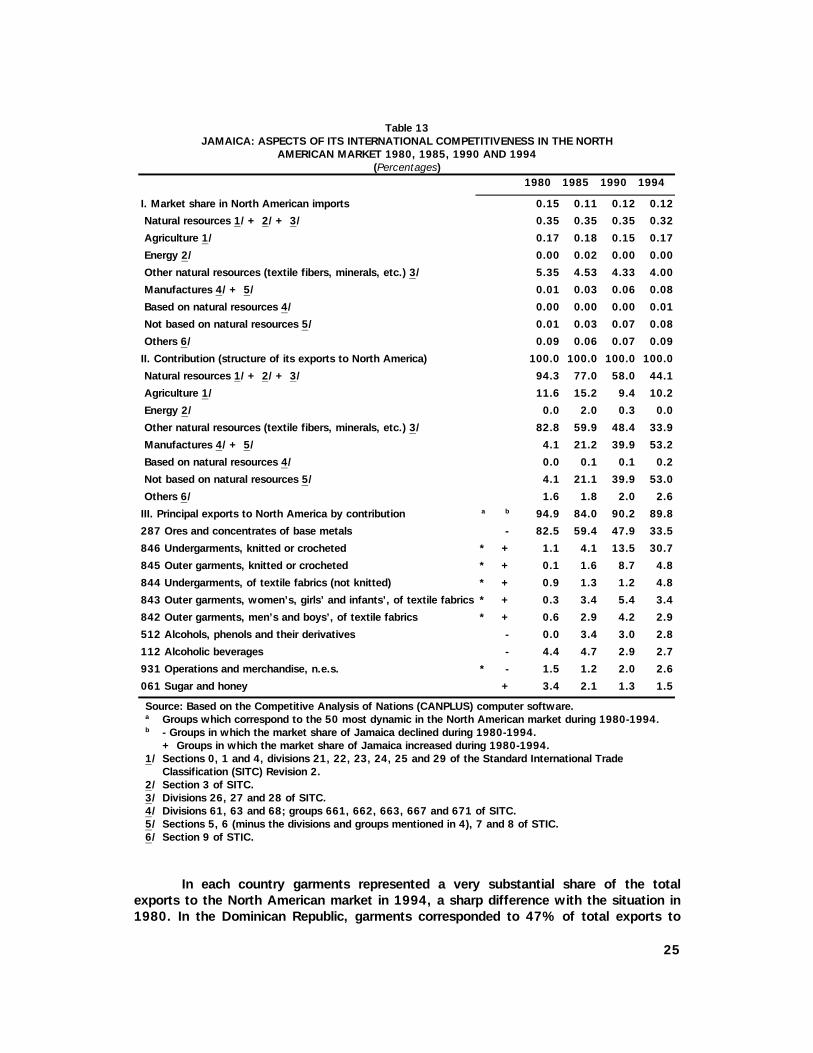
Tables 11, 12 and 13 highlight the main aspects of the internationalcompetitiveness of the Dominican Republic, Costa Rica and Jamaica. All three casesunderwent a structural transformation of their exports to the North American market.The share of manufactures in the total exports of these countries rocketed in the period1980-1994 (from 27% to 84% in the Dominican Republic, from 14% to 56% in CostaRica, and from 4% to 53% in Jamaica). Natural resources became an increasingly minorcomponent of the countries’ integration into the North American market. Manufactures not natural resources registered increases in import market shares, andmanufactures which are not based on natural resources were by far the most dynamicelements.
23
Table 11DOMINICAN REPUBLIC: ASPECTS OF ITS INTERNATIONAL COMPETITIVENESS
IN THE NORTH AMERICAN MARKET 1980, 1985, 1990 AND 1994(Percentages)
1980 1985 1990 1994
I. Market share in North American imports 0.28 0.25 0.31 0.38
Natural resources 1/ + 2/ + 3/ 0.45 0.50 0.32 0.28
Agriculture 1/ 1.66 1.38 0.88 0.65
Energy 2/ 0.00 0.00 0.00 0.00
Other natural resources (textile fibers, minerals, etc.) 3/ 0.35 0.04 0.09 0.04
Manufactures 4/ + 5/ 0.13 0.14 0.29 0.40
Based on natural resources 4/ 0.55 0.49 0.86 1.01
Not based on natural resources 5/ 0.09 0.12 0.26 0.37
Others 6/ 0.82 0.99 0.59 0.39
II. Contribution (structure of its exports to North America) 100.0 100.0 100.0 100.0
Natural resources 1/ + 2/ + 3/ 65.5 46.0 20.8 12.2
Agriculture 1/ 62.5 45.8 20.4 12.1
Energy 2/ 0.0 0.0 0.0 0.0
Other natural resources (textile fibers, minerals, etc.) 3/ 3.0 0.2 0.4 0.1
Manufactures 4/ + 5/ 26.5 41.2 72.9 84.3
Based on natural resources 4/ 9.6 8.1 11.4 9.8
Not based on natural resources 5/ 16.9 33.0 61.5 74.5
Others 6/ 7.9 12.8 6.3 3.5
III. Principal exports to North America by contribution a b 44.7 45.7 66.0 74.8
842 Outer garments, men’s and boys’ of textile fabrics * + 1.1 5.4 13.5 16.6
843 Outer garments, women’s and girls’, of textile fabrics * + 2.2 5.8 10.2 12.9
846 Undergarments, knitted or crocheted * + 4.6 5.6 8.2 11.9
612 Leather manufactures, artificial or regenerated + 1.2 3.4 6.3 7.7
845 Outer garments, knitted or crocheted * + 0.7 0.9 4.7 5.3
872 Medical instruments and appliances, n.e.s. * + 0.2 0.0 4.3 4.9
772 Electrical apparatus for making/breaking electrical circuits,etc.
* + 0.7 1.3 3.9 4.4
061 Sugar and honey - 32.3 17.8 7.2 4.4
897 Jewelry, goldsmiths’ and silversmiths’ ware * + 0.1 3.7 4.8 4.2
931 Operations and merchandise, n.e.s. * + 1.7 1.8 2.9 2.7
Source: Based on the Competitive Analysis of Nations (CANPLUS) computer software.a Groups which correspond to the 50 most dynamic in the North American market during 1980-1994.b - Groups in which the market share of the Dominican Republic declined during 1980-1994.
+ Groups in which the market share of the Dominican Republic increased during 1980-1994.1/ Sections 0, 1 and 4, divisions 21, 22, 23, 24, 25 and 29 of the Standard International Trade
Classification (SITC) Revision 2.2/ Section 3 of SITC.3/ Divisions 26, 27 and 28 of SITC.4/ Divisions 61, 63 and 68; groups 661, 662, 663, 667 and 671 of SITC.5/ Sections 5, 6 (minus the divisions and groups mentioned in 4), 7 and 8 of STIC.6/ Section 9 of STIC.

24
Table 12COSTA RICA: ASPECTS OF ITS INTERNATIONAL COMPETITIVENESS IN
THE NORTH AMERICAN MARKET 1980, 1985, 1990 AND 1994(Percentages)
1980 1985 1990 1994
I. Market share in North American imports 0.15 0.15 0.19 0.23
Natural resources 1/ + 2/ + 3/ 0.31 0.45 0.48 0.60
Agriculture 1/ 1.20 1.17 1.25 1.38
Energy 2/ 0.00 0.01 0.00 0.00
Other natural resources (textile fibers, minerals, etc.) 3/ 0.03 0.05 0.02 0.04
Manufactures 4/ + 5/ 0.03 0.06 0.12 0.16
Based on natural resources 4/ 0.03 0.04 0.07 0.07
Not based on natural resources 5/ 0.03 0.06 0.13 0.17
Others 6/ 0.07 0.04 0.08 0.12
II. Contribution (structure of its exports to North America) 100.0 100.0 100.0 100.0
Natural resources 1/ + 2/ + 3/ 85.2 71.0 49.6 42.5
Agriculture 1/ 84.8 70.1 49.5 42.4
Energy 2/ 0.0 0.5 0.0 0.0
Other natural resources (textile fibers, minerals, etc.) 3/ 0.4 0.5 0.2 0.2
Manufactures 4/ + 5/ 13.5 28.1 49.1 55.8
Based on natural resources 4/ 1.0 1.2 1.4 1.1
Not based on natural resources 5/ 12.5 27.0 47.7 54.7
Others 6/ 1.3 0.8 1.3 1.7
III. Principal exports to North America by contribution a b 78.4 73.7 72.8 73.4
057 Fruit and nuts, fresh or dried + 34.4 34.1 27.2 25.4
842 Outer garments, men’s and boys’, of textile fabrics * + 0.5 3.7 9.7 12.4
846 Undergarments, knitted or crocheted * + 5.2 5.0 9.9 11.9
843 Outer garments, women’s, girls’ and infants’, of textilefabrics
* + 2.6 5.4 6.8 4.6
844 Undergarments, of textile fabrics (not knitted) * + 0.1 2.0 2.9 4.0
845 Outer garments, knitted or crocheted * + 0.3 0.6 3.1 4.0
011 Beef, fresh, refrigerated or frozen - 17.0 9.3 4.7 3.3
071 Coffee and coffee substitutes + 17.6 12.5 6.0 3.2
054 Vegetables, fresh, refrigerated, frozen or preserved * + 0.8 1.0 1.6 2.3
775 Home appliances, electrical and non-electrical * + 0.0 0.0 0.9 2.3
Source: Based on the Competitive Analysis of Nations (CANPLUS) computer software.a Groups which correspond to the 50 most dynamic in the North American market during 1980-1994.b - Groups in which the market share of Costa Rica declined during 1980-1994.
+ Groups in which the market share of Costa Rica increased during 1980-1994.1/ Sections 0, 1 and 4, divisions 21, 22, 23, 24, 25 and 29 of the Standard International Trade
Classification (SITC) Revision 2.2/ Section 3 of SITC.3/ Divisions 26, 27 and 28 of SITC.4/ Divisions 61, 63 and 68; groups 661, 662, 663, 667 and 671 of SITC.5/ Sections 5, 6 (minus the divisions and groups mentioned in 4), 7 and 8 of STIC.6/ Section 9 of STIC.
25
Table 13JAMAICA: ASPECTS OF ITS INTERNATIONAL COMPETITIVENESS IN THE NORTH
AMERICAN MARKET 1980, 1985, 1990 AND 1994(Percentages)
1980 1985 1990 1994
I. Market share in North American imports 0.15 0.11 0.12 0.12
Natural resources 1/ + 2/ + 3/ 0.35 0.35 0.35 0.32
Agriculture 1/ 0.17 0.18 0.15 0.17
Energy 2/ 0.00 0.02 0.00 0.00
Other natural resources (textile fibers, minerals, etc.) 3/ 5.35 4.53 4.33 4.00
Manufactures 4/ + 5/ 0.01 0.03 0.06 0.08
Based on natural resources 4/ 0.00 0.00 0.00 0.01
Not based on natural resources 5/ 0.01 0.03 0.07 0.08
Others 6/ 0.09 0.06 0.07 0.09
II. Contribution (structure of its exports to North America) 100.0 100.0 100.0 100.0
Natural resources 1/ + 2/ + 3/ 94.3 77.0 58.0 44.1
Agriculture 1/ 11.6 15.2 9.4 10.2
Energy 2/ 0.0 2.0 0.3 0.0
Other natural resources (textile fibers, minerals, etc.) 3/ 82.8 59.9 48.4 33.9
Manufactures 4/ + 5/ 4.1 21.2 39.9 53.2
Based on natural resources 4/ 0.0 0.1 0.1 0.2
Not based on natural resources 5/ 4.1 21.1 39.9 53.0
Others 6/ 1.6 1.8 2.0 2.6
III. Principal exports to North America by contribution a b 94.9 84.0 90.2 89.8
287 Ores and concentrates of base metals - 82.5 59.4 47.9 33.5
846 Undergarments, knitted or crocheted * + 1.1 4.1 13.5 30.7
845 Outer garments, knitted or crocheted * + 0.1 1.6 8.7 4.8
844 Undergarments, of textile fabrics (not knitted) * + 0.9 1.3 1.2 4.8
843 Outer garments, women’s, girls’ and infants’, of textile fabrics * + 0.3 3.4 5.4 3.4
842 Outer garments, men’s and boys’, of textile fabrics * + 0.6 2.9 4.2 2.9
512 Alcohols, phenols and their derivatives - 0.0 3.4 3.0 2.8
112 Alcoholic beverages - 4.4 4.7 2.9 2.7
931 Operations and merchandise, n.e.s. * - 1.5 1.2 2.0 2.6
061 Sugar and honey + 3.4 2.1 1.3 1.5
Source: Based on the Competitive Analysis of Nations (CANPLUS) computer software.a Groups which correspond to the 50 most dynamic in the North American market during 1980-1994.b - Groups in which the market share of Jamaica declined during 1980-1994.
+ Groups in which the market share of Jamaica increased during 1980-1994.1/ Sections 0, 1 and 4, divisions 21, 22, 23, 24, 25 and 29 of the Standard International Trade
Classification (SITC) Revision 2.2/ Section 3 of SITC.3/ Divisions 26, 27 and 28 of SITC.4/ Divisions 61, 63 and 68; groups 661, 662, 663, 667 and 671 of SITC.5/ Sections 5, 6 (minus the divisions and groups mentioned in 4), 7 and 8 of STIC.6/ Section 9 of STIC.
In each country garments represented a very substantial share of the totalexports to the North American market in 1994, a sharp difference with the situation in1980. In the Dominican Republic, garments corresponded to 47% of total exports to
26
North America, up from just 8.6% in 1980. For Costa Rica, garment exports to NorthAmerica jumped from 8.7% to 36.9% over the same period. In the case of Jamaica,garment exports accounted for only 3% of total exports to North America in 1980 androse to 46.6% by 1994. In all cases, garment exports gained dramatic increases inmarket shares in dynamic sectors of North American imports. Finally, garmentsaccounted for four or five of the ten principal, most dynamic exports (at three digits ofthe SITC) of each of these countries.
Two segments of the garment industry were among the largest and mostdynamic Caribbean Basin exports to the North American market: outer garmentsof textile fabrics for men and boys (SITC 842) and knitted or crochetedundergarments (SITC 846). As tables 14 and 15 demonstrate, imports of men’s andboys’ outer clothing of textile fabrics (SITC 842) rose from 0.4% to 0.8% of all NorthAmerican imports between 1980 and 1994. The change in the structure of theseimports by source region is similar to the general situation of the garment industry(SITC 84); however, the dimension is distinct. In this case Caribbean Basin marketshare reached 16% in 1994 and was superior to that of both China and the restof developing Asia, excluding the Tigers. Mexico’s gains were also notable in thisrespect.
Imports of knitted or crocheted undergarments (SITC 846) showed less dynamicgrowth. These imports rose during 1980-1985, declined until 1990 and rose sharplyagain thereafter. The Caribbean Basin was already providing a significant level ofNorth American imports in 1980. Nevertheless, it made huge market share gainsby 1994 (accounting for 29.7% of total imports of these goods), becoming the singlemost important North American sourcing center for these goods.9
The SITC 842 and 846 components of the garment industry offer particularlyimportant insights into the company-level changes taking place in the Caribbean Basinand the degree of heterogeneity of corporate strategies, both of which help clarify theimpact of host-country policies on trade, FDI and tax incentives. Detailed questionnaireswere administered to about 80 garment firms in the Dominican Republic, Costa Rica andJamaica in 1994-1996 to examine the nature of their contribution to the successes of andchallenges to that industry and to better comprehend the factors influencing their behavior.Data from these questionnaires was used to define the principal elements of three distinctcompetitive situations: the homogeneous group of large United States assemblers of SITC846 undergarments (Group I),10 the group of national firms producing primarily SITC 842
9 Another ECLAC computer programme —MUSIC— is based exclusively on United States
import data in the Harmonized Tariff Schedule (HTS) format. This programme facilitatesan examination of some of the most dynamic products at six digits of the HTS classification,such as men’s and boys’ cotton trousers or women’s and girls’ cotton panties and brassieres. Forthese products, the United States import market shares won from Asian producers have beenconcentrated in only a few Latin American and Caribbean countries: Mexico, the DominicanRepublic, Costa Rica and Jamaica, although, more recently, other Caribbean Basin countries havebeen winning United States import market shares from them.9 This suggests that the morerecent incentive policies of other Caribbean Basin countries may be influencing the siting ofnew or footloose garment assembly plants outside the existing principal Caribbean Basinlocations.
10 A few firms belonging to large domestic conglomerates (or holding companies) may alsobe included in this group. Their behavior and performance are quite similar to those of the largestUnited States producers and they tend to be linked to large United States retailers throughsubcontracting. They are too few to justify a specific category in this analysis.
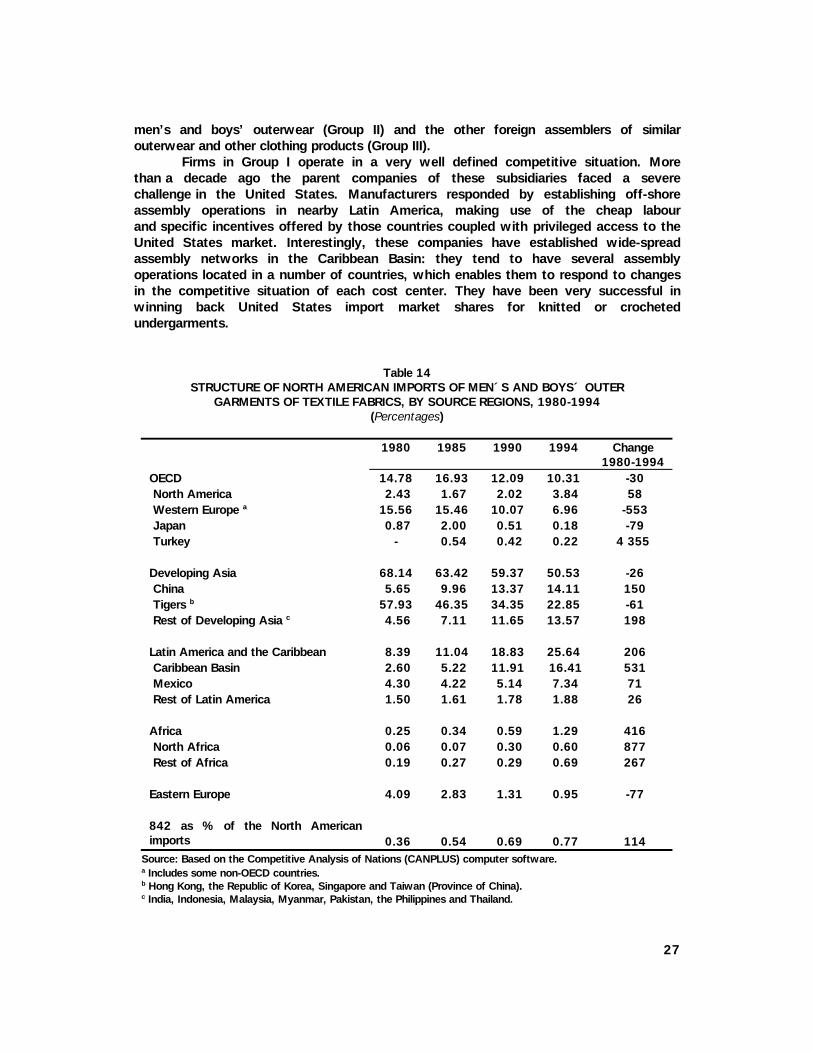
27
men’s and boys’ outerwear (Group II) and the other foreign assemblers of similarouterwear and other clothing products (Group III).
Firms in Group I operate in a very well defined competitive situation. Morethan a decade ago the parent companies of these subsidiaries faced a severechallenge in the United States. Manufacturers responded by establishing off-shoreassembly operations in nearby Latin America, making use of the cheap labourand specific incentives offered by those countries coupled with privileged access to theUnited States market. Interestingly, these companies have established wide-spreadassembly networks in the Caribbean Basin: they tend to have several assemblyoperations located in a number of countries, which enables them to respond to changesin the competitive situation of each cost center. They have been very successful inwinning back United States import market shares for knitted or crochetedundergarments.
Table 14STRUCTURE OF NORTH AMERICAN IMPORTS OF MEN´S AND BOYS´ OUTER
GARMENTS OF TEXTILE FABRICS, BY SOURCE REGIONS, 1980-1994(Percentages)
1980 1985 1990 1994 Change1980-1994
OECD 14.78 16.93 12.09 10.31 -30 North America 2.43 1.67 2.02 3.84 58 Western Europe a 15.56 15.46 10.07 6.96 -553 Japan 0.87 2.00 0.51 0.18 -79 Turkey - 0.54 0.42 0.22 4 355
Developing Asia 68.14 63.42 59.37 50.53 -26 China 5.65 9.96 13.37 14.11 150 Tigers b 57.93 46.35 34.35 22.85 -61 Rest of Developing Asia c 4.56 7.11 11.65 13.57 198
Latin America and the Caribbean 8.39 11.04 18.83 25.64 206 Caribbean Basin 2.60 5.22 11.91 16.41 531 Mexico 4.30 4.22 5.14 7.34 71 Rest of Latin America 1.50 1.61 1.78 1.88 26
Africa 0.25 0.34 0.59 1.29 416 North Africa 0.06 0.07 0.30 0.60 877 Rest of Africa 0.19 0.27 0.29 0.69 267
Eastern Europe 4.09 2.83 1.31 0.95 -77
842 as % of the North Americanimports 0.36 0.54 0.69 0.77 114
Source: Based on the Competitive Analysis of Nations (CANPLUS) computer software.a Includes some non-OECD countries.b Hong Kong, the Republic of Korea, Singapore and Taiwan (Province of China).c India, Indonesia, Malaysia, Myanmar, Pakistan, the Philippines and Thailand.

28
Table 15STRUCTURE OF NORTH AMERICAN IMPORTS OF KNITTED OR CROCHETED
UNDERGARMENTS, BY SOURCE REGIONS, 1980-1994(Percentages)
1980 1985 1990 1994 Change1980-1994
OECD 8.29 8.16 10.34 8.74 5 North America 1.27 0.57 2.38 3.09 144 Western Europe a 4.22 4.85 5.56 2.63 -38 Japan 3.76 2.69 0.31 0.08 -98 Turkey 0.01 0.66 2.51 3.28 >10000
Developing Asia 72.88 75.75 53.78 42.09 -42 China 1.80 5.94 5.60 5.11 184 Tigers b 62.60 57.71 30.61 16.80 -73 Rest of Developing Asia c 8.48 12.10 17.57 20.18 138
Latin America and the Caribbean 14.65 10.37 28.25 40.74 178 Caribbean Basin 9.12 7.18 21.02 29.70 226 Mexico 4.90 2.03 4.04 7.71 57 Rest of Latin America 0.63 1.17 3.19 3.33 430
Africa 0.03 0.15 0.83 0.86 2755 North Africa 0.01 0.05 0.71 0.61 5281 Rest of Africa 0.02 0.10 0.13 0.25 1235
Eastern Europe 0.96 0.62 0.45 0.37 -61
846 as % of North Americanimports
0.42 0.55 0.40 0.51 22
Source: Based on the Competitive Analysis of Nations (CANPLUS) computer software.a Includes some non-OECD countries.b Hong Kong, the Republic of Korea, Singapore and Taiwan (Province of China).c India, Indonesia, Malaysia, Myanmar, Pakistan, the Philippines and Thailand.
These Group I enterprises tend to be much more specialized in their productionand more sophisticated in terms of quality than the rest of the sample. Their corporatestrategy is more aggressive and their outlook more “corporate”. They carry out a veryspecific role in the integrated international production system of their parentcorporations. Quality is especially important because they export mainly to their parentfirms, which market the products.
These enterprises have increased their ability to compete by improving labourproductivity, quality and service. The gains in labour productivity have presumablyhelped offset the increased costs of labour (i.e., wages and social security), especiallygiven the appreciating national currencies in many of the countries in which theyoperated. The labour force has been trained to meet corporate standards ofperformance. Virtually no local physical inputs (via local sourcing or componentsubcontracting) enter into the production process. Each assembly plant is a self-contained element of the corporate network, producing a small range of identical itemsin a very competitive manner.
29
At the other extreme, the national companies in Group II were created for themost part during the import-substitution phase of industrialization. Since thereorientation of macroeconomic policy in the 1980s, they have experienced collapsingnational market shares due to import penetration and have adapted by seeking outcontracts with foreign buyers, mainly large department stores or trade-marked apparelcompanies. They compete with the rest of the world for relatively short-term contractsfor standardized garments in which price is the principal determinant. In contrast to theforeign firms, they consider their own corporate strategies as more central to theircompetitiveness than international market factors. They tend to adopt defensivestances, and they have experienced mixed results in defending or winning United Statesimport market shares for men’s and boys’ outerwear of textile fabrics.
These national companies have several disadvantages compared to the foreigncompetitors operating within transnational corporation (TNC) networks. First, the TNCnetwork permits better programming of individual plant capacities to accommodatesporadic and changing demand for their relatively more specialized products, whichmakes the company much more flexible. Second, the parent company in the TNCnetwork takes care of many aspects of the operations, such as selecting and purchasingtechnology, marketing, acquiring new organizational practices and setting qualitystandards. Third, the TNC network is highly mobile because it can easily add new linesof production in more competitive sites or, if necessary, migrate to them. Fourth, theTNC network has the financial capacity to invest in or guarantee local plant expansion oradaptation. Consequently, small national enterprises face a very difficult competitivesituation, considering that that foreign firms with assembly operations in the CaribbeanBasin are their principal competitors.
In the questionnaires, these companies expressed the belief that national policyis considerably less important to their competitiveness than it is for foreign firms, eventhough it could conceivably be a means of leveling some of the disadvantages they facevis-à-vis their foreign competitors, who are mainly installed in EPZs in the CaribbeanBasin. They view their single, most important impediment to further exports to be thelack or high cost of local financing, which they consider the principal failure of nationalpolicy. They feel that national policy has in no way compensated for the advantages ofthe foreign companies.
Generally, these national companies are less specialized, less sophisticated interms of quality and, at the same time, less willing to invest in what is clearly theirprincipal comparative advantage: cheap labour. Rather, they see their internationalcompetitiveness as more dependent on the acquisition of foreign technology andorganizational practices, which help make their production lines more flexible, improvequality and lower labour costs. Some of these enterprises possess important levels oflocal procurement, but this is not considered basic to their international competitiveness.They appear to be trying to acquire the means to make significant improvements inquality to compensate for increasing shortfalls in competitive pricing. These firms can becharacterized as relatively low-cost producers of mostly short runs of simple,standardized clothing items for international contractors.
The more numerous Group III enterprises represent the middle ground. They arebigger but less specialized components of smaller, less extensive corporate networks.Most of their competitors are other assembly operations in the Caribbean Basin. Theyface cutthroat price competition to win contracts or to defend the flagging United Statesmarket shares of their parent corporations. These enterprises moved offshore morerecently than the Group I firms. They have a more stark, cost-centered mentality. Theessence of their corporate strategy in the Caribbean Basin is similar to that of the
30
national firms, solidly based on cheap labour with an emerging preoccupation for quality.Also like national companies, they are facing a kind of harsh renewal in which themodernization and rationalization of production are central aspects of their corporatestrategies.
These firms have sought to improve efficiency in the same fashion as nationalfirms, through monetary incentives for labour and the acquisition and implementation offoreign technologies and organizational practices. Although their problem with humanresource is somewhat different than national firms —the high cost of social securityrather than simply wage rates— they have sought the same improvements in workorganization, namely a more flexible production line. These companies received theirtechnology from the parent corporation, though like the national companies, they had toadapt it to the local setting. They consider rapid delivery as one of their competitiveadvantages, again similar to national firms, but they feel that productivity is anadvantage that derives primarily from inputs from their corporate network.
Thus, an important degree of heterogeneity exists in the competitive situationsof garment firms operating in the Caribbean Basin. Corporate strategies define thedifferent reactions of distinct groups of companies to the various challenges faced bythe industry. The large subsidiaries of well-known TNCs which make up Group I alreadypossess an integrated international production system that allows them to adapt tochanging competitive situations by expanding a production line in one country, whilereducing another in a second country. They do not have to physically shift productionfrom one location to another. The Group III subsidiaries of smaller, less well knownTNCs do not have those advantages. Often, they do not produce for direct sale to theirparent corporations, but rather for international buyers, usually the big departmentstores or specialist clothing companies. They face a more directly competitive situation,and a growing cost differential among distinct production sites can result in the physicaltransfer of plant and equipment to another location. Finally, the Group II national firmspossess neither the integrated international production system of the former nor thefootloose capabilities of the latter. Born for the most part during the era of importsubstitution, they have seen their national market shares collapse in the face of newimports. They have been forced to compete for assembly-based export contracts, withina framework in which national policy does not compensate for the advantages of theforeign companies operating in those countries.
31
4. POLICY COMPETITION: HOW COUNTRIES COMPETE
National policy makers in the Caribbean now face a quandary. In view of the corporatestrategies presented in the previous section, it seems clear that fiscal or financialincentives will not much influence new FDI flows to this region. The large transnationalproducers of undergarments (Group I) are already present in the most relevant offshoreassembly sites. Incentives might have a marginal influence on the expansion or reductionof existing production lines, but they would probably not result in a physical transferfrom one existing site to another or in the creation of a new large-scale operation.Incentives could very well influence the transfer or siting of the smaller, Group IIItransnational producers of men’s and boys’ outerwear, but the result might not bebeneficial to the host country. These operations are footloose by their very nature.Relatively minor declines in the competitive situation of a host country can result in ahurried exit to another site, because these firms operate with very small margins.National policy makers can be assured that an incentive war to temporarily attract thiskind of operation would not produce the desired results. Finally, the small, nationalgarment firms might be enticed to set up new operations in neighboring countries to theextent that incentives are available. However, given that they generally have rathertenuous operations somewhat like the Group III foreign firms, the results would probablynot be what the host country is expecting.
This section analyzes policy competition for foreign investment examining fourstages of the process: the legal frameworks that countries in the region offer to foreigninvestors, the ways in which those countries sell an image to attract investors, theirstrategies for competing for FDI in export platforms and the role of competitivenesspolicies in this process.
4.1 THE LEGAL FRAMEWORK FOR FOREIGN DIRECT INVESTMENT
FDI regimes in the Latin American and the Caribbean countries share many similarities(Mayorga, 1996). Not only are regulations similar, but all countries share a commoninterest in the promotion and protection of foreign investment. Furthermore, governmentproposals for changes to legislation are usually oriented towards a freer, less regulatedframework with greater security and benefits for foreign investors. However, countriesalso display a variety of differences, some of which derive from the existence of twodifferent legal systems in the region: civil law in the Latin countries and common law inthe English-speaking Caribbean countries. The following list of stylized facts highlightsthe current differences and similarities:
(i) Not all countries have a special legal statute for foreign investment, anddefinitions of what is to be considered a foreign investment varies widely(e.g., contributions from abroad, investment by foreigners or contributionsfrom abroad by foreigners).
32
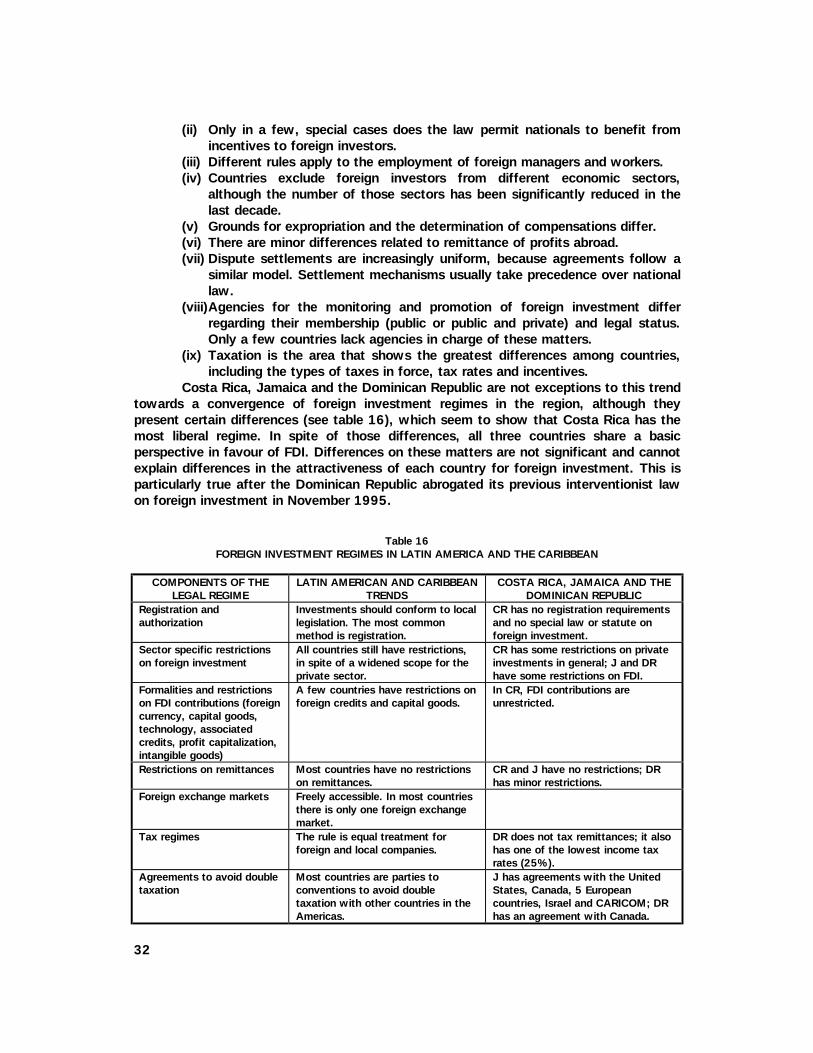
(ii) Only in a few, special cases does the law permit nationals to benefit fromincentives to foreign investors.
(iii) Different rules apply to the employment of foreign managers and workers.(iv) Countries exclude foreign investors from different economic sectors,
although the number of those sectors has been significantly reduced in thelast decade.
(v) Grounds for expropriation and the determination of compensations differ.(vi) There are minor differences related to remittance of profits abroad.(vii) Dispute settlements are increasingly uniform, because agreements follow a
similar model. Settlement mechanisms usually take precedence over nationallaw.
(viii) Agencies for the monitoring and promotion of foreign investment differregarding their membership (public or public and private) and legal status.Only a few countries lack agencies in charge of these matters.
(ix) Taxation is the area that shows the greatest differences among countries,including the types of taxes in force, tax rates and incentives.
Costa Rica, Jamaica and the Dominican Republic are not exceptions to this trendtowards a convergence of foreign investment regimes in the region, although theypresent certain differences (see table 16), which seem to show that Costa Rica has themost liberal regime. In spite of those differences, all three countries share a basicperspective in favour of FDI. Differences on these matters are not significant and cannotexplain differences in the attractiveness of each country for foreign investment. This isparticularly true after the Dominican Republic abrogated its previous interventionist lawon foreign investment in November 1995.
Table 16FOREIGN INVESTMENT REGIMES IN LATIN AMERICA AND THE CARIBBEAN
COMPONENTS OF THELEGAL REGIME
LATIN AMERICAN AND CARIBBEANTRENDS
COSTA RICA, JAMAICA AND THEDOMINICAN REPUBLIC
Registration andauthorization
Investments should conform to locallegislation. The most commonmethod is registration.
CR has no registration requirementsand no special law or statute onforeign investment.
Sector specific restrictionson foreign investment
All countries still have restrictions,in spite of a widened scope for theprivate sector.
CR has some restrictions on privateinvestments in general; J and DRhave some restrictions on FDI.
Formalities and restrictionson FDI contributions (foreigncurrency, capital goods,technology, associatedcredits, profit capitalization,intangible goods)
A few countries have restrictions onforeign credits and capital goods.
In CR, FDI contributions areunrestricted.
Restrictions on remittances Most countries have no restrictionson remittances.
CR and J have no restrictions; DRhas minor restrictions.
Foreign exchange markets Freely accessible. In most countriesthere is only one foreign exchangemarket.
Tax regimes The rule is equal treatment forforeign and local companies.
DR does not tax remittances; it alsohas one of the lowest income taxrates (25%).
Agreements to avoid doubletaxation
Most countries are parties toconventions to avoid doubletaxation with other countries in theAmericas.
J has agreements with the UnitedStates, Canada, 5 Europeancountries, Israel and CARICOM; DRhas an agreement with Canada.
33
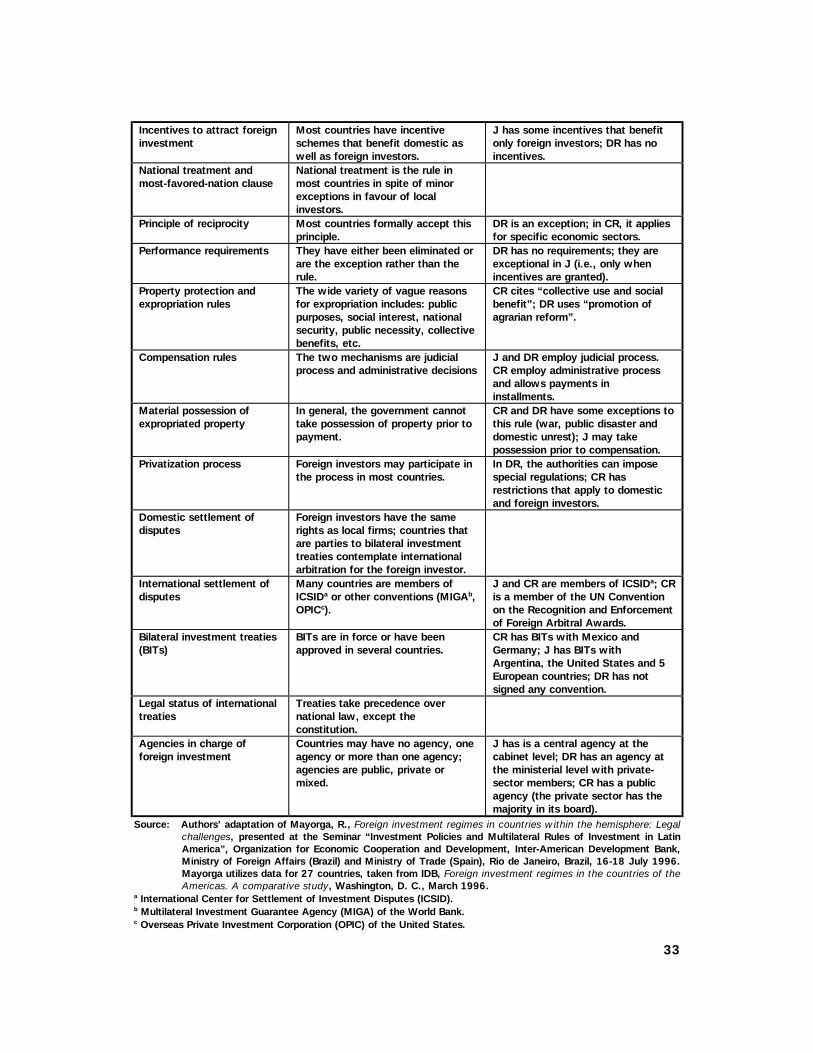
Incentives to attract foreigninvestment
Most countries have incentiveschemes that benefit domestic aswell as foreign investors.
J has some incentives that benefitonly foreign investors; DR has noincentives.
National treatment andmost-favored-nation clause
National treatment is the rule inmost countries in spite of minorexceptions in favour of localinvestors.
Principle of reciprocity Most countries formally accept thisprinciple.
DR is an exception; in CR, it appliesfor specific economic sectors.
Performance requirements They have either been eliminated orare the exception rather than therule.
DR has no requirements; they areexceptional in J (i.e., only whenincentives are granted).
Property protection andexpropriation rules
The wide variety of vague reasonsfor expropriation includes: publicpurposes, social interest, nationalsecurity, public necessity, collectivebenefits, etc.
CR cites “collective use and socialbenefit”; DR uses “promotion ofagrarian reform”.
Compensation rules The two mechanisms are judicialprocess and administrative decisions
J and DR employ judicial process.CR employ administrative processand allows payments ininstallments.
Material possession ofexpropriated property
In general, the government cannottake possession of property prior topayment.
CR and DR have some exceptions tothis rule (war, public disaster anddomestic unrest); J may takepossession prior to compensation.
Privatization process Foreign investors may participate inthe process in most countries.
In DR, the authorities can imposespecial regulations; CR hasrestrictions that apply to domesticand foreign investors.
Domestic settlement ofdisputes
Foreign investors have the samerights as local firms; countries thatare parties to bilateral investmenttreaties contemplate internationalarbitration for the foreign investor.
International settlement ofdisputes
Many countries are members ofICSIDa or other conventions (MIGAb,OPICc).
J and CR are members of ICSIDa; CRis a member of the UN Conventionon the Recognition and Enforcementof Foreign Arbitral Awards.
Bilateral investment treaties(BITs)
BITs are in force or have beenapproved in several countries.
CR has BITs with Mexico andGermany; J has BITs withArgentina, the United States and 5European countries; DR has notsigned any convention.
Legal status of internationaltreaties
Treaties take precedence overnational law, except theconstitution.
Agencies in charge offoreign investment
Countries may have no agency, oneagency or more than one agency;agencies are public, private ormixed.
J has is a central agency at thecabinet level; DR has an agency atthe ministerial level with private-sector members; CR has a publicagency (the private sector has themajority in its board).
Source: Authors’ adaptation of Mayorga, R., Foreign investment regimes in countries within the hemisphere: Legalchallenges, presented at the Seminar “Investment Policies and Multilateral Rules of Investment in LatinAmerica”, Organization for Economic Cooperation and Development, Inter-American Development Bank,Ministry of Foreign Affairs (Brazil) and Ministry of Trade (Spain), Rio de Janeiro, Brazil, 16-18 July 1996.Mayorga utilizes data for 27 countries, taken from IDB, Foreign investment regimes in the countries of theAmericas. A comparative study, Washington, D. C., March 1996.
a International Center for Settlement of Investment Disputes (ICSID).b Multilateral Investment Guarantee Agency (MIGA) of the World Bank.c Overseas Private Investment Corporation (OPIC) of the United States.

34
4.2 SELLING A COUNTRY’S IMAGE
How countries sell an image to attract investment provides a clue to which competitiveadvantages they consider to be the most effective for catching investors’ attention. Thefollowing review of the promotional efforts undertaken by Costa Rica, Jamaica and theDominican Republic shows that countries try to highlight a broad package of natural,social and policy advantages, which are extremely similar perhaps too similar forcountries as different as Jamaica and Costa Rica. Countries perceive that investorsexpect some benefits and advantages, and they are forced to show that they competeto provide those incentives. This homogeneity may point to harsh policy competitionamong Caribbean Basin countries. Within these homogeneous messages however,countries feel the need to highlight how they are tackling their most importantdisadvantages, as is shown by the Dominican Republic’s efforts to emphasize thebenefits investors may expect from the abrogation of the restrictive 1978 legislation onFDI.
(a) Costa Rica as a profit center in the Americas
“Low risk. High productivity. Big opportunity. And a long-standing tradition ofquality. No wonder Costa Rica is the place for business to locate in America. A modern,enduring democracy and political tranquillity makes for the most stable businessenvironment in Latin America. Its strategic location at the heart of the WesternHemisphere makes it the ideal site for relocating international business operations.Government attitude towards business, country infrastructure, market access, and thequality and cost of labour rank it as a top choice for locating business operations.” Thisis the image that the Ministry of Foreign Trade tries to convey to investors (Ministerio deComercio Exterior, 1996). The message highlights the country’s many advantages toinvestors, including those listed below:
(i) Costa Rica has one of the highest literacy rates in the world (93%).Education has long been a national priority, and it is free and mandatory upto secondary level. Academic, technical, agricultural and scientific highschools are located throughout the country, together with twelveuniversities (four public and eight private). The National Institute forApprenticeship, a governmental training institution, keeps track of the needsof industry in order to maintain an updated workforce. A large pool of highlyqualified, bilingual professionals is available, as well as middle-leveltechnicians and supervisors.
(ii) High-productivity workmanship is found at all levels. Investors find that thequality and productivity of the workforce is one of the best assets of thecountry.
(iii) Modern ports on the Caribbean and Pacific coasts offer facilities forcontainers and roll-on roll-off cargo. Air connections to and from majorinternational markets are excellent.
(iv) Low-cost, reliable hydroelectric power is available, with a wide distributionnetwork.
(v) A modern telecommunications network (e.g., cellular phones, datatransmission, facsimile facilities, telex and telephone) enables direct andimmediate access worldwide using both satellite and microwave links.
35
(vi) Well-maintained highways and roads connect the country from coast tocoast. An intercoastal railroad also exits.
(vii) High living standards create an outstanding environment in which to dobusiness and to live. Excellent medical services are readily available. Lifeexpectancy at birth is 75 years, while infant mortality at birth stands at1.4%.
(viii) Other positive characteristics include the following: (a) Costa Rica has had astable democracy, with no army since 1948, which allows for long-term,risk-free planning and fast-paced, continuous progress; (b) the country hasremarkable ecosystems and biological diversity; and (c) the Europeancultural base allows the country to be a cultural center with a symphonyorchestra, theaters, etc., as well as ten local TV channels and 28international cable TV channels from the United States, Europe and LatinAmerica.
(b) The new investment climate in the Dominican Republic
According to the Central Bank of the Dominican Republic, the country shouldpromote the following aspects of its image: (i) a nation with a tradition of democracyand free enterprise; (ii) a Latin American country by language and tradition; (iii) thesecond-largest Caribbean nation; (iv) an economy traditionally linked to the UnitedStates; (v) a beneficiary of special access to the European Union; (vi) a natural haven fortourism; (vii) a success in free-zone development; (viii) a fertile land for agriculture; (ix) asource of mineral wealth; (x) a nation inhabited by willing workers; and (xi) a low-costcountry for economic operations (Russin, Vecchi and Heredia Bonetti, 1996).
In addition to marketing this generally favourable context for investment, themain message the Dominican Republic Government sends to investors is that thecountry adopted a new law in November 1995 to govern foreign investment, thusresponding to new internal pressures and to the imperative of new internationalcommercial norms and relationships. The government considers that Law 16-1995presents real advantages for the investor, which are even more impressive whencompared with the restrictive legislation of Law 861 of 1978, now abrogated.
The fundamental purpose of the new law is to grant equal treatment, under theprinciple of free enterprise, to foreign and national investors, from the point of view ofrights as well as obligations. This equal treatment is reflected in the procedure adoptedto implement the law.11 Individuals and corporations investing in the country shall enjoyliberalized, restriction-free use of their capital or dividends, which can be repatriated infreely convertible currency as follows: (i) for the full amount of capital and capital gains;(ii) for the dividends declared during each fiscal period up to the total amount of netprofits (upon payment of taxes); and (iii) for fees for technology transfer and royaltiesfor contracts previously approved by the Central Bank.
11 The law indicates that the exceptions to the principle of equal treatment are those
specified in the same law and those foreseen in special laws. The former has to do withenvironmental protection, health and national security; thus investments are forbidden in thefollowing areas: (i) disposal and discarding of toxic, dangerous or radioactive materials,(ii) activities affecting public health and the environment and (iii) production of materials andequipment linked to national security and defense, unless a special authorization is obtained fromthe President of the Republic.

36
According to the Central Bank, the liberalization of the legal framework forforeign investments may provide a growing inflow of capital and technology. Thisassumption is supported by the formidable development of the free-zone sectorgoverned by Law 8-90, which was always excluded from the restrictions andrequirements of Law 861. Moreover, the country may now take advantage ofopportunities such as the guarantees for foreign investment offered by the MultilateralInvestment Guarantee Agency (MIGA) of the World Bank Group. MIGA acts similarly tothe Overseas Private Investment Corporation (OPIC) of the United States, but it is opento investment from member countries.
Russin, Vecchi and Heredia Bonetti (1996), however, consider that a new liberallegislation is not all the country needs to attract more investment. The DominicanRepublic cannot lose more time and must move forward with some indispensablereforms to mobilize economic and political modernization. These reforms include theimprovement of the electoral system, the independence of the Judiciary, themodernization of the Civil Service, and the general strengthening of democraticinstitutions.
The reform agenda also includes the approval of a new Monetary and FinancialBill, additional customs reform, legislation on intellectual property, the GeneralTelecommunications Law, the General Law on Privatization, new legislation on privateinsurance, the General Law on Education and new environmental legislation. Finally, alaw should be approved to privatize electrical power so as to make it more efficient. Thesingle, most negative element in the country’s investment climate is the short supply ofenergy, which causes inefficiency in the production sector and increases its costs.
The repeal of Law 861 began the process of updating the country legislation.New legislation must complete that task in order to meet the exigencies of a new worldeconomic context and to establish a better position for entering into internationalcompetition.
(c) Jamaica as a premier investment location
“The Smart Business Choice” is the image that Jamaica Promotions Limited(JAMPRO) tries to sell to investors (JAMPRO, 1996). Different advantages corroboratethis assertion.
Geography. Jamaica is located in the hub of the Caribbean Sea, featuring amountainous central spine and broad coastal plains, fringed with beautiful beaches. Theisland is the largest of the English-speaking countries in the Caribbean. The country liesat the crossroads of major shipping and air routes linking the markets of Europe andNorth America, and the Panama Canal links it to the Pacific. The world’s major capitalsare within easy reach from the island’s strategic location.
Political stability. A former British colony, Jamaica has maintained a tradition ofdemocratically elected governments that respect and protect individual rights, freedomand property.
Vibrant business climate. Both Government and Opposition agreed on aphilosophy of economic development led by the private sector. The country hasembarked on a path of liberalization of all the economic forces. The privatization ofgovernment-owned entities has proceeded apace, and Jamaica is first among26 developing countries in terms of divested properties.
Education. Jamaica’s education and training system has its roots in the Britishsystem. The formal education system has four levels, from pre-primary to tertiary, and a
37
non-formal system provides specialized skills and vocational training, including on-the-jobtraining. Tertiary education is available beyond the high-school level at the University ofthe West Indies, the College of Arts, Science and Technology and various otherspecialized institutions. Local degrees and diplomas are internationally accepted, and theUniversity has post-graduate links with several universities in North America and theUnited Kingdom. The Jamaican population is 85% literate.
Safe foreign investment. Foreign investment is welcome and enjoys an attractivepackage of fiscal incentives. Jamaica has signed bilateral investment agreements withthe United Kingdom, the United States, Germany, France, Switzerland and theNetherlands. Although joint ventures between local and foreign entrepreneurs areencouraged, foreign investors may own 100% of a company that is locally incorporatedor registered, and no approvals are required.
Income tax regime. The corporate income tax rate and the withholding tax onremittances are 33.3%. There is no capital gains tax. The personal income tax rate is25% on earnings over United States $ 18 408. Double taxation agreements exist withthe following countries: Canada, Denmark, Germany, Israel, Norway, Sweden, theUnited Kingdom and the United States. There is also an agreement with the CaribbeanCommunity (CARICOM) countries.
4.3 INVESTMENT IN EXPORT PLATFORMS
Besides selling a favourable country image, governments have to provide competitiveconditions for investors interested in establishing production and trade facilities orientedtowards the international market. Those facilities are the most sought after, because theprevailing export-led growth strategies rely on them. At least in the short term, a largeshare of those plants will be installed in EPZs. Special attention should therefore be paidto the current free-zone regimes in the three countries under consideration.
(a) Costa Rica
Costa Rica has two export promotion mechanisms in place: the regime of activeperfection (temporary admission) and free zones. A third regime (export contracts) waseliminated in 1996, with minor exceptions which will extend some contracts until 1999(CENPRO, PROCOMER and Zona Franca, 1996; PROCOMER, 1997).12
The regime of active perfection (temporary admission) is based on customsregulations which suspend all taxes on the entry into national territory of certainmerchandise destined to be re-exported to non Central American markets after beingtransformed, repaired, reconstructed, mounted or assembled. The normal time limits forimported goods to remain in the country is three months for samples and models, sixmonths for raw materials and other components used in the production process and fivemonths for machinery and equipment. All these terms can be renewed. The benefits oftemporary admission are granted for a period of five years, which is automaticallyrenewed with the approval of the Ministry of Foreign Trade.
12 Eduardo Alonso, General Manager of the Foreign Trade Corporation (PROCOMER),
provided information on the Costa Rican trade regime. His comments and criticism on severalpoints of the paper dealing with that country have been very useful.
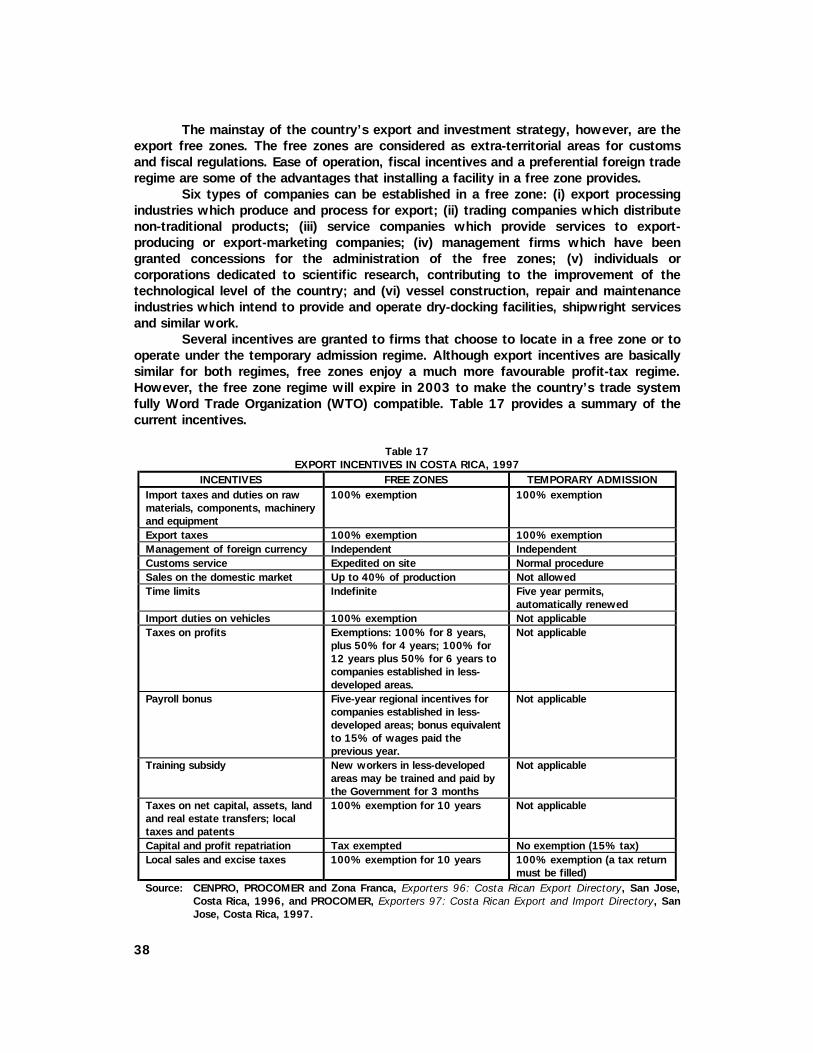
38
The mainstay of the country’s export and investment strategy, however, are theexport free zones. The free zones are considered as extra-territorial areas for customsand fiscal regulations. Ease of operation, fiscal incentives and a preferential foreign traderegime are some of the advantages that installing a facility in a free zone provides.
Six types of companies can be established in a free zone: (i) export processingindustries which produce and process for export; (ii) trading companies which distributenon-traditional products; (iii) service companies which provide services to export-producing or export-marketing companies; (iv) management firms which have beengranted concessions for the administration of the free zones; (v) individuals orcorporations dedicated to scientific research, contributing to the improvement of thetechnological level of the country; and (vi) vessel construction, repair and maintenanceindustries which intend to provide and operate dry-docking facilities, shipwright servicesand similar work.
Several incentives are granted to firms that choose to locate in a free zone or tooperate under the temporary admission regime. Although export incentives are basicallysimilar for both regimes, free zones enjoy a much more favourable profit-tax regime.However, the free zone regime will expire in 2003 to make the country’s trade systemfully Word Trade Organization (WTO) compatible. Table 17 provides a summary of thecurrent incentives.
Table 17EXPORT INCENTIVES IN COSTA RICA, 1997
INCENTIVES FREE ZONES TEMPORARY ADMISSIONImport taxes and duties on rawmaterials, components, machineryand equipment
100% exemption 100% exemption
Export taxes 100% exemption 100% exemptionManagement of foreign currency Independent IndependentCustoms service Expedited on site Normal procedureSales on the domestic market Up to 40% of production Not allowedTime limits Indefinite Five year permits,
automatically renewedImport duties on vehicles 100% exemption Not applicableTaxes on profits Exemptions: 100% for 8 years,
plus 50% for 4 years; 100% for12 years plus 50% for 6 years tocompanies established in less-developed areas.
Not applicable
Payroll bonus Five-year regional incentives forcompanies established in less-developed areas; bonus equivalentto 15% of wages paid theprevious year.
Not applicable
Training subsidy New workers in less-developedareas may be trained and paid bythe Government for 3 months
Not applicable
Taxes on net capital, assets, landand real estate transfers; localtaxes and patents
100% exemption for 10 years Not applicable
Capital and profit repatriation Tax exempted No exemption (15% tax)Local sales and excise taxes 100% exemption for 10 years 100% exemption (a tax return
must be filled)Source: CENPRO, PROCOMER and Zona Franca, Exporters 96: Costa Rican Export Directory, San Jose,
Costa Rica, 1996, and PROCOMER, Exporters 97: Costa Rican Export and Import Directory, SanJose, Costa Rica, 1997.
39
In addition to export incentives, Costa Rica offers investors preferential marketaccess to the United States, the European Union and other Latin American countriesbased on a number of trade agreements.
(i) Caribbean Basic Initiative (CBI) II. CBI a unilateral United States programmewhich provides the country with trade and tax measures to promoteeconomic revitalization and to expand private-sector business opportunities.Virtually all products from Costa Rica are eligible except for textiles andapparel, canned tuna, petroleum and petroleum products and certainwatches (USITC, 1995a).13
(ii) Generalized System of Preferences (GSP). Most developed countries haveimplemented this instrument to promote imports from developing countriesunder reduced or zero import duties. Costa Rica is a beneficiary of the GSPof a large number of countries, including the United States, Japan and theEuropean Union.
(iii) Central American Common Market (CACM). Exports from Costa Rica toother Central American countries enjoy duty-free entry under the CACM.Goods produced within a free zone, however, may not be considered ofCosta Rican origin by other member countries.
(iv) Free Trade Agreement with Mexico. Costa Rica was the only CentralAmerican country able to respond positively to Mexico’s 1991 invitation tonegotiate free trade agreements. The Costa Rica-Mexico Agreement wassigned in 1994 and began its implementation the following year.
(b) Dominican Republic
The Dominican Republic has, at least formally, a dual system to promoteexports: Law 69, which is the cornerstone of the policy to support exports from thecustoms economy, and export processing or free zones.
Law 69 was enacted in 1979. It originally included three basic types ofincentives: (i) a foreign exchange incentive allowing export companies to retain apercentage of their hard-currency earnings, (ii) a fiscal subsidy ranging from 5% to 25%and (iii) duty free and tax exemptions on imports of raw material and parts (not includingmachinery).14 Law 69 has been plagued by administrative and procedural delays,implementation inconsistencies and other obstacles that have rendered it almost useless.Law 69 rebates have long been considered a failure, and it is now widely accepted thatthe country does not have efficient export-promotion policies except for the free-zoneregime (Vicens and Martínez, 1996).
The successful performance of free zones in the Dominican Republic stems fromthe convergence of local and international determinants. In 1983, the Caribbean BasinInitiative (Caribbean Basin Economic Recovery Act) was enacted in the United States,and in 1990 the Dominican Republic joined the Lomé IV Convention. The country thusenjoys privileged access to the two premier world markets: the United States and theEuropean Union. On the domestic side, the Dominican Republic offers important benefits
13 Bilateral textile agreements with the United States are available under the Super 807regime. Costa Rica, however, has not used this benefit because of its reluctance to accept anykind of export quotas.
14 In general, exports are free of taxes and duties. That was not the case a decade ago,however, when export duties of 36% on traditional goods and 5% on non-traditional goods werelevied on exports from non-free zones.
40
for investors wishing to establish enterprises in the free zones, as well as plentifultrained labour. Although free zones in the country date back to 1969, the current regimewas enacted quite recently, in January 1990.15 Law 8-90 provides the legal frameworkfor the handling, organization, incentives, rights and obligations of the industrial free-zone companies and park operations (Pellerano and Herrera, 1996).
Free zones are defined as geographical areas of the country which are subject tospecial customs and tax controls established by law and where it is legal to installcompanies dedicating their production or services to foreign markets, via the granting ofnecessary incentives for their development. Law 8-90 foresees several kinds of freezones according to location.
(i) Industrial or services free zones can be installed anywhere in the nationalterritory to engage in the manufacture of goods or the providing of services.
(ii) Border free zones are granted special incentives, such as those foreseen inLaw 8-90 and those granted by the Executive Power. These free zones mustbe located at a distance of three to 25 kilometers from the border with Haiti.
(iii) Special free zones are allowed to be established near the source of non-movable resources, whether because of the nature of the production processor the geographic, economic and infrastructural conditions of the country.
As of mid-1996, there were 33 free zones in the country and another 10 underconstruction. In those zones, 476 firms provided about 182,000 direct jobs, which ismore jobs than those provided by all the manufacturing sector, except sugar (Valdez,1996; Kaplinski, 1993). Most companies originated in the United States, Canada,Europe, Taiwan (Province of China), the Republic of Korea and Japan. Following is a listof the main incentives available to investors in the export free zones.
(i) Total exemption from import duties is given for all goods used for producingexport goods by free-zone companies and operators (i.e., individuals orcompanies whose main activities are purchasing or leasing land, developingfree-zone infrastructure, selling or leasing buildings and facilities, and carryingout promotion and marketing activities to attract national and foreigncompanies).16
15 The first free-zone law in the country was enacted in 1955. No industrial free zones
were created, however, until the enactment of Law 299 in 1968, which provided tax and dutyexemptions on imports of machinery and raw materials and other fiscal incentives. Paradoxically,Law 299 was the main legal instrument aimed at fostering industrialization through importsubstitution in the Dominican Republic (Vicens and Martínez, 1996).
16 Article 24 of Law 8-90 stipulates the following exemptions for the free-zone companiesand operators: (a) income tax; (b) tax for constructions, loan contracts and the registration andtransfer of real property as of the constitution of the corresponding free-zone operators; (c) taxon the formation of commercial companies or the capital increase of same; (d) import taxes,duties, customs tariffs and other related charges affecting raw materials, equipment, constructionmaterial, building parts, office equipment, etc., all of which are oriented to constructing,preparing or operating in the free zones; (e) all existing export and re-export taxes with a fewexceptions; (f) taxes for licenses and corporate assets, as well as the value-added tax;(g) consular duties for all imports to be used by the free zone operators and companies; (h) importtaxes related to the equipment and utensils necessary for the installation and operation of thedining areas, health areas, medical assistance, childcare facilities, entertainment or amenities, orany other kind of equipment for the welfare of the workforce; (i) import taxes on transportationequipment including cargo vehicles, garbage collectors, microbuses and vans for thetransportation of employees or workers to and from work centers, in every case upon approval bythe National Council for Export Free Zones.
41
(ii) Free-zone operators and companies enjoy the benefits granted by the law forperiods of 20 years for border free zones and 15 years for those located inthe rest of the country.
(iii) Investors are free to repatriate profits obtained in the free zones.(iv) Up to 20% of total production may be sold on the domestic market
(applicable only for goods or services produced by a company in thecustoms territory).
(v) Plentiful labour is available at competitive prices, which is subject to nationallabour and social security regulations, but exempt from paying workers abonus equivalent to 10% of profits, as is legally mandatory elsewhere in thecountry.
(vi) Sea and air cargo services are generally of good quality.Like other Caribbean countries, the Dominican Republic is able to provide
investors with preferential access to foreign markets. The country enjoys preferentialaccess (non-reciprocal) to the United States market not only under the Caribbean BasinInitiative II, but also under Super 807 textile and garment agreements and theGeneralized System of Preferences. It also enjoys access the European market under theLomé IV Convention, as mentioned above.
Another regime which was particularly important for the Dominican Republicwas the United States Internal Revenue Code (USIRC) Section 936. This statuteprovided a special credit for certain types of income in qualifying corporations operatingin Puerto Rico and United States possessions other than the Virgin Islands. The PuertoRican government complemented this statute by granting tax exemptions of up to 90%of income to certain approved companies for a specific period of time, generally 10 to15 years. The combination of Section 936 credit, the incentives offered by Puerto Ricoand the Dominican Republic free-zone regime practically exempted companies operatingunder this law from taxes on their income from Puerto Rican and Dominican Republicsources. “Twin plants” were formed when firms operating in Puerto Rico under the 936tax provision installed complementary plants in the Dominican Republic to maintain the936 tax exemption, while utilizing relatively inexpensive Dominican labour (Pellerano andHerrera, 1995).
(c) Jamaica
Although the encouragement of exports has been an objective of Jamaicandevelopment policy for a long time, the orientation towards an export-push strategy wasonly attempted in earnest in the 1980s. Like Costa Rica and the Dominican Republic,Jamaica has a dual regime to promote exports: free-trade zones and export incentivesfor exporters located in the customs territory. Although free zones provide about 30,000jobs (that is, nearly one-fourth of total manufacturing employment), they rate muchlower than in the other two countries regarding government policy and interests (vanRiel, 1996).
Exporters located in the customs territory benefit from fiscal incentives underthe Export Industry Encouragement Acts (EIEA) of 1956, 1969 and 1974. They alsohave access to a customs-duty drawback scheme that provides a rebate for duties paidon imported raw materials used in export production.
Export financing and credit insurance are provided through the Export -ImportBank. Development financial institutions, such as the National Development Bank, grant
42
long-term financing at preferential rates. Credit schemes offering foreign exchangefinancing for raw material and equipment are also available.
Particular encouragement is given to industries producing for exports tocountries outside CARICOM. These industries include manufacturing activities, such asgarments, furniture and footwear; agriculture, such as a variety of tree crops, exoticfruits and flowers; tourism; bauxite; and motion pictures. Investors are eligible forincome tax relief and import duty exemptions for a maximum period of fifteen years. Inparticular, exporters of manufactured products and processed foods are eligible for dutyand income tax exemptions for a period of up to ten years. It is a simple matter,however, for a company to change its name and obtain, in effect, the incentives inperpetuity (Willmore, 1993a).
With regard to the free-zone regime, the Jamaican government operates threezones with approximately 165,000 square meters of building space, for companiesproducing exclusively for export.17 Although investors in the free zones are required toincorporate and register a Jamaican company, they have access to credit in the localfinancial markets under the same conditions as domestic companies. Such investorsreceive exemptions on duties and taxes on raw materials, machinery and equipment, andon corporate taxes and remittance taxes in perpetuity.
The EIEA regime offers exporters in the customs territory practically all thebenefits associated with free-zone status. The main difference is that EIEA exporters arenot free from foreign exchange controls or from quantitative restrictions on imports.Trade and foreign exchange liberalization18 has tended to blur the differences betweenthe two regimes (Willmore, 1993a).
Preferential market access to the European Union is guaranteed under the LoméIV Convention for products which meet rules-of-origin criteria, and to the United Statesunder the Caribbean Basin Initiative II and the bilateral Super 807 textile and apparelagreement. Jamaica also benefits from general duty free entry for products tradedwithin the Caribbean Community (CARICOM) and duty free entry for selected productsexported to Canada (under CARIBCAN) and to Venezuela (under the CARICOM-Venezuela Agreement).
4.4 COMPETITIVENESS POLICIES
Since the mid-1980s, policy efforts in Latin America and the Caribbean haveconcentrated on macroeconomic stabilization and export promotion. Most countries,designed and implemented those policies on the assumption that free markets andprivate-sector initiative were the best strategies for overcoming past excessive,inefficient state interventions. However, the mid-1990s have seen a revival of activegovernment policies to promote business competitiveness, based on the assumption thatmarket forces have not been enough to foster private initiatives to attain fast growth.This policy revival is not a return to past import-substitution policies, but a search for
17 The first free zone in the country was established in Kingston in 1976 (The EconomistPublications, 1988). This was followed by the Montego Bay Free Zone in 1985 and the GARMEXFree Zone (also in the Kingston area) in 1987 (Willmore, 1993a).
18 Tariffs are gradually being reduced. A Common External Tariff applies to imports fromoutside the Caribbean Community. Tariffs for raw material and capital goods are 5%, while thosefor imports of oil and steel are 20%. Garments and other manufactured goods have to pay a 20%tariff (JAMPRO, 1996).
43
new policy approaches and instruments consistent with a more open trade and financialenvironment. Peres (1996) identifies three types of policy perspectives in the region:(a) countries that have issued formal industrial-policy documents to guide their actions inthis field (e.g., Mexico and Brazil in 1996); (b) countries that prefer to tacklecompetitiveness in a broader sense than that implied by the term industrial policy (e.g.,the policy proposals of most of the Andean and Central American countries which followMichael Porter’s methodology), and (c) countries that concentrate on horizontal, non-discriminatory policy areas (such as technology diffusion, human-resources developmentand export promotion) with only a few or no explicit references to sector-based policies(e.g., Chile and Uruguay).
Jamaica and Costa Rica fit easily within this policy typology. The former is aclear case of a country with a specific industrial programme (the National IndustrialPolicy of March, 1996), while the latter follows an approach to competitiveness andindustrial modernization very much based on Porter’s competitive analysis (Porter,1990). For the Dominican Republic, it is still too early to identify the policy approachthat will guide that the actions of the new government, which took office in the secondsemester of 1996. Given this constraint, this section will concentrate in the cases ofCosta Rica and Jamaica.
(a) Jamaica’s 1996 National Industrial Policy 19
In March 1996, the Government of Jamaica introduced the National IndustrialPolicy.20 This was the culmination of almost two years of public debate on the subject,as well as extensive consensus-building activities and research by technical teams inspecific industries.
For many years, Jamaica pursued inward-looking industrialization policies basedon import substitution. In the 1970s and 1980s the Jamaican economy faced seriousbalance-of-payments and fiscal crises, exacerbated by external shocks. The adjustmentprocess which followed in the mid-1980s involved abandoning policies of protection andheavy Government involvement in the economy, in keeping with the neoliberal policyprescriptions advocated by international lending institutions. Jamaica opted for tradeliberalization and other economic reforms designed to strengthen the marketmechanisms and support export-oriented growth. Within this context, industrial policygenerally came to be regarded with suspicion, because the country’s economic problemswere attributed to inappropriate policies, particularly an overvalued exchange rate, fiscalexpansionism and excessive state intervention. In the new policy model, the privatesector was considered the engine of growth, and export promotion was the mainstrategy.
Concerns about the efficiency of existing markets had arisen by the mid-1990sand industrial policy is once more receiving serious consideration. This trend has becomemore pronounced since 1994 and has provided the immediate justification of theGovernment’s effort to formulate a comprehensive industrial policy. Industrial policieswere never completely abandoned, however, even during the earlier stages of structural
19 This section was prepared by Wesley van Riel, a consultant to the ECLAC/UNDP
Regional Project RLA/88/039. For a detailed account, see van Riel (1996).20 The National Industrial Policy uses a comprehensive definition of industry. The entire
productive sector is included in its scope, not merely the manufacturing sector. The new policy isdetailed in Government of Jamaica (1996).

44
adjustment. Despite radical policy reforms centered on liberalization, deregulation andprivatization combined with orthodox macroeconomic policies, sectoral policies gearedto improving export performance have always been in place.
The Government position is that industrial policy is a necessary policy responseto changes in the international environment and to the emergence of threats andopportunities for the country. In particular, industrial policy seeks to enhance theinternational competitiveness of Jamaican firms and to stimulate export growth.Sectoral interventions and other measures associated with industrial policy are justifiedin terms of the overall benefits to the economy. They do not imply a reversal ofliberalization or orthodox macroeconomic policies.
The two strategic focuses of the National Industrial Policy are an export push intargeted areas of competitive advantage and an efficient process of import substitution.The most important policies considered in this strategy are technology diffusion, humanresources development, export promotion and fostering small-enterprise development.
Policies for technology diffusion aim to improve competitiveness by thesystematic application of science and technology to production. This is expected toproceed along four fronts: (i) strengthening scientific and technological capacity,particularly research and development activities by firms and government institutions, aspart of a support infrastructure for industries; (ii) technical assistance at the enterpriselevel provided by government agencies; (iii) technology transfers through foreign directinvestment; and (iv) stimulation of technological improvements and retooling by meansof appropriate trade policies (e.g., no duties on all capital goods) and fiscal incentives(e.g., accelerated depreciation).
The National Industrial Policy incorporates multiple policy lines to fosterinvestment. While macroeconomic stability is seen as a key precondition for sustainedinvestment growth, the Government recognizes an important role for interventions that aregeared to eliminate particular barriers to investment. The policies include traditional short-run fiscal incentives such as those established by the Export Industry Encouragement Act,although the limitations of these incentives are recognized. In the medium to long term,the tax system will be reformed to make it more “investor friendly”, provide supportservices, facilitate investment financing —through the establishment of an investmentfacilitation board to expedite the processing of investment proposals— and reduce thequantity of paperwork required from investors.
Specific measures to promote foreign investment revolve around macroeconomicstability, market-oriented reforms, trade and investment facilitation and competitive costand risk. Recent Jamaican experience, as well as that of the region as a whole, indicatethat the ability to compete aggressively for FDI will be influenced less by the design ofincentive programmes and other policy interventions, and more by the growth ofinvestment opportunities in traditional and non-traditional areas.
Human resources development will be based on four policy considerations:(i) the large gap which exists between the demand for education and training and thecapacity of existing institutions and programmes; (ii) the changing priorities ineducational and training policies, which are determined by a fast-changing globalenvironment and its impact on the country’s competitiveness; (iii) the weaknesses inhuman resource capabilities, which directly affect the competitiveness of firms; and(iv) the problem of acute poverty and the role of education as a means to improve socialequity. In this framework, priority will be given to meeting educational needs at theprimary and secondary levels.
In addition to the export promotion schemes previously analyzed, the maininnovations in the new policy are threefold: (i) a shift from sector-specific to broad-
45
based incentives;21 (ii) an amendment to the Export Free Zone Act to facilitate theestablishment of single-entity free zones; and (iii) increased collaboration between theGovernment and the private sector in market development, research and development,the establishment of a one-stop facility for exporters, environmental standards andsecurity for shipments.
Government initiatives to stabilize the economy are expected to improve theperformance of the small-enterprise sector. In the short run, measures have been put inplace to help neutralize the direct effects of the tight monetary and fiscal policies. Inparticular, differential interest rates will stabilize the cost of finance to small businesses.Small firms’ access to more affordable factory space and technical assistance will alsobe facilitated.
The policies included in the Jamaican National Industrial Policy represent a mixof macro-level, sectoral and firm-level policies which try to increase the competitivenessof investment located in the country. In this sense, they are clearly part of the futurepolicy package that Jamaica will use to lure new investors.
(b) Costa Rica’s 1995-1998 Industrial Modernization Strategy
After a period of macroeconomic stabilization under the structural adjustmentprogramme that was enacted in 1985, the Arias Administration (1986-1990)established an industrial restructuring programme to identify sectoral problems andpropose solutions. Tripartite groups (government, business and labour) were organizedto formulate specific policy and action proposals, but the programme lost credibility dueto the lack of results. The funds originally assigned to industrial modernization wereeventually used for other purposes. The Calderón Administration (1990-1994)effectively ended that programme and instead emphasized foreign trade and directfinancial support to exporters oriented to countries outside the Central AmericanCommon Market. The end of the programme provoked uncertainty in the industrialsector, which felt that it was no longer a priority for governmental policy (Mortimore andZamora, 1996). The Figueres Government (1994-1998) reinstated an industrial policy,which began to be implemented in January 1995.22
The modernization strategy aims at six main objectives: (i) a continuousimprovement in the country’s competitiveness, (ii) an environmentally sustainableindustrial development, (iii) increased valued-added through the systematic use of thescience and technology infrastructure, (iv) the development of small- and medium-sizedfirms,23 (v) the strengthening of the Central American Common Market, and (vi) thepromotion of competitive markets (MEIC-MICIT, 1996). This strategy will beimplemented through horizontal, non-discriminatory policies, as well as through sector-based actions.
As of mid-1996, the most important policies being implemented were thefollowing: (i) the creation of a fund for industrial modernization in the form of specificcredit lines in the national banking system; (ii) the establishment of a fund to provide
21 This does not imply that sectoral industrial policies will be abandoned. Rather, theGovernment seeks to place emphasis on the effective promotion of strategic sectors, evaluatedon the basis of their competitive advantages.
22 The policy was outlined in Government of Costa Rica, A Strategy for IndustrialModernization in Costa Rica, San Jose, September 1994.
23 Although small firms are expected to be the main beneficiaries of this policy, it includesgovernment commitments and policy measures that go well beyond this universe of firms.
46
partial guarantees to small firms; (iii) the creation of a one-stop office for all certificatesand permits needed by industrial firms;24 (iv) the strengthening of the National QualitySystem; (v) the facilitation of small firms’ access to subcontracting and technicalassistance services; and (vi) the formation of five sectoral committees to channel therequests of industrialists and design specific actions to overcome administrativebottlenecks. Implementation of this modernization policy is subject to the authority ofthe tripartite High Council for Industrial Policy Negotiation created in September 1995(Alonso, 1996).
Broad actions are already being implemented to further support industrialrestructuring. These include the modernization of basic education and vocationaltraining, as well as more limited actions in the field of science and technology (Labarcaand Peres, 1997).
Although the Costa Rican modernization strategy may look modest incomparison to the Jamaican industrial policy, it also sets the basis for increasing thecountry’s competitiveness and its potential attractiveness to foreign, as well as local,investors.
(c) The 1990 Dominican Republic New Economic Programme
In 1990, the Dominican Republic Government initiated an ambitious adjustmentand reform programme called the New Economic Programme.25 Its stated objectiveswere to reduce inflation and promote stable economic growth. In fact, the newprogramme mainly focused on reducing and eventually eliminating the public-sectordeficit, combined with a restrictive monetary policy, the liberalization of credit andforeign exchange markets and a reform of the trade and tax systems. New rulesgoverning foreign investment and free-zone investment were also enacted in 1990.
The shift towards opening up foreign trade by reducing tariffs and eliminatingnon-tariff barriers put strong competitive pressure on non-free-zone companies torestructure their operations. Despite foreign trade liberalization, import policies are stillimplemented on a discretionary basis. For example, customs continues to require localimporters, as well as free-zone companies, to pay for a consular invoice and for thelegalization of shipping documents. Although customs has greatly improved since thereform, the importation of goods can still be a slow, difficult process. The main problemseems to be that customs bases its tariff collection on a highly discretionary valuationsystem for assessing duties on imports, which is permanently under revision.Uncertainty is thus never overcome (Vicens and Martínez, 1996).
As discussed above, a new foreign investment law that eliminates most of theresidue of the previous protectionist policies has recently enhanced this liberal stance.Although it is too early to forecast the actions the new Administration will carry outunder the new industrial policy, the differences among the approaches tocompetitiveness policies in the Dominican Republic, Jamaica and Costa Rica can hardlybe overstated.
24 This action is part of a broader deregulation effort to reduce the cost and time requiredto create an enterprise.
25 This section draws heavily on Vicens and Martínez (1996).
47
5. MEASURING POLICY COMPETITION
The wide array of policy lines in the countries under consideration, as well as differencesin their implementation, makes it very difficult to present a general overview of policycompetition without the help of a quantitative indicator. Using a methodology developedby AXIS Estrategias Empresariales,26 we present a general index to measure howattractive a country is for investment originating in the United States. Given the largeshare of the United States in total investment flows to the Caribbean Basin, the indexprovides a good proxy for a country’s attractiveness for foreign investment in general.Moreover, because the set of conditions that lure foreign investment includes the set ofconditions that attract domestic investors, the index also serves as a good indicator of acountry’s capability to attract investment in general.
The index that measures a country’s capability to attract investment (CAI) fromthe United States incorporates the weighted average of 64 variables that economictheory and practice consider to be the most relevant for United States investors whenthey decide to invest abroad. The variables were integrated into one index through afour-stage process of weighted averages. 27
The main sources of statistical data for those variables were published by thefollowing organizations: the International Monetary Fund (IMF) for most economicindicators; the United Nations Economic Commission for Latin America and theCaribbean for complementary economic indicators; the World Bank for health indicators;The Economist Intelligence Unit for political risk; and the United Nations Educational,Scientific and Cultural Organization (UNESCO) for education indicators. Since most ofthe variables are based on “objective” data, the resulting index may be quite differentfrom the “subjective” image a given country conveys abroad. This is a big plus for theCAI.
The index was used to study the period 1989-1993 for nine Caribbean Basincountries: Barbados, Costa Rica, the Dominican Republic, El Salvador, Guatemala, Haiti,Honduras, Jamaica and Trinidad and Tobago. Data for some specific indicators (e.g., thestock of a particular production factor) were only available for an earlier date, however.The set of first- and second-stage variables included in the index are summarized in table18, as well as their respective weights.
26 Dr. Imelda Cisneros, President of AXIS Estrategias Empresariales (AXIS Business
Strategies), a consulting firm in Caracas, Venezuela, provided the necessary information fordeveloping the analysis included in this section.
27 AXIS assigned weights to each variable or set of variables on the basis of its ratherorthodox approach to economic theory.
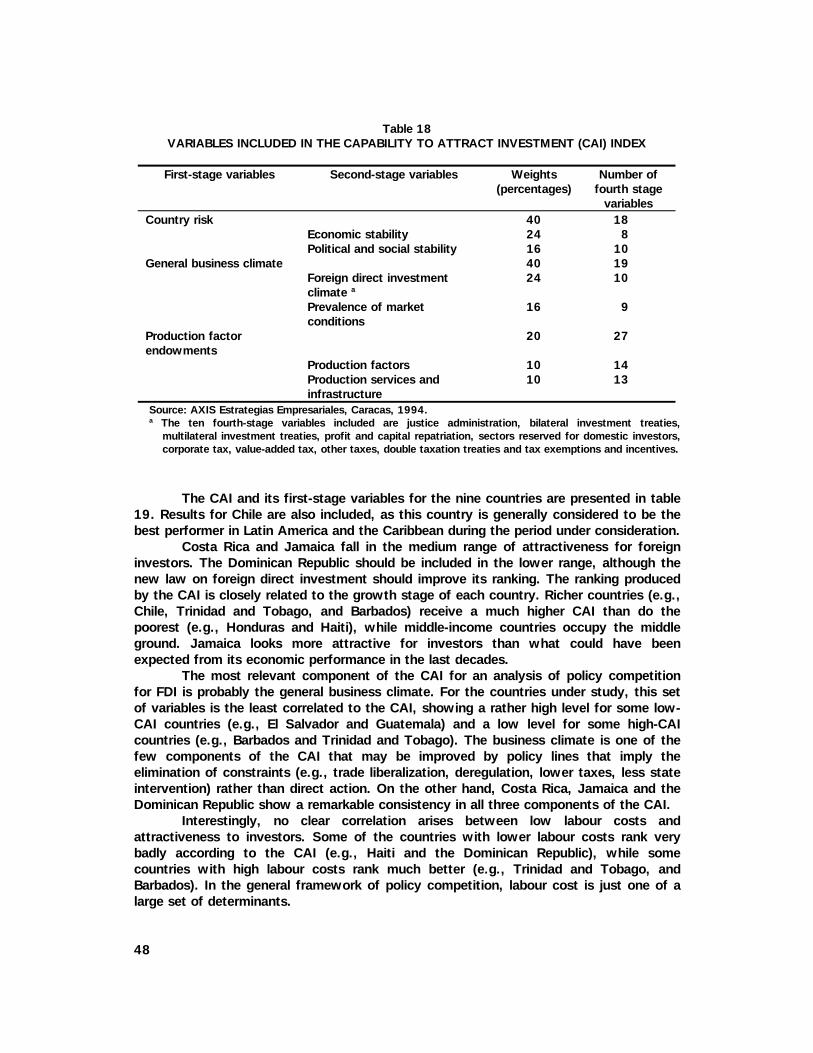
48
Table 18VARIABLES INCLUDED IN THE CAPABILITY TO ATTRACT INVESTMENT (CAI) INDEX
First-stage variables Second-stage variables Weights(percentages)
Number offourth stage
variablesCountry risk 40 18
Economic stability 24 8Political and social stability 16 10
General business climate 40 19Foreign direct investmentclimate a
24 10
Prevalence of marketconditions
16 9
Production factorendowments
20 27
Production factors 10 14Production services andinfrastructure
10 13
Source: AXIS Estrategias Empresariales, Caracas, 1994.a The ten fourth-stage variables included are justice administration, bilateral investment treaties,
multilateral investment treaties, profit and capital repatriation, sectors reserved for domestic investors,corporate tax, value-added tax, other taxes, double taxation treaties and tax exemptions and incentives.
The CAI and its first-stage variables for the nine countries are presented in table19. Results for Chile are also included, as this country is generally considered to be thebest performer in Latin America and the Caribbean during the period under consideration.
Costa Rica and Jamaica fall in the medium range of attractiveness for foreigninvestors. The Dominican Republic should be included in the lower range, although thenew law on foreign direct investment should improve its ranking. The ranking producedby the CAI is closely related to the growth stage of each country. Richer countries (e.g.,Chile, Trinidad and Tobago, and Barbados) receive a much higher CAI than do thepoorest (e.g., Honduras and Haiti), while middle-income countries occupy the middleground. Jamaica looks more attractive for investors than what could have beenexpected from its economic performance in the last decades.
The most relevant component of the CAI for an analysis of policy competitionfor FDI is probably the general business climate. For the countries under study, this setof variables is the least correlated to the CAI, showing a rather high level for some low-CAI countries (e.g., El Salvador and Guatemala) and a low level for some high-CAIcountries (e.g., Barbados and Trinidad and Tobago). The business climate is one of thefew components of the CAI that may be improved by policy lines that imply theelimination of constraints (e.g., trade liberalization, deregulation, lower taxes, less stateintervention) rather than direct action. On the other hand, Costa Rica, Jamaica and theDominican Republic show a remarkable consistency in all three components of the CAI.
Interestingly, no clear correlation arises between low labour costs andattractiveness to investors. Some of the countries with lower labour costs rank verybadly according to the CAI (e.g., Haiti and the Dominican Republic), while somecountries with high labour costs rank much better (e.g., Trinidad and Tobago, andBarbados). In the general framework of policy competition, labour cost is just one of alarge set of determinants.

49
Table 19THE MAIN COMPONENTS OF CARIBBEAN BASIN COUNTRIES´ CAI
Countriesa CAI Country risk General businessclimate
Production factorendowments
Index b Ranking Index b Ranking Index b RankingChile c 0.73 0.667 2 0.714 1 0.700 1Trinidad andTobago
0.60 0.626 3 0.560 5 0.612 2
Barbados 0.57 0.697 1 0.530 7 0.450 4Costa Rica 0.56 0.604 4 0.543 6 0.528 3Jamaica 0.53 0.578 5 0.565 4 0.425 5El Salvador 0.49 0.443 7 0.607 2 0.305 7Guatemala 0.48 0.509 6 0.581 3 0.308 8DominicanRepublic
0.43 0.402 8 0.453 8 0.292 9
Honduras 0.39 0.318 9 0.448 9 0.342 6Haiti 0.27 0.293 10 0.277 10 0.178 10
Source: AXIS Estrategias Empresariales, Caracas, 1994.a Countries ranked according to their capability to attract investment (CAI).b A higher index means a lower country risk.c Included only as a reference.
Finally, table 20 presents the results for an important second-stage variable, theclimate for FDI, and its third-stage components, legal security for investment,regulations, and tax treatment. The weights of the third-stage components are 50%,30% and 20% respectively. Of the three focused countries, the best climate is providedby Costa Rica, followed by Jamaica and the Dominican Republic in a distant third. In thethird-level variables, these countries present an extremely heterogeneous performance.Although Costa Rica fares well regarding security for investment, its tax treatment isjust average and investors are overburdened by regulations. On the other hand, a veryfavourable tax treatment in the Dominican Republic is more than compensated byexcessive regulation and poor security for investment. Jamaica’s lack of security forinvestment can hardly be compensated by means of few regulations and an attractivetax regime. The poor ranking of our benchmark country (Chile) regarding tax treatmentand its excellent performance attracting FDI further indicate that low taxes are a ratherweak instrument for incentives-based competition.
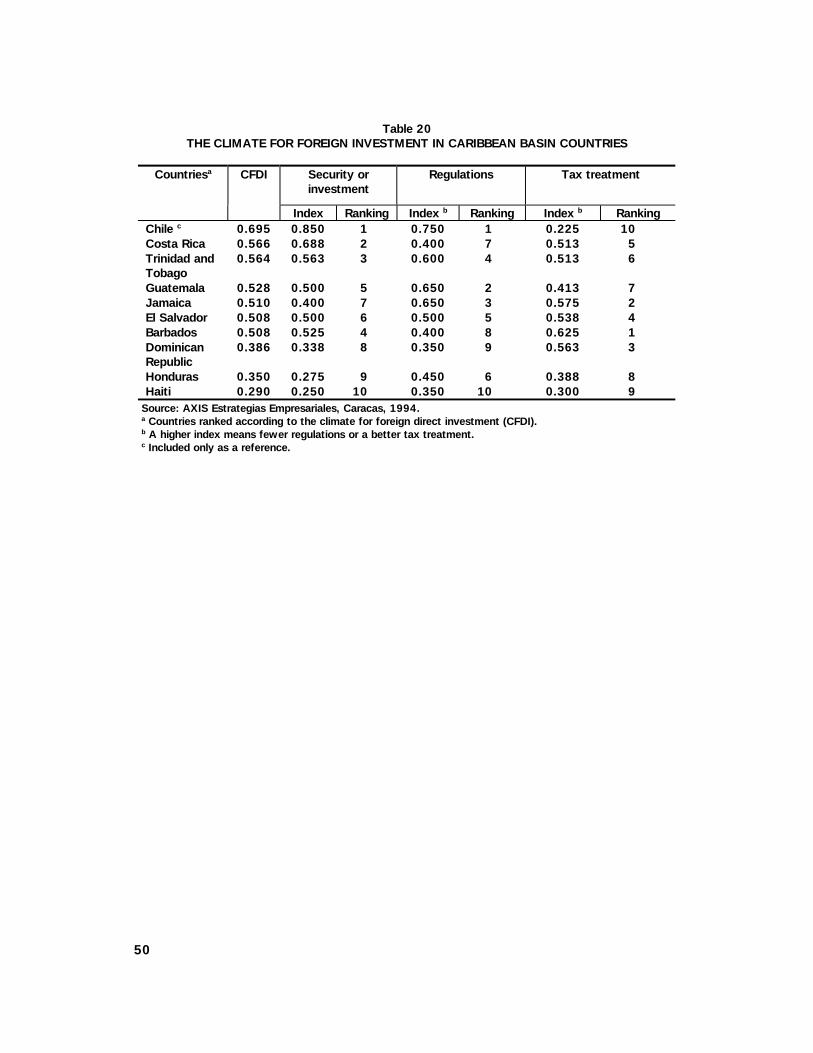
50
Table 20THE CLIMATE FOR FOREIGN INVESTMENT IN CARIBBEAN BASIN COUNTRIES
Countriesa CFDI Security orinvestment
Regulations Tax treatment
Index Ranking Index b Ranking Index b RankingChile c 0.695 0.850 1 0.750 1 0.225 10Costa Rica 0.566 0.688 2 0.400 7 0.513 5Trinidad andTobago
0.564 0.563 3 0.600 4 0.513 6
Guatemala 0.528 0.500 5 0.650 2 0.413 7Jamaica 0.510 0.400 7 0.650 3 0.575 2El Salvador 0.508 0.500 6 0.500 5 0.538 4Barbados 0.508 0.525 4 0.400 8 0.625 1DominicanRepublic
0.386 0.338 8 0.350 9 0.563 3
Honduras 0.350 0.275 9 0.450 6 0.388 8Haiti 0.290 0.250 10 0.350 10 0.300 9
Source: AXIS Estrategias Empresariales, Caracas, 1994.a Countries ranked according to the climate for foreign direct investment (CFDI).b A higher index means fewer regulations or a better tax treatment.c Included only as a reference.
51
6. THE DYNAMICS OF POLICY COMPETITION AND THE LIMITS OF NATIONAL POLICY
6.1 THE EXTENT OF POLICY COMPETITION
Policy competition for FDI in the Caribbean Basin is harsh. Besides rules-based andfactor-creation competition, bidding wars are taking place among countries and evenamong different regions within individual countries, despite their small geographical size.Several pieces of evidence indicate different dimensions of that competition.
The most important domestic factor that led to the expansion of the EPZs werethe competitive exchange rate devaluations of the early 1980s, which took place both inCaribbean Basin countries and elsewhere in Latin America (see figure and table 21).28
The onset of the debt crisis forced countries to reduce domestic absorption and generateforeign exchange surpluses to serve their debts (principal and interest). Althoughexchange rate depreciation was not directly aimed at attracting FDI, it was instrumentalto that goal because it implied a sharp reduction of wages measured in dollar terms.Since the late 1980s, stabilization programmes anchored on fixed nominal exchangerates have reversed the trend, but the Mexican devaluation of December 1994 onceagain put pressure on other countries to follow suit.29
Competition among countries is also taking place at a very detailedmicroeconomic level, as they compete for the investments of individual firms.30 To limitrivalry among member states for the location of industrial activities and to assist inrationalizing the criteria for granting incentives to firms, CARICOM enacted a Schemefor the Harmonization of Fiscal Incentives to Industry in 1973 (UNCTAD, 1996).However, CARICOM Secretariat (1993) finds that its impact has not been important, atleast in the more developed countries of the region.
Competition is also taking place among regions or cities in individual countries.For example, the Dominican Republic provinces put pressure on the Government to havetheir own EPZs, which resulted in 35 such parks by 1996. A national average of lessthan 13 firms per park suggests that competition has resulted in the buildup of excesscapacity. In fact, some of those parks are almost empty.
28 Kaplinski (1993) indicates that Costa Rica, the Dominican Republic, Jamaica and other
Caribbean countries had to keep a very high exchange rate for the United States dollar to increasetheir competitiveness during the 1980s. Besides devaluating, their currencies were kept closelyclustered to avoid losing competitiveness relative to each other. This would show that an actualbidding war on real wages took place during the whole crisis decade.
29 The competitive impact of the Mexican devaluation may be approximated by taking intoaccount that the ratio of wages to maquiladora exports fell almost 4 percentage points from13.3% in 1993 to 9.6% in 1995.
30 An outstanding example the struggle for Intel’s investment in a new microprocessorplant is presented later in this section.
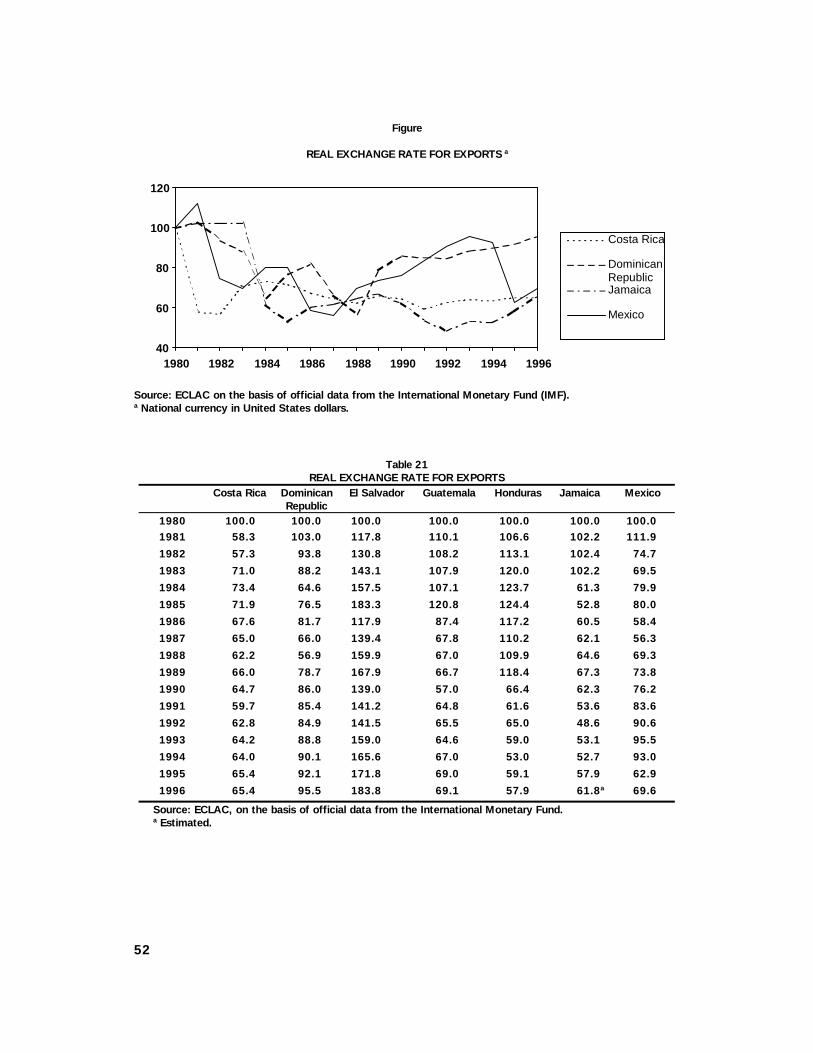
52
Figure
REAL EXCHANGE RATE FOR EXPORTS a
40
60
80
100
120
1980 1982 1984 1986 1988 1990 1992 1994 1996
Costa Rica
DominicanRepublicJamaica
Mexico
Source: ECLAC on the basis of official data from the International Monetary Fund (IMF).a National currency in United States dollars.
Table 21REAL EXCHANGE RATE FOR EXPORTS
Costa Rica DominicanRepublic
El Salvador Guatemala Honduras Jamaica Mexico
1980 100.0 100.0 100.0 100.0 100.0 100.0 100.01981 58.3 103.0 117.8 110.1 106.6 102.2 111.9
1982 57.3 93.8 130.8 108.2 113.1 102.4 74.7
1983 71.0 88.2 143.1 107.9 120.0 102.2 69.5
1984 73.4 64.6 157.5 107.1 123.7 61.3 79.9
1985 71.9 76.5 183.3 120.8 124.4 52.8 80.0
1986 67.6 81.7 117.9 87.4 117.2 60.5 58.4
1987 65.0 66.0 139.4 67.8 110.2 62.1 56.3
1988 62.2 56.9 159.9 67.0 109.9 64.6 69.3
1989 66.0 78.7 167.9 66.7 118.4 67.3 73.8
1990 64.7 86.0 139.0 57.0 66.4 62.3 76.2
1991 59.7 85.4 141.2 64.8 61.6 53.6 83.6
1992 62.8 84.9 141.5 65.5 65.0 48.6 90.6
1993 64.2 88.8 159.0 64.6 59.0 53.1 95.5
1994 64.0 90.1 165.6 67.0 53.0 52.7 93.0
1995 65.4 92.1 171.8 69.0 59.1 57.9 62.9
1996 65.4 95.5 183.8 69.1 57.9 61.8a 69.6
Source: ECLAC, on the basis of official data from the International Monetary Fund.a Estimated.
53
6.2 IS POLICY COMPETITION INTENSIFYING?
Policy competition is not only pervasive, but it is also intensifying everywhere in theregion. Three main forces are pushing in that direction.
The most important force is the erosion of tariff preferences derived from CBI,GSP and Lomé IV. Trade diversion based on unilateral trade concessions mostly fromthe United States, but also from the European Union have been the driving forcebehind EPZ garment and electronics exports. New developments in international tradeare causing those advantages to deteriorate, and they will be eliminated before themiddle of the next decade. The advantages of CBI are not as important as thepreferences Mexico received through the North American Free Trade Agreement(NAFTA); Lomé IV runs out in February 2000; and the results of the Uruguay Roundimply that the Multifibre Arrangement (MFA) will end in 2005. The most threatening ofthese events is by far the elimination of the MFA, because it will put Caribbean Basingarment exports under pressure from extremely competitive East Asian suppliers,especially China.
In the near future, however, the initiatives on NAFTA parity in the United Statesmarket will be relatively more important, due to the current negative impacts of NAFTAon the economies of most Caribbean countries. In the case of the apparel industry,Mexican products enjoy a 6-percentage-points tariff advantage over imports from themembers of the United States Caribbean Basin Initiative II (USITC, 1995b). Twoattempts in the United States Congress to obtain parity have failed. Furthermore,Mexican apparel is not subject to quotas in the United States market, because its accessis determined by the norms of origin of the NAFTA. These two advantages could easilyproduce FDI diversion from Caribbean Basin countries to Mexico (USITC, 1995a;ECLAC, 1994). They were undoubtedly factors in the decisions of two prominentapparel assemblers operating in the Caribbean Basin, Warnaco and Sara Lee, to opennew plants in Mexico.31
While plans for parity have stalled in the United States Congress, the impact ofNAFTA on the Caribbean economies has meant 150 plant closures and 123,000 lostjobs in the apparel industry.32 Since 1994, the Dominican Republic has lost 10,000 jobsin garment and footwear plants, and 7,000 jobs have been eliminated in Jamaica.Although Caribbean Basin economic problems cannot be ascribed only to NAFTA, thestrong trade diversion to Mexico is deteriorating the rather weak trade diversion of theCBI.
Another process that is changing the competitive balance in the region is theonset of peace in El Salvador and Guatemala. These countries, which are the mostpopulated in the region except for Cuba, are providing increasingly competitive bases fornew EPZ investments, particularly given the prevailing low wages and, in the case of ElSalvador, business acumen. More competitors will quite probably mean morecompetitive pressures. These pressures are well summarized in the recommendation ofthe Dominican Republic top private-sector association that “attention should be paid thatminimum-wage increases do not surpass those of competing countries” (CNEP, 1995).
31 “NAFTA and Caribbean Textiles”, Latin American Economy and Business, May, 1995,
p. 11.32 “Impact of NAFTA pounds economies of the Caribbean”, The New York Times, January
30, 1997, pp. A1 and A4.
54
Despite that recommendation, however, wage regulation and labour flexibilitycannot produce any sharp improvement for competitiveness in the region. Wages inEPZs are equal to or higher than those in comparable private-sector industrial firmsoutside of free zones, but earnings are still very low (usually about US$ 100 permonth33). Any further reduction would not change total production costs significantly.Union activity in the EPZs is minimal or non-existent, which is not much different towhat happens in the private sector in most countries in the region. EPZ investment didnot create poor labour conditions in the region; conditions are actually better in the EPZsthan in the rest of industry, except in large, state-owned enterprises. Slow economicgrowth, fast population increase and the debt crisis made the attractiveness of EPZsirresistible. The free zones were a reaction, not a cause.
A much more positive response to competition pressures is evident in theincreasing scale and productivity of apparel firms. In the Dominican Republic, forexample, EPZ exports grew from US$ 1.78 billion in 1995 to US$ 1.87 billion in 1996,while the number of firms decreased from 469 to 434.34 Growth has been accompaniedby technical progress and some firms are introducing modern modular productionsystems.
6.3 THE IMPACT OF POLICY COMPETITION
It is difficult to arrive at definitive evaluations of the costs and benefits of policycompetition for FDI. Such information tends to be scarce, and it is a complicated task tocasually relate FDI flows to the provision of incentives. Most sources agree thatincentives, while clearly not negligible, are a relatively minor factor in the locationaldecisions of TNCs. Other advantages, such as market size and growth, productioncosts, skill levels, political and economic stability and the regulatory framework play amuch stronger role (UNCTAD, 1996, p. 51). Nevertheless, fiscal incentives do tend tobe more attractive for footloose, export-oriented investments (Bergsman and Pirnia,1996), like the apparel and electronics industries in the Caribbean Basin. Anotherdifficulty for causal analysis is that incentives may influence different TNC investmentdecisions in the same way but for different reasons, in accordance with their specificcorporate strategies. Finally, unlike incentives, the net benefits for the host country arequite difficult to measure with any degree of precision, and the benefits themselvesmust be interpreted in terms of the goals of Government strategy, something that isusually not explicit and often changes appreciably over time.
For these reasons, a few cases may better illustrate the impact of policycompetition for FDI than do strictly theoretical or conceptual considerations. Twoexamples from Costa Rica help clarify a number of the above concerns and point to thenegative- or positive-sum outcomes of policy competition for FDI. A third example willbe used in the next section of this paper, which addresses the implications of the policycompetition for FDI.
Case 1. Coskoa S.A., a small assembler of women’s suits, is a Group IIIcompany in the Costa Rican garment industry.35 The company is a subsidiary of GilmorTrading Corporation of Hialeah, Florida, in the Miami Metropolitan Area. The parent
33 Overtime and other benefits may increase monthly earning to about US$ 150.34 Data from the Central Bank of the Dominican Republic.35 See section 3 of this paper for the definition of a Group III company.
55
company began in 1980; ten years later, it was a small trading company with 100employees and sales of about $19 million competing for contracts from buyers such asJ.C. Penney and Liz Claiborne. Its principal products were relatively undifferentiatedstandard ones which did not undergo any major changes in terms of technology, fashionor design and which resulted from a relatively unsophisticated, labour-intensiveproduction process. Because the company faced a deteriorating competitive situation inthe United States market, it established the Costa Rican subsidiary in 1989 to reduceproduction costs in order to compete better for buyers’ contracts. Costa Rican operationwas successful: by 1995, it accounted for about one-half of the sales of the parentcompany.
Coskoa´s principal competitors were other assembly operations in Colombia,Guatemala and Honduras. Although Coskoa enjoyed a very special advantage in CostaRica,36 it complained that its competitors in other countries benefited from even lowerlabour costs. From 1989 to 1996 Coskoa attempted to strengthen the competitivesituation of its parent firm by producing low-cost women’s suits in Costa Rica, takingadvantage of the fiscal incentives of the EPZ regime, the relatively low wages, and theHTS production-sharing mechanism for components sourced in the United States. Itsimply could not keep pace, however. Without notice, it closed its Costa Ricanoperation, leaving behind substantial unpaid wages and social security contributions.
This case presents both positive and negative aspects. On the positive side, thecompany provided an FDI inflow, the creation of about 600 jobs and a steady exportstream. On the negative side, it tended to operate like a sweatshop with a fly-by-nightmentality. The operation did not incorporate any local physical inputs in the productionprocess, the company displayed no concern for upgrading production to include moretechnologically complex or sophisticated goods, and sales were limited to one market. Itwas a short-term, defensive survival strategy. If one assumes that Government prioritiesincluded increased local integration (i.e., greater local content), technological upgradingand export market diversification to help extend the national industrialization process,then the incentives received by Coskoa were for the most part a dead loss. Thecompany turned out to be a free rider: it enjoyed the incentives offered by the countrybut contributed little in the way of what the Government was expecting from its fiscaland other incentives. This is clearly a negative-sum result and something to beavoided.37
Case 2. Sara Lee Corporation of Chicago, Illinois, has two undergarment-producing subsidiaries in Costa Rica that correspond to Group I operations.38 Sara Leebegan in 1941; in 1990 it had sales of about US$12 billion and 100,000 employees.Sara Lee is a diversified producer of various food products and women’s undergarments,including hosiery, brassieres, girdles and allied garments. Bali, Hanes and L´eggs are thebetter-known trademarks of this leader in the garment business. The garment productsare sophisticated and technologically complex, and fashion, design and quality areimportant considerations for consumers. The first Costa Rican subsidiary was set up in1978, before the sharp currency devaluations of the 1980s; the second was establishedin 1987. These subsidiaries provide the parent company both production cost
36 It was the first company allowed to operate under the EPZ regime without being
physically located in a formal free zone, thereby allowing it to source even cheaper labour.37 This case does demonstrate that, in certain circumstances, it is a clearly positive result
when a footloose firm moves on, even if job losses are a consequence.38 See section 3 of this paper for the definition of a Group I operation.
56
advantages and great flexibility to adapt to the changing competitive situation in theinternational market.
The principal competitors of these subsidiaries are other TNCs in the UnitedStates market and other subsidiaries or contractors of Sara Lee in the DominicanRepublic, Honduras, El Salvador, Puerto Rico and Mexico. One of the Costa Ricansubsidiaries serves as the Central American headquarters for many of the operationalaspects of the other producers there. These subsidiaries have expanded forcefully inCosta Rica. They seem to have adapted to rising wage rates through continuousincreases in labour productivity, as well as through technological upgrading of theproduction process for the specialized fashion products. They helped their parentcompanies win back United States market shares from Asian competitors. The 1995“calls” made by the United States Government on undergarment imports from CostaRica put a damper on their rate of expansion,39 but a decision by the World TradeOrganization (WTO) which was favourable to Costa Rica would appear to have resolvedthat problem.
These subsidiaries have had important positive effects for Costa Rica, includingsignificant FDI inflows, the creation of about 4,000 jobs and very significant exportstreams. In the course of their long-term relationship with Costa Rica, they havecontributed in a major way to the training of specialized workers, the technologicalupgrading of their operations, and, in a more minor way, to export marketdiversification. Both stated that they would further expand their work force if they couldfind what they needed. On the negative side, little in the way of improved nationalintegration has resulted, although one subsidiary did attempt unsuccessfully to sourcethread and cardboard locally and the other hopes to extend the local production processto include cutting cloth sourced in the United States. The increased advantages of theMexican subsidiary, however, could limit further expansion in Costa Rica if NAFTAparity is not attained. This case represents a notably positive-sum result. Thesesubsidiaries are at the center of the Costa Rican export success of the 1980s and1990s, and an effort should be made to increase the links between this kind ofoperation and the national economy.
The specific examples have demonstrated how negative- or positive-sumoutcomes evolve from the combination of distinct TNC strategies (e.g., cheap labourversus corporate flexibility) and Government goals (e.g., FDI inflows, job creation,export streams, national integration, technological upgrading and export marketdiversification). Simply keeping up with the FDI incentives offered by other countriesdoes not guarantee success. Furthermore, unfocused FDI incentives produce lesspredictable results. Government policy makers face a more generic problem, however,with regard to FDI incentives based on EPZ operations. The Governments’ desire todeepen the national industrialization process is directly challenged by the use of the EPZregime as an incentive for FDI. Assembly operations based on components sourced inthe United States via HTS 9802 may actually truncate that industrialization process,because of the application of tariffs on local inputs on entry into the United Statesmarket. This dilemma represents a major limitation to the success of national policy inthe wider sense, that is, goals beyond simply increasing FDI inflows.
39 A United States firm which feels that it has been unduly prejudiced by an abnormal
increase in imports to the United States can request a decision by the Department of Commerceto determine if import disruption has taken place. The Department of Commerce can issue “calls”(or, warnings) to the local textile offices which allocate quotas in exporting countries in order torestrain the growth of such items.
57
6.4 POLICY IMPLICATIONS
When developing countries are not able to offer financial incentives to influence thesiting decisions of TNC investments, it is not enough simply to match the fiscal andother incentives of one’s competitors, especially in the form of EPZs. An integral, activepolicy focused on wider national goals is required.
For the small, open economies of the Caribbean Basin, an active policy mustcontemplate at least three separate elements. First, some kind of international accordmust recognize that bidding wars can spin out of control to no one’s benefit except theTNC receiving the incentives. Since developing countries cannot compete with thefinancial incentives of developed countries, they rightfully propose the institution ofsome kind of incentive cap. This is difficult, as even The Economist comments: “Somedeveloping countries complain that, while rich-country governments are keen to seeforeign investors given greater protection against interference from host governments(an OECD agreement on this is due to be completed by May), they are less eager to calla halt to FDI auctions”.40 Initiatives can rightfully be made through the OECDMultilateral Agreement on Investment and through the Working Group on Investment(chaired by Costa Rica) of the Free Trade Area of the Americas (FTAA) negotiations,among others.
Second, the Caribbean Basin countries must act in concert to achieve parity withMexico regarding access to the United States market, as analyzed above.
Third, and most important component, general incentives policy must bereassessed in the context of a new, more competitive international market. Clearly, theincentives have to become more effective. Four operational policy guidelines may help toaccomplish this.
(i) Actively target relevant TNCs. Officials should actively seek out those TNCsthat are most likely to further the Government’s wider goals, such as theindustrialization strategy.
(ii) Focus incentives to promote industrial goals, such as the creation andupgrading of clusters. The aim is, first, to use incentives to promote aconcrete strategy, which could work very well in the apparel and electronicsindustries, and, second, to involve national companies in the evolution ofthese clusters.
(iii) Link the receipt of incentives to investment, transfer of technology, valueadded, training or other aspects of the subsidiary’s operation. The aim is toavoid free riders.
(iv) Limit incentives in time, clearly specifying deadlines and requirements forrenewal or extension. The aim is to avoid creating incentive-dependentoperations.41
Incentives should become less universal and more focused on national goals, ifthey are to contribute more to the advancement of small, open economies in theCaribbean Basin. These recommendations are not far from current practice in other partsof the world, especially developing Asia. Costa Rica has successfully applied similarpractices in the electronics industry, which grew by 47% in 1995. Government policy
40 “Uncommercial travelers”, The Economist, 1 February 1997, p. 25.41 For example, a tire producer created in the 1960s as an “integration industry” in the
context of the Central American Common Market is today requesting EPZ status in Costa Rica.

58
has attracted a number of important electronic firms (including Intel, Motorola, AcerAmerica, DSC Communications, Bourns, C&K Components, Panduit, Conair, Panasonic,Hitachi, Siemens, Square D and GTE Sylvania) and has produced the beginnings of animportant new industrial cluster.42 Costa Rica’s strategy for the electronics sector hasadvanced considerably compared to that used for the apparel industry in the 1980s.
Case 3. Intel is the world’s largest semiconductor company, with 90% of thecore market for PC processors and 9% of the total world semiconductor market. In1996, it enjoyed revenues of US$16.2 billion, profits of US$3.6 billion and a stockmarket capitalization of US$103.9 billion.43 The company’s MMX technology promisesfurther growth in the future.44 Negotiating a major new investment valued at US$300-500 million with so important global player was a very significant accomplishment forCosta Rica. This project alone is predicted to raise GDP growth by 0.5% in 1997.45
The new plant in Costa Rica is an assembly and test facility for the low-technology end of a technology-intensive industry. It forms part of a group of five suchIntel plants worldwide; the others are in Shanghai (China), Manila (the Philippines),Penang (Malaysia) and Arizona (the United States). At the end of the first stage of theinvestment project, the plant will cover 4,000 square meters and have 2,000 directemployees. Operations are scheduled to begin in early 1998. FDI by associated supplierscould reach an additional US$500 million, and the 15% value added of the Intelproduction process will appreciably augment the net value of Costa Rican exports.Negotiations between a special task force of the Costa Rican Investment and TradeDevelopment Board (CINDE)46 and Intel began in November 1995 and more recentlyinvolved the direct participation of the President of the country. Costa Rica won outover the offers of Brazil, Chile and Mexico.
How important were incentives and what was the nature of the negotiatingprocess? Both CINDE and Intel claimed that no special treatment or special investmentincentives beyond the EPZ regime were offered or received. An Intel spokesmanindicated that their principal concerns were always “infrastructure, the operatingenvironment and labour. No matter how many economic incentives a country may offer,if you can’t operate the facility it won’t come into contention as a site”.47 However,Intel received several specific advantages in each one of these categories. Because theIntel operation was to become the principal consumer for electrical energy in Costa Rica,the Intel subsidiary was promised its own electrical substation and electrical energy atabout one-half the normal rate. With regard to labour, the Government madecommitments to train workers, some of whom would participate in training programmesin Intel’s plants in the United States.
42 Information from the Costa Rican Investment and Trade Development Board (CINDE)
web site at http://www.cinde.or.cr43 “Intel and microchips: Squeeze, gently”, The Economist, 30 November 1996, p.65.44 “Make way for MMX computers”, Business Week, 3 February 1997, p.22.45 Intel invested a total of $5 billion on capital projects and R&D in 1996; about every nine
months it was putting up a new chip plant, usually costing about US$2 billion each. See “Intel’samazing profit machine”, Fortune, 17 February 1997, p. 63.
46 A profile of CINDE, including interviews with its Investment Director and a member ofIntel’s Costa Rican site selection and start-up team is found in FDI News, vol. 1, Number 3,Foreign Investment Advisory Service (FIAS), Washington, D. C., December 1996.
47 FDI News, vol. 1, Number 3, Foreign Investment Advisory Service (FIAS), Washington,D.C. December 1996, p. 13.
59
This case clearly support the recommendations listed above. First, the CostaRican policy team actively targeted Intel until they were finally invited to make apresentation at Intel’s headquarters in Santa Clara, the result of which was the inclusionof Costa Rica as a possible location. Second, Costa Rica’s new policy identified theelectronics industry as a potential vehicle for advancing policy goals and focusedspecific incentives in that area, although concrete measures to increase the involvementof national firms were not defined. The third and fourth recommendations linkingincentives to performance and limiting them in time are not apparent in this case, butboth are relevant and attainable in the future. For example, Intel responded to criticismof its new US$2-billion, 5,000-employees, computer-chip plant in Albuquerque, NewMexico, in the United States: “Economists grumble that the plant has sucked more outof the state in tax breaks than it has contributed to the economy. Contrite, Intel hasembarked on a number of schemes to improve its popular standing, among them acommitment to buy 40% of its supplies in New Mexico which should be worth $170million to the state economy each year.”48 Intel is clearly susceptible to this kind ofpressure. Finally, by limiting the time period for the Intel incentives (especially electricityrates), government policy could attempt to induce Intel to upgrade the plant from thelow-tech end of the industry, deepening the local industrialization process at the sametime.
Developing countries can thus influence TNC siting decisions and produceimportant national impacts, which the governments of the industrial countriesaccomplish through direct financial incentives. In a world where competition isintensifying, policy makers must focus FDI incentives on priority activities, such as thecreation of industrial clusters and their technological upgrading. In the apparel andelectronics industries of the Caribbean Basin, this entails combining a focused incentivepolicy with a defined industrial strategy in order to increase specialization and improveinternational competitiveness. Those economies must seek to boost exports throughauthentic international competitiveness, rather than by bidding up incentives to FDI andsoliciting special access to one market.
48 “New Mexico: Flirting with the future”, The Economist, 4 January 1997, p. 27.


61
7. CONCLUSIONS
Policy competition for FDI in the Caribbean Basin, as derived from the study of CostaRica, the Dominican Republic and Jamaica, is characterized by the following tenelements.
(i) At the enterprise level, very little can be expected from competition throughfiscal and financial incentives to firms that are already established. Thelarger, more efficient firms have undertaken their investments based moreon their headquarters’ strategy than on a country’s incentives. The smaller,less efficient firms will not become more competitive through the incentivesthey receive. The prevailing growth pattern in the area, which is stronglybased on EPZs and closely integrated to international production chains,renders the traditional fiscal and financial incentives even less significant.
(ii) Legal frameworks for foreign investment tend to converge quite rapidlytowards a general pattern of national treatment, while countries try to dotheir best to attract foreign investors, preferably for export-related activities.Virtually all countries try to access the international system of guaranteesfor investment. The only area other than tax regimes where substantialdifferences remain is the specification of which economic sectors are opento foreign investors. The recent debate on the privatization of the Mexicanpetrochemical industry shows that it will be difficult to eliminate suchdifferences. Other than deterring investors who are directly interested inthose sectors, the general impact will probably be minor.
(iii) Countries make important efforts to present a good image to investors.They use a wide array of variables to highlight that, despite being low-wagecountries, their main advantages lie elsewhere: geographical location,efficient human resources, a stable democratic political system and so on.Although not always accurate, images do matter. Countries havelearned that investors care more about a dynamic competitive advantagethan about a static comparative advantage. Future policy competition,even when actually based on negative-sum games or bidding wars, willprobably be presented as a positive-sum game. Rules-based and factor-creation competition will be integral to country images and even countrybehavior.
(iv) Homogenization of incentives is another trend in policy competition forinvestment in export platforms, particularly export processing or free zones.Countries compete through incentives and rules that have to be matched byother competitors, as is shown by the Dominican Republic’s need to enact anon-interventionist foreign investment law in 1995. Moreover, competitionput pressure on countries to transform temporary incentives (e.g., limited-time authorizations to operate under the temporary admission or free-zoneregimes) into permanent ones, whenever a competitor allows for automaticauthorization renewals. These cases show how easily incentives-based and

62
rules-based competition can become a bidding war when no internationalstandards set a lower limit to those rules.
(v) A significant type of rules-based competition is the integration into broadertrade areas by means of reciprocal and non-reciprocal free trade agreements.All the countries under consideration are beneficiaries of the Caribbean BasinInitiative II, the Generalized System of Preferences, and one regionalcommon market (either CARICOM or the Central American CommonMarket). Jamaica and the Dominican Republic are also beneficiaries of theLomé IV Convention, while Costa Rica has a bilateral free trade agreementwith Mexico. Although all three consider their membership in theseagreements highly attractive for foreign investors, their main concern is thatNAFTA may make the market-access benefits provided by CBI and GSP lesssignificant. This would substantially affect the economic activity of theirfree trade zones. All countries are extremely interested in joining NAFTA orobtaining NAFTA-parity.49
(vi) Competition based on general competitiveness policies differs widely, from amodernized interventionist industrial policy in Jamaica to a formal laissez-faire in the Dominican Republic, to a mild, active policy approach in CostaRica. In practice, however, differences are not so wide. Policyimplementation is very poor in those countries, as elsewhere in LatinAmerican and the Caribbean (Peres, 1996). The interventionist Jamaicanpolicy may therefore lead to results not so different than those of laissez-faire marred with bureaucratic inefficiencies in the Dominican Republic. Lowimplementation limits the effects of competitiveness policies in thecompetition for FDI.
(vii) The three countries under consideration occupy the middle ground in theCaribbean Basin regarding attractiveness to foreign investors. They achieveconsistent results in the three main components of the CAI index, althoughthey are surpassed by some of the poorest countries in the region in generalinvestment climate. This may suggest that for policy competition countrieshave the most freedom in developing a pro-business investment climate.Policy competition through deregulation and the elimination of constraintsmay prove easier to tackle in the short and medium terms than developingfactor endowments, infrastructure or a stable macroeconomic and politicalenvironment.
(viii) Policy competition in the Caribbean Basin is intensifying, because of theerosion of tariff preferences implicit in CBI, GSP and Lomé IV. New playersin the area will further increase that competition.
(ix) Although FDI incentives are functional during the early period of EPZdevelopment, they become increasingly less effective. For Costa Rica,Jamaica and the Dominican Republic, FDI incentives were significant duringthe crisis period of severe macroeconomic dislocation which followed theonset of the international debt crisis. As the region began to return tonormality, however, FDI incentives produced increasingly random results.They sometimes caused positive-sum results with significant, beneficialimpacts for the developmental trajectory of the host country, as did thelong-term relationships established with the large, modern subsidiaries of
49 As of early 1998, the interim trade programme for the Caribbean Basin submitted by the
Clinton Administration to the United States Congress had not been enacted.
63
Sara Lee, and they sometimes presented negative-sum results whichactually provoked damage to that trajectory, as did the fly-by-nightsweatshop operation called Coskoa. To improve the probability of betterresults after the initial stage, it is necessary to focus FDI incentives.
(x) Developing countries cannot compete with rich countries in using directfinancial incentives to influence the siting decisions of TNCs. They are not inthe same league. However, developing countries can adopt more pro-activepolicies and can better focus their fiscal and other incentives to get morepredictable results, as the Costa Rican negotiations with Intel demonstrate.To get the maximum benefits from this kind of negotiation, the Governmentmust develop a clear strategy for pursuing its national priorities, in terms ofthe industrialization process, the promotion of specific industrial clusters andthe role of national firms as contractors, subcontractors, licensees,suppliers, strategic partners, etc. This strategy must be functionally linkedto the range of policy instruments at the Government’s disposition. Only inthis fashion can small, open developing countries make the most of theirlimited resources and finite incentives for the promotion national priorities.
Policy competition for foreign investment in the Caribbean Basin has achievedgood results mainly in relation to export processing of garments for the United Statesmarket. Transnational corporations’ strategies proved to be more important forthose results than country strategies per se. Although EPZs account for a significantshare of manufacturing employment and exports in the three countries underconsideration, the long-term implications of such a growth pattern are by no meansclear.
Some authors (e.g., Kaplinski, 1993) argue that this is a case of “immiserizingemployment growth”, in which dependence on EPZs, under the regulations establishedby the United States for guaranteed access to its market, has led to low value-addedproduction with minimal backward linkages to the domestic economy. Policycompetition for foreign investment has been detrimental to these countries because itoperated in an economic environment in which only two enclave sectors (i.e., free zonesand tourism) have been attractive enough for foreign investors.
In contrast, other authors (e.g., Willmore 1993a, 1993b) have argued that mostof the negative outcomes were a result not of the free-zone growth pattern per se, butof the fact that the countries under consideration have followed the wrong policies.Policy mistakes such as interventionism and overreached import substitutionhave prevented stronger backward linkages and higher value added in the free-zoneexports. Nevertheless, capacity building and learning has taken place throughhuman resources and technological spillovers from the free zones to the customsterritory.
We tend to agree with the second position. Positive-sum games, although notpervasive, are present in the region. Technological upgrading in Costa Rica andproductivity growth in the free zones of the Dominican Republic are examples that couldbe generalized. Furthermore, introducing one-third or more of the manufacturing labourforce to the dynamics and discipline of the assembly line cannot be considered a minorfeat. Future incentives-based competition may lead to a policy environment moreconducive to a more efficient articulation of the relation between the free zones and therest of the national economy. However, an international set of enforceable rules isnecessary to prevent incentives-based and rules-based competition from degeneratinginto bidding-wars, fought through the deterioration of labour and environmentalstandards. Finally, targeted factor-creation competition which was so successful in

64
attracting Intel’s investment to Costa Rica demands a much better implementation ofimproved competitiveness policies. The time for this effort is just beginning, after morethan a decade of adjustment and the ideological predominance of laissez-faire cumdiscretionary decision-making.
65
8. BIBLIOGRAPHY
Alonso, E. (1996), Agenda para la modernización industrial en Centroamérica. Informede Costa Rica, San Jose, Costa Rica, United Nations Industrial DevelopmentOrganization (UNIDO) and ECLAC subregional headquarters in Mexico, MexicoCity.
AXIS (1994), Posición relativa de Venezuela como polo de atracción de inversión directaestadounidense frente a Argentina, Colombia, Chile, México, Perú,Centroamérica y el Caribe, Caracas, AXIS Estrategias Empresariales.
Bergsman, J. and N. Pirnia (1996), “Do Incentives Work?”, in FDI News, Volume 1,No. 2, FIAS, Washington, D.C., March.
Caribbean Community Secretariat (1993), “Proposals for a harmonized system ofincentives to industry, tourism and other services and agriculture for CARICOM”,Guyana, unpublished.
CENPRO (Center for the Promotion of Exports and Investments)/PROCOMER (ForeignTrade Corporation)/Zona Franca (Export Free Zone Corporation (1996), Exporters96: Costa Rican Export Directory, San José, Costa Rica.
CNEP (National Council for Private Enterprise) (1995), Agenda empresarial para eldesarrollo integrado, Consejo Nacional de la Empresa Privada, Santo Domingo,10 November.
Costa Rica, MEIC-MICIT (Ministry of Industry and Trade/Ministry of Science andTechnology) (1996), Política de modernización industrial. Un pueblo en marcha.Informe de la gestión 1994-1996, XI Congreso Nacional de Industriales, SanJosé, Costa Rica, June 27th.
Costa Rica, Ministry of Foreign Trade (1996), Costa Rica’s Free Zones. Profit Center ofthe Americas, Export Free Zone Corporation, San Jose, Costa Rica,
ECLAC (Economic Commission of Latin America and the Caribbean) (1995), “Lainversión extranjera en América Latina y el Caribe. Informe 1995” (LC/G.1890),Santiago, Chile.
______ (1994), “Centroamérica y el TLC: efectos inmediatos e implicancias futuras”(LC/MEX/R.494 (Sem.68/3)), Mexico City.
Government of Jamaica (1996), National Industrial Policy: A Strategic Plan for Growthand Development, Kingston, Jamaica.
IRELA/IDB (Institute for European-Latin American Relations/Inter-American DevelopmentBank) (1996), Foreign Direct Investment in Latin America in the 1990, Madrid.
Kaplinski, R. (1993), “Export Processing Zones in the Dominican Republic: TransformingManufactures into Commodities”, World Development, vol. 21, No. 11,pp. 1851-1865.
Labarca, G. and W. Peres (1997), “Políticas de desarrollo productivo en Costa Rica”,Políticas de competitividad industrial. América Latina y el Caribe en los añosnoventa, W. Peres (editor) Mexico City, Siglo XXI Editores.
Mayorga, R. (1996), Foreign Investment Regimes in Countries Within the Hemisphere:Legal Challenges, Document presented to the Seminar Investment Policies and
66
Multilateral Rules of Investment in Latin America, Organization for EconomicCooperation and Development, Inter-American Development Bank, Ministry ofForeign Affairs (Brazil) and Ministry of Trade (Spain), Rio de Janeiro, 16-18 July.
Mortimore, M. and R. Zamora (1996), The International Competitiveness of the CostaRican Clothing Industry, Joint ECLAC/UNCTAD Unit, ECLAC, Santiago, Chile.
Mortimore, M. (1995a), “América Latina frente a la globalización”, Desarrollo productivoseries, No. 23 (LC/G.1867), ECLAC, Santiago, Chile, August.
Mortimore, M. (1995b), “Paths Towards International Competitiveness: a CANalysis”,Desarrollo productivo series, No. 25 (LC/G.1869), ECLAC, Santiago, Chile.
Oman, C. (1996), Policy Competition and Foreign Direct Investment. A BackgroundDocument, OECD Development Center, Paris, February.
Pellerano and Herrera (1996), Doing Business in the Dominican Republic, SantoDomingo, Federation of European Chambers of Commerce of the DominicanRepublic.
______ (1995), Legal Guide to the Free Zones of the Dominican Republic, SantoDomingo. Secretariat of State for Industry and Trade/National Council on ExportFree Zones.
Peres, W. (1996), The Revival of Industrial Competitiveness Policies in Latin Americaand the Caribbean in the 1990s, ECLAC/UNDP regional project RLA/88/039“Policies to promote innovation and competitiveness in the Latin American andCaribbean Business Sector”, Santiago, Chile, Economic Commission for LatinAmerica and the Caribbean (ECLAC).
Porter, M. (1990), The Competitive Advantage of Nations, The Free Press, New York.PROCOMER (Foreign Trade Corporation) (1997), Exporters 97: Costa Rican Export and
Import Directory, San Jose, Costa Rica.Russin, Vecchi and Heredia Bonetti (1996), “Doing Business in the Dominican Republic”,
Information Dossier prepared for the Central Bank of the Dominican Republic,Santo Domingo.
The Economist Publications (1988), Tax-free Exporting Zones, A User’s Manual, SpecialReport No. 1135, London, The Economist Publications Limited.
UNCTAD (United Nations Conference on Trade and Development) (1996), Incentivesand Foreign Direct Investment, Current Studies, series A, No. 30, New York,United Nations publication, Sales No. E.96.II.A.6.
USITC (United States International Trade Commission) (1995a), Caribbean BasinEconomic Recovery Act: Impact on U.S. Industries and Consumers, TenthReport 1994, U.S. International Trade Commission, Washington, D.C.
______ (1995b), Production Sharing: Use of United States Components and Materials inForeign Assembly Operations, 1990-1993, USITC Publication 2886,Washington, D.C., May.
Valdez, H. (1996), El nuevo clima de inversión en República Dominicana, Central Bankof the Dominican Republic, Santo Domingo.
Van Riel, W. (1996), Policies to Strengthen Competitiveness of the Jamaican IndustrialSector, ECLAC/UNDP regional project RLA/88/039 “Policies to promoteinnovation and competitiveness in the Latin American and Caribbean businesssector”, Santiago, Chile, Economic Commission for Latin America and theCaribbean (ECLAC).
Vicens, L. and E. Martínez (1996), The International Competitiveness of the GarmentIndustry in the Dominican Republic, Interregional Project on the Impact ofTransnational Corporations on Industrial Restructuring in Developing Countries,

67
Santiago, Chile, Economic Commission for Latin America and the Caribbean(ECLAC).
Willmore, L. (1993a), Export Processing in Jamaica: Ownership, Linkages and Transferof Technology (WP 93-15), Port of Spain, Trinidad and Tobago, ECLAC,subregional headquarters for the Caribbean, September.
______ (1993b), Export Processing in the Dominican Republic: Ownership, Linkages andTransfer of Technology (WP 93-13), Port of Spain, Trinidad and Tobago, ECLAC,subregional headquarters for the Caribbean, September.
68
Desarrollo Productivo series *
No. Title
16 "Reestructuración y competitividad: bibliografía comentada"(LC/G.1840), Restructuring and competitiveness, November 1994
17 "Síntesis del planteamiento de la CEPAL sobre la equidad ytransformación productiva" (LC/G.1841), Restructuring andcompetitiveness, December 1994
18 "Two studies on transnational corporations in the Brazilianmanufacturing sector: the 1980s and early 1990s" (LC/G.1842),Transnational corporations and foreign investment, December 1994
19 "Tendencias recientes de la inversión extranjera directa en AméricaLatina y el Caribe: elementos de políticas y resultados" (LC/G.1851),Transnational corporations and foreign investment, December 1994
20 "Empresas transnacionales manufactureras en cuatro estilos dereestructuración en América Latina. Los casos de Argentina, Brasil, Chiley México después de la sustitución de importaciones" (LC/G.1857),Transnational corporations and foreign investment, May 1995
21 "Mexico's incorporation into the new industrial order: foreign investmentas a source of international competitiveness" (LC/G.1864),Transnational corporations and foreign investment, May 1995
* Desarrollo productivo is the continuation, under a new name, of the Industrialización ydesarrollo tecnológico (IDT) series, published periodically by the ECLAC Division of Production,Productivity and Management. This new name has been chosen as a more accurate reflection ofthe issues dealt with in this series. The articles will be grouped into at least three categories: i)restructuring and competitiveness; ii) transnational corporations and foreign investment; and iii)agricultural and rural development. These topics broadly reflect the internal organization of theDivision (Joint ECLAC/UNIDO Industrial and Technological Development Unit, JointECLAC/UNCTAD Unit on Transnational Corporations and Agricultural Development Unit), as wellas the networks of public and private entities linked to these Units.
The Division welcomes contributions to this series from all staff members of the ECLACand United Nations systems, and particularly from members of the institutions comprising thenetworks, as well as distinguished specialists from Latin America and the Caribbean outside theregion.
Readers interested in back numbers in this series should request them in writing from theDivision of Production, Productivity and Management, ECLAC, Casilla 179-D, Santiago, Chile.
69
22 "Informe sobre la competitividad internacional de las zonas francas en laRepública Dominicana" (LC/G.1866), Transnational corporations andforeign investment, August 1995
23 "América Latina frente a la globalización" (LC/G.1867), Transnationalcorporations and foreign investment, August 1995
24 "Los flujos de capital extranjero en la economía chilena: renovadoacceso y nuevos usos" (LC/G.1868), Transnational corporations andforeign investment, September 1995
25 "Paths towards international competitiveness: a CANalysis"(LC/G.1869), Transnational corporations and foreign investment, June1995
26 "Transforming sitting ducks into flying geese: the Mexican automobileindustry" (LC/G.1865), Transnational corporations and foreigninvestment, October 1995
27 "Indicadores de competitividad y productividad. Revisión analítica ypropuesta de utilización" (LC/G.1870), Restructuring andcompetitiveness, September 1995
28 "The Taiwanese experience with small and medium-sized enterprises(SMEs). Possible lessons for Latin America and the Caribbean"(LC/G.1872), Restructuring and competitiveness, August 1995
29 “Fortalecimiento de los gremios empresariales en América Latina”(LC/G.1885), Restructuring and competitiveness, October 1995
30 “Historia evolutiva de una planta metalmecánica chilena: relacionesmicro-macro y desarrollo tecnológico” (LC/G.1887). Restructuring andcompetitiveness. July 1997
31 “Desempeño global y comportamiento industrial de América Latina en elperíodo 1970-1993” (LC/G.1910). Restructuring and competitiveness.July 1997
32 “Integración económica e inversión extranjera: la experiencia reciente deArgentina y Brasil” (LC/G.1911). Transnational corporations and foreigninvestment. July 1997
33 “Sistemas de innovación y especialización tecnológica en América Latinay el Caribe” (LC/G.1913). Restructuring and competitiveness. March1996
70
34 “Industrial policy and competitiveness in open economies” (LC/G.1928).Restructuring and competitiveness, November 1997
35 “Reestructuración y competitividad: segunda bibliografía comentada.Publicaciones de carácter general y de la región de América Latina y elCaribe”, Volumen I (LC/G.1933) y “América Latina y el Caribe:publicaciones por países”, Volumen II (LC/G.1933/Add.1). Restructuringand competitiveness, October 1996
36 “Encadenamientos, articulaciones y procesos de desarrollo industrial”(LC/G.1934). Restructuring and competitiveness, November 1996
37 “Las economías asiáticas emergentes: treinta años de dinamismoexportador” (LC/G.1935). Restructuring and competitiveness, February1997
38 “Revisión de escenarios agrícolas y comerciales mundiales hacia el2020” (LC/G.1940). Agricultural and rural development, October 1996
39 “La posición de países pequeños en el mercado de importaciones de losEstados Unidos: efectos del TLCAN y la devaluación mexicana”(LC/G.1948). Restructuring and competitiveness, December 1997
40 “Empresas transnacionales y competitividad internacional: un CANálisisde las experiencias de Asia en desarrollo y América Latina” (LC/G.1957),Transnational corporations and foreign investment, July 1997
41 “Quality management and competitiveness: the diffusion of the ISO9000 standards in Latin America and recommendations for governmentstrategies” (LC/G.1959). Restructuring and competitiveness, December1997
42 “Quality management ISO 9000 and government programmes”(LC/G.1960). Restructuring and competitiveness (forthcoming)
43 “El empleo agrícola en América Latina y el Caribe: pasado reciente yperspectivas” (LC/G.1961). Agricultural and rural development,September 1997
44 “Restructuring in manufacturing: case studies in Chile, Mexico andVenezuela” (LC/G.1971). Restructuring and competitiveness(forthcoming)
71
45 “La competitividad internacional de la industria de prendas de vestir dela República Dominicana” (LC/G.1973), Transnational corporations andforeign investment, February 1998
46 “La competitividad internacional de la industria de prendas de vestir deCosta Rica” (LC/G.1979), Transnational corporations and foreigninvestment (forthcoming)
47 “Comercialización de los derechos de agua” (LC/G.1989), Agriculturaland rural development (forthcoming)
48 “Patrones tecnológicos en la hortofruticultura chilena” (LC/G.1990),Agricultural and rural development, January 1998
49 “Policy competition for foreign direct investment in the Caribbean basin:Costa Rica, Jamaica and the Dominican Republic” (LC/G.1991),Restructuring and competitiveness, May 1998