policy and development of agricultural land resource mapping in indonesia: experiences, achievements...
TRANSCRIPT

www.litbang.deptan.go.id
POLICY AND DEVELOPMENT OF AGRICULTURAL POLICY AND DEVELOPMENT OF AGRICULTURAL LAND RESOURCE MAPPING IN INDONESIA: LAND RESOURCE MAPPING IN INDONESIA: EXPERIENCES, ACHIEVEMENTS AND IMPACTSEXPERIENCES, ACHIEVEMENTS AND IMPACTS
INDONESIAN CENTER FOR AGRICULTURAL LAND AND RESOURCESRESEARCH ANINDONESIAN CENTER FOR AGRICULTURAL LAND AND RESOURCESRESEARCH AND DEVELOPMENT D DEVELOPMENT AGENCY FOR AGRICULTURAL RESEARCH AND DEVELOPMENTAGENCY FOR AGRICULTURAL RESEARCH AND DEVELOPMENT
Muhrizal Sarwani, Markus Anda and Rizatus Shofiyati Muhrizal Sarwani, Markus Anda and Rizatus Shofiyati

Content:Content:Content:
Goals of Agricultural Development Goals of Agricultural Development Programs of land resource inventoryPrograms of land resource inventorySoil mapping approachSoil mapping approachSoil inventory achievementSoil inventory achievementThematic Derivative maps from soil mappingThematic Derivative maps from soil mappingImpact of soil maps on national developmentImpact of soil maps on national developmentConclusionsConclusions

Employs around 42% of the labor force (of 235 million)Employs around 42% of the labor force (of 235 million)
Indonesian agriculture contribute to around 14,4% of GDP, dominated by food crops
Indonesian agriculture contribute to around 14,4% of GDP, dominated by food crops
Palm Oil is produced in Outer Island (Sumatra, Kalimantan)Palm Oil is produced in Outer Island (Sumatra, Kalimantan)
Indonesian Agriculture at a GlanceIndonesian Agriculture at a Glance
60% of major food crops (rice, maize, and soybean) being
produced in Java
60% of major food crops (rice, maize, and soybean) being
produced in Java

Increasing food production and sustainable food self sufficiencyFood security and nutritionIncreasing competitiveness, added value and exportIncrease farmer incomeOptimation of soil, climate change adaptation (& mitigation) and soil conservation
GOALS OFGOALS OF AGRICULTURAGRICULTURALAL DEVELOPMENT IN DEVELOPMENT IN INDONESIAINDONESIA
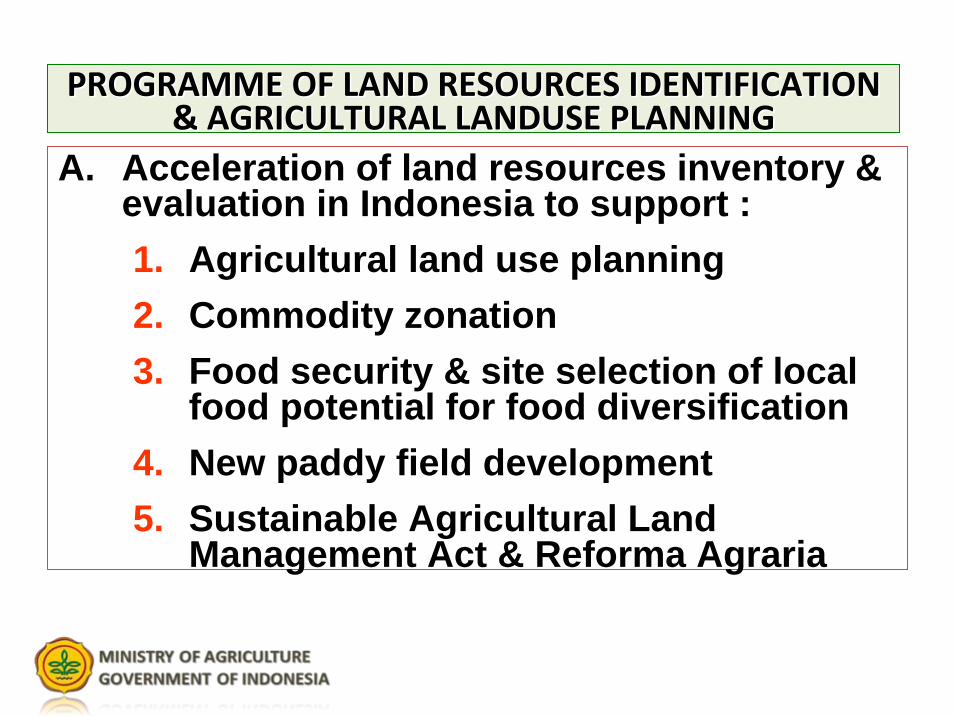
A. Acceleration of land resources inventory & evaluation in Indonesia to support : 1. Agricultural land use planning2. Commodity zonation3. Food security & site selection of local
food potential for food diversification 4. New paddy field development 5. Sustainable Agricultural Land
Management Act & Reforma Agraria
PROGRAMPROGRAMME OFME OF LAND RESOURCES LAND RESOURCES IDENTIFIIDENTIFICATIONCATION&& AGRICULTURAL LANDUSE PLANNINGAGRICULTURAL LANDUSE PLANNING
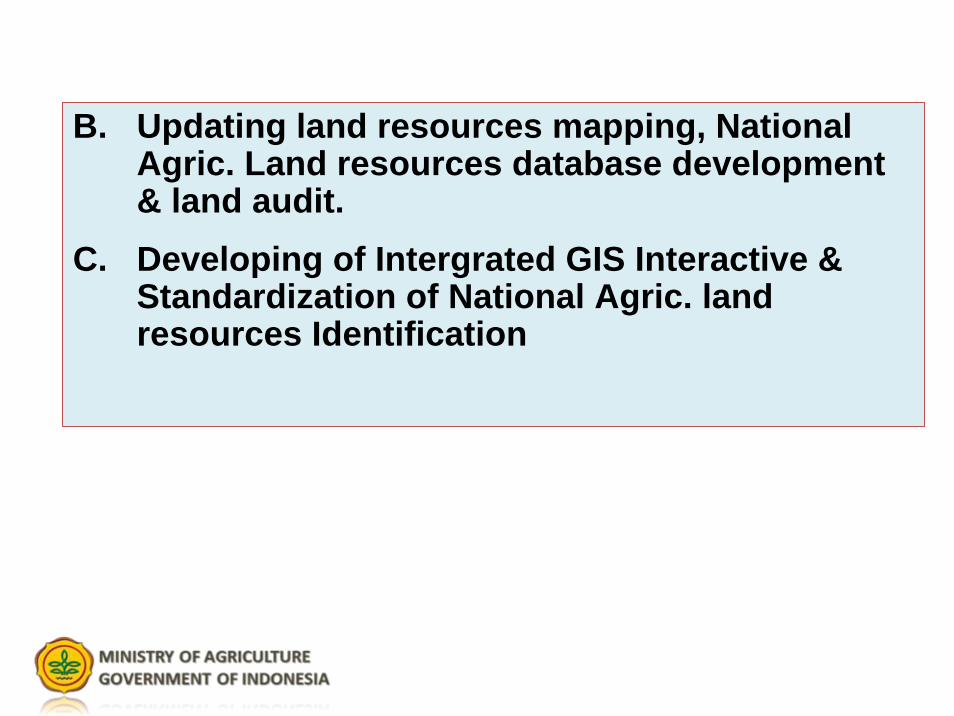
B. Updating land resources mapping, National Agric. Land resources database development & land audit.
C. Developing of Intergrated GIS Interactive &Standardization of National Agric. land resources Identification

Some views of Indonesian landscapesSome views of Indonesian landscapesMerapiMerapi PangrangoPangrango
Swampy area, Swampy area, kalbarkalbar

U
S
Mt. TangkubanPerahu
Mt. Burangrang
Landsat imagery
AerialAerialphotographphotograph
Mt. Merapi - 2003
SPOT imagery
RADAR
Application Remote sensing technology and Geographic information system on soil mapping in Indonesia

20052005--20082008
Landsat ETM 7Landsat ETM 7
IntensiIntensivevelyly usedused::ReconnaisanceReconnaisancepoor farmerpoor farmerAEZAEZPrimary farmPrimary farm
Soil & Landuse Soil & Landuse mappingmapping
2008 2008 -- presentpresent
Landsat ETM 7Landsat ETM 7
IntensiIntensivevelyly usedused::ReconnaisanceReconnaisance
Soil & Landuse Soil & Landuse mappingmapping
Other land resources mappingOther land resources mapping
Experiment Experiment ::ReconnaisanceReconnaisance
JERS, ASTERJERS, ASTERALOS AVNIRALOS AVNIR--22
Application Remote sensing technology and Geographic information system on soil mapping in Indonesia

Present achievement for the extent of soil Present achievement for the extent of soil mapping in Indonesiamapping in Indonesia
Main ExtentIsland
x1000 ha x1000 ha % x1000 ha % x1000 ha %
1.Sumatera 47,241 47,241 100.0 2,227 4.7 4,056 8.62.Jawa, Madura 13,210 13,210 100.0 2,715 20.6 4,401 33.33.Nusa Tenggara 7,209 7,209 100.0 12 0.2 1,172 16.3 and Bali4.Kalimantan 52,890 52,890 100.0 891 1.7 9,072 17.65.Sulawesi 18,743 18,743 100.0 1,003 5.4 2,100 11.26.Maluku 7,817 7,817 100.0 55 0.7 499 6.47.Papua 41,105 4,016 9.8 684 1.7 2,176 5.3TotalIndonesia 188,215 151,126 80.3 7,587 4.0 23,476 12.5
Source: Subagjo (1995), Suwarto et (2000), updating to 2011 (Hikmattulah, 2011)
1:250.000'
All areas have been mapped at exploratory scale 1:1 million (Puslitbangnak, 2000)
1:100.000' 1:10.000 +1:50.000'

Indonesian Soil Exploratory Map (1:1.000.000) Indonesian Soil Exploratory Map (1:1.000.000)
EXPLORATORY SOIL MAP OF INDONESIAKalimantanKalimantan
JawaJawa
SulawesiSulawesi
PapuaPapua
SumateraSumatera
NTTNTT
MalukuMaluku
BaliBali
LegendLegend

Forms of Indonesian Soil Map availability (1:50.000 – 250.000)
Soil map availability at 1:50.000 to 1:250.000
No dataManualDigital 1:250.000Digital 1:100.000Digital 1:50.000
Legend

Availability of Indonesian Digital Soil Mapscale 1:250.000

Type of Mapping Map scale %
1. Agricultural land use planning 1:1.000.000 -500.000
100
2. Commodity zoning (Interactive) 1 : 250.000 -50.000
75
3. Specific Land Suitability 1 : 100.000 -50.000
3-35
4. Nutrient Status of paddy field especially P and K status
1 : 250.000 -50.000
85
5. Critical & degradated land etc. 1:250.000 -50.000 5-25AEZ Map (integration of soil-climate-socio economy) Commodity development recommendation, SUT/US, Agrobusiness& Technology
1:250.000 -50.000 (25-100%)
Derivative Maps of Soil MapsDerivative Maps of Soil MapsDerivative Maps of Soil Maps

POTASIUM MAP AT DISTRIC LEVELPOTASIUM MAP AT DISTRIC LEVEL

PEAT SOIL MAPPING IN KALIMANTANPEAT SOIL MAPPING IN KALIMANTAN

DETAILED SPATIAL PEAT CHARACTERISTICS
Decomposition
Soil depth
Peat thickness
Carbon stocks

Soil Data Base
• Observation data:– program SHDE4 (Soil and Horizon data base using DataEase)
• Data lab– program SSA3 (Soil Sample Analysis data base)
• Definition representative pedon– program SHDE4
• data Mapping Unit– program SHDE4

Some Profiles of Indonesian soils
HistosolHistosolEpiaqueptEpiaquept
UltisolUltisol DystrudeptDystrudeptOxisol
Buried soil
Ash deposit
Andisol Andisol
Alfisol

• Provide a basic information for policy makers in designing spatial planning (national, provinces,regencies)
• Guidance for government in selecting the area fortransmigration
• Guidance for government in allocating fertilizer subsidies
• Source of soil information for students, researchers,universities and other stakeholders
• Provide soil information and associated technologiesfor state and private companies
Impact of soil information on national development
Impact of soil information on national Impact of soil information on national developmentdevelopment
2/9/2012 Las‐BBSDLP 21
Annual crops in Wetlands
Swamp Non swamp
Total
Dry Land for
annual crops
Dry Land for
Perennial crops
TotalMajor Island
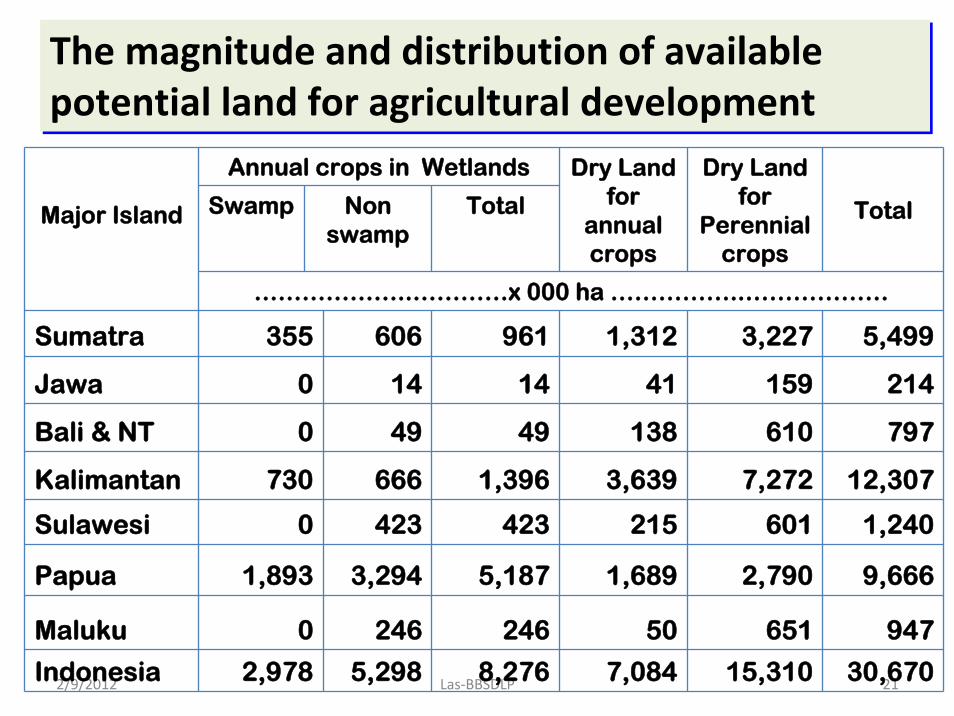
………………..…………x 000 ha ……………..………………
Sumatra 355 606 961 1,312 3,227 5,499
Jawa 0 14 14 41 159 214
Bali & NT 0 49 49 138 610 797
Kalimantan 730 666 1,396 3,639 7,272 12,307
Sulawesi 0 423 423 215 601 1,240
Papua 1,893 3,294 5,187 1,689 2,790 9,666
Maluku 0 246 246 50 651 947
Indonesia 2,978 5,298 8,276 7,084 15,310 30,670
The magnitude and distribution of available potential land for agricultural development The magnitude and distribution of available potential land for agricultural development

PROSPECTIVE OF GSP/GSM
Transfer of Transfer of knowledge, knowledge, technologtechnologyy and and methomethododology (Mapping, GIS, RS)logy (Mapping, GIS, RS)
National maps on P, K and C fertility statusNational maps on P, K and C fertility status
National maps on peat soilsNational maps on peat soils
SharShare e data and fundingdata and funding
Capacity buildingCapacity buildingHHumanuman resourceresourceResearch facilitiesResearch facilities

ConclusionsAll Indonesian areas have been mapped at 1:1.000.000 scale and almost all areas for 1;250.000 . The extent of soil mapping areas decreased with increasing detail in map scales (i.e., from reconnaissance to detail maps) in IndonesiaMost of the maps are available in a digital formAerial photograph and satellite images (e.g. landsat TM, ALOS, RADAR) have been a powerful tool and source of information to be used for mapping of soil information and derivatives' maps Soil mapping in Indonesia have played a key role in providing soil information to policy makers (national, provinces, regencies), private and state companies, research institutions and Universities.GSP/GSM activities are an opportunity to share knowledge, expertise, methodology development and funding among world soil scientists, in order to provide soil information for wise use our natural resources

THANK YOUTHANK YOU
For More information:
Visit Us at:
Http://www.deptan.go.id
Http://www.litbang,deptan.go.id
For More information:
Visit Us at:
Http://www.deptan.go.id
Http://www.litbang,deptan.go.id