policy analysis for warranty, maintenance, and upgrade of software systems
TRANSCRIPT

JOURNAL OF SOFTWARE MAINTENANCE AND EVOLUTION: RESEARCH AND PRACTICEJ. Softw. Maint. Evol.: Res. Pract. 2001; 13:469–493 (DOI: 10.1002/smr.242)
Research
Policy analysis for warranty,maintenance, and upgrade ofsoftware systems‡
Izzet Sahin and Fatemeh ‘Mariam’ Zahedi∗,†
University of Wisconsin Milwaukee, School of Business Administration, PO Box 742, Milwaukee,WI 53201, U.S.A.
SUMMARY
Maintenance of large software systems is one of the least-structured problems in information systems.In this paper, we present a framework to analyze warranty, maintenance, and upgrade decisions forsoftware packages under different market conditions. We discuss the impact of various factors, such asquality, market volatility, and technological obsolescence, on the software supplier’s policies and economicreturn. We identify a class of optimal (or near optimal) policies that are surprisingly robust and easy toimplement, and report on the effectiveness of these policies under different market conditions. Copyright 2001 John Wiley & Sons, Ltd.
KEY WORDS: software change policies; index of customer satisfaction; market factors; technologicalobsolescence
1. INTRODUCTION
Post-installation changes account for the largest cost component in the lifecycle of most in-housesoftware systems [1]. In a set of 487 data-processing organizations surveyed, over half of the staff timewas spent on maintenance [2]. Another study reported that maintenance accounted for 67% of softwarecosts [3]. Port [4] and Huff [5] estimate that maintenance absorbs 60–70% of management informationsystems (MIS) operating budgets and observe that this percentage is on the rise. This was confirmedin a longitudinal study by Nosek and Palvia [6], which concluded that maintenance requirementshave increased as compared to what Lientz and Swanson reported a decade ago. Moreover, a surveyof Fortune 1000 companies has revealed that software maintenance constitutes over 75% of theinformation systems budgets of these companies [7]. Annual software maintenance costs in the UnitedStates are estimated at more than $70 billion [8]. The case is even more dramatic for large softwarepackages.
∗Correspondence to: Fatemeh ‘Mariam’ Zahedi, University of Wisconsin Milwaukee, School of Business Administration,PO Box 742, Milwaukee, WI 53201, U.S.A.†E-mail: [email protected]‡In the memory of a dedicated and accomplished researcher, Professor Izzet Sahin, who will be greatly missed by his colleagues.
Copyright 2001 John Wiley & Sons, Ltd.

470 I. SAHIN AND F. M. ZAHEDI
While software packages and systems are growing in number, size, and complexity, leading tomounting maintenance costs, no formal framework is available for analyzing policy issues in this area.The research literature includes extensive work on the reliability of software systems at the test stage,but little attention has been paid to the development of a theory and methodology for making post-saleor post-installation changes of software packages. Schneidewind [9] laments the paucity of researchon software maintenance, a sentiment echoed by Kemerer [10] in his survey of empirical research onthe topic as well as by Kemerer and Slaughter [11]. With the exception of the works by Banker and hiscolleagues [1,11–13] and a normative model by Chan et al. [14], for notable work in this area we needto go back to Martin and McClure [15], Schneidewind [9], and the special issue of IEEE Transactionson Software Engineering on the topic in 1987, and Swanson and Beath [16,17]. Schneidewind [9]discussed the issues that had led to the maintenance ‘problem’ back in the 1980s, including lack ofplanning for maintenance, a problem that is still with us today. Swanson and Beath [16,17], in theirfield survey of 12 organizations, found a need for systematic monitoring of software systems.
With the phenomenal expansion of the software market, especially in mass-marketed applicationsoftware packages, substantial resources are required to monitor products and manage their change.The academic community has not shown much interest in issues that are critical to the post-salemanagement of software packages. On the other hand, the internal research and development resourcesof software companies are focused almost exclusively on software development, with little attentionpaid to post-sale, post-installation policies.
Systems evolve through time because of different maintenance events, and changes are made inresponse to such events. Software evolution is defined as ‘the dynamic behavior of software systems asthey are maintained and enhanced over their life times’ [11, p. 493, 18]. In the software-maintenanceliterature, recent research on software evolution is even more scarce, with the exception of a majorstudy by Kemerer and Slaughter [11] on the software evolution of two large systems over 20 years.
In our work, we report on the results of modeling the dynamic behavior of post-sale changes andpolicy decisions for making such changes. In doing so, we have discovered policy patterns that seem tohave general applicability for almost all maintenance decisions. Our results could guide policy analysisin making maintenance decisions.
We use the term policy to mean a vendor’s course of action, which is selected among alternativesand in the light of given conditions, to guide present and future decisions. In using the term ‘softwaresystems’, we focus on software packages sold and installed in the mass market, although our frameworkdoes not make any assumption that would preclude customized systems. We take the perspective of thesoftware-system developer, as the decision-making entity responsible for maintaining and upgradingthe system. Our findings should be of particular interest to software vendors, who develop and marketlarge application software packages.
Our framework is based on the assumption that the main business strategy of the software developeris long-term profit maximization, and account for a number of important factors, including systemquality, technological obsolescence, market volatility, and the revenue structure of the system developeras it relates to the type of market the system is serving. We address critical problems in the managementof change in software systems. How frequently should a software developer maintain or upgrade thesoftware? Should the software developer immediately respond to every opportunity to change thesystem, or should certain changes be postponed until a more opportune time? How should the softwaredeveloper’s maintenance and upgrade policies respond to technological obsolescence? How could the
Copyright 2001 John Wiley & Sons, Ltd. J. Softw. Maint. Evol.: Res. Pract. 2001; 13:469–493

WARRANTY, MAINTENANCE, AND UPGRADE OF SOFTWARE SYSTEMS 471
loss induced by technological obsolescence be measured? What are the impacts of revenue structure,market volatility and system quality on software-change decisions?
2. SOFTWARE CHANGES
To study the post-sale actions on a software package, we divide them into three categories: warranty,maintenance, and upgrade. Before formally defining these categories, we observe that the need todistinguish them from each other has been a common thread in attempts to define ‘maintenance’.
ANSI/IEEE [19] defines maintenance as the ‘modification of a software product after deliveryto correct faults, to improve performance or other attributes, or to adapt the product to a changedenvironment’. This definition includes all categories of change in software.
Swanson [20] and Arthur [21] define three maintenance categories: corrective, adaptive,and perfective. Reutter [22], on the other hand, identifies seven categories of maintenance:emergency repairs, corrective coding, upgrades, changes in conditions, growth, enhancement, andsupport. Kemerer and Slaughter [11] use maintenance categories: corrective, enhancement, adaptive(perfective), and new program, which they subsequently divide into 30 subcategories. Martin andMcClure [15] discuss maintenance categories as corrective, adaptive, and enhancement. We definewarranty, maintenance, and upgrade actions as follows.
Warranty. We define warranty action as changes the producer makes in a system in order to make surethat it works as claimed. This definition includes Swanson’s, Martin–McClure’s, and Kemerer–Slaughter’s ‘corrective changes’, Reutter’s ‘emergency coding’ and ‘corrective coding’, as wellas the first part of the ANSI/IEEE definition ‘to correct faults’.
Maintenance. We define maintenance action as changes that improve and enhance the existingfunctions of a software system. (It should be noted that this definition is much narrower thanthe traditional, all-inclusive definition of maintenance.) Maintenance improves the functionalitythat already exists in and is claimed for a system. A maintenance action may also remove faults.In other words, a maintenance action may include a warranty action, but not the converse.
Upgrade. We define upgrade action as adding new functions or features to a software system, inaddition to any maintenance and fault removal. An upgrade action involves new programs andconstitutes an overhaul of the system.
Throughout the paper, we use the terms ‘maintenance’ or ‘warranty opportunity’ synonymouslywith ‘need or requirement to maintain’ or ‘warrant’, prompted by the developer’s perception ofcustomer demands, competitors’ actions, or general market conditions. We give the term ‘upgradeopportunity’ a similar but more specific connotation, in that, in addition to the need or requirement, italso encompasses the supplier’s ability to upgrade.
3. MARKET CONDITIONS
Our framework for analyzing warranty, maintenance, and upgrade policies reflects a number ofperspectives in the market.
Copyright 2001 John Wiley & Sons, Ltd. J. Softw. Maint. Evol.: Res. Pract. 2001; 13:469–493

472 I. SAHIN AND F. M. ZAHEDI
3.1. The system
By software systems, we mean software packages developed for the mass market. Since a softwaredeveloper needs to maintain its market share and customer base, a software package should becharacterized by the users’ satisfaction with its quality, quantified by the index of customer satisfaction.In this view, quality represents the system’s functionality as well as the quality of services it delivers.The theory of index numbers is already developed in economics [23] and has been applied toinformation systems [24]. User satisfaction has long been recognized as the ultimate measure forinformation systems [25–37]. Customer satisfaction as one of the most significant measures forproducts and services has also been recognized in economics [38–40], and its index is computed atthe national level in the U.S. and other countries.
3.2. The system quality
The factors affecting the quality of the system may be viewed as internal factors, which are underthe control of the system supplier, and external factors, over which the supplier has no control.Factors that are predominantly internal to the quality of a system are related to its design and designimplementation. A poorly designed system leads to more frequent opportunities for maintenance.The probability of a maintenance opportunity arising in a time period captures the design quality ofthe system. On the other hand, a faulty design implementation, including but not limited to flawedcoding, leads to more frequent post-sale errors and hence more frequent warranty opportunities. Wequantify the implementation quality by the probability of a warranty opportunity arising in a given timeperiod. This probability as well as the probability of a maintenance opportunity can be estimated eitherobjectively, by observing the occurrences of warranty or maintenance opportunities, or subjectively,from expert judgment. The records of customer complaints and calls could be used to make a judgmenton the frequency of each opportunity.
3.3. Market volatility
A volatile market is normally characterized by a relatively high degree of competition, product infancy,a large number of competitors, and the lack of dominance by one or more competitors [41]. In such amarket, competitors fight to establish dominance by introducing new functionalities in their systems.Due to the relative youth of the market for the product, the cost of adopting a new system is not veryhigh—no inertia has yet been created by the lengthy use of a given system.
Additionally, in any given market, the ability of the supplier to incorporate new technology intoits system upgrade depends on its resources and competencies [42,43]. Each supplier has certaincompetencies in responding to technological advances. Not all suppliers have the resources to upgradetheir systems in response to a technological change [41]. Therefore, the volatility of the market,together with the supplier company’s ability to respond to it, determine the probability of an upgradeopportunity. We assume, in line with Porter [44] and Klepper [41], that this probability is fixed anddistinct for the supplier during the period of analysis. This parameter could be estimated in a similarway as the probabilities of warranty and maintenance opportunities.
Copyright 2001 John Wiley & Sons, Ltd. J. Softw. Maint. Evol.: Res. Pract. 2001; 13:469–493

WARRANTY, MAINTENANCE, AND UPGRADE OF SOFTWARE SYSTEMS 473
Table I. Reported maintenance costs.
Cost variable Source Mean
Person-hours (69 companies) Lientz and Swanson [2] 2768/system/yearPerson-hours (51 companies) Nosek and Palvia [6] 15 530/system/yearProject-hours (65 projects, one company) Banker et al. [12] 937/projectProject-hours (129 projects, one company) Banker and Slaughter [13] 607/project
3.4. The supplier
The supplier is responsible for the warranty, maintenance, and upgrade of the system. The decisionmaker in this analysis is the supplier, who needs to establish policies regarding these actions. We usesupplier and developer interchangeably.
One major attribute of a supplier company is its cost structure—how much each warranty,maintenance, or upgrade action would cost the company. We use the costs of warranty, maintenance,and upgrade actions as the averages over various possible costs in each category for the system.(Whether these are unit costs or total costs would depend on the definition of the revenue functiondiscussed below.) The supplier’s cost accounts could provide estimates for these parameters.
Table I shows the maintenance costs (in person-hours) reported in the literature. In Banker andSlaughter’s study [13], the average elapsed time for a maintenance project was about three months,which may be an appropriate decision interval for the developer. Table I reports cross-sectional datafrom developers of varying sizes and different projects. As documented by Wiener [45], systems varyin complexity, and, consequently, in the extent of the work required for fixing their faults and enhancingtheir functions.
Kemerer and Slaughter [11] report the average cost per change for the two systems in dollars, $2109and $208. They were able to compute the average cost per type of action as well.
In our case, cost estimates represent data for the same system over time or for systems of similar typeand quality owned by the same developer and categorized into warranty, maintenance, and upgradecosts. This should yield more stable and accurate cost estimates. The estimation of cost parametersshould not be a difficult task for the developer, because such cost data are available and could becollected (as documented above). Our framework can also accommodate trends in average costs. Forexample, we can consider the case where the average cost of warranty or maintenance changes in timeat a given predicted rate. This extension of the model is discussed in detail in [46].
3.5. The revenue structure
It has been observed that the sales of a software product increase with its age [47]. This pattern hasbeen related to theories of diffusion of innovation [48,49]. In this view, when a product innovationtakes place, new customers buy the product as a specialty item. Then the new innovation becomes theindustry standard, existing users of the old version switch to the new product, and the entire market
Copyright 2001 John Wiley & Sons, Ltd. J. Softw. Maint. Evol.: Res. Pract. 2001; 13:469–493

474 I. SAHIN AND F. M. ZAHEDI
expands. Prusa and Schmitz [47] observe that innovation diffusion is mostly due to learning. With alarger population using the product, the learning takes place faster and sales increase over time [50].
Another theory for explaining the increase in sales of a software system considers the impactof network externalities [51]. Prusa and Schmitz [47] note that if the benefit of a software productincreases as the number of its users increases, then there exist network externalities, in that, everythingbeing equal, sales increase with the age of the system.
Thus, the market expands with product innovation, learning, and network externalities. However,this analysis is at the industry level, and does not address actions taken by suppliers in accomplishingthis process. We argue that it is the warranty, maintenance, and upgrade actions of the supplier thatkeep the system viable in the market, introduce innovation in the software system, and stop existingcustomers from switching to competing systems. Through warranty and maintenance actions, thesoftware supplier attempts to preserve its market share, whereas by the upgrade action, the suppliertries to add new customers and increase its market share, as observed by Nault and Vandenbosch [52].
The supplier’s ability to maintain or enhance its market position depends on how its customersrespond to its warranty, maintenance, and upgrade actions. We quantify the preference (or utility) ofcustomers by the index of customer satisfaction, which changes over time in response to the supplier’sactions and changing market conditions. For a given system, the revenue function of the supplier in agiven period depends on its index of customer satisfaction as well as on revenue-generating factorsexternal to the system. External factors include, but are not limited to, expanding or contractingmarkets, business cycles, economic trends, and the marketing strategy and name recognition of thesupplier, which may not depend on the satisfaction index.
The relation between customer satisfaction and profitability has been the foundation of the AmericanCustomer Satisfaction Index (ACSI), which has been developed to ‘quantify quality and customersatisfaction and relate them to firms’ financial performance’ [53]. This index is envisioned as the lead-ing indicator of an organization’s long-term financial status and profitability. In information systems,Brynjolfsson and Kemerer [54] estimated the spreadsheet software revenue as a function of productfeature attributes (as well as a number of other variables that represent network externalities.) They usedproduct feature variables to represent software quality. These variables could be interpreted as the man-ifest variables representing the market perception of quality and hence satisfaction with the software.
The revenue function may have any functional form with respect to the index of customer satisfactionand other factors. We only make the plausible assumption that the supplier’s revenue in any periodis increasing with the customer satisfaction index. This assumption is supported by the estimatedspreadsheet revenue functions [54].
While the parameters of the revenue function depend on the supplier’s operations, we argue that thefunctional form of the revenue function depends on the type of market the software package serves.We report and analyze policies for markets with revenue functions that have constant, increasing, anddecreasing rates of return with respect to an increase in the customer-satisfaction index. Brynjolfssonand Kemerer [54] report on the existence of both linear and nonlinear revenue functions in thespreadsheet market.
3.6. Customer expectations
As a software package is used and its shortcomings are discovered, the performance of its existingfunctions should be enhanced, and new functionalities should be added to its configuration. These
Copyright 2001 John Wiley & Sons, Ltd. J. Softw. Maint. Evol.: Res. Pract. 2001; 13:469–493

WARRANTY, MAINTENANCE, AND UPGRADE OF SOFTWARE SYSTEMS 475
opportunities arise at random, as observed by Kemerer and Slaughter [11], and the system customersexpect the supplier to take action to respond to these opportunities. What happens if the supplier fails toact? The level of customer satisfaction with the system decreases. The supplier’s lack of action causesa decline in the index of customer satisfaction. We model the decline in the satisfaction index due to aforegone warranty, maintenance, and upgrade opportunity by three decay parameters: warranty decay,maintenance decay, and upgrade decay.
If the supplier opts to take action in response to a warranty opportunity (fault correction) or amaintenance opportunity (enhancing existing functions of the system), then the index of customersatisfaction stays the same. Since the customer assumes that the system must work fault free andperform its existing functions well, fixing its faults or improving its existing functions cannot increasecustomer satisfaction above that of a fault-free or well-performing system. If this were possible, then alla developer would need to do would be to bring a faulty product to the market, and keep on respondingto faults discovered by customers, thereby increasing the index of customer satisfaction. Clearly, thisis not a viable long-term strategy. Therefore, we assume that an action by the supplier to warrant ormaintain the system keeps the customers at their present level of satisfaction. The impact of an effectiveresponse to a warranty or maintenance opportunity is captured through the assumption that customersatisfaction will be unaffected, if the required action is taken in the same period.
When the supplier upgrades the system, new functions are added to the system and known faultsare removed; new technology may also be introduced. With upgrades, the supplier attempts to increasecustomer satisfaction to its highest possible level, increase its market share, and trigger the combinedeffects of technology diffusion, learning, and network externalities. Therefore, we assume that whenthe supplier takes an upgrade action, the system’s index of customer satisfaction rises to its highestpossible level, however this is defined for the system.
Low decay values represent markets in which customers have low sensitivity to suppliers’ lackof action to warrant, maintain, and upgrade, when such opportunities arise. This behavior may beexpected in mature markets, in which customers have a great deal of experience and a vested interestin the system. High decay values represent markets in which customers expect immediate action bythe supplier in all action categories. This type of expectation may be found in markets for systemsthat are in early stages of the product lifecycle (product infancy) or where changes themselves aremission-critical for the system customers.
There are a number of possibilities for estimating the decay parameters. One possible approach isa direct customer survey. Assume there is a fault in a software system that makes the user unable toperform a certain function. One can survey the customers to evaluate the system with and withoutthis fault removed. The difference between the two satisfaction indices would be an estimate of thewarranty decay. Obviously, all faults do not have the same value for all customers. We need to estimatethe average of warranty decay values for all customers of the system.
Similarly, for the maintenance decay, if the software system needs maintenance (as requested bysome customers), the supplier can survey the customers about the intended maintenance action. Thedifference between the system’s customer-satisfaction indices with and without maintenance would bean estimate of the maintenance decay. The upgrade decay could be estimated in a similar fashion.
Another method of directly estimating warranty, maintenance, or upgrade decays is to computethe differences between customer-satisfaction indices shortly before and shortly after a warranty,maintenance, or an upgrade action. Collecting data shortly before and after the action provides anestimate of the decay, without the influence of technological obsolescence.
Copyright 2001 John Wiley & Sons, Ltd. J. Softw. Maint. Evol.: Res. Pract. 2001; 13:469–493

476 I. SAHIN AND F. M. ZAHEDI
The third method of estimating decays would be to create a prototype of the software system, whichembodies the action in question (warranty, maintenance, or upgrade), and let the customers evaluate thepresent system and the prototype. The difference between the corresponding values of the customer-satisfaction index would be an estimate of the decay.
For software packages installed in multiple locations, the supplier may have the opportunity to pilotthe action in one location, and measure the difference between the satisfaction indices in the pilotlocation and in other locations. This is already a common practice in upgrades. The only additionaltask is the collection of data on the change in customer satisfaction. Such data are needed for a reliableestimate of the decay parameters for a software system, or a class of software systems, and need notbe collected regularly. In some cases, one may be able use a ‘what if’ approach with respect to decayparameters that lack reliable data for their estimates at the moment.
3.7. Technology
The speed of change in technology is one of the external factors impacting customer expectationsand satisfaction. Technological obsolescence reduces customer satisfaction. We quantify the impact oftechnological obsolescence by a decay factor that represents the amount of reduction in the index ofcustomer satisfaction. In each period, technological advances create new customer expectations, andreduce the level of satisfaction with the system by the decay factor. The value of this decay depends onthe technology on which the system is based.
The supplier is not able to offset technological obsolescence by its warranty or maintenance action.It is only through the upgrade action that the supplier can bring the system up-to-date with technology.On the other hand, technological obsolescence by itself does not create upgrade opportunities. Theability of the supplier to deal with new technology, together with the potential actions of competitorsin the market, give rise to opportunities for upgrading the system.
One can estimate the technological decay factor as the difference between the value of the customer-satisfaction index in two consecutive periods, when there has not been any warranty or maintenanceopportunity, or when the supplier has already taken the appropriate action in response to a warranty ormaintenance opportunity. The justification for this method of estimation is that the index of customersatisfaction could decline as a result of four events: warranty decay, maintenance decay, upgrade decay,and technological decay. In periods where there has not been any warranty, maintenance, or upgradeopportunity, a decline in the index of customer satisfaction would only be due to technological decay.This would also be true when there has been a warranty or maintenance opportunity, and the developer’saction has neutralized the decay.
Another estimation method for this factor is to take the difference between customer-satisfactionindices at the beginning and end of two consecutive upgrades, for which the warranty and maintenanceactions have been quite regular; and, due to competition, the supplier has upgraded the system at thefirst opportunity. Dividing the difference between the two index values by the length of time betweenthe two consecutive upgrades provides an estimate for the technological decay factor.
Consider the following example. Assume that a software system is entirely Microsoft-based, andis impacted only by the changes in Microsoft operating systems and server technologies. As Table IIshows, the technology has changed, on average, every 4.26 months from 1995 to 1998.
Obviously, not all customers of the system will wish to have the software system work in the newenvironment. The developer, through interviews with the system customers, has established that, on
Copyright 2001 John Wiley & Sons, Ltd. J. Softw. Maint. Evol.: Res. Pract. 2001; 13:469–493

WARRANTY, MAINTENANCE, AND UPGRADE OF SOFTWARE SYSTEMS 477
Table II. Microsoft technology changes related to operating systems and software.
Release intervalsProduct Release date (in months)
Windows 95 08/24/95 —SQL Server 6.5 02/13/96 5.63Windows NT Server and Workstation 4.0 07/31/96 5.60SNA Server 3.0 12/17/96 4.57Windows CE 2.0 09/29/97 9.40Proxy Server 2.0 10/08/97 0.30Windows Based Terminal Server 11/17/97 1.30Site Server 3.0 04/27/98 5.33Windows 98 06/25/98 1.93
Average 4.26
average, the introduction of a new technology causes a 10% reduction in customer satisfaction, if thecompany does not implement it in its system. In other words, the company loses 10% in the index ofcustomer satisfaction every 4.26 months. Therefore, the technological decay for this system is about2.34 points per month. If the company makes its software-change decisions every quarter, then anestimate of the technological decay for this software system is three times 2.34, or about 7% ofthe customer-satisfaction index. In the case of a less technologically sensitive customer base, fewercustomers would demand the new technology and be impacted less by the change. In our example, iffewer customers prefer the new technology and the index goes down only by 4% for every change inthe relevant technology, then the estimate of the technological decay would be 3% per quarter.
4. MODEL STRUCTURE
Given the market factors, the developer has to decide in each period what action, if any, it should take.As an opportunity arises, the supplier experiences either a cost (of responding) or a decline in potentialrevenue (of not responding) to the opportunity. How the supplier should trade off these competingcosts clearly depends on their relative severity, which in part is determined by the relationship betweenthe customer-satisfaction index and the revenue function. Given that the revenue function is positivelycorrelated with the customer-satisfaction index, the larger the potential decay caused by an opportunity,the stronger is the inducement for the supplier to respond to the opportunity, thus substituting the cost ofan action for the expected loss in revenue. Based on these observations, the details of the mathematicalformulation of the model is discussed in Sahin and Zahedi [46,55]. Here, we provide a brief description.
The decision horizon is an upgrade cycle. An upgrade cycle is the length of time between twoconsecutive upgrades. The life of the upgraded software begins with the completion of the upgradeand ends when it undergoes a subsequent upgrade, as shown in Figure 1. Since an upgrade coulddrastically change the functionality and scope of the software, the upgrade lifecycle is close to the
Copyright 2001 John Wiley & Sons, Ltd. J. Softw. Maint. Evol.: Res. Pract. 2001; 13:469–493

478 I. SAHIN AND F. M. ZAHEDI
Do nothing region
Warrant-only region
Warrant and
maintain region
Warrant, maintain, and
upgrade region
Customer
satisfaction index
Warranty
threshold:W
Maintenance
threshold: M
Upgrade
threshold: U
Time period
no opportunity, reduction in the index due to technical decay
warranty opportunity, reduction in the index due to technical +warranty decays
warranty opportunity, warranty action is taken, reduction in
the index due to technical decay
warranty, maintenance, upgrade opportunities, warranty action is taken,
reduction in the index due to technical+maintenance+upgrade decays
no opportunity, reduction in the index due to technical decay
maintenance opportunity, no action is taken, reduction due to technical+ maintenance decays
warranty, maintenance, and upgrade opportunities, maintenance action is taken,
reduction due to technical +upgrade decays
warranty and maintenance opportunities, maintenance action is
taken, reduction due to technical decay
maintenance opportunity, maintenance action
is taken, reduction due to technical decay
maintenance opportunity, maintenance action is
taken, reduction due to technical decay
upgrade opportunity,
upgrade action is taken
0 1 2 3 4 5 6 7 8 9 10 11
Max value
Upgrade cycle
Figure 1. An example of the upgrade cycle based on decision thresholds.
software lifecycle in concept. Also, it is a concrete measure, and could be used for comparing variouspolicies. The length of an upgrade cycle is a random variable, dependent on market factors and thesupplier’s actions throughout the cycle.
Decision variables are the thresholds for the customer-satisfaction index for warranty, maintenance,and upgrade actions. We define four regions for the index of customer satisfaction: do nothing; warrantonly; warrant and maintain; and warrant, maintain, and upgrade. The action thresholds for theseregions, W , M , and U , are values of the index of customer satisfaction, which recommend action.As the index of customer satisfaction falls below each threshold, the type of required action changes.
Let us consider the example in Figure 1. At the start of the upgrade cycle, the index of customersatisfaction is at its highest (the developer has done its best). In the first period, no opportunity arises,and the index declines only by the technical decay. In the second period, a warranty opportunityarises. Since the system is in the ‘do nothing’ region, the developer does not take any action, andconsequently the index declines by the sum of the warranty and technical decays. In the third period,no opportunity arises, and the index falls only by the technical decay, but falls below the warrantythreshold (W ) by the end of this period. Now we are in the warranty-only region. In this region,
Copyright 2001 John Wiley & Sons, Ltd. J. Softw. Maint. Evol.: Res. Pract. 2001; 13:469–493

WARRANTY, MAINTENANCE, AND UPGRADE OF SOFTWARE SYSTEMS 479
every time a warranty opportunity arises, the warranty action must be taken and no decay takesplace due to the warranty opportunity. But no maintenance or upgrade action is taken. Therefore, anymaintenance or upgrade opportunity would cause a decay. As the index falls below the maintenancethreshold (M) to the ‘warrant and maintain’ region, every warranty or maintenance opportunity willrequire the appropriate action, but any upgrade opportunity would cause a decay, because no upgradeaction is taken in this region. As the index falls below the upgrade threshold (U ), then the developershould respond to all opportunities, including upgrade. As the developer upgrades, the index rises toits maximum level, and the upgrade cycle is completed.
Our model determines the threshold levels (W , M , and U ) such that the expected total return, orby the use of a different optimization criterion, the expected average return of the developer duringan upgrade cycle is maximized. Thus, we use two different optimization criteria. The first criterion isthe maximization of the expected present value of the total return in an upgrade cycle. For brevity, werefer to this criterion as the total return criterion. We also report on maximum expected returns, usinga discount rate of zero.
The problem with the first criterion is that upgrade cycles have different expected lengths underdifferent market or internal conditions. To have a measure that could be compared across differentconditions, we divided the total return by the expected length of the upgrade cycle, as a proxy forthe average return in an upgrade cycle. This criterion includes both discounting and time averaging.We refer to this criterion as the average return criterion, and also report on non-discounted averagereturns.
We have made a conscious effort to represent the actual decision environment as closely as possible,while keeping complexity and the data requirements of the model at an affordable level. In doing so,we have made a number of assumptions.
We assume that the probabilities of warranty, maintenance, and upgrade opportunities do not changewithin the upgrade lifecycle under study. This assumption is reasonable for maintenance and upgrade.There is no guarantee that taking a maintenance action decreases the probability of the developer’sopportunities to enhance the system. Otherwise, a well-maintained software system eventually wouldnot need maintenance, but this notion is contradicted by the existence of IS maintenance budgets for oldsystems. A similar argument could be made for the upgrade opportunity. However, it could be arguedthat as warranty actions are taken, the probability of discovering more faults is reduced. This argumentis countered by a study of two U.S. and one Australian companies (a total of 427 programs) byVessey and Weber [56], in which they could not find any evidence to support the hypothesis that repairmaintenance would increase the number of production runs in the subsequent period or, equivalently,decrease the chance of finding faults in the next period. (Their definition of repair maintenance issimilar to the definition of warranty here.)
We assume that once a customer’s goodwill is lost due to lack of action, it cannot be recovered by alater action. This assumption is justifiable in a competitive market, in which if the action is not taken,competitors take action, and customers become aware of the improved competitive system, resulting ina decrease in customer satisfaction. The developer ‘pays’ the price in decreased customer satisfaction.This loss of goodwill is not recoverable. Otherwise, the developer would have no incentive to take animmediate action; and delaying actions would always be preferable.
We have assumed a hierarchy of thresholds from warranty, to maintenance, to upgrade (see Figure 1).This assumption is in agreement with general practice in software development. When a system isnewly introduced or upgraded, there is a period during which the developer would not make any
Copyright 2001 John Wiley & Sons, Ltd. J. Softw. Maint. Evol.: Res. Pract. 2001; 13:469–493
480 I. SAHIN AND F. M. ZAHEDI
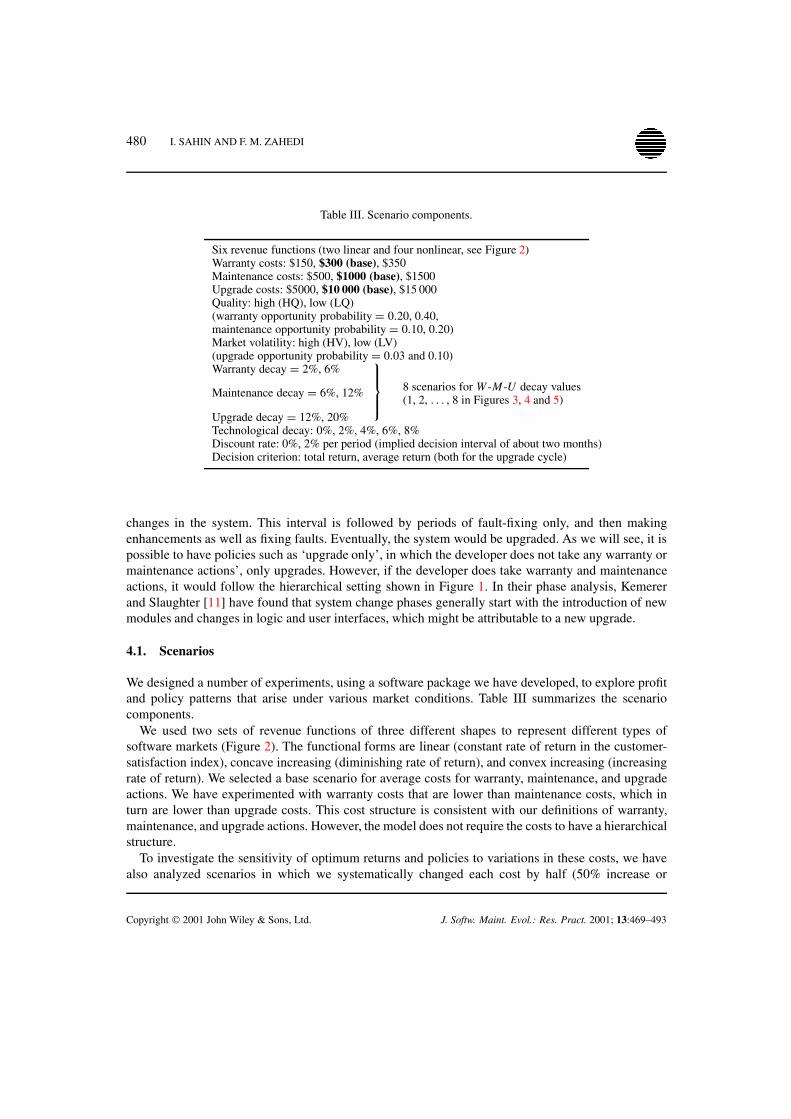
Table III. Scenario components.
Six revenue functions (two linear and four nonlinear, see Figure 2)Warranty costs: $150, $300 (base), $350Maintenance costs: $500, $1000 (base), $1500Upgrade costs: $5000, $10 000 (base), $15 000Quality: high (HQ), low (LQ)(warranty opportunity probability = 0.20, 0.40,maintenance opportunity probability = 0.10, 0.20)Market volatility: high (HV), low (LV)(upgrade opportunity probability = 0.03 and 0.10)Warranty decay = 2%, 6%
Maintenance decay = 6%, 12%
8 scenarios for W -M-U decay values(1, 2, . . . , 8 in Figures 3, 4 and 5)
Upgrade decay = 12%, 20%Technological decay: 0%, 2%, 4%, 6%, 8%Discount rate: 0%, 2% per period (implied decision interval of about two months)Decision criterion: total return, average return (both for the upgrade cycle)
changes in the system. This interval is followed by periods of fault-fixing only, and then makingenhancements as well as fixing faults. Eventually, the system would be upgraded. As we will see, it ispossible to have policies such as ‘upgrade only’, in which the developer does not take any warranty ormaintenance actions’, only upgrades. However, if the developer does take warranty and maintenanceactions, it would follow the hierarchical setting shown in Figure 1. In their phase analysis, Kemererand Slaughter [11] have found that system change phases generally start with the introduction of newmodules and changes in logic and user interfaces, which might be attributable to a new upgrade.
4.1. Scenarios
We designed a number of experiments, using a software package we have developed, to explore profitand policy patterns that arise under various market conditions. Table III summarizes the scenariocomponents.
We used two sets of revenue functions of three different shapes to represent different types ofsoftware markets (Figure 2). The functional forms are linear (constant rate of return in the customer-satisfaction index), concave increasing (diminishing rate of return), and convex increasing (increasingrate of return). We selected a base scenario for average costs for warranty, maintenance, and upgradeactions. We have experimented with warranty costs that are lower than maintenance costs, which inturn are lower than upgrade costs. This cost structure is consistent with our definitions of warranty,maintenance, and upgrade actions. However, the model does not require the costs to have a hierarchicalstructure.
To investigate the sensitivity of optimum returns and policies to variations in these costs, we havealso analyzed scenarios in which we systematically changed each cost by half (50% increase or
Copyright 2001 John Wiley & Sons, Ltd. J. Softw. Maint. Evol.: Res. Pract. 2001; 13:469–493

WARRANTY, MAINTENANCE, AND UPGRADE OF SOFTWARE SYSTEMS 481
0
500
1000
1500
2000
2500
3000
0 2 4 6 8
10
12
14
16
18
20
22
24
26
28
30
32
34
36
38
40
42
44
46
48
50
Index of Customer Satisfaction
Re
turn
Set 2
Set 2
Set 2
Set 1
Set 1Set 1
Figure 2. Revenue functions in Sets 1 and 2.
decrease). The base scenario has eight combinations of warranty, maintenance, and upgrade decays.We varied the technological decay from 2% to 8%, and also used zero technological decay as abenchmark to analyze the cost of technological obsolescence. The percentage values in Table IIIrepresent percentages of the maximum value of the index of customer satisfaction.
5. POLICY ANALYSIS
Based on the above choices, we have examined 3840 base scenarios, and 23 040 variations on these fortesting the sensitivity of our findings to changes in warranty, maintenance, and upgrade costs. In thissection, we present our findings relative to the average return criterion, and note the differences thatarise under the total return criterion and the impact of lack of discounting, when such differences aresignificant.
5.1. Quality
Figure 3 shows the average returns under the linear revenue function (Set 1). In this and thesubsequent two figures, the graph is divided into four areas: high quality–low volatility (HQ–LV), highquality–high volatility (HQ–HV), low quality–high volatility (LQ–HV), and low quality–low volatility(LQ–LV). Each area contains eight combinations of warranty, maintenance, and upgrade decays, listed
Copyright 2001 John Wiley & Sons, Ltd. J. Softw. Maint. Evol.: Res. Pract. 2001; 13:469–493

482 I. SAHIN AND F. M. ZAHEDI
-100
0
100
200
300
400
500
600
700
0 1 2 3 4 5 6 7 8 1 2 3 4 5 6 7 8 1 2 3 4 5 6 7 8 1 2 3 4 5 6 7 8
Scenarios
Average Return
LQ-LV HQ-LV HQ-HV LQ-HV
Tech decay = 2%
Tech decay = 4%
Tech decay = 6%
Tech decay = 8%
W-M-U decay scenarios W-M-U decay scenarios W-M-U decay scenarios W-M-U decay scenarios
Figure 3. Average returns (linear revenue function, Set 1).
in Table III. Each plot shows the average returns for a given level of technological obsolescence,ranging from low (2%) to high (8%) in each period.
The results show that quality pays under all circumstances. A higher quality of design andimplementation always yields a higher average return. For example, comparing the results for HQ–LVwith LQ–LV, we see that for the same level of market volatility, better system quality yields higheraverage returns. Similarly, in a market with high volatility, higher average returns are associated withbetter quality. This pattern is observed for all forms of the revenue function and for all warranty,maintenance, and upgrade cost levels.
This finding is not surprising, given that we have associated better design and implementation qualitywith lower probabilities of warranty and maintenance opportunities arising in each time period. Thelower these probabilities are, the lower are the chances of incurring warranty or maintenance costs ina period, if the supplier responds to the opportunity, or of suffering a decline in the index of customersatisfaction, which induces a decline in revenue. Therefore, any novelty in our findings regarding theimpact of quality is not only in the qualitative conclusion that quality pays, but also in measuringthe impact of quality. This impact can reach substantial proportions, as Figure 3 also indicates. From
Copyright 2001 John Wiley & Sons, Ltd. J. Softw. Maint. Evol.: Res. Pract. 2001; 13:469–493

WARRANTY, MAINTENANCE, AND UPGRADE OF SOFTWARE SYSTEMS 483
HQ–LV to LQ–LV, the relative decline in average return is seen to range from about 5% to more than100%, as the rate of technological obsolescence is increased.
Furthermore, we find that the average return is not sensitive to customers’ reactions, as measuredby warranty, maintenance, and upgrade decays, when the product is of high quality (first and fourthregions in Figure 3). This pattern, which we observed consistently in all cases we examined, is of greatimportance in developing software systems. Quality pays, and it is possible to measure the impactof higher quality on the developer’s profitability using our model. This provides the developer witha powerful tool for making design and implementation decisions regarding the quality of the system,hence providing feedback from post-sale changes upstream to the design and implementation of newsystems or upgrades.
5.2. Market volatility
Market volatility and the software supplier’s competency to respond to it has a major impact on thesupplier’s average return. Again, Figure 3 presents a typical case. A volatile market creates morefrequent upgrade opportunities for the developer. Comparing first and fourth regions (low-volatilityareas) with second and third regions (high-volatility areas), we observe that the average return isuniformly higher in the regions of high volatility. Thus, when there are more opportunities to upgradein the market and the supplier has the competency to take advantage of these opportunities, thesupplier’s average return is higher than it is in the less volatile market. This finding conforms withthe observed growth of companies like Microsoft, which operate under high-volatility and high-competency conditions.
Another interesting observation is that under a volatile market condition, the supplier’s averagereturn is generally more sensitive to the quality of the system. A drop in the quality of the systemhas a larger impact on returns in a more volatile market. In such a market, which is characterized byhigh competition, customers are used to frequent upgrades, have more mobility from one system toanother, and are less tolerant of low quality.
5.3. Technological obsolescence
When customers are more sensitive to a system’s technological obsolescence, the supplier’s averagereturn is lower, everything else being equal. Figure 3 confirms this by showing substantial gaps betweenthe four plots of the average returns corresponding to technological obsolescence rates ranging from2% to 8% of the maximum value of the index per period. As customers’ reactions to obsolescenceincrease, average returns decrease. This has been the case for all types of revenue functions with whichwe have experimented. This result makes sense in that there is a faster decline in the satisfaction indexin each period, and the window of profitability is narrower for the developer. The microchip market isa well-known example of this phenomenon. The profit window for a microchip is limited, partly dueto the rapid decay in customer satisfaction caused by technological obsolescence.
Our model makes it possible to measure the impact of technological obsolescence on the developer’sprofitability. In order to investigate the extent of the loss due to obsolescence, we used the theoreticalbenchmark where there is no technological obsolescence. Figure 4 shows the typical patterns foroptimum average return. The supplier’s relative loss in a volatile market is much larger than the relative
Copyright 2001 John Wiley & Sons, Ltd. J. Softw. Maint. Evol.: Res. Pract. 2001; 13:469–493

484 I. SAHIN AND F. M. ZAHEDI
0
0.2
0.4
0.6
0.8
1
1.2
0 1 2 3 4 5 6 7 8 1 2 3 4 5 6 7 8 1 2 3 4 5 6 7 8 1 2 3 4 5 6 7 8
Average Return
HQ-LV HQ-HV LQ-HV LQ-LV
Tech decay = 6%
Tech decay = 8%
Tech decay = 4%
Tech decay = 2%
Scenarios
W-M-U decay scenarios W-M-U decay scenarios W-M-U decay scenarios W-M-U decay scenarios
Figure 4. Relative loss in average return due to obsolescence (linear revenue function, Set 1).
loss in a less volatile market. One of the reasons for this phenomenon is that the upgrade cycle is shorterunder higher market volatility.
5.4. Revenue structure
The form of the revenue function impacts the sensitivity of the supplier’s average return to customerexpectations. When the decrease in customer satisfaction due to the supplier’s lack of action is high,the average return falls faster under nonlinear revenue functions. The form of the revenue functiondoes not change the patterns discussed so far. However, it has a consequential impact on the pattern ofoptimal policies, which is discussed later.
5.5. Decision criteria
The above conclusions also hold true under the non-discounted average return criterion. We found theaverage-return and non-discounted-average-return criteria yield similar patterns of optimum return,with generally lower returns under the latter, except for low levels of technological obsolescence.
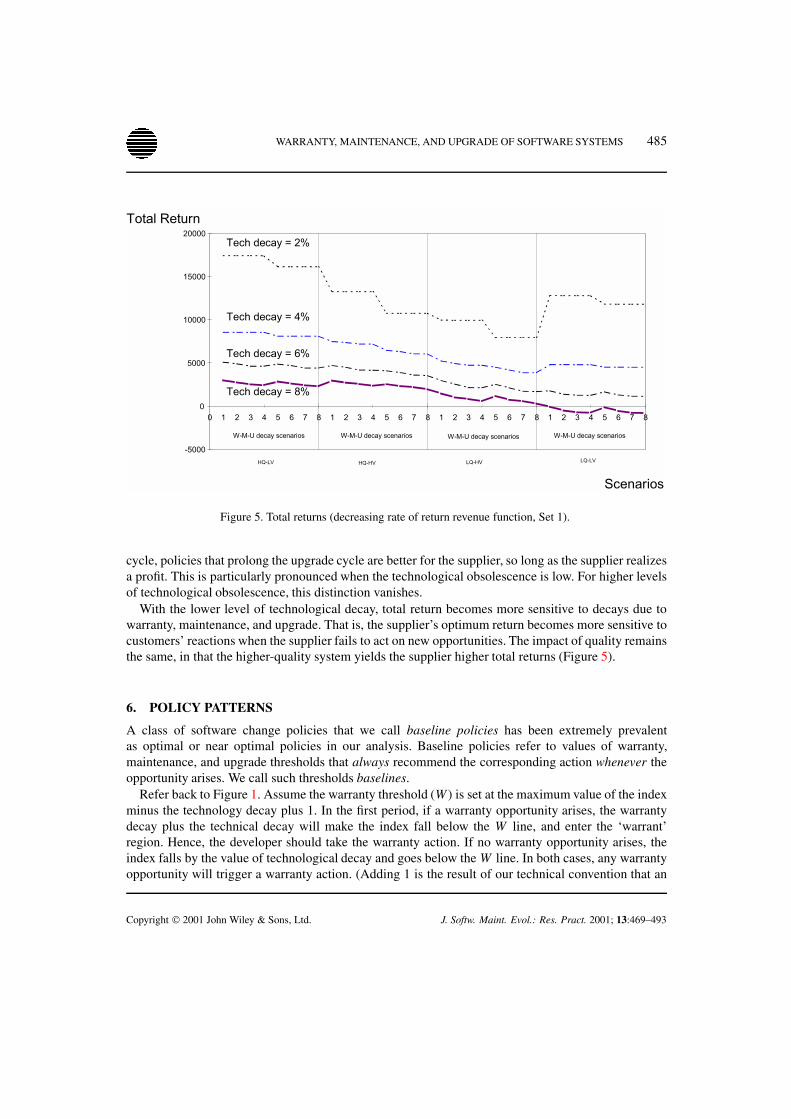
On the other hand, when the decision criterion is total return, the conclusion regarding marketvolatility changes. A volatile market does not yield the highest total return for the supplier (Figure 5)—the less volatile market is more profitable. Because the total return is not averaged over the upgrade
Copyright 2001 John Wiley & Sons, Ltd. J. Softw. Maint. Evol.: Res. Pract. 2001; 13:469–493
WARRANTY, MAINTENANCE, AND UPGRADE OF SOFTWARE SYSTEMS 485
-5000
0
5000
10000
15000
20000
0 1 2 3 4 5 6 7 8 1 2 3 4 5 6 7 8 1 2 3 4 5 6 7 8 1 2 3 4 5 6 7 8
Scenarios
Total Return
HQ-LV HQ-HV LQ-HV LQ-LV
Tech decay = 2%
Tech decay = 4%
Tech decay = 6%
Tech decay = 8%
W-M-U decay scenarios W-M-U decay scenarios W-M-U decay scenarios W-M-U decay scenarios
Figure 5. Total returns (decreasing rate of return revenue function, Set 1).
cycle, policies that prolong the upgrade cycle are better for the supplier, so long as the supplier realizesa profit. This is particularly pronounced when the technological obsolescence is low. For higher levelsof technological obsolescence, this distinction vanishes.
With the lower level of technological decay, total return becomes more sensitive to decays due towarranty, maintenance, and upgrade. That is, the supplier’s optimum return becomes more sensitive tocustomers’ reactions when the supplier fails to act on new opportunities. The impact of quality remainsthe same, in that the higher-quality system yields the supplier higher total returns (Figure 5).
6. POLICY PATTERNS
A class of software change policies that we call baseline policies has been extremely prevalentas optimal or near optimal policies in our analysis. Baseline policies refer to values of warranty,maintenance, and upgrade thresholds that always recommend the corresponding action whenever theopportunity arises. We call such thresholds baselines.
Refer back to Figure 1. Assume the warranty threshold (W ) is set at the maximum value of the indexminus the technology decay plus 1. In the first period, if a warranty opportunity arises, the warrantydecay plus the technical decay will make the index fall below the W line, and enter the ‘warrant’region. Hence, the developer should take the warranty action. If no warranty opportunity arises, theindex falls by the value of technological decay and goes below the W line. In both cases, any warrantyopportunity will trigger a warranty action. (Adding 1 is the result of our technical convention that an
Copyright 2001 John Wiley & Sons, Ltd. J. Softw. Maint. Evol.: Res. Pract. 2001; 13:469–493

486 I. SAHIN AND F. M. ZAHEDI
Table IV. Baseline policies.
Policy Description Recommended action
WMU baseline Warranty, maintenance, and upgradethresholds are at their baselines
Always warrant, maintain, and upgrade
WM baseline Warranty and maintenance thresholds areat their baselines, the upgrade threshold isbelow its baseline
Always warrant and maintain; upgrade onlywhen the index falls below the upgradethreshold
WU baseline Warranty and upgrade thresholds are attheir baselines, maintenance and upgradethresholds coincide at the upgrade baseline
Always warrant and upgrade; maintain onlywhen the index falls below the upgradebaseline
MU baseline Maintenance and upgrade thresholds are attheir baselines, warranty and maintenancethresholds coincide at the maintenancebaseline
Always maintain and upgrade; warrant onlywhen the index falls below the maintenancebaseline
W baseline Warranty threshold is at its baseline, main-tenance and upgrade thresholds coincidebelow the upgrade baseline
Always warrant; maintain and upgradewhen the index falls below the upgradethreshold
M baseline Maintenance threshold is at its baseline,warranty and maintenance thresholds coin-cide at the maintenance baseline, the up-grade threshold is below its baseline
Always maintain; warrant only when theindex falls below the maintenance baseline;upgrade below the upgrade threshold
U baseline Warranty, maintenance, and upgradethresholds coincide at the upgrade baseline
Always upgrade; warrant and maintain onlywhen the index falls below the upgradebaseline
U only Warranty, maintenance, and upgradethresholds coincide below the upgradebaseline
Never warrant, maintain, or upgrade, untilthe index falls below the upgrade threshold
action is recommended when the satisfaction index falls below the corresponding threshold, not whenthe index just reaches it.) We call this threshold the warranty baseline. A warranty baseline alwaystriggers a warranty action, leading to the always warrant policy.
Maintenance and upgrade baselines are defined similarly. For the example, assuming a maximumindex value of 100, and given the technological, maintenance, and upgrade decays of 2%, 6%, and20%, respectively, the maintenance baseline is M = 100 − 6 − 2 + 1 = 93, and the upgrade baselineis U = 100 − 20 − 2 + 1 = 79. With M = 93 as the maintenance threshold, the supplier would alwaysrespond to a maintenance opportunity, even at the high end of the customer satisfaction index—alwaysmaintain. Also, given an upgrade opportunity, U = 79 would trigger an upgrade action, whatever theindex value is—always upgrade.
In our analysis, we discovered that almost all of the optimal change policies involved warranty andmaintenance baselines. On the other hand, the upgrade baseline appeared in relatively fewer optimalpolicies. By combining the warranty, maintenance, and upgrade baselines, we define a set of eightbaseline policies, which account for almost all of the 26 880 optimal policies we have computed forthis analysis, as shown in Table IV.
Copyright 2001 John Wiley & Sons, Ltd. J. Softw. Maint. Evol.: Res. Pract. 2001; 13:469–493

WARRANTY, MAINTENANCE, AND UPGRADE OF SOFTWARE SYSTEMS 487
In terms of practical implications to software change policy formulation, this set of policies hasa number of interesting properties. All baseline policies are defined by what we may call extreme-point warranty and maintenance thresholds. On the other hand, the upgrade threshold is not always anextreme-point setting. By these, we mean the following.
• The warranty threshold is set either at its baseline (always warrant) or at the maintenancethreshold (do not warrant until maintenance). A warranty threshold that is in between thewarranty baseline and the maintenance threshold is never (or very seldom) optimal. The suppliershould either respond to all warranty opportunities, whenever they arise, or postpone all warrantyactions until the maintenance threshold is crossed downward.
• The maintenance threshold is set either at its baseline (always maintain) or at the upgradethreshold (do not maintain until upgrade). A maintenance threshold that is in between themaintenance baseline and the upgrade threshold is never (or very seldom) optimal. The suppliershould either respond to all maintenance opportunities, whenever they arise, or postpone allmaintenance action until the upgrade threshold is crossed downward.
• The upgrade threshold is set either at its baseline (always upgrade) or at a level below itsbaseline. Thus the supplier should either respond to all upgrade opportunities, or postpone thenext upgrade to the most opportune time, when the index of customer satisfaction falls below theoptimal upgrade threshold.
In the case of the upgrade policies, being at the extreme point (always upgrade) is in line withNault and Vandenbosch’s [52] result from their competitive model, where they conclude that the ITmarket leader should always be the first to upgrade when the opportunity arises. Norton and Bass [57]also observed the existence of extreme points. They found that the best time to launch a product lineextension (upgrade in our case) is either relatively early in the original product’s life cycle or not at all.
6.1. Prevalence of baseline policies
In this section, we compare the baseline policies, and report on their prevalence and cost-sensitivity,on the basis of the 26 880 scenarios we have examined. In the 3840 main scenarios, we used warranty,maintenance, and upgrade base scenarios for costs (Table III). The rest of the scenarios were designedto investigate the cost-sensitivity of optimal returns and policies. This was considered important inview of our representation in the main scenarios of the warranty, maintenance, and upgrade costs byaverages.
The most frequent optimal policy was the WM-baseline policy, which accounted for about one-half of the base scenarios. At low levels of technological obsolescence, this policy was optimal forthe market with high volatility. With an increase in technological decay, it became optimal also forthe market with low volatility. The second-most-frequent optimal policy (26% of the base scenarios)was the WMU-baseline policy, which emerged as optimal under conditions of low technologicalobsolescence and market volatility. Thus, the most ‘active’ policies, WMU-baseline (always warranty,maintain, and upgrade) and WM-baseline (always warrant and maintain) were optimal for about77% of the base scenarios. As technological obsolescence and market volatility were increased, theWMU-baseline policy gave way to the WM-baseline policy, as these conditions made it cost inefficientto upgrade all the time.
Copyright 2001 John Wiley & Sons, Ltd. J. Softw. Maint. Evol.: Res. Pract. 2001; 13:469–493

488 I. SAHIN AND F. M. ZAHEDI
In terms of the frequency of optimality in base scenarios, the WM-baseline and WMU-baselinepolicies were followed by the U -only (10%), W -baseline (7%), and M-baseline (3%) policies. Theother baseline policies and policies that are not baseline accounted for the remaining 3% of the optimalpolicies. Generally, the W -baseline, M-baseline, and U -only policies were associated with high ratesof technological obsolescence or high market volatility.
We found that as the level of the technological decay increased, everything else being equal, theoptimal policy shifted first from WMU- or WM-baseline to W -baseline or M-baseline, and then tothe U -only policy. These shifts were faster in the more volatile markets. When there was stability inthe market (low technological decay and low volatility), always-warrant–maintain–upgrade, or always-warrant–maintain policies were generally optimal. However, in unstable markets, with high volatilityand faster technological decay, these policies gave way to W -, M-baseline, or U -only policies. In theU -only policy, the company takes only the upgrade action. Therefore, the index falls much more rapidlyinto the upgrade area (Figure 1), because no action is taken to compensate for warranty or maintenancedecays.
The U -only policy is in line with strategies used by some leading high-tech companies, such asIntel and Hewlett Packard, which operate in a highly competitive market with large technological andupgrade decays. Their strategy is to cannibalize their successful products and upgrade frequently tokeep their leadership position [52,58].
We would like to report the following additional observations regarding the base-scenario results,with useful implications to practical software change policy formulation.
• The optimal upgrade threshold in the market with high volatility was generally lower than thatin the market with low volatility, under the average return criterion. When the decision criterionwas the total return, the optimal upgrade threshold value was generally lower for higher-qualitysystems. This is in line with the Nault and Vandenbosch [52] observation that early upgrade incompetitive markets is costlier because of the lack of adequate expertise and research experiencewith the new technology.
• In both sets of revenue functions (Figure 2), the linear form had the highest frequency ofoptimal WM-baseline policies, while the revenue function with the increasing rate of return hadthe highest incidence of optimal WMU-baseline policies. The reason is that when revenue isincreasing with the customer-satisfaction index at an increasing rate, it pays to correct faults assoon as they are discovered, whereas a straight-line revenue growth experience may allow thesupplier to wait for a maintenance opportunity before correcting faults.
• Higher revenues offset or reduced the impact of market instability (high volatility and highrate of technological decay), in that they induced the optimal policies to be more ‘active’ andpushed the change policy towards the WMU-baseline policy. This was evidenced by the higherfrequencies of these policies with the second set of revenue functions. Under higher revenues, wealso observed a reduction in the frequency of optimal policies associated with market instability(W -, M-baseline, and U -only policies).
• When there was no technological obsolescence, about 95% of the optimal policies were WMU-and WM-baseline. As the rate of obsolescence increased to 2%, 4%, 6%, and 8% per period,this percentage fell to 91, 83, 69, and 48. These two baseline policies extend the upgrade cycleby requiring frequent warranty and maintenance actions. This strategy would be reasonable fora company only in a stable and less competitive market. An example is the washer and dryer
Copyright 2001 John Wiley & Sons, Ltd. J. Softw. Maint. Evol.: Res. Pract. 2001; 13:469–493

WARRANTY, MAINTENANCE, AND UPGRADE OF SOFTWARE SYSTEMS 489
0.00
10.00
20.00
30.00
40.00
50.00
60.00
70.00
WMU-Baseline MU-Baseline WU-Baseline U-Baseline WM-Baseline M-Baseline W-Baseline Uonly-Baseline
Baseline Policies
Pe
rce
tag
e
warranty cost=150
warranty cost=300
warranty cost=450
Figure 6. Baseline policies as warranty cost changes (Set 1 of revenue functions).
market and Maytag’s successful deployment of such a strategy. Microsoft used a similar strategyin the 1980s in its PC operating system. (DOS was launched in August of 1981, and remainedon the market for 9 years.)
To investigate the sensitivity of the baseline policies to changes in costs, we repeated our experimentssix more times, each time increasing or decreasing the warranty, maintenance, or the upgrade cost by50%; see Figure 6 for the results regarding warranty-cost changes. The overall outcomes of the analysisshowed that WM-baseline and WMU-baseline policies together remain the most frequently optimalpolicies. However, baseline policies shifted in frequency of optimality, as costs changed.
6.2. Implications for large software package developers
It is a well-established fact that software changes are costly and regular, and their relative share ininformation systems budgets is increasing. It is also a fact that there is no formal tool available forsoftware-change managers and decision makers to help them set policies and to examine the impactof their policies prior to taking action. In this paper, we identified the major decision parameters inmaking change decision and proposed a model that could be used as a decision tool.
We used the model to establish the existence of certain types of change policies, which are robust andhighly prevalent. Since these policy types are not very sensitive to small variations in parameter values,one does not need to be overly concerned about minor errors in parameter estimation. A software-change manager could use the model to identify the policy type that best fits a system. A system that
Copyright 2001 John Wiley & Sons, Ltd. J. Softw. Maint. Evol.: Res. Pract. 2001; 13:469–493

490 I. SAHIN AND F. M. ZAHEDI
runs on a WMU-baseline policy requires a drastically different change management than the system thatfollows a U -only policy. The first system requires a vigilant crew to monitor warranty, maintenance,and upgrade opportunities and to take actions on the system. The U -only system puts the emphasis oninnovations and upgrades, and needs less attention to fixing faults or making incremental enhancementson the software system’s existing functions.
Arthur [59] and Kim and Westin [60] have observed organization and human-relations managementfactors contribute significantly to software maintainability. Arthur [21] suggests that having a change-management system is critical to successful and productive software maintenance. Our frameworkprovides managers with two vehicles for decision making. The first vehicle provides the softwarechange decision maker with: (i) a guideline for the data needed to monitor the process; (ii) the abilityto manage the change by experimenting with data and various policies; and (iii) the ability to set actionguidelines, such that only unusual cases would be managed on an exceptional basis. This is a vehiclefor single-system change management.
The second vehicle is for multi-system change analysis. Using our model, a manager should beable to categorize the portfolio of the company’s software systems based on the policies they requireand have a formal framework to connect the nature of the market with the actions required in orderto remain competitive. A developer with a portfolio of systems, for which the U -baseline is optimal,relies heavily on innovation and continuous creativity. A developer with a portfolio of WM-baselinesystems needs to establish processes to monitor warranty and maintenance opportunities and maintaina crew for fixing and enhancing existing systems. Therefore, this type of optimal policies could be usedto analyze the company’s portfolio of software systems and link them to the company’s internal andexternal strategies.
7. CONCLUDING REMARKS
Managing changes in large software packages is one of the critical issues in information systems, forwhich no systematic method exists in theory or in practice. Companies are left to decide on changesbased on the feedback from the loudest customers or the decisions of their technical staff. On the otherhand, while customer satisfaction has been a major focus in software development, there has beenno formal connection between the measures of customer satisfaction and decisions regarding post-installation changes. At a time when information technology has become a major strategic weaponfor organizations in their bid for market share and long-term profitability, there is a dire need for astrategic approach to making changes in software systems. In our analysis, we formalized the linkbetween customer satisfaction and long-term revenue generation, and used this link to develop policiesfor software developers in making changes in their large packages.
We found that quality pays in all cases, for all decision criteria, market conditions, and customerexpectations. Our approach allows the developer to measure the increase in profitability associatedwith higher-quality systems. This feature has important implications not only for software-changemanagement, but also for the development of software systems and their upgrades. It makes quality animportant strategic dimension in the agendas of chief information officers and software developers.
We found market volatility to be another major factor impacting the supplier’s returns. Supplierswho operate in a volatile market have a higher optimal average return than those who operate in a lessvolatile market. This is true for all revenue structures, customer response patterns, and technological
Copyright 2001 John Wiley & Sons, Ltd. J. Softw. Maint. Evol.: Res. Pract. 2001; 13:469–493

WARRANTY, MAINTENANCE, AND UPGRADE OF SOFTWARE SYSTEMS 491
obsolescence levels we have tested. When a company has the technical core competency, playing in afast moving industry with a high probability of technological innovation is more profitable than beingin a technologically or competitively stagnant market.
A third significant factor has been the rate of reduction in the customer satisfaction index dueto technological obsolescence. We found that the supplier incurs a relatively higher loss due totechnological decay in a more volatile market. Furthermore, for a given market type, higher qualityreduces the extent of loss due to technological obsolescence. The significance of this finding is thatcustomer satisfaction, quality, and volatility have strong interactions. The players in a volatile marketshould have a strong emphasis on quality in order to preserve their market share and revenue stream.
We discovered and reported on the prevalence of what we called baseline policies, as optimalsoftware-change policies. Our analysis showed that market volatility and technological obsolescencehave a deciding impact on which baseline policy would be optimal. We found that of the eightdifferent baseline policies we identified, the ‘active’ policies (always-warrant–maintain, or always-warrant–maintain–upgrade)are more frequently associated with stable markets (low volatility and slowtechnological decay). On the other hand, ‘passive’ policies (i.e. do not warrant until maintenance, or donot maintain until upgrade) are more frequently optimal in an unstable market (high volatility and rapidtechnological decay). We also found that baseline policies are robust under various market conditions,and cover almost all policy options available to developers for software-system changes. This providessoftware developers with a menu of eight well-defined policy options to choose from, depending ontheir internal structures and market factors.
REFERENCES
1. Banker RD, Datar SM, Kemerer CF. A model to evaluate variables impacting the productivity of software maintenanceprojects. Management Science 1991; 37(1):1–18.
2. Lientz BP, Swanson BE. Problems in application software maintenance. Communications of the ACM 1981; 24(11):763–769.
3. Zelkowitz MV, Shaw AC, Gannon JD. Principles of Software Engineering and Design. Prentice-Hall: Englewood CliffsNJ, 1979.
4. Port O. The software trap—automate or else. Business Week 1988; 3051(9):142–154.5. Huff S. Information systems maintenance. The Business Quarterly 1990; 55:30–32.6. Nosek JT, Palvia P. Software maintenance management: Changes in the last decade. Journal of Software Maintenance
1990; 2(3):157–174.7. Eastwood A. Firm fires shots at legacy systems. Computing Canada 1993; 19(2):17.8. Sutherland J. Business objects in corporate information systems. ACM Computing Surveys 1995; 27(2):274–276.9. Schneidewind N. The state of software maintenance. IEEE Transactions on Software Engineering 1987; SE-13(3):303–
310.10. Kemerer CF. Software complexity and software maintenance: A survey of empirical research. Annals of Software
Engineering 1995; 1:1–22.11. Kemerer CF, Slaughter S. An empirical study approach to studying software evolution. IEEE Transactions on Software
Engineering 1999; 25(4):493–509.12. Banker RD, Datar SM, Kemerer CF, Zweig D. Software complexity and software maintenance costs. Communications of
the ACM 1993; 36(11):81–94.13. Banker RD, Slaughter S. A field study of scale economies in software maintenance. Management Science 1997;
43(12):1709–1725.14. Chan T, Chung SL, Ho TH. An economic model to estimate timings of software rewriting and replacement. IEEE
Transactions on Software Engineering 1996; 22(8):580–598.15. Martin J, McClure C. Software Maintenance: The Problem and Its Solutions. Prentice-Hall: Englewood Cliffs NJ, 1983.16. Swanson EB, Beath CM. Reconstructing the systems development organization. MIS Quarterly 1989; 13(3):293–305.17. Swanson EB, Beath CM. Maintaining Information Systems in Organization. Wiley: New York NY, 1989.
Copyright 2001 John Wiley & Sons, Ltd. J. Softw. Maint. Evol.: Res. Pract. 2001; 13:469–493

492 I. SAHIN AND F. M. ZAHEDI
18. Belady LA, Lehman MM. A model of large program development. IBM Systems Journal 1976; 15(1):225–252.19. IEEE. An American National Standard IEEE Glossary of Software Engineering Terminology (ANSI/IEEE Standard 729).
IEEE: New York NY, 1983.20. Swanson EB. The dimensions of maintenance. Proceedings Second International Conference on Software Engineering.
IEEE Computer Society Press: Long Beach CA, 1976; 492–497.21. Arthur LJ. Software Evolution: A Software Maintenance Challenge. John Wiley & Sons: New York, 1988.22. Reutter J. Maintenance is a management problem and a programmer’s opportunity. IFIP Conference Proceedings of 1981
National Computer Conference, vol. 50. AFIPS Press: Reston VA, 1981; 343–347.23. Caves DW, Christensen LR, Diewert WE. The economic theory of index numbers and the measurement of input, output,
and productivity. Econometrica 1982; 50(6):1393–1414.24. Brynjolfsson E. The contribution of information technology to consumer welfare. Information Systems Research 1996;
7(3):281–300.25. Bailey JE, Pearson S. Development of a tool for measuring and analyzing computer user satisfaction. Management Science
1983; 29(5):530–545.26. Baroudi JJ, Orlikowski W. Short-form measure of user information satisfaction: A psychometric evaluation and notes on
use. Journal of Management Information Systems 1988; 4(4):44–59.27. Ives B, Olson M. User involvement and MIS success: A review of research. Management Science 1984; 30(5):586–603.28. Ives B, Olson M, Baroudi JJ. The measurement of user information satisfaction. Communications of the ACM 1983;
26(10):785–793.29. DeLone W, McLean E. Information systems success: The quest for the dependent variable. Information Systems Research
1992; 3(1):60–95.30. Doll WJ, Xia W, Torkzadeh G. A confirmatory factor analysis of the user–user computing satisfaction instrument. MIS
Quarterly 1994; 18(4):453–461.31. Kettinger WJ, Lee C. Perceived service quality and user satisfaction with the information services function. Decision
Sciences 1994; 25(5–6):737–766.32. Kim KK. User satisfaction: A synthesis of three different perspectives. Journal of Information Systems 1989; 4(1):1–12.33. Lucas H. User reactions and the management of information systems. Management Informatics 1973; 2(4):165–172.34. Maish AM. A user’s behavior toward his MIS. MIS Quarterly 1979; 3(1):39–52.35. McKeen JD, Guimaraes T, Wetherbe JC. The relationship between user participation and user satisfaction: An investigation
of four contingency factors. MIS Quarterly 1994; 18(4):427–451.36. Nolan R, Seward H. Measuring user satisfaction to evaluate information systems. Nolan RL (ed.) Managing the Data
Resource Function, West Publishing Co.: New York, 1974; 253–275.37. Torkzadeh G, Doll WJ. Test-retest reliability of the end-user computing satisfaction instrument. Decision Sciences 1991;
22(1):26–37.38. Fornell C. A national customer satisfaction barometer: The swedish experience. Journal of Marketing 1992; 56(1):6–21.39. Fornell C, Robinson T. Industrial organization and customer satisfaction/dissatisfaction. Journal of Customer Research
1983; 9(4):403–412.40. Johnson D, Fornell C. A framework for comparing customer satisfaction across individual and product categories. Journal
of Economic Psychology 1991; 12(2):267–286.41. Klepper S. Entry, exit, growth, and innovation over the product life cycle. The American Economic Review 1996;
86(3):562–583.42. Nelson RR. Assessing private enterprise: An exegesis of tangled doctrine. Bell Journal of Economics 1981; 12(1):93–111.43. Cohen WM, Klepper S. The anatomy of industry R&D intensity distribution. American Economic Review 1992; 82(4):773–
799.44. Porter ME. Competitive Strategy. The Free Press: New York NY, 1980.45. Wiener LR. Digital Woes. Addison-Wesley: Reading MA, 1993.46. Sahin I, Zahedi FM. Optimal policies under risk for changing software systems based on customer satisfaction. European
Journal of Operational Research 2000; 123(1):175–194.47. Prusa TJ, Schmitz JA Jr. Can companies maintain initial innovative thrust? A study of the PC software industry. The Review
of Economics and Statistics 1994; 76(3):523–540.48. Griliches Z. Hybrid corn: An exploration in the economics of technological change. Econometrica 1957; 25:501–522.49. Gort M, Klepper S. Time path in the diffusion of product innovations. Economic Journal 1982; 92(367):630–653.50. Jovanovic B, Lach S. Entry, exit, and diffusion with learning by doing. American Economic Review 1989; 79(4):690–699.51. Katz M, Shapiro C. Network externalities, competition, and compatibility. American Economic Review 1985; 75(3):424–
440.52. Nault BR, Vandenbosch MB. Eating your own lunch: Protection through preemption. Organization Science 1996;
7(3):342–358.53. Brecka J. The American customer satisfaction index. Quality Progress 1994; 27(10):41–44.
Copyright 2001 John Wiley & Sons, Ltd. J. Softw. Maint. Evol.: Res. Pract. 2001; 13:469–493

WARRANTY, MAINTENANCE, AND UPGRADE OF SOFTWARE SYSTEMS 493
54. Brynjolfsson E, Kemerer C. Network externalities in microcomputer software: An econometric analysis of the spreadsheetmarket. Management Science 1996; 42(12):1627–1647.
55. Sahin I, Zahedi FM. Control limit policies for warranty, maintenance, and upgrade of software systems. IIE Transactions2001; 33(9):729–745.
56. Vessey I, Weber R. Some factors affecting program repair maintenance: An empirical study. Communications of the ACM1983; 26(2):128–134.
57. Norton J, Bass FM. A diffusion theory model of adoption and substitution for successive generations of high-technologyproducts. Management Science 1989; 32(9):1069–1086.
58. Deutschman A. The managing wisdom of high-tech superstars. Fortune 1994; October 17: 197–206.59. Arthur LJ. Programmer Productivity. John Wiley & Sons: New York, 1982.60. Kim C, Westin S. Software maintainability: Perceptions of EDP professionals. MIS Quarterly 1988; 12(2):167–185.
AUTHORS’ BIOGRAPHIES
Dr Izzet Sahin (deceased) was with the School of Business Administration at the University of Wisconsin–Milwaukee since 1978 where he held the Johnson Controls Research Professorship. He had also been associatedwith the University Ottawa, Middle East Technical University and Bilkent University. He had a Diploma inmechanical engineering from the Technical University of Istanbul (1964), an MS in management science fromStevens Institute of Technology (1967) and a PhD in operations research from Case Institute of Technology (1970).
Dr Sahin was interested in the theory and applications of stochastic processes. He published widely in theapplied probability, operations research/management science, production and operations management, insurance-risk and actuarial science journals. He was the author of research monographs on quality, warranty and preventivemaintenance; inventory theory; private pension systems; and post-retirement health plans. He was an area editorof Production and Operations Management, an associate editor of Transactions on Operational Research, and aneditorial board member of Applied Stochastic Models and Data Analysis.
Dr Fatemeh ‘Mariam’ Zahedi is a Wisconsin Distinguished Professor, MIS Area atthe Business School, University of Wisconsin–Milwaukee. She received her doctoraldegree from Indiana University. Her present areas of research are in IS policy (includingweb market strategies, information systems quality and reliability), web design issues,intelligent systems, and IS-related decision analysis. She has published extensively, andin a number of journals including: MIS Quarterly, Decision Sciences, IEEE Transactionsfor Software Engineering, IEEE Transactions on Man, Machine, and Cybernetics,Operations Research, Computers and Operations Research, Decision Support Systems,IEEE Transactions on Professional Communications, Interfaces, International Journal ofQuality and Reliability Management, Journal of Information Technology Management,Journal of Computational Intelligence and Organizations, Journal of OperationalResearch Society, Mathematical and Computer Modelling, The Review of Economics andStatistics, Empirical Economics; Socio-Economic Planning Sciences.
Dr Zahedi has contributed to the topic of information systems in InternationalEncyclopedia of Business and Management, and group decisions in Encyclopedia ofManagement Science and Operations Research. She has published two books: QualityInformation Systems and Intelligent Systems for Business: Expert Systems with NeuralNetworks. She is on the editorial board of three journals and has served as the guest editorof another. Dr Zahedi has extensive consulting experience in developing informationsystems and in creating policy analysis models.
Copyright 2001 John Wiley & Sons, Ltd. J. Softw. Maint. Evol.: Res. Pract. 2001; 13:469–493