policies for reduction of greenhouse gases emission … · política de imposição de metas...
TRANSCRIPT

28
Policies for reduction of greenhouse gases emission and their costs and opportunities for the
Brazilian industry
Aline Magalhães (CEDEPLAR-UFMG)
Terciane Carvalho (UFPR)
Edson Domingues (CEDEPLAR-UFMG)
SUMMARY
Brazil has taken an active stance in the Climate Change Negotiations, confirming goals to
reduce its greenhouse gas emissions (GHG) and proposing sectoral mitigation plans. Recent Brazilian
industrial policies attempt to accelerate the industrial growth and, among other goals, develop a more
efficient industry in terms of energy use. However, typical mechanisms of mitigation policies, such as
carbon pricing, can act in a counterproductive way against the incentives of the industrial policy. In this
paper we fill a gap in Brazilian literature, estimating the impact of policies to reduce emissions in
Brazilian industry, imposing caps to the emissions (CAP scenario) or carbon markets (CAP-AND-
TRADE scenario). The results show the importance of sectoral considerations and the design of
mechanisms in the formulation of mitigation policies. The CAP scenario makes productions costs more
expensive for important sectors in the investment composition (cement, steel, non-metallic) and
relatively benefits consumer goods sectors (textiles, clothing and footwear). The CAP-AND-TRADE
scenario can achieve the same emission reduction goals with less adverse effects.
Key-words: CO2 emissions, industry, Cap-and-trade, Computable general equilibrium model
JEL Classification: Q54, C68
RESUMO
O Brasil tem se posicionado de maneira mais ativa nas negociações sobre mudanças climáticas,
ao confirmar metas voluntarias de redução de emissões e propor Planos Setoriais de Mitigação de GEE.
Par e passo com os planos setoriais, o país procura implementar políticas de estímulos ao crescimento
do setor industrial, que tem perdido participação e competitividade na economia. Não há uma
preocupação de mitigação de GGE nas políticas industriais, que podem até aumentar emissões. Além
disso, os mecanismos típicos de políticas de mitigação, como a precificação de carbono, podem atuar de
forma contraproducente com os incentivos de políticas industriais. Este trabalho preenche uma lacuna
na literatura brasileira, estudando o impacto de políticas de redução de emissões na indústria brasileira,
como a imposição de tetos de emissões ou mercado de carbono. Os resultados mostram a importância
de considerações setoriais e de desenho de mecanismos na formulação das políticas de mitigação. A
política de imposição de metas encarece os custos de produção de setores importantes na composição do
investimento (cimento, aço, não-metálicos) e beneficia relativamente setores de bens de consumo
(têxteis, vestuários e calçados). A política de mercado de carbono consegue atingir as mesmas metas de
redução de emissões com efeitos menos adversos.
Palavras-chaves: Emissões industriais, Mercado de carbono, Modelos de equilíbrio geral
computável

28
1. INTRODUCTION
Brazil has taken an active stance in the Climate Change Negotiations, confirming goals to
reduce its greenhouse gas emissions (GHG) and proposing sectoral mitigation plans. A first step has
already been taken in this sense at the Conference of the Parties (COP) in Copenhagen (2009), Cancun
(2010) and Paris (2015), where Brazil confirmed its voluntary national goals of greenhouse gases
emission reductions of 43% below 2005 levels in 2030, according the Brazilian Intended Nationally
Determined Contributions – INDCs.
In Brazil, authorities have pointed the deforestation control, especially in Amazon, as the
country’s main proposal to reduce GHG emissions. However, from 2005 to 2012, there was a decline
in the deforestation rates, indicating a consequently reduction on emissions associated to changes of
land-use (INPE, 2012). According the most recent Brazilian Inventory of Greenhouse Gases, the share
of emissions from land use change and forestry have declined from 61% to 22% between 2005 and
2010. So, the relative importance of GHG emissions derived from fuel usage and productive processes
have increased significantly, in the same period (MCTI, 2013). This importance is intensified due to
the emissions tendency to increase in use of energy, transportation (especially related to diesel usage),
oil refining, and activity of industrial sectors. Some initiatives, in this context, have already started to
emerge. As part of the NPCC, for example, Mitigation Sectoral Plans of GHG were released in 2013 for
Agriculture, Mining, Metallurgy and Manufacturing Industry as a whole, proposing goals and some
mitigating measures against global warming.
Along with the NPCC, the country seeks to implement policies to estimate the industrial sector
growth, which has lost participation and competitiveness in the Brazilian economy. There is no obvious
concern with GHG mitigation in industrial policies, which may even increase the emissions. The recent
Brazilian industrial policies seek to promote the increase in productive efficiency, the incentive of asset
and capital sectors, taking advantage of environmental opportunities and of business related to the
energy sector, diversification of exports, among others. This policy presents ambitious goals, such as
expanding investments participation in the GDP, increasing the expenditure in research and
development and increase of worker’s qualification.
The Brazilian industrial policy has goals for a cleaner production system, which implies the
reduction of energy consumption by unit of the industrial GDP. This goal, direct and indirectly aims at
the reduction of GHG emissions. Thus, there is a relationship between the two policies, the Brazilian
industrial policy and the NPCC. However, typical mechanisms of mitigation policies, such as carbon
pricing, can act in a counterproductive way against the incentives of the industrial policy. The aim of
this work is to verify the costs for the industrial sector and for investment that an eventual carbon
pricing policy would cause. To achieve that objective, we apply a computable general equilibrium
model especially adapted for the question of carbon pricing and energy demand, especially for the
industrial sector.
There is a great debate currently underway on the GHG mitigation policies framework: by
market mechanisms, such as taxes, subsidies and carbon market, or by regulations (e.g. government
regulations, performance standards, and voluntary programs). An alternative and very probable
scenario, with the non-approval of a global agreement, and one that has been globally discussed would
be the creation and strengthening of national policies for GHG reduction, which could take the form of
taxation policies or carbon markets. According to Al-Min et al., (2009), the question posed is whether
such measures and mitigation policies will be durable and lasting enough to provide the necessary
reductions in GHG emission. Systems of mitigation application are still in debate, especially about the
use of market mechanisms and preferences.
There are many examples of national tax policies and carbon markets. Denmark and
Switzerland, for example, are the major countries to adopt taxes over carbon and reach goals of
emission reduction proposed by the Kyoto Protocol. The greatest carbon market is the EU ETS

28
(European Union’s Emissions Trade Scheme), in the European Union, which according to Gregoriou et
al. (2014), in 2011, presented a 11 % growth, reaching a total amount of US$ 176 billion. The
European Union has served as an example in proposing similar schemes in the United States, Canada
and New Zealand.
In Brazil, the NPCC still has as its base actions of monitoring, supervision, control, licensing and
funding line. There is, however, the possibility of instituting tools specifically designed to create a price
signaling for the reduction of GHG emissions, which have been widely discussed in the international
scenario. The creation of economical instruments pre-induced for GHG emissions – such as an emission
trade system between sectors – can be a cheaper alternative to expand the array of options available
within the National Policy on Climate Change proposed by Brazil. It is recommendable, however, that
the cost-effectiveness relation of such policies be analyzed.
The mitigation or reduction of emissions of greenhouse gases is a global “public good”1 whose
benefits reach all, while costs are passed on to those financing the mitigation. In contrast to other public
goods, such as public safety, the mitigation benefits are not immediate, and on the contrary, can only be
felt in the future, something that compromises the implementation of policies. Literature on the
ramifications of a carbon market implementation in Brazil is still limited 2
. As far as is known, there
are no other studies estimating the effects of a national emission trade system for the different
sectors. Economic impacts for Brazil in a global market scenario of certificates, however, can be
found in Feijó and Porto Júnior (2008).
In this context, this study fills a gap in Brazilian literature, estimating the viability and the cost
of a mitigation emission policy trough a national carbon market among industrial sectors, taking as an
example what happens in the EU ETC. Like many other developing countries, Brazil faces a double
challenge of promoting development and reducing its emissions. Therefore, in face of this new scenario
and of the new post-2012 context, it is important to study the perspectives and policies for carbon
market development in Brazil. Such alternatives can characterize a more active way for the country to
contribute to the mitigation of global warming and lead this trend among other developing countries.
In methodological terms, we developed an applied dynamic-recursive general equilibrium
model, called BeGreen (Brazilian Energy and Greenhouse Gas Emissions General Equilibrium
Model), built for Brazil’s reality and specificities, with energetic and environmental detailing
empowered to analyze policies of GHG reduction on the economy. The model is innovative in many
aspects for the Brazilian literature: it has a high desegregation of energetic products and sectors, it is a
recursive dynamics CGE model and it has differentiated energetic and environmental specification.
Besides this introduction, the paper is organized in three more sections: the second section details the
methodology developed to project the effects of mitigation policies on the Brazilian economy. Third
section shows the main results of mitigation policies simulated. At last, the final considerations are
made.
1 Public goods are defined as those whose individuals cannot be excluded from its consumption (non-excludable) and
the supply does not depend on the number of agents reached (non-rival). Therefore, the rights for the ownership of
public goods are not defined and, thus, exchanges by other goods ended up not being made in an efficient way in the
competitive market and an intervention of public policies is necessary so that the efficiency can be achieved. 2 Most studies have been focused on the analysis of the effects of carbon taxes imposition on the Brazilian economy
[see Rocha (2003), Lopes (2003), Tourinho et al. (2003), Ferreira filho and Rocha (2007), Silva and Gurgel (2010),
Margulis and Dubeux (2010), Gurgel (2012)].

28
2. Methodology
2.1 BeGreen Model
The general equilibrium approach has been increasingly used to evaluate environmental
policies impacts. The reason is that a policy that aims to decrease pollution emission significantly
can have significant effects on prices, quantities and on the structure of an economy. Producers’ and
consumers’ behavior is affected by emissions effects on production and consumption, and by the
implementation of pollution control policies. Additionally, a CGE model makes it possible to
analyze impacts on distribution and on the welfare of policies from different tax instruments, such
as quotas, taxes, subsides or income transfers, whose effects can be transmitted through several
markets (WING, 2004, TOURINHO et al., 2003). Accordingly, our model has three important
advances: i) detailed energetic specification, ii) an environmental module that allows a projection of
emission reduction policies, and iii) a structure of recursive dynamics.
The first two elements are fundamental to the goal of this paper, as they allow a consistent
analysis of policies for greenhouse gas mitigation (GHG) for the Brazilian economy through the
incorporation of a detailed energetic and environmental specification module. Additionally, the model is
calibrated with the latest data from national accounts, with an input-output matrix and the Brazilian
emission inventory from 20053. The structure of recursive dynamics aggregates one more differential.
Since it is a long-term matter, the responses to policies depend significantly on projections of a baseline
scenario to the economy, involving presumptions about growth rates of uncountable macroeconomic
variables, such as GDP, population, consumption, and investment for several years. This aspect allows
the implementation of simulations in which restrictions of GHG emissions are relative to this baseline
scenario as proposed by the National Policy on Climate Chance.
These characteristics in CGE models (recursive dynamics and detailed energetic and
environmental specification) are relatively new in the Brazilian literature. The BeGreen model is a CGE
model with recursive dynamics for the Brazilian economy, empowered with an environmental and
energetic analysis. The database includes a high level of product and sector disaggregation, enabling a
detailed treatment of energy and emissions. It enhances the models’ capacity to analyze the impact of
greenhouse gas mitigation policies. The model is multiproduct, comprised of 124 products and 58
sectors. In addition to that, we also add 14 final demand components - household consumption (10
representative families)4, government consumption, investments, exportation and stocks - three primary
factor elements (capital, labor and land), two margin sectors (trade and transportation), importations by
product for each one of the 58 sectors and 14 components of final demand, and an aggregation of
indirect taxes on production.
In general, the central structure of the CGE model is comprised of equation blocks that
determine supply and demand relationships, derived from the optimization hypothesis, and conditions of
market balance. Additionally, several macro aggregates are defined in this block, such as employment
level, balance of trade and price indexes. Productive sectors minimize the production costs subject to a
technology of constant scale returns.
One of the model distinguishing features refers to the technological vectors from specific
energy-intensive sectors and energy compounds to other sectors. In the description of the model that
follows we concentrate on the special features of the model; detailed equations can be found in Annex 1
3 The model is supplied by an extensive set of data that reflects the structure of the Brazilian economy in 2005. These
data are obtained from several sources: National Accounts and Input-Output Matrix (IBGE), International Trade
(SECEX), Family Budget Survey (POF-IBGE). 4 The families are aggregated according to income deciles obtained from POF data, totaling 10 representative families.

28
2.1.1. Production structure
In our model, each sector can produce more than one product, making use of various types of
energy inputs, intermediate inputs and primary factors such as labor, capital and land. In each sector
firms have an optimizing behavior, in which inputs choose a combination which minimizes the cost of
production for a given level of product subject to constant returns to scale technology. However, a major
enhancement of the theoretical structure of production with regard to energy specification is
fundamental to the issues to be addressed in this thesis. The model, specifies two distinct categories of
productive sectors grouped as follows: i) sectors with manufacturing technologies and technological
vectors ii) replacement with sectors structures between energetic compounds.
An effort was made to move towards a more realistic approach for "bottom-up" in the modeling
of energy-intensive sectors. BeGreen model brings, as an innovation for Brazilian models, the bottom-
up approach known as "Technological Bundle" (MCDOUGALL, 1993; HINCHY and HANSLOW,
1996; ABARE, 1996). This approach includes particular energy-intensive sectors where the input
substituting options are relevant for the purpose of simulating mitigation of greenhouse gas policies.
Different technologies can be partially replaced (using a hypothesis of imperfect substitutability) using
CRESH production functions (constant ratio of elasticities of substitution, homotheticity) (HANOCH,
1971; DIXON et al., 1982). This structure was inspired by the ABARE-GTEM model (Australian
Bureau of Agriculture and Resource Economics Global Trade and Environment Model), a dynamic
CGE model for the treatment of global environmental issues (ABARE, 1996). The specification of
"technology bundle" poses a restriction on the substitution of inputs, making it consistent with the
characteristics of well-known technologies. This avoids the possibility of obtaining replacement or
technically unfeasible combinations of inputs. Two sectors fall into this category due to their well
characterized production technologies: Electricity generation and Steel and iron industry.
In the production process of the others sectors, the representation of the technology allows for
various substitution possibilities among different types of fossil fuel and non-fossil energy, in addition to
other intermediary inputs and primary factors. Firms choose the composition of energy inputs from
three composites: Renewable composite, self-generation of electricity and non-renewable composite. In
renewable composite through a CES function, firms choose the composition of renewable energy inputs
(firewood, charcoal, alcohol, sugar cane bagasse, hydropower). In turn, the non-renewable composite,
they choose among non-renewable inputs (oil, natural gas, LPG, diesel oil, fuel oil, gasoline, kerosene,
coke, other refinery products).
2.1.2 Final Demand
The model divides households into different income groups. Households are disaggregated
according to income deciles obtained from Brazilian Consumer Expenditure Survey (POF data),
providing ten representative households. This nationwide survey provides detailed information on
household income and expenditures including electricity, gasoline and other energy goods. For
households, the initial factor endowments are fixed. They, therefore, supply factors in a non-elastic way.
The household demand is specified by a non-homothetic Stone-Geary utility function (Peter et al.,
1996). Demand equations are derived from a utility maximization problem whose solution follows
hierarchical steps. On the first level there is a CES substitution between domestic and imported goods.
At this level, the possibility of substitution between gasoline and alcohol was introduced through a CES
function. This compound was chosen because of the real possibility of this substitution, boosted by the
increasing use of vehicles with flex-fuel technology in Brazil, whose composition depends on the
relative prices of both products.
In subsequent top level there is a Klein-Rubin aggregation of the composed goods; so the utility
derived from consumption is maximized according to this utility function. This specification gives rise

28
to the linear expenditure system (LES), in which the participation of expenses above the subsistence
level for each good represents a constant proportion of the total subsistence expense for each household.
The composition of consumption by domestic and imported products is controlled by constant elasticity
of substitution functions (CES).
The standard small country assumption is made implying that Brazil is a price-taker in import
markets. However, because the imported goods are differentiated from the domestically produced
goods, the two varieties are aggregated using a CES function, based on the Armington assumption.
Exports are linked to the demand curves negatively associated with domestic production costs and
positively affected by an exogenous expansion of international income.
Government consumption is typically exogenous and can be associated or not with household
consumption or tax collection. Stocks accumulate following the variation of production.
The specification of the recursive dynamic is based on the modeling of intertemporal behavior
and results from previous periods (backward looking). Current economic conditions, such as the
availability of capital, are endogenously dependent on later periods but remain unaffected by
forward-looking expectations. Thus, investment and capital stock follows accumulation mechanisms
and inter-sectoral shifts from pre-established rules associated with the depreciation rate and rates of
return. Moreover, it assumes a dampening of the investment responses. The labor market also presents
an intertemporal adjustment process involving three variables: real wages, current employment, and
employment trends.
On the supply side, a constant elasticity of transformation (CET) function is used to define the
output of a given sector as a revenue-maximizing aggregate of goods for the domestic market and goods
for the foreign markets.
2.1.3 Environmental module
In the model of core specifications, previously reported, the BeGreen model has an
environmental module inspired by the MMRF-Green model (Adams et al., 2002). The model treats
emissions in detail, separating them by issuing agent (fuel, industries and households), and issuing
activity. Emissions in the model are associated with the use of fuel (twelve fuels in total) or the level of
sector activity, such as agricultural emissions (whose cause lies in the enteric fermentation of ruminants,
rice cultivation and use of fertilizers especially, an important source of Brazilian emissions) or industrial
processes (e.g. cement manufacture). The model calculates the carbon price or cost of emission
reductions by imposing GHG emission targets endogenously. This module is responsible for the
transformation of these prices or carbon taxes on ad-valorem rates, feeding the core model. From the
results of certain variables (fuel use by sectors, level of activity and household consumption), the
environmental module calculates changes in emissions. Emissions are measured in terms of carbon
dioxide equivalents (CO2-e).
According to Adams et al. (2002), government revenue from the imposition of a carbon tax, R,
can be calculated as:
,f u
f u
R E (1)
where τ is a specific tax on a ton of CO2-e and E is the amount (in tonnes) of CO2-e by emission
source f (fossil fuels or productive activity) and by user u (industries and households). Since the tax on
CO2-e emissions will be determined through an ad-valorem tax rate on fuel use or production activity, R
is equivalent to:
,
,100
f u
f f u
f u
tR P Q (2)

28
Where ft is the ad valorem tax rate ( %), fP is the basic unit price of fuel or carbon-content
product and ,f uQ is the amount of fuel or product consumed by user u. For each type of emission source
and user, a specific tax on emissions can be translated into an ad valorem rate as follows:
,
,
,
100 f u
f u
f f u
Et
P Q
(3)
The last part of the equation, ,
,
f u
f f u
E
P Qcan be defined as the emission intensity for fuel use or
level of productive activity by Brazilian currency (Reais). To determine the carbon price, marginal cost
of emissions (or carbon tax), the impact on the ad valorem tax rate for each type of emission source
depends not only on technical features, such as the carbon content of each source but also economic
variables or market conditions such as price.
Emissions from fuel use are modeled proportionally to use and activity emissions for the
product-related industries. The producer’s cost function is modified to include the carbon taxes so that
they induce a substitution in favor of lower carbon-content fossil fuels or products.
Another important mechanism of the model is the possibility of returning the revenue from taxes
through income compensation or an allowance (negative tax) on household purchases. This process,
however, is specified to allow only a certain portion of revenue to be compensated. Therefore, there is
the possibility of both total revenue return (100 % return), and the return at an intermediate level.
In this stage, there are no endogenous technological innovations in the case of fossil fuels or
productive activities (less emission-intensive technologies) that allow, for example, the burning of coal
to release less CO2 per ton used. Many of these abatement technologies or alternative production
methods would become cost effective under increasing carbon tax rates. However, appropriate values of
the parameters of the abatement response functions need to be firmly established, and in the Brazilian
case there is still a lot of uncertainty. We do not do so here because of lack of information. This is a
topic for future work5.
2.1.4 Equilibrium conditions and closure rules
The market equilibrium conditions of BeGreen is characterized by an allocation of goods and
factors in such a way that (i) the endogenously determined prices clear all markets, ii) all agents respect
their budget constraint, and iii) the total level of CO2 emissions meets the specified reduction target.
Supply–demand balances for all commodities and nonfixed factors clear through adjustment in prices in
frictionless markets. The model is Walrasian in character, and hence, it determines only relative prices.
The nominal exchange rate is chosen to be the numéraire. The major macroeconomic variables are
endogenous in the policy scenario (real government expenditure is exogenous). In CGE recursive
dynamic models, investment increases cause reductions in the expected rates of return, via an increase in
capital stock, later reducing these investments to its steady state (equilibrium). On the other hand, real
wages will respond to employment increases until the balance of the labor market is reestablished.
BeGreen is a one country model with exogenous international trade structures. So, Brazil is modelled as
a small open economy. There is free movement of goods and factors within the Brazilian economy
sectors.
In the simulations, the constraint on total emissions is binding (exogenous), the equilibrium of
carbon price (or abatement marginal cost) is endogenously determined by the model. In “cap-and-trade”
simulations, the model allows sectors to trade permissions between themselves according to established
5 The sectors, on the other hand, can reduce emissions by replacing energy inputs, via change in relative prices.
28
targets. From results of fuel usage by the sectors, activity level and household consumption, the
environmental module calculates the variations in emissions.
2.1.4 Model Database e Parameters
The core database was built based on the Input-Output Matrix of 2005 from the Brazilian
Institute of Geography and Statistics (IBGE), foreign trade by sector and trade port, available and
household consumption by product from Household Budget Survey (POF) from IBGE. Emissions of
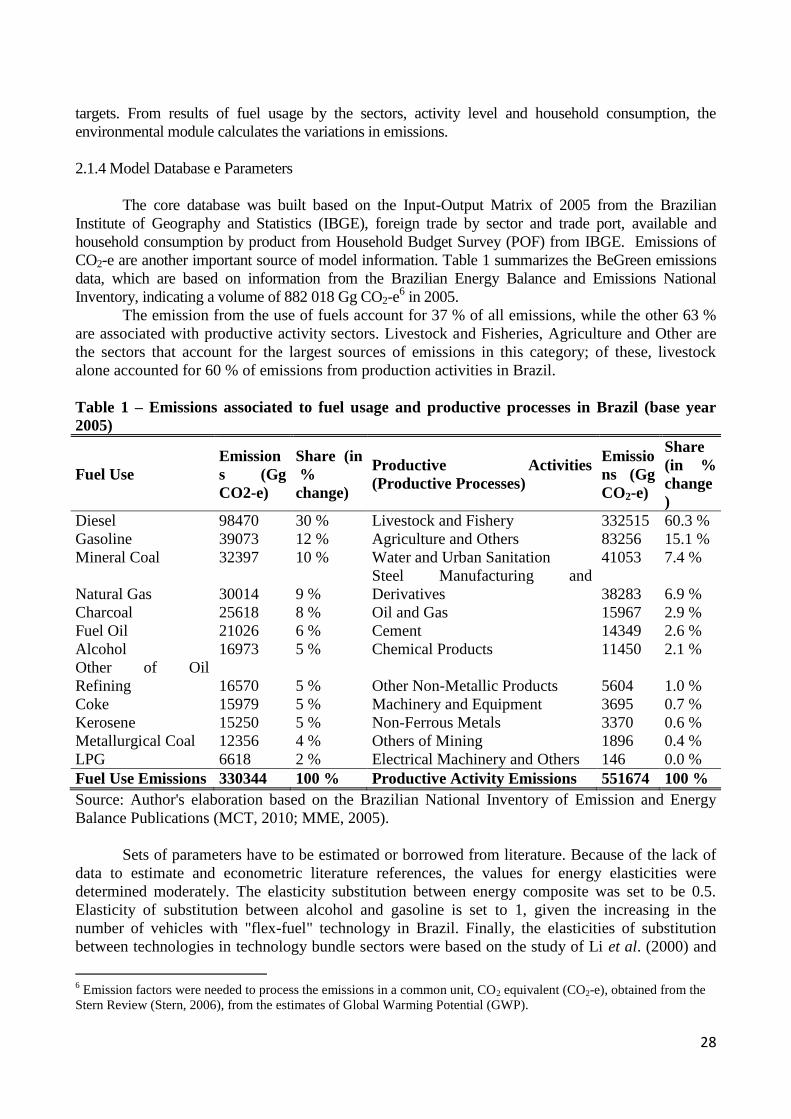
CO2-e are another important source of model information. Table 1 summarizes the BeGreen emissions
data, which are based on information from the Brazilian Energy Balance and Emissions National
Inventory, indicating a volume of 882 018 Gg CO2-e6 in 2005.
The emission from the use of fuels account for 37 % of all emissions, while the other 63 %
are associated with productive activity sectors. Livestock and Fisheries, Agriculture and Other are
the sectors that account for the largest sources of emissions in this category; of these, livestock
alone accounted for 60 % of emissions from production activities in Brazil.
Table 1 – Emissions associated to fuel usage and productive processes in Brazil (base year
2005)
Fuel Use
Emission
s (Gg
CO2-e)
Share (in
%
change)
Productive Activities
(Productive Processes)
Emissio
ns (Gg
CO2-e)
Share
(in %
change
)
Diesel 98470 30 % Livestock and Fishery 332515 60.3 %
Gasoline 39073 12 % Agriculture and Others 83256 15.1 %
Mineral Coal 32397 10 % Water and Urban Sanitation 41053 7.4 %
Natural Gas 30014 9 %
Steel Manufacturing and
Derivatives 38283 6.9 %
Charcoal 25618 8 % Oil and Gas 15967 2.9 %
Fuel Oil 21026 6 % Cement 14349 2.6 %
Alcohol 16973 5 % Chemical Products 11450 2.1 %
Other of Oil
Refining 16570 5 % Other Non-Metallic Products 5604 1.0 %
Coke 15979 5 % Machinery and Equipment 3695 0.7 %
Kerosene 15250 5 % Non-Ferrous Metals 3370 0.6 %
Metallurgical Coal 12356 4 % Others of Mining 1896 0.4 %
LPG 6618 2 % Electrical Machinery and Others 146 0.0 %
Fuel Use Emissions 330344 100 % Productive Activity Emissions 551674 100 %
Source: Author's elaboration based on the Brazilian National Inventory of Emission and Energy
Balance Publications (MCT, 2010; MME, 2005).
Sets of parameters have to be estimated or borrowed from literature. Because of the lack of
data to estimate and econometric literature references, the values for energy elasticities were
determined moderately. The elasticity substitution between energy composite was set to be 0.5.
Elasticity of substitution between alcohol and gasoline is set to 1, given the increasing in the
number of vehicles with "flex-fuel" technology in Brazil. Finally, the elasticities of substitution
between technologies in technology bundle sectors were based on the study of Li et al. (2000) and
6 Emission factors were needed to process the emissions in a common unit, CO2 equivalent (CO2-e), obtained from the
Stern Review (Stern, 2006), from the estimates of Global Warming Potential (GWP).

28
adapted to the reality of the Brazilian energy matrix. The sensitivity analysis performed on the
parameters and elasticities revealed that the results, considering the methodological specification, are
robust for most variables7.
Some database indicators can be calculated in order to show how the GHG emissions are
associated with industrial sectors. For each sector, the activity emissions and fuel use emissions were
summed. Table 2 calculates the ratio between emissions per Gross Value of Production (GVP), the
exports coefficient (Exports/GVP) and the multiplier of emissions. This multiplier should be interpreted
as the increase in emission in the economy (in Gg) for each R$ 1 million increase in final demand
production of the sector, taking into account both direct and indirect emissions.
Table 2 indicates the heterogeneous structure of emissions in the industrial sectors. Cement has
high direct emission coefficient and multiplier effect. Food and Beverage has low direct emission
coefficient, but it has a high multiplier effect of emission, due to the agriculture and livestock supplies
that it acquires. Some sectors with higher participation in exports have high emissions multiplier effect
(steel and derivatives, iron ore and equipment)
Table 2 - Sectoral indicators and greenhouse effect gas emissions for industrial sectors (Brazil,
2005)
Sectors Emissions
Multiplier Emissions/GVPcoefficient
Exports
(in
millions
of R$)
Share
of
Exports
Exports/GVP
Cement 3.38 2.98 143 0 % 0.02
Steel Manufacturing and Derivatives 1.64 1.24 21366 7 % 0.29
Food and Beverage 1.39 0.03 43198 14 % 0.17
Other of Mining 0.89 0.64 2251 1 % 0.19
Other Non-Metallic Products 0.86 0.45 4170 1 % 0.16
Chemicals Products 0.72 0.46 6635 2 % 0.11
Transport, Storage and Postal Services 0.63 0.47 5394 2 % 0.03
Non-Ferrous Metals 0.59 0.29 9010 3 % 0.36
Iron Ore 0.58 0.36 14797 5 % 0.63
Tobacco Products 0.57 0.01 3926 1 % 0.41
Alcohol 0.51 0.03 1416 0 % 0.12
Accommodation and Food Services 0.51 0.01 9491 3 % 0.14
Appliances 0.5 0.05 1224 0 % 0.13
Machinery and Equipment 0.49 0.09 15202 5 % 0.25
Metal Products 0.49 0.06 2229 1 % 0.04
Oil and Gas 0.48 0.27 9974 3 % 0.14
Parts for Motor Vehicles 0.46 0.04 11219 4 % 0.2
Resin and Spandex 0.46 0.07 4067 1 % 0.17
Oil Refining 0.46 0.14 11689 4 % 0.1
Transmission and Distribution of
Energy 0.45 0.01 5 0 % 0
Cellulose and Paper 0.43 0.12 7907 3 % 0.21
Wood Products 0.38 0.07 6636 2 % 0.34
Leather and Footwear 0.37 0.02 6328 2 % 0.27
Automobiles and Utilities 0.35 0.02 14748 5 % 0.28
Others Equipment of Transport 0.35 0.06 11383 4 % 0.46
7 These results are available by request from the author.

28
Electrical Equipment 0.34 0.06 4416 1 % 0.14
Perfumery and Others 0.34 0.02 1055 0 % 0.06
Rubber and Plastic 0.34 0.07 4281 1 % 0.09
Paints and Others 0.33 0.06 394 0 % 0.05
Textiles 0.31 0.06 4069 1 % 0.12
Distribution of Natural Gas 0.31 0.01 - 0 % 0
Others of Chemical 0.3 0.06 2060 1 % 0.16
Trucks and Buses 0.29 0.02 6992 2 % 0.36
Pesticides 0.29 0.02 797 0 % 0.07
Construction 0.28 0.03 977 0 % 0.01
Others Industries 0.25 0.02 3486 1 % 0.11
Electronic Material 0.22 0.06 7401 2 % 0.2
Others Services 0.16 0.01 1180 0 % 0.01
Pharmaceutical Products 0.15 0.02 1379 0 % 0.05
Clothing 0.15 0.01 835 0 % 0.03
Medical Advices 0.15 0.01 1277 0 % 0.12
Journals and Magazines 0.14 0.01 252 0 % 0.01
Source: BeGreen model database
2.1 Control policies simulations (CAP) and Market simulations (CAP-AND-TRADE)
In this section, the procedures used in the GHG mitigating policies simulations over the
Brazilian industrial sector are reported. Two different policies are considered: 1) imposition of a
common emissions control policy to the selected sectors (CAP) and 2) a carbon market policy (CAP-
AND-TRADE) over the selected sectors, inspired by the Sectoral Plan of Industry Mitigation.
At first, a baseline scenario is set for the growth of the Brazilian economy, in the absence of
such policies. The baseline scenario is set as a trend scenario of the economy where deviations related to
it can be measured, estimating the effects of specific policies. This scenario represents a growth
trajectory of the Brazilian economy between 2006 and 2030, as well as the trajectory of the total and
sectoral emissions that would take place if there were no control policy and/nor carbon market. The
evolution of the economy in the 2006-2030 period is based on oficial macroeconomic data and
emissions observed 2006 and 2011. The scenario also incorporates information about the increase of
energy efficiency based on EPE (Brazillian official Energy Research Institute) projections.
The baseline scenario is characterized by an average rate of 4.0 % growth in the Brazilian
GDP per year from 2005 to 2030. In this scenario, the emissions grow on average 3.0 %,
highlighting the growth of emissions from energy use –fuels (3.4 % per year) and industrial
processes (4.0 % per year). Hence, we observe a growth acceleration of the industrial processes
emissions and an increase in its participation in the total emissions, as well as a slower increase of
agricultural emissions, with consequent loss of participation in total emissions.
The difference between the trajectories of the baseline scenario and the policy scenario
represents the effect of the simulated GHG mitigation policies. In each scenario, the policy starts in
2016. New linked simulations, year by year, allow us to analyze the results up to 2030, based on
accumulated deviation in relation to the baseline scenario.

28
Having as motivation the goals and sectors included in the Sectoral Plan for Industry
Mitigation8, two policy scenarios were created, summarized in Chart 1. The first one (Scenario I)
refers to the policy where it would establish, in 2016, a standard mandatory emissions reduction for
the selected industrial sectors. These sectors are the most representative regarding the GHG
emissions, and they correspond to 23 % of the sectoral emissions in Brazil in 2005, according to
Table 3. The policy would have two phases: 2016 to 2020 and 2021 to 2030. In the first phase, the
goal would be a reduction in relation to the baseline scenario of 5 % of the projected emissions9
between 2016-2020 for the sectors of Cement, Other non-metallic mineral products (lime), cellulose
and paper, no-ferrous metals (aluminum) and steel manufacturing and derivatives (pig iron and
steel). Then, in the second phase (2021-2030), that goal would be a decrease of 10 % compared to
the baseline scenario, incorporating the sectors of chemical products, petroleum refining and natural
gas.
The second scenario (Scenario II) would represent an emission reduction policy with the
same goals, phases and sectors of the previous policy, but with the establishment of a carbon market
for industrial sectors, like the EU-ETS. The permissions distribution would be 100 % free, allocated
among the sectors, according to their participation in the total sectors emissions in the carbon
market.
Chart 1- Characteristics and specifications of the policy scenarios
Scenario I Scenario II
Policy Mandatory emission reduction standard
(CAP)
Emissions Limit via Carbon Market
(CAP-AND-TRADE)
Phase I 2016-2020 2016-2020
Sectors Cement, lime, cellulose and paper,
aluminum, pig iron and steel.
Cement, lime, cellulose and paper,
aluminum, pig iron and steel.
Target 5 % reduction in projected emissions from
2016 to 2020
5 % reduction in projected emissions from
2016 to 2020
Phase II 2021-2030 2021-2030
Sectors
Cement, lime, cellulose and paper,
aluminum, pig iron, steel, chemicals, oil
exploration and refining and natural gas.
Cement, lime, cellulose and paper,
aluminum, pig iron, steel, chemicals, oil
exploration and refining and natural gas.
Target 10 % reduction in projected emissions
from 2021 to 2030
10 % reduction in projected emissions
from 2021 to 2030
Source: Own elaboration
8http://www.brasil.gov.br/noticias/arquivos/2012/06/25/planos-setoriais-de-mitigacao-e-adaptacao-a-mudanca-do-
clima-em-consulta-publica. 9The reduction goal of the first phase was based on the Industry Plan.

28
Table 3 - Total emissions (fuels usage and productive process) in 2005 of the sectors covered by
emissions control policies (CAP) and the carbon Market (CAP-AND-TRADE)
Source: own elaboration based on data from the Brazilian Inventory and Energy Balance.
3. Sectoral impacts of mitigation policies
It is expected that the simulated policies would increase production costs over the industrial
activity and the economy as a whole. In general, the main effect of imposition policies of emission
restriction over the included sectors is the increase of the cost of carbon intensive industrial goods,
shifting the marginal cost curves upwards. Intuitively, the extent of this effect will vary according to
the participation of energy or carbon in the production, implying that large energy and fuel users
will be the most intensively affected. The same can be said regarding the goods produced by the
carbon-intensive productive sectors, such as chemical products, iron and steel.
The linking and interdependence of the different sectors of economy, reflected in the use of
inputs in the production process is a determinant element in elucidating the sectoral impacts.
Although the input-output structure is crucial for the results, it is just the starting point to
understand the effect of the emission policies over economy. Another important factor is the degree
of substitutability between the different energy sources (renewable, non-renewable) and the fuels
use. This factor influences the magnitude over which the increase of cost of intensive products in
carbon is transferred to the sectoral production costs. It also includes the effect caused by the
displacement of productive factors that influence sectoral performance. Taking into account these
determinants, Table 4 shows the impacts of the two scenarios over the level of sectoral activity.
Table 4 - Impacts over the level of industrial activity in an emissions limit (CAP) and emission
limit via carbon Market (CAP AND TRADE)-2016 to 2030 (perceptual cumulative deviation
in relation to the baseline scenario in 2030)
Sectors
Scenario
I
Scenario
II
Sectors
Scenario
I
Scenário
II
CAP
CAP-
AND-
TRADE
CAP
CAP-
AND-
TRADE
Oil and Gas -6.51 -3.01 Others Chemicals -0.36 -0.65
Mining -1.73 -1.55 Rubber and Plastic -1.83 -1.96
Others of Mining 0.96 1.31 Cement -10.16 -7.67
Food and Beverage 0.93 0.88 Other Non-Metallic Products -6.80 -6.13
Tobacco Products 0.76 0.72
Steel Manufacturing and
Derivatives -16.84 -17.89
SectorsEmissions (Gg
CO2-e)
Share (%) on
total emissions in
Brazil
Steel Manufacturing and Derivatives 90855 10%
Chemical Products 27565 3%
Cement 19904 2%
Oil and Gas 19111 2%
Oil Refining 17676 2%
Other Non-Metallic Products 13185 1%
Non-Ferrous Metals 7258 1%
Cellulose and Paper 4470 1%
Total Emissions (CAP Sectors) 200024 23%
Total Sectors Emissions 883048 100%

28
Textiles 0.92 0.88 Non-Ferrous Metals -4.32 -5.73
Clothing 1.12 0.94 Metal Products -4.58 -4.53
Leather and Footwear 1.30 1.11 Machinery and Equipment -7.37 -7.85
Wood Products -0.94 -0.71 Appliances -4.89 -5.55
Cellulose and Paper -1.25 -2.11 Office and Computers -1.94 -1.60
Journals and
Magazines 0.46 0.26 Electrical Equipment -2.20 -2.03
Oil Refining -7.91 -5.22 Electronic Material -1.47 -1.30
Alcohol 1.03 0.75 Medical Advices -0.54 -0.62
Chemicals Products -5.28 -7.60 Automobile and Utilities -7.45 -8.10
Resin and Spandex -1.74 -2.37 Trucks and Buses -4.92 -5.12
Pharmaceutical
Products 0.61 0.47 Parts for Motor Vehicles -5.12 -5.42
Pesticides 0.69 0.68 Transport Equipment -3.65 -3.89
Perfumery and Others 0.51 0.27 Others Industries -1.29 -1.50
Paints and Others -2.19 -2.09
Source: own elaboration based on the simulations results with the BeGreen model.
Once again it’s worth emphasizing that the sectors have positive growth in the baseline
scenario, so the negative impact results shown in the table are relative reductions to this scenario
and, because of that, they shouldn’t be read as absolute decreases in the activity level. The impact of
the policies is very different between sectors. The most direct impact over the activity level happens
in the industrial sectors taking part of the policies. Steel manufacture and derivatives, cement, oil
refining, oil and gas, other non-metallic products, chemical products, cellulose and paper have
larger decreases in production.
The increase of costs in the carbon-intensive sectors and in its consequent investment drop
can elucidate these results. The results are also heterogeneous when comparing CAP and
CAP-AND-TRADE scenarios. Sectors such as cement, oil and gas and oil refining would have less
intense losses due to the carbon market policy. On the other hand, sectors such as steel
manufacturing and derivatives and chemical products have more pronounced drops with the carbon
market than the emissions limit without trading. These results will be more detailed later on, where
the results of sectoral costs and trade permissions between sectors are shown.
Indirectly, via interconnections of the productive chain, other sectors are also affected
negatively, due to the decline in production of the interlinked sectors. In this case, sectors such as
automobiles and utilities, machinery and equipment, trucks and buses and appliances are good
examples. Light manufacturing sectors (Food and beverages, textiles, clothing, leather and
footwear) are not affected by the policy and even present growth in the activity level in both
scenarios.
As mentioned above, the policy impacts over the sectoral costs (Table 5) help to explain the
verified effects over the sectoral activity level.
Table 5 - Impacts over the sectoral production cost of an emission limit (CAP) and emission
limits scenarios via carbon market (CAP-AND-TRADE) - 2016 to 2030 (perceptual
cumulative deviation in relation to the baseline scenario in 2030)
Sectors
Scenario
I
Scenario
II
Sectors
Scenario
I
Scenário
II
CAP
CAP-
AND-
TRADE
CAP
CAP-
AND-
TRADE
Oil and Gas -1.80 -2.81 Others Chemicals -1.25 -1.03

28
Mining -3.82 -4.37 Rubber and Plastic -0.80 -0.59
Others of Mining -0.66 -0.95 Cement 64.63 34.25
Food and Beverage -1.77 -2.02 Other Non-Metallic Products 19.01 14.62
Tobacco Products -1.12 -1.20
Steel Manufacturing and
Derivatives 46.13 50.21
Textiles -1.63 -1.89 Non-Ferrous Metals 0.61 3.19
Clothing -2.65 -2.95 Metal Products 4.70 5.80
Leather and Footwear -2.62 -2.66 Machinery and Equipment 5.80 6.77
Wood Products -2.76 -3.09 Appliances 7.50 8.14
Cellulose and Paper 1.65 3.39 Office and Computers -1.90 -2.12
Journals and
Magazines -2.76 -2.73 Electrical Equipment 1.24 1.24
Oil Refining 17.30 8.88 Electronic Material -0.55 -0.74
Alcohol 2.75 2.36 Medical Advices -1.88 -2.02
Chemicals Products 8.18 12.57 Automobile and Utilities 4.27 4.60
Resin and Spandex 0.98 2.04 Trucks and Buses 2.91 3.27
Pharmaceutical
Products -1.90 -2.13 Parts for Motor Vehicles 6.43 7.19
Pesticides 0.02 0.41 Transport Equipment 3.22 3.42
Perfumery and Others -1.18 -1.19 Others Industries -0.56 -0.49
Paints and Others -0.53 -0.63
Source: own elaboration based on the simulations results with the BeGreen model
In fact, the sectors’ production costs increase, as they need to take into account the cost of
GHG emission and that impacts the production level in each sector. As it can be seen in the table,
the emission limit (CAP) imposes meaningful production costs for the selected industrial sectors in
the policies, especially on steel manufacturing and derivatives and cement. In the case of the cement
sector, a net permissions purchaser (this result will be shown later on), it is less expensive to buy
emissions in the carbon market than facing with emissions abatement costs in a CAP scenario
without commercialization. This way, for sectors with marginal cost curve in higher emission
reductions, participation in a carbon market could be beneficial compared to the imposition of a
standard or emission reduction limit. Besides the cement sector, oil and gas, oil refining and other
non-metallic products are included in this category.
This result shows the importance of sectoral considerations and the design of mechanisms in
the formulation of mitigation policies. The CAP scenario makes productions costs more expensive
for important sectors in the investment composition (cement, steel, non-metallic) and relatively
benefits consumer goods sectors (textiles, clothing and footwear). The higher cost of investments
weakens growth possibilities in the economy and capital accumulation. The CAP-AND-TRADE
scenario can achieve the same emission reduction goals with less adverse effects.
The carbon market results on industrial sectors (scenario II) can be better analyzed in Table
6. We can see the emission reduction by sector in each phase, emissions and permissions in
diagrams of CO2-e and the sectors permit trading. The last two columns are related to the revenue
with the permission trading and its participation over the production value for each sector in the end
of each phase.
Given a carbon price, set by CAP in all sectors, the sector maximizes its production
choosing how much it is going to reduce its emissions. That reduction depends on that price and the
emissions abatement marginal cost in the sector (which is related to the production function, inputs
use, emissions, among other factors). If the sector will be a permission seller that means its
abatement cost is lower, vis-à-vis a buyer whose reductions cost would be higher.
In the first phase of the policy (2016-2020), for example, steel manufacturing and
derivatives, followed by cement, would be the sectors set as permission buyers. That indicates that

28
the abatement marginal cost for these sectors is higher than the price of carbon market, making it
more efficient to buy permissions, reducing the emissions under the set goal. The opposite is valid
for cellulose and paper, other non-metallic mineral products and non-ferrous metals.
An interesting result is, in the second phase of the policy, with an extension of the market to
more than three sectors, that steel manufacturing and derivatives would turn out to be a permissions
net seller. That suggests that with the entrance of sectors with higher abatement costs (oil and gas,
oil refining), and consequently, higher carbon prices, abatement cost for the sectors becomes lower
than the permissions price in the market.
Regarding the revenue (or expenses) coming from permissions sale and purchase in the
carbon market in general, the results point out that their participation on the sectoral production
value are relatively low, indicating that the permissions sale or purchase has a marginal effect over
the sectors production decisions.

28
Table 6 - Emissions limit policy results via carbon market over industrial sectors (emission perceptual variation) (cumulated
deviation in the end of each phase in relation to the baseline scenario)
Phases
of
Carbon
Market
Policy
in
Brazil
Sectors
Emissions
Reduction
with CAP-
AND-
TRADE
(% change)
Initial
Emissions
(Gg CO2-
e)
Permissions
(Gg CO2-e)
Emissions
Reduction
(Gg CO2-
e)
Permissions
Trade
(Gg CO2-e)
Permissions
Trade
Revenue
(millions of
R$)*
Permissions
Trade
Revenue (%
change of the
sectoral
production
value)***
1ª phase
- 2016-
2020
(Target
= 5 %)
Cellulose and Paper -7.6 6576 329 501 173 58 0.03
Cement -4.9 33173 1659 1619 -39 -12 -0.04
Other Non-Metallic Products -6.8 16473 824 1132 308 104 0.10
Steel Manufacturing and Derivatives -4.2 106902 5345 4518 -827 -280 -0.12
Non-Ferrous Metals -9.4 8761 438 824 386 130 0.13
2ª phase
- 2021-
2030
(Target
= 10 %)
Cellulose and Paper -11.0 7539 754 828 74 159 0.08
Cement -7.1 41370 4137 2910 -1227 -2589 -3.02
Other Non-Metallic Products -9.2 19748 1975 1778 -197 -410 -0.15
Steel Manufacturing and Derivatives -11.7 127206 12721 14777 2056 4321 0.71
Non-Ferrous Metals -12.0 10045 1004 1160 156 330 0.15
Oil and Gas -5.3 38136 3814 1996 -1817 -3836 -0.49
Oil Refining -8.2 29068 2907 2331 -575 -1218 -0.10
Chemical Products -14.6 34280 3428 4959 1531 3247 0.63
*accumulated revenue in the end of each phase
**revenue participation over the production value in the end of each phase
Source: own elaboration based on simulation results with the BeGreen model

28
3.1 Impacts of mitigation policies: macroeconomic effects
A way to assess the mitigation policies cost is to analyze the production losses, consumption,
exports and investments, since imposing targets to the emissions and carbon markets imply an adjustment
of the economy towards inputs reallocation and productive processes. As the sectoral production
technology is given (no technological progress occurs due to the policy) necessarily the mitigation
policies increase production costs in the economy, despite certain capacity of the sectors to reallocate
inputs and productive factors.
Table 7 shows the aggregated results of emissions indicators for the policy scenarios I and II. The
numbers represent a cumulated percentage deviation (from 2016 to 2030) relative to the baseline
scenario. The real GDP reduction over all scenarios is not surprising. A control policy over emissions in
the most relevant industrial sectors in terms of emissions, for instance, could result in a cumulative
decrease of GDP in relation to the baseline scenario of -1,06 % in 2030. It is worth reminding that this
result represents a reduction related to the baseline scenario in 2030; therefore, it is not an absolute drop
of GDP. In other words, that means that the GDP growth would go from 4.00 % per year to nearly 3.92 %
on average by 2030, considering the emission policy.
However, if the emission target is reached via carbon market among sectors, the costs on GDP
terms would be lower. In that case, the GDP would present a -0.9 % cumulative reduction in 2030, a
reduction with an impact of 0.12 percentage points, which would be equivalent to R$ 270 billion. That is
an important result, derived from the highest efficiency of the carbon market, according to literature. In
that way, there is a gain of economic efficiency when the carbon market is established.
Table 7 - Macroeconomic impacts of a emission limits (CAP) and emission limits via carbon market
(CAP-AND-TRADE) over Brazilian economy - 2016 to 2030 (cumulative percentage deviation in
relation to the baseline scenario in 2030)
Source: own elaboration based on the simulation results with the BeGreen model.
The GDP drop in both scenarios is associated with household consumption behavior, investment and
exports. Reduction in household consumption is a result of the negative income effect, because of the
economic activity drop. The investment reduction is linked to the investment costs increase and the lower
need for capital expansion. This result can be related to the decline in the profitability of primary factors,
Scenario I Scenario II
CAPCAP-AND-
TRADE
GDP -1.06 -0.94
Investment -2.99 -2.52
Household Consumption -0.58 -0.52
Exports -2.67 -2.8
Imports -0.52 -0.86
Exports Price Index 2.57 2.74
Total Variation of Emissions -3.87 -3.66
Agricultura 0.47 0.54
Energy Use (fuels) -5.97 -5.74
Generation and Distribution
of Electricity 2.12 1.89
Industry Sectors -10.54 -10.86
Transport Sector -1.21 -1.37
Others Sectores -5.23 -3.03
Industry Processes -11.39 -10.72
Variable

28
particularly of the capital. It is reasonable to have the profitability drop of primary factors as an effect, because
of the reduction in the demand for those factors caused by the reduction of the economic activity10
. Declines
in primary factors profitability indicate that the incidence of carbon pricing is not integrally passed to the final
consumers, being partially absorbed by the factors prices. The table shows that the investment reduction is
better in the carbon market scenario, given the higher efficiency of this scenario over the sectors participating
in the market.
Exports would also present a negative impact because of the loss of competitiveness of national
products. That drop is caused by the effect of price, due to the increase in production costs, since exports vary
inversely to domestic prices. In the case of imports, results show a cumulative drop in 2030. With economic
activity drop over the years, there is a reduction in domestic prices, which, along with the simultaneous drop
in GDP, implies reduction in imports. However, since imports reduce less than GDP, there is a substitution of
domestic goods for imported ones, even though this effect is small.
Regarding total emissions (Table 7), there is a percent decrease in both scenarios of around 3.5 times
the GDP reduction. The impact on emissions would be around -3.87 % and -3.66 %, respectively, for
scenarios I and II. However, sectoral reductions are heterogeneous. Emissions linked to industrial sectors are
the ones with greatest reduction because they are the target sectors for both scenarios. The sectors of
agriculture and electric power generation and distribution have elevated emissions, which features a carbon
leakage effect (emission leakage). The trajectory of emissions over the entire period of the two policies (2016-
2030) can be seen in Figure 3, as well as the carbon price behavior in the Cap-and-Trade Scenario.
Even though the difference in emissions reduction between the scenarios is small, we can observe
that the trajectories are different in the second phase of the carbon policies, when reduction goal increases
from 5 % to 10 %. From that point, the CAP scenario reduction is marginally higher than the CAP-AND-
TRADE scenario reduction.
Figure 3 - Trajectory of emissions growth in both policies scenarios and trajectory of carbon price
in CAP-AND-TRADE scenario
Source: own elaboration based on the simulation resources with the BeGreen model.
The carbon price in the market of the CAP-AND-TRADE policy is an indicator of the marginal
cost of emissions reduction in all the sectors. Progressive targets of emission reductions until 2030 imply
a growing escalation of carbon prices when there is trade via permissions carbon market. The expansion
of sectors in phase II implies a certain inflexion of the carbon price since 2021, suggesting an increase in
marginal costs in emissions reduction with an expansion in industrial sectors and also the target of goals
reduction. The prices started as R$ 50 per CO2-eq ton. and can reach R$ 338 in 2030, given more
ambitious emission reduction goals and the sectors participation with higher emission abatement cost. It
is worthy of note that these higher carbon prices are justified by the fact of encompassing only industrial
sectors, not including agriculture and livestock that would tend to reduce considerably the carbon price in
the market, given its lower reduction cost.
10
Land profitability decreases more sharply, due to the simulation hypothesis in which the land supply is fixed.

28
4. CONCLUSIONS
This paper intended to contribute to the studies of GHG emission reduction policies in Brazil. The
focus is on policies with market mechanisms, which are believed to have the lowest costs of GHG
emissions reductions. Since GHG emissions in Brazil are greatly focused in the use of energy (fossil
fuels) and in industrial activity, as shown by 2010 emissions data, it becomes important to study the
impact of the mitigation policies on the industry.
A recent (2012) Brazilian industrial policy has proposed cleaner production goals, implying energy
efficiency (less energy per unit of product), which direct and indirectly goes in the same way as the GHG
emission reduction. These incentives can increase the impact of emission reduction or carbon market policies,
because they tend to encourage innovation and efficiency in the use of GHG emmiting fuels. The results
presented in our simulations can help unveil the industrial sectors where technological innovation aimed at
reducing emissions should be addressed, such as cement, steelworks, non-metallic products, oil refining and
chemical.
The carbon market estimations showed to be cost-effective: it achieved the same emission
reduction with a lower cost of economic activity loss. In monetary terms, related to the goal imposition
policy without trade, the carbon market would avoid the loss of R$270 billion in economic activity
between 2016 and 2030, equivalent to 6.2 % of the Brazilian GDP in 2012.
REFERENCES
ABARE. The Megabare Model: Interim Documentation. Australian Bureau of Agricultural and Resource
Economics.Canberra, 1996, 71 p.
ADAMS, P. D.; HORRIDGE, M.; PARMENTER, B. R. MMRF-GREEN: A Dynamic, Multi-sectoral, Multi-
regional Model of Australia. Australia: Monash University, Centre of Policy Studies, Impact Project, 2000.
AL-MIN, A. Q.; JAAFAR, A. H.; SIWAR, C. Climate Change Mitigation and Policy Concern for
Prioritization. International Journal of Climate Change Strategies and Management, vol. 2, n. 4, pp. 418-425,
2010.
Brasil. Ministério da Ciência e Tecnologia. SegundoInventário Brasileiro das Emissões Antrópicas por
Fontes e Remoções por Sumidouros de Gases Efeito Estufa não Controlados pelo Protocolo de Montreal
INERAGEE, 2010. (Disponível em: http://www.mct.gov.br/index.php/content/view/310922.html)
BRIGHT, S. Carbon Reduction and Commercial Leases in the UK. International Journal of Law in the
Built environment, vol. 2, n.3, pp. 218-231, 2010.
DIXON, P. B.; PARMENTER B. R.; SUTTON, J. M.; VINCENT D. P. ORANI: A Multisectoral Model of
the Australian Economy. Amsterdam: North-Holland, 1982.
FEIJO, F. T.; PORTO Jr., Protocolo de Quioto e o Bem Estar Econômico no Brasil Uma Análise Utilizando
Equilíbrio Geral Computável. Análise Econômica (UFRGS), v.51, p. 127-154, 2009.
FERREIRA FILHO, J. B. S.; ROCHA, M. T. Avaliação econômica de políticas públicas visando redução das
emissões de gases de efeito estufa no Brasil. In: CONGRESSO DA SOCIEDADE BRASILEIRA DE
ECONOMIA E SOCIOLOGIA RURAL, 45., 2007, Londrina. Anais ... Londrina: SOBER, 2007.
GREGORIOU, A., HEALY, J.; SAVVIDES, N. Market Efficiency and the basis in the European Union
Emissions Trading Scheme: new evidence from non linear mean reverting unit root tests. Journal of
Economic Studies, vol. 41, n. 4, pp. 615-628, 2014.
GRUBB, M., NEUHOFF K. Allocation and competitiveness in the EU emissions trading scheme: policy
overview. ClimatePolicy 6, 2006, pp.7–30.
GURGEL, A. C. Impactos da economia mundial de baixo carbono sobre o brasil. Anais da ANPEC, 2012.
28
HAHN, R. W.; STAVINS, R. N.What Has the Kyoto Protocol Wrought? The Real Architecture of
International Tradable Permit Markets. Washington, D.C.: American Enterprise Institute Press, 1999.
HANOCH, G. CRESH production functions. Econometrica. USA, v. 39, n. 5, p. 695–712, 1971.
HEPBURN, C. Regulating by prices, quantities or both: an update and an overview.Oxford
ReviewofEconomicPolicy, v.22, p.226–247, 2006.
HINCHY, M.; HANSLOW, K.The MEGABARE model:interim documentation. Australian Bureau of
Agricultural and Resource Economics, 1996.Disponívelem: < http://www.abareconomics.com>.
LIMA, E. M. C. Impactos de políticas climáticas internacionais sobre a economia brasileira. 2011. 151p.
Dissertação (Mestrado em Economia Aplicada) – Faculdade de Economia, Administração e Contabilidade de
Ribeirão Preto, Universidade de São Paulo, Ribeirão Preto, 2011.
MACE, M.J., MILLAR, I., SCHWARTE, C., ANDERSON, J., BROEKHOFF, D., BRADLEY, R.,
BOWYER, C., HEILMAYR, R. Analysis of legal and organisational issues arising in linking the EU
Emissions Trading Scheme to other existing and emerging emissions trading schemes. London, Brussels,
Washington, DC: Foundation for International Environmental Law and Development, Institute for
European Environmental Policy, World Resources Institut, 2008.
Ministério do Desenvolvimento, Indústria e Comércio Exterior (MDIC). Plano setorial de mitigação e
adaptação à mudança do clima para a consolidação de uma economia de baixa emissão de carbono na
indústria de transformação. Brasília, jun. 2013.
PEREIRA, A. S.; MAY, P.H. Economia do Aquecimento Global. In: MAY, P. H.; LUSTOSA, M. C.;
VINHA, V. Economia do Meio Ambiente: Teoria e Prática. Rio de Janeiro: Elsevier, 2003, pp. 219-244.
PETER, W. W. HORRIDGE, M.; MEGUER, G.A. NAVQUI, F.; PARMENTER, B. R. The
theoreticalstructureof MONASH-MRF. Cayton: Center of Policy Studies, 1996. 121 p. (Preliminary working
paper, OP-85).Disponível em: http://www.monash.edu.au/polycy. Acesso em: 12 jul. 2010.
SILVA, J. G; GURGEL, A. C. Impactos econômicos de cenários de políticas climáticas para o Brasil.
Pesquisa e PlanejamentoEconômico, v. 42, n. 1, 2012.
TOURINHO, O. A. F.; da MOTTA, R. S.; ALVES, Y. L. B. Uma aplicação ambiental de um modelo de
equílibrio geral. IPEA. Texto para discussão n. 976, Rio de Janeiro, 2003. Disponível em:
(http://www.ipea.gov.br/pub/td/2003/td_0976.pdfp)
WEYANT, J. (Ed.) The Costs of the Kyoto Protocol: A Multi-Model Evaluation, Energy Journal
(Special Issue), 1999.
WING I. S. Computable General Equilibrium Models and Their Use in Economy-WidePolicy Analysis. The
MIT Joint Program on the Science and Policy of Global Change, Technical note N 6, 2004.