policies for climate action in industries and products
TRANSCRIPT

JULY 2016
ETIENNE KECHICHIANALEXIOS PANTELIASARI REEVESGUY HENLEYJIEMEI LIU
PARTNERS IN COLLABORATION WITH
A GREENER PATH TO COMPETITIVENESSPOLICIES FORCLIMATE ACTION ININDUSTRIES AND PRODUCTS
www.worldbank.org
A G
REEN
ER PATH
TO C
OM
PETITIVEN
ESS PO
LICIES
FOR
CLIM
ATE A
CT
ION
IN IN
DU
ST
RIES
AN
D PR
OD
UC
TSJU
LY 20
16

A Greener Path to Competitiveness Policies for Climate Action in Industries and Products
©2016 The World Bank Group1818 H Street NWWashington, DC 20433Telephone : 202-473-1000Internet : www.worldbank.org
All rights reserved.
This volume is a product of the staff of the World Bank Group. The World Bank Group refers to the member institutions of the World Bank Group: The World Bank (International Bank for Reconstruction and Development); International Finance Corporation (IFC); and Multilateral Investment Guarantee Agency (MIGA), which are separate and distinct legal entities each organized under its respective Articles of Agreement. We encourage use for educational and non-commercial purposes.
The findings, interpretations, and conclusions expressed in this volume do not necessarily reflect the views of the Directors or Executive Directors of the respective institutions of the World Bank Group or the governments they represent. The World Bank Group does not guarantee the accuracy of the data included in this work.
Rights and PermissionsThe material in this publication is copyrighted. Copying and/or transmitting portions or all of this work without permission may be a violation of applicable law. The World Bank encourages dissemination of its work and will normally grant permission to reproduce portions of the work promptly.
For permission to photocopy or reprint any part of this work, please send a request with complete information to the Copyright Clearance Center Inc., 222 Rosewood Drive, Danvers, MA 01923, USA; telephone: 978-750-8400; fax: 978-750-4470; Internet: www.copyright.com.
All other queries on rights and licenses, including subsidiary rights, should be addressed to the Office of the Publisher, The World Bank Group, 1818 H Street NW, Washington, DC 20433, USA; fax: 202-522-2422;E-mail: [email protected].
Photo Credits
07 Maciej Noskowski
20 Hramovnick
25 Acnakelsy
29 JazzIRT
33 Jordachelr
36 Etienne Kechichian
37 Muzaffer Akarca
89 Aniaostudio
101 Moreno Soppelsa
115 Baloncici
118 SlobodanMilijevic
123 tvierimaa

A Greener Path to Competitiveness Policies for Climate Action in Industries and Products
AcknowledgmentsAbbreviationsExecutive SummaryIntroductionCompetitiveness and Climate ChangeEmissions and GrowthDefining Competitiveness
Part 1 Competitiveness and Climate Action for Industrial OperationsIntroduction EmissionsBreakdown of Industrial EmissionsOverview of Industry Energy Consumption by Fuel TypeCompetitionCompetiveness of the Iron and Steel, Cement, Chemical, and Aluminum SectorsThe Challenges in Industrial Competitiveness and Environmental ActionInterventionsEnergy Efficiency ImprovementsLow-Carbon Substitutes for Feedstock and FuelsAlternative and Innovative ProcessesSectorwide InterventionsExamples of GHG Improvements across Industrial SectorsBarriers and DriversPathway for Technology DeploymentLow-Carbon Technologies’ Role in Company CompetitivenessRecommendationsActions to Decrease GHG Emissions and Maintain Competitiveness through Technology AdoptionDialogue and Collaboration to Achieve Successful Outcomes at Marrakesh and BeyondCase Study 1 RUSAL Aluminum Production: Tackling Climate Change through Technology InterventionsCase Study 2 Energy Efficiency at LG Chem: Reducing GHG Emissions across the Republic of Korea’s Chemical Industry
Part 2 Scaling Climate Action and Competitiveness through Energy Efficient ProductsIntroductionA Brief History of Energy Efficiency Standards and Labeling PolicyGHG Emissions Reductions and Energy Impacts of S&L PoliciesThe Impact of S&L on Manufacturing CompetitivenessLightingGlobal Overview of Current Lighting S&L PolicyHistorical Energy Efficiency and Consumer Price TrendsChina - S&L Policies for Compact Fluorescent Lamps Space CoolingGlobal Overview of Current S&L Space Cooling PolicyHistorical Energy Efficiency and Consumer Price TrendsIndia - S&L Policies for Air Conditioners Major Home AppliancesGlobal Overview of Current S&L Home Appliance PolicyHistorical Energy Efficiency and Consumer Price Trends The United States - Manufacturers’ Tax Credits Switzerland - Heat Pump Clothes Dryer Mexico - Regional Harmonization of Refrigerator Standards Industrial EquipmentGlobal Overview of Current S&L Industrial Equipment PolicyHistorical Energy Efficiency and Consumer Price TrendsThe U.S. Department of Energy and Negotiated RulemakingSiemens and New Electric MotorsRecommendations for Promoting Competitiveness with S&LReferences
04050612121415
18181821222529395254555556586263646767697072
74747478808585878891929395100105 106108113115118119120121124125126
TABLE OF CONTENTS

A Greener Path to Competitiveness Policies for Climate Action in Industries and Products
2
BoxesI.1 Key GHG-Emitting Sectors1.1 Competitive Dynamics of the Steel Market1.2 Key Structural Changes to the Aluminum Sector1.3 Production and GHG Decoupling across the EU Chemical Sector1.4 Best Available Technologies1.5 Gaining Acceptance for Low-Carbon Cements1.6 Iron and Steel GHG Reduction1.7 Cement GHG Reduction1.8 Chemicals GHG Reduction1.9 Aluminum GHG Reduction1.10 Short-Term Volatility in Energy and Commodity Prices Deters Low-Carbon Technology Investment1.11 Finding the Right Balance between Regulation and Technology Support1.12 Examples of Driving Change Industrial though Collaboration
FiguresES.1 The Impact of Interventions on CompetitivenessES.2. Greenhouse Gas Emissions Reductions in 2030 from Product Efficiency PoliciesI.1 Global GHG Emissions by Sector, 1970–20101.1 Final Energy Consumption by Sector, 20121.2 Industrial Emissions, 1970–20101.3 Main Fuel Sources for the Iron and Steel, Cement, Aluminum, and Chemical Industries (2012)1.4 Realized and Unrealized Energy Efficiency Potential1.5 UNIDO’s Ranking of Countries’ Industrial Competitiveness1.6 Tangible and Intangible Factors of Competitiveness1.7 Steel-Making Processes and the Associated Low-Carbon Interventions1.8 Global Crude Steel Production1.9 Crude Steel Regional Production, 2015B1.1.1 World Crude Steel Capacity (nominal) and DemandB1.1.2 Indexed Global Energy Consumption per Ton of Crude Steel Production1.10 Cement-making Process and Associated Low-carbon Interventions1.11 Global Cement Production1.12 World Cement Production 2014, by Region and Main Countries1.13 Regional Chemical Sales1.14 Regional Growth in Chemical Production1.15 Process of Aluminum Production1.16 Regional Primary Aluminum Production1.17 Global Annual Primary Aluminum ProductionB1.2.1 Focus of Primary Energy across the Aluminum SectorB1.3.1 Decoupling of GHG and ProductionB1.3.2 Energy Intensity of EU Chemical Production1.18 Countries That Have or Are looking to Implement a Carbon Tax or ETS and Linkage Occurring between Different Schemes1.19 Sectors Covered Emission Trading Schemes1.20 California Assessment of Carbon Leakage Risk1.21 Risk of Carbon Leakage across EU Industry in 20101.22 Steps to Improve Emission Trading Schemes1.23 Energy Maturity Model1.24 An Example of Industrial Symbiosis in DenmarkB1.10.1 Commodity Price IndicesB1.10.2 Brent Price Prospects 1.25 Potential Carbon Abatement Potential across the Cement Sector by 20501.26 The Impact of Interventions on Competitiveness1.27 Impact of Interventions on Abatement Potential, Timeframe, and CostCS1.1.1 The Khakas Aluminum Smelter is the most up-to-date and Technologically Advanced Smelter in RussiaCS1.1.2 “Boges,” RUSAL’s new Boguchansky Aluminum Smelter, will be the main consumer of Electricity Generated by Boguchanskaya Hydropower PlantCS1.2.1 Energy Efficiency in Cracked FurnaceCS1.2.2 New insolation technology, Aerogel adoption2.1 Examples of Energy Labels
14333940555658596061636769
0810141919222426283132323333343535363637383839404042
464848515457636364656671
71
727374

3
A Greener Path to Competitiveness Policies for Climate Action in Industries and Products
2.2 The Uptake of S&L Programs and Policies2.3 Total Number of S&L Policies in Effect by Type, 20152.4 Number of Standards and Labeling Policies around the Globe, by Country2.5 Greenhouse Gas Emissions Reductions in 2030 from Product Efficiency Policies2.6 LED Sales as a Percentage of All Sales of Domestic Lamps2.7 The Uptake of Lighting S&L Policies Worldwide2.8 Historical and Predicted Efficiency of Light Sources2.9 Number of Lamps Sold in China by Type, 2005–122.10 Annual Energy Saving Lamp Production and Export in China, 1996–20122.11 Annual Sales of Air Conditioners and Cooling Fans in India2.12 Global Production of Nonducted Air Conditioners2.13 The Uptake of Space Cooling S&L Policies2.14 The Relationship between Seasonal Energy Efficiency Ratio (SEER) and the Adjustable Consumer Price Index for ACs in the United States between 1990 and 20102.15 The Relationship between Cooling Coefficient of Performance (COP) and the Consumer Price Index for Room ACs in Japan between 1990 and 20102.16 Room Air Conditioner Sales in India, 2006–142.17 Indian Market Share of AC Products Rated One to Five Stars, 2008–142.18 Voltas Used Its Energy Efficient ACs as a Key Differentiator to Gain Market Share in India2.19 Annual AC Sales of Leading Brands (Voltas, LG, and Samsung) between 2005 and 2015 in India2.20 Godrej’s AC Models Registered with BEE in Its S&L Database2.21 Annual Sales of Major Appliances Worldwide, 2001–142.22 Expected Appliance Market Growth, 2014–192.23 Global Production of Home Appliances2.24 The Uptake of Home Appliance S&L Policies2.25 Household Ownership of Refrigerator-Freezers in Three Countries2.26 Increase in Household Appliance Energy Efficiency, 1980–20082.27 Refrigerator Energy Use, Volume, and Retail Price, 1987–20102.28 Annual Rate of Decline of Median, Feature-Adjusted Refrigerator Energy Use2.29 Units Eligible for Appliance Manufacturers’ Tax Credit, 2008–92.30 Market Transformation of Refrigerators and Clothes Washers, 2000–20152.31.1 Whirlpool Yearly Tax Credits2.32 Clothes Dryer Sales in Switzerland by Energy Label Category2.33 The Import of Refrigerators from Mexico to the United States, 2002–142.34 S&L Policies for Motors and Transformers2.35 Market Share of Efficiency Classes in the United States, 2001–62.36 Market Share of Efficiency Classes in Europe under the CEMEP Voluntary Agreement2.37 Marketing Materials from Siemens Presenting New, Efficient Motors
TablesES.1 Industry Climate Action Matrix: Operations and OutputsI.2 Definitions of Competitiveness1.1 The World’s Highest-Emitting Industries1.2 Drivers of Competitiveness across Four Industrial Sectors1.3 Examples of Technological Solutions, by Category and IndustryCS1.2.1 Comparison of LG Chem to Competitors2.1 Examples of Diverse Savings within Different Jurisdictions2.2 Profile of Competitiveness Indicators2.3 List of Cases Examined2.4 Cumulative Energy and CO2 Savings through 2030 from Recent Lighting Standards in the United States2.5 Energy and CO2 Targets for PILESLAMP Project2.6 Energy Performance Standard for Room ACs (Minisplit) in India2.7 Summary of U.S. Manufacturer’s Tax Credits2.8 Mexican MEPS (NOMs) Schedule for Refrigerators and Freezers
75757679858687909091929394
94
95979899100100102104105106107107108110111112114117119120121124
13172130537378 82 84 87
89 96 109 116

A Greener Path to Competitiveness Policies for Climate Action in Industries and Products
4
This report was written by a team led by Etienne Kechichian and Alexios Pantelias and comprising Ari Reeves, Guy Henley, and Jiemei Liu. Contributions were made by Amit Khare, Jennifer Corry Smith, Yang Yu, and Naz Beykan.
This report benefited from extensive discussions and inputs from the expert group comprising Eric Bush, Thom Catania, Jennifer Cleary, Lloyd Harrington, Soren Heitmann, Shane Holt, Stuart Jeffcott, Jim McMahon, Kevin Messner, Alison lp, Michael Scholand, Melanie Slade, Kavita Surana, Tanmay Tathagat, Margaret Taylor, Marcus Wagner, Paul Waide, and Andrew Johnson. Case studies were drafted with essential support from Inchul Hwang and Koojung Mo from the Korea Energy Agency (KEA). Zhuo Zhang at China Association of Lighting Industry (CALI), Niko Kavakiotis at Siemens, Vera Kurochkina at UC RUSAL, and the Energy-Climate Team at LG Chem.
Guidance was provided by the book’s peer reviewers. Internal peer reviewers include Pepukaye Bardouille, Michael Ehst, Emmanuel Pouliquen, Jonathan Coony, Massimiliano Santini, Han-koo Yeo, Thomas Michael Kerr, Ivan Rossignol, Paulo Guilherme Correa, Nidal Nouhad Mahmoud, Armando Heilbron, and Stephane Hallegatte. External advisors included Han-koo Yeo, Russell Bishop, and Jigar Shah. The report was carried out under the guidance and direction of Cecilia Sager.
S.D. Williams provided substantive copy editing and the team benefited from the World Bank’s GSDTI English Editing Team. The design and typesetting of the report was carried out by Finar with guidance from Beril Benli.
ACKNOWLEDGEMENTS

5
A Greener Path to Competitiveness Policies for Climate Action in Industries and Products
ACs air conditioners BAT best available technologies BEE Bureau of Energy Efficiency (India)BF blast furnaceBOF basic oxygen furnaceCAGR compound annual growth rate CCS carbon capture and storage CCU carbon capture and utilization CEMEP European Committee of Manufacturers of Electrical Machines and Power Electronics CFL compact fluorescent lamps CGLP China Green Lights Program CHP Combined Heat and Power CO2 carbon dioxide CONAE National Commission on Energy Savings of Mexico DOE Department of Energy (United States)DRI direct reduced iron EAF electric arc furnace EE energy efficiencyEER energy efficiency ratio EES&L energy efficiency standards and labelingEnMS energy management systemESL energy-saving lamp EU ETS EU Emission Trading Scheme GHG greenhouse gas GRIM Government Regulatory Impact Model GWh gigawatt hourHID high-intensity discharge lamps IEC International Electro-technical CommissionINPV industry net present value kWh kilowatt hourLBNL Lawrence Berkeley National Lab LED light-emitting diode MEF modified energy factor MEPS minimum energy performance standards MIA manufacturer impact analysis Mt million tons MMtCO2e million metric tons of carbon dioxide equivalentsMtCO2e metric ton carbon dioxide equivalentNEMA National Electrical Manufacturers Association (North America)OECD Organization for Economic Co-operation and DevelopmentPH Porter HypothesisR&D research and developmentSDG Sustainable Development GoalS&L standards and labeling SEAD super-efficient equipment and appliance deployment SEER seasonal energy efficiency metric tCO2e tons of carbon dioxide equivalentTWh terawatt hourUNIDO United Nations Industrial Development Organization
ABBREVIATIONS

6
A Greener Path to Competitiveness Policies for Climate Action in Industries and Products
The ninth Sustainable Development Goal advises countries to “build resilient infrastructure, promote inclusive and sustainable industrialization and foster innovation.”1 Industry has historically been one of the most important pillars of economic and social development, but traditional resource-intensive and heavily polluting production is no longer sustainable in the face of climate change. If the path of industrial growth is not redirected immediately and effectively, reaching the target set in the 2015 Paris Agreement to “avoid dangerous climate change by limiting global warming to well below 2°C” will become unrealizable.
The good news is that recent practices demonstrate how industry could be a big part of the solution for climate mitigation and inclusive, sustainable development. The unprecedented task presented in Paris to “decarbonize” globally introduces challenges but also enormous opportunities for industries as they seek a greener path to production while remaining globally competitive.
This report helps chart that path to industrial competitiveness through policy and technology interventions that improve industrial operations. At the same time it explores ways that industrial products can become greener through public standards while companies and countries maintain, and even increase, competitiveness. The information is directed toward government leaders, policy makers, and multilateral institutions in the fields of energy, climate mitigation, and sustainable development. The report’s recommendations to policy makers are based on comprehensive case studies and quantitative and qualitative analyses.
EXECUTIVE SUMMARY
1 UNIDO (United Nations Industrial Development Organization). 2015. “SDG Goal 9: Industry, Innovation and Infrastructure.” New York: UNIDO. https://isid.unido.org/goal9.html.
COMPETITIVENESS AND CLIMATE ACTION FOR INDUSTRIAL OPERATIONS
While new technologies can be important parts of industry’s efforts to address climate change, not all options are currently conducive to price competitiveness.
Technology solutions need to be complemented by institutional frameworks and policy options that counter competitive disadvantages.
Some technological interventions face numerous barriers to adoption, both in jurisdictions under environmental regulation and in those that are not. A sound institutional and policy framework that targets long-term prosperity needs to be in place to facilitate and cushion industry upgrades to new technologies.
Given their potential to limit energy costs, implementing energy-efficient technologies and undertaking cost-effective process improvements across industrial manufacturing operations are in industries’ own interests. Various technological decarbonization interventions are already available to industrial managers. Complementary policies will encourage the scaling up of such initiatives and enhancing the outcomes.
Basic energy efficiency interventions can reduce greenhouse gas emissions without damaging a company’s competitiveness.
Best practice solutions already exist. For the most part they involve relatively easy retrofits and have quick paybacks. Newer innovative approaches are also available. While many show promise and appear to be effective, they are generally not yet mature and typically require larger investments with longer paybacks and longer operational shutdown periods. Some may become mainstream solutions while others may not.
Retrofitting existing equipment is essential to decarbonizing the industrial sector, as is integrating best available technologies when building new industrial facilities. It must be noted, however, that installing new technologies alone does not automatically guarantee the largest emission reduction potential-the manner in which they are operated and maintained is crucial to realizing energy efficiencies.

7
A Greener Path to Competitiveness Policies for Climate Action in Industries and Products

8
A Greener Path to Competitiveness Policies for Climate Action in Industries and Products
Many of the interventions that are easiest to implement, and have low capital costs, short payback periods, and low transaction costs relate to energy efficiency. Overall, such interventions are conducive to price competitiveness and can be implemented without the need for stringent policy mechanisms such as a carbon tax or emission trading scheme.
Complex interventions need additional policy actions if they are going to provide a net benefit to business.
The implementation rates of low-carbon technology vary across sectors and regions. There has been good uptake in many Western production facilities, where companies seek to counteract high energy prices and adapt to carbon policies. There is also good implementation across new builds in emerging economies, where companies seek to minimize operational costs from the outset.
High energy and feedstock prices provide an incentive for at least partial adoption of low-carbon technologies, substitutes, and process improvements. Companies that implement such measures reduce the quantity of energy and commodities consumed and enhance their competitive position vis-à-vis companies that do not implement these measures. However, with the low costs of traditional fossil fuels and commodities in the middle of the century’s second decade, the business case for low-carbon technology investment is sometimes difficult to make. In the absence of robust low carbon policy frameworks, such investment is unlikely to be prioritized as a means to improve competiveness unless these costs start to rise.1 Unfortunately; this means that the rate of future carbon reduction is uncertain and unlikely to be at the scale and pace required to meet ambitious carbon reduction targets set in Paris.1 Since 2000, the main trend in commodity and energy prices has been upward. Current low levels are a relatively recent fluctuation.
Technology solutions for decarbonization and modernization across the industrial sector can be categorized broadly in three areas:
1. Energy efficiency improvements2. Low-carbon substitutes, both fuels and material3. Innovative and alternative processes
As summarized in Figure ES.1, these interventions have different impacts on competiveness and would require differing enabling environments for successful uptake.
Figure ES.1 The Impact of Interventions on Competitiveness
Context for successful
implementation
Energy efficiency
Current impact of interventions on competitiveness
Low-carbon substitutes Innovative abatement technologies
- Business as usual- Low margins/high costs
- Early movers- Dependent on price and
availability of substitutes- Extent of Policy Support
- Global carbon policy agreements
- Period of economic growth- Strong innovation support
Low HighExtent of policy support
= positive impact for companies who implement these versus those who do not.
= both positive and negative impacts for companies who implement these versus those who do not (dependent on market and company circumstances).
= negative impact for companies who implement these versus those who do not.

9
A Greener Path to Competitiveness Policies for Climate Action in Industries and Products
There is no single solution to the decarbonization versus competitiveness dichotomy. Diverse entities must develop climate-friendly and competitive approaches that suit their requirements. There is a need to develop a suite of policies that protect against carbon leakage in the short term and simultaneously assist in creating a conducive environment for further implementation. These policies should provide clear signals of support for research and development (R&D) investment that leads toward a greener path.
The business case for low-carbon interventions is based largely on the following:
• The ability to provide quick paybacks • Minimal operational disruption• Cost of the intervention• Access to finance• The cost of current inputs used within operations (for example, energy or aggregates) versus the low
carbon substitutes • A strong and globally implemented carbon policy and limited subsidies for conventional energy• The extent to which competitors around the world are implementing these measures
Complex interventions-for example, carbon abatement interventions-should not be discounted. Although they can be expensive in the short run, innovative abatement technologies will be required to further decarbonize industry in order to meet long-term targets. Efforts to both create the right policy-enabling environment and support innovative R&D are needed in order to reduce costs and facilitate uptake in the short to medium terms.
From a technology and operations perspective, the path to decreasing GHG emissions while maintaining competitiveness is straightforward:
1. Industry should focus on cost-effective energy efficiency options that can be deployed today with short payback periods, low transaction costs, and easy-to-access finance. While many of these options have been implemented by leading companies already, there is still substantial variation in global practice, indicating opportunities for securing some quick wins. Key enablers include the following: • Management/board buy-in on the need to decarbonize is critical. Improved valuation of non-economic
benefits can assist in building the business case. • Implementation support and awareness programs, for example, energy surveys, management system
and communication campaigns can be crucial.
2. Industry, governments, and consumers should focus on enabling those technologies and interventions that are on the cusp of cost-effectiveness. Regulation or procurement policies can signal the direction of demand for a low-carbon products. Making consumer demand visible can encourage solutions currently at the margin of viability. Examples of enabling solutions are standards and labeling, explored in more detail in the next section of the executive summary. Key enablers include the following:
• Specific economic incentives to see through the more complex energy efficiency interventions, for example, concessional energy efficiency finance to reduce payback periods
• Research into methods to reduce the administrative burden to comply with energy and carbon regulations
• Strong labeling schemes and building and construction codes, practices, and standards that support the implementation of novel solutions
• Additional light touch R&D demonstration support may be required to prove survivability and reliability to the market
• Strengthening collaboration and interaction between producers and consumers-there is the need to share visions and pathways for technology development and deployment
• An improved framework for fuel switching and increased recycling• Improved finance solutions, based on greater awareness and certainty of energy payback

10
A Greener Path to Competitiveness Policies for Climate Action in Industries and Products
3. Governments should pursue framework policies such as removing distorting production subsidies or trade tariffs and putting a comprehensive price on carbon. They should also develop technology-incentive programs for solutions that currently have a weak business case-for example, in the adoption of large-scale and capital-intensive carbon abatement technologies. In addition, government should adopt industry decarbonization policies within strategic development plans and harmonize these across jurisdictions. Key enablers include the following: • Policies need to be designed to be conducive with private sector growth. Business has highlighted
the need for strong and clear signals from government, to allow time to respond to policies that may impact the manner in which they traditionally operate. Therefore, political consensus on credible, consistent, longer term policy signals is critically required. This would include strong, consistent, flexible, and globally implemented carbon taxes or cap-and-trade schemes.
• Phase out country level energy subsidies as these impact competiveness and are especially detrimental to the implementation of low carbon interventions.
• Develop Sector specific carbon reduction strategies. Without this, achieving carbon reduction targets will be expensive and potentially unattainable.
• Financial support for R&D investment in early stage products and process innovation can help companies overcome market barriers and increase manufacturers’ and consumers’ confidence in the technologies or resulting products. This will support the business case for breakthrough interventions.
Scaling Competitiveness and Climate Action through Efficient Industrial Products
Energy efficiency standards and labeling (S&L) policies are cost-effective tools for reducing energy usage and GHGs. They also have co-benefits such as reducing peak power demand, saving energy costs for consumers, and, importantly, improving industry competitiveness.
S&L approaches could be preferable tools for policy makers to meet their national climate agenda
Adopting and harmonizing (worldwide) the most stringent MEPS could reduce 9% of the global total energy consumption1 --- The 8,950 TWh saving per annum is equivalent to shutting down 165 coal-fired power plants or getting 132 million cars off the road.
Improving product efficiency to the level of the best technologies available in 2010-across a group of 18 major economies- could achieve emission reduction in the amount of 1.5 Gt CO2e, almost half of all countries’ Nationally Determined Contributions (NDCs). (Figure ES.2.)
1 European Union. 2015. “Savings and Benefits of Global Regulations for Energy Efficient Products: A ‘Cost of non-World’ Study2 NDCs data were sourced from “Aggregate effect of the intended nationally determined contributions: an update” published by UNFCCC, May 2016. Other
data from unpublished analysis conducted by CLASP and LBNL on behalf of the SEAD Initiative.
Figure ES.2. Greenhouse Gas Emission Reduction in 2030 from Product Efficiency Policies (Gt CO2e)
0,52
-1,48
-3,3
Impact of recent policies
Remaining potential
Unit: Gt C02e
NDCs
Sources: UNFCCC and CLASP2 2016.
Business as usual:
45%
59.5 Gt

11
A Greener Path to Competitiveness Policies for Climate Action in Industries and Products
S&L policies spur innovation and unlock new markets.
When countries develop or revise energy efficiency standards, manufacturers must invest in technological innovation to ensure their products meet the standards. Innovation drives the development and commercialization of more efficient products, and this expands existing markets or creates new markets for manufacturers. A concrete example is the case of clothes dryers in Switzerland. S&L policies drove the technology innovation behind heat pump dryers, which are highly efficient in comparison to conventional clothes dryers. An entirely new market for high-efficiency heat pumps was created as a result of aggressive S&L policies, which were complemented by an incentive package that included government procurement, a rebate program, and awareness campaigns. Similarly, the introduction of an energy efficiency label for air conditioners in India unlocked innovation and boosted domestic production of high-efficiency products.
Complementary incentive policies support the implementation of S&L policies.
Procurement programs, rebates, tax credits, and subsidies can help manufacturers offset their R&D costs for new products, and they can create demand for high-efficiency products. Such policies have enabled manufacturers to better compete in domestic markets, as in the case of white goods (large appliance) manufacturers in the United States. Policies encouraged domestic manufacturers to produce highly efficient appliances by awarding tax credits for every unit of efficient product they produced. The market penetration of efficient products increased significantly, and because of the tax credit program, domestic manufacturers were not disadvantaged by the additional cost of making more efficient products.
Harmonizing standards among trading partners can lower transaction costs and promote export growth.
By aligning domestic standards with foreign trade partners, trade barriers can effectively be lowered. Policies directed at manufacturing energy-saving lights in China and standards for refrigerators in Mexico provide examples. In both cases, S&L policies were strengthened to align with those in major foreign markets. Incentives for domestic manufacturers pointed toward higher efficiency, and exports were facilitated.
Dialogue among stakeholders is a key to successful S&L policy development.
Policy makers, manufacturers, and other stakeholders must work together to ensure that S&L policies realize the dual benefits of energy savings and industrial competitiveness. The highly participatory rulemaking processes used in the United States can serve as models. Through dialogue, policy makers can learn what manufacturers need to succeed: access to technical assistance, test laboratories, or loan facilities, for example. Similarly, manufacturers can better understand what policy makers are trying to achieve and how quickly, and use this knowledge to plan and market accordingly.
It has become clear that competitiveness cannot be achieved if the climate agenda is left behind. Fortunately, new industrial leaders in some emerging economies have already become role models and surpassed their counterparts in the developed world by adopting resource-efficient and environmentally friendly technologies and practices. The world has a very small window in which to stabilize GHG emissions and redirect the development path by 2050. The risk of inaction is real.

12
A Greener Path to Competitiveness Policies for Climate Action in Industries and Products
COMPETITIVENESS AND CLIMATE CHANGE
Manufacturing includes the highest carbon-emitting sectors in the global economy. This study examines policies that can push these industries toward climate-friendly operations and the technologies that simultaneously can preserve-or enhance-their competitiveness. The study focuses on both industrial operations and the products that the industries produce.
The first global pact to fight climate change was signed by almost 200 countries in Paris in 2015. It aims to prevent global temperatures from rising another degree Celsius in the century to come. The Paris Agreement was significant not only in charting a path for progress on the Sustainable Development Goal agenda but also in creating momentum for human society to work toward eliminating greenhouse gas (GHG) pollution.1 Among numerous GHG emission sources, manufacturing industry has been identified as a main contributor to the complex issue of climate change, but it is also seen as a significant part of the solution. The manufacturing industry is responsible for almost a third of total GHG emissions, and there are significant untapped opportunities to reduce those emissions. Countries are already taking actions in reducing GHG in the industrial sector, but much more could be done.
The main challenge for industries and governments is how to integrate the carbon reduction scheme into the economic growth and competitiveness agenda and how to provide industries with a greener path to competitiveness. Factors of competitiveness are complex and differ according to sector and products. Market access, labor and labor costs, technologies, and other bottom-line factors often supersede the importance of reducing environmental impact. Even when accounting for the eventual global framework for carbon pricing and other cost externalities, businesses in developing countries will not be greatly affected by policy intervention because of their low baseline emissions, and it can be argued they may benefit in the short term by increasing energy availability under cap-and-trade schemes. Therefore, many governments are justifiably reluctant to impose requirements on industries or specific products that would have GHG reduction benefits. They worry that these interventions might harm domestic industry. Governments and businesses are skeptical of any additional cost burden on their operations.
This study acknowledges those concerns while it provides concrete policy recommendations that can help to chart a greener development path in the industrial sector. It helps policy makers better understand the changing landscape of climate mitigation strategies. It also helps them understand the impacts of environmental policies on economies and how to create strategies that work for both industry and the environment.
The report explores aspects of competitiveness and draws on insights from numerous industry and research experts. Cases from various economic groups and countries were examined to showcase (1) the technologies that are applicable and economically feasible for optimizing industrial operations and (2) policy solutions, especially minimum energy performance standards and labeling (S&L), that influence the design of energy-consuming products (see Table I.1).
The insights are directed at government leaders, policy makers interested in climate change and related policies, and multilateral institutions that work along the spectrum of climate mitigation and sustainable development. The document provides an overview on how to drive industries toward a green path of competitiveness. It focuses on basic and cost-effective technologies for high-emitting industries and leveraging the manufacturing sector in order to spur development of energy efficient appliances and products through S&L.
INTRODUCTION
1 The overarching purpose of the 17 Sustainable Development Goals are to end poverty, combat climate change, and fight injustice and inequality by 2030. United Nations (UN). (UNIDO, 2015. “Sustainable Development Goals.” http://www.un.org/sustainabledevelopment/sustainable-development-goals/. The role of the industry sector is illustrated in goal nine: Build Resilient Infrastructure, Promote Inclusive and Sustainable Industrialization and Foster Innovation. United Nations Industrial Development Organization (UNIDO). 2015. “SDG Goal 9: Industry, Innovation and Infrastructure.” https://isid.unido.org/goal9.html.

13
A Greener Path to Competitiveness Policies for Climate Action in Industries and Products
Table ES.1 Industry Climate Action Matrix: Operations and Outputs
Note: CSR = Corporate social responsibility; FSC = Forest Stewardship Council
Industrial operations Industry outputs
Public policy leverage
• Overall climate change policy (GHG emission limits)• Energy management programs• Environmental licensing• Fiscal and non-fiscal incentives
• Energy efficiency standards• Energy efficiency or eco-labeling• Regulations (e.g., customs exemptions)• Incentives• Waste regulations
Private sector leverage• Voluntary performance standards (ISO 14000, ISO 50000)• Corporate social responsibility
• Industry standards for testing products• Private labels (e.g., FSC)• CSR requirements
The report begins with a discussion on the role of industries in climate change, the dynamics of climate change, and the public policy measures that can help guide industrial operations toward climate friendly operations. Part 1 ranks 12 subsectors according to their emissions associated with direct energy use, offsite electricity generation, and industrial processes. (See Table 1.1.) Four of the highest ranking subsectors-iron and steel, chemicals, aluminum, and cement-are then examined in greater detail. For each of these sectors, the report examines the upstream interventions available to reduce GHG emissions and how these may impact a firm’s competiveness. These interventions can be divided into three broad categories: (1) energy efficiency improvements, (2) substitution of low-carbon feedstocks and fuels, and (3) use of alternative or innovative processes. Additional routes to the decarbonization of the industrial sector include storing or using (recycling) carbon that would otherwise be emitted and increasing the use of renewable energy sources within the sector. Options provided on carbon capture and storage (CCS) and carbon recycling might not be economically feasible in the short term-more aggressive carbon reduction agendas at the country level and international collaboration are required to unleash the capacity of breakthrough CCS technologies. They may, however, become more common facets of future strategies.
Part 2 of the report focuses on the products of the manufacturing process. Public policy has leverage in the energy or resource consumption of these products and the firms that manufacture them. Energy efficiency standards are the main tools policy makers use in order to lower emissions from products and the way they are made. Falling commodity prices and massive production volumes allow trillions of end-use products to be utilized by households and businesses, and these products continually consume energy in the form of electricity and emit GHGs until the end of their life cycle. How these products are manufactured determines either the rise or fall of GHG emission in years and decades to come.
Minimum energy performance S&L programs for these products are proven pathways to energy savings and GHG emission reductions. As of 2015, there were more than 1,400 minimum energy performance standards, comparative labeling, and endorsement labeling policies in place in about 75 countries. Where studies have been done, they have found that S&L policies have delivered substantial energy and GHG emissions savings, yielding real benefits for individual consumers and the countries that have put those policies in place.
Part 2 also explores in some depth the impacts of energy efficiency standards and labeling (EES&L) policies on industry competitiveness in four product categories: (1) lighting products, (2) air conditioners, (3) major home appliances, and (4) industrial equipment. Products in these categories are together responsible for much of the energy used in homes and businesses and are typically the first products addressed by new S&L programs. Part 2 gives an overview of EES&L policies and their achievements in each of these product areas and identifies trends in policy making.
This report is based on thorough desk research and case study analysis obtained through interviews and qualitative research. The publication is a first in exploring the direct link between competitiveness and climate-friendly practices in industry, or more specifically, manufacturing. The results chart the way for more quantitatively based analysis of this link in order to provide further support to policy makers as they develop business and climate friendly regulations for a greener path to competitiveness.

14
A Greener Path to Competitiveness Policies for Climate Action in Industries and Products
EMISSIONS AND GROWTH
Global energy consumption increased 16-fold during the 20th century, and it surpasses the growth rate of the global population, which increased 4-fold over the same period.1 Since the beginning of the current century, GHG emission growth has been particularly strong in Asia, Latin America, and the Middle East.2 Most of these economies are in their early stages of industrial development, and with increasing market activities, the trajectory of strong emission growth will last in these regions if no immediate actions are taken. In terms of sector-wide emission, the key GHG emitting sectors globally are agriculture,3 industry, transport, buildings, and energy. (Box I.1 and Figure I.1)
BOX I.1 KEY GHG-EMITTING SECTORS
Transport emissions grew substantially from 2.8 GtCO2eq in 1970 to 7 GtCO2eq in 2010.
Industrial emissions experienced high growth from 5.4 GtCO2eq in 1970 to 8.8 GtCO2eq in 2010.
Buildings emissions experienced mild growth from 2.5 GtCO2eq in 1970 to 3.2 GtCO2eq in 2010.
Agriculture emissions experienced mild growth from 9.9 GtCO2eq in 1970 to 12 GtCO2eq in 2010.
1 Wilson, C. 2012. “Up-scaling, formative phases, and learning in the historical diffusion of energy technologies.” Energy Policy, 50, pp.81-94.2 IEA. 2014. Energy Technology Perspectives 2014. http://www.iea.org/etp/etp2014/3 Agriculture, forestry, other land use.
Energy Transport Buildings Industry AFOLU Waste
FIGURE I.1 Global GHG Emissions by Sector, 1970 - 2010
Source: IPCC 2014.
ALL +14%
ALL +5%
ALL +10%
ALL +21%
+8%
+13%
+11%
+9%
+11%
+26%
+11%
+27%
+36%
+18%
+27%
+41%
+18%
+25%
+25%
+35%
+9%
+1%+5%
+9% +45%+2%
+4%
+15%
1990 - 20001980 - 19901970 - 1980 2000 - 2010
World by Sector
10
20
30
40
50
Ann
ual G
HG
Em
issi
ons
(GtC
O2 e
q/yr
)

15
A Greener Path to Competitiveness Policies for Climate Action in Industries and Products
Key drivers of emission growth have been the following:
• Rapid population growth and sustained economic development, especially across developing and emerging economies
• Increased and globalized trade facilitated through the expansion of infrastructure, technology diffusion, and increased resource availability
• Industrialization and growth of middle-class consumers in middle and lower income countries• Improvements in standards of living leading to increased consumption• Increases in energy intensity• Growth-driven public policies and long-term industry commitment to less than efficient technology,
which by and large have not been successfully offset by carbon reduction policies
In spite of worrying trends, there are projected pathways to decarbonization, which would limit global temperature rise to less than two degrees Celsius by the end of the twenty-first century. These scenarios require significant emissions reduction across the power and industrial sectors before 2050 to reach target. With only 34 years remaining until 2050, achieving the needed decarbonization is increasingly challenging and requires robust and firm climate commitments complemented by immediate and sustained action.
That carbon emissions can be uncoupled from economic growth has been confirmed by the International Energy Agency, whose data show that since 2014 “global energy-related carbon dioxide (CO2) emissions-the largest source of man-made greenhouse gas emissions-stayed flat for the second year in a row.”1 Such uncoupling can be attributed to the successful implementation of low-carbon technologies, such as solar and wind energy, and other energy efficiency measures. However, as traditionally there is a direct correlation between economic growth and emissions, uncoupling can also be attributed to the stagnation in growth and consumption due to the recent economic downturn in major economies. Sustained action is therefore required to maximize the potential for uncoupling. This report explores the pathways toward this goal.
There is widespread understanding of the significant societal risks from climate change. At the same time, consensus has formed gradually that climate change mitigation and adaptation measures could be aligned with poverty alleviation, job creation, and competitive growth. Deep collaborations among the private sector, public institutions, and civil society need to be scaled up to realize the potential.
DEFINING COMPETITIVENESS
The next 15 years are critical. The extent of low-carbon investment and action will likely shape the future of the planet. Technological advancements in the past several decades have redefined industrial boundaries and how consumers’ needs are met. An increasingly integrated global value chain, accompanied by knowledge dissemination, has induced new supply-demand channels. This creates new business models, opportunities, and challenges. Whether economies recede or thrive will depend on their flexibility and their capacity to adapt to a rapidly changing social and economic environment, bound by the climate threshold and their means to compete. It is worth revisiting the essence and meaning of competitiveness within this context.
Understanding the different drivers of competitiveness will help clarify how climate action in industries can be assisted by certain types of technologies and policies. The challenge is that the definition of competitiveness itself, especially for industries, is loosely or inconsistently defined. Research across various institutional and private sector approaches shows that there is no core definition for the term (see Table I.2). Stakeholders nonetheless know when they are gaining or losing competitive advantage and recognize paths that lead to gains.
1 IEA (International Energy Agency). 2016. “Decoupling of Global Emissions and Economic Growth Confirmed,” IEA, Paris. https://www.iea.org/newsroomandevents/pressreleases/2016/march/decoupling-of-global-emissions-and-economic-growth-confirmed.html.

16
A Greener Path to Competitiveness Policies for Climate Action in Industries and Products
Concerns about competitiveness have grown in response to globalization, shrinking economic distance, rapid technological change, and the liberalization of markets.1 In general, competitiveness refers to an entity’s ability to compete in national or international markets. Broader definitions of competitiveness focus on structural factors such as productivity, skills, and innovation that affect economic performance. However, most commonly competitiveness is measured as a relative price or cost indices.2 According to the Global Green Growth Institute, the effects of competitiveness can be felt at multiple levels.
• At the firm level, a business is considered competitive if it can produce better or cheaper products or services than its domestic and international competitors.3
• At the sector level, competitiveness refers to how attractive different countries are for a particular industry. This is often measured in terms of performance in international trade: net exports, investment flows, and so forth. Industrial policy, supply chain linkages, standards, and the availability of raw materials are key drivers for sector-level competitiveness.4
• At the country level, competitiveness is often represented by national welfare or productivity and driven by many factors, including a nation’s educational and scientific strengths.5
From a different perspective, competitiveness is always a relative measure that consists not only of tangible components, such as labor, technology, and physical assets, but also of intangible factors, such as brand, site integration or clustering, and access and channels to investment. The discussion in Part 1 further explores competitiveness from the angle of industrial operation. Technical and policy options are provided for decision makers to help them expand both tangible and intangible competitiveness capacity.
Part 2 examines the competitiveness argument deriving from the Porter hypothesis,6 which argues, “Well-designed environmental regulations enhance competitiveness through innovation.” Ample evidence shows that environmental regulations induce innovation in clean and efficient technologies. Regulated firms face a higher price on emissions relative to other costs of production. This induces them to invest in R&D and innovate and make operational changes to reduce emissions. Also, the Global Green Growth Institute found in its research that the “low-carbon innovations induce larger economic benefits than the ‘dirty’ technologies they replace, because they generate more knowledge in the economy, which can be used by other innovators to further develop new technologies across various sectors of the economy.”7 For example, the EU Emissions Trading Scheme has increased innovation activity in low-carbon technologies among regulated companies by 10 percent compared to a counterfactual scenario.8
1 Lall, Sanjaya. 2001. “Competitiveness Indices and Developing Countries: An Economic Evaluation of the Global Competitiveness Report.” World Development 29 (9): 1501–1525. http://biblioteca.fundacionicbc.edu.ar/images/3/34/Politicas_2.pdf.
2 Fagerberg, J., 1996. Technology and competitiveness. Oxford review of economic policy, 12(3), pp.39-51.3 Dechezleprêtre, Antoine, and Misato Sato. 2014. “The Impacts of Environmental Regulations on Competitiveness.” Policy brief, Grantham Research
Institute on Climate Change, London, and Global Green Growth Institute, Seoul. http://personal.lse.ac.uk/dechezle/Impacts_of_Environmental_Regulations.pdf.
4 Dechezleprêtr and Sato. 2014. “The Impacts of Environmental Regulations on Competitiveness.”5 Shenkar, Obed, Yadong Luo, and Tailan Chi. 2014. “Country Competitiveness.” In International Business, 3rd ed., chap. 5. Abingdon-on-Thames, UK: Taylor
and Francis. http://www.sagepub.com/sites/default/files/upm-binaries/18595_Chapter_5.pdf.6 Proposed by Harvard Business School economist and strategy professor Michael Porter twenty years ago.7 Dechezleprêtr and Sato. 2014. “The Impacts of Environmental Regulations on Competitiveness.”8 Calel, R., and A. Dechezleprêtre. 2016. “Environmental Policy and Directed Technological Change: Evidence from the European Carbon Market.” Review of
Economics and Statistics 98 (1): 173–191.

17
A Greener Path to Competitiveness Policies for Climate Action in Industries and Products
Table I.2 Definitions of Competitiveness
World Economic Forum, 2014
Competitiveness is the set of institutions, policies, and factors that determine the level of productivity of a country.
Sustainable competitiveness is the set of institutions, policies, and factors that make a nation productive over the longer term while ensuring social and environmental sustainability.
Deloitte, 2012
Although not explicitly defined, manufacturing competitiveness draws from trade theory and focuses largely on cross-country or cross-sector competitive advantage-the ability to produce goods and services at globally competitive levels. Competitiveness measurements focus on the manner in which the target sector is competitive. Markets of the Organization for Economic Co-operation and Development (OECD) are deemed competitive by innovation and other factors that further promote their capital-intensive competitiveness, whereas Brazil, Russia, India, China, and South Africa (BRICS), for example, have a competitive advantage in labor.
Organization for Economic Co-operation and Development, 2014
Competitiveness is the degree to which a country generates relatively high factor income and factor employment levels while being exposed to international competition.
Industry competitiveness is a multifaceted concept, best described with multiple measures of the effectiveness of production processes.
United Nations Industrial Development Organization, 2013
Industrial competitiveness is defined as the capacity of countries to increase their presence in international and domestic markets while developing industrial sectors and activities with higher value added and technological content.Source: UNIDO. 2013. The Industrial Competitiveness of Nations: Looking back, Forging ahead-Competitive Industrial Performance Report 2012/2013. New York: UNIDO. https://www.unido.org/fileadmin/user_media/Services/PSD/Competitive_Industrial_Performance_Report_UNIDO_2012_2013.PDF.
McKinsey, 2010
For each sector, the McKinsey Global Institute defines competitiveness as a capacity to sustain growth through either increasing productivity or expanding employment. A competitive sector is one in which companies improve their performance by increasing productivity through managerial and technological innovations and offer better quality or lower-prices goods and services, thereby expanding demand for their products.
Grantham Research Institute on Climate Change and the Environment, 2014
Firm-level competitiveness is defined by whether a firm can produce better or cheaper products or services than its domestic and international competitors. It is a firm’s long-run profit performance and refers to its ability to compensate its employees and provide adequate returns to its owners.
Sector-level competitiveness refers to how attractive different countries are for a particular industry and is often measured in terms of performance in international trade (net exports, investment flows, and so forth).
Country-level competitiveness is often used as a synonym for national welfare or productivity. Unlike firm or sector competitiveness, which are achieved at the expense of rivals when competing for global market share, the competitiveness of a country should not come at the expense of other countries but rather will benefit them by providing a bigger market for exports, greater opportunities for specialization, and cheaper and more innovative inputs.
A Greener Path to Competitiveness Policies for Climate Action in Industries and Products
18
INTRODUCTION
The industrial sector is a major contributor to global emissions. Developed countries and the leading emerging economies are the world’s dominant industrial powers and have the opportunity to lead on sector decarbonization in order to meet the climate targets being set by the international community. As other economies grow and industrialize, they too have an important role in ensuring a greener path for industrial production. In particular they will need to establish safeguards to avoid the historical carbon-heavy pathway of Western societies.
Part 1 introduces the challenges and opportunities for industries in finding greener paths to competitiveness. It places particular emphasis on the role of technology in reducing greenhouse gas (GHG) emissions and the potential implications for competitiveness. Part 1 groups favorable technology solutions, and analyzes the economic feasibility of each under discussed policy scenarios. Leveraging polices for the successful adoption of these options were illustrated.
EMISSIONS
Roughly a third of both global carbon dioxide emissions and the world’s energy consumption are attributable to manufacturing industries.1 Figure 1.1 displays industrial energy use, while Figure 1.2 highlights the growth of industrial emissions between 1970 and 2010 by country income. Industrial sector emissions grew 63 percent from 1970 to 2010.
High-income countries were the key emitters in 1970 but have now been overtaken by middle-income countries such as China. This growth can be attributed to rapid economic development among low- and middle-income countries since the 1980s. There has been a fundamental shift in production and consumption of goods and services from countries of the Organization for Economic Co-operation and Development (OECD) to others, particularly in Southeast Asia.2
PART 1COMPETITIVENESS AND CLIMATE ACTION FOR INDUSTRIAL OPERATIONS
1 IEA-4E. 2007. Tracking Industrial Energy Efficiency and CO2 Emissions. Paris: IEA. https://www.iea.org/publications/freepublications/publication/tracking_emissions.pdf.
2 De Backer, Koren, and Norihiko Yamano. 2012. “International Comparative Evidence on Global Value Chains.” OECD Science, Technology and Industry Working Papers, OECD, Paris. http://www.oecd-ilibrary.org/science-and-technology/international-comparative-evidence-on-global-value-chains_5k9bb2vcwv5j-en?crawler=true.

19
A Greener Path to Competitiveness Policies for Climate Action in Industries and Products
Source: IPCC 2014.
Industry
Figure 1.2 Industrial Emissions, 1970-2010
1970 - 1980 1980 - 1990 1990 - 2000 2000 - 2010
Figure 1.1 Final Energy Consumption by Sector, 2012
9%
3%
32%
29%
27%
Non energy
Other
Buildings
Industry
Transport
Source: IEA 2014, Key World Energy Statistics.
Low-Income Countries
Lower-Middle-Income Countries
Upper-Middle-Income Countries
High-Income Countries from Non-OECD-1990
High-Income Countries from OECD-1990
2
4
6
8
Ann
ual G
HG
Em
issi
ons
(GtC
O2 e
/yr)
-7%+6%+17%-4%
+58%
-1%+43%+10%
+100%+18%+18%+66%
+23%+2%+24%
+24%

A Greener Path to Competitiveness Policies for Climate Action in Industries and Products
20
Industrial emissions growth has been particularly strong since the start of the 21st century. Emission spikes equate to a 100 percent increase across upper-middle-income countries and 58 percent across lower-middle-income countries between 2000 and 2010. Growth in emissions across non-OECD high-income countries has been milder, with a 23 percent increase, while OECD high-income countries have experienced a 7 percent decrease within the same period.1
China now firmly dominates world production, and there is also high growth across Asia, the Middle East, and Latin America. Improved global transport routes and technological development have enabled China to become a global powerhouse within the industrial sector. One should note that regions and countries do not operate in vacuums. Industrial production draws heavily on global resources and produces downstream emissions that are embedded in the end product. The production of energy-intensive products has grown between 200 and 500 percent across cement, aluminum, steel, ammonia, and paper.2 Emissions have been falling in OECD countries, however, which can be attributed to both a decrease in OECD production and the deployment of energy efficiency levers.
1 IPCC (Intergovernmental Panel on Climate Change). 2014. Climate Change 2014: Mitigation of Climate Change. Geneva: IPPC. http://www.ipcc.ch/report/ar5/wg3/.
2 Kelly, T. D., and G. R. Matos. 2013. “Historical Statistics for Mineral and Material Commodities in the United States.” US Geological Survey (USGS) Data Series 140, USGS, Washington, DC. http://minerals.usgs.gov/ds/2005/140/.

21
A Greener Path to Competitiveness Policies for Climate Action in Industries and Products
Table 1.1 The World’s Highest-Emitting Industries (in Mt CO2e)
SectorEmissions
through direct energy use
Offsite electricity and
heat supply
Process emissions Total
Global GHG emissions
ranking
Iron and steel 190 720 1,500 2,410 1
Nonmetallic minerals
1,011 350 550 1,910 2
Chemical and petrochemical
390 960 530 1,880 3
Paper, pulp, and print
430 320 15 760 4
Food and tobacco
420 270 N/A 690 5
Nonferrous metals
130 460 100 690 6
Machinery 150 440 N/A 590 7
Mining and quarrying
130 150 2 280 8
Textile and leather
90 180 N/A 270 9
Transport equipment
60 130 N/A 190 10
Construction 130 60 N/A 180 11
Wood and wood products
90 80 N/A 170 12
Note: Mt CO2e = Million metric tons of carbon dioxide equivalent. Estimate emissions, 2010.
Ranking method: Three areas of emissions were examined. First, emissions through direct energy use, i.e., direct emissions from consumption of different forms of energy (e.g. coal, natural gas, biofuel) within the manufacturing facility were calculated, using energy use data from International Energy Agency (IEA) energy statistics and emission factors.2 Second, indirect emissions through consumption of grid electricity and heat from offsite supply was examined, using IEA energy use data for global industrial sectors and emission factors weighted by production by country.3 Last, process emissions from the manufacturing process (by-products of various non-energy-related industrial activities) were calculated, using data from industry reports and IPCC emission factors.4 Carbon Trust analysis identifies the top industrial sectors by GHG emissions as iron and steel; nonmetallic minerals; chemicals and petro chemicals; paper, print and pulp; food and tobacco; and nonferrous metals.
BREAKDOWN OF INDUSTRIAL EMISSIONSA ranking of the top emitting industries is provided in Table 1.1. In order to discuss the potential technological and energy management interventions and their impact on competitiveness four sectors were selected for closer examination based on their high emissions from direct energy use, indirect use, and processes. These are iron and steel, chemicals, aluminum (nonferrous metal), and cement were chosen.1
1 Significant analysis has been conducted on these four sectors and readers should refer to wider literature for an in-depth sector review.2 IEA (International Energy Agency). 2012a. “CO2 Emissions from Fuel Combustion Highlights: Beyond 2020 Documentation,” IEA, Paris; IEA. 2012b. “Energy
Statistics of Non-OECD Countries,” IEA, Paris.3 IEA. 2012. “Energy Statistics of Non-OECD Countries”; Country specific emissions factor for offsite energy production are provided by IEA; individual
sector offsite energy use emission factors were weight-adjusted based on production figures in different countries.4 IPCC. 2006. “Guidelines for National Greenhouse Gas Inventories,” IPCC, Geneva.
Sector being examined in this report.

A Greener Path to Competitiveness Policies for Climate Action in Industries and Products
22
OVERVIEW OF INDUSTRY ENERGY CONSUMPTION BY FUEL TYPECoal, oil, natural gas, and electricity are the main fuel sources across industry. Fuel mixes differ across the four sectors chosen for close examination, but what the sectors have in common is the weak contribution of low-carbon fuels. Coal features heavily across the iron and steel and cement sectors, while electricity is the dominant source for the aluminum sector, and oil and natural gas for the chemical sector. This diversity in fuel mix demonstrates the need for tailored solutions in order to reduce the carbon intensity of each sector.
a. Total industry final energy consumption (PJ) (including BF, CO and chemical feedsstocks)
b. Chemicals final energy consumption (PJ)
Figure 1.3 Main Fuel Sources for the Iron and Steel, Cement, Aluminum, and Chemical Industries (2012)
20%
10%
5%
0%
4%
5%
20%
30%
30%
8%
21%
47%
Electricity
Electricity
Biomass, waste and other renewables
Biomass, waste and other renewables
Heat
Natural gas
Natural gas
Coal
Heat
Coal
Oil
Oil
Note: PJ = Petajoule; BF = Blast Furnace; CO = Coke Oven. Source: IEA 2015, Energy Technology Perspectives dataset.

23
A Greener Path to Competitiveness Policies for Climate Action in Industries and Products
c. Iron and steel final energy consumption (PJ)
d. Aliminum final energy consumption (PJ)
Figure 1.3 Main Fuel Sources for the Iron and Steel, Cement, Aluminum, and Chemical Industries (2012) (Continued)
11%
19%
3%4%
0%
0%
2%
61%
18%
12%
15%
Natural gas
Electricity
55% Electricity
HeatBiomass, waste and other renewables
Biomass, waste and other renewables
Biomass, waste and other renewables
Oil
Coal
Coal
Oil
Natural gas
Note: PJ = Petajoule; BF = Blast Furnace; CO = Coke Oven. Source: IEA 2015, Energy Technology Perspectives dataset.
e. Cement final energy consumption (PJ)
12%
8%
3%
11%
66%Electricity
Natural gas
Heat
Oil
Coal

A Greener Path to Competitiveness Policies for Climate Action in Industries and Products
24
Recent studies have identified strong realization of energy efficiency across the industrial sector, with an estimated 40 percent of realized energy efficiency having been already achieved.1 However, as Figure 1.4 highlights, significant economic potential, in the region of 60 percent, for future energy efficiency savings still remains. Beyond energy efficiency, decarbonization strategies such as carbon capture and storage can also be deployed to reduce the industrial sector’s carbon footprint.
While the sector has started to adopt low-carbon technologies, in order to avoid exceeding a two degree Celsius rise in global temperatures, significant improvement in emissions reduction is required across the world’s industrial sector.1 Key challenges facing the sector globally are securing gains from increased production and trade while also reducing emissions, which has become particularly challenging in the current global economic climate. Furthermore, industrialized processes are largely mature with established and long-life technologies in place that are not necessarily compatible with or aligned to a fully developed low-carbon pathway. Increasingly, the sector will have to deploy currently available carbon-reducing technologies while investing in R&D to bring down the cost of more progressive and effective solutions. Other solutions exist, for example, product standards and labeling and energy management systems, which have yet to be fully developed and could stimulate further decarbonization across the industrial sector.
Figure 1.4 Realized and Unrealized Energy Efficiency Potential
Realized energy efficiency potential Unrealized energy efficiency potential
Industry Transport Power generation Buildings
20%
40%
60%
80%
100%
Source: IEA 2014.
1 IEA. 2014. Capturing the Multiple Benefits of Energy Efficiency. Paris: IEA. http://www.iea.org/publications/freepublications/publication/Captur_the_MultiplBenef_ofEnergyEficiency.pdf

25
A Greener Path to Competitiveness Policies for Climate Action in Industries and Products
COMPETITION
Recent declines in output from individual countries, decreasing prices, the desire to maintain economic benefits, and the need for strategic access to core industrial products have made the subject of industrial competitiveness topical. Competiveness is generally examined at the country level, and a number of indexes that classify countries’ industrial competitiveness exist, including the following:
• Competitive Industrial Performance Index (CIP) from the United Nations Industrial Development Organization (UNIDO)
• Global Manufacturing Competitiveness Index (GMCI) from Deloitte Global• Global Competitiveness Index from the World Economic Forum
Figure 1.5 displays UNIDO’s relative ranking of state industrial competiveness.2
The GMCI 2016 identifies talent, cost competiveness, productivity, and supplier networks as the key drivers of manufacturing competitiveness. It further highlights the role of advanced manufacturing technologies and the cultivation of strategic public partnerships as important to unlocking competitiveness. Policy environments that enable technology transfer, science, and innovation is also an important component.3 UNIDO notes that the context in which sustainable industrial development occurs is rapidly changing due to the globalization of production systems, the shrinking economic distance between trading partners, the emergence of new competitors and transnational companies, and rapid technological change induced through innovation and learning. Navigating industrial competitiveness is challenging, in particular for countries that have yet to realize their industrial potential.4
The integration of environmental impact of industrial activity is an aspect that is better considered within developing countries, than in emerging economies. There is now the fundamental requirement to ensure that industrial policies integrate ‘green’ considerations across all economies to ensure GHG reduction can progress while minimizing competitive distortions across national industry.
1 IEA. 2015b. Energy Technology Perspectives 2015. Paris: IEA. http://www.iea.org/etp/etp2015/; World Energy Council (WEC). 2015. 2015 World Energy Issues Monitor. London: WEC. http://www.worldenergy.org/wp-content/uploads/2015/01/2015-World-Energy-Issues-Monitor.pdf.
2 UNIDO. 2014. “Competitive Industrial Performance Report 2014,” Working Paper 12/2014, UNIDO, New York. http://www.unido.org/fileadmin/user_media/Services/PSD/WP2014_12_CIPReport2014.pdf.
3 Deloitte Global. 2016. “Highlights from the 2016 Global Manufacturing Competitiveness Index.” http://www2.deloitte.com/content/dam/Deloitte/us/Documents/manufacturing/us-gmci-highlights.pdf.
4 UNIDO. 2012. Tanzania Industrial Competitiveness Report 2012. New York: UNIDO. https://www.unido.org/fileadmin/user_media/Services/PSD/TanzaniaIndustrialCompetitivenessReport2012-ebook.pdf.

A Greener Path to Competitiveness Policies for Climate Action in Industries and Products
26
Figure 1.5 UNIDO’s Ranking of Countries’ Industrial Competitivenss
Highly competitive
Less competitive
Competitive Industrial Performance
Source: UNIDO 2014.

27
A Greener Path to Competitiveness Policies for Climate Action in Industries and Products
Figure 1.5 UNIDO’s Ranking of Countries’ Industrial Competitivenss

A Greener Path to Competitiveness Policies for Climate Action in Industries and Products
28
Companies seek comparative advantage by successfully competing for markets and resources and apply industrial strategy to improve performance. Companies commonly measure competitiveness by examining relative profitability and market shares.1
The classification of sector competitiveness is less common than that of country or business competitiveness. As highlighted within the introduction, competitiveness is always a relative measure, not an absolute concept. Examining competitiveness is always a comparative exercise: companies versus companies, industries versus industries, and countries versus countries. If energy costs fall by the same amount for all companies in a particular market, there will be no impact on any individual company’s relative competiveness.
Sector- and company-level competiveness is composed of both tangible and intangible factors (Figure 1.6). Tangible factors include labor, energy, other inputs, intellectual property and technology, and physical assets. Intangible factors include branding, price setting, innovative capacity, site integration and clustering, trade and access to foreign investment, and the strength of local markets. The extent to which these factors are dominant forces varies from sector to sector. The primary focus of this report is the impact of reducing GHG emissions on competiveness. At the core to this discussion is the cost of energy or carbon intensity and the current structural market conditions and exposure to trade, or trade intensity.
Figure 1.6 Tangible and Intangible Factors of Competitiveness
Intangible
Tangible
Source: Carbon Trust and Vivid Economics analysis 20152.
Sector competitiveness
Brand/price setting
Innovative capacity
Integration/clustering
Trade/foreign
investment acces
Strength of the local
market
Labor (cost and skill)
Energy (cost and
availability)
Commodities (cost and
availability)
IP/technology
Physical assest
(maturity and scale)
1 Law, S. 2001. “Competitiveness Indices and Developing Countries: An Economic Evaluation of the Global Competitiveness Report.” World Development 29 (3): 1501-1525. http://biblioteca.fundacionicbc.edu.ar/images/3/34/Politicas_2.pdf.
2 Some categories were adapted from McKinsey Global Institute, 2012. Manufacturing the future: The next era of global growth and innovation. http://www.nist.gov/mep/data/upload/Manufacturing-the-Future.pdf.

29
A Greener Path to Competitiveness Policies for Climate Action in Industries and Products
COMPETITIVENESS OF THE IRON AND STEEL, CEMENT, CHEMICAL, AND ALUMINUM SECTORS
Cement, aluminum, iron and steel, and chemicals are largely mature, consolidated industries-they are dominated by a relatively small number of large global players. The products are often globally traded, have similar upstream activities, and feed into common processes and end sectors.
All of these sectors have been faced with the challenge of weathering the global economic downturn. Traditional centers of production have had to take new strategic paths to compete with new players and to address shifts in traditional centers of consumption, sluggish demand, surplus in capacity, and a spiral of downward prices.
The key components of competiveness for individual companies or countries across these sectors when faced with decarbonizing can be summarized as follows:
• Availability of low cost energy• The maturity and scale of the physical plants, which influence the ability to retrofit• The availability, to a varying degree, of key inputs, innovative capacity, integration or clustering of sites,
cost of labor, and strength of the local and regional markets

A Greener Path to Competitiveness Policies for Climate Action in Industries and Products
30
Table 1.2 provides a summary of the drivers of competiveness and their relative importance across the chosen industrial sectors.1
While many factors that influence competitiveness are at play, these differ case by case. Part 1 focuses on the role of low-carbon interventions to reduce the impact of GHG emissions and the impacts such interventions have on competiveness.
Due to the energy-intensive nature of these four industrial sectors, fluctuations in fuel price and resource price are particularly material to sector profitability.2 They can bring about a change in relative regional comparative advantage, resulting in new winners and losers.3 Therefore positioning centers of production, where there are low energy costs and close proximity to resources, will provide competitive advantage.
It is worth noting that while all four sectors are strongly exposed to the cost of energy, not all industrial sectors are subject to strong exposure to global market forces. For instance, cement products are not traded globally to the same degree as the other industrial products due to logistical constraints inherent to the sector.
Close proximity to consumers and trade hubs helps to serve markets in a cost-competitive manner and, generally speaking, with a lower carbon footprint than distance would entail. The extent to which this is a key determinant of competitiveness differs across sectors. Chemical and aluminum production across the Middle East is a prime example in which these factors are decisive. These sectors have access to competitive energy prices and are geographically well placed to serve multiple markets, allowing companies within the region to remain globally competitive.
The fluid characteristics of various industrial subsectors provide challenges to policy makers who try to develop comprehensive multisector national and regional industrial development policies. A strong understanding of the sectors at the national, regional, and where applicable global levels are required in order to design policies that support global competitiveness.
Table 1.2 Drivers of Competitiveness across Four Industrial Sectors
Source: Carbon Trust, based on a Carbon Trust and Vivid Economics Analysis Framework, adapted from Mckinsey 2012.
Not important
Subsectors analysed
Tangible Intangible
Labo
ur
Ener
gy
Oth
er in
puts
IP/t
echn
olog
y
Phys
ical
ass
ets
Bra
nd/p
rice
sett
ing
Inno
vativ
e ca
paci
ty
Inte
rgar
ion/
clus
terin
g
Trad
e/FI
Acc
ess
Stre
ngth
of l
ocal
mkt
.
Moderately important Highly important
Competitiveness drivers
Chemicals
Steel and iron
Cement
Aluminum
1 It should be noted that this is not the definitive picture, but serves to show the importance of certain factors of competitiveness over others. Factors of competitiveness vary by sector and region, and in some jurisdictions the relative importance will vary.
2 Eventually, mid-term input price variations will pass through to consumers. Any actions that threaten to impact those at risk of fuel poverty is of particular concern to policy makers.
3 IEA. 2015a. Energy Efficiency Market Report 2015. Paris: IEA. https://www.iea.org/publications/freepublications/publication/MediumTermEnergyefficiencyMarketReport2015.pdf.

31
A Greener Path to Competitiveness Policies for Climate Action in Industries and Products
Iron and SteelSteel is manufactured via three main processing routes: (1) blast furnace (BF)/basic oxygen furnace (BOF); scrap/electric arc furnace (EAF); and direct reduced iron (DRI/EAF). About 70 percent of steel is produced via BF-BOF processes.1 The products-sheets, rails, pipe products, bars, plates, wire rods, wires, coated steel products, and so forth-are regionally and globally traded and very price sensitive.2 These products can be found within a wide range of sectors such as construction, transportation equipment, automotive materials, heavy machinery, domestic appliances, and electrical equipment.
1 WSA (World Steel Association). 2014. “Energy Use in the Steel Industry,” fact sheet, WSA, Brussels, https://www.worldsteel.org/publications/fact-sheets/content/02/text_files/file0/document/fact_energy_2014.pdf.
2 IETD (Industrial Efficiency Technology Database). 2015. “Iron and Steel.” http://ietd.iipnetwork.org/content/iron-and-steel.
Figure 1.7 Steel-Making Processes and the Associated Low-Carbon Interventions
Source: IETD 2015, “Iron and Steel.”
Coal
Coke Making Sintering
BOF
ScrapDRI
EAF
Casting
Steel Rolling
General measures Blast Furnace
-Coke dry quenching-Further use of cog-Coal moisture Control-Non – recovery ovens-Better process control-Coke stamp charging -All measures
-Use of high – quality are -Top pressure recovery turbine -Pulverized coal injection -Recuperative hot stove -Improved process control -Improved BFG Recovery-Bell-less top charging-Natural gas / oil injection -Direct reduced iron (DRI)-Smelting reduction-All measures
-Waste heat recovery -Waste gas recycling-EOS-Multı- slit burning -Waste fuel use -All measures
-Midrex process-Fastmet, Fastmelt-ITmk3 -HYL III-Coal Based HYL -SL/ RN process-All processes
-Preventative maintenance -Energy management system-VFD for pumps & fans -Motor systems optimization-Steam system optimization-
-Process control -Hot DRI/HBI charging-Flue gas combustion -Bottom stirring -Charge pre – heating -Foamy slag practices -Oxy – fuel burners/lancing -Direct current (DC) AF -Engineered materials -All measures
-Advanced process control -Hot charging-Recuperative/regenerative burners -Improved insulation -Flamelless burners -Walking beam furnace -Heat recovery from water -Lubrication systems -All measures
-Heat & gas recovery-Process control -Bottom stirring/lancing-Improved ladle preheating-All measures
-Continuous casting -Efficient ladle pre-heating -Thin- slab casting-Castrip process -Endless strip production -Integrated casting&rolling -All measures
Iron fines
Coal
Gas
The industry is very energy intensive. It is the world’s largest CO2 emitter and the second largest industrial user of energy.3 Energy intensity is estimated at 14–23 Gigajoule (GJ) per ton4 of crude steel,5 and the sector accounted for 13.6 percent of primary energy use in China and 1.4 percent in the USA.6
The production of steel and iron relies heavily on combustion fuels. It entails significant process emissions arising from the utilization of carbon as a chemical reductant and additional emissions through indirect electricity consumption. The majority of consumed energy is used to provide heat, at temperatures over 1000 degrees Celsius.7 While emissions can be reduced through EAF processes by leveraging recycled scrap iron, the more energy-intense BOF is still needed to produce high-grade steel, which is required in many end-use applications.
Estimates vary, but the literature suggests that energy constitutes up to 40 percent (but can be as low as 5–15 percent) of the cost of steel production, while raw materials make up about 70 percent of costs. Cost of labor varies by region and can also be a competitive factor.8
3 WSA. 2015c. “World Steel in Figures,” WSA, Brussels. https://www.worldsteel.org/dms/internetDocumentList/bookshop/2015/World-Steel-in-Figures-2015/document/World%20Steel%20in%20Figures%202015.pdf; IETD. 2015. “Iron and Steel.”
4 Metric tone5 For Chinese and U.S. iron and steel producers.6 Hasanbeigi, Ali, Lynn Price, and Nathaniel Aden. 2011. A Comparison of Iron and Steel Production Energy Use and Energy Intensity in China at the US.
Berkeley, CA: Lawrence Berkeley National Laboratory. https://china.lbl.gov/sites/all/files/lbl-4836e-us-china-steeljune-2011.pdf. 7 DECC (Department of Energy and Climate Change) and BIS (Department for Business, Innovation and Skills). 2015. Industrial Decarbonisation and Energy
Efficiency Roadmaps to 2050: Iron and Steel. London: DECC and BIS. https://www.gov.uk/government/uploads/system/uploads/attachment_data/file/416667/Iron_and_Steel_Report.pdf.
8 Various, e.g., WSA. 2015b. “Energy Use in the Steel Industry Report Available Now,” press release, https://www.worldsteel.org/media-centre/press-releases/2015/Energy-use-in-the-steel-industry-report-available-now.html; Steel Consult. 2006. “New Competitive Realities in Steel.” http://www.steelconsult.com/ArticleSteelConsultinMillenniumSteel_English.pdf.

A Greener Path to Competitiveness Policies for Climate Action in Industries and Products
32
Figure 1.9 Crude Steel Regional Production, 2015
Source: World Steel Association, 2015 Data.
0.4%
68.3%
10.5%
2.1%
0.9%
6.3%
7.0%
2.8%
Oceania
Asia
Africa
European Union (28)
Other Europe
C.I.S. (6)
North America
South America
1 WSA. 2015a. “Crude Steel Production.” Brussels: WSA. https://www.worldsteel.org/statistics/crude-steel-production0.html. 2 Steel Consult. 2013. “Realities of Survival for European Steel: Is There a Future for Steel in Europe?” http://www.steelconsult.com/images/Presentation%20
SteelConsult%20Platts%20Steel%20EUR.pdf. 3 WSA. 2015c. “World Steel in Figures.”
The iron and steel sector is a highly mature and consolidated sector dominated by large international companies. Figure 1.8 displays the growth in crude steel production, and Figure 1.9 displays the regional production levels. Between 2000 and 2011 steel production grew by about 75 percent, with crude steel production estimated at 1.6 billion tons in 2015, hitting an average of about 130 million tons per month in 2014.1
The development of steel production entails fundamental differences by region. Steel production is moving from the Atlantic to Asia, which in 2012 produced 66 percent of global output, compared to only 11 percent in 1960.2 China’s share of global demand for finished flat steel more than doubled to 42 percent in the past decade, while the share of consumption by EU and North American nations fell by 23 percentage points. China now represents 48 percent of the total global market.3
Despite a recent decrease in nominal demand and production growth rates, demand for steel is expected to increase with global growth and urbanization, with more than 1 billion people expected to relocate to towns and cities by 2030, requiring essential steel-dependent transport and energy, water, and housing infrastructure.
Due to the global and regional nature of the steel trade, remaining competitive will hinge on access to low energy and iron ore prices, the state of capacity, the global price of steel, the strength of regional markets, and state of physical assets. Growth in the steel market is forecast to remain weak, with excess in capacity and volatility in energy and raw material costs expected to challenge the viability of high-cost producers and limit future investments. The extent of political interference will also impact the ability to undertake commercially rational investments.4 For more on the dynamics of the steel market, see Box 1.1.
4 Ernst & Young. 2013. Global Steel 2013: A New World, a New Strategy. London: Ernst & Young. http://www.ey.com/Publication/vwLUAssets/Global-Steel-Report-2013/$FILE/Global-Steel-Report-2013_ER0046.pdf.
Figure 1.8 Global Crude Steel Production (thousand tonnes)
1990 1995 2000 2005 2010 2015e
600,000
800,000
1,000,000
1,200,000
1,400,000
1,600,000
1,800,000
Source: World Steel Association, 2015 Data.

33
A Greener Path to Competitiveness Policies for Climate Action in Industries and Products
BOX 1.1 COMPETITIVE DYNAMICS OF THE STEEL MARKET
The global steel sector faces a number of key trends: shifting production and consumption, a shift in value chains, technology innovation in operating methods, geoeconomics preferences, vertical integration, protectionism, and overcapacity and asset dumping. The global steel market is currently facing overcapacity with demand falling below production. Despite the decline of the global steel price, global nominal capacity is projected to increase to 2.36 billion tons by 2017, up from 2.16 billion tons in 2013. Non-OECD countries are expected to lead the expansion in capacity.
Key factors to maintaining the excess in capacity include the following: government interventions (including subsidies), regardless of profitability, have been put in place in order to avoid social upheavals due to layoffs; the high cost of plant closure discourages downward adjustments or reallocation of capacity; and some large net steel-importing regions are interested in moving toward greater self-sufficiency in steel production in order to reduce their dependence on imports. Therefore despite current market conditions, a large number of new projects are taking place, which will increase global crude steel-making capacity significantly in the coming years. Many countries view steel production as a strategic priority and try to keep production local.
Many governments actively intervene to strengthen domestic steel markets to ensure supply (via protectionism, state aid, and subsidies). In the past 50 years, the steel industry has reduced its energy consumption per tonne of steel produced by 60 percent. However, due to this dramatic improvement in energy efficiency, it is estimated that there is limited room for further improvement on the basis of existing proven technologies. A recent study by the World Steel Association shows that the average energy intensity for steel production is 20 Gigajoule per tonne (GJ/t) crude steel with a potential for improvement of 15–20%. The steel sector is progressively implementing energy efficiency projects, largely done at the individual companies’ initiative because of the potential cost savings. Cost control and better productivity are the main drivers for companies to implement energy efficiency measures, while corporate reputation and government regulations remain low on the list of influencing factors. Companies also quote restrictive internal investment criteria and long payback periods as issues facing them when choosing to invest in energy efficiency projects. Financial mechanisms that support shared investment schemes could help in implementation of energy efficiency projects with long payback periods. Policies that support innovation and implementation of new tools will be important to advancing energy efficiency more progressively.
Figure B1.1.1 World Crude Steel Capacity (nominal) and Demand
Capacity/Demand gap (RHS)
2000 2001 2002 2003 2004 2005 2006 2007 2008 2009 2010 2011 2012 2013 2014 2015
700 100
900
1,100200
1,300
1,500
300
1,700
1,900
400
2,100
500
2,300600
2,500
Million Tonnes Million Tonnes
700
Capacity (LHS) Demand (LHS)
Sources: OECD 2014.
Figure B1.1.2 Indexed Global Energy Consumption/Tonne of Crude Steel Production
1960 1965 1970 1975 1980 1985 1990 1995 2000 2005 2010 2014
20
40
60
80
100
%
Sources: World Steel Association 2015c.

A Greener Path to Competitiveness Policies for Climate Action in Industries and Products
34
CementCement is a binding agent made up primarily of clinker1 mixed with other minerals. The vast majority of global cement production is used to create concrete-a key component of infrastructure development and maintenance. It can also be found in products such as mortar.
Cement is manufactured in a process that involves two basic steps. Clinker is made in a kiln at temperatures of 950–1,450 degrees Celsius. It is then cooled before it is ground with other minerals to produce cement. The kilns have heavy fuel requirements, making the process energy intensive, and further CO2 is emitted during chemical exchanges within the kiln.2 Cement has been identified as the most energy-intensive of all U.S manufacturing industries, with a heavy reliance coal and petroleum coke3.
Cement can be classified as a predominantly local commodity, with production serving local markets to a greater extent than other industrial products. This is because the extraction of inputs (for example, limestone) and the nature of the production processes largely occurs on a regional or local basis. Cement markets are mature with relatively high capital-intensity requirements. The sector is highly regulated in developed countries and is undergoing a process of consolidation.4
The cost of energy can be significant in cement production. It is estimated that energy represents 20 to 40 percent of the total cost of production.5 One large cement manufacturer broke down costs as follows: about 30 percent energy; 30 percent raw materials and consumables; and 30 percent production, labor, and maintenance costs.6
Global production in 2014 was 4.3 billion tons. China now dominates global production with an estimated 56 percent of the total (figures 1.11 and 1.12).7 Coal and petroleum coke remain the predominant industry fuels today, and hence the sector remains carbon intensive.
1 Clinker consists of various calcium silicates including alite and belite, and generated by heating various clays and limestone.2 MPA Cement. 2015. “Modern Cements (Bulk),” MPA Cement Fact Sheet 14b, MPA Cement, London, http://cement.mineralproducts.org/documents/
FS_14b_Modern_cements_BULK.pdf. 3 U.S. Energy Information Agency. 2013. “Today in Energy: The cement industry is the most energy intensive of all manufacturing industries”. http://www.eia.
gov/todayinenergy/detail.cfm?id=11911.4 It is estimated that there are currently thousands of plants globally, but the sector is being increasingly dominated by a few key players.5 ClimateTechWiki. 2015. “Energy Efficiency and Saving in the Cement Industry,” http://www.climatetechwiki.org/technology/energy-saving-cement.6 Lafarge. 2008. “Information on Lafarge,” chap. 3, 2007 annual report, Paris. http://www.lafarge.com/04022008-Activities-Details_cement_business-en.pdf.7 Cembureau. 2014. Activity Report 2014. Brussels: Cembureau. http://www.cembureau.eu/sites/default/files/Activity%20Report%202014_website_1.pdf;
USGS. 2015. Minerals Information data. http://minerals.er.usgs.gov/minerals/pubs/commodity/cement/
Figure 1.10 Cement-making Process and Associated Low-carbon Interventions
Source: IETD 2015.
Raw material preparation
General measures
Clinker making
Clinker cooling
Finish grinding
Fuel preparation
Emerging carbon reducing products & measures
-Preventative maintenance -High-efficiency motors& drives -Variable Speed Drives (VSD) -Compressed air & fan system optimization -Lighting control & optimization
-Alternative raw materials -Process control systems -Efficient transport systems -Efficient meal blending -High-efficiency mills -High-efficiency classifiers
-Alternative fuels -Fuel management -High efficiency mills-High-efficiency classifiers
-High efficiency coolers -Optimized heat recovery -VSD in cooler fans
-Blended cements -Process control and management-High efficiency mills-High efficiency classifiers -Grinding aids in ball mils -Improved grinding media in ball mills
-Energy management and process control -Improved insulation -Combustion improvements -Heat recovery for power generation -Addition of mineralizers -Low pressure drop cyclones for preheaters -Additional pre-heater stages -Converting to multistage preheater systems -Addition of precalciner to preheater kilns -Dry systems with preheaters & precalciner -Fluidized bed advanced kiln systems
-Low- & negative –carbon cement alternatives -Carbon capture & storage

35
A Greener Path to Competitiveness Policies for Climate Action in Industries and Products
European countries have been successful in using alternative fuels (for example, biomass waste) in cement production and are claiming successful decarbonization strategies through the replacement of long dry and wet kilns.
Due to the high energy intensity of the cement sector, remaining competitive heavily relies on the ability to have access to low energy costs and access to competitively priced raw materials. The state of local demand will heavily impact profit margins and hence influence the ability of the sector to invest in new technologies.
ChemicalsThe chemical industry supplies and supports innovative solutions across virtually all sectors. It serves a large number of end markets, including aerospace, automobiles, energy construction, fast-moving consumer goods, textiles, health, packaging, electronics, and agriculture.
The industry is energy intense and competes globally.1 It utilizes a diverse range of complex processes spanning from small batch processes to large volume, continuous operations. The sector is highly energy intensive, accounting for approximately 10 percent of global final energy demand.2 It uses 30 percent of global industrial energy.3 According to some estimates it is the largest energy user within the industrial sector.4 The manufacturing process requires high energy inputs and high temperatures, including extensive use of natural gas, petroleum, coal, heat purchase, and electricity. It also entails process emissions for activities such as chilling, compression, pumping, and lighting.
Figure 1.11 Global Cement Production (thousand tons)
1965 1972 1979 1986 1993 2000 2007 2014
500,000
1,000,000
1,500,000
2,000,000
2,500,000
3,500,000
3,000,000
4,000,000
4,500,000
Source: U.S. Geological Survey, 2015 Data.
Thousand tons
Figure 1.12 World Cement Production 2014, by Region and Main Countries (percentage)
Source: U.S. Geological Survey, 2015 Data.
56.4%
1.4%
5.7%
7.0%
0.3%4.6%
4.8%
1.9%
15.5%
China
Japan India
Europe
2.4%CIS
Oceania America (exl. USA)
Africa
USA
Rest of Asia
1 Cefic. 2015b. “Energy and Climate Change.” http://www.cefic.org/Policy-Centre/Energy--Climate-Change/.2 ICCA (International Council of Chemical Associations). 2013. “Chemical Industry Contributions to Energy Efficiency and Mitigating Climate Change.”
Brussels: ICCA. http://www.icca-chem.org/ICCADocs/ICCA%20Roadmap%20Summary.pdf.3 OECD and IEA. 2009. “Chemical and Petrochemical Sector: Potential of Best Practice Technology and Other Measures for Improving Energy Efficiency,” IEA
Information Paper, Brussels, https://www.iea.org/publications/freepublications/publication/chemical_petrochemical_sector.pdf.4 OECD and IEA. 2009. “Chemical and Petrochemical Sector.”
Approximately half of the energy used within the sector is contained within hydrocarbon raw materials (primarily from oil and natural gas), and the other half is used in the transformation of raw materials into chemical products (through reaction and purification steps). Further, unlike other sectors, much of the original energy is preserved within the final chemical products.5 Energy use within the sector can be broken down into two key categories: energy within feedstock and energy within fuel.6
With the growth in production there has been a growth in energy consumption. The U.S. Energy Information Administration (US EIA) estimates that chemicals industries are the second largest user of energy in the U.S. manufacturing industry, representing 29 percent of total manufacturing energy, and that a 28 percent growth in energy consumption occurred from 1991 to 2002.7
The global market has shifted substantially since the 1990s and is now highly competitive, with increasing market share captured by developing countries and economies in transition (e.g. China, India, and countries in the Middle East)8. Global sales have roughly doubled over the past decade, and there is increased competition for investment. These countries have been able to lean upon increasingly sophisticated production facilities and feedstock as well as energy advantages to attract investment9.
5 Neelis et al., 2007, sourced in Patt, J., and Banholzer, W., Improving Energy Efficiency in the Chemical Industry. Washington, DC: National Academy of Engineering. https://www.nae.edu/Publications/Bridge/EnergyEfficiency14874/ImprovingEnergyEfficiencyintheChemicalIndustry.aspx.
6 US EIA (U.S. Energy Information Administration). 2015. “Chemical Industry Analysis Brief,” US EIA, Washington, DC. https://www.eia.gov/consumption/manufacturing/briefs/chemical/.
7 US EIA. 2015. “Chemical Industry Analysis Brief.”8 UNEP. 2013. “Global Chemicals Outlook: Towards Sound Management of Chemicals”. http://www.unep.org/hazardoussubstances/Portals/9/
Mainstreaming/GCO/The%20Global%20Chemical%20Outlook_Full%20report_15Feb2013.pdf9 Cefic. 2015a. “Competitiveness of the European Chemical Industry.” http://www.cefic.org/Documents/PolicyCentre/Reports-and-Brochure/
Competitiveness-of-the-European-chemical-industry-2014.pdf.

A Greener Path to Competitiveness Policies for Climate Action in Industries and Products
36
Figure 1.14 Regional Growth in Chemical Production
Source: U.S. Geological Survey, 2015 Data.200520042003 20072006 20092008 20112010 20132012
50
100
150
200
250
300
350
400
China Russia Brazil USA
India South Korea EU Japan
Prod
uctio
n in
dex
(20
03=
100)
by
coun
try
Figure 1.13 Regional Chemical Sales
Source: Cefic. Facts and Figures 2014.
1%
2%3%
4%
5%
5%
13%
17%
33%
Rest of World
India Rest of Europe
Rep. Of Korea
Latin America
Japan
Rest of Asia
NAFTA
China
17%EU 28
In 2013 China dominated production with EUR 1,047 billion in sales, representing roughly one third of global sales estimated at EUR 3,136 billion.
The European market is currently at a competitive disadvantage, with lower energy prices within the Middle East and the United States. However, it is able to retain some competitiveness by staying at the forefront of product innovation. Due to the highly traded nature of the product, staying ahead from a cost price point is important. A key challenge facing the sector is how to provide the high energy intensity required within the manufacturing process while minimizing emissions.
AluminumAluminum is a key enabling metal. Its use facilitates important developments in industries such as automotive, infrastructure, construction, electric engineering, food and drink, and aircraft.1 Aluminum is one of the highest consumed metals globally, surpassed only by steel and copper.2
1 Aluminium Leader. 2015. All about Aluminium. http://www.aluminiumleader.com/.2 IMF (International Monetary Fund). 2015. “Commodity Special Feature,” from World Economic Outlook, IMF, Washington, DC. http://www.imf.org/external/
np/res/commod/pdf/WEOSpecialOCT15.pdf.

37
A Greener Path to Competitiveness Policies for Climate Action in Industries and Products
1 World Aluminium. 2015. Aluminium and Life Cycle Thinking: Towards Sustainable Cities. World Aluminium. 2015. Aluminium and Life Cycle Thinking: Towards Sustainable Cities.
2 Mr. Reid. 2011. “Electricity Consumption in the Production of Aluminium.” Blog entry, Mr. Reid.org, July 14, 2011. http://wordpress.mrreid.org/2011/07/15/electricity-consumption-in-the-production-of-aluminium/.
3 Terawatt-hour is a unit of energy. It represents a billion units of the more common kilowatt-hour.4 Data retrieved from World Aluminum, “Statistics,” March 2016. http://www.world-aluminium.org/statistics/primary-aluminium-smelting-power-
consumption/. 5 Rusal. 2015.”Aluminium Production Costs.” http://rusal.ru/en/aluminium/energetics.aspx.
Figure 1.15 Process of Aluminum Production
Source: World Aluminum 2015.1
Extraction Production Use End of Life
Waste Mgmt. &
RecyclingSmelting
Anode Production
Remelting & Refining
Ignot Casting
Semis manu-factur-
ing
Manufac-turing
Other Materials/Product SystemsOther raw materials
Use Collection
Sorting & Treatment
Landfill
Mining bauxite
Co-products
Co-products
alumina
dross
scrap
new scrap new scrap
final product
semis
use energy
old scrap
primary Al
Refining
recycled Allgnots
Key stages of aluminum production are bauxite mining, smelting, and processing. Aluminum production requires significant energy. The Hall-Héroult process, the electrolytic refining process during aluminum smelting, is very energy intensive, accounting for about 80 percent of energy required within primary aluminum production. Approximately 3 percent of the world’s entire electricity supply goes to the extraction of aluminum,2 and in 2014 the sector consumed about 700 terawatt-hour (TWh)3 of energy. Globally, 57,890 thousand metric tons of aluminum were produced in 2015.4
Energy costs account for approximately 35 percent of aluminum production costs.5 Tariffs charged by energy producers are therefore crucial to remain regionally and globally cost competitive. Large producers of aluminum are able to gain competitive advantage when located where electricity is cheap and readily available.

A Greener Path to Competitiveness Policies for Climate Action in Industries and Products
38
Aluminum profit margins are affected by rising energy costs and falling prices, and about 70 percent of the variability in aluminum’s total cost is linked to energy cost.1 However, given the reliance on electricity within its production, which is heavily regulated in most countries, aluminum prices are more stable than those of iron.
Recycling has become an increasingly important part of meeting demand for aluminum. According to World Aluminum, about 70 percent of production is derived from primary production and about 30 percent is supplied through recycling. Recycling is driven by market mechanisms. It currently is an attractive proposition as it provides high value at a relatively low cost and it is less energy intensive than primary production. It also simultaneously helps meet city and national recycling objectives. Recycling of aluminum requires as little as 5 percent of the energy and emits 5 percent of the GHG emissions when compared to primary aluminum production.2 Since 1990, emission savings from recycled aluminum have more than doubled. However, as recycling becomes more prominent, efforts need to be supported by increased collection and separation from end-of-life products.3
Aluminum is globally traded, but with increasing recycling, larger proportions of the value chain occur on a regional basis. Since 1970 production has grown by 35 percent in China, 23 percent in Australia, 11 percent in Brazil, and 4 percent in India. The combined market share of these countries is about 70 percent.4 Annual consumption has grown by about 3 percent per year in the past half century, with forecast growth expected to continue. Global aluminum production has increased since the economic recession, driven primarily through Chinese and Middle Eastern production, with Western countries losing market share.
1 World Aluminium. 2013a. “The Global Aluminium Industry: 40 years from 1972.” http://www.world-aluminium.org/media/filer_public/2013/02/25/an_outlook_of_the_global_aluminium_industry_1972_-_present_day.pdf.
2 World Aluminum. 2013b. “Global Aluminum Recycling: A Cornerstone of Sustainable Development.” http://www.world-aluminium.org/media/filer_public/2013/01/15/fl0000181.pdf.
3 World Aluminum. 2015. “Aluminium for Future Generations”. http://recycling.world-aluminium.org/home.html. 4 World Aluminium. 2013a. “The Global Aluminium Industry.”
Figure 1.16 Regional Primary Aluminum Production
Source: World Aluminum Data 2015.
2%
4%
9%3%
9% 52%
3%7%
4%
AfricaEast & Central Europe
West Europe
South America
North America
Oceania
Asia (ex China)
GCC
China
Row Est. UN-Reported
7%
Figure 1.17 Global Annual Primary Aluminum Production (thousand tons)
Source: World Aluminum 2013a.198019761973 19861983 19921989 19981995 2004 2007 2010 20132001
10,000
20,000
30,000
40,000
50,000
60,000
The current global market is binary, divided into China as the biggest producer and consumer and the rest of the world. In 2014 Chinese production accounted for about 52 percent of global production. The sector has experienced significant structural change, with geographical relocation of key production centers and shifts in the concentration and integration of the industry (Box 1.2).
Emerging economies, such as China, India, and Africa, are successfully using energy-efficient technologies, and the average energy efficiency of the industry in non-OECD countries runs ahead of that in OECD countries. The cost of energy, access to competitively priced raw inputs and recycled product, innovative capacity, and the ability to cluster sites in order to gain system efficiencies are important factors in remaining competitive.

39
A Greener Path to Competitiveness Policies for Climate Action in Industries and Products
BOX 1.2 KEY STRUCTURAL CHANGES TO THE ALUMINUM SECTOR
Like other industrial sectors, the aluminum sector has experienced a number of important structural changes that have shaped the current aluminum market. These can be summarized as follows:
• The emergence of new consuming regions • The geographical relocation of bauxite, alumina, and aluminum production centers• Shifts in the degree of concentration and integration • The development of new end-use markets and the threat of substitutes, including recycled
metal• The historical decline in real prices of the metal and the recent upward shift in the industry cost
curve• The market adjustment mechanisms and, more recently, the rising popularity of commodities as
an asset class
Energy consumption within the aluminum sector is dominated by the reduction process, requiring significant electricity. Countries that are located close to bauxite mines, are within close proximity to port facilities, and have access to power generation capacity-namely, coal, gas, hydropower, and nuclear power (the key power sources of aluminum facilities)-have a natural competitive advantage.
Further new builds across West Africa, Southeast Asia, the Middle East, and China have been able to implement best available technologies (BAT), and are not necessarily subjected to emissions taxation or trading systems. This has allowed them build strong competitive advantage.
Figure B1.2.1 Focus of Primary Energy across the Aluminum Sector
20
40
60
80
100
120
140
160
180
Note: MJ= Mega jouleSource: World Aluminum 2015.
Bauxite mining (fuel and electricity)
Anode production (fuel combustion)
MJ primary energy per tonne of aluminium
Alumina refining (fuel and electricity) Reduction (electricity)Ingot casting
(fuel combustion)
THE CHALLENGES IN INDUSTRIAL COMPETITIVENESS AND ENVIRONMENTAL ACTION
Maintaining competitive advantage and growth in output while continuing to meet societal demands to decarbonize is a considerable challenge facing today’s industrial sectors. Industrial emissions are strongly correlated to economic development, where growth in economic activity results in strong demand for industrial products-and results in increased emissions. This remains the case, despite a partial decoupling of emissions and production across a range of industrial sectors. (See Box 1.3 for an example.)

A Greener Path to Competitiveness Policies for Climate Action in Industries and Products
40
With changes in the international economy, downward pressure on costs, and the need to remain cost competitive, many of the energy efficiency retrofit quick fixes have already been deployed.1 To a large degree, current success rates have been the result of implementing easily applied interventions that neatly align with the drive to remain cost competitive. The present challenge for industry is to turn to more complex and costly interventions if the decoupling trend is to continue. However, this needs to be aligned with competitive motives in order for business to remain commercially viable. This is a formidable and multifaceted challenge, with no single stop solution.
BOX 1.3 PRODUCTION AND GHG DECOUPLING ACROSS THE EU CHEMICAL SECTOR
European chemical sector production grew by 60 percent between 1990 and 2012. During the same period GHG emissions decreased by 54 percent. This means that GHG intensity fell by 71 percent. This decoupling of emissions can be attributed to the following: • The use of low-carbon fuels and the abatement of nitrous oxide• Development of cleaner technologies• Waste recycling processes• New energy efficient products
However, it is estimated that in order for further decoupling to occur, industry will need to turn to more aggressive and higher cost abatement technologies that currently conflict with EU competitive aspirations.
Figure B1.3.1 Decoupling of GHG and Production
19951990 2000 2005 2010 2013
5060708090
100110120130140150160170180
Index (1990=100)
Greenhouse gas emissions Chemicals production*
Figure B1.3.2 Energy Intensity of EU Chemical Production
Source: Cefic and European Environmental Agency 2014.
19951990 2000 2005 2010 2013
5060708090
100110120130140150160170180
Index (1990=100)
Average growth rate p.a. 1990-2012EU chemicals production 2.1%Energy consumption -0.8% Chemicals intensity -2.9%
Energy consumption
Chemicals production
Energy intensity*
100.0
69.857.7 54.7 51.4 52.9
1 See DECC (2015) Industrial Decarbonisation and Energy Efficiency Roadmaps to 2050. https://www.gov.uk/government/publications/industrial-decarbonisation-and-energy-efficiency-roadmaps-to-2050.; and IEA (2015b) Energy Technology Perspectives. http://www.iea.org/etp/etp2015/.

41
A Greener Path to Competitiveness Policies for Climate Action in Industries and Products
Broadly, there is one set of challenges and economic barriers that apply to those companies operating within jurisdictions that impose stringent environmental regulations and another, lesser set of challenges for those who operate outside.
While the former are faced with greater constraints, there are core societal and business benefits to being front runners in decarbonizing and reducing the energy intensity of operations.
Despite the market failures that hold back low-carbon investment, the benefits of green growth interventions are well documented and extend beyond stakeholder financial return. Mitigating the adverse impacts of climate change can provide the following:
• Increased climate change resilience• Enhanced energy security• Economic benefits (for example, sector productivity and reduced fuel import costs) • Social benefits (for example, less local pollution)
Further, while downsides to carbon policies exist, there are strong benefits to implementation. For example, introducing a carbon scheme can result in the development of innovative and cost-reducing technologies with positive social benefits. In particular, by putting a predictable and strong price on carbon, developed and emerging economies can send signals across the economy that can help accomplish the following:
• Guide investment and consumption choices away from carbon intense activities• Increase fiscal revenues• Phase out energy subsidies that discourage decarbonization and increase exposure of importing
countries to volatile prices1
Challenges for Companies That Operate within Carbon Regulation ZonesComplying with carbon regulations can be costly to business and detrimental to competiveness relative to companies that are not required to comply with such regulations. However, as traditional fuels and commodities become scarcer, sector transformation to a more sustainable pathway is ultimately required.
Today much of the narrative surrounding industrial competiveness involves carbon taxes and cap-and-trade schemes, the most prominent being the EU Emission Trading Scheme (EU ETS). Companies that face a carbon tax or are subject to an emissions trading scheme will face costs that other companies will not. This is the inevitable result of the partial and nonbinding climate policy landscape. However, an increasing number of countries and cities are looking to carbon taxes and cap-and-trade schemes (Figure 1.18). To date 40 national and 20 subnational jurisdictions – including seven of the ten largest economies- have implemented or preparing to implement carbon pricing mechanisms. For example Mexico, China, California, Quebec, Portugal, and South Africa aim to launch cap-and-trade schemes in the coming years. The countries, regions, and cities with plans for carbon taxes and such schemes are responsible for 22 percent of global emissions. These schemes would cover 13 percent of global emissions2.
Despite the positive direction, many of these plans have yet to be formally implemented or progressed beyond pilot schemes. In addition, linking of national carbon markets with regional and international trading partners is required to reduce competitive disadvantages. This is highly relevant to industrial competitiveness, where products subject to different regulatory environments are traded between the jurisdictions.
1 Rydge, J. 2015. “Implementing Effective Carbon Pricing,” New Climate Economy Working Paper, Washington, DC. http://2015.newclimateeconomy.report/wp-content/uploads/2015/10/Implementing-Effective-Carbon-Pricing.pdf.
2 World Bank. 2016b. “Pricing Carbon.” Washington, DC: World Bank. http://www.worldbank.org/en/programs/pricing-carbon.

A Greener Path to Competitiveness Policies for Climate Action in Industries and Products
42
Figure 1.18 Countries That Have or Are looking to Implement a Carbon Tax or ETS and Linkage Occurring between Different Schemes
ETS and Carbon Tax implemented or scheduled
ETS implemented or scheduled for implementation
Carbon Tax implementedor scheduled for implementation
ETS or Carbon Tax under consideration
Carbon Tax implemented or scheduled, ETS under consideration
Note: ETS = emission trading scheme.Source: World Bank Group; ECOFYS. 2016.
Chile
Mexico
California
OregonWashington
British Columbia
Brazil
Rio de JaneiroSao Paulo
Quebec
Alberta
RGGI
Manitoba
Ontario
Iceland

43
A Greener Path to Competitiveness Policies for Climate Action in Industries and Products
Figure 1.18 Countries That Have or Are looking to Implement a Carbon Tax or ETS and Linkage Occurring between Different Schemes
Tianjin
Portugal ChinaTurkey
Greece
SwitzerlandJapan
Republic of Korea
Thailand
KazakhstanFrance
Norway
SwedenFinland
Denmark
Saitama
Guangdong
New Zealand
EstoniaUKLatvia
UkraineIreland Poland
Beijing
HubeiChong Qing
South Africa
Shenzhen
Kyoto
Tokyo
Shanghai

A Greener Path to Competitiveness Policies for Climate Action in Industries and Products
44
Note: ETS = emission trading scheme.Source: World Bank Group; ECOFYS. 2016. Carbon Pricing Watch 2016.
Figure 1.18 Countries That Have or Are looking to Implement a Carbon Tax or ETS and Linkage Occurring between Different Schemes (Continued)
Sub-national or regional
Implemented (in force with established rules)
Status of implementation
Implementation scheduled (mandate agreed, start date communicated, rules in preparation)
Under consideration*** (government gave public signal towards the development of an ETS)
National
Mexico
Brazil
Chile
RGGI**California
Quebec
Washington
WCI’

45
A Greener Path to Competitiveness Policies for Climate Action in Industries and Products
Figure 1.18 Countries That Have or Are looking to Implement a Carbon Tax or ETS and Linkage Occurring between Different Schemes (Continued)
European Union
Kazakhstan
New Zealand
Switzerland
Turkey
China
Japan
Thailand
Ukraine
LinkingOffisetting
Planned linkCDM and Jl creditsLinkBilateral offsets
Domestic offsets
Republic of Korea
China Tianjin
Republic of Korea
SaitamaTianjin
Chong Qing
Beijing
Guangdong
ShanghaiHubei
Shenzhen
Tokyo Kyoto

A Greener Path to Competitiveness Policies for Climate Action in Industries and Products
46
There are three main types of carbon costs: direct, indirect, and compliance. Direct costs arise from the fee associated with purchasing emission allowances or paying a carbon tax. These vary considerably across regions. Carbon taxes in Switzerland, Sweden, and Finland are particularly high and range between about $60 and $130 per tCO2e, (tons of carbon dioxide equivalent) while the pilot ETS in China, New Zealand and the EU ETS prices are closer to $5 to $15 per tCO2e.3
Indirect costs can manifest themselves through a carbon price increase knock-on effect, which can lead to a rise in the cost of energy, increased costs of process emissions, and a pass-through to an increase in the price of electricity for consumers.
Figure 1.18 provides an overview of sectors covered by a number of cap-and-trade schemes. Understanding which sectors have previously been targeted can assist in designing future programs and limiting risks that affect industrial competitiveness.1 While Figure 1.19 demonstrates a strong coverage of industrial sectors, a large proportion of free allowances or total exemptions have traditionally been provided to industry to reduce the risk of hindering competition.2 Industries must develop strategic plans and collaborate to graduate beyond a world of free allowances and determine how to minimize competitive disadvantages when this occurs.
Figure 1.19 Sectors Covered Emission Trading Schemes
RGGI
Korea
EU
Pow
er
Indu
stry
Avi
atio
n
Foss
il fu
el
Bui
ldin
gs
Was
te
Agr
icul
ture
Tran
spor
t
Fore
stry
Beijing
California
Kazakhstan
New Zealand
Source: Adapted from World Bank 2015, State and Trends of Carbon Pricing.
1 For comprehensive guides to the operation and design of emission trading schemes, see World Bank. 2016a. Emissions Trading in Practice: A Handbook on Design and Implementation. Washington, DC: World Bank; European Commission. 2014. EU ETS Handbook. Brussels: European Commission.
2 For example, within phase three of the EU ETS, industry sectors deemed at risk of carbon leakage receive 100 percent of free allowances for emission trading.
3 World Bank. 2015. State and Trend of Carbon Pricing. A World Bank Study. Washington, DC: World Bank. http://www.worldbank.org/content/dam/Worldbank/document/Climate/State-and-Trend-Report-2015.pdf.

47
A Greener Path to Competitiveness Policies for Climate Action in Industries and Products
The cost of compliance with environmental policies and its impact (both positive and negative) varies by sector. These will be influenced by factors such as the following:
• Energy intensity of the business• Technology deployment costs• Cost of any penalty for noncompliance• Extent of free allowances or sector exemptions• Transaction costs and the ability to overcome or pass on these transaction costs
The risk of industry relocating or exiting a country due to carbon policies is a concern of business leaders and national governments. Of particular concern is the prospect of investment, jobs and gross domestic product growth relocating to countries with relaxed GHG emission policies. This phenomenon is known as carbon leakage. Today, both operational and investment carbon leakage is of a particular concern to governments in countries with advanced climate-based policies. The European Commission (EC) defines carbon leakage as follows: “Carbon leakage is the situation that may occur, if for reasons of costs related to climate policies, businesses were to transfer production to other countries which have laxer constraints on greenhouse gas emissions. This could lead to an increase in their total emissions. This risk of carbon leakage may be higher in certain energy intensive industries.”1
The risk of carbon leakage differs by industrial subsector. For example the steel sector is at larger risk than the cement sector. There are a number of factors to consider in determining if a sector is at risk of carbon leakage.2 These can be summarized as follows:
• Direct CO2 intensity from energy use or process• Use of energy that internalizes CO2 costs (for example, electricity-intensive industries-especially in
countries with low renewable uptake)• Importance of the cost of carbon relative to other variables • Trade intensity • Abatement potential or cost of abatement • Ability to pass costs downstream or through to consumers
Power sectors within the EU have been able to successfully pass on costs of the EU-ETS. The ability to pass through costs is in turn subject to a number of considerations. These can be summarized as follows:
• Extent of exposure to international competition• Market concentration• Product differentiation• Availability of substitutes that are less energy intensive• Exchange rate risks• Customer reaction to a price increase• Vertical integration of the industry• Quality issues and long-term contracting• Legal and political environment• Coverage of a global pricing mechanism3
The state of California’s assessment of carbon leakage is demonstrated in Figure 1.20 and within the EU ETS sectors are deemed at risk from carbon leakage if any criteria within Figure 1.21 are met.
1 EC (European Commission). 2016. “Carbon Leakage.” http://ec.europa.eu/clima/policies/ets/cap/leakage/index_en.htm.2 Marcu, Andrei, Christian Egenhofer, Susanna Roth, and Wijnand Stoefs. 2016. Carbon Leakage: An Overview. CEPS Special Report no. 79. Brussels: Centre
for European Policy Studies. http://aei.pitt.edu/46163/1/Special_Report_No_79_Carbon_Leakage.pdf. 3 Renaud, J. 2008. “Issues behind Competiveness and Carbon Leakage: Focus on Heavy Industries,” IEA Information Paper, Paris; Droge, Susan. 2010.
Tackling Leakage in a World of Unequal Carbon Prices. Climate Strategies, London.

A Greener Path to Competitiveness Policies for Climate Action in Industries and Products
48
Industry’s exposure to carbon regulation and its effect on sector competiveness needs to be analyzed at the company or economic zone level. In 2010 the Carbon Trust and Climate Strategies identified EU industrial sectors at risk of carbon leakage (see Figure 1.21). This demonstrates that the chosen sectors are at risk of carbon leakage. More recently in 2014 the EC reconfirmed that industrial sectors were particularly affected by carbon leakage with strong growth in production experienced in emerging markets. Industrial sectors have been provided with free allowances to alleviate the risk of carbon leakage.
Figure 1.20 California Assessment of Carbon Leakage Risk
>5,000 High
Emissions Intensity
High High High
1,000-4,999 Medium Medium Medium High
100-999 Low Low Medium Medium
<100 Very Low
<10% Low 10-19% Medium >20% High Trade Intensity
Low Low Low
Source: California Environmental Protection Agency 2015.
Figure 1.21 Risk of Carbon Leakage across EU Industry in 2010
20 40 60 80 100
20
40
60
80
100
Source: Adapted from Carbon Trust 2010.1
Carbon Cost as % of GVA
Trade Intensity %
EU ETS sectors at risk if:
A) Carbon costs increase production costs by at least 5% of gross value added and non EU trade intensity is over 10%(combined criterion)B) OR direct costs by at least 30%(carbon cost criterion)C) Or non EU intensity is over 30% (trade intensity criterion)
C) Trade Intensity Basic iron & steel
No carbon leakage Aluminum
B) Carbon Cost Only Refineries
A) Combined Criteria
Leakage Criteria:
Cement
Example Sectors:
1 Carbon Trust. 2011. Tackling Carbon Leakage: Sector-specific solutions for a world of unequal carbon prices. https://www.carbontrust.com/media/84908/ctc767-tackling-carbon-leakage.pdf; and European Commission. 2015. Carbon Leakage. http://ec.europa.eu/clima/policies/ets/cap/leakage/index_en.htm.

49
A Greener Path to Competitiveness Policies for Climate Action in Industries and Products
While identified as administratively burdensome, regulatory compliance with such schemes has not had as severe an impact on competitive advantage as the recent structural shift in centers of consumption, access to low input costs, geographical trade route access, surpluses in capacity, and national and regional protectionism. Work undertaken by the London School of Economics Centre for Economic Performance in 2010 demonstrated that a complete relocation of business outside of the EU due to carbon price was unlikely, with carbon intensity bearing more impact on competiveness than trade intensity.1
Carbon trading schemes such as the EU ETS were initially identified as a driver for implementing decarbonizing initiatives. Those companies that are within a carbon tax jurisdiction are incentivized to implement such initiatives in order to reduce their exposure to the carbon tax.
However, for businesses that operate within a carbon market or face a carbon tax, there is incentive to carry out low-carbon interventions only with abatement costs equal to or below the carbon price or carbon tax level. With the current low-carbon price and high level of free allocations for the industrial sectors in the EU ETS, companies are not yet facing a strong driver for change. Furthermore, as the price of carbon has decreased over the past five years and uncertainty with the scheme rose, the strategic importance of the scheme fell in priority for industrial executives.2 Without a strong floor price and confidence that the price of carbon will increase over time there is not a strong push for plant managers to invest in high-cost abatement technologies. As and when the EU ETS scheme is revised, and in tandem a suite of other national and subnational jurisdictions launch similar cap-and-trade schemes, the driver for increased investment in low-carbon interventions will return.3 To the extent that such schemes cover a substantial share of global industrial emissions, this would have limited detrimental effects on competiveness for companies.
A level international playing field is strongly advocated by industry. This would require an international carbon price and/or similar levels of carbon regulations in numerous countries. International carbon taxes could in theory drive the development and implementation of carbon capture, low-carbon feedstocks, further energy efficiency improvements, and a reduction in industrial process emissions. However, government action and policies (both carbon and non-carbon related) are currently focused at the regional and national levels.
It needs to be recognized that compliance with long-term global climate targets implies that industrial transformation is inevitable, and a strong carbon price is ultimately required.
1 See Martin, R. et al. 2010. Europe’s Emissions Trading Scheme: Tax Payers versus the Industry Lobby. LSE. http://cep.lse.ac.uk/pubs/download/cp311.pdf 2 Climate Strategies. 2014. Carbon Control and Competiveness Post 2020: The Cement Report. London: Climate Strategies. http://climatestrategies.org/
wp-content/uploads/2014/02/climate-strategies-cement-report-final.pdf. 3 New Climate Economy. 2014. Better Growth, Better Climate. Washington, DC: New Climate Economy. http://newclimateeconomy.report/wp-content/
uploads/2014/08/NCE_GlobalReport.pdf.
Challenges for Companies not within Jurisdictions with a Carbon PriceCompanies faced with a carbon tax or emission trading schemes today will not face the same pressures as those who do have to comply. In the short term companies not facing a carbon price could benefit from this position. However, as previously highlighted, there are numerous societal and financial benefits to reducing the energy and carbon intensity of industry. In addition, companies will be able to leverage learnings from early adopter companies found within jurisdictions with a carbon price and can prepare themselves for future carbon taxes and minimize negative externalities related to fossil-fuel-intensive emissions. Ultimately, companies that strategically position themselves as early followers can reap the benefits while minimizing investment costs.
The Introduction of Carbon Pricing across Emerging EconomiesIt is in the interest of emerging economies to transition away from fossil-fuel-intensive development and avoid the consequences of heavy polluting pathways. Carbon pricing mechanisms offer an efficient means for meeting this objective. However, there are pros and cons associated with the introduction of carbon pricing schemes within developing and emerging economies.
On the plus side, greater coverage of the world with emissions standards would lead to a more competitive global environment for industry. This would spur industry to invest in energy efficient technologies in order to limit their exposure to carbon pricing where abatement costs are below the carbon price, rather than to move to areas not covered by carbon pricing, that is-minimizing effects on carbon leakage.

A Greener Path to Competitiveness Policies for Climate Action in Industries and Products
50
1 Rydge, J. 2015. Implementing Effective Carbon Pricing.
For emerging countries contemplating carbon pricing, there is a wealth of helpful documentation. In 2016 the World Bank published the technical paper “Emissions Trading in Practice: A Handbook on Design and Implementation.”2 It complements the European Commission’s EU ETS Handbook by focusing on the 10 steps to designing an ETS. Countries can also turn to a number of initiatives and principles such as the 2015 joint World Bank and OECD “FASTER Principles for Successful Carbon Pricing,”3 an overview of best practices in designing an ETS. An excerpt of that overview is provided in Figure 1.22.
On the negative side, at the national level, industrial companies within countries introducing carbon pricing may face additional costs of operation (compliance costs) and increased energy costs (if the power sector were included in the carbon pricing mechanism and were to pass on the costs of compliance onto end users). Depending on the extent to which these prices could be passed on to final consumers, such increases would squeeze profit margins.
For emerging economies looking to try carbon pricing, a carbon tax may be an easier avenue to pursue in the short term. It is can be more straightforward and may be more readily, given existing tax regimes that are already in use (for example, existing fuel excises).1 In addition, if information on current abatement costs across the economy is limited, taxes give industry certainty regarding the maximum additional costs they face compared with a trading scheme where costs could turn out to be higher than anticipated.
Alternatively, emerging countries could look to pilot emissions trading schemes. As with trading schemes in other countries, mechanisms such as border carbon adjustments and free allowances could be utilized to minimize the cost impact on industry at introduction. Furthermore, coordinating policies internationally with key trading partners could reduce or streamline administration costs, with lessons learned applied as appropriate. Such coordination would minimize any distortions in competitive advantage.
2 Partnership for Market Readiness; International Carbon Action Partnership. 2016. Emissions Trading in Practice: A Handbook on Design and Implementation. World Bank, Washington, DC. © World Bank. https://openknowledge.worldbank.org/handle/10986/23874 License: CC BY 3.0 IGO.
3 World Bank. 2015. The FASTER principles for successful carbon pricing: an approach based on initial experience. Washington, D.C.: World Bank Group. http://documents.worldbank.org/curated/en/2015/09/25060584/faster-principles-successful-carbon-pricing-approach-based-initial-experience

51
A Greener Path to Competitiveness Policies for Climate Action in Industries and Products
Figure 1.22 Steps to Improve Emission Trading Schemes
10 practical steps to create an ETS
World Bank and OECD FASTER Principles for Successful Carbon Pricing
• Fairness• Alignment of
Policies and Objectives
• Stability and Predictability
• Transparency• Efficiency
and Cost effectiveness
• Reliability and Environmental Integrity
Leverage international collaboration initiatives, e.g.
• Carbon Pricing Leadership Coalition
• International Carbon Action Partnership
• Partnership for Market Readiness
• Prince of Wales Corporate Leaders Group
• Caring for Climate Initiative
• Pricing Carbon Initiative
Laying the foundation for an ETS:
• Setting ETS objectives• Tailoring the ETS to local circumstances • Managing policy interactions • Incorporating lessons learned
Laying the foundation for an ETS: •Setting ETS objectives •Tailoring the ETS to local circumstances •Managing policy interactions •Incorporating lessons
learned
10 practical steps to create an ETS
World Bank and OECD FASTER Principles for
Successful Carbon Pricing • Fairness • Alignment of Policies and
Objectives • Stability and Predictability • Transparency • Efficiency and Cost
effectiveness • Reliability and
Environmental Integrity
Leverage international collaboration initiatives
• Carbon Pricing Leadership Coalition
• International Carbon Action Partnership
• Partnership for Market Readiness
• Prince of Wales Corporate Leaders Group
• Caring for Climate Initiative
• Pricing Carbon Initiative
In conclusion, regardless of whether a company has to comply with regulation, as growth occurs across emerging economies, combined with future and unmet energy demand, there remains strong potential to alter the trajectory of GHG emissions by enacting green growth policies today. Energy efficiency measures, carbon abatement technologies, and demand management including standards, technical guidelines, and incentives are integral to the policy discussion.1 These are examined in the following sections.
1 WEC. 2015. “Energy Price Volatility: The New Normal,” in 2015 World Energy Issues Monitor. https://www.worldenergy.org/publications/2015/world-energy-issues-monitor-2015/.
Countries looking to deploy carbon tax or trade schemes must consider their parameters at the outset. For instance, starting with a low-carbon price and incrementally increasing the price will allow industry to come to terms with the system and implement new technologies as they are developed and fall in cost (through targeted R&D and support programs). In addition, when considering schemes, countries must closely examine the state of competitiveness and identify which sectors should be targeted initially. This will inform negotiations with governments in key producer and consumer countries to minimize barriers to success.

A Greener Path to Competitiveness Policies for Climate Action in Industries and Products
52
INTERVENTIONS
This section explores decarbonization technologies within industry. Technology research and development, innovation spending, and producer and client acceptance are key to decarbonizing the industrial sector. However, a number of barriers need to be overcome and enablers and incentives diligently aligned in order for successful technology adoption.
As previously highlighted, decarbonization strategies must aim to minimize their impact on competiveness in order to maximize the chance of deployment at the scale and pace needed to meet carbon reduction targets. Interventions can provide significant benefits beyond financial gain, but improved valuation of these benefits is required in order for these nonfinancial benefits to be understood and integrated within investment decisions.1
Several interventions are available to industrial plant managers today. Given their link with energy costs, implementing energy efficient technologies and undertaking soft process improvements is within the industries’ own interests.
Best practice solutions exist. They are usually easy to retrofit and have quick paybacks. More innovative solutions also exist, but these are generally less mature and typically require larger investments with longer paybacks and longer operational shutdown periods.
Retrofitting existing stock is key to decarbonizing the sector, as is integrating best available technologies within new builds. It must be noted that installing new technologies alone does not automatically guarantee the largest emission-reduction potential. The manner which they are operated and maintained is crucial to realizing energy efficiency potential.2 Intervention adoption rates vary across regions, and evidence suggests that non-OECD nations have high adoption rates, which for the most part can be attributed to new builds using best available technologies within emerging economies.
Technology solutions across the industrial sector can be broadly categorized into three discrete areas:• Energy efficiency improvements• Low-carbon substitutes, both fuel and material• Innovative and alternative processes Downstream emission-reduction activities exist, which pertain to the manner in which the product is utilized further along in the value chain Such activities may entail design considerations that result in less material input and recycling opportunities at the end of a product’s use.
Table 1.3 provides examples of technological and process solutions across the four industries examined. It is worth noting that comparison between different interventions is difficult due to a large number of variables, ranging from the locations of sites to types of installed equipment. Furthermore, the gains in the implementation of different technologies and processes depend on material flows and the type and availability of feedstocks. Interventions must be tailored to geography, industry, and process in order to maximize operational success, efficiency, and GHG reduction gains.
1 Detailed commentary and suggestions on how to do this can be found in IEA. 2014. Capturing the Multiple Benefits of Energy Efficiency. 2 WBCSD (World Business Council for Sustainable Development). 2009. The Cement Sustainability Initiative: Cement Industry Energy and C02
Performance. Geneva: WBCSD. http://www.wbcsdcement.org/pdf/CSI%20GNR%20Report%20final%2018%206%2009.pdf.

53
A Greener Path to Competitiveness Policies for Climate Action in Industries and Products
Table 1.3 Examples of Technological Solutions, by Category and Industry
Iron and steel Cement Aluminum Chemicals
Energy efficiency improvements
• Furnace retrofit-top gas recycling• Basic oxygen furnace technologies• Coke dry quenching• Endless strip production• Improved oven ignition efficiency• Improved ladle heating• Continuous casting• Improved insulation• Walking beam furnace
• Kiln energy efficiency improvements• Oxygen enrichment technology• Voltage power optimization• High-efficiency belts• Electricity from waste heat• Variable speed drives• High-efficiency mills• Preheaters and precalciners
• Energy efficient smelters
• Improvements in catalyst technologies• Improved insulation• Improved steam system efficiency
Low-carbon substitutes for feedstock and fuels
• Low-carbon electricity• Biomass as fuel
• Cementitious substitution-leveraging pulverized ash, natural pozzolanic materials, ground blast furnace slag• Natural gas, biomass, hydrogen fuel switching
• Increased fuel recycling• Biomass, low-carbon methane as fuel• Electricity from waste heat
• Biomass as fuel• Low-carbon electricity• Decarbonized methane as fuel• Hydrogen by electrolysis• Recycled plastics as feedstock• Waste as fuel• Combined Heat and Power (CHP)
Alternative or innovative processes
• HISarna• Finex • Corex• Selective waste gas recycling• Increased recycling via electric arc furnaces• Co-melting and twin shells• Hot charging
• Alternative cements including Calcium Sulfoaluminate- Belite Concrete cements, magnesium-oxide-based cements, thermoplastic carbon-based cements• Fluidized bed advanced kilns• Direct separation reactors
• Direct carbothermic reduction of alumina• Kaolinite reduction• Wetted drained cathodes• Inert anodes
• Improved separation (e.g. new solvents, membrane technology)• High temperature cracking • Methanol-to-olefins1
• Retrofit Oxygen depolarized cathode (ODC )for chlorine production• New chemical pathways
Sector-wide interventions
• Carbon capture and storage (CCS), carbon capture and utilization (CCU)• Improved energy management, automation, process control, optimization, insulation, and maintenance regimes• System engineering and clustering of sites, providing efficiency gains• Efficient use of the end product and increased recycling and engagement with the value to chain to realize the benefits of a circular economy• Advanced heat recovery
Sources: IETD 2015. “Iron and Steel”; Ricardo-AEA 2013. DECC 2015.
1 Olefin, also called alkene, compound made up of hydrogen and carbon that contains one or more pairs of carbon atoms linked by a double bond. Olefins are examples of unsaturated hydrocarbons (compounds that contain only hydrogen and carbon and at least one double or triple bond). Retrieved on June 2, 2016 from Encyclopedic Britannic at http://www.britannica.com/science/olefin

A Greener Path to Competitiveness Policies for Climate Action in Industries and Products
54
Across the industrial sector, technologies that reduce system heat and energy loss, provide real time measurement of constituents, and reduce the material or energy input requirements within kilns, furnaces, and production lines are being implemented and can provide important gains. Robust data on technology adoption rates, costs, readiness levels, and performance is currently lacking, and success extends beyond installation, requiring diligent supporting management processes. Box 1.4 outlines the state of best-available-technology adoption.
ENERGY EFFICIENCY IMPROVEMENTS
Industrial energy efficiency interventions can simultaneously assist in increasing energy productivity and reducing the cost of energy. It can therefore be a very attractive up-front investment that pays for itself over time.
Energy efficiency improvements for the most part can be classified as incremental solutions that can be integrated within existing infrastructure (see Figure 1.23). Each intervention offers small to medium gains in efficiency. In total, the global or sector gain can be significant. Indeed, the IEA identified that about 40 percent of the emissions reductions required by 2050 could come from energy efficiency interventions, and despite good take-up to date across the industrial sector, there is still ample room for economic and climate gain.1 Significant energy efficiency gains have been experienced across European industry. These gains can be attributed to both technological improvements, such as improved utilization rates of plants and equipment, and structural changes, such as the closure of inefficient plants.2
Deploying energy efficiency interventions in the industrial sector can be challenging, because interventions may require expensive plant shutdown periods (depending on the size of the intervention), but these closures are expected to be less significant than innovative or alternative process integration. Furthermore, the literature suggests that the benefits and paybacks of certain interventions available today outweigh potential losses, which are at times overstated. Energy managers are required to carefully plan improvements before implementing an energy reduction program. In particular, care should be taken not to implement potential improvements that are of no economic value, have a knock-on effect elsewhere that has not been assessed, and waste time in improving the wrong part of the processes.3
In addition to improving energy practices, gains can be realized through deployment of state-of-the-art machinery and components. Retrofitting industrial operations or including best available energy efficient machinery and system components within new builds can provide valuable energy efficiency gains. Furthermore, designing new builds with a view for future system integration facilitates future energy efficiency realizations.
Figure 1.23 Energy Maturity Model
Energy reduction
Source: Adapted from Oung, K. 2013.
Housekeeping Process integrationControl systems Alternative
processesSimple
modification
1 IEA. 2015a. Energy Efficiency Market Report 2015.2 Arens, M., E. Worrell, and J. Schleich. 2012. “Energy Intensity Development of the German Iron and Steel Industry between 1991 and 2007.” Energy 45 (1):
786–797. http://www.sciencedirect.com/science/article/pii/S0360544212005427. 3 Oung, K. 2013. Energy Management in Business. Farnham. Gower Publishing.
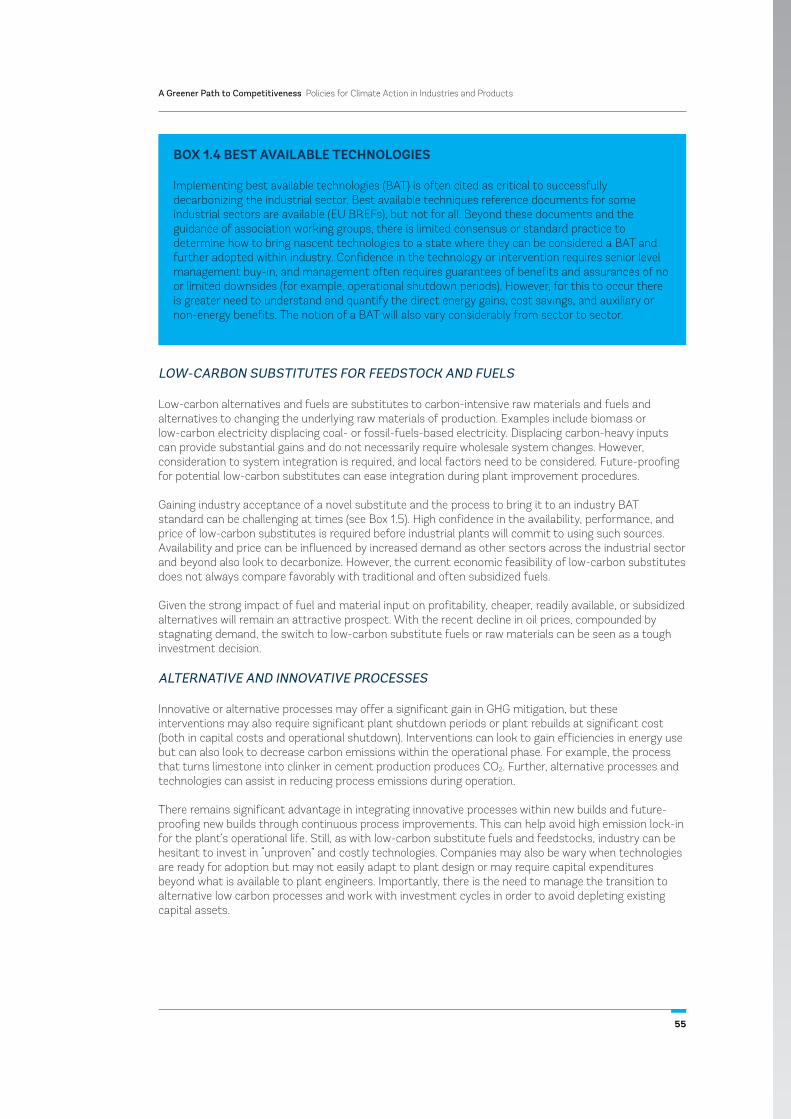
55
A Greener Path to Competitiveness Policies for Climate Action in Industries and Products
LOW-CARBON SUBSTITUTES FOR FEEDSTOCK AND FUELS
Low-carbon alternatives and fuels are substitutes to carbon-intensive raw materials and fuels and alternatives to changing the underlying raw materials of production. Examples include biomass or low-carbon electricity displacing coal- or fossil-fuels-based electricity. Displacing carbon-heavy inputs can provide substantial gains and do not necessarily require wholesale system changes. However, consideration to system integration is required, and local factors need to be considered. Future-proofing for potential low-carbon substitutes can ease integration during plant improvement procedures.
Gaining industry acceptance of a novel substitute and the process to bring it to an industry BAT standard can be challenging at times (see Box 1.5). High confidence in the availability, performance, and price of low-carbon substitutes is required before industrial plants will commit to using such sources. Availability and price can be influenced by increased demand as other sectors across the industrial sector and beyond also look to decarbonize. However, the current economic feasibility of low-carbon substitutes does not always compare favorably with traditional and often subsidized fuels.
Given the strong impact of fuel and material input on profitability, cheaper, readily available, or subsidized alternatives will remain an attractive prospect. With the recent decline in oil prices, compounded by stagnating demand, the switch to low-carbon substitute fuels or raw materials can be seen as a tough investment decision.
ALTERNATIVE AND INNOVATIVE PROCESSES
Innovative or alternative processes may offer a significant gain in GHG mitigation, but these interventions may also require significant plant shutdown periods or plant rebuilds at significant cost (both in capital costs and operational shutdown). Interventions can look to gain efficiencies in energy use but can also look to decrease carbon emissions within the operational phase. For example, the process that turns limestone into clinker in cement production produces CO2. Further, alternative processes and technologies can assist in reducing process emissions during operation.
There remains significant advantage in integrating innovative processes within new builds and future-proofing new builds through continuous process improvements. This can help avoid high emission lock-in for the plant’s operational life. Still, as with low-carbon substitute fuels and feedstocks, industry can be hesitant to invest in “unproven” and costly technologies. Companies may also be wary when technologies are ready for adoption but may not easily adapt to plant design or may require capital expenditures beyond what is available to plant engineers. Importantly, there is the need to manage the transition to alternative low carbon processes and work with investment cycles in order to avoid depleting existing capital assets.
BOX 1.4 BEST AVAILABLE TECHNOLOGIES
Implementing best available technologies (BAT) is often cited as critical to successfully decarbonizing the industrial sector. Best available techniques reference documents for some industrial sectors are available (EU BREFs), but not for all. Beyond these documents and the guidance of association working groups, there is limited consensus or standard practice to determine how to bring nascent technologies to a state where they can be considered a BAT and further adopted within industry. Confidence in the technology or intervention requires senior level management buy-in, and management often requires guarantees of benefits and assurances of no or limited downsides (for example, operational shutdown periods). However, for this to occur there is greater need to understand and quantify the direct energy gains, cost savings, and auxiliary or non-energy benefits. The notion of a BAT will also vary considerably from sector to sector.

A Greener Path to Competitiveness Policies for Climate Action in Industries and Products
56
SECTORWIDE INTERVENTIONS
A range of interventions are applicable across all industrial sectors. First, operating and system management improvements can result in energy gains, realized through energy management systems (EnMS).1 EnMS is an approach that helps energy managers think systematically about the use of energy within the plant and allows them to take action and measure impact. A well-implemented EnMS can provide the foundation for energy efficiency improvements, improved process control and automation, recycling and reuse of material, and operation and maintenance regimes. These are broad actions that can be undertaken across all industrial sectors and are conducive to current best practice management and site operating procedures.
Second, carbon capture, through carbon capture and storage (CCS) or carbon capture and utilization (CCU), offers significant potential for CO2 abatement, offering up to about 85–90 percent in emissions reduction2. CCU in theory involves leveraging captured CO2 and redirecting it to processes that can utilize CO2 waste, for example, ammonia, drinks, and enhanced oil recovery.
Demand in the industrial sector is likely to be relatively small in the immediate future because centers of demand are likely to be geographically dispersed, which results in entailing upward pressure on transportation costs. In addition, questions remain on the permanency of CO2 abatement through CCU due to the potential rerelease of CO2 emissions into the atmosphere. However, CCU is viewed by some as a good bridging technology or option to CCS as it helps offset the current high costs of deployment. CCS is the process of capturing carbon from emitting sources and storing it underground. It offers strong potential to the power sector, with potentially less immediate application within the industrial sector (due to a weaker cost-benefit analysis and a greater variety of CO2 sources that require integration into a CCS plant.)3 Industrial application will likely increase if industrial sites are able to connect to CCS power supply sites via a network of integrated pipelines.
BOX 1.5 GAINING ACCEPTANCE FOR LOW-CARBON CEMENTS
Gaining sector-wide acceptance for low-carbon substitutes to Portland cement CEM I (formerly known as “ordinary Portland cement”) is challenging. End users of cement products require a cement to be “fit for purpose,” that is, made to withstand stringent structural requirements. The process of getting a novel low-carbon cement accepted is a nonlinear process with taxing sector buy-in requirements. These entail underwriting of insurance indemnities, independent certification, and initial qualification followed by national or regional standardization once the product has been tried and tested. Even after this process is completed, gaining acceptance is challenging with customers who are risk averse and have to adhere to compliance requirements, such as legal or engineering codes of practice. A route to acceptance and sector-wide deployment would involve demonstration projects and significant capital expenditure given that Portland cement CEM I benefits from sizeable economies of scale based on existing products and production facilities. In addition, there is no guarantee that low-carbon cement would pass structural requirements. Finally, due to the importance of in-country economic activity and local production, government has an incentive to maintain the status quo and avoid disruption to the current value chain. This can deter a move away from established Portland cement CEM I value chains to novel low-carbon cement solutions.
Source: MPA Cement 2013.
1 ISO recently released the ISO50000 EnMS. However, it is worth noting that while EnMS provides a framework to take and monitor action, the ISO application provides no guarantee of significant results.
2 IPCC. 2005. Carbon Dioxide Capture and Storage. https://www.ipcc.ch/pdf/special-reports/srccs/srccs_wholereport.pdf3 Challenges include considerations in how to process varying concentrations of CO2 emissions across different sectors, and future-proofing for CCS
integration within planning processes for new builds.

57
A Greener Path to Competitiveness Policies for Climate Action in Industries and Products
CCS requires sustained demonstration and further consideration of technical aspects before wide spread adoption occurs within the industrial sector. Government intervention and support is required to assist in kick starting CCS plants.
Third, industrial symbiosis through the clustering of sites and interventions such as advanced heat recovery and transfer can provide important efficiency gains and reductions in GHG emissions. The process of sharing resources, particularly industrial waste, among different businesses is referred to as industrial symbiosis. In order to increase the sustainability of industrial production, there is the underlying need to identify and evaluate opportunities to share resources (including materials, energy, and utilities) among production units. This is particularly true in complex production sites, such as those for steel making and chemical production. There are strong economic and sustainable benefits to industrial symbiosis for both the producer and consumer of industrial waste. Competitive advantage and improved environmental performance through industrial symbiosis is demonstrated by the industrial park in Kalundborg, Denmark, where savings of 130 kt CO2 emissions per year and reduced water consumption by 1.2 million m³ per year were realized (Figure 1.24).1 However, strong cooperation and long term commitments between firms is required to achieve successful implementation2.
Figure 1.24 An Example of Industrial Ecosystem in Denmark
Source: Sustainable Sanitation and Water Management (SSWM) 2010.
Industrial Ecosystem at Kalundborg, Denmark
1 Onita, J. A. 2006. “How Does Industrial Symbiosis Influence Environmental Performance?” MSc thesis, Linköpings University, Sweden.2 Danielsson, “M. Reuse Water between Business”. SSWM. http://www.sswm.info/content/reuse-water-between-businesses. Retrieved November 2015.
Finally, given the energy-intensive nature of the industrial sector, decarbonization of the power sector through a shift to renewables could significantly help alleviate the sector’s GHG footprint. However, certain industries require constant base loads for operation, and the “peaky” nature of a portfolio of intermittent renewables are not well suited for industrial energy needs. Hydro, geothermal, natural gas, and nuclear are well suited to meet the industrial sector’s production needs. Grid and energy system balancing technologies (such as energy storage) are required to support a shift to renewables, and the implementation of these are beyond the control of the industrial sector.

A Greener Path to Competitiveness Policies for Climate Action in Industries and Products
58
EXAMPLES OF GHG IMPROVEMENTS ACROSS INDUSTRIAL SECTORS
Boxes 1.6 through 1.9 briefly highlights examples of GHG-reducing technologies and the associated pros and cons across the four industry sectors that are the focus of this report: iron and steel, cement, chemicals, and aluminum.
BOX 1.6 IRON AND STEEL GHG REDUCTION
The largest share of sector emissions occurs from the primary steel-making process. The energy efficiency of steel-making facilities hinges on the production route, type of iron ore and coal used, the steel product mix, operation control technology, and material efficiency.1
Efficiency interventions, such as the ones listed below could provide good opportunity for GHG reduction gains:• Reduce waste gas emissions related to power generation• Update control systems for hot and cold rolling mills to improve material efficiency, • Increase recycling rates• Move to higher value steel and more efficient use• Adopt breakthrough CCS
Estimates show there is still technical potential to reduce CO2 emissions and energy consumption by 20 percent2 driven by a reduction in output and increased efficiency, the EU-27 steel sector’s emissions decreased by 25 percent from 1990 to 2010.3
Practices on efficiency improvement in EUThe majority of European steel emissions are associated with the highly energy-intensive basic oxygen furnaces (BOFs). Shifting from BOF technologies to EAF (which uses reduced or scrap iron, thus omitting the need for coke and iron-making processes) and achieving efficiencies in smelting reduction provide significant gains. These, however, are dependent on securing access to supplies of scrap steel. The EU’s EAF sector produces 42 percent of all EU crude steel from scrap. Compared to the blast furnace sector, it consumes 78 percent less energy and generates 85 percent less CO2.4
It should be noted that BOFs are used to create higher grade steel (for use, for example, in the auto industry), while EAF primarily produces lower grade steel (for construction, for example). Therefore BOF innovations are required in addition to reductions through EAF’s use of scrap iron. Novel technologies applied to BOFs offer future potential gains in carbon reduction-for example, through the use of BOF heat and gas recovery, CO2 reductions are estimated at 50 kilograms (kg) per ton of steel.5 A plant in Belgium applied BOF gases resulting in CO2 reductions of 170,000 tons per year.6 Finally, potential exists in reducing emissions in the supply of power to the plants.
1 World Steel Association 2014b. 2 IEA 2009. 3 BCG 2013. 4 LaPlaceConseil 2013.5 US EPA 2010. 6 ArcelorMittal 2015.

59
A Greener Path to Competitiveness Policies for Climate Action in Industries and Products
BOX 1.7 CEMENT GHG REDUCTION
Cement-related CO2 emissions account for 5 percent of global emissions. In the United States the cement industry has been identified as the most energy-intensive of all manufacturing industries.1 However, the carbon intensity of cement has decreased 3– 5 % since 2005 in the EU.2 The industry as a whole has managed to partially decouple GHG emission growth with production, but further action is required to maintain this trend. Approximately 60 percent of the cement industry’s direct CO2 emissions arise from the decomposition of the raw materials, with the remaining arising from burning of fuel during the manufacturing process. Indirect emissions from electric power contribute an additional 10 percent to overall CO2 emissions.3 Interventions should therefore aim to focus on the reduction of process, fuel-related, and indirect emissions. Potential levers for GHG reduction include:• Alternative fuels• Energy efficiency improvement • Clinker substitution• Efficient cement use• Development of alternative cements• CCS technologies.
Among which, fuel switching, process optimization within kilns, and clinker substitution offer the greatest immediate potential today.
• Fuel switching: Industry estimates note that alternative fuels could provide 60 percent of kiln energy requirements, which could include up to 40 percent biomass by 2050.4
• Process optimization within kilns: Multistage preheater/precalciners dry kilns offer greater fuel efficiency than wet kilns. Adoption of decarbonization strategies within the EU has started to take place largely through fuel switching to biomass and waste fuels in cement production. However, investment is required to successfully move away from the heavy dependence on petroleum coke and coal.
• Fuel substitution may be hindered by increasing costs of low-carbon alternatives as demand increases from other sectors that are also looking to reduce their carbon footprint. Interventions such as substitution away from Portland cement CEM I to low-carbon cements (for example, CSA-belite and MSWIA cements), which are produced at lower temperatures (about 1200°C) and already adopted in China and Japan, can result in 25 percent energy gains and 20 percent reduction in CO2.5 In addition, the use of magnesium-based cements provides the potential to bypass the GHG-heavy calcination process.
• Energy efficiency improvement: Downstream efficiencies and the use of combined heat and power offer good mitigation potential.6 Through the adoption of best available technologies, it is estimated that global energy intensity could reduce 1.1 GJ/t-cement resulting in a CO2 saving of about 119 Mt.7
1 US EIA 2013. 2 Climate Strategies 2014. 3 IEA and WBCSD 2009. 4 Cembureau 2013.5 Imababi, M. et al. 2012. 6 Ricardo-AEA 2013. 7 IEA and WBCSD 2009.

A Greener Path to Competitiveness Policies for Climate Action in Industries and Products
60
BOX 1.8 CHEMICALS GHG REDUCTION
There is a wide range of technologies and processes that can assist in sector decarbonization.
Table B1.8.1 Decarbonization technologies1
Solutions with short-term payback period
Deep carbon reduction solutions
Low technical risk options (with relatively low costs)
Distillation column design Process control
Advanced membrane Solvent Catalyst technologies
Improved insulation Increased heat recovery More efficient steam systems
Clustering of sites can create synergies, reduce energy use, increase recycling, and therefore help to reduce emissions. Further, substitute feedstocks and CHP can greatly assist in the decarbonization of the sector.2 The bulk of carbon and energy stored in synthetic organic materials is released in the use-phase or in the waste phase, indicating that in addition to energy efficiency, biomass feedstock could help to decarbonize the sector.3
The IEA estimated energy savings between 5 and 15 percent were possible in the short term. Since 1990 the United States chemical industry has cut its GHG emissions by 13 percent, while in the EU energy used per unit of chemical output decreased by 53 percent compared to 1990 levels.4 Overall energy consumption fell by 16 percent in the EU chemical industry compared with 1990 levels; this was primarily achieved by using CHP, continuous process improvements, and shifts to less energy intense products.5 Due to the high use of chemical products in other sectors, reducing GHG emissions in the production process will allow reductions in embedded emissions in a wide variety of end-use products.6 Life-cycle assessments are important to assess the impact of chemical products, as the impact of technological interventions on embedded emissions is complex and uncertain.
1 Ricardo-AEA 2013. 2 IETD 2015. 3 IEA 2009. 4 ICCA 2013. 5 Cefic 2014. 6 ICCA 2013.

61
A Greener Path to Competitiveness Policies for Climate Action in Industries and Products
BOX 1.9 ALUMINUM GHG REDUCTION
From 1990 to 2010, energy required to smelt one ton of aluminum was reduced by 10 percent, with industry goals for a further 5 percent reduction by 2020.1 The majority of production emissions originate from indirect sources due to the high electricity consumption required within the reduction and smelting process. Aluminum production is powered by electricity, generated predominantly through power sources such as coal, gas, and hydro power. The extent of the carbon emitted will depend on the source utilized. China’s dependence on coal, for example, will result in higher levels of CO2 than found in Norway’s plants, which are predominantly generated via hydro power. It should be noted that renewable energy providing intermittent power (e.g. wind) is not particularly well suited to the sector as it requires a constant source of power. However, aluminum smelters provided they have production flexibility, may play a role in supporting the shift to intermittent renewables sources by running when there is excess power, and powered down during supply shortages.2 Decarbonization of the power sector (either through renewables or through the application of CCS) could significantly reduce indirect CO2 emissions.
Recycling and resource efficiency is increasingly an important part of the aluminum industry producing aluminum from recycled scrap is 20 times less energy intensive than production from ore.3 Direct emissions, in the EU, from the primary smelting and casting of one tonne of aluminum are between 1.5 and 2.7 tCO2, whilst recycling aluminum emits about 0.2 tCO2 per tonnes of product.4 Gearing supply chains toward the characteristics of a circular economy can assist in decreasing energy and input costs for producers. Current action advocated by the European Aluminum Association is to maximize the energy-saving potential of aluminum products, increase recycling through improved aluminum collection, and streamline energy use during production.5 Direct decarbonization technologies such as carbothermic reduction and Kaolinite reduction are still in development and need further capital resources to reach the commercial stage. Applying best available technologies provides the potential to reduce emissions in production by 11 percent.6 Efficiency in the smelting process varies according to the applied technology. The best smelters use 13 kWh of electricity compared to the world average of 15 kWh.7 In addition, the combination of high electricity use and steam for calcination and refining processes mean that combined heat and power can be deployed for facilities that don’t have access to hydro power.8
1 World Aluminum 2015. 2 Brown, T. et al. 2012. 3 Ibid.4 Ecofys 2009 2015.5 European Aluminum 2015.6 IEA 2014. 7 Alcoa 2015. 8 Vivid Economic 2014.

A Greener Path to Competitiveness Policies for Climate Action in Industries and Products
62
BARRIERS AND DRIVERS
Energy efficiency and decarbonization interventions can play a crucial role in reducing the industrial sectors’ GHG footprint and contributing to cost reductions. However, these interventions require immediate capital expenditure while offering only future savings, which are incremental and can encounter verification and measurement issues, making them potentially unattractive.1
The rate of development and adoption of technological solutions across the industrial sector is hindered by a number of barriers, which can be summarized as follows (see also Box 1.10):
Cost • High capital costs of technological solutions, compounded by competing internal demands for capital• Unattractive payback periods and return on investment• Difficulty in valuing noneconomic benefits related to low-carbon interventions• Low, uncertain, and lack of price for carbon, both regionally and nationally, reducing confidence in
pricing mechanisms and future cost and distorting competitionInstitutional and market barriers • Lack of enough targeted regulations and lack of coherency among those that exist deter investment• Lack of customer awareness and demand for low-carbon products• Internal and external risk aversion, which is compounded by policy, standards, legal requirements, and
client expectation lock-in2
• Long economic life of industrial plants (more than 25 years) limits opportunities to introduce new technologies (due to long investment cycles)
• High sensitivity to fuel and resource prices, which when distorted through subsidies can impact sector competitiveness
Technical barriers • Relatively old plant systems may not be compatible with new technologies• Lack of experienced and skilled staff with knowledge to deploy measures• Unproven technology and low technology readiness (for example, CCS)• Raw material availability
Despite the challenges, encouraging levels and demonstrable adoption of green growth interventions have occurred across the industrial sector. This is evidenced by carbon reductions to date.3 There are numerous factors driving the development and deployment of low-carbon industrial interventions. The key factors can be summarized as follows:
• Cost control and desire to improve profitability and remain competitive-in particular the price of fuel or energy and resources as an input can impact sector competiveness at the national and global levels
• The desire to reduce to the environmental impact of production • Compliance with and or future-proofing for regulations and government policies
Public and client demands for greener products and the importance of a green brand are at times cited as drivers that could lead to the deployment of energy efficient and carbon friendly interventions. However, across the industrial sector the tangible impact of client demands on green growth investment decisions within companies is uncertain, with the expectation that client demands on quality, durability, price, and internal cost considerations trump sustainability drivers.4
1 WEC. 2015. “Energy Price Volatility.”2 Consider, for example, moral and legal obligations on design engineers and architects to utilize Portland CEM I cement over novel cements whose durability
is yet to be fully vouched by end-use customers. MPA Cement. 2015. “Modern Cements (Bulk).”3 See, inter alia, IETD. 2015. “Iron and Steel”; WSA. 2014. “Energy Use in the Steel Industry”; Cembureau. 2014. Activity Report 2014; World Aluminium. 2015.
“Energy & Water”; and Cefic.2014. “The European Chemical Industry: Facts and Figures 2014”4 MPA Cement. 2013. “Novel Cements.”

63
A Greener Path to Competitiveness Policies for Climate Action in Industries and Products
BOX 1.10 SHORT-TERM VOLATILITY IN ENERGY AND COMMODITY PRICES DETERS LOW-CARBON TECHNOLOGY INVESTMENT
Short-term volatility in energy and commodity prices deters carbon technology investment despite long-term trends depicting a steady growth in prices. Business understandably operates and makes investment decisions with a short-term horizon in mind. The current global markets are deeply uncertain, with volatility across energy and commodity prices. A difference exists between secular demand (long-term projections) and cyclical demand (affected by events such as financial crises). The main driver for carbon-reduction technology implementation has been the ability for these to counter the cost of energy and the availability and cost of input commodities. Long-term secular projections demonstrate that costs are expected to increase and availability to decrease, making a strong business case for implementation. However, recent projections highlight a decrease in commodity prices over the short term (as shown in figures B1.10.1 and B1.10.2). The decreases in price are due to a decrease in global demand arising from the recent economic downturn. Metal prices in particular have fallen due to slowing demand from China and substantial increases in the supply of metals. These short-term fluctuations are potentially challenging for plant managers. Such managers are faced with the complex decision-making process of trying to understand the business case for plant refurbishments or technology interventions. Included within the set of criteria will be a cost benefit of the solution compared to the current setup. Uncertain evolution of the price of commodities (see Figure B1.10.2, which demonstrates the large future variation in the price of crude oil brent) can make low-carbon technology investment a risky investment.
Figure B1.10.1 Commodity Price Indices (2005 = 100)
2005 06 07 08 09 10 11 12 13 14 Aug.15
50
75
100
125
150
175
200
225
275
250
300
All Commodities Food
Energy Metals
Figure B1.10.2 Brent Price Prospects (US$ per barrel)
2017 2018 20192015 2016201420132012
-20
0
20
40
60
80
100
120
140
Futures
68 percent confidence interval 95 percent confidence interval
86 percent confidence interval
PATHWAY FOR TECHNOLOGY DEPLOYMENT
A wide number of studies have been carried out on the potential impact of interventions to reduce carbon emissions across the industrial sector. These studies identify carbon capture as the greatest opportunity in terms of the volume of emissions abatement, with several other interventions also able to deliver substantial reductions. Figure 1.25 displays a 2014 meta-analysis of interventions across the cement sector and their potential abatement impact by 2050. A similar pattern of opportunities exists across most industrial sectors, with carbon capture dwarfing other interventions in potential carbon abatement.1
However, the future of carbon capture is uncertain, with increased demonstration required to prove the technology and bring it to a higher readiness. Recent developments have put into question the exact timing of carbon capture development and deployment. Furthermore, once proven, both CCS and CCU interventions entail significant capital investment. At least at current costs they will require policy incentives such as carbon prices and synchronization of future plant locations with CCS/CCU sites or pipe networks in order to be viable solutions. In light of the challenges to deployment of CCS in the short term, there is a strong need to deploy-and, where still necessary, develop-industrial energy efficient improvements, both technological and procedural, and develop and deploy low-carbon substitutes for feedstocks and fuel. In tandem there is a strong requirement for the public sector to support the development of early stage alternative or innovative processes.
1 It should be noted that such analysis carries inherent uncertainties, and actual carbon reduction across any given plant will vary significantly and be dependent on a wide range of factors.
Source: IMF 2015.

A Greener Path to Competitiveness Policies for Climate Action in Industries and Products
64
LOW-CARBON TECHNOLOGIES’ ROLE IN COMPANY COMPETITIVENESS
Given recent structural market changes and increased global competition, there is a strong drive across each of the industries examined to reduce costs in order to remain competitive. Remaining competitive and implementing decarbonizing strategies are not necessarily mutually exclusive. In fact they often correlate.
Currently, low-carbon technology implementation rates vary across the sectors. By and large, there has been good uptake in both Western production facilities, where companies have sought to counteract high energy prices and carbon policies, and across new builds in emerging economies, where companies have sought to minimize operational costs from the outset.
High energy and feedstock prices provide an incentive for the partial adoption of low-carbon technologies, substitutes, and process improvements. Companies that implement these measures reduce the quantity of energy and commodities consumed and enhance their competitive position vis-à-vis companies that do not implement these measures. However, with current low costs of traditional fossil fuels and commodities,1 the business case for low-carbon technology investment is difficult and unlikely to be prioritized as a means to improving competiveness.
The extent to which low-carbon interventions are advanced as a means to improve competitiveness largely depends on the following:
• The ability to provide quick paybacks • Minimal operational disruption• Absolute value of the intervention, that is, how much capital the intervention will tie up• Access to finance• The cost of current inputs versus the cost following the intervention• A world with a strong and globally implemented carbon policy and limited energy subsidies• The extent to which competitors around the world are implementing these measures
There are a suite of interventions available to industry to decarbonize and modernize their operations, albeit over different timelines.2 These are summarized in Figure 1.26.
Figure 1.25 Potential Carbon Abatement Potential across the Cement Sector by 2050
60%
50%
40%
30%
20%
10%
0%
Source: Climate Strategies 2014.
Baseline Adjustments are based on the data collected from GNR database Pre-treated waste have been calculated with the assumption that alternative fuel use mainly consists of biomass and pre-treated waste.
Perc
enta
ge S
hare
of E
mis
sion
s R
educ
ed b
y 20
50
Biomass (waste) Pre-treated (waste) Energy Efficiency Clinker SubstitutionSubstitution/Efficient
Use of CementInnovative
Cement Based Materials
Carbon Capture and
Storage
IEA
(low
dem
and
scen
ario
)
UK
Com
mitt
ee o
n C
ilmat
e C
hang
e
Ecof
ys/W
WF
Ass
ocia
tion
Min
eral
Pro
duct
s A
ssoc
iatio
n
WB
SD/E
CR
A Te
chno
logy
Rep
ort
IEA
low
dem
and
scen
ario
Ecof
sy/W
WF
UK
Com
mitt
ee o
n C
limat
e C
hang
e
Cem
bure
au
Min
eral
Pro
duct
s A
ssoc
iatio
n
WB
SD
/EC
RA
Tec
hnol
ogy
Rep
ort
IEA
low
dem
and
scen
ario
Ecof
ys/W
WF
UK
Com
mitt
ee o
n C
limat
e C
hang
e
Cem
bure
au
Min
eral
Pro
duct
s A
ssoc
iatio
n
WB
SD
/EC
RA
Tec
hnol
ogy
Rep
ort
IEA
low
dem
and
scen
ario
IEA
low
dem
and
scen
ario
IEA
low
dem
and
scen
ario
IEA
low
dem
and
scen
ario
Ecof
ys/W
WF
Ecof
ys/W
WF
Ecof
ys/W
WF
Ecof
ys/W
WF
UK
Com
mitt
ee o
n C
limat
e C
hang
e
UK
Com
mitt
ee o
n C
limat
e C
hang
e
UK
Com
mitt
ee o
n C
limat
e C
hang
e
UK
Com
mitt
ee o
n C
limat
e C
hang
e
Cem
bure
au
Cem
bure
au
Cem
bure
au
Cem
bure
au
Min
eral
Pro
duct
s A
ssoc
iatio
n
Min
eral
Pro
duct
s A
ssoc
iatio
n
Min
eral
Pro
duct
s A
ssoc
iatio
n
Min
eral
Pro
duct
s A
ssoc
iatio
n
WB
SD
/EC
RA
Tec
hnol
ogy
Rep
ort
WB
SD
/EC
RA
Tec
hnol
ogy
Rep
ort
Share of Total Emissions Reduced Baseline Adjustment
2 Climate Strategies. 2014. Carbon Control and Competiveness Post 2020.
1 Since 2000, the main trend in commodity and energy has been upward. Current low levels are a relatively recent fluctuation.
High abatement options revolved around CCS, a technology that isn't
economically competitive today.

65
A Greener Path to Competitiveness Policies for Climate Action in Industries and Products
Figure 1.26 clearly places energy efficiency interventions at the forefront of available options that can reduce GHG emissions without damaging a company’s competitiveness. Generally, these interventions are easy to implement, require relatively low capital expenditure, have low payback periods, and have low transaction costs. These interventions would sit on the left-hand side of a marginal abatement cost curve and could be implemented without a price on carbon.
More complex interventions, which require substantial capital expenditure and in some cases further development, may not help companies achieve competitive advantage in today’s current environment. Policy levers, such as a strong carbon price and cap-and-trade scheme across key competing countries, are required in order for these interventions to provide a net benefit to business. Without such levers there is little incentive for deployment.
More complex carbon abatement interventions should not be discounted, however, as innovative abatement technologies will be required in order to further decarbonize industry to meet long-term carbon abatement targets. Strategizing on the right policy-enabling environment and strong innovation R&D support is needed in order to reduce costs and facilitate deployment in the medium term.
Figure 1.26 The Impact of Interventions on Competitiveness
Context for successful
implementation
Energy efficiency
Current impact of interventions on competitiveness
Low-carbon substitutes Innovative abatement technologies
- Business as usual- Low margins/high costs
- Early movers- Dependent on price and
availability of substitutes- Extent of Policy Support
- Global carbon policy agreements
- Period of economic growth- Strong innovation support
Low HighExtent of policy support
= positive impact for companies who implement these versus those who do not.
= both positive and negative impacts for companies who implement these versus those who do not (dependent on market and company circumstances).
= negative impact for companies who implement these versus those who do not.

A Greener Path to Competitiveness Policies for Climate Action in Industries and Products
66
Broadly, energy efficiency measures that have an acceptable payback rate will provide a competitive advantage, achieved through cost reduction.1 Retrofitting existing plants with low-cost, quick-payback energy efficiency solutions is particularly pertinent for business located in countries with high energy costs. Countries with a low energy costs often maintain this via energy subsidies. The longevity of such policies, which are increasingly negatively viewed, is uncertain, and therefore it is in the interest even of businesses within these countries to tackle such uncertainty through proactive technology adoption. This can future-proof such companies for potential increases in energy costs. New builds in emerging economies have been able to implement best available energy efficient technologies, giving them a further competitive edge over traditional production centers.
Conversely, carbon abatement technologies (such as CCS) contribute additional costs to a business and will likely provide a competitive edge only if there is a strong global carbon cap-and-trade and carbon tax scheme. These technologies require wholesale changes that are capital intensive with long payback periods. Installing these technologies can require shutdown periods that disturb market supply and key customer relationships.
Finally, substitute fuels and feedstocks may be compatible with competitiveness. However, this depends on the price of traditional fuels and or the extent of government subsidies in the home country and in key competing countries.
To gauge the appetite for adoption of technologies, it is important to understand why organizations undertake sustainability-focused actions (see Box 1.11). Businesses undertake voluntary decarbonizing actions only if they are likely to support company growth or reduce costs, with an acceptable return on investment. Scarcity of capital and natural resources have pushed these industrial sectors toward the use of best available technologies that can help to reduce costs and remain competitive. However, not all industrial sectors are alike, and the motivational factors behind investment decisions and the market conditions that influence these vary according to subsector and geographical locale.
Figure 1.27 Impact of Interventions on Abatement Potential, Timeframe, and Cost
State-of-the-art plant using best available technologies Short–Long
Resource efficiency, circular economy measures Medium–Long
ActionTimeframe of
implementation
Low Low
Low–Medium Negative–Low
Low–High Low–High
Medium–High Negative–Medium
High Medium–High
High High
Abatement potential Cost
Adoption of cost-effective energy efficiency options Short–Medium
Carbon capture and storage (CCS) Long
Passive operational energy efficiency measures (e.g. measurement and
benchmarking)Short
Novel low-carbon processes (excluding CCS) Medium
Source: Based on Brown, T. et al. 2012.
1 Investments that provide paybacks within two to four years are generally deemed acceptable. However, in periods of scare financing, acceptable payback periods may be shorter.

67
A Greener Path to Competitiveness Policies for Climate Action in Industries and Products
RECOMMENDATIONS
In the international arena, a shift in perspectives is taking place. Climate change is no longer identified as a burden. In many quarters, it is seen as an opportunity. Emerging economies see that they can transition to a clean energy pathway, avoiding the historical polluting pathway of Western economies. Global mitigation action across the industry and the power sectors is the surest path toward meeting the targets agreed in Paris in 2015.
However, there is currently a gap between global climate targets and the carbon reduction actions that businesses are willing to implement. To date there has been a good level of GHG emission reduction across industry, largely driven through energy efficiency interventions. However, uptake has occurred principally because there is a strong business case for reducing emissions on a cost-improvement basis, as opposed to action that is driven by carbon reduction commitments. This momentum is now at risk of being clouded by competitive concerns.
Policy makers face a dilemma if competitive concerns sit at the forefront of political decision making while carbon reduction targets take a back seat. There is the potential that targets set in Paris would be missed in deference to understandable local competitive pressures. However, this would leave policy makers in an awkward position. In the future, they would have to design frameworks to cope with higher mitigation costs associated with implementation of an accelerated decarbonization strategy. It is therefore imperative that action takes place across government, industry, and consumers.
These recommendations are divided into two sections. First, recommendations are made that would enable the uptake of technological solutions while mitigating competitiveness concerns. Second, recommendations to increase dialogue and global collaboration are presented.
ACTIONS TO DECREASE GHG EMISSIONS AND MAINTAIN COMPETITIVENESS THROUGH TECHNOLOGY ADOPTION
With shifting global dynamics and high internal and external barriers to implementation-including systemic management issues-the rationale for further carbon reduction action remains a difficult argument to make to senior company executives. This is particularly true regarding expensive and not yet mainstream abatement technologies that do not succinctly align with internal business objectives.
In short, from a business perspective the importance of decarbonizing can easily fall out of the picture. What this ultimately means is that the rate of future carbon reduction is uncertain and unlikely to be at the scale and pace required to meet ambitious carbon reduction targets.
BOX 1.11 FINDING THE RIGHT BALANCE BETWEEN REGULATION AND TECHNOLOGY SUPPORT
With competing demands for capital investments across business for future interventions, a key lever for further action remains regulation. Regulation, however, takes significant time to be designed, proposed, ratified, and implemented, the latter often with mixed results. Despite nascent signs of strong commitment to launch cap-and-trade and carbon tax schemes across a variety of global jurisdictions, the coverage of such policies remains incomplete, meaning the impact on competitiveness can be negative for the companies covered by the scheme and positive for those outside. This creates the potential for carbon leakage. A suite of carefully aligned regulatory and technological solutions are required in order to spur action in lieu of global carbon agreements. Furthermore, well-designed, sector-specific emission-reduction strategies are required. Without such support mechanisms in place, reaching carbon reduction targets will be expensive and potentially unattainable.

A Greener Path to Competitiveness Policies for Climate Action in Industries and Products
68
There is a need to develop policies that protect against carbon leakage in the short term and simultaneously create an environment that encourages the implementation of easily adoptable solutions and funding for technologies that will be key to meeting long-term targets.
From a technology standpoint, the path to decreasing GHG emissions while maintaining competitiveness is straightforward:
1. Industry should focus on cost-effective energy efficiency options that can be deployed today with short payback periods, low transaction costs, and easy-to-access finance. While many of these options have been implemented by leading companies already, there remains substantial variation in global practice, meaning opportunities for such actions still exist.
2. Industry, governments, and consumers should focus on enabling technologies and interventions that are on the cusp of cost-effectiveness. These may have positive net present values, but because they have long payback periods or high transaction costs, or finance is difficult to obtain, they are not progressing. Regulation or procurement policies can signal the direction of demand for a low-carbon product. Making consumer demand visible can encourage solutions currently at the margin of viability. S&L is an example of an enabling solution.
3. Governments should pursue framework policies such as removing distorting production subsidies or trade tariffs and putting a comprehensive price on carbon. They should also develop technology-incentive programs for solutions that currently have a weak business case-for example, in the adoption of large-scale and capital-intensive carbon abatement technologies. In addition, government should seek to adopt industry mitigation policies within strategic development plans and harmonize these across jurisdictions.
In order to achieve these, a number of key enablers need to be in place. For the most attractive energy efficiency option, the following are needed:
• Management and board buy-in on the need to decarbonize-improved valuation of noneconomic benefits can help to build the business case
• Implementation support and awareness programs, for example, energy surveys, management system and communication campaigns
For energy efficiency and substitute feedstock and fuel options where the business case remains challenging, the following are needed:
• Specific economic incentives to support the more complex energy efficiency interventions, for example, concessional (subsidized) energy efficiency finance to reduce payback periods
• Research into methods to reduce the administrative burden of complying with energy and carbon regulations
• Strong labeling schemes and building and construction codes, practices, and standards that support the implementation of novel solutions
• Additional small scale, low cost R&D demonstration support to prove survivability and reliability on the market
• Strengthening collaboration and interaction between producers and consumers-share visions and pathways for technology development and deployment
• An improved framework for changing fuels and increasing recycling• Improved finance solutions, based on greater awareness and certainty of energy payback (e.g. via
energy service companies (ESCOs) giving companies greater certainty of energy savings.
For the most ambitious carbon mitigation options, it is essential to do the following:
• Design policies to encourage private sector growth. Businesses have highlighted that what they want from government are strong and clear signals. Businesses need the time to respond to policies that may impact the way they operate. Therefore, political consensus on credible, consistent, long-term policy signals is required. This would include strong, consistent, flexible, and globally implemented carbon taxes or cap-and-trade schemes.
• Phase out country-level energy subsidies, as these have an artificial impact on competiveness and are especially detrimental to the implementation of carbon taxes or cap-and-trade schemes.

69
A Greener Path to Competitiveness Policies for Climate Action in Industries and Products
• Develop sector-specific carbon reduction strategies. Without them, achieving carbon reduction targets will be expensive and potentially unattainable.
• Provide financial support for R&D investment in early stage products and process innovations that can help overcome market barriers and increase manufacturers’ and consumers’ confidence in the technologies or resulting products. This will support the business case for breakthrough interventions.
DIALOGUE AND COLLABORATION TO ACHIEVE SUCCESSFUL OUTCOMES AT MARRAKESH AND BEYOND
With uncertainty surrounding the timing and extent of enabling technologies and the introduction of carbon prices in new geographies, international cross-sector and governmental dialogue and collaboration on interventions are urgently required.
Maintaining momentum from Paris will be key to successful implementation of the ambitious Intended Nationally Determined Contributions. Industrial decarbonization must be on the agenda, and policy makers and negotiators should not shy away from it because of competitiveness concerns. In addition, ensuring that emerging economies pursue a greener path to production is crucial. Regional dialogue will be essential to seeing success in this arena.
BOX 1.12 EXAMPLES OF DRIVING CHANGE INDUSTRIAL THROUGH COLLABORATION
International collaboration can assist the acceleration of industrial decarbonisation. A wide number of initiatives exist today, that span from company to trade association to country and international initiatives. A non-exhaustive list illustrates some of the current and recent private sector and international initiatives that look to progress the uptake of low carbon interventions across the industrial sector.
Multi Sector • UK industrial energy efficiency accelerator• EU Horizon 2020 EU-MERCI programme • SE4ALL- UN initiative
Iron & Steel • EU ULCOS programme• COURSE 50 program in Japan • Industrial Technologies Program in the United States.• Chinese Industrial Energy Performance Standards Programme• ArcelorMittal’s 10 sustainable development outcomes• Tata Steel’s certification of 19 construction products
Cement• European standards for cement and concrete• Australia investigating Alkali-activated geopolymeric cements• Roadmaps produced by DECC, MPA, WBCSD, IEA, and EU• EU Low Emissions Intensity Lime & Cement (LEILAC) Project 1
Chemicals• UN Strategic Approach International Chemical Management• The global Responsible Care initiative and EU Care+ project• EU SpiCE3 sectoral platform in chemicals for energy efficiency excellence
Aluminum• International Aluminium Institute- ‘Towards sustainable cities’• World Aluminum supported by associations in China, USA, EU and Japan push for sustainable
green growth within the industry
1. Carbon Trust. April 2016.” Breakthrough technology to be demonstrated in Europe to cut carbon from cement and lime sectors” Retrieved on June 12th, 2016 from https://www.carbontrust.com/news/2016/04/breakthrough-technology-to-be-demonstrated-in-europe-to-cut-carbon-from-cement-and-lime-sectors/

A Greener Path to Competitiveness Policies for Climate Action in Industries and Products
70
In addition to above the recommendations, policy makers should undertake the following as they devise solutions:
• Establish private-public partnerships that aim to reduce costs and increase market confidence in decarbonizing interventions. Such partnerships are already under way (see Box 1.12), but increased regional, international, and cross-sectoral collaboration and research would help improving the readiness of potential technology solutions. The goal is to future-proof companies for increasing global uptake of interventions. In particular in-situ technology demonstration programs supported by the public sector would greatly assist in building confidence and increasing uptake of expensive and unproven carbon abatement technologies. For this to occur in a timely fashion and at sufficient scale, resources may need to be pooled regionally or globally, not least to dampen competiveness concerns for any particular country or region.
• Create and maintain dedicated institutions and organizations to support these initiatives. These will be important efforts to support emerging economies as they leapfrog to a green industrial sector. However, this will require strong country and regional buy-in and a strong approach to governance and transparency.
• Supplement unilateral action on phasing out energy subsidies with dialogue at a regional level. Subsidies not only distort international competition and disincentivize action for energy efficiency but they can also create problems for industry if a subsidy is rapidly changed. Regional dialogue may increase the momentum or pressure for individual jurisdictions to act.
• Provide long-term support for local energy and industrial entrepreneurs. The oligopolistic nature of the global industrial sector is not always conducive to solutions that meet national growth needs. Finding ways to utilize Green Climate Funds will help provide autonomy for countries’ growth plans.
CASE STUDY 1 - RUSAL ALUMINUM PRODUCTION: TACKLING CLIMATE CHANGE THROUGH TECHNOLOGY INTERVENTIONS
UC RUSAL, a leading global aluminum producer, produces aluminum with one of the world’s lowest carbon footprints by utilizing the renewable hydropower resources of Siberian Russia. More than 90 percent of RUSAL’s aluminum production is powered by water. Since 1990, RUSAL has more than halved direct emissions from its smelters and continues to increase its share of energy from hydropower and other renewable energy sources. The company continues to improve its carbon footprint and aims to achieve almost 100 percent of its energy from hydropower.
Background: For a long time, RUSAL’s focus has been on cutting greenhouse gas (GHG) emissions. Today, RUSAL has one of lowest records of GHG emissions per ton of aluminum produced. RUSAL’s strategic goal is to not exceed 6 tonnes level of CO2 per ton of aluminum. Since 1990, the CO2 emissions per ton of aluminum produced from RUSAL smelters was cut by 53 percent. From 2012 to 2015, RUSAL went through a significant transformation by optimizing its output through the curtailment of its least efficient smelters which used out-of-date eco-unfriendly technologies and coal-fired energy in the European part of Russia.
Another of RUSAL’s green competitive advantages is its in-house R&D, engineering, and design resources, which enable the company to develop cutting-edge technologies, state-of-the-art equipment, and technically advanced facilities. RUSAL is the proprietor of a number of energy efficient smelter technologies, including RA-300, RA-400, and RA-500, which have helped to cut energy consumption, drive down emissions, and boost production efficiency by reducing production costs. Currently RUSAL is developing the most upgraded version of RA-potroom, introducing efficient RA-550 technology.
One of largest GHG emissions sources is oxidation of anodes made from carbon blocks, and RUSAL is currently involved in the development of inert anode cells. The use of inert anodes in the aluminum smelting process has the potential to radically reshape the industry as the only by-product of the inert anode smelting pot will be pure oxygen. Once introduced, the inert anode technology will enable RUSAL to completely eliminate any GHG and polyaromatic hydrocarbon emissions. A single reduction cell will be able to generate the same amount of oxygen as 70 hectares of forest.

71
A Greener Path to Competitiveness Policies for Climate Action in Industries and Products
Environmental initiatives and goals: Over the past three years RUSAL has invested around US$295 million to implement environmental actions. As a result, between 2011 and 2014 RUSAL managed to reduce industrial water waste by 55 percent. Among RUSAL’s key activities has been the creation of a closed-circuit water supply system for the main production processes, increasing the volume of treated and used waste products and their safe disposal, replacing and safe disposing of electrical equipment containing polychlorbiphenyls in line with Stockholm Convention on Persistent Organic Pollutants (POPs) valid till 2025, rehabilitating land and assisting in the maintenance of biodiversity, and creating corporate systems to manage environmental aspects and risks in compliance with ISO 14001:2015 environmental management systems.
In addition, RUSAL has joined the Aluminum Stewardship Initiative with a view of participating in the development of global sustainability standards for international application in the aluminum value chain. The initiative was launched at the end of 2012 by key participants in the aluminum industry including producers, converters and end users.
On a corporate level, RUSAL has identified five strategic goals for reducing GHG emissions. In particular, in 2020 the company plans to switch completely electricity produced from renewable or other carbon-free sources. At the same time, the annual consumption of aluminum smelters will be reduced by 3,400 GWh compared with 2011. By 2025, specific GHG emissions at aluminum smelters will be reduced by 15 percent and at alumina smelters by 10 percent compared to 2014. By the same date, 85 percent of RUSAL’s primary aluminum production will generate specific direct and indirect greenhouse gas emissions in CO2eq not exceeding six tons per ton of metal. This figure applies to the entire production chain, from bauxite mining to aluminum smelting.
Figure CS1.1.1 The Khakas Aluminum Smelter is the most up-to-date and Technologically Advanced Smelter in Russia
Figure CS1.1.2 “Boges,” RUSAL’s new Boguchansky Aluminum Smelter, will be the main consumer of Electricity Generated by Boguchanskaya Hydropower Plant

A Greener Path to Competitiveness Policies for Climate Action in Industries and Products
72
CASE STUDY 2 - ENERGY EFFICIENCY AT LG CHEM: REDUCING GHG EMISSIONS ACROSS THE REPUBLIC OF KOREA’S CHEMICAL INDUSTRY
LG Chem, Ltd. has grown steadily since its founding in 1947 and has become Korea’s representative chemicals company by continuously developing new technologies and products and making innovations in quality. LG Chem is transitioning from a traditional petrochemical business to high-value businesses focusing on information-electronics materials and batteries for future growth engines and is growing into a global firm offering unique materials and solutions.
LG Chem’s NCC Plant produces basic petrochemicals such as ethaline and propylene using naphtha as the key ingredient. It is located in facilities in both Yeosu and Daesan. The Yeosu facility has increased capacity from 385,000 tons of ethaline to 1,160,000 tons by revamping the plant four times since 1991. In addition, the basic petrochemicals produced at the NCC Plant have been utilized in downstream vertical integration to provide a stable supply of source material for basic chemical products. This enhances internal competitiveness.
LG Chem has gone beyond regulatory compliance by proactively taking voluntary measures to reduce energy consumption. This has led to numerous innovations. In particular, the Yeosu NCC facility operates a high-temperature cracking furnace that uses 62 percent of manufacturing costs (excluding raw material costs) for energy. Following this, LG Chem is actively reducing energy consumption to gain a comparative advantage over competitors.
In addition, the continued growth of downstream businesses has led the company to adopt a differentiated strategy for increasing production. The goal is to stabilize supply and implement an innovative and unique production process; already the company it has achieved a global level of ethaline production for a single plant.
By identifying measures to reduce energy consumption in the Yeosu NCC facility’s cracking furnace and unique new NCC processes, it has achieved the best energy intensity on a global scale.
The measures to improve efficiency in the highest consumption cracking furnace led the company’s achievements in energy intensity. First, using the new material Aerogel as an insulant reduced the exterior temperature from 90 degrees to 70 degrees, significantly reducing heat loss. In addition, the installation of a mass transfer convection and heat exchanger stack reduced flue gas temperatures from 170 degrees to 100 degrees. These are part of the many measures taken to improve energy efficiency.
Figure CS2.1 Energy Efficiency in Cracked Furnace

73
A Greener Path to Competitiveness Policies for Climate Action in Industries and Products
In addition, a new ethane process was put in place to separate the ethane that was processed in the existing NCC process. To treat it more easily, low-cost C3LPG was adopted in the new process to maximize output. Other ways of increasing production have been continuously identified in order to secure competitiveness while reducing GHG emissions.
Results: According to a study conducted by an NCC consulting specialist, Solomon Associates, in February 2013, LG Chem recorded the best energy intensity out of 115 firms across the globe. LG Chem’s Yeosu NCC Plant’s energy intensity was 4,170 kcalorie/kg, 40 percent above the global average, and it consumed 24 percent less energy than the global top 25 percent of firms. Various efforts have been made since this study to maintain the global lead position.
Table CS2.1 Comparison of LG Chem to Competitors
Source: Based on research by Solomon Associates. (Compared energy competitiveness of 115 companies worldwide)
LG Chem Global Top 25% Companies First tier Global Average
Energy intensity (kcal/kg, ethylene)
4,170 5,561 7,460
Energy costs (one hundred million KRW per year)
Base +1,310 +3,100
LG Chem is participating in efforts to combat climate change by continuously transitioning toward a low-carbon business structure and process innovation. Not only is it working toward directly reducing GHG emissions by improving energy efficiency in production processes, it is working to contribute to reducing indirect emissions by transitioning to a production structure of high-added value and low consumption products. Of these products, LG Chem is particularly focusing on developing EV batteries and supplying ESS technology.
Figure CS2.2 New insolation technology, Aerogel adoption
Aerogel installation Aerogel installation
Aerogel is installed so there is no gap between the burner tile and where it connects to
the Aerogel

A Greener Path to Competitiveness Policies for Climate Action in Industries and Products
74
INTRODUCTION
Part 2 focuses on energy efficiency S&L, which improve the energy performance of the products that households and businesses use, thereby reducing the GHG emissions associated with their use. These policies have yielded substantial reductions in GHG emissions and other public benefits. In many cases, they also benefit firms that manufacture the regulated products.
In the following sections, a review of key developments in S&L policies and their impact in terms of energy savings and GHG emissions reduction is described. A discussion of S&L impact on manufacturers in theory and practice follows that section. The study analyzes cases from countries that have long-standing product energy efficiency policies. This report is a first attempt to include analysis from the most recent cases in developing countries, complementing it with more quantitative analysis from developed countries. Future research will be needed to assess the impacts of more recently implemented policies.
It is important to note that while product efficiency policies have been implemented for the most commonly used products in a number of countries, there remains considerable potential for further expansion in geographical and product coverage and for increases in stringency.
PART 2SCALING CLIMATE ACTION AND COMPETITIVENESS THROUGH ENERGY EFFICIENT PRODUCTS
A BRIEF HISTORY OF ENERGY EFFICIENCY STANDARDS AND LABELING POLICY
Energy efficiency S&L programs for appliances, lighting, and equipment have been used by governments around the world for nearly 40 years. These programs cost-effectively reduce energy consumption and lessen peak electricity demand while maintaining the level of energy service for consumers. Policy makers can use energy performance S&L to move markets away from inefficient products and toward energy efficient ones. Minimum energy performance standards (MEPS) specify an energy performance level and prohibit the manufacture, import, or sales of new products that are less efficient than that minimum level. Energy labels describe the energy performance of a product, telling consumers how much energy it uses, how efficient it is, or what energy costs to expect. This gives consumers information necessary to make informed purchases. Figure 2.1 shows a few common examples of the two principal types of energy labels: comparative and endorsement labels.
Figure 2.1 Examples of Energy Labels

75
A Greener Path to Competitiveness Policies for Climate Action in Industries and Products
The first minimum energy performance standards were enacted in 1977 by the U.S. state of California for refrigerators and air conditioners. The first comparative label, Canada’s Energy Guide label, was introduced in 1978. In 1992 the first endorsement labeling program, Energy Star, was launched in the United States. Figure 2.2 shows the number of economies that have adopted standards and/or labeling programs since 1977. This number has grown to include at least 45 economies,1 excluding the 28 EU member states.
Figure 2.2 The Uptake of S&L Programs and Policies
Countries with an S&L Program Cumulative S&L Policies
5 200
10
15400
20
25
600
30
35
800
40
1000
45
1200
50
Cou
ntrie
s w
ith a
n S
&L
Polic
y
Cum
ulat
ive
S&
L Po
licie
s
1600
1400
Source: CLASP S&L Database 2015.
1976 1978 1980 1982 1984 1986 1988 1990 1992 1994 1996 1998 2000 2002 2004 2006 2008 2010 2012 2014
1 This number counts the European Union as a single economy. Thus, the total number of countries that have S&L programs is nearly 75.
As of 2015 these programs included at least 551 MEPS, 515 comparative labels, and 350 endorsement labels (Figure 2.3).2 These programs cover approximately 125 residential, commercial, and industrial products ranging from globally traded products such as televisions to regionally specific products, such as an industrial tortilla making machine.
Despite this progress, there are still many economies that do not have a robust S&L program in place. This includes many emerging economies where energy-demand growth rates are rising exponentially. Figure 2.4 illustrates the current number of S&L policies in various countries. Within those economies that have S&L programs, there remain many opportunities to expand product coverage and raise the stringency of the efficiency level. Demonstrating co-benefits of S&L programs such as industrial competitiveness adds to the body of evidence demonstrating the value of robust and effective appliance efficiency policies.
Figure 2.3 Total Number of S&L Policies in Effect by Type, 2015
Mandatory Voluntary
100
200
300
400
500
600
Source: CLASP S&L Database 2015.
MEPS Comparative Labels Endorsement Labels
2 See CLASP S&L Database http://www.clasp.ngo/Tools/Tools/SL_Search

A Greener Path to Competitiveness Policies for Climate Action in Industries and Products
76
Figure 2.4 Number of Standards and Labeling Policies around the Globe, by Country
0-20
81-100
61-80
41-60
21-40
>100
# of S&L Policies
Source: CLASP S&L Database 2015.

77
A Greener Path to Competitiveness Policies for Climate Action in Industries and Products
Figure 2.4 Number of Standards and Labeling Policies around the Globe, by Country

A Greener Path to Competitiveness Policies for Climate Action in Industries and Products
78
Table 2.1 Examples of Diverse Savings within Different Jurisdictions
Source: IEA-4E 2015.
Jurisdiction Product types Savings accrual period
Savings (TWh)
Savings (US$)
Savings (MtCO2e)
European Union
Ecodesign/Labeling directives
1990–2010 213 N/A N/A
European Union
Ecodesign/Labeling directives
2010–2020 1,719 120 billion 320
United StatesFederal energy and water
conservation standards1987–2013 10,753 N/A 2,113
United StatesFederal energy and water
conservation standardsIn 2013 1,187 56 billion 218
United StatesEnergy Star, voluntary
program1992–2013 2,700 295 billion 2,198
United StatesEnergy Star, voluntary
programIn 2013 380 32 billion 294
China All programs to 2020 1,143 N/A N/A
Australia Air conditioner program 2003–2020 6.5 0.8 billion N/A
Australia Refrigerator/Freezers 1986–2009 5.9 N/A 6
Fiji Refrigerator/Freezers 2012–2014 0.005 0.85 million 0.002
India All programs 2012–2030 70 N/A N/A
GHG EMISSIONS REDUCTIONS AND ENERGY IMPACTS OF S&L POLICIES
Research shows that S&L is a highly cost-effective policy tool that yields significant benefits in terms of both GHG emissions and energy demand reductions. A recent International Energy Agency-4E report, for example, summarized the energy and GHG emissions savings from a number of policies from various jurisdictions (Table 2.1).1 The scale of these savings are very significant compared to overall energy consumption, as reported in the same study:
• S&L programs are estimated to have saved 12 percent of electricity consumption and 4 percent of end-use natural gas demand in 2014 in the United States.2 The voluntary Energy Star program saved a further 5 percent of electricity consumption in 2014.
• S&L programs are estimated to have saved 6.2 terawatt hours (TWh) of electricity within the residential sector in Australia and New Zealand in 2012,3 equivalent to 10 percent of the residential sector electrical energy consumption in that year.
• The EU Eco-Design program is expected to achieve an annual primary energy savings of 19 percent by 2020 and residential sector savings equivalent to 25 percent of residential energy consumption.4
• Annual savings from residential energy efficiency programs in China are expected to save 11 percent of residential electricity use by 2020.5
1 IEA Technology Collaboration Program on Energy Efficient End-Use Equipment (4E) is a program of 12 countries from the Asia-Pacific, Europe, and North America that have joined together to share information and transfer experience in order to support good policy development in the field of energy efficient appliances and equipment.
2 Nadel, S., et al. 2015. “Energy Efficiency in the United States: 35 Years and Counting. ACEEE.”3 Equipment Energy Efficiency Committee (E3). 2014. “Impacts of the E3 Program: Projected Energy, Cost and Emission Savings, 2014.” 4 Kemna, R. 2014. Ecodesign Impact Accounting: Part 1-Status Nov. 2013. Delft, The Netherlands: Van Holsteijn and Kemna.5 Fridley, D., et al. 2007. Impacts of China’s Current Appliance Standards and Labeling Program to 2020. Berkeley, CA: LBNL.

79
A Greener Path to Competitiveness Policies for Climate Action in Industries and Products
The S&L policies already in place have achieved significant energy and GHG savings. However, there remains large potential for further energy savings that can be achieve by spreading S&L policies to additional countries (Figure 2.4), broadening product coverage, increasing the stringency of existing policies, and spurring further technological innovation. A recent European Union report estimated that global final energy consumption could be reduced by 9 percent if the most stringent MEPS were adopted and harmonized worldwide.1 The resulting savings-8,950 TWh per annum-are equivalent to the output of 165 coal-fired power plants or 132 million cars.
Another analysis by the SEAD Initiative found that improving product efficiency to the level of the best technologies available in 2010-across a group of 18 major economies-could reduce GHG emissions by 1.5 GtCO2e in 2030, an amount equal to 45% of all countries’ Nationally Determined Contributions (NDCs) taken together. This 1.5 Gt would add to the 0.5 Gt already locked in by product efficiency policies implemented during the six-year period from 2010 through 2015 (Figure 2.5).
1 NDCs data were sourced from “Aggregate effect of the intended nationally determined contributions: an update” published by UNFCCC, May 2016. Other data from unpublished analysis conducted by CLASP and LBNL on behalf of the SEAD Initiative.
2 European Union. 2015. “Savings and Benefits of Global Regulations for Energy Efficient Products: A ‘Cost of non-World’ Study.”
Adopting and harmonizing (worldwide) the most stringent MEPS could reduce 9% of the global total energy consumption2 --- The 8,950 TWh saving per annum is equivalent to shutting down 165 coal-fired power plants or getting 132 million cars off the road.
Figure 2.5 Greenhouse Gas Emissions Reductions in 2030 from Product Efficiency Policies (Gt CO2e)
0.52
-1.48
-3.3
Impact of recent policies
Remaining potential
Unit: GtCO2.e
NDCs
Sources: UNFCCC and CLASP1 2016.
Business as usual:
45%
59.5 Gt

A Greener Path to Competitiveness Policies for Climate Action in Industries and Products
80
THE IMPACT OF S&L ON MANUFACTURING COMPETITIVENESS
Appliance energy efficiency S&L programs enable consumers to make better informed decisions. They also affect manufacturers’ decisions about what to offer for sale and how to market products. S&L programs can spur innovation and drive competition in the market. In the absence of an S&L program, if most consumers were interested only in the price of products and not in energy efficiency, manufacturers would predominantly supply cheap but energy-inefficient products. Investment in R&D on energy efficiency would not be stimulated if customers did not recognize and prefer energy efficient products. Manufacturers may also be risk averse, not wanting to be first to offer significantly more efficient products whose market success is unknown.
S&L programs can have both positive and negative impacts on domestic and global manufacturers’ competitiveness. In the absence of access to capital for R&D and energy-efficient technologies, smaller domestic manufacturers may find it hard to compete. Global manufacturers may find it easier to compete and comply with standards because of more flexible manufacturing practices and dedicated resources for R&D. However, domestic manufacturers could gain consumer confidence and remain competitive if they invest in energy efficient improvements of their products and use energy efficiency labels as a marketing tool. In other words, manufacturers could use energy efficiency labels to help them differentiate their products from their competitors’.
The post implementation effects on manufacturers of appliance energy efficiency S&L programs have not been analyzed in a comprehensive way. To understand the impacts, environmental regulations can be accepted as a proxy for S&L programs within the scope of this publication, since they can be considered as a subset of S&L.
The Porter Hypothesis (PH) was identified as the theoretical foundation for the study.1 The hypothesis states that stringent but economically efficient environmental regulations can trigger environmental innovation in firms and that the innovation leads to improved competitiveness. However, the PH may not apply directly to voluntary schemes, such as voluntary S&L programs. In voluntary schemes, the stringency level is endogenous to the firm’s choice of adopting (or not) that scheme. Hence, it is not as much of a driver for innovation at the firm level as for other levels.
The PH is studied in three versions:2• The weak version of the PH suggests that stringent regulation spurs innovation as firms react to the
new restrictions on their activities.• The narrow version suggests that flexible regulatory approaches with strict objectives, such as
economic instruments, create stronger incentives for firms to innovate than more restrictive regulations, such as technology mandates.
• The strong version suggests that complying with the regulation increases firm profitability and/or competitiveness by means of innovation offsets.
The literature usually presents strong empirical evidence for the weak and narrow PH versions that show positive links between environmental regulations and innovation. However, the evidence that ties innovation to competitiveness is conflicting, and hence strong PH is not supported unanimously. The following are the potential causes identified for variation among the empirical literature’s results looking at the strong PH version:
• The study’s sector focus: Literature shows that sectors react differently to environmental regulations. Some sectors are not affected, while some are affected positively and others negatively. Chalermthanakom and Ueta3 identified electronics and food industries as sectors that are not affected. Brannlund’s4 study of five Swedish manufacturing sectors showed that pulp and paper industry is negatively affected due to regulations (which are potentially more stringent on this particular sector). Looking at EU exports, Constantini and Mazzanti)5 found that reactions are also technology-level specific: high-tech sectors respond to environmental regulations much more positively than more energy-intensive medium-tech and low-tech sectors.
1 Wagner, M. 2006. “A Comparative Analysis of Theoretical Reasoning and Empirical Studies on the Porter Hypothesis and the Role of Innovation.” Journal of Environmental Law and Policy 3: 349–368.2 Ambec, S., and P. Barla. 2006. “Can Environmental Regulations Be Good for Business? An Assessment of the Porter Hypothesis.” Energy Studies Review 14
(2): 42.3 Chalermthanakom, A., and K. Ueta. 2011. “Impact of Environmental Regulation on Productivity: Case Studies of Three Industries in Japan.” Kyoto Economic
Review 80 (2): 167–187.4 Brännlund, R. 2008. “Productivity and Environmental Regulations.” Umeå Economic Studies (728).5 Costantini, V., and M. Mazzanti. 2012. “On the Green and Innovative Side of Trade Competitiveness? The Impact of Environmental Policies and Innovation
on EU Exports.” Research Policy 41 (1): 132–153.

81
A Greener Path to Competitiveness Policies for Climate Action in Industries and Products
• The regulation’s target: It matters whether the regulation aims toward efficiency improvements or pollution mitigation matters. Efficiency improvements demonstrate positive impacts. However, mitigation-focused regulations affect firms negatively in the short term but may have long-term positive impacts. For S&L programs in particular, it should be expected there will be differences between mandatory and voluntary programs
• Time scale: Although initial impacts are negative, compliance costs can eventually be offset over time, and competitiveness impacts can eventually be positive. There may also be time lags for any effect to be observed. Some studies may have overlooked this.1 Such a time lag was the case in Chalermthanakom and Ueta’s study2 involving the automobile industry. The sector’s productivity and economic performance shifted from a negative link with environmental regulations to a positive link when a one-year lag was introduced to the model.
• Innovation type triggered: Bernauer et al.3 emphasize that different testing indicators may be required to measure whether process or product innovation is triggered by an environmental regulation and to understand the impact of these innovations on competitiveness.
Another reason for results variation is the variety of indicators used in each study for measuring competitiveness, innovation, and market share in relation to regulations. Regulations are usually identified through the costs or investments required for compliance4.
As mentioned in Part 1, indicators for competitiveness vary depending on the scale. In terms of S&L, for firm-level competitiveness, changes in market share are the most common indicator.5 For sector-level competitiveness, productivity and total factor productivity are the most commonly used indicators.6 Activity heterogeneity is also found to be a crucial indicator for determining competitiveness in a number of studies.7 Innovation is usually tested through R&D and patenting expenditures, or number or patents.8
Table 2.2 addresses the competitiveness factors as they relate to manufacturers of products affected by S&L, along with overall factors identified in major reports based on the World Economic Forum Global Competitiveness Index, Deloitte’s Manufacturing Competitiveness, and European Innovation Scoreboard.
1 Broberg, T., P. O. Marklund, E. Samakovlis, and H. Hammar. 2013. “Testing the Porter hypothesis: The Effects of Environmental Investments on Efficiency in Swedish Industry.” Journal of Productivity Analysis 40 (1): 43–56.
2 Chalermthanakom and Ueta. 2011. “Impact of Environmental Regulation on Productivity.”3 Bernauer, T., S. Engel, D. Kammerer, and J. Sejas Nogareda. 2007. “Explaining Green Innovation: Ten Years after Porter’s Win-Win Proposition: How to
Study the Effects of Regulation on Corporate Environmental Innovation?” Politische Vierteljahresschrift 39: 323–341.4 Broberg et al. 2013. “Testing the Porter Hypothesis.”; Chalermthanakom and Ueta. 2011. “Impact of Environmental Regulation on Productivity.”; Arouri, M. E.
H., G. M. Caporale, C. Rault, R. Sova, and A. Sova. 2012. “Environmental regulation and competitiveness: Evidence from Romania.” Ecological Economics 81: 130–139.
5 Ghisetti, C., and K. Rennings. 2013. “Environmental Innovations and Profitability: How Does It Pay to Be Green? An Empirical Analysis on the German Innovation Survey.” ZEW-Centre for European Economic Research Discussion Paper, 13-073.; Delchet-Cochet, K., L.C. Vo, and H. Akeb. 2015. “From Compliance with Environmental Regulations to Pursuit of Environmental-Based Competitive Advantages: Mediators of the Relationship in an SME Context.” Journal of Applied Business Research 31 (3): 987–1004.
6 Carayannis, E., and E. Grigoroudis. 2014. “Linking Innovation, Productivity, and Competitiveness: Implications for Policy and Practice.” Journal of Technology Transfer 39 (2): 199–218.; Brännlund. (2008. Productivity and Environmental Regulations.
7 Ghisetti and Rennings. 2013. “Environmental Innovations and Profitability.”; Bradburd, R. M., and D. R. Ross. 1989. “Can Small Firms Find and Defend Strategic Niches? A Test of the Porter Hypothesis.” Review of Economics and Statistics, 15(6) 258–262; Costantini and Mazzanti 2012. “On the Green and Innovative Side of Trade Competitiveness?”
8 Ghisetti and Rennings. 2013. “Environmental Innovations and Profitability.”; Costantini and Mazzanti. 2012. “On the Green and Innovative Side of Trade Competitiveness?”; Doran, J., and G. Ryan. 2012. Regulation and Firm Perception, Eco-Innovation and Firm Performance.” European Journal of Innovation Management 15 (4): 421–441.

A Greener Path to Competitiveness Policies for Climate Action in Industries and Products
82
Table 2.2 Profile of Competitiveness Indicators
a. The data for the indicators will have different sources based on whether firm, sector, or country-level competitiveness is being assessed.
Source: WEF Global Competitiveness Index, Deloitte’s Manufacturing Competitiveness, European Innovation Scoreboard, with others.
Regulations
• Environmental and/or energy compliance investments
• Policy and/or regulation stringency
• Stability of regulations
• Environmental and energy tax
• Compliance with regulations and/or S&L
Innovation
• R&D expenditure
• R&D budget
• Patent expenditure
• Number of patents approved
• Type of innovation (product versus process)
Competitiveness
Country • Added share in total manufacturing value added• Aggregate value of the domestic manufacturing industry
Firm /Sector / Country
• Profitability (e.g., value added, market value)• Export share • Employment (e.g., labor costs, levels of gross domestic product per worker, employment share) • Productivity (e.g., total factor productivity, productivity growth)• Export intensity (ratio of exports to sales)• Change in cost of material and/or resource supply • Price premiums • Change in cost of production
Firm
• Firm activity heterogeneity• Costs of promotion to consumers and retailers for manufacturers• Market share, change in market share, impact on sales
Market share
• Changes in product supply• Changes in product demand• Number of domestic versus international manufacturers• Shares of import and export in market
It should be noted that PH theory covers all environmental regulations and is not specific to energy performance S&L. In fact, although environmental regulations can be considered as a proxy for S&L programs, the literature showcasing PH within the scope of S&L is rare. On the other hand, the indicators identified through these studies are applicable to the publication’s S&L–focused scope.
Ex Ante (Anticipated Changes) Analyses and U.S. DOE’s Manufacturer Impact AssessmentsAs part of determining whether an energy efficiency policy under consideration is economically justified, governments typically estimate the energy savings expected to result from the policy. Such estimations are called ex ante estimation.

83
A Greener Path to Competitiveness Policies for Climate Action in Industries and Products
The U.S. Department of Energy (DOE) is required to conduct ex ante analyses to forecast the economic impact of a proposed standard on the manufacturers and consumers of those products. In addition to ex ante estimation of energy savings, DOE also conducts a manufacturer impact analysis (MIA) to estimate the financial impact of a new or amended energy conservation standard on manufacturers.1 The MIA must include an assessment of the impacts of a standard on competition among manufacturers, direct employment, and manufacturing capacity.
The U.S. DOE’s MIA has both quantitative and qualitative aspects. DOE uses the Government Regulatory Impact Model (GRIM) to conduct the quantitative assessment. GRIM is an input-output model that requires industry cost structure, product shipments, and costs as the model’s input parameters. The output of the GRIM is the industry’s net present value (INPV).2 The model estimates the financial impact of new and amended energy conservation standards for each product. It compares INPVs between a base case and standards case. The MIA’s qualitative part addresses product characteristics, manufacturer characteristics, market and product trends, as well as the impact of standards on subgroups of manufacturers.
The U.S. DOE has published results from dozens of such MIAs conducted in developing energy conservation standards over the years. Thus, a large number of manufacturer impact ex ante analyses exist.
Ex Post (Past Performance) Analyses in the LiteratureEx post analysis of any policy is essentially an effects estimation after the fact (after the policy implementation). In the case of appliance energy efficiency standards, cost and savings ex post estimations are generally considered a more accurate representation of actual costs and savings due to standards implementation than the ex ante analysis. For example, in India the Bureau of Energy Efficiency (BEE) conducts ex post energy estimation of GHG emissions reduction from BEE’s policies (including appliances S&L program) annually. These are published those in BEE’s annual reports.3 Results from some of these ex post analyses are summarized in Table 2.1.
There have been efforts to estimate the ex post energy and cost savings because of efficiency standards. However, very little is known about the effects of appliance energy efficiency standards on manufacturers after their implementation.
The following sections present specific product policy cases and how actions affected manufacturers. These policies on domestic and global manufacturers vary in their results. Some were positive and some negative. Not only S&L policies, but also complementary policies such as tax incentives, capacity building, and other upstream policies were examined.
The case studies are organized around the four major product groups: lighting, space cooling, home appliances, and industrial equipment. These groups contain some of the most important energy-consuming products globally and the products that new S&L programs typically address first.
Standards alignment’s effects are also studied in these sections. Alignment on product definitions, test methods, and efficiency metrics, or even performance levels, is perceived as beneficial for both national manufacturers and importers. It reduces the manufacturing, testing, and administrative costs to the manufacturers and importers. Also, the harmonization of test procures and performance standards within a larger economy or in the region provides access to new markets. That could enable export-led growth and spur innovation.
The case studies provide broad coverage of countries where S&L policies are implemented and that are major GHG emitters. These case studies are drawn from China, the United States, the European Union, India, and Mexico. The cases examined are listed in Table 2.3.
1 Code of Federal Regulations (CFR), title 10, part 202, section 21. 2 See DOE, “Standards Development and Revision. http://energy.gov/eere/buildings/standards-development-and-revision. 3 Bureau of Energy Efficiency, India, annual reports. https://beeindia.gov.in/content/annual-report.

A Greener Path to Competitiveness Policies for Climate Action in Industries and Products
84
Table 2.3 List of Cases Examined
Product group Case study Key features
LightingCompact fluorescent lamps in China
Illustrates how stringent S&L policies coupled with government investment has helped domestic firms compete in global markets
Space coolingRoom air conditioners in India
Illustrates how S&L policies spurred innovation and enabled domestic manufacturers to compete with imports of global brands
Home appliances
Major appliances in the United States
Illustrates how a tax policy built on a solid S&L foundation helped domestic manufacturers compete with global brands while increasing the sales and affordability of highly energy-efficient products
Clothes dryers in Switzerland
Illustrates how a combination of policies, including government procurement schemes, can be used to tip the scales in favor of a new technology
Refrigerators in Mexico
Illustrates how standards alignment enabled Mexico to realize consumer benefits from market transformation, while enjoying the macroeconomic benefits of export-led growth
Industrial equipment
Distribution transformers in the United States
Illustrates how the standard-setting process was able to take into account domestic firms’ concerns
Electric motors: A case study of Siemens
Illustrates how Siemens, a global motor manufacturer, responded to the ratcheting-up of energy efficiency policies by strategically positioning itself to gain competitive advantages in the European market
For each product group, the report first explains the group’s significance in terms of market size and energy consumption and gives an overview of current S&L policy, in order to provide context for the case studies that follow. Each case study is structured to describe (1) the situation before the policy intervention, (2) the policy intervention, (3) the situation after the policy intervention, and finally (4) impacts on manufacturers.
The authors mined published and unpublished documents and conferred with government and industry representatives and other individuals knowledgeable about the specifics of these cases. The hope is that qualitatively and quantitatively assessing the selected cases furthers understanding of how appliance policy can help reduce GHG emissions and encourage industrial competitiveness, innovation, and export-led growth.

85
A Greener Path to Competitiveness Policies for Climate Action in Industries and Products
LIGHTING
The value of the global lighting market was an estimated 69 billion euros in 2010. It is expected to have grown by an average of 6 percent per year from 2010 to 2016 and 3 percent per year from 2016 to 2020.1 The lighting market was estimated to reach a value of 110 billion euros by 2020.
The principal lighting technologies are incandescent, linear fluorescent lamps (LFL), compact fluorescent lamps (CFL), high-intensity discharge lamps (HID), and light-emitting diode (LED). The lighting market in the past was dominated by incandescent and linear fluorescent lamps. However, the much more efficient but relatively expensive LED is quickly gaining market share due to rapid price decline and product performance improvement. The market shares of LED has been increasing in recent years in various key economies as demonstrated in a recent benchmarking study (Figure 2.6).
The United Nations Environment Program (UNEP) estimates that lighting accounts for approximately 15 percent of global electricity consumption and 5 percent of worldwide greenhouse gas emissions. By replacing all the inefficient lighting worldwide, an estimated 1,044 TWh of electricity can be saved annually, equivalent to 530 MMt of CO2 emission reduction and $120 billion savings in electricity bills.2
GLOBAL OVERVIEW OF CURRENT LIGHTING S&L POLICY
Lighting is a relatively simple energy-using product and makes up a large percentage of end-use energy in both developed and developing economies. For this reason it is usually one of the first products to be regulated when an S&L program is introduced.
The first energy efficiency labels for lighting products were introduced in 1984 in Brazil, and the first MEPS program followed shortly in Israel in 1985. There are now over 250 S&L policies in place in nearly 40 countries (see Figure 2.7). These policies cover ballasts, lamps, and specialized lighting products such as traffic signals and string lights.
Figure 2.6 LED Sales as a Percentage of All Sales of Domestic Lamps
Source: IEA-4E 2015.
20052004 20072006 2009 2010 2011 2012 20132008
20%
15%
10%
5%
0%
25%
Australia Denmark United Kingdom
Austria Japan EU
Canada Republic of Korea Poland and Spain
Solid=robust data Dashed line=indicative data Dotted line=illustrative data
Perc
enta
ge o
f all
sale
s th
at a
re L
EDs
1 McKinsey & Company. 2011. “Lighting the Way: Perspectives on the Global Lighting Market.”2 UNEP-GEF en.lighten initiative. 2014. “Green Paper: Policy Options to Accelerate the Global Transition to Advanced Lighting.”

A Greener Path to Competitiveness Policies for Climate Action in Industries and Products
86
Incandescent bulbs have been in use for over a hundred years. However, the past 10 years have seen a dramatic shift in the market to more efficient technologies, including principally CFL and LED lamps. These technologies have a higher up-front cos, but are significantly more efficient and have much longer lifetimes than incandescent options. Public policy has thus focused on accelerating the adoption of the more efficient lighting technologies while ensuring quality and consumer satisfaction. Government and nongovernmental organizations are using policy tools and awareness campaigns to encourage the mass adoption of the more efficient technologies such as CFL and LED.1
Lighting products are globally traded, and test standards for most lamp types have a high-level of international alignment.2 A key benefit to global lighting industry competitiveness is that trade barriers can decrease and export-led growth increase by further aligning performance and test standards. The en.lighten initiative is supporting harmonization efforts, and there are regional harmonization efforts under way in Latin America, West Africa, and Southeast Asia.
Going one step further, these performance levels could also be aligned with quality characteristics. Many lighting programs for highly efficient products already incorporate quality characteristics, such as color quality or longevity, to ensure consumer satisfaction with the overall product.3 Shared definitions in terms of aligned performance and test standards ensures a healthy competition within the global lighting industry. This, in turn, increases the likelihood that consumers will make an energy efficient product choice in the future, rather than developing a distrust of new energy efficient technologies.4
Figure 2.7 The Uptake of Lighting S&L Policies Worldwide
198819861984 19921990 19961994 20001998 2004 2006 2008 2010 2012 20142002
0
5
10
15
20
30045
40
35
30
25
250
200
150
100
0
50
Cou
ntrie
s w
ith a
pol
icy
Countries with lighting policies
Cumulative lighting policies
Num
ber o
f pol
icie
s
Source: CLASP S&L Database 2015.
1 See UNEP en.lighten program and the CEM Global Lighting Challenge. 2 CLASP. 2013. Improving Global Comparability. Washington, DC: CLASP.3 Examples include ENERGY STAR, for lamps (http://www.energystar.gov/sites/default/files/ENERGY%20STAR%20Lamps%20V1%201_Specification_0.pdf)
and luminaires (http://www.energystar.gov/sites/default/files/specs/private/Final_Luminaires_V1_2_1.pdf); the IEA-4E Solid State Lighting Annex, http://ssl.iea-4e.org/; and the SEAD Global Efficiency Medal competition for efficient lighting products, http://superefficient.org/lightingawards.
4 Jenny Corry Smith, Debbie Karpay Weyl and Ari Reeves. 2015. “How and When to Increase Alignment of Appliance Policies.” EEDAL Conference Paper.

87
A Greener Path to Competitiveness Policies for Climate Action in Industries and Products
HISTORICAL ENERGY EFFICIENCY AND CONSUMER PRICE TRENDS
Figure 2.8 charts the typical luminous efficiency of major lamp technologies from 1940 to 2010, with projections to 2020. The efficiency of incandescent and halogen lamps has remained relatively flat, while the efficiency of fluorescent and HID lamps has improved steadily. White LED lamps have improved in efficiency very rapidly since their introduction just a few years ago, and are expected to continue improving rapidly in the coming years.
Figure 2.8 Historical and Predicted Efficiency of Light Sources
1940 1960 1980 2000 2020
200
150
100
50
0
Lum
inou
s Effi
cacy
(Lum
ens
per W
att)
Low Wattage
Linear Fluorescent
HalogenIncandescent
Compact Fluorescent
White LED Lamp
White OLED Panel
High Wattage
HID
Source: U.S. DOE 2012.
MEPS for lamps have helped to lock in improvements in luminous efficiency. An analysis of the savings expected to accrue from the MEPS established in the United States since 2009, for example, shows that lamp standards are expected to yield cumulative savings of more than 2100 TWh of electricity and 1000 MMt CO2 emissions by 2030. This is nearly half of the total savings from all U.S. standards established during that time (Table 2.4).
Table 2.4 Cumulative Energy and CO2 Savings through 2030 from Recent Lighting Standards in the United States
Lighting product Final rule date
Effective date
Cumulative electricity
savings through
2030 (TWh)
Cumulative CO2
reductions through
2030 (MMt)
Net present value of
savings (US$ billions,
2012)
General service lamps (EISA 2007a)
March 2009 2012–14 1,511 704 168.7
General service fluorescent lamps
July 2009 2012 415 193 17.6
Incandescent reflector lamps
July 2009 2012 98 46 6.7
General service fluorescent lamps
Jan 2015 2018 140 90 0.8
Total for lighting products 2,164 1,034 194
Source: ASAP (Appliance Standards Awareness Project) 2015b.

A Greener Path to Competitiveness Policies for Climate Action in Industries and Products
88
CHINA - S&L POLICIES FOR COMPACT FLUORESCENT LAMPS
Manufacturer ImpactsChina has a long history of indigenous electric light source production. With steady growth in the past several decades, it is now the leading producer of lighting products worldwide and plays dominant roles in the high-efficiency lighting market globally. A deep market transformation has resulted from improved and expanded MEPS programs, an initiative to phase out incandescent lights, and a state-driven industrial upgrade toward high-efficient lighting products, including LEDs. This has bred competitiveness improvement along with energy savings and carbon reduction.
China’s Green Lights Program (CGLP), initiated by the Chinese government in 1996, played a critical role in China’s emergence as the leading supplier of high-efficiency lighting products. It has raised consumer awareness of efficient products, spurring demand for efficient lighting within China. By 2015, there were more than 30,000 lighting manufacturers in China, with annual sales of more than 48 billion unit lamps, of which about 29 billion are exports.1
China’s accelerated urbanization in the early 1990s spurred large energy demand.2 The energy consumed by the lighting sector grew at about 15 percent annually during much of the decade.3 This posed great challenges to the then out-of-date electrical power system. In addition, most of the lighting in use at that time was very inefficient, resulting in considerable electricity waste. The market for efficient lighting products was immature and consumer’s awareness of these products was low. As a result, there were great challenges to but also huge opportunities for policy intervention.
Policy InterventionChina implemented the CGLP via public education, consumer incentives, national product testing, and investments in R&D and manufacturing capacity for efficient lighting. The program has achieved great success. Specific measures include the following:
• Disseminating information about efficient lighting through mass media outlets and establishing CGLP product display sites to familiarize shoppers with energy efficient options
• Funding channels set up by the government to incentivize efficient-lighting manufacturer and various rebate programs for efficient lighting products, targeting consumers with different income levels
• Organizing training sessions and study tours abroad for product engineers and managers
The program included three pilot projects-in Beijing, Shanghai, and Guangdong-and succeeded in training 400 engineers and managers on CGLP policies and measures, product certification, quality standards, and the design and implementation of pilot projects.4
Witnessing the CGLP’s early implementation stage success and realizing the market growth potential, the Chinese government took further steps by implementing MEPS for fluorescent lamp ballasts and compact and linear fluorescent lamps in 1999 and 2003, respectively.5
In 2004, the CGLP was identified as one of the 10 key energy-saving projects in China’s Medium- and Long-Term Plan for Energy Conservation. China also launched financial incentives in 2008 that provided a 50 percent and 30 percent subsidy for household and bulk users, respectively,6 to realize the goal of converting 80 percent of installed lamps to efficient technologies.7 The program led to a record sale of 1.3 billion efficient lamps (subsidized) in 2008, which is a 250 percent increase over the previous year (Figure 2.9). An estimated 8.8 billion KWh electricity savings and 8.8 MtCO2 reduction were achieved annually with these efficient lamps installed compared to the business-as-usual scenario.
1 Data sourced on Sept 15, 2016 from Euro monitor 2014 at http://www.euromonitor.com/2 Xu, T., T. Ma, C. Zhou, and Y. Zhou 2014. “Characterizing Spatio-Temporal Dynamics of Urbanization in China Using Time Series of DMSP/OLS Night Light
Data.” Remote Sensing 6 (8): 7708–7731.3 Min, G. F., E. Mills, and Q. Zhang. 1997. Energy Efficient Lighting in China: Problems and Prospects. Energy Policy 25 (1): 77–83.4 Zhuo, Wang. 2011. The lighting Industry Development in China. China Association of Lighting Industry.5 Tan, Q., Song, Q. and Li, J., 2015. The environmental performance of fluorescent lamps in China, assessed with the LCA method. The International Journal
of Life Cycle Assessment, 20(6), pp.807-818.6 Yuan, Jiahai, Junjie Kang, Cong Yu, and Zhaoguang Hu. 2011. “Energy Conservation and Emissions Reduction in China: Progress and Prospective.”
Renewable and Sustainable Energy Reviews 15 (9): 4334-4347.7 National Ministry of Construction of China. 2006. The Implementation Guideline on City Green Lighting Project during the 11th Five Year Plan.

89
A Greener Path to Competitiveness Policies for Climate Action in Industries and Products
In 2010, the third phase of CGLP, the Phasing-Out of Incandescent Lamps and Energy Saving LampsPromotion (PILESLAMP) Project, was rolled out by the United Nations Development Program–Global Environment Facility (UNDP-GEF) and the Chinese government collaboratively. The objective is “the enhanced promotion and resulting higher utilization of energy-saving lamps (ESLs) in China through the transformation of the local lighting products market and the phasing-out of incandescent lamp production and sale.”1 The plans calls for saving 15,880–20,832 GWh of electricity annually 5 years after the project’s end in late 2012, and 12,334–33,335 GWh annually 10 years after the project ends. Cumulative CO2 saving will reach 80.3–90.0 Mt 5 years after the project ends and 174.7–237.4 Mt 10 years after the project ends (Table 2.5). The Industrial restructuring and upgrade within the lighting industry in China constitutes a critical component of the project, it becomes the outcome, but also the cause of such profound change.
Table 2.5 Energy and CO2 Targets for PILESLAMP Project
Indicator Project end (late 2012)
5 years after end of project
10 years after end of project
Electricity savings (GWh realized in each year)
4,011 15,880–20,832 12,334–33,335
CO2 reductions (Mt realized in each year)
4.4 17.3 – 22.9 13.5 – 36.6
Cumulative CO2 savings (total Mt) 514 80.3–90.0 174.7–237.4
Source: UNEP/GEF2 2014.
LED Lighting
AchievementsThe green lighting program initiated in 1996 has accelerated the industry upgrade and improved the average product quality substantially. The production ratio of energy-saving lamps to incandescent lamps has witnessed a vigorous growth from 1:34 in 1996 to 1:1 in 2010.
2 UNDP-GEF and Government of China. 2014. “Phasing-Out of Incandescent Lamps.”
1 UNDP-GEF, and Government of China. 2008. “Phasing-Out of Incandescent Lamps & Energy Saving.” Lamps Promotion (PILESLAMP) Project (PIMS# 4166).
Domestic sales volumes also shifted markedly from incandescent to energy-saving CFL and LED lamps between 2005 and 2012. Energy-saving lamps comprised only 22 percent of the lamps sold in China in 2005, but about 45 percent in 2012 (See Figure 2.9).

A Greener Path to Competitiveness Policies for Climate Action in Industries and Products
90
Figure 2.9 Number of Lamps Sold in China by Type, 2005–12
Incandescent lamps Tungsten halogen lamps Energy saving lamps
0.2
0.4
N/A N/A
0.6
0.8
1.0
1.2
1.4
1.6
1.8
2.0
2005 2006 2007 2008 2009 2010 2011 2012
0.5
0.7
1.0
1.1
1.5
1.1
1.6 1.6
1.8 1.8
1.6
1.51.4
1.21.1 1.1
0.7 0.7
0.9
0.8 0.8
0.7
Source: China Auto Logistics Inc. (CALI), China Illuminating Engineering Society (CIES), and General Administration of Customs of China 2014.
Chinese exports of energy-saving lamps have also grown considerably. Figure 2.10 shows the number of energy-saving lamps produced in China each year from 1996 to 2012 and what proportions were consumed domestically and exported.
China’s domestic energy efficiency policy has had spillover effects beyond its borders. Australia harmonized its self-ballasted CFL product standards to allow it to align with China’s standards. This reduced the cost of product testing in Australia, since China already has the world’s most stringent MEPS and endorsement label energy performance levels for self-ballasted CFLs.1
4.0
3.5
3.0
2.5
2.0
1.5
1.0
0.5
0.0
4.5
Export Domestic use
Figure 2.10 Annual Energy Saving Lamp Production and Export in China, 1996–2012 (billion lamps)
Source: National Lighting Test Centre 2012.
199819971996 20001999 20022001 20042003 2006 2007 2008 2009 2010 2011 20122005
Prod
uctio
n of
ene
rgy
savi
ng la
mps
0.1 0.1 0.1 0.2 0.30.5 0.5
0.81.1 1.3
1.7 1.9 2.1 2.2
3.0 2.8 2.8
1.6 1.61.11.5
1.1
1.00.7
0.3
0.30.3 0.3
0.20.0 0.1 0.1 0.1
0.5
Billion
1 National Appliance and Equipment Energy Efficiency Program. 2005. “Evaluation of MEPS and Endorsement Label Options for CFLs.” In Minimum Energy Performance Standards: Compact Fluorescent Lamps. https://www.scribd.com/doc/205975385/Australia-MEPS.
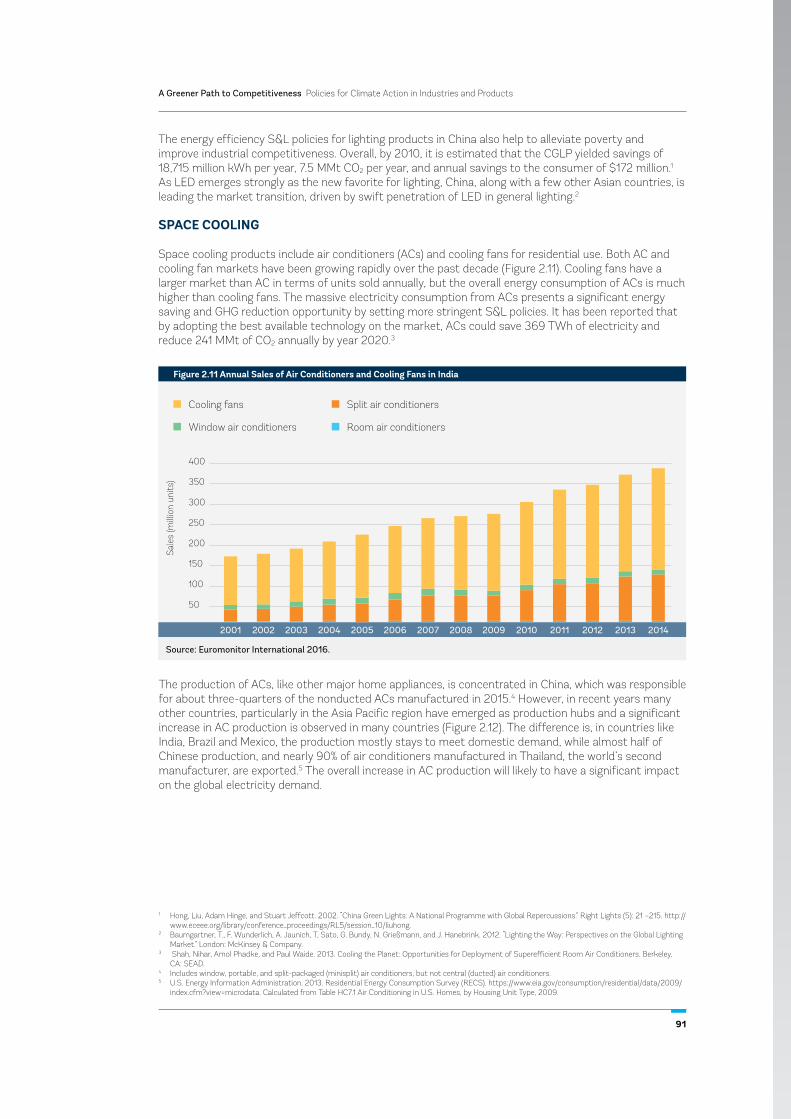
91
A Greener Path to Competitiveness Policies for Climate Action in Industries and Products
The energy efficiency S&L policies for lighting products in China also help to alleviate poverty and improve industrial competitiveness. Overall, by 2010, it is estimated that the CGLP yielded savings of 18,715 million kWh per year, 7.5 MMt CO2 per year, and annual savings to the consumer of $172 million.1
As LED emerges strongly as the new favorite for lighting, China, along with a few other Asian countries, is leading the market transition, driven by swift penetration of LED in general lighting.2
The production of ACs, like other major home appliances, is concentrated in China, which was responsible for about three-quarters of the nonducted ACs manufactured in 2015.4 However, in recent years many other countries, particularly in the Asia Pacific region have emerged as production hubs and a significant increase in AC production is observed in many countries (Figure 2.12). The difference is, in countries like India, Brazil and Mexico, the production mostly stays to meet domestic demand, while almost half of Chinese production, and nearly 90% of air conditioners manufactured in Thailand, the world’s second manufacturer, are exported.5 The overall increase in AC production will likely to have a significant impact on the global electricity demand.
SPACE COOLING
Space cooling products include air conditioners (ACs) and cooling fans for residential use. Both AC and cooling fan markets have been growing rapidly over the past decade (Figure 2.11). Cooling fans have a larger market than AC in terms of units sold annually, but the overall energy consumption of ACs is much higher than cooling fans. The massive electricity consumption from ACs presents a significant energy saving and GHG reduction opportunity by setting more stringent S&L policies. It has been reported that by adopting the best available technology on the market, ACs could save 369 TWh of electricity and reduce 241 MMt of CO2 annually by year 2020.3
50
100
150
200
250
300
350
400
Figure 2.11 Annual Sales of Air Conditioners and Cooling Fans in India
Cooling fans Split air conditioners
Window air conditioners Room air conditioners
Source: Euromonitor International 2016.
2001 2002 2003 2004 2006 2007 2008 2009 2010 2011 2012 2013 20142005
Sal
es (m
illio
n un
its)
1 Hong, Liu, Adam Hinge, and Stuart Jeffcott. 2002. “China Green Lights: A National Programme with Global Repercussions.” Right Lights (5): 21 –215. http://www.eceee.org/library/conference_proceedings/RL5/session_10/liuhong.
2 Baumgartner, T., F. Wunderlich, A. Jaunich, T, Sato, G. Bundy, N. Grießmann, and J. Hanebrink. 2012. “Lighting the Way: Perspectives on the Global Lighting Market.” London: McKinsey & Company.
3 Shah, Nihar, Amol Phadke, and Paul Waide. 2013. Cooling the Planet: Opportunities for Deployment of Superefficient Room Air Conditioners. Berkeley, CA: SEAD.
4 Includes window, portable, and split-packaged (minisplit) air conditioners, but not central (ducted) air conditioners.5 U.S. Energy Information Administration. 2013. Residential Energy Consumption Survey (RECS). https://www.eia.gov/consumption/residential/data/2009/
index.cfm?view=microdata. Calculated from Table HC7.1 Air Conditioning in U.S. Homes, by Housing Unit Type, 2009.

A Greener Path to Competitiveness Policies for Climate Action in Industries and Products
92
Energy demand for space cooling is growing rapidly around the world. The rise in demand for is driven mainly by rising incomes of households-especially in emerging economies such as India, Indonesia, and Brazil and so forth. People have a natural preference for comfortable temperatures, and so there is a natural demand for cooling products. Room ACs are becoming a more affordable product segment than they were just five to six years ago, and they are increasingly within reach of the rising middle class. Emerging economies such as India, Indonesia, and Brazil have a relatively low penetration of ACs, while the developed economies such as the United States and the EU have a much more saturated market. Around 87 percent of U.S. households have AC equipment1, while the penetration of ACs in India is still below 5 percent2. However, ACs are among the most prevalent purchases for the growing middle class in the emerging economies. For example, in India, room AC ownership and usage are increasing rapidly due to growing income and increased cooling days per year. The Indian AC industry estimated sales of close to 4 million new units in 2014.3 Similarly, “rapid economic development and urbanization in China has led to increasingly significant sales of AC units over the last decade. The AC sales rose rapidly in 2010 and 2011 as a result of the various subsidy programs targeting ACs, but the annual sales fell back following the phase-out of these incentive policies in 2012.”4
GLOBAL OVERVIEW OF CURRENT S&L SPACE COOLING POLICY
Space cooling makes up a significant portion of energy demand in warm climates and puts a lot of stress on electricity grids at times of peak demand. Air conditioners have therefore been a priority product for most S&L programs.
The first energy efficiency standards for space cooling came into effect in 1977 for central air conditioning units in California. S&L policies are currently in place in nearly 40 countries to help mitigate energy demand and encourage the uptake of more efficient technologies.
Figure 2.12 Global Production of Nonducted Air Conditioners
120100806040200
China
Thailand
Malaysia
Japan
Korea, Rep
Indonesia
India
Argentina
Turkey
Brazil
2010 2015
Source: Euromonitor International 2016.
Million units
1 U.S. Energy Information Administration. 2013. Residential Energy Consumption Survey (RECS). https://www.eia.gov/consumption/residential/data/2009/index.cfm?view=microdata. Calculated from Table HC7.1 Air Conditioning in U.S. Homes, by Housing Unit Type, 2009.
2 The Economic Times. 2015. Market penetration in India for ACs is still below 5 per cent, we can grow: Satish Jamdar, Blue Star. http://articles.economictimes.indiatimes.com/2015-07-29/news/64997120_1_satish-jamdar-cash-flow-blue-star
3 Euromonitor, Indian Bureau of Energy Efficiency data.4 Li, Jayond, Yang Yu, and Steven Zeng. 2014. “2014 Market Analysis of China Energy Efficient Products.” Washington, DC: CLASP.

93
A Greener Path to Competitiveness Policies for Climate Action in Industries and Products
Residential room ACs are the most commonly regulated cooling product, but S&L policies are in place for several other residential, commercial, and industrial product categories, including central ACs, chillers, and packaged terminal ACs. (See Figure 2.13 for the growth in cooling S&L policies.) Standard split-packaged (minisplit) air conditioners are among the most energy efficient options for room ACs and dominate sales in most parts of the world, including Asia and Europe.1
Most countries reference the ISO 5151 testing procedure for packaged products and use the energy efficiency ratio (EER) as a metric. A seasonal energy efficiency metric (SEER) is also adopted by several economies. SEER is a better measure of part-load performance and accounts for variations in outdoor air temperature. However, SEER values are not easily comparable between economies making it likely that it will become more difficult to compare AC performance in the future.2
The demand for space cooling products is rising rapidly in emerging economies across the global South. In many countries, first time consumers are faced with only poor choices-the most affordable products are typically inefficient, low-quality imports or rebuilds found on secondary markets. There are, however, many existing technologies that can significantly improve efficiency, such as nonvapor compression technology, variable speed motors, thermal expansion valves, advanced compressors, and microchannel heat exchangers.3 S&L programs can spur R&D and innovations, speeding the introduction of new cost-effective technologies to meet the rise in global demand for cooling.
HISTORICAL ENERGY EFFICIENCY AND CONSUMER PRICE TRENDS
Improvements in energy efficiency of products often result in an increase in their initial purchase costs. However, the marginal cost of adopting energy efficient technologies decline over the time, and the products become relatively less costly. As per the analysis conducted by the Lawrence Berkeley National Lab (LBNL), in the United States, AC prices stayed flat despite a major MEPS revision (>20 percent) in 2006, as shown in Figure 2.14.
Figure 2.13 The Uptake of Space Cooling S&L Policies
Source: CLASP S&L Database 2016.
198019781976 19841982 19881986 19921990 1996 1998 2000 2002 2004 2008 2010 2012 2014 20161994
0
5
10
15
20
16040
35
30
25
140
120
100
80
0
60
40
20
Countries with a policy
All cooling policies Cum
ulat
ive
polic
ies
Cou
ntrie
s w
ith a
spa
ce c
oolin
g po
licy
1 Shah, Phadke, and Waide. 2013. Cooling the Planet.2 CLASP. 2013. Improving Global Comparability.3 ASAP. 2013. Better Appliances: An Analysis of Performance Features and Price as Efficiency has Improved. Roslindale, MA: ASAP.

A Greener Path to Competitiveness Policies for Climate Action in Industries and Products
94
1992-2006 MEPS=10
Adj
uste
d Pr
ice
Inde
x (A
ll A
Cs,
199
0=1
)
SEE
R (B
tu/h
r)
2006-2015 MEPS=13
Figure 2.14 The Relationship between Seasonal Energy Efficiency Ratio (SEER) and the Adjustable Consumer Price Index for ACs in the United States between 1990 and 2010
1990 1992 1994 1996 1998 2000 2002 2004 2006 2008 2010
1.10 15
14
13
12
11
10
9
8
7
6
1.00
0.90
0.80
0.70
0.60
0.50
0.40
Source: Shah, Nihar, and Amol Phadke 2016.
SEER US Central ACs ( Spit System)Price Index (1990=1, all ACs)
In Japan, after introduction of the top runner program, AC prices dropped steadily despite rapid efficiency gains. The relationship between cooling coefficient of performance (COP) and the consumer price index between 1990 and 2010 is shown in Figure 2.15.
Price Index (1990=1)
1st Target Year 2nd Target Year
Con
sum
er P
rice
Inde
x fo
r Roo
m A
Cs
(199
0=1
)
Coo
ling
CO
P
Figure 2.15 The Relationship between Cooling Coefficient of Performance (COP) and the Consumer Price Index for Room ACs in Japan between 1990 and 20101
1990 1995 2000 2005 2010
7
6
5
4
3
2
1
00.00
0.20
0.40
0.60
0.80
1.00
1.20
Cooling COP
1 Nihar Shah, Max Wei, Virginie Letschert and Amol Phadke. 2015. Benefits of Leapfrogging to Super-efficiency and Low Global Warming Potential Refrigerants in Air Conditioning. 36th Open-ended Working Group of the Parties to the
Montreal Protocol, Paris, France. http://conf.montreal-protocol.org/meeting/oewg/oewg-36/pubs/English/The%20Benefits%20of%20Leapfrogging%20Presentation.pdf

95
A Greener Path to Competitiveness Policies for Climate Action in Industries and Products
INDIA - S&L POLICIES FOR AIR CONDITIONERS
Manufacturer Impacts In response to growing usage of AC units in the country, the Indian BEE launched a voluntary energy efficiency S&L program for ACs in 2006, which became mandatory in 2010. The S&L program for ACs enabled domestic manufacturers to better compete with global brand imports.
The room AC market in India is divided between two types of ACs: window units and split units.1 Their rated cooling capacity is usually up to 11 kW. Annual sales of the two air conditioner types in India grew with a compound annual growth rate (CAGR) of 14 percent between 2006 and 2014, even faster than GDP growth in India during this time. (India was one the fastest growing economies during the past decade, with an average annual growth rate of around 7 percent).2 The annual sales of ACs in India between 2006 and 2014 is shown in Figure 2.16. The market is estimated to be close to 4 million units in 2014, with a CAGR of 14 percent between 2006 and 2014. A sudden growth between 2009 and 2010 might have also negatively affected sales the following year. Many think this resulted from a bonus offered by the Indian government to central government employees, which translated in higher appliance purchases in that period.
Sales of ACs in India are still significantly lower than in such countries as Japan and the United States, which have annual sales of more than 6 million and 9 million units, respectively. Additionally, sales are lower than in economies like China and Brazil that are expected to reach similar market sizes in the coming years.3
In India, the ownership of ACs is estimated at between 4 to 5 percent. The market penetration potential is still very large, and growth in the coming years is expected to rise. The AC market in India is dominated by LG, Voltas, and Samsung. In 2005, LG had a 21 percent market share followed by domestic firm Voltas and Samsung with 19.4 percent and 11.2 percent, respectively. Another domestic manufacturer, Godrej, had a market share between 2 to 3 percent in 2005 and 2006. There were also some other smaller domestic manufacturers, such as Gujral Aircon, with limited geographical coverage and annual sales in the Indian market.4
Figure 2.16 Room Air Conditioner Sales in India, 2006–14
Total Market Size (million)
Ann
ual A
C C
sal
es (m
illio
n un
its)
0.50
1.00
1.50
2.00
2.50
3.00
3.50
4.00
4.50
2006 2007 2008 2009 2010 2011 2012 2013 20142005
1 The term “window AC” describes a type of AC in which a single unit contains all the components of the air conditioning system. A split AC incorporates two separate units: an indoor unit and an outdoor unit.
2 U.S. Energy Information Administration. 2014. India - International energy data and analysis. http://www.eia.gov/beta/international/analysis_includes/countries_long/India/india.pdf
3 Shah, Phadke, and Waide. 2013. Cooling the Planet. 4 Discussion with AC S&L expert in India.

A Greener Path to Competitiveness Policies for Climate Action in Industries and Products
96
Policy InterventionThe Indian BEE launched a voluntary comparative labeling program for room ACs in 2006. The program covers single-phase split and unitary (window) ACs of the vapor compression type for household use, up to a rated cooling capacity of 11 kW, being manufactured in, imported to, or sold in India.1 The energy efficiency of ACs is measured by the EER2 and then rated by the number of stars displayed on the energy label. The label shows between one and five stars, with one star being the least efficient and five stars being the most efficient.
In 2010, the S&L program was made mandatory for room ACs. BEE adopted a phase-wise approach for ratcheting up of AC MEPS in every two years.3 The first revision took place in January 2012, with 8 percent improvement in MEPS and in every subsequent star level. Similar revision in MEPS occurred in January 2014 and remained effective till December 2015. The EER values for MEPS and other star ratings for split ACs between 2010 and 2015 are shown in Table 2.6.
1 BEE (Indian Bureau of Energy Efficiency). 2013. Schedule – 3: Room Air Conditioners. Revision May 20, 2013. http://beestarlabel.com/Content/Files/Schedule3A-RAC9jun.pdf.
2 The energy efficiency ratio (EER) is a ratio of the cooling capacity in watts to the electricity consumption in watts when measured at full load at a specific outdoor temperature (usually 95 degree Fahrenheit).
3 BEE. “Schedule – 3.” Revision May 20, 2013.
S&L programs are typically designed help to consumers make better (more energy efficient) choices by addressing information asymmetry problems. Labeling requirements for ACs made it easier for consumers to know and compare the electricity consumption and energy performance of ACs. The setting of MEPS prohibited sale of ACs whose energy efficiency ratio is lower than the one-star level. Thus, consumers who might have been tempted to purchase a low-cost appliance with very low energy efficiency were prevented from doing so.
After the AC S&L program’s implementation, Indian consumers became more aware of the product’s energy efficiency. In a recent CLASP impact assessment study of BEE’s S&L program, urban consumers ranked AC energy efficiency as their top priority while making a purchase decision. Also, over 90 percent of the survey respondents were convinced that the higher star rated ACs will lead to electricity savings and reduction in their monthly energy bill.
Since the beginning of the S&L program for ACs, the one- and three-star remained the dominate product categories. However, sales of five-star ACs in India have significantly increased in recent years due to increased consumer awareness. In 2014, the market share of five-star ACs was 21 percent compared to 1 percent and 14 percent in 2008 and 2010, respectively. The market share of one- to five-star rated products between 2008 and 2014 is shown in Figure 2.17.
Table 2.6 Energy Performance Standard for Room ACs (Minisplit) in India
07 January 2010 to 31 December 2011
01 January 2012 to 31 December 2013
01 January 2014 to 31 December 2015
EER (W/W)
Star rating Min. Max. Min. Max. Min. Max.
1 Star 2.3 2.49 2.5 2.69 2.7 2.89
2 Star 2.5 2.69 2.7 2.89 2.9 3.09
3 Star 2.7 2.89 2.9 3.09 3.1 3.29
4 Star 2.9 3.09 3.1 3.29 3.3 3.49
5 Star 3.1 3.3 3.5

97
A Greener Path to Competitiveness Policies for Climate Action in Industries and Products
100%
80%
60%
40%
20%
Figure 2.17 Indian Market Share of AC Products Rated One to Five Stars, 2008–14
One Star Two Star Three Star Five StarFour Star
Source: Saurabh Diddi, 2015.
2008Years 2009 2010 2011 2012 2013 2014
Mar
ket
Sha
re (%
)
The weighted average EER of the annual AC sales has also gone up significantly due to increased sales of three- and five-star products and the rise in energy efficiency standards every two years since 2010. In 2014, the weighted average EER was 3.17 compared to of 2.61 in 2007 when the S&L program for ACs was introduced.1 This is an almost 18 percent average efficiency improvement in ACs in India over the period of eight years.
The S&L program for ACs in India has also resulted in significant energy savings and GHG emissions reductions. The BEE estimated cumulative electricity savings of over 42 billion kWh and avoided capacity of over 5,000 MW in 2014 alone. The program resulted in over 30 million tons of GHG emissions reductions in past eight years.
The Indian AC S&L program has helped some domestic manufacturers in competing with the global brands such as LG Electronics and Samsung Electronics. Two domestic manufacturers, Voltas, a TATA group company, and Godrej used a star-rated range of ACs as a marketing tool. In one advertisement, Godrej claimed that its latest five-star air conditioner uses less power than a hair dryer.2 In a story released by the TATA group in July 2013, Voltas mentioned that its research team realized that most customers were concerned not just with an AC’s purchase cost but also with its operating cost.3 This finding led to a change in company’s manufacturing and marketing strategy. Voltas’s product development team found that it could make ACs more energy efficient at a marginally higher cost. Their marketing campaign then centered on energy efficiency and clearly communicated that an energy efficient AC, though more expensive upfront, would help consumers save more money because of energy savings during usage. One of the many print advertisements that Voltas used in its marketing campaign is shown in Figure 2.18.
1 Presentation made by Saurabh Diddi. 2 “Godrej Energy Efficient AC.” 2012. YouTube. https://www.youtube.com/watch?v=fc14G1UFhhs. 3 TATA. 2013. “Cooling Minds, Winning Hearts.” http://www.tata.com/company/articlesinside/DOQREdk8wHI=/TLYVr3YPkMU=.

A Greener Path to Competitiveness Policies for Climate Action in Industries and Products
98
Figure 2.18 Voltas Used Its Energy Efficient ACs as a Key Differentiator to Gain Market Share in India

99
A Greener Path to Competitiveness Policies for Climate Action in Industries and Products
In 2010, when India’s BEE made it mandatory to display an AC’s energy efficiency through the star rating label, Voltas moved forward with its marketing campaign of “sensible cooling.” The campaign tried to educate consumers about the energy-saving features of their ACs, such as sleep mode, eco-mode, timer, and so forth. Voltas claimed that the campaign was very successful and market share improved in 2010–11. In an interview to a business newspaper, Voltas’ president and chief operating officer said, “We expect to continue with a double-digit growth this season with an assortment of energy efficient products in split and window category.”1
AchievementsS&L programs affect not only consumers’ choice behavior but also manufacturers’ strategies in designing and pricing products for the market place. An S&L program enables innovation and drives competitiveness in the market. Energy efficiency labels can act as a differentiator and provide support for domestic manufacturers to compete with global brands. This is especially true for ACs since Indian consumers ranked energy efficiency as the top priority over brand in a recent S&L impact assessment study commissioned by CLASP.
In India, the introduction of the BEE’s S&L program for ACs enabled some of the domestic manufacturers to compete with global brands and spurred innovations. Voltas achieved the market leadership position in 2012 with 19.4 percent market share, ahead of LG Electronics. Voltas was also the winner of Ministry of Power’s National Energy Conservation Award in 2013, which recognized the company’s efforts to promote and sell energy efficient ACs in India. The award is given annually to recognize those appliances, equipment manufacturers, and energy-intensive industries that have made significant contributions to effective utilization and conservation of energy.
Voltas’s success in Indian AC market arises from its leadership in room ACs across the country, coupled with its industry leadership in five-star AC production in 2013. Voltas has remained the market leader in the Indian AC market since 2012. The annual AC sales of leading brands (Voltas, LG, and Samsung) from 2005 to 2014 is shown in Figure 2.19.
In terms of CAGR, Voltas performed slightly better than the industry’s average. The AC industry CAGR was about 14 percent between 2006 and 2014. Voltas achieved a 15 percent CAGR in that period.
Figure 2.19 Annual AC Sales of Leading Brands (Voltas, LG, and Samsung) between 2005 and 2015 in India
900,000
800,000
700,000
600,000
500,000
400,000
200,000
300,000
100,000
2005 2006 2007 2008 2009 2010 2011 2012 2013 2014Years
Ann
ual A
CC
sal
es (U
nits
)
LG
VoltasSamsung
1 “AC Makers Bet on Smaller Cities to Drive Growth This Summer.” Hindu Business Line, March 29, 2015. http://www.thehindubusinessline.com/companies/ac-makers-expect-smaller-cities-to-drive-growth-this-summer/article7045421.ece.

A Greener Path to Competitiveness Policies for Climate Action in Industries and Products
100
Figure 2.20 Godrej’s AC Models Registered with BEE in Its S&L Database
One star
Ener
gy e
ffici
ency
ratio
(EER
) (W
/W)
Godrej AC modelsFive star
2
2.4
2.2
2.6
2.8
3.2
3
3.4
3.6
3.8
4
2010 2011 2012 2013 2014 2015 2016
1 NRDC. 2015. Expert Interview: Increase in Demand for ACs, Growth for Industry Likely in India. Last accessed on November 17, 2015. https://www.nrdc.org/experts/anjali-jaiswal/expert-interview-increase-demand-acs-growth-industry-likely-india
2 BEE. S&L Search and Compare Database. Last accessed on November 17, 2015. http://beestarlabel.com/SearchCompare/Searchandcompare.
Another domestic AC manufacturer, Godrej, achieved a CAGR of 20 percent between 2006 and 2014. In an interview with the Alliance for an Energy Efficient Economy, Godrej claimed to have strategically invested in R&D for energy efficiency improvement of its products.1 Godrej claimed that some of its ACs are designed in such a way that they will retain the five-star rating for two more rounds of policy updates in upcoming years. Godrej is also the first brand in India to launch an AC with 3.7 EER, significantly better than the five-star level in 2014, and it used climate-friendly, low global warming potential refrigerant. Some of the Godrej’s AC models registered with BEE in the S&L database are shown in Figure 2.20.2
MAJOR HOME APPLIANCES
The global home appliances market has been growing fast since the turn of the twenty-first century. The annual sales for major appliances such as refrigerators, washing machines and dishwashers all expanded significantly over the past decade, despite the severe economic downturn of 2008 and 2009 (Figure 2.21).
The rapid increase in the appliance market is due largely to the raising demand from emerging markets such as Latin America and Asia Pacific regions. With the living standards and quality of life improving in these regions, the global market for appliances is expected to continue to grow for the years to come (Figure 2.22).
300
250
150
100
50
Figure 2.21 Annual Sales of Major Appliances Worldwide, 2001–14
Refrigerators Automatic Washing Machines
Automatic Tumble Dryers
Dishwashers
Source: Euromonitor International 2015.
2001Years 2003 20042002 2005 2006 2007 2008 2009 2010 2011 2012 2013 2014
Sal
es (m
illio
n un
its)

101
A Greener Path to Competitiveness Policies for Climate Action in Industries and Products
Washing Machine Drum

A Greener Path to Competitiveness Policies for Climate Action in Industries and Products
102
Figure 2.22 Expected Appliance Market Growth, 2014–19
1,000-3,499
0,999
<0
Not Illustrated
3,500-31,000
Growth Volume (Measured in Total Number of Units Produced) (000) 14-19
Source: Euromonitor International 2014.

103
A Greener Path to Competitiveness Policies for Climate Action in Industries and Products
Figure 2.22 Expected Appliance Market Growth, 2014–19

A Greener Path to Competitiveness Policies for Climate Action in Industries and Products
104
The production of major home appliances, like air conditioners, is concentrated in China, which was responsible for more than half of the household dishwashers, laundry, and refrigeration appliances produced worldwide in 2015. Figure 2.23 shows the total number of units of these appliances produced in 2010 and 2015 in each of the top 10 producing countries.
Unavoidably the large global appliance market and its rapid growth rate have resulted in significant energy consumption. However, huge energy saving opportunities are also available by adopting effective S&L policies. The following examples demonstrate the scales of the energy consumption and savings potential from major household appliances:
• RefrigeratorsA report in 2012 estimated that the global electricity consumption of refrigerators and freezers was over 649 TWh, causing over 450 MMt CO2-equivalent GHG emission.1 However, if every time an old refrigerator or freezer were to be replaced, the most energy efficient model was selected, a total of 240 TWh of electricity and 159 million tons of CO2-equivalent per year can be saved by 2020.
• Washing machinesA report in 2012 estimated that the annual global electricity consumption of washing machines was 92 TWh, causing over 62 MMt of CO2-equivalent GHG emission.2 However, if every time an old washing machine was replaced, the most energy efficient model was selected, a total of 62 TWh of electricity per year can be saved by 2020.
• Clothes dryersClothes dryers are responsible for approximately 6 percent of the residential electricity consumption in the United States, which is equivalent to 60 TWh of electricity, 40 MMt of CO2, and US$9 billion of annual energy bills.3 Potential savings could be had by switching to the highly efficient heat pump dryers, which use only 40–50 percent as much energy as conventional dryers.
• DishwashersDishwashers consumed 26.4 TWh of electricity in the United States in 2014, equivalent to approximately 2 percent of the U.S. residential electricity consumption.4 It has been estimated that the U.S. dishwasher energy efficiency standard could save 2.6 TWh of electricity and reduce 1.7 MMt CO2 emissions annually by 2025.5
Figure 2.23 Global Production of Home Appliances
China
United States
Turkey
Brazil
India
Thailand
Poland
Korea, Rep.
Indonesia
20 40 60 80 100 120 140 160 180 2000Million units
Mexico
2010 2015
1 Barthel, Claus, and Thomas Götz. 2012a. “The Overall Worldwide Saving Potential from Domestic Refrigerators and Freezers.” retrieved on July 10th 2016 from http://www.bigee.net/media/filer_public/2012/12/04/bigee_doc_2_refrigerators_freezers_worldwide_potential_20121130.pdf
2 Barthel, Claus, and Thomas Götz. 2012b. “The Overall Worldwide Saving Potential from Domestic Washing Machines.” retrieved on July 10th 2016 from 3 Denkenberger, Dave, Chris Calwell, Nathan Beck, et al. 2013. Analysis of Potential Energy Savings from Heat Pump Clothes Dryers in North America. http://
clasp.ngo/~/media/Files/SLDocuments/2013/2013_Analysis-of-Potential-Energy-Savings-from-Heat-Pump-Clothes-Dryers-in-North-America.pdf 4 U.S. Energy Information Administration. How is electricity used in U.S. homes? Accessed November. 24, 2015. https://www.eia.gov/tools/faqs/faq.
cfm?id=96&t=3 5 ASAP. 2012. ASAP Fact Sheet: Dishwashers. Roslindale, MA: ASAP. Accessed November 24, 2015. http://www.appliance-standards.org/sites/default/files/
Dishwasher_Fact_Sheet_May16.pdf.
Source: Euromonitor International 2016.

105
A Greener Path to Competitiveness Policies for Climate Action in Industries and Products
GLOBAL OVERVIEW OF CURRENT S&L HOME APPLIANCE POLICY
S&L policies have been in use for nearly 40 years to reduce energy use in the residential sector. S&L policies include voluntary labels, mandatory labels, and MEPS, complemented by tax incentives and state or utility rebate programs. When a new S&L program is developed, the home refrigerator is generally one of the first products to be regulated, because it is used continuously and is found in a large proportion of households in most countries. The refrigerator is often cited as an example of how effective standards can raise efficiency even as purchase prices fall. Other commonly regulated home appliances are those used for laundry, cooking, and dishwashing.
Figure 2.24 shows that 40 countries have 301 S&L policies (195 for refrigerators, 79 for laundry machines, and 27 dishwashers).
Num
ber o
f cou
ntrie
s
Num
ber o
f pol
icie
s
Figure 2.24 The Uptake of Home Appliance S&L Policies
1976 1988 20001982 1994 20061978 1990 20021984 1996 2008 20121980 1992 20041986 1998 2010 2014Years
45 350
300
250
200
150
100
50
40
35
30
25
20
15
10
5
Countries with Home Appliance Policies Cumulative Home
Appliance Policies
Source: CLASP S&L Database 2015.
Usage patterns and household penetration for different home appliances varies greatly across economies. The divergence can be explained largely by differences in household income, but cultural preferences also have a strong relationship to the household penetration and usage of appliances. Figure 2.25 shows the projected growth for household ownership of refrigerator-freezers in China, Indonesia, and the United States. The figure demonstrates the importance of putting standards in place for home refrigeration appliances in emerging economies such as Indonesia, where the level of household penetration currently is relatively low, to avoid locking in high energy consumption over products’ lifetimes.

A Greener Path to Competitiveness Policies for Climate Action in Industries and Products
106
HISTORICAL ENERGY EFFICIENCY AND CONSUMER PRICE TRENDS
Various technological innovations have improved the efficiency of home appliances in recent years, due to consumer preferences, competitive manufacturers, and energy efficiency standards. Refrigerators can better regulate temperature because of electronic controls. Insulation has improved, including the use of vacuum insulated panels, which improve efficiency while reducing the space needed for insulation, leaving more room for food storage while keeping the refrigerator size. Variable speed compressors have improved efficiency and reduced refrigerator noise.1 New dishwashers have soil sensors that adjust the wash cycle to optimize the use of water and energy. More efficient jets use less energy, and improved rack designs maximize cleaning.2 Moisture sensors in clothes dryers are becoming more common and save energy by shutting the dryer off once it senses that the clothes are dry. The heat source for electric dryers can be resistance or heat pump. The latter doubles efficiency but raises purchase price and lengthens drying time.3 Most high-end clothes washers on the market are now front loading. These are more energy and water efficient than top loaders while also having superior cleaning ability and being gentler on clothes. Improved moisture removal features-for example, higher spin speeds-have also reduced drying times. Energy efficiencies of home appliances have improved dramatically over the past several decades. Figure 2.26 charts the improved efficiencies of major home appliances in the U.S. market. Average prices of refrigerators declined while efficiency increased. When comparing the prices of two typical refrigerators in 1979 and 2008 using average hourly salary rates as the basis for comparison, it was found that the price of a typical 2008 model was only approximately one-third of a 1979 model, despite the fact that the refrigerator in 2008 was almost three times more efficient than the refrigerator in 1981.
100%
120%
80%
60%
40%
20%
Figure 2.25 Household Ownership of Refrigerator-Freezers in Three Countries
United States China Indonesia
2009 2014 2019
1 Dols, Jeff, Brian Fortenbery, Micah Sweeney, and Frank Sharp. 2014. “Efficient Motor-Driven Appliances Using Embedded Adjustable-Speed Drives.” 2014 ACEEE Summer Study on Energy Efficiency in Buildings. Washington, DC: American Council for an Energy-Efficient Economy (ACEEE).
2 Energy Star. Product webpage for dishwashers. Accessed November 24, 2015. https://www.energystar.gov/products/appliances/dishwashers 3 CLASP. 2013. Improving Global Comparability.

107
A Greener Path to Competitiveness Policies for Climate Action in Industries and Products
A 2013 study showed that, over the past two decades in the United States, the energy consumption of refrigerators decreased and the average adjusted volume (refrigerator volume + 1.63 times the freezer volume) increased. At the same time, the average retail price dropped (Figure 2.27). The average energy use of refrigerators decreased by more than 50 percent from 1987 to 2010. The average price of refrigerators in 2010 was about $850, which is 35 percent lower than the price in 1987.
Figure 2.26 Increase in Household Appliance Energy Efficiency, 1980–2008
Room AC Freezer Clothes Washer Dishwasher Refrigerator
Source: Perry 2009.
Incr
ease
in h
ouse
hold
app
lianc
e en
ergy
effi
cien
cy (%
)
Figure 2.27 Refrigerator Energy Use, Volume, and Retail Price, 1987–2010
Ener
gy U
se (k
Wh/
year
) and
Ret
ail P
rice
(20
11$)
Adj
uste
d Vo
lum
e (c
u. ft
.)
1985 1990 1995 2000 2005 2010 2015
0
200
400
600
800
1,000
1,200
1,400
0
4
8
12
16
20
24
Price
1990 Standard
1993 Standard
2001 Standard
Energy Use
Volume
Adjusted Volume (cu. ft.) Retail Price (2011$) Energy Use (KWh/year)
Source: Mauer et al. 2013.
Similar trends for refrigerators are observed in other countries. Figure 2.28 shows the rate of decline of energy use for refrigerators in 11 European countries. On average the energy use declined at 5 percent per year since the energy efficiency policies were enacted. Swedish trends generally followed the average trend in Europe but had a faster decline rate at approximately 8 percent per year in 2011.
20%
40%
60%
80%
100%
120%
140%
160%
180%
200%

A Greener Path to Competitiveness Policies for Climate Action in Industries and Products
108
Manufacturer Impacts This section features three case studies related to home appliances. The first describes a tax credit policy in the United States that stimulated domestic production of high-efficiency appliances. The second describes how public policy in Switzerland created a market for high-efficiency clothes dryers, to the benefit of European households and appliance manufactures alike. The third explores how efficiency standards alignment leads to the export growth of refrigerators in Mexico.
THE UNITED STATES - MANUFACTURERS’ TAX CREDITS
S&L programs are often coupled with financial incentives to accelerate the uptake of high-efficiency products. Financial incentives can be used to target various market actors, such as manufacturers, distributors, or consumers. One of the best examples is the production tax credit in the United States, which rewarded manufacturers for producing qualified high-efficiency appliances. It has been considered one of the most successful incentive programs for spurring the adoption of high-efficiency appliances that meet or exceed Energy Star requirements.2
The policy provided manufacturers per-unit tax credits to produce high-efficiency dishwashers, clothes washers, and refrigerators. The products must be manufactured in the United States and must meet or exceed the Energy Star requirements in order to qualify. The amount of the tax credit varied by efficiency level. Another feature of this tax credit program is that it does not reward stagnation. For example, the Tax Relief and Job Creation Act of 2010 limited the eligible production to only the excess of the average number of appliances produced by the manufacturer during the preceding two-calendar-year period.3 If a manufacturer wants to apply for tax credits, it must scale up its production of high-efficiency appliances from the previous years, and only the increased portion of the production are eligible for the tax credit.
Figure 2.28 Annual Rate of Decline of Median, Feature-Adjusted Refrigerator Energy Use
Source: Enervee 2014.
1995 1997 1999 2001 2003 2005 2007 2009 2011 2013
-8.0%
-9.0%
-10.0%
-7.0%
-6.0%
-5.0%
-4.0%
0.0% Average
Sweden
Austria
Belgium
France
Germany
Italy
Netherlands
Portugal
Spain
Switzerland
UK
-1.0%
-2.0%
-3.0%
Ann
ual R
ate
of D
eclin
e (%
/yea
r)
In Australia the energy consumption of refrigerators declined at about 3 percent per annum from 1993 to 2008.1 Energy efficiency improved at approximately the same rate, resulting an overall 40 percent energy reduction in parallel with a 20–50 percent price reduction. This demonstrates again that technology improvements can deliver lower energy usage along with reduced purchase prices, with both parameters falling rapidly over time.
1 Energy Efficient Strategies. 2010. Evaluation of Energy Efficiency Policy Measures for Household Refrigeration in Australia: An Assessment of Energy Savings since 1986. Equipment Energy Efficiency (E3 ) Report No. 2010/10.
2 Nadel, S. 2012. “Energy Efficiency Tax Incentives in the Context of Tax Reform.” ACEEE Working Paper, Washington, DC: ACEEE.3 IRS (Internal Revenue Service). 2016. “Manufacturers' Energy Efficient Appliance Credit.” Page last updated February 9, 2016. https://www.irs.gov/
Businesses/Corporations/Manufacturers'-Energy-Efficient-Appliance-Credit.

109
A Greener Path to Competitiveness Policies for Climate Action in Industries and Products
This incentive policy was first introduced in the Energy Policy Act of 2005. Only appliances manufactured in the United States in the calendar years of 2006 and 2007 were eligible for the incentive. It was extended as a part of the Emergency Economic Stabilization Act of 2008 and extended again by the Tax Relief, Unemployment Insurance Reauthorization, and Job Creation Act of 2011. The latest extension of the manufacturer’s tax credit incentive was from the American Taxpayer Relief Act of 2012. The tax incentive covered the entire period of 2006 to 2013 through different phases. See Table 2.7.
a. SEC. 1334. CREDIT FOR ENERGY EFFICIENT APPLIANCES. https://www.congress.gov/bill/109th-congress/house-bill/6/text; b. SEC. 305. MODIFICATIONS OF ENERGY EFFICIENT APPLIANCE CREDIT FOR APPLIANCES PRODUCED AFTER 2007. https://www.congress.gov/
bill/110th-congress/house-bill/1424/text; c. SEC. 709. ENERGY EFFICIENT APPLIANCE CREDIT. https://www.congress.gov/bill/111th-congress/house-bill/4853/text; d. SEC. 409. EXTENSION OF CREDIT FOR ENERGY-EFFICIENT APPLIANCES. https://www.congress.gov/bill/112th-congress/house-bill/8/text; e. Modified Energy Factor (MEF)>1.72, Water Consumption Factor (WF)<8.0; f. Energy factor 0.67.
Table 2.7 Summary of U.S. Manufacturer’s Tax Credits
Energy Policy Act of 2005a
The Emergency Economic Stabilization Act of 2008b
Tax Relief, Unemployment Insurance Reauthorization, and Job Creation Act of 2010c
American Taxpayer Relief Act of 2012d
Eligible year 2006 or 2007 2008, 2009, or 2010 20112011, 2012, or 2013
Clothes washers
• $100: Meets the requirements of the Energy Star program which are in effect for clothes washers in 2007.e
• $75: Residential, top-loading, MEF>1.72, WF<8.0• $125: Residential, top-loading, MEF> 1.8; WF< 7.5• $150: Residential or commercial, MEF>2.0; WF<6.0;• $250: Residential or commercial, MEF>2.2; WF<4.5
• $175: Top-loading, MEF>2.2, WF<4.5• $225: Top-loading, MEF>2.4, WF<4.2 • $225: Front-loading, MEF>2.8, WF<3.5
Same
Refrigerators
• $75: Consumes at least 15% less energy than the 2001 energy conservation standards.• $125: Consumes at least 20% less energy than the 2001 energy conservation standards $175: Consumes at least 25% less energy than the 2001 energy conservation standards.
• $50: Consumes at least 20% less energy than the 2001 energy conservation standards.• $75: Consumes at least 35% less energy than the 2001 energy conservation standards.• $200: Consumes at least 30% less energy than the 2001 energy conservation standards.
• $150: Consumes at least 30% less energy than the 2001 energy conservation standards.• $200: Consumes at least 35% less energy than the 2001 energy conservation standards.
Same
Dishwashers
• Meets the requirements of the Energy Star program which are in effect for dishwashers in 2007.f
• $45: <324 kwh/year and <5.8 gallons per cycle• $75: <307 kwh/year and <5.0 gallons per cycle
• $25: <307 kWh per year and 5.0 gallons per cycle• $50: <295 kWh per year and 4.25 gallons per cycle• $75: <280 kWh per year and 4 gallons per cycle
Same

A Greener Path to Competitiveness Policies for Climate Action in Industries and Products
110
Market ImpactThe most direct market impact of the tax incentive was that market penetration of high-efficiency appliances increased because the manufacturers were encouraged to produce more of them. After the tax credit was extended in 2008, market data from the Association of Home Appliance Manufacturers showed that the tax credit’s eligible products increased dramatically for all three product categories, whereas the ineligible products decreased (Figure 2.29).
The tax credits also helped increase Energy Star efficiency levels. At the beginning, when the market shares of high-efficiency appliances were low, the tax incentive encouraged manufacturers to produce more high-efficiency appliances and increase their market penetration. As efficient appliances market share, new and more stringent requirements were employed for the new phase of the incentive program, and consequently Energy Star efficiency requirements also improved.
Clothes washers demonstrate the effect of tax credits on the improvement of Energy Star efficiency requirements. Before the introduction of the tax credits, it has been reported that only 153 out of 258 (59 percent) Energy Star clothes washer models available in 2005 could meet the tax incentive requirement of 1.72 MEF. As the tax credits were introduced, 100 percent of the Energy Star clothes washers could meet 1.72 MEF in 2007. Subsequently, this efficiency level became the minimum Energy Star efficiency level in 2007.
Figure 2.30 illustrates how the energy efficiency levels of refrigerators and clothes washers improved over time. From the improvement of Energy Star levels over time, it can be inferred that the average efficiency on the market increased as well, largely due to the positive contribution from the tax incentives.
Figure 2.29 Units Eligible for Appliance Manufacturers’ Tax Credit, 2008–9
80.0%
60.0%
40.0%
20.0%
Dishwashers Clothes Washers Refrigerators
Year 2008 Year 2009
Perc
ent
of p
rodu
cts
elig
ible
fo
r tax
cre
dits
Source: Graph created with data from Gold and Nadel 2011.

111
A Greener Path to Competitiveness Policies for Climate Action in Industries and Products
This tax incentive program significantly shifted the U.S. appliance market toward higher efficiency by encouraging the manufacturers to produce high-efficiency appliances. At the same time, the tax incentive program helped the Energy Star program improve its energy efficiency requirements.
High cost is considered a major barrier for the market transformation of high-efficiency appliances. Manufacturers are reluctant to produce high-efficiency products because these products are more expensive and normally have a lower market share. Manufacturers may potentially lose their competitive edge if they introduce high-efficiency products to the market when the market is not ready for them. It is sometimes not economically beneficial for manufacturers to adopt energy efficiency measures.
The manufacturer tax credits successfully addressed the barrier of high cost by rewarding manufacturers to produce high-efficiency products. Manufacturers reported that tax credit availability allowed them to increase production of high-efficiency products earlier than they would have otherwise.1 In response to this incentive, manufacturers have to plan and expand production lines for high-efficiency products, but they do not have to bear high risks for production expansion. Once the production lines of high-efficiency products are assembled or expanded, manufacturers are extremely resistant to backward reversions, thus creating long-lasting energy saving effects. The manufacturer tax credits also positively impacted the competitiveness of U.S. appliance manufacturers by encouraging innovation. In order for manufacturers to meet the continuously tightened requirements for the incentives, they needed to invest in innovations for high-efficiency products. The availability of the tax credits can also offset some of the R&D investments.
Most important, the tax credits can translate into direct or indirect jobs for domestic manufacturers. ACEEE estimated that over 40,000 were created due to manufacturer’s tax credits, including 19,000 direct jobs and 27,000 indirect jobs from supply chain and support service.2
Manufacturers improved energy efficiency by engaging in a combination of policies, including voluntary labels (ENERGYSTAR), mandatory standards (MEPS), and tax incentives. The success of the tax credit program was highlighted by a joint agreement entered by major appliance manufacturers and energy efficiency advocates in 2010, in which all parties jointly proposed that the U.S. government extend the manufacturer’s tax credits and improve energy efficiency standards. In response, the government extended the incentive for another three years as a part of the American Taxpayer Relief Act of 2012. This agreement is testimony to the success of the program, not only for its impacts on energy savings and environmental benefits, but also for its positive influence on the competitiveness of the U.S. appliance manufacturing industry.
Figure 2.30 Market Transformation of Refrigerators and Clothes Washers, 2000–15
800.0
700.0
600.0
500.0
400.0
300.0
200.0
100.0
2000 2002 2004 2006 2008 2012 20142010
kWh/
year
Standard Energy Star Minimum Tax Credit Maximum Tax Credit
Source: Gold and Nadel 2011.
3
2.5
2
1.5
1
0.5
2000 2002 2004 2006 2008 2012 201620142010
Mod
ifed
Ener
gy F
acto
r (M
EF)
Standard-Top Loading Standart-Front Loading
Minimum Tax Credit
Energy Star
Maximum Tax Credit
Refrigerator Energy Efficiency 2000-2015 Clothes Washer Energy Efficiency 2000-2015
1 Calabrese, David B. 2006. “Appliance Manufacturer’s Tax Credit.” PowerPoint presentation. Association of Home Appliance Manufacturers, Washington, DC. Accessed November 1, 2015. https://www.energystar.gov/ia/partners/downloads/meetings/EnergyBillPresentation_Calabrese_APM2006.pdf?442a-1e83.
2 ACEEE. 2010. “Major Home Appliance Efficiency Gains to Deliver Huge National Energy and Water Savings and Help to Jump Start the Smart Grid.” Washington, DC: ACEEE. Accessed November 1, 2015.
http://aceee.org/press/2010/08/major-home-appliance-efficiency-gains-deliver-huge-national-energy-and-water-savings.
2018

A Greener Path to Competitiveness Policies for Climate Action in Industries and Products
112
Tax Credits and WhirlpoolWhirlpool is one of the largest U.S. manufacturers for home appliances and one of the major beneficiaries of the tax credits. The most direct impact of the credit on Whirlpool is financial. For example, in 2011 Whirlpool accumulated over $379 million in tax credits, which accounted for a significant source of income (Figure 2.31).
-100
600
500
-200
400
-300
300
-400
200
-500
100
0
Figure 2.31 Whirlpool Yearly Tax Credits
Earnings before income tax (United States) US government tax incentives including Energy Tax Credits
Source: Graph created from Whirlpool SEC filings 10-K from 2003 to 2015.
2003 2004 2005 2006 2007 2008 2009 2010 2011 2012 2013 2014
US
D M
illio
n
Other direct or indirect benefits from the tax credits for Whirlpool were multifaceted. Bloomberg reported in 2011 that Whirlpool’s profit was raised by the help of tax credits for making energy-efficient appliances1. The same report also highlighted that Whirlpool planned to expand its business in emerging markets such as Brazil, invest more than $600 million on research and development, and open a plant and distribution center in Tennessee and a new headquarters in Michigan with a $1 billion investment. Although the tax credit may not directly result in these major strategic investment plans, it definitely made significant contributions to Whirlpool’s decisions.
ConclusionThe manufacturer tax credits successfully improved the market penetration of high-efficiency appliances in the US while helping manufacturers to keep their competitive advantages by providing direct financial incentives. The tax credits directly or indirectly helped manufacturers to expand their production of high-efficiency appliances, spur innovation, increase R&D investment, and create or retain jobs in the US. Moreover, the program was welcomed by energy efficiency advocates and appliance manufacturers alike. It can be observed from this case study that financial incentives such as tax credits can be an effective tool to complement standard and labeling policies, as it speeds up the market transformation towards higher efficiency products.
1 Lauren Coleman-Lochner and Richard Rubin. 2011. Whirlpool’s First-Quarter Profit Rises, Aided by Tax Credits. Accessed November 1, 2015. http://www.bloomberg.com/news/articles/2011-04-27/whirlpool-s-first-quarter-profit-rises-helped-by-u-s-energy-tax-credits

113
A Greener Path to Competitiveness Policies for Climate Action in Industries and Products
SWITZERLAND - HEAT PUMP CLOTHES DRYER
The European residential clothes dryer market is undergoing a transformation driven by highly efficient heat pump dryer technology. Incentivized by government technology procurement programs, the first heat pump dryer hit the market in 1997. Its energy efficiency level is a drastic improvement over conventional tumble dryers.
The then new product was commercialized, facilitated by the Swiss rebate program and the Top ten program.1 The effects of these programs have been felt not only in Switzerland; they have played a pivotal role in pushing the wider European clothes dryer market towards high efficiency.
Background The tumble dryer is one of the largest energy-consuming home appliances, accounting for 12 percent of the total electricity consumed in a Swiss household. Currently, the major markets for tumble dryers are distributed across North America and the EU, while data shows the demand from Asia and other developing countries is rising.
In spite of the high-efficiency performances, the market share of heat pump dryers was less than 2 percent in Switzerland in 2004 due to appliance’s comparatively high cost and the low awareness among the consumers about its energy-saving capability.
In the 1990s the use of tumble dryers was on the rise in Europe. Replacing line drying with tumble drying increased electricity demand. Switzerland knew that it would be difficult to meet this demand if all those new dryers used conventional resistance heating technology.
Recognizing the market growth potential, as well as the country’s need to greatly expand power-generating capacity should more dryers be installed, the Swiss government put in place a comprehensive energy-saving scheme to encourage the adoption of the super-efficient heat pump dryer model. The energy efficiency initiated is sustaining, is well coordinated among stakeholders, and was implemented in a timely manner. In addition, the stringency of the S&L has increased over time, sending clear signals to the manufacturers of their need for R&D engagement and creating a transparent, stable, and secure market environment that favors high-quality (and high-efficiency) products.
Policy InterventionsAn ambitious labeling program for dryers was implemented by the European Commission as early as 1995. The label categories ranged from “A” through “G,” with “A” class representing the most efficient clothes dryers.2 However, no dryer models qualified for class “A” during the first few years of the program, manufacturers were motivated to invest in bringing such products to the market to fill the efficiency gap.
The high risk during product development and the initial commercialization is one of the primary reasons cited for inadequate investments of financial and intellectual capital in R&D. To overcome this, the government of Switzerland launched the Sustainable Public (technology) Procurement program in 2005, which encouraged manufacturers to engage in research and innovation for super-efficient model development.3 The market demand side is warrantied and well-coordinated by the program, and it helps the manufacturers focus the work within the company. The program brings together product development and marketing functions on how an optimal product should be designed, given an assumed price and market potential. It thus drastically reduces risks of manufacturers during product commercialization.
As part of the market upgrade scheme, starting in 2003 the city of Zurich initiated laboratory tests of all dryer models available on the Swiss market. Consumer satisfaction with the product in the everyday life was analyzed. The consistently positive experiences with heat pump driers convinced the city to officially favor heat pump driers. In 2005 Zurich instituted a rebate program promoting them. These products had a wide national market introduction because of Zurich’s policy.
1 The Top ten program, established in 2000 in Switzerland, is a consumer-oriented online search tool that integrates information disclosure, stakeholder engagement, and education to inform consumers of the best appliances in terms of efficiency in various categories of products.
2 Eco-design and labeling, retrieved on Sept 10th, 2016 from http://www.eceee.org/Eco_design/Energy_labeling_directive3 UNEP. “Sustainable Public Procurement Programme.” Retrieved on November 11, 2015. http://www.unep.org/10yfp/Programmes/
ProgrammeConsultationandCurrentStatus/Sustainablepublicprocurement/tabid/106267/Default.aspx.

A Greener Path to Competitiveness Policies for Climate Action in Industries and Products
114
Taking advantage of the favorable situation, the Swiss government and its Federal Office of Energy moved forward. They set labeling class “A” as the MEPS for laundry dryers from 2012 onward. As a result, only heat pump tumble dryers and nonconventional dryers have been sold in Switzerland since that time.
In addition, the Top ten program was launched in 2000 to better disperse product information and facilitate consumer education. The program certifies and labels the most efficient models on the market. It helps improve their public visibility in coalition with manufacturers, the government, utilities, NGOs, and energy agencies on both the national and international levels. It also provides technical expertise to stakeholders in order to promote standards, subsidies, and procurement schemes.1 Since its inception, it has been instrumental in all phases of Europe’s dryer market evolution through today.
ResultsThe European residential clothes dryer market is now undergoing a transformation driven by highly efficient heat pump dryer technology. The market share of heat pump driers in Switzerland jumped from 1.7 percent in 2004 to 100 percent in 2012. The energy saved reached 11.5 TWh by 2030, compared the scenario in which conventional dryers would have dominated in the market.2
The long-term efficiency scheme also benefits utilities, as large investment for extra capacity buildup is avoided because of controlled demand.
The profound market transformation of dryers in the Swiss market is attributable to Swiss government’s consistent and sustainable support, through technology procurement, information distribution, and consumer education via the Top ten program,3 enhanced by the timely and stringent S&L polices.
The consistency and credibility of the government’s efforts can be a model for other efforts to bring improved efficiency of products to market. See Figure 2.32.
2 Mylan, J., 2015. Understanding the diffusion of sustainable product-service systems: insights from the sociology of consumption and practice theory. Journal of Cleaner Production, 97, pp.13-20.
3 Michel, A., Attali, S. and Bush, E., 2015. Energy efficiency of White Goods in Europe: monitoring the market with sales data.
Figure 2.32 Clothes Dryer Sales in Switzerland by Energy Label Category
100%
80%
60%
40%
20%
2004 2005 2006 2007 2008 2009 2010 2011 2012
Sales share of dries in Switzerland 2004-2012
Hea
t pu
mp
drie
rs: S
ales
sha
re 1
00
%
Source: Top ten. Swiss Energy Regulation for driers:Since January 2012, only heat pump driers allowed on the Swiss market
• Non – Efficient tumble driers are completely banned from the Swiss market • Market share rose to 100%
A (old label) B C D
3.6
94.2 90.4
66.8
26.6
5.94.41.7
4.8 0.7 0.8
42
31.127.1
19.38.4
100
44.2
47.4
48.4
31.9
48
24.5
52.9
15.6
50
7.4
1 Top ten program, established in 2000 in Switzerland, is a consumer-oriented online search tool that integrates info disclosure, stakeholder engagement and education to inform consumers of the best appliances in terms of efficiency in various categories of products.

115
A Greener Path to Competitiveness Policies for Climate Action in Industries and Products
In 1989, Mexico founded the National Commission on Energy Savings (CONAE) and established a program of MEPS (in Spanish, Normas Oficiales Mexicanas, or NOMs). In 1994, CONAE published standards for three products: domestic refrigerators, air conditioners, and three-phase electric motors.
This first set of NOMs, NOM-072-SCFI-1994, for refrigerators was based on already implemented U.S. DOE standard for refrigerators. The standard was aligned for both the energy consumption test procedure and the energy efficiency tiers (energy consumption thresholds for rating the products). The first revision to this standard happened in 1997, NOM-015-ENER-1997, and the second revision, NOM-015-ENER-2002, took place in 2002. The standards and update schedule is shown in Table 2.8.
1 EEDAL. 2015. “Heat Pump Tumble Dryers: Market Development in Europe and MEPS in Switzerland.” Retrieved on July 11th from http://www.topten.eu/uploads/File/EEDAL15_Eric_Bush_Heat_Pump_Tumble_Driers.pdf
2 Sanchez, I., H. Pulido, M. A. McNeil, I. Turiel, and M. della Cava. 2007. “Assessment of the Impacts of Standards and Labeling Programs in Mexico (four products),” LBNL-62813. Berkeley, CA: LBNL.
3 Impacts Evaluation of Appliance Energy Efficiency Standards in Mexico since 2000. http://www.superefficient.org/Research/PublicationLibrary/2015/Impacts%20Evaluation%20of%20Appliance%20Energy%20Efficiency%20Standards%20in%20Mexico%20since%202000
Refrigerator Compressor
A major appliance manufacturer in Europe, Electrolux, which won the heat pump dryer technology procurement program, certainly benefited from this market transformation. Electrolux reports that the company increased its production capacity with lower product costs as barriers during the initial commercialization stage were overcome. Since entering the European market, heat pump dryers have experienced steady market growth, continued efficiency improvements, and decreased costs.1
MEXICO - REGIONAL HARMONIZATION OF REFRIGERATOR STANDARDS
Mexico and the United States share a common market for many types of appliances, including domestic refrigerators and air conditioners. The countries have a long history of standards alignment, and such alignment on MEPS and test protocols for products has facilitated trade between the two countries. Standards alignment also helped minimize manufacturers’ compliance costs.
In Mexico, refrigerators and air conditioners were among the first three products for which MEPS were established. Since the beginning of the MEPS program, standards for refrigerators and air conditioners were explicitly harmonized with the U.S. standards. A 2006 study conducted by LBNL found that between 1995 and 2005 the harmonized refrigerator standard produced more GHG emissions reductions than standards for other products in Mexico, about 20 Mt CO2e.2 The value of refrigerator exports from Mexico has gone up nine fold, from US$401 million to about US$3.7 billion, between 2000 and 2014.3
This section evaluates the impacts of standard alignment with U.S. DOE’s standard on refrigerator manufacturers and their market size in Mexico. Standards for refrigerators have been revised since first implementation, so the analysis considers effects of both the original standard and the subsequent revisions through 2012.

A Greener Path to Competitiveness Policies for Climate Action in Industries and Products
116
Table 2.8 Mexican MEPS (NOMs) Schedule for Refrigerators and Freezers
Standard Version Publication date Effective date
NOM-072-SCFI-1994 Energy efficiency of refrigerators and freezers: Limits, test methods, and labeling
Original September 8, 1994 January 1, 1995
NOM-015-ENER-1997 First revision July 11, 1997 August 1, 1997
NOM-015-ENER-2002 Second revision January 13, 2003 March 14, 2003
Source: Sanchez et al. 2007.
In every revision, Mexico’s National Commission for the Efficient Use of Energy, CONUEE, explicitly harmonized with the US DOE’s standard for refrigerators.
AchievementsThe standards alignment minimized barriers to the import and export of domestic refrigerators between the United States and Mexico. As noted, a study commissioned by Super-efficient Equipment and Appliance Deployment (SEAD) initiative found that the trade value of refrigerator exports from Mexico has risen nine fold, from US$401 million to about US$ 3.7 billion between 2000 and 2014. The SEAD study also suggested that the standard alignment reduced energy consumption of the major refrigerator product class by 27 percent and reduced GHG emissions by nearly 30 Mt over a period of 12 years.1
Mexico is one of the most competitive countries in the world in terms of manufacturing costs, which are approximately 25 percent lower than in the United States.2 Mexico’s NOMs for refrigerators and their subsequent alignment with the US standards enabled industry to make investments in energy efficiency to upgrade technology and product manufacturing processes.
To understand the impact of refrigerator NOMs on Mexico’s export to the United States, the export-import data from the UN COMTRADE database was analyzed for the period 2002–14. The data shows a significant increase in refrigerators export from Mexico to the United States between 2002 and 2007. There could be many factors that triggered this increase in exports, including the comparative advantage that Mexico has because of its lower manufacturing costs. However, experts believe that the refrigerator energy efficiency NOMs and their alignment with U.S. standards may have contributed. The import of refrigerators from Mexico to the United States grew from 12 percent in 2002 to close to 46 percent of the U.S. market in 2014, as shown in Figure 2.33.
1 Abel Hernandez, director general, Asociacion Nacional de Normalizacion y Certificacion del Sector Electric (ANCE) (National Association for Standardization and Certification of Electrical Sector), in SEAD 2015.
2 SEAD (Super-efficient Equipment and Appliance Deployment). 2015. Impacts Evaluation of Appliance Energy Efficiency Standards in Mexico since 2000. http://www.superefficient.org/Research/PublicationLibrary/2015/Impacts%20Evaluation%20of%20Appliance%20Energy%20Efficiency%20Standards%20in%20Mexico%20since%202000

117
A Greener Path to Competitiveness Policies for Climate Action in Industries and Products
10
12
Figure 2.33 The Import of Refrigerators from Mexico to the United States, 2002–14
Rest of the US market US import from MexicoM
illio
n un
its
8
6
4
2
2002 2003 2004 2005 2006 2007 2008 2009 2010 2011 2012 2013 2014
The introduction of NOMs and their harmonization with the U.S. standard is also seen as positive for encouraging innovations in manufacturing by those interviewed in the SEAD study. The certification body in Mexico, National Association for Standardization and Certification of Electric Sector (ANCE), noted, “Standards and regulations are essential for innovation, as they provide a solid base for product improvement without sacrificing performance and with consideration of efficiency parameters that are especially important in the current context.”1 Without aligned NOMs for refrigerators, the manufacturers in Mexico may not have invested in the newer and energy efficient technologies for their domestic market. The delay in adoption of energy efficient technologies for products would have resulted in loss of energy savings that the country has achieved otherwise.
To conclude, the aligned NOMs in Mexico created a level playing field where manufacturers can compete under similar conditions. This gave a clear signal to industry that investments to upgrade technology and product manufacturing processes for energy efficiency are worthwhile. Such a policy signal may result in technology changes, as manufacturers tend to improve products by including new components or more efficient parts.
1 http://embamex.sre.gob.mx/kenia/images/stories/pdf/household_appliances.pdf

A Greener Path to Competitiveness Policies for Climate Action in Industries and Products
118
INDUSTRIAL EQUIPMENT
The industrial sector is one of the most energy-demanding sectors in the world. It is a key setting for global energy consumption reduction and GHG reduction. It has been reported that nearly a third of the world’s energy consumption and 36 percent of CO2 emissions are attributable to manufacturing industries.1 The U.S. Energy Information Administration has estimated that the industrial sector accounted for 52 percent of the overall world energy consumption in 2010 and is expected to grow by an average of 1.4 percent from 2010 to 2040.2 Among various types of industrial equipment, motors and transformers play important roles in energy consumption and savings potential.
Motors are the single largest electricity-consuming equipment in the world. It is estimated that motors in all sectors accounted for 43 to 46 percent of all global electricity consumption, accounting for 6,040 MMt of CO2 emissions.3 Fortunately, the huge electricity consumption of motors presents a significant savings opportunity. Estimates show that by adopting the best practice MEPS for industrial electric motors, 322 TWh of electricity can be saved annually by 2030, resulting in over 206 MMt of CO2 emission reduction.
Distribution transformers are a crucial part in the modern electricity delivery system. They convert high voltage currents to low voltage for end use. The installed power capacity of the world’s distribution transformer stock is estimated to reach 13,848 gigavolt-ampere (GVA) in 2014. It is projected to rise to 22,400 GVA by 2030.4 During the process of converting electricity from one voltage to another, a portion of the electricity is lost by transformers. It is estimated that 657 TWh of electrical energy per annum is attributable to distribution transformer losses. By adopting the available high-efficiency technologies, a total savings of 402 TWh per annum could be achieved by 2030, resulting in over 201 MMt of CO2 emissions per annum.
1 IEA-4E. 2007. Tracking Industrial Energy Efficiency and CO2 Emissions.2 U.S. Energy Information Administration. 2013 “International Energy Outlook 2013.” Washington, DC: EIA.3 Waide, Paul, and Conrad U. Brunner. 2011. “Energy-Efficiency Policy Opportunities for Electric Motor-Driven Systems.” International Energy Agency working
paper4 Waide, Paul, and Michael Scholand. 2014. “PROPHET II: The Potential for Global Energy Savings from High-Efficiency Distribution Transformers.” Prepared
for the European Copper Institute.
Electric Motors

119
A Greener Path to Competitiveness Policies for Climate Action in Industries and Products
GLOBAL OVERVIEW OF CURRENT S&L INDUSTRIAL EQUIPMENT POLICY
The ways in which energy is used vary widely across the industrial sector. Thus the opportunities for energy and GHG emissions savings and the strategies employed for finding and exploiting those opportunities vary widely. Energy management systems are helpful tools across many industries, and some governments have created policies and programs customized to specific industries. S&L policies are a useful tool for equipment that is standardized and manufactured rather than custom designed and built. Perhaps the two best examples are electric motors and distribution transformers. Electric motors convert electrical energy to rotating mechanical energy to drive devices such as fans, pumps, blowers, compressors, and conveyors. They are used in many types of facilities throughout the industrial sector. Distribution transformers (or simply “transformers”) provide the final voltage transformation in the electric power distribution system, stepping down the voltage used in distribution lines to the level used by the customer.1
The first MEPS were introduced in Chinese Taipei in 1981 for motors and in 1997 in Mexico for transformers. There are now about 80 policies in place in at least 25 economies for these electric motors and transformers (Figure 2.34). For motors, most regulations target small or medium three-phase motors, as these constitute a large portion of the global market. Motor efficiency has improved significantly in the past 15 years through the use of more conductive materials, improved designs, and effective policies. However, there are a lot of savings that remain on the table for motor system efficiency (for example, for pumps, fan compressors, and other auxiliary components).
1 Waide, Paul, and Michael Scholand. 2014. “PROPHET II: The Potential for Global Energy Savings from High-Efficiency Distribution Transformers.” Prepared for the European Copper Institute.
Motors Transformers
Figure 2.34 S&L Policies for Motors and Transformers
Source: CLASP S&L Database 2015.
Cum
ulat
ive
Polic
ies
50
40
30
20
10
60
198519831981 19891987 19931991 19971995 2001 2003 2005 2007 2009 2011 2013 20151999
The international IEC 60034-30 standard for single-speed, three-phase induction motors establishes efficiency classes (or tiers) that can be adopted to meet the needs of an economy. Prior to the development of IEC 60034-30, there were effectively three test methods for electric motors used around the world. These standards were promulgated by the International Electro-technical Commission (IEC), National Electrical Manufacturers Association (NEMA, in North America), and Japanese Industrial Standards. The IEC decided to revise its standard to bring it into line with the approach used in North America, which was generally regarded as technically superior but somewhat more expensive. With significant international collaboration, the revised IEC test procedure was published in 2007. As part of the standards development process, the IEC also created efficiency classes or tiers that can be used as a ladder to help economies easily raise the stringency of standards. Tiers also make it easier to compare stringency across economies.2
2 Jenny Corry Smith, Debbie Karpay Weyl and Ari Reeves. 2015. “How and When to Increase Alignment of Appliance Policies.” EEDAL. Lucerne-Horw, Switzerland. August 2015

A Greener Path to Competitiveness Policies for Climate Action in Industries and Products
120
1 CLASP. 2013. Improving Global Comparability.
Figure 2.35 Market Share of Efficiency Classes in the United States, 2001–6
Perc
ent
of u
nits
Epact Other
60
70
50
40
30
20
10
200620052004200320022001
NEMA Premium
Note: NEMA Premium equivalent to IE3; EPAct equivalent to IE2.Source: Boteler 2007.
The motor efficiency improvement was also observed in Europe. Under a voluntary agreement between the European Committee of Manufacturers of Electrical Machines and Power Electronics (CEMEP) and the European Union, the market share of more efficient of motors between 1.1 kW and 90 kW steadily increased (Figure 2.36). The market share of less efficient Eff3 class motors decreased from 68 percent in 1998 to 2 percent in 2007 while the combined market share of the more efficient Eff2 (equivalent to IE1) and Eff1 (equivalent to IE2) motors increased from 32 percent in 1998 to 98 percent in 2007.
To further reduce trade barriers and help motor manufacturers to comply with different regulatory schemes NEMA and IEC System of Conformity Assessment Schemes for Electro-technical Equipment and Components (IECEE) are collaborating to create the Global Motor Labeling Program. This program would develop a global MEPS registration process that would allow manufacturers to test products at a globally recognized lab and obtain a test certificate accepted in all participating economies.
Most economies reference the IEC 60076 standard for power transformers for their regulatory programs. The two major economies that deviate from this are the United States and Canada. Their standards are consistent and are largely based on the Institute of Electrical and Electronics Engineers (IEEE) standard, which is similar to the IEC standard. There are differences in load points and ambient temperature for tests, which could be aligned.1
HISTORICAL ENERGY EFFICIENCY AND CONSUMER PRICE TRENDS
As they did for household appliances, energy efficiency policies helped industrial equipment such as motors and transformers improve their efficiencies. Since 1998 when MEPS for motors were enforced in the United States, the energy efficient motors started to gain market share (Figure 2.35). It can be observed that the more efficient NEMA Premium (equivalent to IE3) motors steadily gaining market share between 2001 and 2006 while the market share of less efficient Epact motors (equivalent to IE2) declined over the same period.

121
A Greener Path to Competitiveness Policies for Climate Action in Industries and Products
The motor purchase price was very inelastic and would not affect the uptake of high-efficiency motors. Hence the purchase price was less relevant for motors than energy efficiency. The initial purchase price typically represented just 1 percent of the total cost of ownership, considering a 20th year service life.
Manufacturer ImpactsThis section features two case studies related to industrial equipment. The first describes how the U.S. DOE used a special process called negotiated rulemaking to develop new more stringent standards for distribution transformers. The second explains how a major manufacturer leveraged a newly defined high-efficiency level for electric motors to successfully differentiate its products from others on the market.
THE U.S. DEPARTMENT OF ENERGY AND NEGOTIATED RULEMAKING
Negotiated Rulemaking Process: Distribution Transformers in the United StatesPolicy makers have to ensure that S&L policies are ambitious enough so that energy saving objectives and other related benefits can be maximized, but also realistic enough to enable the industry to meet the policy requirements without being disadvantaged in the market. Stakeholder engagement is extremely important in setting well-informed, ambitious, and balanced S&L policies. The importance of stakeholder engagement in setting energy efficiency policies was long recognized by the U.S. DOE-seeking early input from stakeholders is listed as the first objective in developing new or revising standards.1 The emphasis on engagement and support from stakeholders was further highlighted when DOE introduced the “negotiated rulemaking” process for the first time in setting the standards for distribution transformers. This study examines how the negotiated rulemaking process was used by the US DOE in setting energy efficiency standards.
1 U.S. DOE. 1996. “Energy Conservation Program for Consumer Products: Procedures for Consideration of New or Revised Energy Conservation Standards for Consumer Products.” Federal Register 61 (136): 36974.
Figure 2.36 Market Share of Efficiency Classes in Europe under the CEMEP Voluntary Agreement
100%
90%
80%
70%
60%
50%
40%
30%
20%
10%
1998 1999 2000 2001 2002 2003 2004 2005 20072006
Eff3 Eff2=IE1 Eff1=IE2
Source: Waide, Paul, and Conrad U. Brunner 2011.
2 3 3 4 5 6 7 9 12 12
86
2
85
3
87
4
85
8
84
10
83
16
80
16
44
54
53
43
30
68

A Greener Path to Competitiveness Policies for Climate Action in Industries and Products
122
Traditional versus Negotiated Rulemaking ProcessesIn a typical rulemaking process, DOE develops a proposed rule, using DOE staff and consultant resources. DOE will publish the notice of the proposed rule, which will be open for public comments. Parties may respond with information and data supporting their positions. DOE will then publish the final rule, taking all viewpoints and arguments into consideration.
In recent years, negotiated rulemaking was used more and more regularly by DOE for setting energy efficiency standards. Negotiated rulemaking was preferred was because stakeholders strongly support the rulemaking effort while DOE believed that the negotiated rulemaking process would be less adversarial and better suited to resolving complex technical issues. One of the key advantages of negotiated rulemaking is that it encouraged dialogue and debate among stakeholders with different viewpoints.
Unlike the traditional rulemaking process led by DOE, the negotiated rulemaking process was led by an advisory committee comprising representation from different interested parties, including manufacturers, raw material suppliers, utility companies, power companies, industry associations, energy efficiency advocates, and so forth. The advisory committee engages in discussions and debate on the key issues surrounding the energy efficiency standards. The goal of the negotiated rulemaking process is for different interest parties to reach a consensus, and the advisory committee presents the proposed rule to DOE for approval.
Negotiated Rulemaking for Distribution TransformersDistribution transformers are one of the most important and widely used types of industrial equipment. They reduce high voltage electric current from power lines to lower voltages for end-use equipment, such as lighting, appliances, or other electricity-driven equipment. In early 2013, DOE published a final rule amending the standards for liquid-immersed, medium-voltage dry-type and low-voltage dry-type distribution transformers1. Suppliers must comply with these amended standards beginning January 1, 2016. This is the first time that negotiated rulemaking process was used by DOE in setting energy efficiency standards.
A subcommittee of stakeholders was established to negotiate the rules for transformers. More than 10 subcommittee meetings were held during the rulemaking process. The high degree of involvement of stakeholders allowed constructive argument, an exchange of viewpoints, and sharing of technical data. However, due to the vast difference in opinions surrounding several key issues, including the use of amorphous core steel and the impact on small manufacturers, the subcommittee was unable to reach consensus. Subsequently, DOE had to revert to its traditional rulemaking process. Despite the fact that no consensus was reached, data and arguments from the negotiation were extremely valuable and all participants came to understand the diverse viewpoints2.
Although stakeholders were unable to agree on the distribution transformers standards, the negotiated rulemaking process was still used more regularly by DOE in setting energy efficiency standards. It allowed more thorough and effective discussion on complex technical issues among different parties. A good example was the recent negotiated rulemaking for package air conditioning and heating equipment and commercial warm air furnaces. Seventeen stakeholders, including representatives of individual manufacturers, installers, utilities, environmental groups, and efficiency organizations, were able to reach to a consensus on efficiency standards. The end result was a massive saving of 1.7 trillion kWh over 30 years, representing the largest energy and pollution savings of any rule ever issued by DOE3.
ConclusionAs demonstrated in this case, the stakeholder-led negotiated rulemaking process enables more debates and discussions surrounding key issues of the policy in comparison to the traditional government-led rulemaking process. The final policies developed using this process will likely receive support from all parties, as consensus has already been reached. Although in the case of distribution transformers consensus could not be reached, the arguments and technical data presented during the negotiation process were still extremely valuable for policy makers to develop well-informed and balanced energy efficiency policies.
1 Energy Conservation Program: Energy Conservation Standards for Distribution Transformers; Final Rule. Federal Register 78 FR 23335.2 Scholand, Michael. 2013. “US Department of Energy Adopts Higher Efficiency Standards for Distribution Transformers.” Presentation at International
Energy Efficient Transformers Workshop, Bangkok, 13 November 2013.3 ASAP. 2015a. “Manufacturers, Efficiency Groups Praise Largest Energy-Savings Standards Ever Issued.” Roslindale, MA: ASAP. Accessed April 4, 2016.
http://www.appliance-standards.org/documents/asap-press-releases/manufacturers-efficiency-groups-praise-largest-energy-savings-standard.

123
A Greener Path to Competitiveness Policies for Climate Action in Industries and Products
Electric Motor

A Greener Path to Competitiveness Policies for Climate Action in Industries and Products
124
SIEMENS AND NEW ELECTRIC MOTORS
In the most recent IEC standards for motors, IEC 60034-30-1:2014, a new efficiency class-IE4 Super Premium Efficiency-was introduced. The IE4 class is more efficient that the previous most efficient class of IE3. Siemens, which held the second largest global low-voltage electric motor market share of 9.5 percent (by revenue) in 2013,1 quickly responded to the change in standards by leveraging its existing research and development capacity and quickly developed super-efficient products that meet IE4 requirements, despite the fact that IE4 efficiency is not required by the current EU regulation. At the moment, IE4 efficiency products are already available in many of Siemens’ product lines. For example, IE4 models have been introduced to Siemens’ general purpose motors family (SIMOTICS GP) and severe duty motors (SIMOTICS SD) family-two of Siemens’ flagship motor product lines.
By investing in the development of the IE4 products that exceed requirements of current EU regulations, Siemens was well-prepared for any future S&L policy updates and at the same time maintained its position as the leader of high-quality and high-efficiency motor manufacturers.
Moreover, an emerging market for IE4 motors is being created in light of the newly introduced IE4 class. The global market for IE4 motors is expanding at double-digit rates and is expected to increase from US$115 million in 2013 to almost US$300 million in 2018-almost tripling its size in five-years. By investing in IE4 development at early stages, Siemens aims to take a leadership position in this new market.
Standard and labeling policies allow product differentiation by efficiency levels, which allows manufacturers to use efficiency and cost savings as a primary selling point when marketing their products. Many manufacturers, including Siemens, took such opportunities to reeducate the market about the misconceptions of energy efficiency and to help clients focus on the real challenge behind motors: lifecycle costs versus procurement costs. Energy efficiency and energy cost are highlighted as key messages and selling points in Siemens’ marketing materials (Figure 2.37).1
Figure 2.37 Marketing Materials from Siemens Presenting New, Efficient Motors
Contrary to common misconceptions, Siemens has proven that manufacturers can benefit from S&L policies if they are adaptive, innovative, and well-prepared for the policy change.
1 Mark Meza. 2014. “Industrial LV Motors & Drives: A Global Market Update.” Presentation at Motor and Drive Systems 2014.

125
A Greener Path to Competitiveness Policies for Climate Action in Industries and Products
RECOMMENDATIONS FOR PROMOTING COMPETITIVENESS WITH S&L
Governments and the private sector have numerous opportunities to collaborate and drive down the emissions of manufactured goods. Standards and labeling policies are drivers of energy efficiency improvement, and they have been adopted by governments around the world. These policies are typically designed to achieve energy savings, peak demand reductions, GHG emissions reductions, and energy cost savings, or some combination of these.
Energy efficiency policies can benefit manufacturers as well as consumers. Part 2 of this study presented cases in which S&L regulations, sometimes in combination with complementary policies, not only achieved reductions in energy use and GHG emissions but strengthened domestic manufacturing industries.
The following recommendations will help policy makers design S&L policies and help manufacturers respond to or engage with those policies. The goal is to achieve energy and climate objectives and enhance industrial competitiveness. Readers seeking detailed guidance will find the S&L Guidebook helpful,1 with thorough information on developing, implementing, enforcing, and monitoring energy efficiency labeling and standards programs.
Engage manufacturers in the S&L policy setting process so that better decisions can be made. Governments can realize the dual benefits of energy savings and industrial competitiveness, but they cannot do it alone. To succeed, governments must engage industry in the standards-development process and help manufacturers thrive in the new environment. The highly participatory rulemaking processes used in the United States can serve as models. Through dialogue, policy makers can learn what manufacturers need to succeed-access to technical assistance, test laboratories, or loan facilities, for example. Similarly, manufacturers can better understand what policy makers are trying to achieve and how quickly and then use this knowledge to plan accordingly. Although in some cases consensus cannot be reached by all stakeholders, the data and arguments used during the negotiation process are still valuable for policy makers as they make balanced decisions that can achieve energy savings and preserve the competitiveness of the industry at the same time.
Design market-sensitive incentive polices that allow the manufacturers to adjust and adapt to the new S&Ls. S&L policy designs should include incentive policies. They are effective in creating demand for high-efficiency products, and they help manufacturers adapt to new S&L policies. The U.S. production tax credit program was used to complement the U.S. Energy Star labeling program. The program helped move the U.S. appliance market toward higher efficiency and it improved domestic manufacturers’ competitiveness by rewarding them with tax credits for their investment in producing high-efficiency products. Similarly, by using a wide range of incentive policies such as a government procurement program and a rebate program, the Swiss government helped appliances manufacturers in Switzerland create a new market for the highly efficient heat pump clothes dryers.
Make S&L part of the national strategy to lower trade barriers and strengthen the competitiveness of industries in foreign markets. Alignment of S&L policies can lead to export growth. Mexico’s refrigerator programs and China’s lighting policies highlight this. In both cases, S&L policies were strengthened to align with those in major foreign markets. Domestic manufacturers’ incentives meshed with energy efficiency goals.
Conduct ex ante and ex post analyses of appliance S&L policies. Policy makers should consider impacts on manufacturers among the various impacts examined when considering a policy for adoption. They should also seek to determine what impacts actually result from the policies they implement. Doing so can help build political support for S&L policies and improve the accuracy and credibility of the forecasts used to justify future policies.
Part 2 of the publication presents a number of cases in which manufacturers and governments have successfully progressed down a greener path to competitiveness. They have used public policy to improve the energy efficiency of some of the most common products found in homes and businesses and strengthen industrial competitiveness at the same time. There are no guarantees that these results will be replicated in any given situation. However, by following the recommendations presented herein, policy makers can improve their chances of obtaining favorable results. 1 Wiel. S., J. E. McMahon, et al. 2005. S&L Guidebook. CLASP. Available at http://clasp.ngo/en/Resources/Resources/StandardsLabelsGuidebook.

A Greener Path to Competitiveness Policies for Climate Action in Industries and Products
126
ACEEE. 2010. Major Home Appliance Efficiency Gains to Deliver Huge National Energy and Water Savings and Help to Jump Start the Smart Grid. Washington, DC: ACEEE. http://aceee.org/press/2010/08/major-home-appliance-efficiency-gains-deliver-huge-national-energy-and-water-savings.
Aluminium Leader. 2015. “All about Aluminium.” http://www.aluminiumleader.com/about_aluminium/.
Ambec, S., and P. Barla. 2006. “Can Environmental Regulations Be Good for Business? An Assessment of the Porter Hypothesis.” Energy Studies Review 14 (2): 42.
Arens, M., E. Worrell, E., and J. Schleich., J., 2012. “Energy Intensity Development of the German Iron and Steel Industry between 1991 and 2007.” Energy 45 (1): 786–797. http://www.sciencedirect.com/science/article/pii/S0360544212005427http://www.sciencedirect.com/science/article/pii/S0360544212005427.
Arouri, M. E. H., G. M. Caporale, C. Rault, R. Sova, and A. Sova. 2012. “Environmental regulation and competitiveness: Evidence from Romania.” Ecological Economics 81: 130–139.
ASAP (Appliance Standards Awareness Program). 2012. ASAP Fact Sheet: Dishwashers. Roslindale, MA: ASAP. http://www.appliance-standards.org/sites/default/files/Dishwasher_Fact_Sheet_May16.pdf.
---. 2013. Better Appliances: An Analysis of Performance Features and Price as Efficiency has Improved. Roslindale, MA: ASAP. http://www.appliance-standards.org/sites/default/files/Better_Appliances_Report.pdf.
---. 2015a. Manufacturers, Efficiency Groups Praise Largest Energy-Savings Standards Ever Issued. Roslindale, MA: ASAP. http://www.appliance-standards.org/documents/asap-press-releases/manufacturers-efficiency-groups-praise-largest-energy-savings-standard.
---. 2015b. Progress toward 3 Billion MT CO2 Reduction. Roslindale, MA: ASAP. http://www.appliance-standards.org/sites/default/files/Progress_toward_3_billion_CO2_reduction_1.pdf.
Barthel, Claus, and Thomas Götz. 2012a. The Overall Worldwide Saving Potential from Domestic Refrigerators and Freezers. Wuppertal, Germany: BigEE. http://www.bigee.net/media/filer_public/2012/12/04/bigee_doc_2_refrigerators_freezers_worldwide_potential_20121130.pdf.
---. 2012b. The Overall Worldwide Saving Potential from Domestic Washing Machines. Wuppertal, Germany: BigEE. http://www.bigee.net/media/filer_public/2013/03/28/bigee_domestic_washing_machines_worldwide_potential_20130328.pdf.
BEE (Indian Bureau of Energy Efficiency). 2013. “Schedule – 3: Room Air Conditioners.” Rev. May 20, 2013. http://beestarlabel.com/Content/Files/Schedule3A-RAC9jun.pdf.
Bernauer, T., S. Engel, D. Kammerer, and J. Sejas Nogareda. 2007. “Explaining Green Innovation: Ten Years after Porter’s Win-Win Proposition: How to Study the Effects of Regulation on Corporate Environmental Innovation?” Politische Vierteljahresschrift 39: 323–341.
Boteler, R. 2007, “NEMA Premium Update.” Presentation at EEMODS 2007, June 10–15 June, Beijing, cited in Waide and Brunner. 2011. “Energy-Efficiency Policy Opportunities for Electric Motor-Driven Systems.”
REFERENCES

127
A Greener Path to Competitiveness Policies for Climate Action in Industries and Products
Bradburd, R. M., and D. R. Ross. 1989. “Can Small Firms Find and Defend Strategic Niches? A Test of the Porter Hypothesis.” Review of Economics and Statistics 71(2): 258–262.
Brännlund, R. 2008. “Productivity and Environmental Regulations: A long run analysis of the Swedish industry.” Umeå Economic Studies. No. 728. Sweden: Umeå University. http://www.jus.umu.se/digitalAssets/8/8214_ues728.pdf.
Broberg, T., P. O. Marklund, E. Samakovlis, and H. Hammar. 2013. “Testing the Porter hypothesis: The Effects of Environmental Investments on Efficiency in Swedish Industry.” Journal of Productivity Analysis 40 (1): 43–56.
Calabrese, David B. 2006. “Appliance Manufacturer’s Tax Credit.” PowerPoint presentation. Association of Home Appliance Manufacturers, Washington, DC. https://www.energystar.gov/ia/partners/downloads/meetings/EnergyBillPresentation_Calabrese_APM2006.pdf?442a-1e83.
Calel, R., and A. Dechezleprêtre. 2016. “Environmental Policy and Directed Technological Change: Evidence from the European Carbon Market.” Review of Economics and Statistics 98 (1): 173–191.
Carayannis, E., and E. Grigoroudis. 2014. “Linking Innovation, Productivity, and Competitiveness: Implications for Policy and Practice.” Journal of Technology Transfer 39 (2): 199–218.
Carbon Trust. 2010. “Tackling Carbon Leakage: Sector-specific solutions for a world of unequal carbon prices.” https://www.carbontrust.com/media/84908/ctc767-tackling-carbon-leakage.pdf.
Cefic. 2014. “The European Chemical Industry: Facts and Figures 2014.” http://www.cefic.org/Documents/FactsAndFigures/2014/Facts%20and%20Figures%202014%20-%20The%20Brochure.pdf.
---. 2015a. “Competitiveness of the European Chemical Industry.” http://www.cefic.org/Documents/PolicyCentre/Reports-and-Brochure/Competitiveness-of-the-European-chemical-industry-2014.pdf.
---. 2015b. “Energy and Climate Change.” 2015. http://www.cefic.org/Policy-Centre/Energy--Climate-Change/http://www.cefic.org/Policy-Centre/Energy--Climate-Change/.
Cefic and European Environmental Agency. 2014. “The European Chemical Industry: Facts and Figures 2014.”http://www.cefic.org/Documents/FactsAndFigures/2014/Facts%20and%20Figures%202014%20-%20The%20Brochure.pdf.
Cembureau. 2014. “Activity Report, 2014”. Brussels: Cembureau. http://www.cembureau.eu/sites/default/files/Activity%20Report%202014_website_1.pdfhttp://www.cembureau.eu/sites/default/files/Activity%20Report%202014_website_1.pdf.
CFR (Code of Federal Regulations), Title 10, Part 202, Section 21. https://www.gpo.gov/fdsys/granule/CFR-2009-title10-vol3/CFR-2009-title10-vol3-sec202-21
Chalermthanakom, A., and K. Ueta. 2011. “Impact of Environmental Regulation on Productivity: Case Studies of Three Industries in Japan.” Kyoto Economic Review 80 (2): 167–187.
CLASP. 2013. Improving Global Comparability. Washington, DC: CLASP. http://clasp.ngo/~/media/Files/SLDocuments/2014/2014-09_Improving-Global-Comparability/Improving-Global-Comparability.pdf?la=en

A Greener Path to Competitiveness Policies for Climate Action in Industries and Products
128
CLASP S&L Database. http://www.clasp.ngo/Tools/Tools/SL_Search.
Climate Strategies. 2014. “Carbon Control and Competiveness Post 2020: The Cement Report. London: Climate Strategies.” http://climatestrategies.org/wp-content/uploads/2014/02/climate-strategies-cement-report-final.pdf.
ClimateTechWiki. 2015. “Energy Efficiency and Saving in the Cement Industry.” http://www.climatetechwiki.org/technology/energy-saving-cement.
Costantini, V., and M. Mazzanti. 2012. “On the Green and Innovative Side of Trade Competitiveness? The Impact of Environmental Policies and Innovation on EU Exports.” Research Policy 41 (1): 132–153.
De Backer, Koren, and Norihiko Yamano. 2012. International Comparative Evidence on Global Value Chains. OECD Science, Technology and Industry Working Papers, OECD, Paris. http://www.oecd-ilibrary.org/science-and-technology/international-comparative-evidence-on-global-value-chains_5k9bb2vcwv5j-en?crawler=true.
DECC and BIS (Department for Business, Innovation and Skills). 2015a. “Industrial Decarbonisation and Energy Efficiency Roadmaps to 2050: Iron and Steel.” London: DECC and BIS.
---.2015b. “Industrial Decarbonisation & Energy Efficiency Roadmaps to 2050: Chemicals”. London: DECC and BIS.
Dechezleprêtre, Antoine, and Misato Sato. 2014. The Impacts of Environmental Regulations on Competitiveness. Policy brief, Grantham Research Institute on Climate Change, London, and Global Green Growth Institute, Seoul. http://personal.lse.ac.uk/dechezle/Impacts_of_Environmental_Regulations.pdf.
Delchet-Cochet, K., L.C. Vo, and H. Akeb. 2015. “From Compliance with Environmental Regulations to Pursuit of Environmental-Based Competitive Advantages: Mediators of the Relationship in an SME Context.” Journal of Applied Business Research 31 (3): 987–1004.
Deloitte Global.2016. “Highlights from the 2016 Global Manufacturing Competitiveness Index.”
Denkenberger, Dave, Chris Calwell, Nathan Beck, et al. 2013. Analysis of Potential Energy Savings from Heat Pump Clothes Dryers in North America. Spokane, WA: Ecova, and Washington, DC: CLASP. http://clasp.ngo/~/media/Files/SLDocuments/2013/2013_Analysis-of-Potential-Energy-Savings-from-Heat-Pump-Clothes-Dryers-in-North-America.pdf.
Dols, Jeff, Brian Fortenbery, Micah Sweeney, and Frank Sharp. 2014. “Efficient Motor-Driven Appliances Using Embedded Adjustable-Speed Drives.” Paper prepared for the 2014 ACEEE Summer Study on Energy Efficiency in Buildings. Pacific Grove, CA. August 17- 22. http://aceee.org/files/proceedings/2014/data/papers/9-886.pdf.
Doran, J., and G. Ryan. 2012. “Regulation and Firm Perception, Eco-Innovation and Firm Performance.” European Journal of Innovation Management 15 (4): 421–441.
Dröge, Susanne, Harro van Asselt, Thomas Brewer, Michael Grubb, Roland Ismer, Yasuko Kameyama, Michael Mehling et al. “Tackling leakage in a world of unequal carbon prices.” Climate strategies 1 (2009): 2-16.

129
A Greener Path to Competitiveness Policies for Climate Action in Industries and Products
EC (European Commission). 2014. “EU ETS Handbook”. Brussels: European Commission. http://ec.europa.eu/clima/publications/docs/ets_handbook_en.pdf.
---. 2016. “Carbon Leakage.” http://ec.europa.eu/clima/policies/ets/cap/leakage/index_en.htm.
---. 2015. Savings and Benefits of Global Regulations for Energy Efficient Products: A ‘Cost of non-World’ Study. Brussels: European Commission. https://ec.europa.eu/energy/sites/ener/files/documents/Cost%20of%20Non-World%20-%20Exec%20Summary.pdf.
Bush, Eric, Anette Michel, Francisco R. Zuloaga, Chris Granda, and Christopher Wold. 2015. “Heat Pump Tumble Dryers: Market Development in Europe and MEPS in Switzerland.” Paper prepared for the 8th International Conference on Energy Efficiency in Domestic Appliances and Lighting. Lucerne-Horw, Switzerland, August 26-28. http://iet.jrc.ec.europa.eu/energyefficiency/sites/energyefficiency/files/events/EEDAL15/S10_Standards3/eedal15_submission_58.pdf
E3 (Equipment Energy Efficiency Committee). 2005. Compact Fluorescent Lamps Assessment of Minimum Energy Performance and Labelling Options. Canberra, Australia. Report No. 2005/12. http://www.energyrating.gov.au/file/1317/download?token=Wwy-mrgK.
---. 2010. Evaluation of Energy Efficiency Policy Measures for Household Refrigeration in Australia: An Assessment of Energy Savings since 1986. Canberra, Australia. E3 Report No. 2010/10.
---. 2014. Impacts of the E3 Program: Projected Energy, Cost and Emission Savings. Canberra, Australia. http://www.energyrating.gov.au/file/1373/download?token=LCq4YJZr.
Energy Star. Dishwasher product website. https://www.energystar.gov/products/appliances/dishwashers
Ernst & Young. 2013. Global Steel 2013: A New World, a New Strategy. London: Ernst & Young. http://www.ey.com/Publication/vwLUAssets/Global-Steel-Report-2013/$FILE/Global-Steel-Report-2013_ER0046.pdf.
Euromonitor Database. https://www.euromonitor.com
Euromonitor. 2015. “Consumer Appliances 2015: New Insights and System Refresh.” http://www.portal.euromonitor.com/portal/?NFjoyB299%2f%2ftRK3MlcDiBg%3d%3d
Fagerberg. 1996. “Technology and competitiveness”. Oxford Review of Economic Policy 12(3): 39-51.
Fridley, D., Nathaniel Aden, Nan Zhou, and Jiang Lin. 2007. Impacts of China’s Current Appliance Standards and Labeling Program to 2020. Berkeley, CA: Lawrence Berkeley National Laboratory. https://eaei.lbl.gov/sites/all/files/lbl-62802-appliance-esl-2020march2007.pdf.
Ghisetti, C., and K. Rennings. 2013. “Environmental Innovations and Profitability: How Does It Pay to Be Green? An Empirical Analysis on the German Innovation Survey.” ZEW-Centre for European Economic Research Discussion Paper, 13-073.
Gold, Rachel, and Steven Nadel. 2011. Energy Efficiency Tax Incentives, 2005–2011: How Have They Performed? ACEEE White Paper. Washington, DC: American Council for an Energy-Efficient Economy.
Hasanbeigi, Ali, Lynn Price, and Nathaniel Aden. 2011. “A Comparison of Iron and Steel Production Energy Use and Energy Intensity in China at the US.” Berkeley, CA: Lawrence Berkeley National Laboratory. https://china.lbl.gov/sites/all/files/lbl-4836e-us-china-steeljune-2011.pdf.

A Greener Path to Competitiveness Policies for Climate Action in Industries and Products
130
Hong, Liu, Adam Hinge, and Stuart Jeffcott. 2002. “China Green Lights: A National Programme with Global Repercussions.” Paper prepared for The Right Light 5 Conference. Nice, France, May 29-31. http://www.eceee.org/library/conference_proceedings/RL5/session_10/liuhong.
ICCA (International Council of Chemical Associations (ICCA). 2013. “Chemical Industry Contributions to Energy Efficiency and Mitigating Climate Change.” Brussels: ICCA. http://www.icca-chem.org/ICCADocs/ICCA%20Roadmap%20Summary.pdf
IEA (International Energy Agency). 2012a. “CO2 Emissions from Fuel Combustion Highlights: Beyond 2020 Documentation.” IEA, Paris.
---. 2012b. “Energy Statistics of Non-OECD Countries.” IEA, Paris.
---. 2014. “Capturing the Multiple Benefits of Energy Efficiency.” IEA, Paris. http://www.iea.org/publications/freepublications/publication/Captur_the_MultiplBenef_ofEnergyEficiency.pdf.
---.2014. “Energy Technology Perspectives 2014. ” http://www.iea.org/etp/etp2014/
---. 2015a. Energy Efficiency Market Report 2015. IEA, Paris.https://www.iea.org/publications/freepublications/publication/MediumTermEnergyefficiencyMarketReport2015.pdf.
---. 2015b. “Energy Technology Perspectives 2015.” OECD Publishing, Paris.
---. 2016. “Decoupling of Global Emissions and Economic Growth Confirmed,” IEA, Paris. https://www.iea.org/newsroomandevents/pressreleases/2016/march/decoupling-of-global-emissions-and-economic-growth-confirmed.html.
IEA-4E (IEA Technology Collaboration Programme on Energy Efficient End-Use Equipment). 2007. Tracking Industrial Energy Efficiency and CO2 Emissions. Paris: IEA. https://www.iea.org/publications/freepublications/publication/tracking_emissions.pdf.
---. 2015. Achievements of Appliance Energy Efficiency Standards and Labelling Programs: A Global Assessment. Paris: IEA-4E https://www.iea.org/publications/freepublications/publication/4E_S_L_Report_180915.pdf.
IETD (Industrial Efficiency Technology Database (IETD). 2015: “Iron and Steel.” http://ietd.iipnetwork.org/content/iron-and-steelhttp://ietd.iipnetwork.org/content/iron-and-steel.
IMF (International Monetary Fund). 2015. “Commodity Special Feature from World Economic Outlook, IMF.” Washington, DC. http://www.imf.org/external/np/res/commod/pdf/WEOSpecialOCT15.pdf.
IPCC (Intergovernmental Panel on Climate Change). 2005. IPCC Special Report on Carbon Dioxide Capture and Storage, Prepared by Working Group III of the Intergovernmental Panel on Climate Change [Metz, B., O. Davidson, H. C. de Coninck, M. Loos, and L. A. Meyer (eds.)]. Cambridge University Press. https://www.ipcc.ch/pdf/special-reports/srccs/srccs_wholereport.pdf.
---.2006. 2006 IPCC Guidelines for National Greenhouse Gas Inventories, Prepared by the National Greenhouse Gas Inventories Programme, Eggleston H.S., Buendia L., Miwa K., Ngara T. and Tanabe K. (eds). Published: IGES, Japan.

131
A Greener Path to Competitiveness Policies for Climate Action in Industries and Products
---. 2014. Climate Change 2014: Mitigation of Climate Change. Contribution of Working Group III to the Fifth Assessment Report of the Intergovernmental Panel on Climate Change [Edenhofer, O., R. Pichs-Madruga, Y. Sokona, E. Farahani, S. Kadner, K. Seyboth, A. Adler, I. Baum, S. Brunner, P. Eickemeier, B. Kriemann, J. Savolainen, S. Schlömer, C. von Stechow, T. Zwickel and J.C. Minx (eds.)]. Cambridge University Press, Cambridge, United Kingdom and New York, NY, USA.IRS.
IRS (Internal Revenue Service) 2016. “Manufacturers’ Energy Efficient Appliance Credit.” https://www.irs.gov/Businesses/Corporations/Manufacturers’-Energy-Efficient-Appliance-Credit.
Kelly, T. D., and G. R. Matos. 2013. Historical Statistics for Mineral and Material Commodities in the United States. US Geological Survey (USGS) Data Series 140, USGS, Washington, DC. http://minerals.usgs.gov/ds/2005/140/.
Kemna, R. 2014. Ecodesign Impact Accounting: Part 1-Status Nov. 2013. Delft, The Netherlands: Van Holsteijn and Kemna.
Kossoy, Alexandre; Peszko, Grzegorz; Oppermann, Klaus; Prytz, Nicolai; Klein, Noemie; Blok, Kornelis; Lam, Long; Wong, Lindee; Borkent, Bram. 2015. State and trends of carbon pricing 2015. Washington, D.C: World Bank Group. http://documents.worldbank.org/curated/en/2015/09/25053834/state-trends-carbon-pricing-2015
Lafarge. 2008. “Information on Lafarge,” chap. 3, 2007 annual report, Paris. http://www.lafarge.com/04022008-Activities-Details_cement_business-en.pdf.
Lall, Sanjaya. 2001. “Competitiveness Indices and Developing Countries: An Economic Evaluation of the Global Competitiveness Report.” World Development 29 (9): 1501–1525. http://biblioteca.fundacionicbc.edu.ar/images/3/34/Politicas_2.pdf.
Law, S. 2001. “Competitiveness Indices and Developing Countries: An Economic Evaluation of the Global Competitiveness Report.” World Development 29 (3): 1501-1525. http://biblioteca.fundacionicbc.edu.ar/images/3/34/Politicas_2.pdf.
Li, Jayond, Yang Yu, and Steven Zeng. 2014. 2014 Market Analysis of China Energy Efficient Products. Washington, DC: CLASP. http://clasp.ngo/~/media/Files/SLDocuments/2014/2014_11_Market_Analysis_of_China_Energy_Efficient_Appliances_2014_Final.pdf.
Marcu, Andrei, Christian Egenhofer, Susanna Roth, and Wijnand Stoefs. 2016. Carbon Leakage: An Overview. CEPS Special Report no. 79. Brussels: Centre for European Policy Studies. http://aei.pitt.edu/46163/1/Special_Report_No_79_Carbon_Leakage.pdf.
Martin R, Muûls M, Wagner UJ. 2010. “Europe’s Emissions Trading Scheme: Tax Payers versus the Industry Lobby”. No. 311. Centre for Economic Performance, LSE. http://cep.lse.ac.uk/pubs/download/cp311.pdf
Mauer, Joanna, Andrew deLaski, Steven Nadel, Anthony Fryer, and Rachel Young. 2013. Better Appliances: An Analysis of Performance, Features, and Price as Efficiency Has Improved. Report number A132. Washington, DC: American Council for an Energy-Efficient Economy. http://aceee.org/sites/default/files/publications/researchreports/a132.pdf.
A Greener Path to Competitiveness Policies for Climate Action in Industries and Products
132
McKinsey & Company. 2011. Lighting the Way: Perspectives on the Global Lighting Market. McKinsey & Company, London.
---. 2012. Lighting the Way: Perspectives on the Global Lighting Market. Second Edition. McKinsey & Company, London. https://www.mckinsey.de/files/Lighting_the_way_Perspectives_on_global_lighting_market_2012.pdf.
McNeil, Michael, and Ana Maria Carreño. 2015. Impacts Evaluation of Appliance Energy Efficiency Standards in Mexico since 2000. Washington DC: Super-efficient Equipment and Appliance Deployment (SEAD). http://www.superefficient.org/Research/PublicationLibrary/2015/Impacts%20Evaluation%20of%20Appliance%20Energy%20Efficiency%20Standards%20in%20Mexico%20since%202000.
Meza, Mark. 2014. “Industrial LV Motors & Drives: A Global Market Update.” Presentation at the Motor and Drive Systems Conference. Orlando, Fla, January 29-30. http://www.e-driveonline.com/conferences/wp-content/uploads/2014/01/IHSMMeza.pdf.
Min, G. F., E. Mills, and Q. Zhang. 1997. “Energy Efficient Lighting in China: Problems and Prospects.” Energy Policy 25 (1): 77–83.
Ministry of Construction of the People’s Republic of China. 2006. The Implementation Guideline on City Green Lighting Project during the 11th Five Year Plan. Beijing, China.
MPA Cement. 2013. “Novel Cements: Low Energy, Low-Carbon Cements,” MPA Cement Factsheet 12, London. http://cement.mineralproducts.org/documents/FS_12_Novel_cements_low_energy_low_carbon_cements.pdf.
---.2015. “Modern Cements (Bulk),” MPA Cement Fact Sheet 14b, MPA Cement, London. http://cement.mineralproducts.org/documents/FS_14b_Modern_cements_BULK.pdf.
Mr. Reid. 2011. “Electricity Consumption in the Production of Aluminium.” Blog entry, Mr. Reid.org, July 14, 2011. http://wordpress.mrreid.org/2011/07/15/electricity-consumption-in-the-production-of-aluminium/.
Nadel, Steven. 2012. Energy Efficiency Tax Incentives in the Context of Tax Reform. ACEEE Working Paper, Washington, DC: American Council for an Energy-Efficient Economy. http://aceee.org/files/pdf/white-paper/energy-efficiency-tax-incentives.pdf.
Nadel, S., et al. 2015. Energy Efficiency in the United States: 35 Years and Counting. Report No. E1502. Washington, DC: American Council for an Energy-Efficient Economy. http://aceee.org/sites/default/files/publications/researchreports/e1502.pdf.
National Lighting Test Centre. 2012. Analysis Report on the Quality of Energy Saving Lamps in China. Beijing.
Neelis et al., 2007, sourced in Patt, J., and Banholzer, W. 2009. Improving Energy Efficiency in the Chemical Industry. Washington, DC: National Academy of Engineering. https://www.nae.edu/Publications/Bridge/EnergyEfficiency14874/ImprovingEnergyEfficiencyintheChemicalIndustry.aspxhttps://www.nae.edu/Publications/Bridge/EnergyEfficiency14874/ImprovingEnergyEfficiencyintheChemicalIndustry.aspx.
New Climate Economy. 2014. Better Growth, Better Climate. Washington, DC: New Climate Economy. http://newclimateeconomy.report/wp-content/uploads/2014/08/NCE_GlobalReport.pdfhttp://newclimateeconomy.report/wp-content/uploads/2014/08/NCE_GlobalReport.pdf.
Nipkow, Jürg, and Eric Bush Jurg. 2009. “Promotion of energy-efficient heat pump dryers.” Paper prepared for the 5th International Conference on Energy Efficiency in Domestic Appliances and Lighting. Berlin, Germany, June 16-18.

133
A Greener Path to Competitiveness Policies for Climate Action in Industries and Products
OECD (Organization for Economic Development and Co-operation). 2014. Excess Capacity in the Global Steel Industry and Implications of New Investment Projects. Paris: OECD.
OECD and IEA. 2009. “Chemical and Petrochemical Sector: Potential of Best Practise Technology and Other Measures for Improving Energy Efficiency,” IEA Information Paper, Brussels. https://www.iea.org/publications/freepublications/publication/chemical_petrochemical_sector.pdfhttps://www.iea.org/publications/freepublications/publication/chemical_petrochemical_sector.pdf.
Olivetti, Elsa A., Huabo Duan, and Randolph E. Kirchain. 2013. Exploration of Carbon Footprint of Electrical Products: Guidance Document for Product Attribute to Impact Algorithm Methodology. Arlington, VA: National Electrical Manufacturers Association and Materials Systems Laboratory, MIT. https://www.nema.org/Policy/Environmental-Stewardship/Documents/Exploration%20of%20Carbon%20Footprint%20of%20Electrical%20Products-June%202013.pdf.
Partnership for Market Readiness; International Carbon Action Partnership. 2016. “Emissions Trading in Practice: A Handbook on Design and Implementation”. World Bank, Washington, DC. © World Bank. https://openknowledge.worldbank.org/handle/10986/23874 License: CC BY 3.0 IGO. http://hdl.handle.net/10986/23874
Perry, Mark J. 2009. “The Good Old Days Are Right Now.” Carpe Diem blog entry, October 2. http://mjperry.blogspot.ca/2009/10/chart-above-shows-significant-increases.html.
Renaud, J. 2008. “Issues behind Competiveness and Carbon Leakage: Focus on Heavy Industries,” IEA Information Paper, Paris.
Ricardo-AEA. 2013. Analysing the Opportunities for Abatement in Major Emitting Industrial Sectors.http://ee.ricardo.com/cms/assets/Documents/Final-Report-CCC.pdf
Rusal. 2015. “Aluminium Production Costs.” http://rusal.ru/en/aluminium/energetics.aspx.
Rydge, J. 2015. “Implementing Effective Carbon Pricing,” New Climate Economy Working Paper, Washington, DC. http://2015.newclimateeconomy.report/wp-content/uploads/2015/10/Implementing-Effective-Carbon-Pricing.pdf.
Sanchez, I., H. Pulido, M. A. McNeil, I. Turiel, and M. della Cava. 2007. “Assessment of the Impacts of Standards and Labeling Programs in Mexico (four products),” LBNL-62813. Berkeley, CA: Lawrence Berkeley National Laboratory.
Scholand, Michael. 2013. “US Department of Energy Adopts Higher Efficiency Standards for Distribution Transformers.” Presentation at International Energy Efficient Transformers Workshop. Bangkok, Thailand, November 13.
Shah, Nihar, and Amol Phadke. Forthcoming. Energy Efficiency and Air Conditioner Pricing Strategy. Berkeley, CA: Lawrence Berkeley National Laboratory.
Shah, Nihar, Amol Phadke, and Paul Waide. 2013. Cooling the Planet: Opportunities for Deployment of Superefficient Room Air Conditioners. Washington DC: Super-efficient Equipment and Appliance Deployment (SEAD). http://superefficient.org/~/media/Files/PublicationLibrary/2013/Cooling%20the%20Planet%20Opportunities%20for%20Deployment%20of%20Superefficient%20Room%20Air%20Conditioners.ashx.
Shenkar, Obed, Yadong Luo, and Tailan Chi. 2014. “Country Competitiveness.” In International Business, 3rd ed., chap. 5. Abingdon-on-Thames, UK: Taylor and Francis. http://www.sagepub.com/sites/default/files/upm-binaries/18595_Chapter_5.pdf.

A Greener Path to Competitiveness Policies for Climate Action in Industries and Products
134
Smith, Jenny Corry, Debbie Karpay Weyl, and Ari Reeves. 2015. “How and When to Increase Alignment of Appliance Policies.” Paper prepared for the 8th International Conference on Energy Efficiency in Domestic Appliances and Lighting. Lucerne-Horw, Switzerland, August 26-28. http://iet.jrc.ec.europa.eu/energyefficiency/sites/energyefficiency/files/events/EEDAL15/S7_Policies7/eedal15_submission_135.pdf.
Steel Consult. 2006. “New Competitive Realities in Steel.” http://www.steelconsult.com/ArticleSteelConsultinMillenniumSteel_English.pdf.
Tan, Q., Q. Song, and J. Li. 2015. “The environmental performance of fluorescent lamps in China, assessed with the LCA method”. The International Journal of Life Cycle Assessment 20(6): 807-818.
TATA. 2013. “Cooling Minds, Winning Hearts.” http://www.tata.com/company/articlesinside/DOQREdk8wHI=/TLYVr3YPkMU=.
UNEP. 2013. “Global Chemicals Outlook: Towards Sound Management of Chemicals”. http://www.unep.org/hazardoussubstances/Portals/9/Mainstreaming/GCO/The%20Global%20Chemical%20Outlook_Full%20report_15Feb2013.pdf
UNEP. “Sustainable Public Procurement Programme.” http://www.unep.org/10yfp/Programmes/ProgrammeConsultationandCurrentStatus/Sustainablepublicprocurement/tabid/106267/Default.aspx.
UNEP-GEF (United Nations Development Program–Global Environment Facility) and Government of China. 2008. Phasing-Out of Incandescent Lamps & Energy Saving. Lamps Promotion (PILESLAMP) Project (PIMS# 4166).
UNEP-GEF en.lighten initiative. 2014. Green Paper: Policy Options to Accelerate the Global Transition to Advanced Lighting. Prepared for Global Efficient Lighting Forum. Beijing, China, November 10-11. http://www.enlighten-initiative.org/Portals/0/documents/global-forum/Green_Paper_FINAL%20reduced.pdf.
UNIDO (United Nations Industrial Development Organization). 2012. Tanzania Industrial Competitiveness Report 2012. New York: UNIDO. https://www.unido.org/fileadmin/user_media/Services/PSD/TanzaniaIndustrialCompetitivenessReport2012-ebook.pdf.
---. 2013. The Industrial Competitiveness of Nations: Looking back, Forging ahead-Competitive Industrial Performance Report 2012/2013. New York: UNIDO. https://www.unido.org/fileadmin/user_media/Services/PSD/Competitive_Industrial_Performance_Report_UNIDO_2012_2013.PDF.
---. 2014. “Competitive Industrial Performance Report 2014,” Working Paper 12/2014, UNIDO, New York. http://www.unido.org/fileadmin/user_media/Services/PSD/WP2014_12_CIPReport2014.pdf.
---. 2015. “SDG Goal 9: Industry, Innovation and Infrastructure.” New York: UNIDO. https://isid.unido.org/goal9.html.
US DOE (U.S. Department of Energy). 1996. Energy Conservation Program for Consumer Products: Procedures for Consideration of New or Revised Energy Conservation Standards for Consumer Products. Federal Register 61 (136): 36974.
---. 2012. Solid-State Lighting Research and Development: Multi-Year Program Plan April 2012. Washington, DC: DOE. http://apps1.eere.energy.gov/buildings/publications/pdfs/ssl/ssl_mypp2014_web.pdf.

135
A Greener Path to Competitiveness Policies for Climate Action in Industries and Products
US EIA (U.S. Energy Information Administration). 2013. International Energy Outlook 2013. Washington, DC: EIA.
---. 2013. Residential Energy Consumption Survey (RECS). Washington, DC: EIA. https://www.eia.gov/consumption/residential/data/2009/index.cfm?view=microdata.
---. 2015. Chemical Industry Analysis Brief. Washington, DC: EIA. https://www.eia.gov/consumption/manufacturing/briefs/chemical/.
Wagner, M. 2006. “A Comparative Analysis of Theoretical Reasoning and Empirical Studies on the Porter Hypothesis and the Role of Innovation.” Journal of Environmental Law and Policy 3: 349–368.
Waide, Paul, and Conrad U. Brunner. 2011. Energy-Efficiency Policy Opportunities for Electric Motor-Driven Systems. Paris: International Energy Agency. https://www.iea.org/publications/freepublications/publication/EE_for_ElectricSystems.pdf.
Waide, Paul, and Michael Scholand. 2014. PROPHET II: The Potential for Global Energy Savings from High-Efficiency Distribution Transformers. Brussels: European Copper Institute. http://www.leonardo-energy.org/sites/leonardo-energy/files/documents-and-links/prophet_ii_final_report_beta_version.pdf.
WBCSD (World Business Council for Sustainable Development (WBCSD). 2009. The Cement Sustainability Initiative: Cement Industry Energy and C02 Performance. Geneva: WBCSD. http://www.wbcsdcement.org/pdf/CSI%20GNR%20Report%20final%2018%206%2009.pdfhttp://www.wbcsdcement.org/pdf/CSI%20GNR%20Report%20final%2018%206%2009.pdf.
WEC (World Energy Council). 2015. “Energy Price Volatility: The New Normal,” in 2015 World Energy Issues Monitor. https://www.worldenergy.org/publications/2015/world-energy-issues-monitor-2015/.
---. 2015. 2015 World Energy Issues Monitor. London: WEC. http://www.worldenergy.org/wp-content/uploads/2015/01/2015-World-Energy-Issues-Monitor.pdf.
WEF (World Economic Forum). 2014. The Global Competitiveness Index 2014–2015. Geneva: WEF. http://www3.weforum.org/docs/WEF_GlobalCompetitivenessReport_2014-15.pdf.
Wiel. S., J. E. McMahon, et al. 2005. S&L Guidebook (Second Edition). Washington, DC: CLASP. http://clasp.ngo/en/Resources/Resources/StandardsLabelsGuidebook.
Wilson, C. 2012. “Up-scaling, formative phases, and learning in the historical diffusion of energy technologies.” Energy Policy, 50, pp.81-94.
World bank. 2016. “Pricing Carbon.” Washington, DC: World Bank. http://www.worldbank.org/en/programs/pricing-carbon.
World Bank Group; ECOFYS. 2016. Carbon Pricing Watch 2016. Washington, DC: World Bank. https://openknowledge.worldbank.org/handle/10986/24288; and European Commission.
World Aluminium. 2013a. “The Global Aluminium Industry: 40 years from 1972.” http://www.world-aluminium.org/media/filer_public/2013/02/25/an_outlook_of_the_global_aluminium_industry_1972_-_present_day.pdf.

A Greener Path to Competitiveness Policies for Climate Action in Industries and Products
136
---. 2013b. “Global Aluminum Recycling: A Cornerstone of Sustainable Development.” http://www.world-aluminium.org/media/filer_public/2013/01/15/fl0000181.pdf.
---. 2015. “Aluminium and Life Cycle Thinking: Towards Sustainable Cities.” http://www.world-aluminium.org/media/filer_public/2015/10/05/tsc_report3_lca_100dpi_release_locked.pdf.
---. 2016. “Statistics. Primary Aluminium Smelting Power Consumption.”. http://www.world-aluminium.org/statistics/primary-aluminium-smelting-power-consumption/.
WSA (World Steel Association). 2014. “Energy Use in the Steel Industry.” Fact sheet. WSA. Brussels. https://www.worldsteel.org/publications/fact-sheets/content/02/text_files/file0/document/fact_energy_2014.pdf.
---. 2015a. “Crude Steel Production.” Brussels. https://www.worldsteel.org/statistics/crude-steel-production0.html.
---. 2015b. “Energy Use in the Steel Industry.”. https://www.worldsteel.org/media-centre/press-releases/2015/Energy-use-in-the-steel-industry-report-available-now.html.
---. 2015c. “World Steel in Figures.” WSA. Brussels. https://www.worldsteel.org/dms/internetDocumentList/bookshop/2015/World-Steel-in-Figures-2015/document/World%20Steel%20in%20Figures%202015.pdf.
---. 2015d. “Steel’s Contribution to a Low-Carbon Future and Climate-Resilient Societies.” World Steel Position Paper. WSA. Brussels.
Xu, T., T. Ma, C. Zhou, and Y. Zhou. 2014. “Characterizing Spatio-Temporal Dynamics of Urbanization in China Using Time Series of DMSP/OLS Night Light Data.” Remote Sensing 6 (8): 7708-7731.
Yuan, Jiahai, Junjie Kang, Cong Yu, and Zhaoguang Hu. 2011. “Energy Conservation and Emissions Reduction in China: Progress and Prospective.” Renewable and Sustainable Energy Reviews 15 (9): 4334-4347.
Zhuo, Wang. 2011. The Lighting Industry Development in China. Beijing: China Association of Lighting Industry.

A Greener Path to Competitiveness Policies for Climate Action in Industries and Products
©2016 The World Bank Group1818 H Street NWWashington, DC 20433Telephone : 202-473-1000Internet : www.worldbank.org
All rights reserved.
This volume is a product of the staff of the World Bank Group. The World Bank Group refers to the member institutions of the World Bank Group: The World Bank (International Bank for Reconstruction and Development); International Finance Corporation (IFC); and Multilateral Investment Guarantee Agency (MIGA), which are separate and distinct legal entities each organized under its respective Articles of Agreement. We encourage use for educational and non-commercial purposes.
The findings, interpretations, and conclusions expressed in this volume do not necessarily reflect the views of the Directors or Executive Directors of the respective institutions of the World Bank Group or the governments they represent. The World Bank Group does not guarantee the accuracy of the data included in this work.
Rights and PermissionsThe material in this publication is copyrighted. Copying and/or transmitting portions or all of this work without permission may be a violation of applicable law. The World Bank encourages dissemination of its work and will normally grant permission to reproduce portions of the work promptly.
For permission to photocopy or reprint any part of this work, please send a request with complete information to the Copyright Clearance Center Inc., 222 Rosewood Drive, Danvers, MA 01923, USA; telephone: 978-750-8400; fax: 978-750-4470; Internet: www.copyright.com.
All other queries on rights and licenses, including subsidiary rights, should be addressed to the Office of the Publisher, The World Bank Group, 1818 H Street NW, Washington, DC 20433, USA; fax: 202-522-2422;E-mail: [email protected].
Photo Credits
07 Maciej Noskowski
20 Hramovnick
25 Acnakelsy
29 JazzIRT
33 Jordachelr
36 Etienne Kechichian
37 Muzaffer Akarca
89 Aniaostudio
101 Moreno Soppelsa
115 Baloncici
118 SlobodanMilijevic
123 tvierimaa

JULY 2016
ETIENNE KECHICHIANALEXIOS PANTELIASARI REEVESGUY HENLEYJIEMEI LIU
PARTNERS IN COLLABORATION WITH
A GREENER PATH TO COMPETITIVENESSPOLICIES FORCLIMATE ACTION ININDUSTRIES AND PRODUCTS
www.worldbank.org
A G
REEN
ER PATH
TO C
OM
PETITIVEN
ESS PO
LICIES
FOR
CLIM
ATE A
CT
ION
IN IN
DU
ST
RIES
AN
D PR
OD
UC
TSJU
LY 20
16