police use of force and misconduct in california
TRANSCRIPT
Police Use of Force and Misconduct in California
Technical Appendices
CONTENTS Appendix A. Data Sources and Descriptive Statistics
Appendix B. Association Analysis: Regression Model and Supplemental Findings
Appendix C. Racial Disparity Analysis: Regression Model and Supplemental Findings Appendix D. Supplementary Information on Police Misconduct
Deepak Premkumar, Alexandria Gumbs, Shannon McConville, and Renee Hsia

PPIC.ORG Technical Appendices Police Use of Force and Misconduct in California 2
Appendix A. Data Sources and Descriptive Statistics
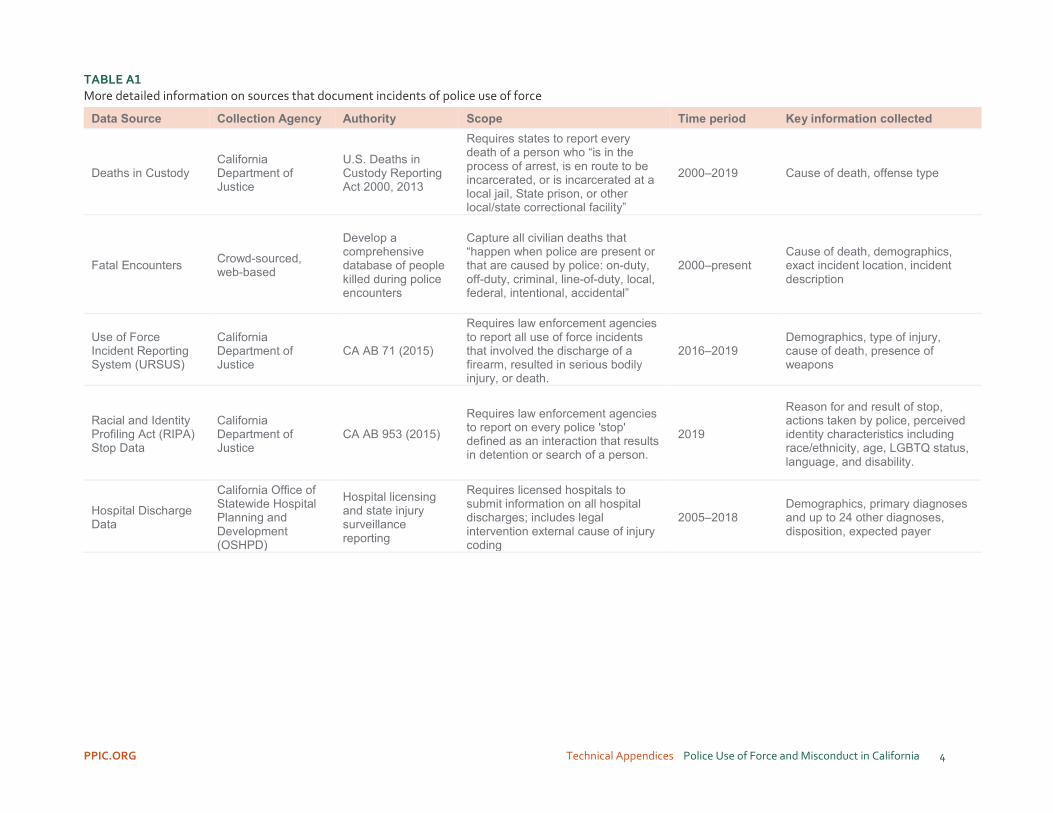
The California Department of Justice maintains several data repositories containing detailed information on crime rates, arrests, criminal histories, law enforcement injuries and deaths, along with other aspects of the criminal justice system. Three of these data sources provide information on police use of force and are used in this analysis. In addition to these data sources, we also examine data collected outside of the DOJ or the criminal justice system in order to compare how these ‘official’ datasets compare with other information collected by different agencies for different purposes. Table 1 and Appendix Table A1 detail each of these data sets and includes additional information on their purpose, scope, and variables.
Deaths in Custody is a longstanding data collection effort created by federal law. It is intended to capture all deaths that occur while individuals are incarcerated in state prisons or local jails, as well as those that occur during the process of arrest. Though the original federal legislation passed more than two decades ago, funding has never been allocated to states to support data collection and in recent years there are clear gaps in reporting. California, however, has continued to routinely collect this information and has worked with university researchers to analyze arrest-related deaths (McCrary and Raphael 2015). Nonetheless, there remain questions as to how well it captures deaths related to police use of force, which was one of the motivating factors behind California passing legislation to collect additional information (California Senate Committee on Public Safety 2015).
Fatal Encounters is a crowdsourced, online database assembled by individuals reporting incidents, journalists, and university researchers, and maintained and vetted by a team of researchers.1 The stated goal of the effort is to provide a comprehensive, searchable database of all fatalities that involve law enforcement in some capacity. Researchers consider this national dataset the most comprehensive source on officer-involved fatalities (Edwards, Lee, and Esposito 2019; Premkumar 2019). The data are publicly available online, free to download, and contain detailed information on every encounter including information about the person killed and the incident including the date and location, the law enforcement agency involved, the type of force used, whether the decedent was armed, and the source that provided or verified the information. We use Fatal Encounters in this study to provide an external source to compare with the DOJ data. Since Fatal Encounters collects all deaths where law enforcement is present, we focus on a subset of officer-involved fatalities that are more comparable to DOJ datasets. We include cases that involve use of force—accidental or purposeful—and pursuit-related deaths, while excluding cases of suicide or deaths of other causes (e.g., drug overdose during police stop).
Starting in 2016, AB 71 mandated the collection of detailed information on any police encounter that resulted in serious bodily injury or death to a civilian (or an officer) from all law enforcement agencies in the state. It also requires reporting on all incidents where a firearm was discharged by officers regardless of whether someone was injured. California DOJ has a repository called the Use of Force Incident Reporting System (which we refer to throughout the report as ‘Use of Force’ data) that collects and publicly provides this data on their OpenJustice portal.
While deaths resulting from police encounters are by far the most visible and concerning, it is also important to examine instances of police use of force that result in non-fatal injuries. These incidents obviously can have serious consequences for the person involved, but also have implications for how communities engage with law enforcement and view their ability to maintain public safety. The DOJ Use of Force data offers a new resource—and one of the first of its kind at the state level—to collect data on serious injuries sustained from police contact
1 The Fatal Encounters team collects the data through numerous methods, including Google Alerts, news search engines, civilian reports, Freedom of Information Act requests, and comparing with other online databases. These reports, particularly the civilian submissions (which require a link to a news source to submit), are then individually verified by checking other sources.

PPIC.ORG Technical Appendices Police Use of Force and Misconduct in California 3
that do not result in death. In addition to other detailed information on the incident, the data contains information on the race/ethnicity of both the officers and civilians involved in serious use-of-force incidents, allowing closer examination of the disproportionate incidence of police encounters and use of force experienced by Black residents, in particular.
We rely on another new DOJ dataset created by in recent years by state legislation. The Racial and Identity Profiling Act (Assembly Bill 953, 2015) mandated that California law enforcement agencies document every law enforcement ‘stop’—defined as the detention or search of a person by a peace officer. In its data collection requirements, RIPA includes information about the actions taken by officers including certain measures of use of force (e.g., firearm discharge), along with detailed characteristics of the individuals stopped, including race/ethnicity, LGBTQ status, language and disability, as recorded by the reporting officer. The agencies have begun collecting and reporting the data in waves, and the most recent data from 2019 contain information from the 15 largest law enforcement agencies in the state.2 We use the RIPA stop data to probe more on observed racial/ethnic disparities in use-of-force incidents.
2 Law enforcement agencies in 2019 RIPA include the California Highway Patrol, the police departments of the cities of Fresno, Long Beach, Los Angeles, Oakland, Sacramento, San Diego, San Francisco, and San Jose, and the sheriff departments of Los Angeles, Orange, San Bernardino, Riverside, Sacramento, and San Diego Counties. For more background information on RIPA, see Lofstrom et al. (2021) for a more thorough summary and analysis of non-force-related outcomes.
PPIC.ORG Technical Appendices Police Use of Force and Misconduct in California 4
TABLE A1 More detailed information on sources that document incidents of police use of force
Data Source Collection Agency Authority Scope Time period Key information collected
Deaths in Custody California Department of Justice
U.S. Deaths in Custody Reporting Act 2000, 2013
Requires states to report every death of a person who “is in the process of arrest, is en route to be incarcerated, or is incarcerated at a local jail, State prison, or other local/state correctional facility”
2000–2019 Cause of death, offense type
Fatal Encounters Crowd-sourced, web-based
Develop a comprehensive database of people killed during police encounters
Capture all civilian deaths that “happen when police are present or that are caused by police: on-duty, off-duty, criminal, line-of-duty, local, federal, intentional, accidental”
2000–present Cause of death, demographics, exact incident location, incident description
Use of Force Incident Reporting System (URSUS)
California Department of Justice
CA AB 71 (2015)
Requires law enforcement agencies to report all use of force incidents that involved the discharge of a firearm, resulted in serious bodily injury, or death.
2016–2019 Demographics, type of injury, cause of death, presence of weapons
Racial and Identity Profiling Act (RIPA) Stop Data
California Department of Justice
CA AB 953 (2015)
Requires law enforcement agencies to report on every police 'stop' defined as an interaction that results in detention or search of a person.
2019
Reason for and result of stop, actions taken by police, perceived identity characteristics including race/ethnicity, age, LGBTQ status, language, and disability.
Hospital Discharge Data
California Office of Statewide Hospital Planning and Development (OSHPD)
Hospital licensing and state injury surveillance reporting
Requires licensed hospitals to submit information on all hospital discharges; includes legal intervention external cause of injury coding
2005–2018 Demographics, primary diagnoses and up to 24 other diagnoses, disposition, expected payer
PPIC.ORG Technical Appendices Police Use of Force and Misconduct in California 5
Hospital Discharge Data Analysis All hospitals licensed by the state of California must submit detailed discharge abstracts on every hospital visit—including emergency department visits that do not result in an inpatient admission. The California Office of Statewide Health and Planning Development (OSHPD) collects and maintains this data.
To identify hospital visits that resulted from a police encounter, we use external cause of injury codes (E-codes) described in the ICD-10 clinical management system. E-codes are reported for all injury-related hospital visits as part of the state’s injury surveillance program and are intended to capture how an injury occurred and intent (U.S. Center for Disease Control and Prevention 2008). The discharge data contain a primary E-code and up to four additional E-codes. We identify visits related to police use of force based on primary or additional E-codes reflect legal intervention injuries coded “Y35.” The description of these codes is “any injury sustained as a result of an encounter with any law enforcement official, serving in any capacity at the encounter, whether on-duty or off-duty and includes injuries to law enforcement officials, suspects, bystanders, or other.” We define civilians injured during a police encounter as those coded as suspects, bystanders, or other.
In our discharge analysis, we also use e-codes to identify legal intervention incidents that involved a firearm discharge (Y35.00, Y35.01, Y35.02, Y35.03, Y35.09); we exclude firearm discharges of rubber bullets (Y35.04) as those are explicitly excluded from the Use of Force reporting data. It is important to note that e-codes are recorded by health information specialists at hospitals according to state reporting guidelines, rather than directly by emergency department physicians or other clinicians. California has had a state mandate in place for more than two decades requiring hospitals to report e-codes for all injury-related hospital visits along with quality-assurance procedures to monitor and maintain the validity and completeness of this reporting in the state’s hospital discharge data (U.S. CDC 2008). Though hospital administrative staff code this information, it is based on physician or other health-care providers documentation in the medical record of details regarding the incident including the mechanism, intent, location, and activity at time of injury.
While hospital discharge data is used primarily for administrative and billing purposes, these data systems are considered to be the best source of information to measure the impact of non-fatal injuries in the U.S. and inform policy efforts aimed at preventing injuries (U.S. Center for Disease Control and Prevention 2008). Nonetheless, this reporting process is different than the Use of Force data which indicates whether a civilian had a ‘gunshot wound’. There is no single equivalent diagnostic code that indicates a patient suffered from a gunshot wound so we rely on e-codes to identify these incidents.
We also examined primary diagnoses to incorporate additional information about the nature and the potential severity of the injury being treated. In the hospital discharge data, a principal diagnosis is recorded for every visit and is defined as the condition, problem or other reason established to be the chief cause of the encounter for care (OSHPD 2019). In the case of inpatient admissions, the principal diagnosis is established after study to be the chief cause of the admission of the patient to the hospital for care.
Using the principal diagnosis data, we identified “serious” injuries resulting from police encounters to better align with the requirements of the Use of Force data. We used the primary diagnosis, which are grouped into clinically meaningful categories by the Clinical Classifications Software (CCS) developed by the Agency for Healthcare Research and Quality (AHRQ). All hospital visits that had the following CCS codes as the primary diagnosis were NOT included in our definition of serious injuries: 239–superficial injury/contusion; 255–administrative/social admission (includes examination for prison/jail admission) ; 660–alcohol-related disorders; 661–substance-related disorders; 650–659, 662–670 mental health conditions including schizophrenia, other psychoses, mood disorders (like bipolar I and II), affective disorders (like major depression and anxiety). We

PPIC.ORG Technical Appendices Police Use of Force and Misconduct in California 6
exclude those with a primary diagnosis of behavioral health conditions because if that is the chief cause of their hospital visit, an injury from their law enforcement encounter was not likely to be serious.
Behavioral health analysis We also use the hospital discharge data to examine whether people treated for a legal intervention injury had any behavioral health conditions identified during the hospital visit. We compare the hospital data with information reported in the Use of Force data on the mental status and impairments recorded by law enforcement officers based on their observation of the injured civilian’s behavior. The Use of Force data contain codes for mental status/impairment related to alcohol, drugs, mental health, and erratic behavior; it also includes physical and development impairments though these are quite rare (only 3 instances in the four years of data we use) and so we do not include those in our analysis.
For the hospital analysis, we use the primary diagnosis and up to 24 additional diagnoses that can be reported for hospital visits to identify if a person was diagnosed with an alcohol- or substance-related disorder or a mental health disorder, which includes conditions like schizophrenia, affective disorders (anxiety/depression), and mood disorders (bipolar). Most often behavioral health conditions are identified not as the primary diagnosis, but in other diagnostic fields where clinicians include information on co-morbidities and other conditions that may contribute to decisions around a patient’s treatment and/or impact their health outcomes. We exclude nicotine dependence from our definition of drug-related conditions in order to have it more closely align with reports of observed impairments reported in the Use of Force Data.
In the figure and discussion presented in the main report we focus on comparing the presence of behavioral health conditions reported in cases of serious, non-fatal gunshot wounds to provide the closest potential comparison group with what is available in the Use of Force data. We focus on non-fatal gunshot wounds both because so few fatalities from law enforcement encounters seem to die at a hospital and those who do may not have been screened for other conditions like mental health or drugs because of the emergent nature of their injuries. We also only include gunshot wounds that were considered “serious” based on their primary diagnosis.
Appendix Tables A2–A4 provide descriptive statistics on the prevalence of behavioral health conditions, among several other descriptive statistics, from the Use of Force and hospital discharge data, respectively. We report these across a number of different cuts of both data sets including all fatal and non-fatal serious injuries, gunshot injuries, and deaths. In the Use of Force table, we also include how the estimates of behavioral health and mental health change when we include a report of ‘erratic behavior’ in the category. Again, this may or may not signal a clinical condition like serious mental illness or substance-use, but nonetheless provide some measure of the civilian’s behavior that could play a role in their encounter with police.

PPIC.ORG Technical Appendices Police Use of Force and Misconduct in California 7
TABLE A2 Serious Civilian Injuries during Police Encounters, DOJ Use of Force Data, 2016 – 2019
All Deaths All Gunshot injuries All serious injuries
Total Fatal Non-fatal Total Fatal Non-fatal
Year
2016 25.1% 25.8% 25.9% 25.7% 27.2% 25.1% 27.9%
2017 27.7% 27.5% 28.2% 26.6% 24.5% 27.7% 23.4%
2018 23.7% 23.2% 22.1% 24.5% 22.8% 23.7% 22.5%
2019 23.5% 23.6% 23.9% 23.2% 25.5% 23.5% 26.2%
Race/ethnicity
White 31.9% 30.9% 31.9% 29.6% 30.7% 31.9% 30.3%
Latino 44.8% 45.4% 45.1% 45.8% 45.3% 44.8% 45.5%
Black 16.3% 17.3% 16.2% 18.8% 18.4% 16.3% 19.1%
Asian/Pacific Islander 4.7% 3.6% 4.5% 3.2% 3.2% 4.7% 2.7%
Native American/Multi-racial/Other 2.4% 2.7% 2.3% 2.6% 2.4% 2.4% 2.5%
Behavioral health conditions
Any behavioral health, with erratic 56.4% 48.9% 52.6% 44.2% 53.7% 56.4% 52.8%
Any behavioral health, no erratic 37.7% 31.9% 33.0% 30.6% 41.7% 37.7% 43.1%
Any alcohol 11.0% 10.6% 10.9% 10.2% 15.6% 11.0% 17.1%
Any drug 21.9% 17.2% 17.3% 17.1% 22.6% 21.9% 22.8%
Any substance use (alcohol or drugs) 28.0% 23.1% 23.9% 22.0% 33.2% 28.0% 34.9%
Any mental health, with erratic 38.7% 33.9% 36.9% 30.1% 27.6% 38.7% 24.0%
Any mental health, no erratic 15.6% 13.7% 14.3% 13.0% 13.0% 15.6% 12.2%
Reason for Stop
Call for service 57.3% 50.8% 56.3% 43.5% 51.2% 57.3% 49.2%
Crime in progress 18.2% 21.7% 19.3% 24.8% 18.2% 18.2% 18.2%
Vehicle/pedestrian stop 12.9% 14.6% 13.7% 15.5% 13.9% 12.9% 14.3%
Pre-planned 5.2% 7.1% 5.4% 9.3% 5.8% 5.2% 6.0%
Other 6.4% 6.0% 5.4% 6.9% 10.9% 6.4% 12.4%

PPIC.ORG Technical Appendices Police Use of Force and Misconduct in California 8
All Deaths All Gunshot injuries All serious injuries
Total Fatal Non-fatal Total Fatal Non-fatal
Armed Status
Perceived and confirmed armed 77.6% 79.4% 85.0% 72.0% 42.2% 77.6% 30.4%
Unarmed, but perceived armed 9.8% 11.1% 8.9% 13.9% 15.9% 9.8% 17.9%
Confirmed armed, but not perceived armed 2.3% 2.6% 2.5% 2.8% 2.2% 2.3% 2.1%
Unarmed, and not perceived armed 10.3% 7.0% 3.6% 11.3% 39.8% 10.3% 49.6%
Weapon Type (for those confirmed armed)
Multiple weapons 2.4% 3.2% 2.4% 4.3% 3.9% 2.4% 5.1%
Knife/Stabbing instrument 28.4% 25.4% 28.1% 21.4% 29.3% 28.4% 30.1%
Firearm 51.8% 52.3% 52.3% 52.3% 45.2% 51.8% 39.9%
Firearm, replica 6.9% 6.6% 6.9% 6.2% 5.6% 6.9% 4.6%
Other weapon 10.5% 12.4% 10.2% 15.8% 16.0% 10.5% 20.4%
Medical Aid Received
Admitted to hospital, critical injuries 14.0% 32.8% 12.7% 58.9% 18.3% 14.0% 19.7% Admitted to hospital, other 2.4% 5.2% 0.5% 11.2% 9.3% 2.4% 11.7% Received care from medical facility and released 0.4% 11.3% 0.5% 25.2% 44.9% 0.4% 60.2% Received medical care on scene 13.5% 9.5% 13.9% 3.7% 8.6% 13.5% 6.9% No medical aid/refused treatment 4.3% 3.1% 4.8% 0.9% 2.2% 4.3% 1.5% Died in transit 65.4% 38.1% 67.5% 0.0% 16.7% 65.4% 0.0%
Total incidents 621 993 561 432 2500 621 1879
SOURCE: California DOJ, Use of Force Incident Reporting System, 2016 – 2019.
NOTES: Includes civilian injuries that were recorded as ‘receiving force’ and ‘sustaining an injury’. We exclude 15 incidents that were missing information on whether they were injured as these incidents were also missing data in many other fields. The Medical Aid Received analysis excludes data from 2016 as the categories had a different coding scheme that did not include ‘Died in Transit’ option.

PPIC.ORG Technical Appendices Police Use of Force and Misconduct in California 9
TABLE A3 Civilian Injuries during Police Encounters, Hospital Discharge Data, 2016 – 2019
Serious injuries Serious gunshot injuries
Year Total Non-fatal Total Non-fatal
2016 23% 23% 23% 23%
2017 24% 25% 30% 30%
2018 26% 26% 25% 23%
2019 26% 26% 23% 23%
Race/ethnicity
White 34% 34% 30% 30%
Latino 19% 19% 16% 16%
Black 39% 39% 44% 44%
Asian/Pacific Islander 2% 2% 6% 5%
Native American/Multi-racial/Other 6% 6% 5% 6%
Behavioral health conditions
Any behavioral health 27% 27% 39% 43%
Any substance use 18% 18% 26% 28%
Any alcohol 7% 7% 8% 9%
Any drug 13% 13% 21% 24%
Any mental health 13% 13% 23% 26%
Schizophrenia 5% 5% 8% 9%
Suicidal behavior 2% 2% 4% 5%
Type of hospital visit
Outpatient emergency department 90% 91% 49% 45%
Hospital admission 10% 9% 51% 55%
Primary diagnosis
Open wounds of head, neck and trunk 21% 21% 29% 27%
Sprains and strains 14% 14% 0% 0%
Open wounds of extremities 14% 14% 16% 18%
Behavioral health 2% 2% 3% 3%
Fracture of upper limb 7% 7% 9% 10%
Other non-traumatic joint disorders 5% 5% 1% 1%
Skull and face fractures 5% 5% 4% 4%
Intracranial injury 3% 3% 2% 1%
Fracture of lower limb 2% 2% 4% 5%
Crushing injury or internal injury 1% 1% 14% 13%
All other diagnoses 25% 25% 19% 18%
Total incidents 13,130 13,038 560 490

PPIC.ORG Technical Appendices Police Use of Force and Misconduct in California 10
SOURCE: California OSHPD, Hospital Discharge Data, 2016 – 2019.
NOTES: Includes outpatient emergency department visits and hospital admissions that had external cause of injury codes indicating the injury occurred during an encounter with law enforcement, referred to as a legal intervention injury in the ICD manual.
While we do not present the information presented in Appendix Table A4, we include additional cuts of the data to assess how the conditions or assumptions we are making to best align the hospital discharge data with the Use of Force data may impact our findings. Overall, the characteristics of all incidents including those we have identified as “minor” look quite similar to those included in our discussion of “serious” injuries, except obviously for the primary diagnoses which is the criteria we use to identify “serious” injuries. The same is true when we look at all gunshot injuries (as identified solely through e-codes) with serious gunshot injuries, which again use primary diagnosis to assess seriousness.
TABLE A4 Civilian Injuries during Police Encounters, Hospital Discharge Data, 2016 – 2019
All injuries All gunshot injuries All Deaths
Year Total Total Non-fatal Total
2016 23% 23% 23% 20%
2017 24% 27% 27% 24%
2018 27% 27% 26% 35%
2019 26% 23% 23% 22%
Race/ethnicity
White 34% 28% 28% 32%
Latino 18% 17% 17% 14%
Black 40% 44% 44% 44%
Asian/Pacific Islander 2% 5% 5% 9%
Native American/Multi-racial/Other 6% 6% 6% 1%
Behavioral health conditions
Any behavioral health 28% 38% 41% 21%
Any substance use 20% 26% 28% 17%
Any alcohol 8% 8% 9% 2%
Any drug 13% 21% 23% 15%
Any mental health 14% 22% 23% 12%
Schizophrenia 5% 9% 10% 3%
Suicidal behavior 2% 4% 4% 3%
Type of hospital visit
Outpatient emergency department 95% 63% 62% 66%
Hospital admission 5% 37% 38% 34%
Primary diagnosis
Superficial injury 27% 16% 18% 0%
Administrative/social visit 11% 7% 8% 0%
Other unspecified injury 11% 6% 6% 0%

PPIC.ORG Technical Appendices Police Use of Force and Misconduct in California 11
All injuries All gunshot injuries All Deaths
Open wounds of head, neck and trunk 10% 20% 18% 31%
Sprains and strains 6% 6% 6% 0%
Open wounds of extremities 6% 11% 12% 6%
Behavioral health 6% 5% 5% 0%
Fracture of upper limb 3% 1% 1% 0%
Other non-traumatic joint disorders 2% 0% 2% 0%
Skull and face fractures 2% 3% 2% 1%
Intracranial injury 1% 1% 1% 7%
Fracture of lower limb 1% 3% 3% 0%
Crushing injury or internal injury 1% 10% 8% 22%
All other diagnoses 12% 11% 13% 33%
Total incidents 28,497 818 747 92
SOURCE: California OSHPD, Hospital Discharge Data, 2016 – 2019.
NOTES: Includes outpatient emergency department visits and hospital admissions that had external cause of injury codes indicating the injury occurred during an encounter with law enforcement, referred to as a legal intervention injury in the ICD manual. The other large diagnostic category for hospital deaths is ‘cardiac arrest’ which was the primary diagnosis in 26% of legal intervention in-hospital deaths.
TABLE A5 Percent of Law Enforcement Stops where Civilian is Armed with a Firearm or Weapon by Contact Reason, RIPA, 2019
% Firearm % Weapon
Contact Reason 0.22 0.53
Traffic Violation (85.0%) 0.09 0.18
Reasonable Suspicion (12.1%) 0.89 2.59
Consensual Encounter Resulting in Search (1.1%) 0.73 1.88
Parole/Probation Supervision (0.7%) 1.43 2.60
Knowledge of Outstanding Arrest Warrant (0.7%) 1.82 2.85
School/Student Violation (0.4%) 0.60 1.60
No Call for Service (95.0%) 0.18 0.39
Call for Service (5.0%) 0.89 3.19
SOURCE: California Department of Justice, Racial and Identity Profiling Act (RIPA) Wave 2 data, 2019.
NOTES: The contact reason is in a descending order by frequency of occurrence (associated percent in parentheses). In the RIPA data, unlike the DOJ Use of Force data, calls for service are indicated in a separate variable, which can overlap with all contact reasons.

PPIC.ORG Technical Appendices Police Use of Force and Misconduct in California 12
Appendix B. Association Analysis: Regression Model and Supplemental Findings
The analysis combines FBI data on crimes, population, and attacks on law enforcement with crowdsourced data from Fatal Encounters (2013–2019). To explore how various contextual factors are associated with the number of officer-involved fatalities for a law enforcement agency in a given year, we run the following regression model
𝐿𝐿𝐿𝐿𝐿𝐿(𝑌𝑌𝑖𝑖𝑖𝑖) = 𝛼𝛼 + 𝛽𝛽1𝐿𝐿𝐿𝐿𝐿𝐿(𝑂𝑂𝑂𝑂𝑂𝑂𝑂𝑂𝑂𝑂𝑂𝑂𝑂𝑂𝑂𝑂𝑂𝑂𝑂𝑂𝑂𝑂𝑂𝑂𝑂𝑂𝑂𝑂𝑂𝑂𝑂𝑂𝑑𝑑/𝐾𝐾𝑂𝑂𝑂𝑂𝑂𝑂𝑂𝑂𝑑𝑑𝑖𝑖𝑖𝑖) + 𝛽𝛽2𝐿𝐿𝐿𝐿𝐿𝐿(𝑃𝑃𝐿𝐿𝑝𝑝𝑖𝑖𝑖𝑖) + 𝛽𝛽3𝐿𝐿𝐿𝐿𝐿𝐿(𝑂𝑂𝑂𝑂𝐴𝐴𝑂𝑂𝑑𝑑𝐴𝐴𝐿𝐿𝐴𝐴𝐴𝐴𝑂𝑂𝑂𝑂𝐴𝐴𝑂𝑂𝑂𝑂𝑂𝑂𝑂𝑂𝑂𝑂𝑂𝑂𝑂𝑂𝑖𝑖𝑖𝑖)+ 𝛽𝛽4𝐿𝐿𝐿𝐿𝐿𝐿(𝑉𝑉𝑂𝑂𝐿𝐿𝑂𝑂𝑂𝑂𝑉𝑉𝑂𝑂𝑉𝑉𝑂𝑂𝑂𝑂𝐴𝐴𝑂𝑂𝑖𝑖𝑖𝑖) + 𝛽𝛽5𝐿𝐿𝐿𝐿𝐿𝐿(𝑃𝑃𝑂𝑂𝐿𝐿𝑝𝑝𝑂𝑂𝑂𝑂𝑂𝑂𝐴𝐴𝑉𝑉𝑂𝑂𝑂𝑂𝐴𝐴𝑂𝑂𝑖𝑖𝑖𝑖) + 𝛾𝛾′𝐿𝐿𝐿𝐿𝑂𝑂𝑖𝑖 + 𝜆𝜆′𝑌𝑌𝑂𝑂𝑂𝑂𝑂𝑂𝑖𝑖 + 𝜖𝜖𝑖𝑖𝑖𝑖
where Yit represents the number of officer-involved fatalities for law enforcement agency i in year t. We assess how the following contextual factors are associated with these police-involved deaths of civilians: officers assaulted or killed in a given agency-year, population of the jurisdiction, armed robberies and assaults (a possible proxy for criminal gun ownership), violent crime, and property crime. We transform the dependent and independent variables via the logarithmic function, reducing the ability of outliers to drive the estimates and making agencies of different sizes more comparable.3 Thus, the coefficients of interest are 𝛽𝛽1 through 𝛽𝛽5, which can be interpreted as elasticities (e.g., for 𝛽𝛽1, a 1% increase in the number of officer assaulted or killed results in 𝛽𝛽1% increase in the number of officer-involved fatalities). 𝐿𝐿𝐿𝐿𝑂𝑂𝑖𝑖 are the law enforcement agency fixed effects, and 𝑌𝑌𝑂𝑂𝑂𝑂𝑂𝑂𝑖𝑖 are the year fixed effects.
Occasionally, this model is modified by excluding the agency and year fixed effects, or is only run on a subset of the police-involved deaths (e.g., ones where the civilians were armed). The results for each regression are reported in a separate table column, which denote whether the fixed effects are included in the regression specification. Appendix Table B1 presents the estimates for how these variables correlate with the full set of police-involved fatalities, and then sequentially adjusts for year-to-year variation in fatalities as well as time-invariant fixed characteristics of the agency.
TABLE B1 Regression of Log(Officer-Involved Fatalities) on Predictor Variables
Log(Officer-Involved Fatalities)
(1) (2) (3) (4)
Log(Officers Assaulted/Killed) 0.045*** 0.048*** 0.032* 0.038** (0.011) (0.011) (0.017) (0.018)
Log(Pop) 0.141*** 0.146*** -0.697* -0.387
(0.031) (0.031) (0.415) (0.461)
Log(Armed Robbery/Assault) 0.101*** 0.100*** 0.105*** 0.103***
(0.019) (0.019) (0.026) (0.027)
Log(Violent Crime) 0.041* 0.045* -0.051 -0.039
(0.025) (0.025) (0.045) (0.046)
Log(Property Crime) -0.068** -0.081*** -0.098 -0.174***
(0.027) (0.028) (0.062) (0.067)
3 Because of zeros being present in several of the count variables (e.g., officer-involved fatalities), the actual transformation is Log(Variable+1). However, the results are robust to alternative transformations, such as inverse hyperbolic sine.

PPIC.ORG Technical Appendices Police Use of Force and Misconduct in California 13
Log(Officer-Involved Fatalities)
Observations 1,624 1,624 1,624 1,624
R-squared 0.318 0.323 0.577 0.582
Agency FE No No Yes Yes
Year FE No Yes No Yes
Robust standard errors in parentheses *** p<0.01, ** p<0.05, * p<0.1 SOURCES: Authors ran the regression analysis using data from Fatal Encounters and the FBI from 2013-2019.
NOTES: The analysis only includes the 232 agencies that have at least one officer-involved fatality during 2013–2019 and have non-missing data for the associated predictors. Because we use population as a predictor, the analysis excludes agencies such as the California Highway Patrol who have that information is missing.
For Columns (1) and (2), the estimates reflect the effects across agencies since we do not include agency fixed effects. In Column (1), a 1% increase in the number of officers assaulted/killed in an agency-year is associated with a 0.045% increase in the number of officer-involved fatalities, keeping all other variables constant. These percent increases are relative to an average of 0.85 fatalities in a year for a given agency. Population is positively correlated to these civilian deaths with the largest elasticity of 0.14, intuitively suggesting that agencies with more populous jurisdictions experience more fatalities. Jurisdictions that experience 1% more armed robbery/assault have 0.1% more officer-involved fatalities, aligning with assault being the predominant reason for arrest (66%) in these officer-involved fatalities (calculated from CA DOJ’s Deaths in Custody dataset). However, with property crime, we see the opposite sign where areas with more property crime have less fatalities. This potentially counterintuitive result may be a reflection of municipalities such as San Francisco, which have high levels of property crime, but lower levels of violent crime involving a firearm.
However, these estimates could also be driven by confounding differences across agencies or trends in fatalities between 2013-2019. After controlling for fixed characteristics of a law enforcement agency and year-to-year variation in police-involved fatalities, Column (4) presents the preferred regression specification because the estimates reflect within-agency comparisons. After introducing these adjustments, the coefficient on population becomes negative and statistically insignificant. However, the remaining relationships for assaults on officers, armed robbery/assault, and property crime hold. In fact, for property crime, the elasticity is accentuated such that a 1% increase in property crime within a jurisdiction results in 0.17% less officer-involved fatalities.4 These broad findings are consistent with officers responding to higher risk environments for policing, where firearm-involved crimes and assaults against officers seem to be the only factors that significantly increase fatalities, aligning with studies that find increased firearm prevalence is associated with more officers being killed (Swedler et al., 2015).
We discuss results from the preferred regression model in the main text, with Appendix Table 2 containing those coefficients of interest for all subsets. It presents the main estimates for how these variables correlate with police-involved fatalities, after adjusting for year-to-year variation in fatalities as well as time-invariant fixed characteristics of the agency.
With Column (1) through (5) referencing separate regressions, the coefficient estimates in Appendix Table 2 can be interpreted as elasticities estimated across various subsets. These percent increases are relative to an average of 0.85 fatalities in a year for a given agency. To ensure these estimates do not capture confounding differences
4 Importantly, the Column (4) results are not very sensitive to the inclusion or exclusion of certain crime controls, despite concerns of multi-collinearity in the regression.

PPIC.ORG Technical Appendices Police Use of Force and Misconduct in California 14
across agencies or time, we control for fixed characteristics of a law enforcement agency and year-to-year variation in police-involved fatalities. Thus, the presented estimates reflect within-agency comparisons.
TABLE B2 Regression of Log(Officer-Involved Fatalities) on Predictor Variables by Fatality Subset
Log(Officer-Involved Fatalities) by Subset
(1) (2) (3) (4) (5)
All Fatalities Armed Unarmed Firearm Non-firearm
Log(Officers Assaulted/Killed) 0.038** 0.044*** -0.003 0.035** 0.010 (0.018) (0.016) (0.014) (0.016) (0.010)
Log(Population) -0.387 -0.944** -0.079 -0.345 0.143
(0.461) (0.414) (0.412) (0.405) (0.288)
Log(Armed Robbery/Assault) 0.103*** 0.071*** 0.025 0.081*** 0.023
(0.027) (0.024) (0.019) (0.024) (0.016)
Log(Violent Crime) -0.039 -0.038 -0.011 -0.036 -0.009
(0.046) (0.040) (0.038) (0.039) (0.028)
Log(Property Crime) -0.174*** -0.092 -0.090* -0.101 -0.083**
(0.067) (0.067) (0.053) (0.064) (0.035)
Observations 1,624 1,392 1,392 1,624 1,624
R-squared 0.582 0.570 0.456 0.579 0.365
Agency FE Yes Yes Yes Yes Yes
Year FE Yes Yes Yes Yes Yes
Robust standard errors in parentheses *** p<0.01, ** p<0.05, * p<0.1 SOURCES: Authors ran the preferred regression model using data from Fatal Encounters and the FBI from 2013-2019. Because data on whether civilians were armed only reliably began in 2014, we run those regressions from 2014-2019.
NOTES: The analysis only includes the 232 agencies that have at least one officer-involved fatality during 2013–2019 and have non-missing data for the associated predictors. Because we use population as a predictor, the analysis excludes agencies such as the California Highway Patrol who have that information is missing. Armed and unarmed refers to whether the civilian who dies from the officer’s actions allegedly has a weapon on their person and in their immediate vicinity at the exact moment of the incident. Firearm and non-firearm reference whether the officer used deadly force by discharging their firearm.
In Column (1), a 1% increase in the number of officers assaulted/killed in an agency-year is associated with a 0.038% increase in the number of officer-involved fatalities, keeping all other variables constant.5 A 1% increase in armed robbery/assault within a jurisdiction is associated with 0.10% more officer-involved fatalities, aligning with assault being the predominant reason for arrest (66%) in these officer-involved fatalities (calculated from CA DOJ’s Deaths in Custody dataset). Conversely, we see that a 1% increase of property crime within a jurisdiction is associated with 0.17% less officer-involved fatalities.6 This potentially counterintuitive result may be a reflection of municipalities such as San Francisco, whose property crime levels have grown with increased wealth, but have been accompanied by less violent crime. These broad findings are consistent with officers
5 We combine assaults and fatal attacks on law enforcement as one variable because the small number of officers killed each year limit the ability to draw precise estimates of the relationship. If we were to separate them in the regression, the coefficient on assaults looks very similar to the combined category, and the coefficient on officers killed is consistently large but insignificant. 6 Importantly, these results are not very sensitive to the inclusion or exclusion of certain crime controls, despite concerns of multi-collinearity in the regression.
PPIC.ORG Technical Appendices Police Use of Force and Misconduct in California 15
responding to higher risk environments for policing, where firearm-involved crimes and assaults against officers seem to be the only factors that significantly increase fatalities, aligning with studies that find increased firearm prevalence is associated with more officers being killed (Swedler et al., 2015).
We explore this interpretation more carefully by estimating the same empirical model over various subsets of officer-involved fatalities (the outcome variable), and compare the estimates to understand what may be driving any observed differences. We first explore the differences in these relationships when we limit the set of officer-involved fatalities to where the civilian was allegedly armed (65% of officer-involved fatalities) and compare it to the subset where the civilian was unarmed (35%). Focusing on the allegedly armed civilian fatalities in Column (2), the estimates on officer assaulted and armed robbery/assault seem to comport with the general results from the full set of fatalities. These “threat” variables are the only significant factors that are positively associated with these fatalities within an agency. Replacing property crime, population is the only significant factor that is negative correlated, seeing a substantial effect of a 1% increase in population within a jurisdiction resulting in 0.94% fewer fatalities. Unsurprisingly, these effects are similar (aside from the large population coefficient) when looking at the subset of civilians who were fatally shot by officers (Column 4), a far majority of which were armed.
Comparatively, police-involved deaths of unarmed civilians occur about half as often as incidents involving armed persons, averaging about 0.267 instances per agency-year. There are noticeably zero significant predictors of fatalities when the person killed was unarmed (Column 3). It seems straightforward that these variables representing “threat” are less relevant when predicting deaths of unarmed civilians compared to armed ones. But it is critical to understand factors are predictive of these deaths, as these officer-involved fatalities tend to be the ones that communities and law enforcement agencies mutually agree are the most urgent to address and cause the most scrutiny (Premkumar, 2019). The lack of significant correlates is largely mirrored in the subset of fatalities that are caused by officers using less-lethal force (i.e., not discharging their firearm) in Column (5). In these non-firearm deaths, we only see property crime as a significant negative predictor, with a magnitude is similar to the effect size for unarmed fatalities. To probe further, investigating with more contextual or agency data may shed light on what factors are associated with deaths of unarmed people during police encounters (e.g., behavioral health, poverty, and police trainings or procedures).
Technical Appendix Tables B3–4 are robustness checks exploring the sensitivity of our estimates. Table B3 expands the sample to include all California agencies that report to the FBI, rather than the previous sample that was also restricted to having at least one officer-involved fatality. One important caveat is that the added departments tend to have less populous jurisdictions, where we have less reliably information generally. Further, it is difficult to distinguish whether the Fatal Encounter’s data collection mechanism (i.e., typically using news articles) is unable to find a civilian fatality from a police encounter in these places or there were none. Overall, though, the results express a similar pattern, with estimates about a third as large, after doubling the number of law enforcement agencies.

PPIC.ORG Technical Appendices Police Use of Force and Misconduct in California 16
TABLE B3 All Law Enforcement Agencies: Regression of Log(Officer-Involved Fatalities) on Predictor Variables by Fatality Subset
Log(Officer-Involved Fatalities) by Subset
(1) (2) (3) (4) (5)
All Fatalities Armed Unarmed Firearm Non-firearm
Log(Officers Assaulted/Killed) 0.018** 0.017** -0.001 0.015** 0.005 (0.008) (0.007) (0.006) (0.008) (0.005)
Log(Population) -0.158 -0.320** -0.014 -0.143 0.067
(0.195) (0.149) (0.145) (0.172) (0.120)
Log(Armed Robbery/Assault) 0.033*** 0.023*** 0.007 0.027*** 0.006
(0.009) (0.007) (0.005) (0.008) (0.005)
Log(Violent Crime) -0.010 -0.008 -0.002 -0.009 -0.003
(0.011) (0.008) (0.008) (0.010) (0.007)
Log(Property Crime) -0.034** -0.013 -0.014 -0.019 -0.017**
(0.015) (0.012) (0.009) (0.014) (0.008)
Observations 3,808 3,576 3,576 3,808 3,808
R-squared 0.662 0.634 0.505 0.646 0.408
Agency FE Yes Yes Yes Yes Yes
Year FE Yes Yes Yes Yes Yes
Robust standard errors in parentheses *** p<0.01, ** p<0.05, * p<0.1 SOURCES: Authors ran the preferred regression model using data from Fatal Encounters and the FBI from 2013-2019. Because data on whether civilians were armed only reliably began in 2014, we run those regressions from 2014-2019.
NOTES: The analysis includes the 544 agencies that have non-missing data for the associated predictors. Because we use population as a predictor, the analysis excludes agencies such as the California Highway Patrol who have that information is missing. Armed and unarmed refers to whether the civilian who dies from the officer’s actions allegedly has a weapon on their person and in their immediate vicinity at the exact moment of the incident. Firearm and non-firearm reference whether the officer used deadly force by discharging their firearm.
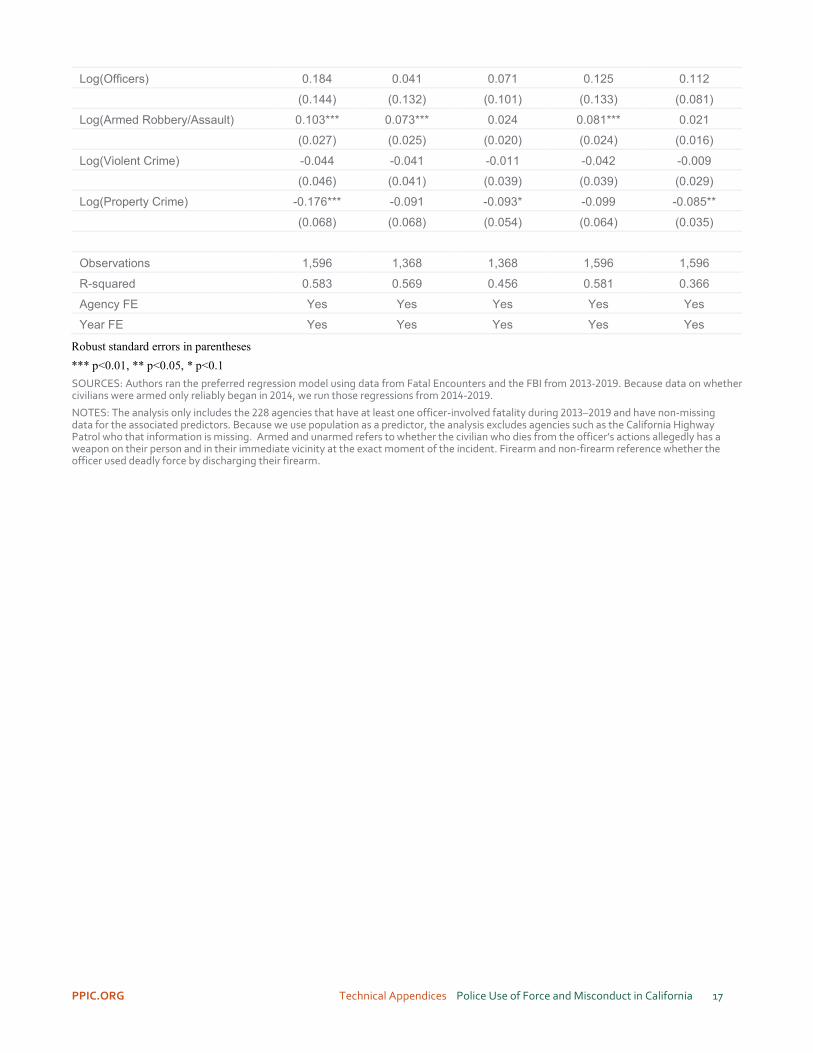
Technical Appendix Table B4 returns to the preferred sample (narrowing to agencies with at least one officer-involved fatality between 2013–2019), and adds sworn, non-jail law enforcement officers as a predictor. Since most law enforcement agencies report personnel, the number of agencies only drops to 228 from 232. The results are quite similar to preferred specification across the different outcomes, as we see in Technical Appendix Table B2.
TABLE B4 Including Personnel: Regression of Log(Officer-Involved Fatalities) on Predictor Variables by Fatality Subset
Log(Officer-Involved Fatalities) by Subset
(1) (2) (3) (4) (5)
All Fatalities Armed Unarmed Firearm Non-firearm
Log(Officers Assaulted/Killed) 0.038** 0.044*** -0.003 0.035** 0.009 (0.018) (0.017) (0.014) (0.017) (0.010)
Log(Population) -0.447 -0.977** -0.112 -0.383 0.101
(0.472) (0.420) (0.418) (0.413) (0.293)
PPIC.ORG Technical Appendices Police Use of Force and Misconduct in California 17
Log(Officers) 0.184 0.041 0.071 0.125 0.112
(0.144) (0.132) (0.101) (0.133) (0.081)
Log(Armed Robbery/Assault) 0.103*** 0.073*** 0.024 0.081*** 0.021
(0.027) (0.025) (0.020) (0.024) (0.016)
Log(Violent Crime) -0.044 -0.041 -0.011 -0.042 -0.009
(0.046) (0.041) (0.039) (0.039) (0.029)
Log(Property Crime) -0.176*** -0.091 -0.093* -0.099 -0.085**
(0.068) (0.068) (0.054) (0.064) (0.035)
Observations 1,596 1,368 1,368 1,596 1,596
R-squared 0.583 0.569 0.456 0.581 0.366
Agency FE Yes Yes Yes Yes Yes
Year FE Yes Yes Yes Yes Yes
Robust standard errors in parentheses *** p<0.01, ** p<0.05, * p<0.1 SOURCES: Authors ran the preferred regression model using data from Fatal Encounters and the FBI from 2013-2019. Because data on whether civilians were armed only reliably began in 2014, we run those regressions from 2014-2019.
NOTES: The analysis only includes the 228 agencies that have at least one officer-involved fatality during 2013–2019 and have non-missing data for the associated predictors. Because we use population as a predictor, the analysis excludes agencies such as the California Highway Patrol who that information is missing. Armed and unarmed refers to whether the civilian who dies from the officer’s actions allegedly has a weapon on their person and in their immediate vicinity at the exact moment of the incident. Firearm and non-firearm reference whether the officer used deadly force by discharging their firearm.

PPIC.ORG Technical Appendices Police Use of Force and Misconduct in California 18
Appendix C. Racial Disparity Analysis: Empirical Model and Supplemental Findings
We conduct a regression analysis of racial disparities using a linear probability model, assessing differences in the likelihood of firearm-related use of force across race. Although we introduce various controls sequentially, the full specification for the regression is below:
𝑌𝑌𝑖𝑖𝑖𝑖𝑖𝑖 = 𝛼𝛼 + 𝜷𝜷′𝐴𝐴𝑂𝑂𝑂𝑂𝑂𝑂𝑖𝑖 + 𝛾𝛾′𝐷𝐷𝑂𝑂𝐴𝐴𝐿𝐿𝐿𝐿𝑖𝑖 + 𝛿𝛿′𝐴𝐴𝑅𝑅𝑅𝑅𝑖𝑖𝑖𝑖 + 𝜆𝜆𝜆𝜆𝑂𝑂𝑂𝑂𝑝𝑝𝐿𝐿𝑉𝑉𝑖𝑖𝑖𝑖 + 𝜂𝜂′𝐿𝐿𝐿𝐿𝑂𝑂𝑖𝑖 + 𝜃𝜃′𝑉𝑉𝑂𝑂𝑂𝑂𝐴𝐴𝑖𝑖 + 𝜀𝜀𝑖𝑖𝑖𝑖𝑖𝑖𝑖𝑖
𝑌𝑌𝑖𝑖𝑖𝑖𝑖𝑖 represents likelihood of an officer, from law enforcement agency j, using some type of force in stop of individual i in closest city k. Racei is a vector of indicator variables identifying perceived racial/ethnicity groups. Thus, estimates of the 𝜷𝜷′ vector are the coefficients of interest, reflecting the difference in the outcome between individuals of perceived non-white race/ethnicity and whites (i.e., white is the reference group). Demogi is a matrix of perceived personal or demographic traits, such as gender, age, LGBT, limited English proficiency and disabilities (including mental health status). RFSij is a vector of reported reasons for the stop of individual i by law enforcement agency j, and Weaponij is an indicator variable for whether the law enforcement agency j conducts a search and finds a weapon. LEAj are law enforcement fixed effects, and Cityk are fixed effects of the location of the stop (nearest city).
TABLE C1 Probability of Firearm Discharge/Point by Race/Ethnicity
Probability(Firearm Discharge/Point)
Black 0.00521*** 0.00461*** 0.00243*** 0.00205*** 0.00150***
(0.00012) (0.00012) (0.00011) (0.00011) (0.00011)
Latino 0.00202*** 0.00131*** 0.00168*** 0.00150*** 0.00123*** (0.00007) (0.00007) (0.00007) (0.00007) (0.00007)
Asian and Pacific Islanders -0.00088*** -0.00114*** 0.00053*** 0.00050*** 0.00072***
(0.00007) (0.00007) (0.00007) (0.00007) (0.00007)
Native American/Multi-race 0.00205*** 0.00140*** 0.00118*** 0.00094*** 0.00068**
(0.00031) (0.00032) (0.00031) (0.00031) (0.00031)
Observations 3,992,074 3,992,072 3,992,072 3,992,072 3,992,020
R-squared 0.00095 0.00221 0.01834 0.03169 0.03562
Demographics No Yes Yes Yes Yes
Reason for Stop/CFS No No Yes Yes Yes
Weapon Control No No No Yes Yes
Agency FE No No No No Yes
Closest City FE No No No No Yes
White Point/Shoot Probability 0.00234
Robust standard errors in parentheses *** p<0.01, ** p<0.05, * p<0.1 SOURCE: Authors’ regression results using California Department of Justice, Racial and Identity Profiling Act (RIPA) Wave 2 data, 2019.
NOTES: The coefficient estimates represent differences in the likelihood of an officer pointing or discharging a firearm at a civilian when they are white compared to the corresponding racial/ethnic groups, sequentially adding controls. The stop data are limited to the state’s 15 largest law enforcement agencies: California Highway Patrol, the police departments of the cities of Los Angeles, San Diego, San Francisco, Fresno, Long Beach, Oakland, Sacramento, and San Jose and the sheriff departments of Los Angeles, San Bernardino, Riverside, San Diego, Orange and Sacramento Counties.

PPIC.ORG Technical Appendices Police Use of Force and Misconduct in California 19
TABLE C2 Probability of Weapon-involved Force by Race/Ethnicity
Probability(Weapon-involved Force)
Black 0.0056*** 0.0049*** 0.0026*** 0.0022*** 0.0017***
(0.0001) (0.0001) (0.0001) (0.0001) (0.0001)
Latino 0.0021*** 0.0013*** 0.0017*** 0.0015*** 0.0013*** (0.0001) (0.0001) (0.0001) (0.0001) (0.0001)
Asian and Pacific Islanders -0.0010*** -0.0013*** 0.0005*** 0.0005*** 0.0007***
(0.0001) (0.0001) (0.0001) (0.0001) (0.0001)
Native American/Multi-race 0.0023*** 0.0015*** 0.0013*** 0.0011*** 0.0008**
(0.0003) (0.0003) (0.0003) (0.0003) (0.0003)
Observations 3,992,074 3,992,072 3,992,072 3,992,072 3,992,020
R-squared 0.0010 0.0024 0.0194 0.0326 0.0362
Demographics No Yes Yes Yes Yes
Reason for Stop/CFS No No Yes Yes Yes
Weapon Control No No No Yes Yes
Agency FE No No No No Yes
Closest City FE No No No No Yes
White Weapon-Involved Prob. 0.0026
Robust standard errors in parentheses *** p<0.01, ** p<0.05, * p<0.1 SOURCE: Authors’ regression results using California Department of Justice, Racial and Identity Profiling Act (RIPA) Wave 2 data, 2019.
NOTES: The coefficient estimates represent differences in the likelihood of an officer pointing or discharging their firearm, or using another weapon (i.e., electric device such as a Taser, chemical spray, baton, or canine bite) on a civilian when they are white compared to the corresponding racial/ethnic groups, sequentially adding controls. The stop data are limited to the state’s 15 largest law enforcement agencies: California Highway Patrol, the police departments of the cities of Los Angeles, San Diego, San Francisco, Fresno, Long Beach, Oakland, Sacramento, and San Jose and the sheriff departments of Los Angeles, San Bernardino, Riverside, San Diego, Orange and Sacramento Counties.
TABLE C3 No California Highway Patrol: Probability of Firearm Discharge/Point by Race/Ethnicity
Probability(Firearm Discharge/Point)
Black 0.00580*** 0.00478*** 0.00412*** 0.00357*** 0.00276***
(0.00019) (0.00019) (0.00019) (0.00019) (0.00020)
Latino 0.00351*** 0.00214*** 0.00367*** 0.00330*** 0.00271*** (0.00015) (0.00015) (0.00016) (0.00015) (0.00016)
Asian and Pacific Islanders -0.00170*** -0.00195*** 0.00162*** 0.00151*** 0.00197***
(0.00019) (0.00019) (0.00019) (0.00019) (0.00019)
Native American/Multi-race 0.00250*** 0.00145** 0.00219*** 0.00174*** 0.00127**
(0.00060) (0.00061) (0.00061) (0.00061) (0.00061)
Observations 1,820,051 1,820,049 1,820,049 1,820,049 1,819,963
R-squared 0.00078 0.00220 0.01602 0.02946 0.03425
Demographics No Yes Yes Yes Yes

PPIC.ORG Technical Appendices Police Use of Force and Misconduct in California 20
Probability(Firearm Discharge/Point)
Reason for Stop/CFS No No Yes Yes Yes
Weapon Control No No No Yes Yes
Agency FE No No No No Yes
Closest City FE No No No No Yes
White Point/Shoot Probability 0.00545
Robust standard errors in parentheses *** p<0.01, ** p<0.05, * p<0.1 SOURCE: Authors’ regression results using California Department of Justice, Racial and Identity Profiling Act (RIPA) Wave 2 data, 2019.
NOTES: The coefficient estimates represent differences in the likelihood of an officer pointing or discharging a firearm at a civilian when they are white compared to the corresponding racial/ethnic groups, sequentially adding controls. The coefficients were estimated by excluding the California Highway Patrol, and thus limited to the state’s 14 largest law enforcement agencies: the police departments of the cities of Los Angeles, San Diego, San Francisco, Fresno, Long Beach, Oakland, Sacramento, and San Jose and the sheriff departments of Los Angeles, San Bernardino, Riverside, San Diego, Orange and Sacramento Counties.
TABLE C4 Unarmed civilians with no perceptions of mental health conditions: Prob. of Firearm Discharge/Point by Race/Ethnicity
Probability(Firearm Discharge/Point)
Black 0.00429*** 0.00383*** 0.00198*** 0.00137***
(0.00011) (0.00011) (0.00010) (0.00011)
Latino 0.00166*** 0.00105*** 0.00138*** 0.00112*** (0.00006) (0.00006) (0.00006) (0.00007)
Asian and Pacific Islanders -0.00080*** -0.00104*** 0.00041*** 0.00059***
(0.00007) (0.00007) (0.00007) (0.00007)
Native American/Multi-race 0.00181*** 0.00129*** 0.00105*** 0.00077***
(0.00029) (0.00030) (0.00030) (0.00030)
Observations 3,940,572 3,940,570 3,940,570 3,940,519
R-squared 0.00078 0.00172 0.01619 0.02024
Demographics No Yes Yes Yes
Reason for Stop/CFS No No Yes Yes
Agency FE No No No Yes
Closest City FE No No No Yes
White Point/Shoot Probability 0.00199
Robust standard errors in parentheses *** p<0.01, ** p<0.05, * p<0.1 SOURCE: Authors’ regression results using California Department of Justice, Racial and Identity Profiling Act (RIPA) Wave 2 data, 2019.
NOTES: The coefficient estimates represent differences in the likelihood of an officer pointing or discharging a firearm at a civilian when they are white compared to the corresponding racial/ethnic groups, sequentially adding controls. The stop data are limited to unarmed civilians who are not perceived to be having any mental health conditions in the state’s 15 largest law enforcement agencies: California Highway Patrol, the police departments of the cities of Los Angeles, San Diego, San Francisco, Fresno, Long Beach, Oakland, Sacramento, and San Jose and the sheriff departments of Los Angeles, San Bernardino, Riverside, San Diego, Orange and Sacramento Counties.

PPIC.ORG Technical Appendices Police Use of Force and Misconduct in California 21
TABLE C5 Armed civilians: Prob. of Firearm Discharge/Point by Race/Ethnicity
Probability(Firearm Discharge/Point)
Black 0.03453*** 0.02922*** 0.02877*** 0.03378***
(0.00583) (0.00586) (0.00583) (0.00632)
Latino 0.03504*** 0.02376*** 0.02917*** 0.02503*** (0.00547) (0.00573) (0.00571) (0.00607)
Asian and Pacific Islanders 0.01885* 0.01377 0.00788 0.00911
(0.01075) (0.01079) (0.01081) (0.01094)
Native American/Multi-race -0.00844 -0.01435 -0.00618 0.00106
(0.01602) (0.01585) (0.01597) (0.01666)
Observations 21,232 21,232 21,232 21,117
R-squared 0.00220 0.00705 0.03156 0.07262
Demographics No Yes Yes Yes
Reason for Stop/CFS No No Yes Yes
Agency FE No No No Yes
Closest City FE No No No Yes
White Point/Shoot Probability 0.08909
Robust standard errors in parentheses *** p<0.01, ** p<0.05, * p<0.1 SOURCE: Authors’ regression results using California Department of Justice, Racial and Identity Profiling Act (RIPA) Wave 2 data, 2019.
NOTES: The coefficient estimates represent differences in the likelihood of an officer pointing or discharging a firearm at a civilian when they are white compared to the corresponding racial/ethnic groups, sequentially adding controls. The stop data are limited to armed civilians in the state’s 15 largest law enforcement agencies: California Highway Patrol, the police departments of the cities of Los Angeles, San Diego, San Francisco, Fresno, Long Beach, Oakland, Sacramento, and San Jose and the sheriff departments of Los Angeles, San Bernardino, Riverside, San Diego, Orange and Sacramento Counties.
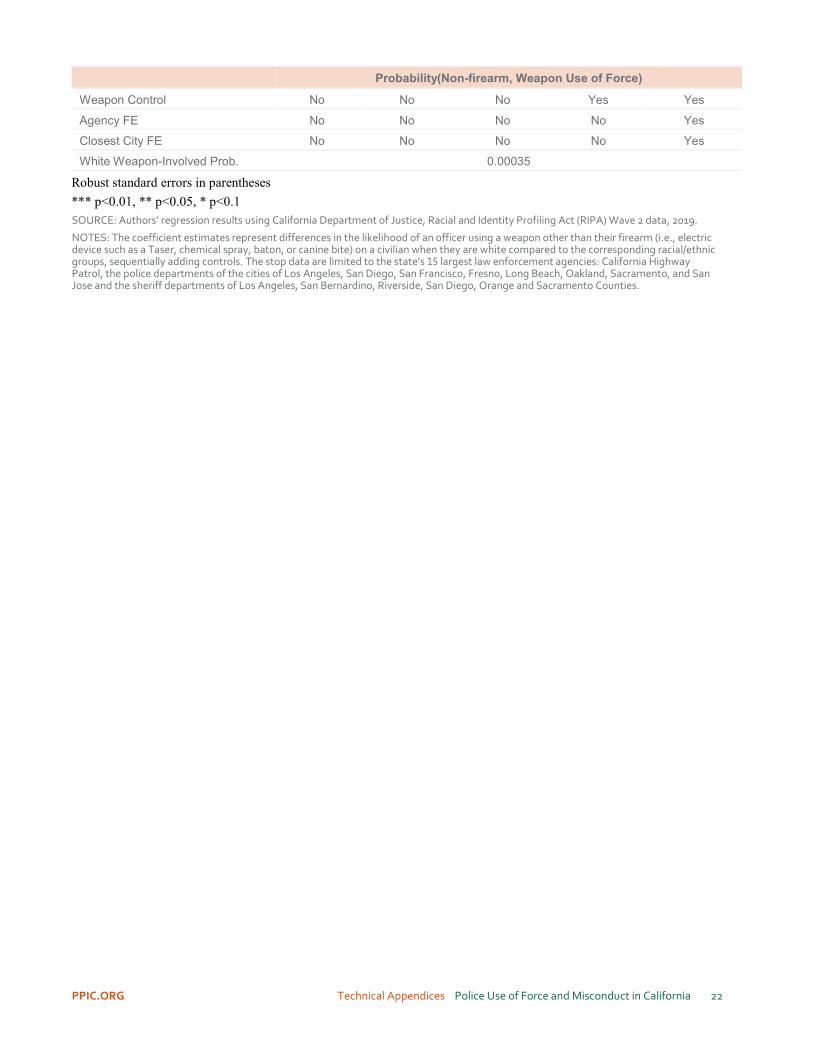
TABLE C6 Probability of Non-Firearm, Weapon Use of Force by Race/Ethnicity
Probability(Non-firearm, Weapon Use of Force)
Black 0.00048*** 0.00040*** 0.00020*** 0.00017*** 0.00018***
(0.00004) (0.00004) (0.00004) (0.00004) (0.00004)
Latino 0.00008*** 0.00003 0.00007*** 0.00006** 0.00006** (0.00002) (0.00002) (0.00002) (0.00002) (0.00003)
Asian and Pacific Islanders -0.00016*** -0.00018*** -0.00003 -0.00003 -0.00001
(0.00003) (0.00003) (0.00003) (0.00003) (0.00003)
Native American/Multi-race 0.00033*** 0.00025* 0.00023* 0.00021 0.00019
(0.00012) (0.00013) (0.00013) (0.00013) (0.00013)
Observations 3,992,074 3,992,072 3,992,072 3,992,072 3,992,020
R-squared 0.00008 0.00067 0.00202 0.00288 0.00326
Demographics No Yes Yes Yes Yes
Reason for Stop/CFS No No Yes Yes Yes
PPIC.ORG Technical Appendices Police Use of Force and Misconduct in California 22
Probability(Non-firearm, Weapon Use of Force)
Weapon Control No No No Yes Yes
Agency FE No No No No Yes
Closest City FE No No No No Yes
White Weapon-Involved Prob. 0.00035
Robust standard errors in parentheses *** p<0.01, ** p<0.05, * p<0.1 SOURCE: Authors’ regression results using California Department of Justice, Racial and Identity Profiling Act (RIPA) Wave 2 data, 2019.
NOTES: The coefficient estimates represent differences in the likelihood of an officer using a weapon other than their firearm (i.e., electric device such as a Taser, chemical spray, baton, or canine bite) on a civilian when they are white compared to the corresponding racial/ethnic groups, sequentially adding controls. The stop data are limited to the state’s 15 largest law enforcement agencies: California Highway Patrol, the police departments of the cities of Los Angeles, San Diego, San Francisco, Fresno, Long Beach, Oakland, Sacramento, and San Jose and the sheriff departments of Los Angeles, San Bernardino, Riverside, San Diego, Orange and Sacramento Counties.

PPIC.ORG Technical Appendices Police Use of Force and Misconduct in California 23
Appendix D. Supplementary Information on Police Misconduct
POST “Null and Void” Certificates In theory, previous to the signing of Senate Bill 2 in September 2021, California POST had the power to decertify officers, although the Commission only revoked certifications for a limited set of reasons explicitly outlined in the legal statute—ones still relevant today: felony convictions, erroneously issuing a certificate, and fraud in obtaining one. In 1991, “the Commission adopted a rule that would have permitted cancellation beyond the statutory grounds,” but the constitutionality of the move came under question, which halted its adoption (Goldman and Puro 2001).7 Eventually, the state attorney general determined a narrowed rule was constitutional, but pushback from some of the POST Commissioners that were police union representatives stymied its implementation and use. Under pressure from police unions and division over what the defining role of what POST should be, California state legislature took away POST’s decertification power in 2004, under Senate Bill 221 and implemented in California Penal Code § 13503(i) and 13506 (Goldman and Puro 2001; Atherley and Hickman 2013).
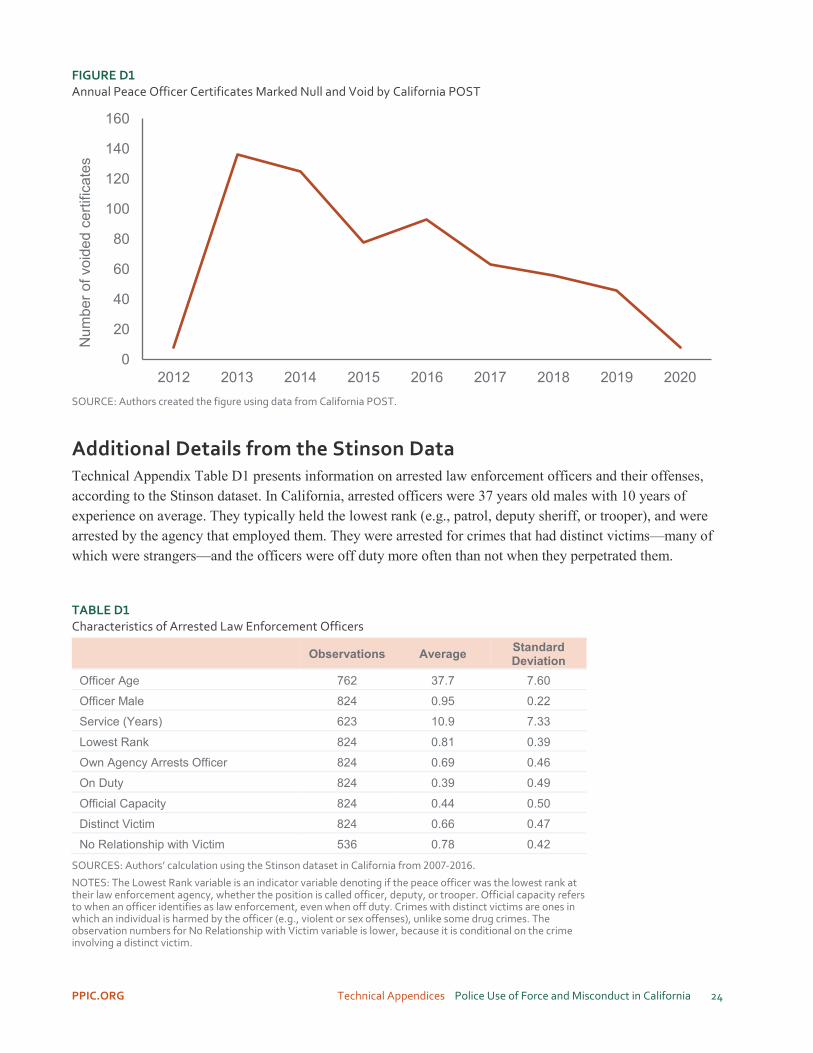
Currently, POST can only mark officer certificates “null and void” after receiving unreliable submissions of disqualification from individual law enforcement agencies and the CA DOJ. Subsequently, the organization that certifies and tracks peace officers’ certificates and trainings does not know the number of officers that should have those certificates cancelled under Government Code section 1029(a) (i.e., California law disqualifies peace officer if they are convicted of a felony). Technical Appendix Figure D1 provides the annual number of voided certificates made by POST, ranging from eight in 2012 and 2020 to 136 in 2013.8 This number is relative to about 78,000 sworn peace officers (with full arrest power) in California during that time, where over 67,200 of them are non-jail, law enforcement officers and over 10,700 work in county jails.
However, given the high variability in disclosures of police misconduct to POST (Technical Appendix Figure D1), the numbers of “null and void” certificates each year are clearly unreliable estimates of the amount of misconduct and illustrates the problems of the current process. Without a systematic data collection effort or commission that consistently flags these officers, there are cases when officers are fired or leave an agency to suspend an investigation into their misconduct, and then are hired by a different agency (Kelly, Lowery, and Rich 2017; Grunwald and Rappaport 2020). The recently introduced Assembly Bill 718 and the recently signed Senate Bill 2 would work to stymie this “wandering officer” phenomenon, where officers who commit misconduct move from agency to agency to evade consequences. These concerns reflect discussions at the federal level, where the George Floyd Justice in Policing Act would have required the federal DOJ to create a National Police Misconduct Registry (Congressional Research Service 2021).9
7 In 1993, the California POST Commission asked the state Attorney General to deliberate on the constitutionality of the rule. He determined that they do have the power to cancel any certificate, but only in context of legislative guidelines. Otherwise, it could be challenged as an unconstitutional delegation of legislative power (Goldman and Puro 2001). 8 POST did not start tracking null and void certificates in their system until 2012, which is why it is the first year of data in the figure. After a discussion with POST, it seems the peak in 2013 is likely an artifact of system processing on their end, rather than a reflection of misconduct in that year. 9 The registry would be partially modeled after the National Decertification Index (NDI), hosted and operated by the International Association of Directors of Law Enforcement Standards and Training. The NDI contains voluntary submissions of law enforcement records by state POST agencies, but still suffers issues of incompleteness and inconsistent use.
PPIC.ORG Technical Appendices Police Use of Force and Misconduct in California 24
FIGURE D1 Annual Peace Officer Certificates Marked Null and Void by California POST
SOURCE: Authors created the figure using data from California POST.
Additional Details from the Stinson Data Technical Appendix Table D1 presents information on arrested law enforcement officers and their offenses, according to the Stinson dataset. In California, arrested officers were 37 years old males with 10 years of experience on average. They typically held the lowest rank (e.g., patrol, deputy sheriff, or trooper), and were arrested by the agency that employed them. They were arrested for crimes that had distinct victims—many of which were strangers—and the officers were off duty more often than not when they perpetrated them.
TABLE D1 Characteristics of Arrested Law Enforcement Officers
Observations Average Standard Deviation
Officer Age 762 37.7 7.60
Officer Male 824 0.95 0.22
Service (Years) 623 10.9 7.33
Lowest Rank 824 0.81 0.39
Own Agency Arrests Officer 824 0.69 0.46
On Duty 824 0.39 0.49
Official Capacity 824 0.44 0.50
Distinct Victim 824 0.66 0.47
No Relationship with Victim 536 0.78 0.42
SOURCES: Authors’ calculation using the Stinson dataset in California from 2007-2016.
NOTES: The Lowest Rank variable is an indicator variable denoting if the peace officer was the lowest rank at their law enforcement agency, whether the position is called officer, deputy, or trooper. Official capacity refers to when an officer identifies as law enforcement, even when off duty. Crimes with distinct victims are ones in which an individual is harmed by the officer (e.g., violent or sex offenses), unlike some drug crimes. The observation numbers for No Relationship with Victim variable is lower, because it is conditional on the crime involving a distinct victim.
0
20
40
60
80
100
120
140
160
2012 2013 2014 2015 2016 2017 2018 2019 2020
Num
ber o
f voi
ded
certi
ficat
es

PPIC.ORG Technical Appendices Police Use of Force and Misconduct in California 25
As discussed previously in the Police Misconduct section, officers have additional privileges that protect them from civil, criminal, and employment consequences. These privileges also reduce their likelihood of being arrested in the first place. Technical Appendix Table D2 explores the criminal and employment consequences of police misconduct for those who were arrested.10 Most commonly, the officer’s own employing agency performs the arrest. In 70 percent of arrests, the agency fires the officer or they resign afterward. However, given the lack of a decertification process in California or even a centralized database of misconduct reporting, these officers may end up rehired at nearby jurisdictions (Kelly, Lowery, and Rich 2017; Grunwald and Rappaport 2020). Only in 9 percent of arrests is no employment action taken. For the incidents where the criminal case outcome is known (over 80% of them), officers are convicted in 76% of them—a majority of which are felony convictions (62%), which would disqualify them as peace officers if reliably reported to POST. Though less than 20 percent of officers are detained pretrial, once convicted, nearly 75 percent of them face some jail or prison time, averaging out to about 8.1 years per incident (with wide variation in sentencing length).
TABLE D2 Criminal and Employment Consequences from Arrest
Observations Mean Standard Deviation
Own Agency Arrests Officer 824 0.69 0.46
Fired/Resigned 824 0.70 0.46
Fired 824 0.44 0.50
No Employment Action 824 0.09 0.29
Convicted 669 0.76 0.43
Felony (if convicted) 509 0.62 0.49
Prosecutorial Dismissal (if not convicted) 158 0.38 0.49
Guilty Plea (if convicted) 507 0.69 0.46
Detained Pre-Trial 739 0.17 0.38
Jail/Prison (if convicted) 487 0.72 0.45
Incarceration Sentence in Years (if jail/prison) 350 8.73 17.7
SOURCES: Authors’ calculation using the Stinson dataset in California from 2007-2016.
NOTES: If the total observation numbers are below 824, it implies that variable is contingent on some condition, which is indicated in parentheses (e.g., if there were convicted, the proportion that are felonies), or that there is unknown information (e.g., the dataset does not have full information on whether officers were eventually convicted or detailed pre-trial).
In California from 2007–2016, Stinson data identifies 20 incidents where an officer was arrested and the victim suffered fatal injuries—15 of which were committed in the officer’s official capacity. The officer was typically charged with either murder, non-negligent manslaughter, or negligent/voluntary/vehicular manslaughter, but there was one arrest each for aggravated assault and driving under the influence (DUI). With two justified exceptions and one omission, every one of these arrests is recorded in the Fatal Encounters data as well, including high-profile deaths of Oscar Grant, Alesia Thomas, and Kelly Thomas (Premkumar 2019).11 The remaining 17 arrests 10 One of the benefits of having an older sample frame (2007-2016) for police misconduct data is that enough time has expired that we can reliably analyze the criminal consequences of the misconduct, which can occasionally take years to be fully adjudicated, particularly when it concerns whether use of force is unreasonable. 11 One of the officer-involved fatalities present in the Stinson data but not Fatal Encounters involved a cold murder case that happened in 1986 with a 2009 DNA match and arrest. Naturally, 1986 is outside of the sample frame for Fatal Encounters. The other justified discrepancy was a case in Stanislaus County around a disappearance and death in 2012, and charges in 2015 that at one point involved nine people—one of them being a California Highway Patrol officer charged with murder. However,

PPIC.ORG Technical Appendices Police Use of Force and Misconduct in California 26
map to 15 officer-involved fatalities from 2007–2016, as one of the deaths prompted charges for three officers. Over the same period, there were 2,075 relevant officer-involved fatalities, suggesting that 0.72 percent of civilian deaths result in an officer being arrested.12
Without more contextual information, it is impossible to know what the appropriate reference point is—the number of fatalities that should result in the arrest of the officer—particularly since Fatal Encounters only has data on certain incident characteristics starting in 2014 (e.g., whether the civilian was armed).13 If we narrow our comparison to 2014–2016, we find that there are three instances in which officers were arrested and charged with killing a civilian, out of 659 relevant fatalities in California (about 0.46%). When focusing on just deaths of unarmed civilians, arrests occur in about 1.2% of incidents.
the charges were dropped in 2019, severing any direct connection to the death. The only incident that was erroneously omitted by Fatal Encounters was when off-duty Santa Paula officer was driving under the influence and crashed their vehicle, which killed a passenger, who was also a Santa Paula police officer. 12 Given constraints around the crowdsourced collection methodology in both datasets, it is certainly possible that there could be more officer-involved fatalities or arrests of officers. However, after a manual check of the incident descriptions from Fatal Encounters, every officer-involved fatality that mentioned an arrest or charge of an officer is present in the Stinson data, suggesting that these datasets may be internally complete. The term “relevant officer-involved fatalities” refers to this report focusing on cases that involve use of force—accidental or purposeful—and pursuit-related deaths, while excluding cases where the victim committed suicide or they died of other causes (e.g., drug overdose during police stop). 13 Fatal Encounters began its systematic data collection process in 2013. Because the data collection process for previous years (2007–2012 for our sample frame) is retrospective, then we may be especially concerned that incidents from these years are undercounted. While it is true that there is a consistent increase in fatalities during these years for the entire country, that trend is distinctly not apparent in California. Additionally, we are comforted by the fact that nearly all of the relevant arrests in the Stinson dataset have a corresponding entry in Fatal Encounters, regardless of the year.

The Public Policy Institute of California is dedicated to informing and improving public policy in California through independent, objective, nonpartisan research.
Public Policy Institute of California 500 Washington Street, Suite 600 San Francisco, CA 94111 T: 415.291.4400 F: 415.291.4401 PPIC.ORG
PPIC Sacramento Center Senator Office Building 1121 L Street, Suite 801 Sacramento, CA 95814 T: 916.440.1120 F: 916.440.1121