police resources in canada census metropolitan area (cma) ... year ending december 31, 2011 (or...
TRANSCRIPT

Catalogue no. 85-225-X
Police Resources inCanada
2012

How to obtain more information
For information about this product or the wide range of services and data available from Statistics Canada, visit our website,www.statcan.gc.ca.
You can also contact us by
e-mail at [email protected]
telephone, from Monday to Friday, 8:30 a.m. to 4:30 p.m., at the following toll-free numbers:• Statistical Information Service 1-800-263-1136• National telecommunications device for the hearing impaired 1-800-363-7629• Fax line 1-877-287-4369
Depository Services Program• Inquiries line 1-800-635-7943• Fax line 1-800-565-7757
To access this product
This product, Catalogue no. 85-225-X, is available free in electronic format. To obtain a single issue, visit our website,www.statcan.gc.ca and browse by “Key resource” > “Publications.”
Standards of service to the public
Statistics Canada is committed to serving its clients in a prompt, reliable and courteous manner. To this end, this agencyhas developed standards of service that its employees observe. To obtain a copy of these service standards, please contactStatistics Canada toll-free at 1-800-263-1136. The service standards are also published at www.statcan.gc.ca under “About us” >“The agency” > “Providing services to Canadians.”
Statistics CanadaCanadian Centre for Justice Statistics
Police Resources in Canada2012
Published by authority of the Minister responsible for Statistics Canada
© Minister of Industry, 2013
All rights reserved. Use of this publication is governed by the Statistics CanadaOpen License Agreement.
http://www.statcan.gc.ca/reference/licence-eng.html
March 2013
Catalogue no. 85-225-X
ISSN 1488-867X
Frequency: Annual
Ottawa
Cette publication est également disponible en français.
Note of appreciation
Canada owes the success of its statistical system to a long-standing partnership betweenStatistics Canada, the citizens of Canada, its businesses, governments and otherinstitutions. Accurate and timely statistical information could not be produced withouttheir continued cooperation and goodwill.
User information
Symbols
The following standard symbols are used in Statistics Canada publications:
. not available for any reference period
.. not available for a specific reference period
... not applicable
0 true zero or a value rounded to zero
0s value rounded to 0 (zero) where there is a meaningful distinction between true zero and the value that wasrounded
p preliminary
r revised
x suppressed to meet the confidentiality requirements of the Statistics Act
E use with caution
F too unreliable to be published
* significantly different from reference category (p < 0.05)
Note
This publication was prepared by Marta Burczycka.
2 Statistics Canada – Catalogue no. 85-225-X
Table of contents
Highlights 5
Police Resources in Canada, 2012 6
Slight decline in police strength 6
Manitoba records largest growth in police strength among provinces 9
Police strength decreases in New Brunswick census metropolitan areas 10
One in ten officers eligible for retirement 12
Growth in number of female officers continues 13
Weighted clearance rate stable in 2011 15
Expenditures by Canadian police services totalled $12.9 billion in 2011 16
Summary 16
References 16
Related products 17
Statistical tables
1 Trends in police personnel and expenditures, Canada, 1962 to 2012 19
2 Police officers and selected crime statistics 20
2-1 Police officers by level of policing, by province and territory, 2012 20
2-2 Selected crime statistics, by province and territory, 2011 21
3 Police officers and crime rates 22
3-1 Police officers in census metropolitan areas, 2012 22
3-2 Police officers in the 30 largest municipal police services, 2012 23
4 Reported hirings and departures of police officers, Canada, provinces and territories, 2011/2012 24
5 Hirings and departures of police officers by overall years of service, Canada, 2011/2012 25
6 Hirings and departures of police officers at the largest police services, Canada, 2011/2012 26
7 Police officers by sex, Canada, selected years 27
8 Male and female police officers by rank, Canada, 1986 to 2012 27
9 Police officers by sex, provinces and territories, 2012 28
10 Current and constant dollar expenditures on policing, Canada, 1985 to 2011 29
11 Total expenditures on policing, 2011 30
Statistics Canada – Catalogue no. 85-225-X 3
Police Resources in Canada – 2012
Table of contents – continued
12 Police personnel in municipal police services 31
12-1 Newfoundland and Labrador, 2012 31
12-2 Prince Edward Island, 2012 32
12-3 Nova Scotia, 2012 33
12-4 New Brunswick, 2012 34
12-5 Quebec, 2012 35
12-6 Ontario, 2012 37
12-7 Manitoba, 2012 41
12-8 Saskatchewan, 2012 42
12-9 Alberta, 2012 43
12-10 British Columbia, 2012 45
12-11 Yukon, 2012 47
12-12 Northwest Territories, 2012 48
Data quality, concepts and methodology
Methodology 49
Appendix
I Census metropolitan area (CMA) reference list 51
Charts
1. Crime rate and police strength per 100,000 population, Canada, 1962 to 2012 7
2. Police strength, selected countries, 2002 and 2012 9
3. Police strength, Canada, provinces and territories, 2012 10
4. Police strength, census metropolitan areas, 2012 11
5. Age distribution of police officers, Canada, 2011 13
6. Female officers as a percentage of total police officers, Canada, 1986 to 2012 14
4 Statistics Canada – Catalogue no. 85-225-X
Highlights
• On May 15, 2012, there were 69,539 police officers in Canada, 115 more officers than in 2011. Expressed as arate, police strength declined slightly (-1.0%) from the previous year, to 199 officers per 100,000 population.
• Despite small declines in recent years, police strength in Canada has generally been increasing over the pastdecade, up 7% since 2002. Over the same period, both the volume and severity of police reported crime havecontinued to decline.
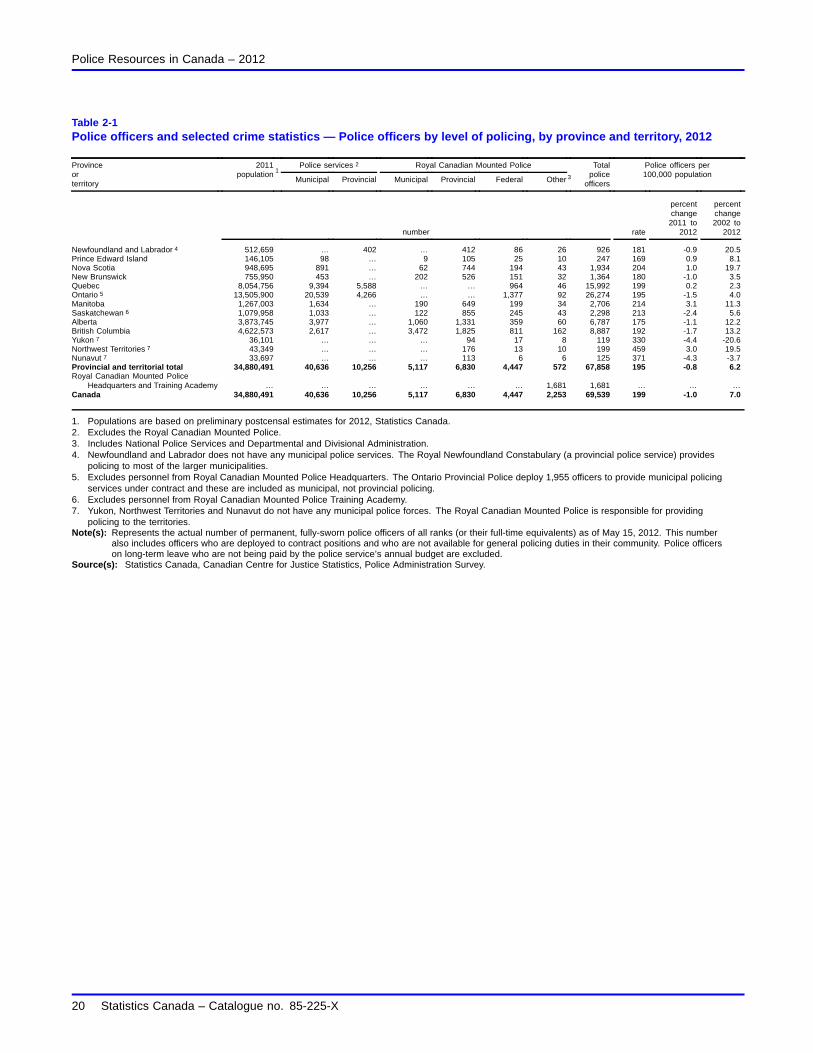
• Manitoba replaced Saskatchewan in 2012 as the province with the most officers per 100,000 population(214 and 213 officers per 100,000 population, respectively). Prince Edward Island (169) and Alberta (175)reported the fewest officers per 100,000 population.
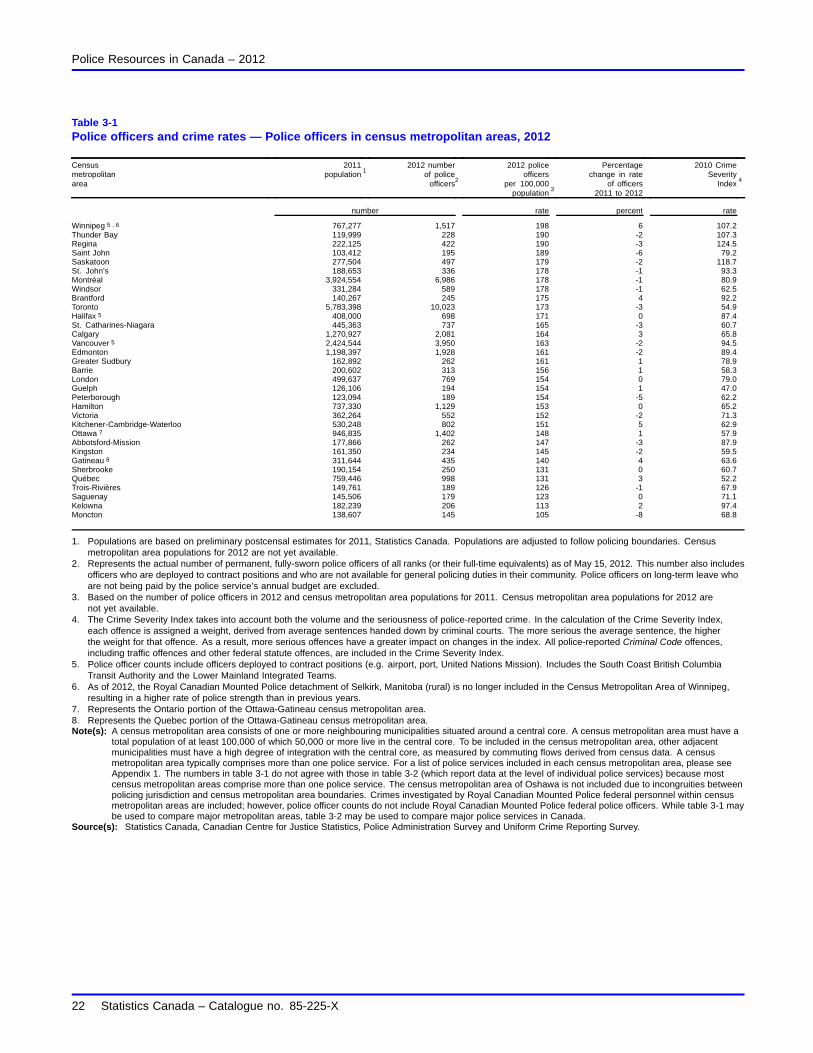
• The highest rates of police strength in 2012 were reported in the census metropolitan areas of Winnipeg, ThunderBay, Regina and Saint John. The lowest were reported in Moncton and Kelowna.
• The majority of police officers (65%) who left their police service in 2011 did so to take their retirement.About 1,300 police officers retired in 2011, accounting for 2% of all officers. That year, one in ten officers inCanada were eligible to retire.
• Of new police officers hired by police services in 2011, about four in five were new recruits, with the remainderhired from another police service.
• The trend towards more women in policing continued in 2012. For the second year in a row the number of femaleofficers increased, while the number of male officers declined. Females now account for 20% of all police officers,compared to 15% in 2002.
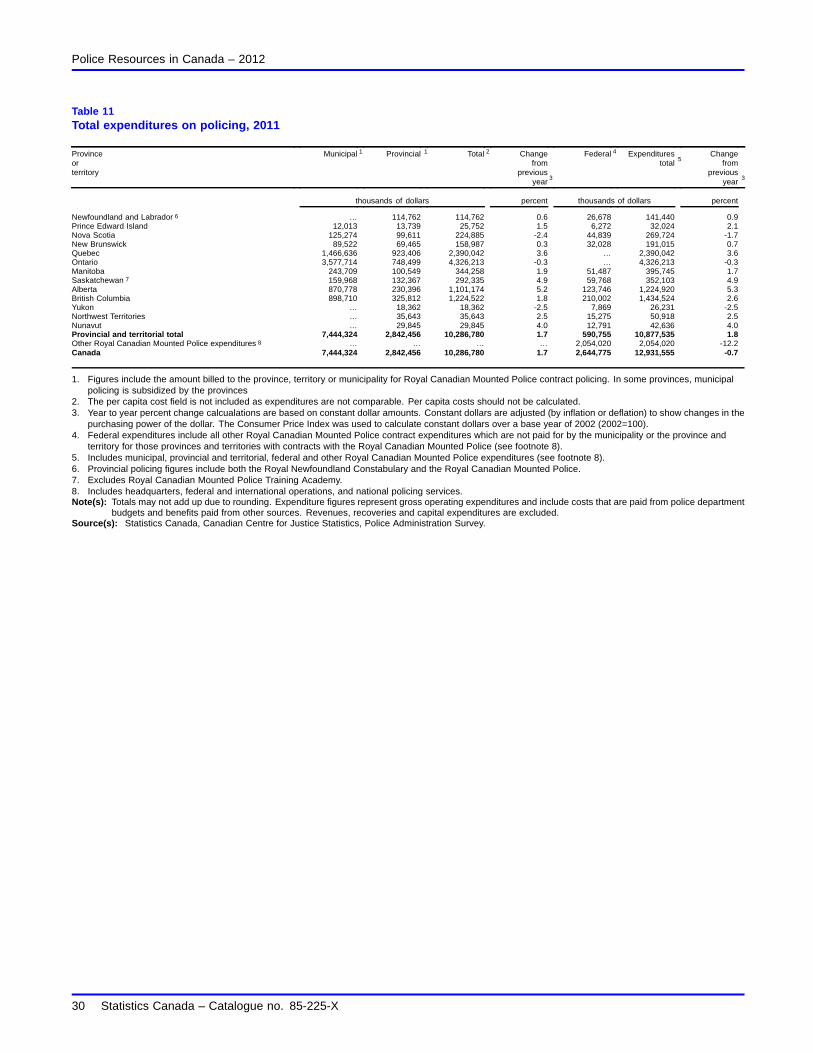
• Expenditures on policing totalled $12.9 billion in 2011. Controlling for inflation, this marks a decrease of 0.7%from the previous year, the first decline in spending since 1996.
Statistics Canada – Catalogue no. 85-225-X 5
Police Resources in Canada, 2012
In Canada, information on police personnel and expenditures is collected by Statistics Canada through the annualPolice Administration Survey. Using data reported by each police service in Canada, this report provides details onpolice personnel and expenditures at the national, provincial and municipal levels. For the first time, in 2012, a newSupplemental Survey was added to collect detailed information on police hirings, retirements, eligibility to retire and,where available, visible minority status.
Data presented in this report represent two distinct time periods. Most of the information on police personnel is basedon a “snapshot date” of May 15, 2012, while data on hirings, departures and expenditures represent the calendaryear ending December 31, 2011 (or March 31, 2012 for those police services operating on a fiscal year).
The concept “police strength” is used throughout this report. Police strength refers to the number of police officersper 100,000 people in a given area (Canada, a province or territory, a Census Metropolitan Area or a policejurisdiction), and is used to enable comparisons over time and geography.
Slight decline in police strength
On May 15, 2012, there were 69,539 police officers in Canada, 115 more officers than in 2011. Expressed as a rate,police strength declined slightly (-1.0%) from the previous year, to 199 officers per 100,000 population (Table 1).
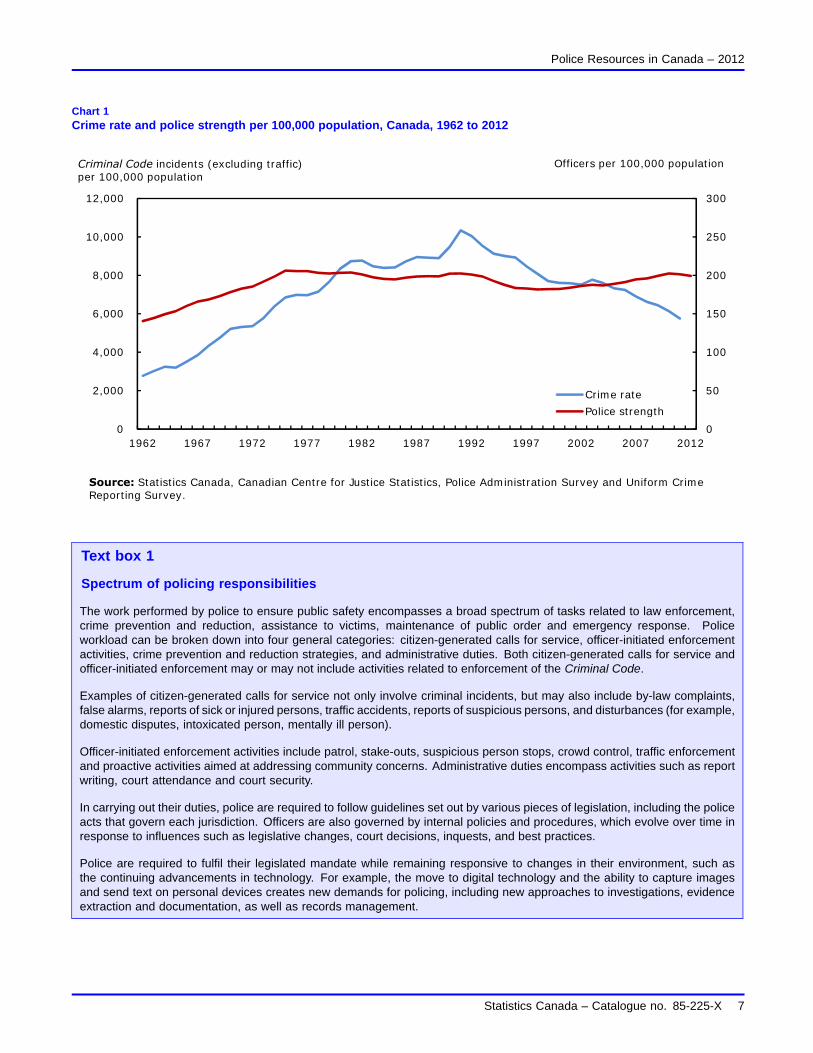
While police strength has been generally increasing since the late 1990s, the police-reported crime rate hascontinued to decline (Brennan, 2012) (Chart 1). In 2011, the latest year for which data are available, both thevolume and severity of police-reported crime decreased. The 2011 crime rate was 24% lower than in 2001 and wasat its lowest point since 1972 (Brennan, 2012). Similarly, the Crime Severity Index (CSI) was at 77.6 in 2011, 26%lower than a decade earlier and at the lowest point since data became available in 1998.1
The number of Criminal Code (excluding traffic) incidents per police officer declined by 6% in 2011. The ratioof 29 incidents per officer was the lowest since 1970. Over the past decade, the number of incidents per officer hasdecreased by 31%.
1. The Crime Severity Index (CSI) takes into account both the volume and the seriousness of crime. In the calculation of the CSI, each offence is assigned aweight, derived from average sentences handed down by criminal courts. The more serious the average sentence, the higher the weight for that offence.As a result, more serious offences have a greater impact on changes in the index. All Criminal Code offences, including traffic offences and other federalstatute offences, are included in the CSI.
6 Statistics Canada – Catalogue no. 85-225-X
Police Resources in Canada – 2012
Chart 1Crime rate and police strength per 100,000 population, Canada, 1962 to 2012
0
50
100
150
200
250
300
0
2,000
4,000
6,000
8,000
10,000
12,000
1962 1967 1972 1977 1982 1987 1992 1997 2002 2007 2012
Crime rate
Police strength
Criminal Code incidents (excluding traffic) per 100,000 population
Officers per 100,000 population
Source: Statistics Canada, Canadian Centre for Justice Statistics, Police Administration Survey and Uniform Crime Reporting Survey.
Text box 1
Spectrum of policing responsibilities
The work performed by police to ensure public safety encompasses a broad spectrum of tasks related to law enforcement,crime prevention and reduction, assistance to victims, maintenance of public order and emergency response. Policeworkload can be broken down into four general categories: citizen-generated calls for service, officer-initiated enforcementactivities, crime prevention and reduction strategies, and administrative duties. Both citizen-generated calls for service andofficer-initiated enforcement may or may not include activities related to enforcement of the Criminal Code.
Examples of citizen-generated calls for service not only involve criminal incidents, but may also include by-law complaints,false alarms, reports of sick or injured persons, traffic accidents, reports of suspicious persons, and disturbances (for example,domestic disputes, intoxicated person, mentally ill person).
Officer-initiated enforcement activities include patrol, stake-outs, suspicious person stops, crowd control, traffic enforcementand proactive activities aimed at addressing community concerns. Administrative duties encompass activities such as reportwriting, court attendance and court security.
In carrying out their duties, police are required to follow guidelines set out by various pieces of legislation, including the policeacts that govern each jurisdiction. Officers are also governed by internal policies and procedures, which evolve over time inresponse to influences such as legislative changes, court decisions, inquests, and best practices.
Police are required to fulfil their legislated mandate while remaining responsive to changes in their environment, such asthe continuing advancements in technology. For example, the move to digital technology and the ability to capture imagesand send text on personal devices creates new demands for policing, including new approaches to investigations, evidenceextraction and documentation, as well as records management.
Statistics Canada – Catalogue no. 85-225-X 7
Police Resources in Canada – 2012
In addition to the actual number of officers on staff on May 15, 2012, police services reported the number of positionsthey were authorized to fill during the year.2 The term authorized strength is used by police services to refer tothe number of positions available throughout the year based on their budget, whether or not those positions wereactually filled on that day. Examining both the “actual” and “authorized” strength together provides a more completeunderstanding of police staffing throughout the year, as not all available positions are occupied on the May 15 surveysnapshot date.
Normal changes in staffing occurring throughout the year often result in higher authorized strength numbers ascompared to actual police strength point-in-time numbers. In 2012, there were 71,855 authorized police officerpositions in Canada, about 2,000 (3%) more than the actual May 15 number of active officers. Reasons for thedifference may include officers who retired earlier in the year and who had not yet been replaced, or positions heldfor recruits planning to graduate later in the year.3 Compared to 2011, the number of authorized positions increasedby 1.2%.
Text box 2
Police strength in other countries
The United Nations Office on Drugs and Crime (UNODC) compiles a biennial report comparing rates of police strength acrossa number of countries. While the most recent UNODC report was published in 2011, some countries have released policepersonnel data for 2012 via their national statistical offices.
Among the eight countries that are included in the scope of the UNODC survey, Canada’s police strength was similar to thatof Japan and New Zealand, but well below Scotland, Australia, England and Wales and the United States (Text table 1).
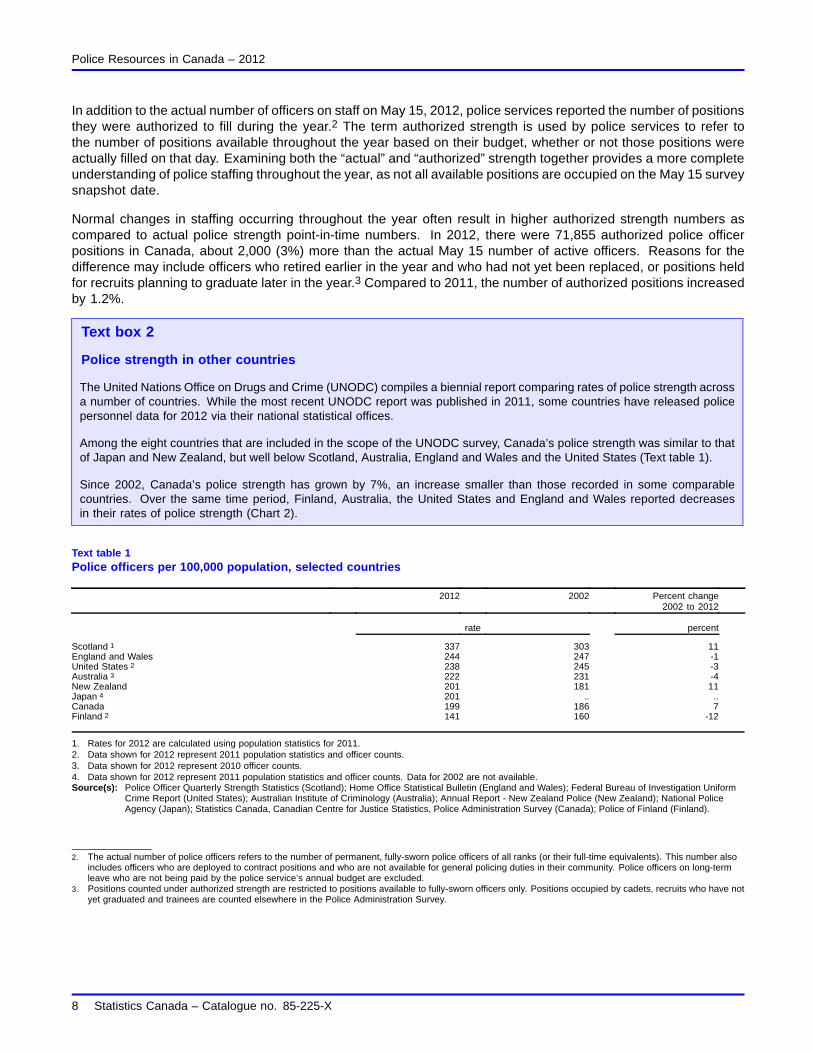
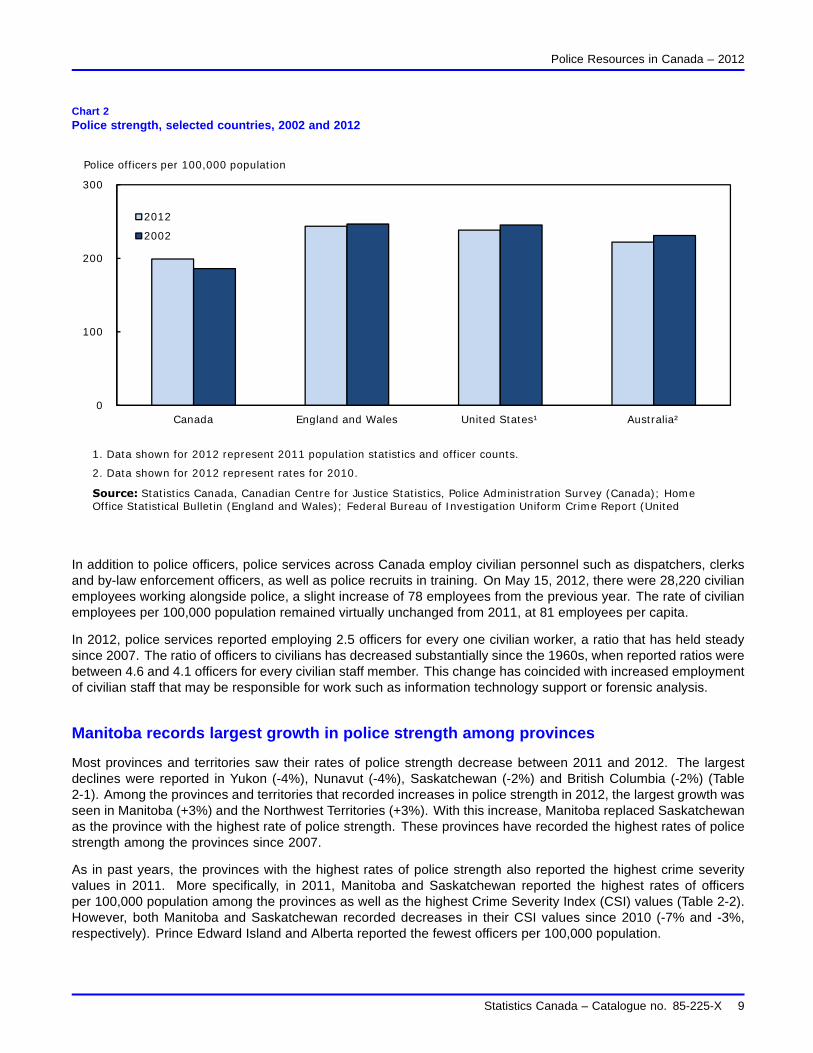
Since 2002, Canada’s police strength has grown by 7%, an increase smaller than those recorded in some comparablecountries. Over the same time period, Finland, Australia, the United States and England and Wales reported decreasesin their rates of police strength (Chart 2).
Text table 1Police officers per 100,000 population, selected countries
2012 2002 Percent change2002 to 2012
rate percent
Scotland 1 337 303 11England and Wales 244 247 -1United States 2 238 245 -3Australia 3 222 231 -4New Zealand 201 181 11Japan 4 201 .. ..Canada 199 186 7Finland 2 141 160 -12
1. Rates for 2012 are calculated using population statistics for 2011.2. Data shown for 2012 represent 2011 population statistics and officer counts.3. Data shown for 2012 represent 2010 officer counts.4. Data shown for 2012 represent 2011 population statistics and officer counts. Data for 2002 are not available.Source(s): Police Officer Quarterly Strength Statistics (Scotland); Home Office Statistical Bulletin (England and Wales); Federal Bureau of Investigation Uniform
Crime Report (United States); Australian Institute of Criminology (Australia); Annual Report - New Zealand Police (New Zealand); National PoliceAgency (Japan); Statistics Canada, Canadian Centre for Justice Statistics, Police Administration Survey (Canada); Police of Finland (Finland).
2. The actual number of police officers refers to the number of permanent, fully-sworn police officers of all ranks (or their full-time equivalents). This number alsoincludes officers who are deployed to contract positions and who are not available for general policing duties in their community. Police officers on long-termleave who are not being paid by the police service’s annual budget are excluded.
3. Positions counted under authorized strength are restricted to positions available to fully-sworn officers only. Positions occupied by cadets, recruits who have notyet graduated and trainees are counted elsewhere in the Police Administration Survey.
8 Statistics Canada – Catalogue no. 85-225-X
Police Resources in Canada – 2012
Chart 2Police strength, selected countries, 2002 and 2012
0
100
200
300
Canada England and Wales United States¹ Australia²
2012
2002
Police officers per 100,000 population
1. Data shown for 2012 represent 2011 population statistics and officer counts.
2. Data shown for 2012 represent rates for 2010.
Source: Statistics Canada, Canadian Centre for Justice Statistics, Police Administration Survey (Canada); Home Office Statistical Bulletin (England and Wales); Federal Bureau of Investigation Uniform Crime Report (United
country
In addition to police officers, police services across Canada employ civilian personnel such as dispatchers, clerksand by-law enforcement officers, as well as police recruits in training. On May 15, 2012, there were 28,220 civilianemployees working alongside police, a slight increase of 78 employees from the previous year. The rate of civilianemployees per 100,000 population remained virtually unchanged from 2011, at 81 employees per capita.
In 2012, police services reported employing 2.5 officers for every one civilian worker, a ratio that has held steadysince 2007. The ratio of officers to civilians has decreased substantially since the 1960s, when reported ratios werebetween 4.6 and 4.1 officers for every civilian staff member. This change has coincided with increased employmentof civilian staff that may be responsible for work such as information technology support or forensic analysis.
Manitoba records largest growth in police strength among provinces
Most provinces and territories saw their rates of police strength decrease between 2011 and 2012. The largestdeclines were reported in Yukon (-4%), Nunavut (-4%), Saskatchewan (-2%) and British Columbia (-2%) (Table2-1). Among the provinces and territories that recorded increases in police strength in 2012, the largest growth wasseen in Manitoba (+3%) and the Northwest Territories (+3%). With this increase, Manitoba replaced Saskatchewanas the province with the highest rate of police strength. These provinces have recorded the highest rates of policestrength among the provinces since 2007.
As in past years, the provinces with the highest rates of police strength also reported the highest crime severityvalues in 2011. More specifically, in 2011, Manitoba and Saskatchewan reported the highest rates of officersper 100,000 population among the provinces as well as the highest Crime Severity Index (CSI) values (Table 2-2).However, both Manitoba and Saskatchewan recorded decreases in their CSI values since 2010 (-7% and -3%,respectively). Prince Edward Island and Alberta reported the fewest officers per 100,000 population.
Statistics Canada – Catalogue no. 85-225-X 9

Police Resources in Canada – 2012
In 2012, Yukon, the Northwest Territories and Nunavut continued to report rates of police strength well above thoserecorded in the provinces (Chart 3). The CSI values recorded in the territories were also above those in the rest ofthe country, though each recorded a decrease in 2011.
Chart 3Police strength, Canada, provinces and territories, 2012
0
50
100
150
200
250
300
350
400
450
500
N.L. P.E.I. N.S. N.B. Que. Ont. Man. Sask. Alta. B.C. Yk. N.W.T. Nvt.
Canada (199)
Police officers per 100,000 population
Source: Statistics Canada, Canadian Centre for Justice Statistics, Police Administration Survey.
Provinces
Police strength decreases in New Brunswick census metropolitan areas
Police strength decreased in the majority of Canada’s census metropolitan areas (CMAs) in 2012 (Table 3-1).4 Thelargest decreases in the rate were recorded in the New Brunswick CMAs of Moncton (-8%) and Saint John (-6%).With the recent decrease, Moncton became the CMA with the lowest rate of police strength. Prior to 2012, Kelownahad reported the lowest rate police strength among CMAs for several consecutive years.
However, a number of CMAs experienced increases in their rates of police strength in 2012. While the largestincrease was in Winnipeg (+6%), the increase was partially due to a change in the police service boundaries of onedetachment operating within that CMA. Kitchener-Cambridge-Waterloo also recorded a notable increase (+5%).
Winnipeg replaced Saint John in 2012 as the CMA with the highest rate of police strength (Chart 4). Saint John hadreported the highest rate of police strength among CMAs since 2010.
Those CMAs with the highest rates of police strength in 2012 were also among those with the highest crime severityvalues.5 The three CMAs with the highest rates of police strength in 2012 – Winnipeg, Thunder Bay and Regina –ranked fourth, third and first, respectively, in terms of crime severity in 2011.6
4. A census metropolitan area (CMA) consists of one or more neighbouring municipalities situated around a central core. A CMA must have a total populationof at least 100,000 of which 50,000 or more live in the central core. To be included in the CMA, other adjacent municipalities must have a high degree ofintegration with the central core, as measured by commuting flows derived from census data. A CMA typically comprises more than one police service. Fora list of police services included in each CMA, please see Appendix 1.
5. Many factors can influence police-reported crime statistics including: local police service policies, procedures and enforcement practices; changes in variousdemographic, social and economic factors; neighbourhood characteristics; technological advancements; legislative amendments; and public perception andattitudes. Comparisons across census metropolitan areas should be made with caution.
6. For information on police personnel, Crime Severity Index values weighted clearance rates in Yellowknife and Whitehorse, please refer to Tables 12-11and 12-12 of this report.
10 Statistics Canada – Catalogue no. 85-225-X

Police Resources in Canada – 2012
Chart 4Police strength, census metropolitan areas, 2012
Victoria
Vancouver
Abbotsford-Mission
Kelowna
Edmonton
Calgary
Saskatoon
Regina
Winnipeg
Thunder Bay
Greater Sudbury
Barrie
Windsor
London
Guelph
Brantford
Kitchener-Cambridge-Waterloo
St. Catharines-Niagara
Hamilton
Toronto
Peterborough
Kingston
Ottawa
Gatineau
Montréal
Trois-Rivières
Sherbrooke
Québec
Saguenay
Saint John
Moncton
Halifax
St. John's
Census metropolitan area
0 50 100 150 200 250
Victoria
Vancouver
Abbotsford-Mission
Police officers per 100,000 population
Source: Statistics Canada, Canadian Centre for Justice Statistics, Police Administration Survey.
Statistics Canada – Catalogue no. 85-225-X 11

Police Resources in Canada – 2012
One in ten officers eligible for retirement
The potential impact of retirements and other types of workforce mobility have become a concern for executivesat many Canadian police services (Lewis, 2011; Royal Canadian Mounted Police, 2010). For the first time,information on hirings, departures and eligibility to retire among Canada’s police officers was collected through thenew Supplemental questionnaire to the Police Administration Survey. Based on information on workforce mobilityduring 2011,7 the survey measured the number of positions left vacant as well as the number of positions filled byincoming police officers.
Across Canada, the majority of police officers who left their police service in 2011 did so to take their retirement, withjust under 1,300 or 65% of departing officers retiring (Table 4).8 Officers departing for reasons of retirement madeup approximately 2% of the police officers employed by the services reporting this information. Almost half (49%)of all officers who retired had between 30 and 35 years of service, while over one-quarter (26%) had over 35 yearsof service.
Among the provinces, the proportion of departing police officers who left for reasons of retirement was highest inNova Scotia (75%) and Prince Edward Island (73%). Meanwhile, reporting police services in Alberta and Manitobarecorded the highest percentages of officers leaving their services for reasons other than retirement (50% and 49%,respectively).
The number of police officers who took their retirement was considerably smaller than the number of officers whowere eligible to do so.9 A total of 7,459 officers were eligible for retirement with full pension in 2011, representingabout one in ten (11%) police officers across Canada.10 Over half (52%) of officers who were eligible to retirein 2011 had over 30 years of service in policing (Table 5).11
While little variation was noted among provinces with respect to eligibility to retire, differences exist among policeservices. For example, the Royal Canadian Mounted Police reported that 19% of their officers were eligible to retirein 2011, while the average among non-RCMP municipal police services was 8% (Table 6). In large part, thesevariations were due to the number of senior officers on staff, as well as specific characteristics of various collectiveagreements.
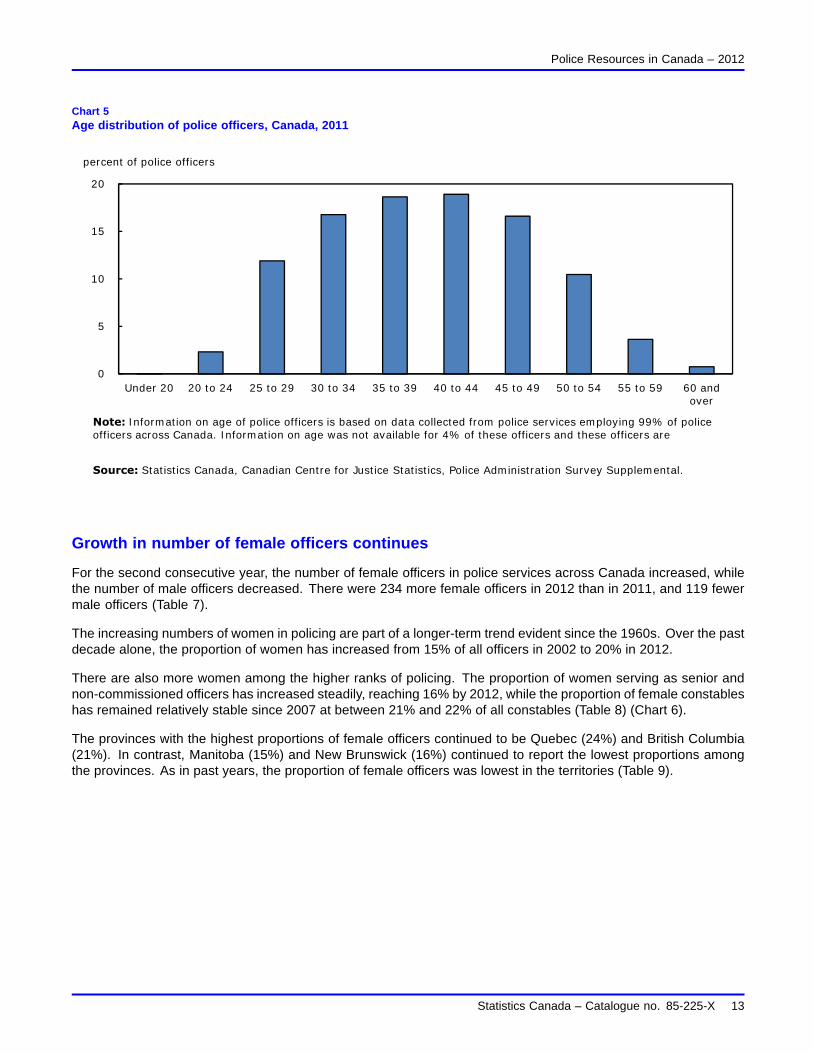
Across Canada, police officers aged 60 years and over accounted for less than 1% of all police officers, while thosebetween 50 and 60 years of age represented 15% (Chart 5). The largest cohorts were officers aged 30 to 40 years(35%) and those aged 40 to 50 years (35%). Officers aged between 20 and 30 years represented 14% of all officers,while less than 1% of officers were under 20 years of age.12
Among officers who were hired by police services during 2011 and for whom prior policing experience was known,the majority (80%) were recruit graduates.13,14 Officers who had experience with another police service made upthe remaining 20%.
7. Data on departures represent departures during the 2011 calendar year or the 2011/2012 fiscal year, depending on how individual police services choseto report the information.
8. Information on departures due to retirement is based on data collected from police services employing 98% of police officers across Canada. These policeservices were able to report their total departures, including departure for reason of retirement, but may not have been able to report details for reasons fordeparture other than retirement.
9. Information on eligibility to retire is based on data collected from police services employing 97% of police officers across Canada.10. This number may or may not include officers who did retire in 2011 (1,310 officers).11. While most police service collective agreements set the minimum years of service required for retirement with full pension at 25 years, other considerations may
sometimes apply. For instance, many agreements require a minimum age in addition to minimum years of service, while others use a formula such as the“80 factor”, where years of service plus age must equal 80.
12. Information of age of police officers is based on data collected from police services employing 99% of police officers across Canada. Information on agewas not available for 4% of these officers.
13. Information on hirings was unavailable for 1% of police officers In addition, police services employing 36% of officers were unable to provide the level ofexperience (experienced police officers or recruit graduate) of their officers at time of hire. These police services are excluded from the percentage calculations.
14. Recruit graduates include senior officers, non-commissioned officers and constables who achieved the status of a fully-sworn officer during the calendaror fiscal year prior to the year for which data are shown.
12 Statistics Canada – Catalogue no. 85-225-X
Police Resources in Canada – 2012
Chart 5Age distribution of police officers, Canada, 2011
0
5
10
15
20
Under 20 20 to 24 25 to 29 30 to 34 35 to 39 40 to 44 45 to 49 50 to 54 55 to 59 60 and over
percent of police officers
Note: Information on age of police officers is based on data collected from police services employing 99% of police officers across Canada. Information on age was not available for 4% of these officers and these officers are
Source: Statistics Canada, Canadian Centre for Justice Statistics, Police Administration Survey Supplemental.
Growth in number of female officers continues
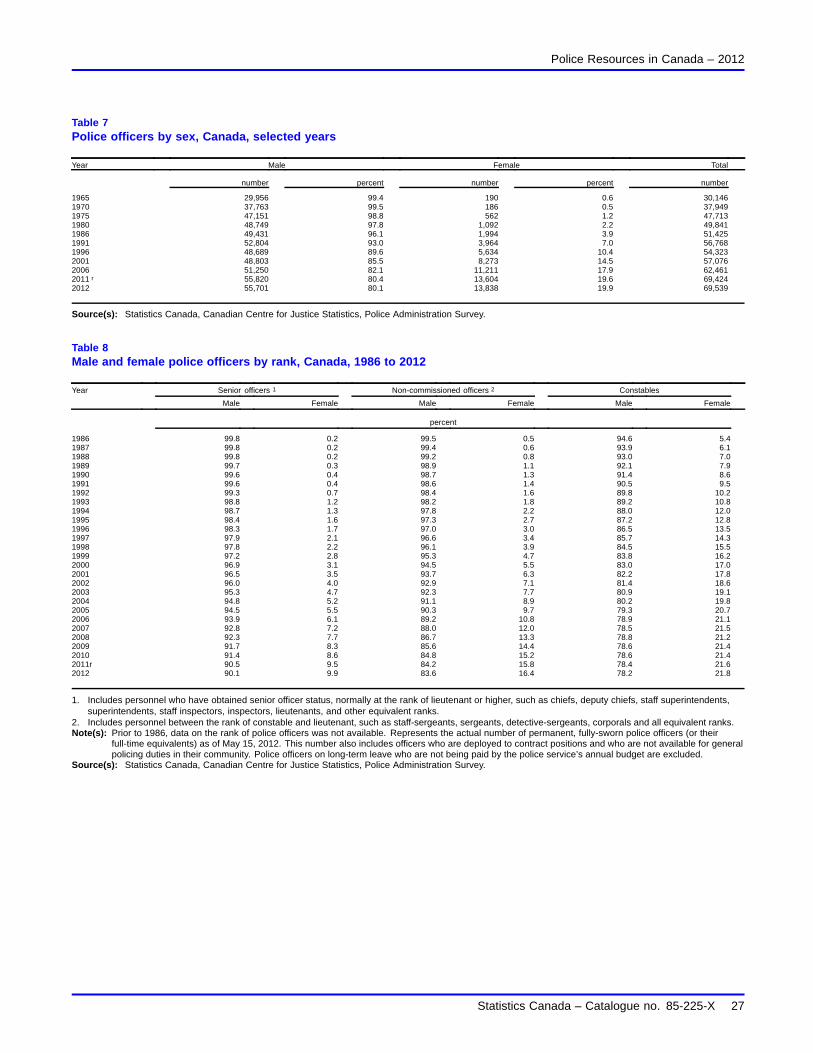
For the second consecutive year, the number of female officers in police services across Canada increased, whilethe number of male officers decreased. There were 234 more female officers in 2012 than in 2011, and 119 fewermale officers (Table 7).
The increasing numbers of women in policing are part of a longer-term trend evident since the 1960s. Over the pastdecade alone, the proportion of women has increased from 15% of all officers in 2002 to 20% in 2012.
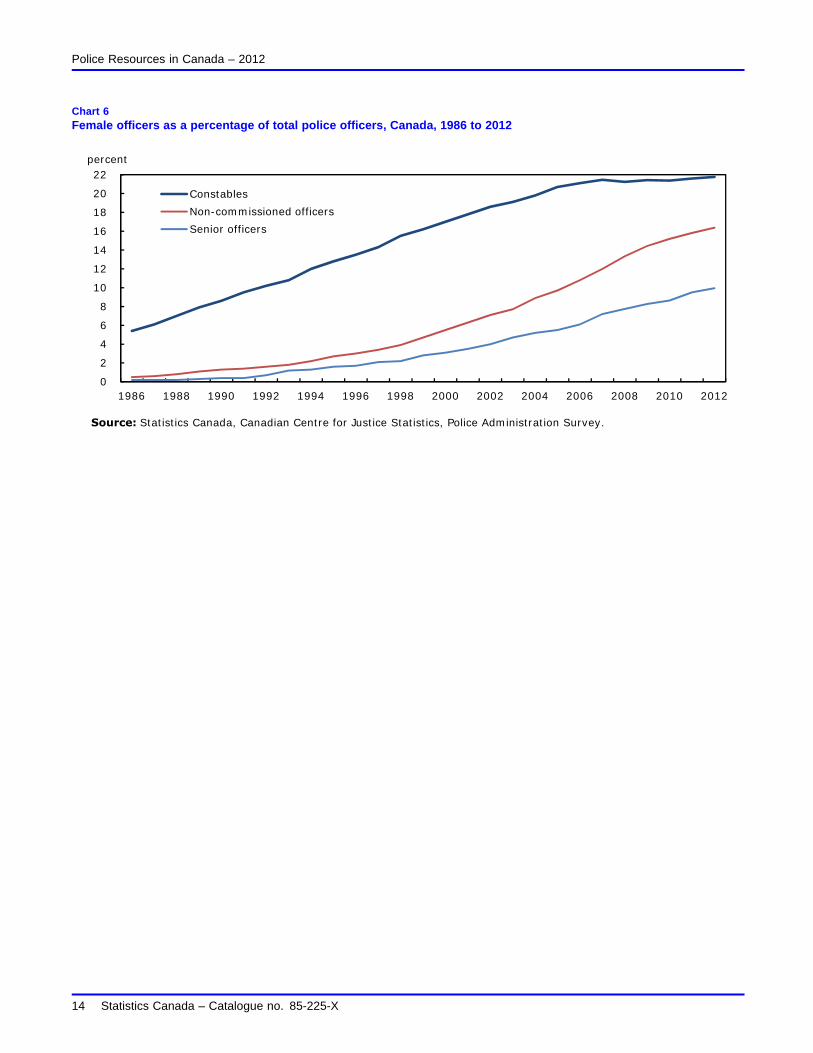
There are also more women among the higher ranks of policing. The proportion of women serving as senior andnon-commissioned officers has increased steadily, reaching 16% by 2012, while the proportion of female constableshas remained relatively stable since 2007 at between 21% and 22% of all constables (Table 8) (Chart 6).
The provinces with the highest proportions of female officers continued to be Quebec (24%) and British Columbia(21%). In contrast, Manitoba (15%) and New Brunswick (16%) continued to report the lowest proportions amongthe provinces. As in past years, the proportion of female officers was lowest in the territories (Table 9).
Statistics Canada – Catalogue no. 85-225-X 13
Police Resources in Canada – 2012
Chart 6Female officers as a percentage of total police officers, Canada, 1986 to 2012
0
2
4
6
8
10
12
14
16
18
20
22
1986 1988 1990 1992 1994 1996 1998 2000 2002 2004 2006 2008 2010 2012
Constables
Non-commissioned officers
Senior officers
percent
Source: Statistics Canada, Canadian Centre for Justice Statistics, Police Administration Survey.
14 Statistics Canada – Catalogue no. 85-225-X

Police Resources in Canada – 2012
Text box 3
Police officers self-report as Aboriginal persons or visible minorities
Data from the 2006 Census of Population show that Canada’s ethnocultural diversity is steadily increasing (StatisticsCanada, 2008). In response, some police services are looking to staff their ranks with officers who are representative ofthe communities they serve (Royal Canadian Mounted Police, 2010). The 2012 Supplemental questionnaire to the PoliceAdministration Survey asked police services to provide information on the visible minority identity of their officers.15
While the Canadian Human Rights Commission permits employers, including police services, to collect data on whether theiremployees are Aboriginal persons or members of visible minority groups, some police services in Canada choose not tocollect this information (Canadian Human Rights Commission, 2007). Those that do collect these data do so on a strictlyvoluntary basis – meaning officers can choose to disclose to their employer that they are Aboriginal or a visible minority, butare not compelled to do so.
In 2012, whether an officer was an Aboriginal person, a member of a visible minority group or Caucasian was unknown for 33%of police officers, as either the police service or the individual officer chose not to report the information.
Information was collected for the more than 46,000 police officers who voluntarily self-identified as an Aboriginal person,a member of a visible minority group or Caucasian.16 Of these officers, 87% reported being Caucasian in race or white incolour. A further 9% reported being a member of a non-Aboriginal visible minority group and 5% reported being an Aboriginalperson.17
Some variation was seen with respect to self-reported visible minority status for experienced officers versus recruit graduates.A larger proportion of experienced officers reported being members of a visible minority than did recruit graduates: amongexperienced officers, 11% reported being a visible minority, compared to 4% of recruit graduates. The proportions ofexperienced officers and recruit graduates who self-identified as Aboriginal persons showed less variation, with 4% of recruitgraduates and 3% of experienced officers self-identifying as Aboriginal persons.
Weighted clearance rate stable in 2011
Clearance rates are one measure of police performance. A criminal incident is said to be cleared when a policeinvestigation leads to the identification of an accused person against whom charges can be laid or recommended bypolice. Incidents can be cleared by the laying of a charge or by other means (e.g., through diversionary programsand other extrajudicial measures). The clearance rate represents the proportion of all crimes that were successfullycleared.
Factors unrelated to the effectiveness of police can impact a police service’s clearance rate. For instance, minorthefts and mischief are crimes that are more numerous and more difficult to solve than serious, violent crimes; thus,a police service with a higher proportion of these less serious crimes may have a lower clearance rate. For thisreason, the weighted clearance rate was developed to provide a more meaningful picture of crime solved by policeservices.
Using concepts similar to the Crime Severity Index, the weighted clearance rate assigns values to crimes accordingto their seriousness, with more serious crimes being given a higher statistical weight.18 However, comparisonsbetween police services on the basis of weighted clearance rates should be made with caution, due to factors suchas internal policies and procedures, and resources.
15. Definitions related to visible minority status found on the Supplemental to the Police Administration Survey questionnaire are based on those used by theCensus and the Employment Equity Act. Aboriginal peoples refers to whether the police officer is an Aboriginal person of Canada, that is, First Nations (NorthAmerican Indian), Métis or Inuit. Visible minority refers to persons, other than Aboriginal peoples, who are non-Caucasian in race or non-white in colour. Nonvisible minority populations are persons who are Caucasian in race or white in colour.
16. Though the definitions for Aboriginal person and visible minority specify that Aboriginal people be counted separately from members of visible minority groups, itis possible that some individuals were counted in both categories. The number of individuals counted in both categories is estimated to be less than 1%.
17. Percentages add to more than 100 due to rounding.18. Applying this concept to clearance rates means that, for example, the clearance of a homicide, robbery or break and enter receives a higher weight than the
clearance of less serious offences such as minor theft, mischief and disturbing the peace. For more information on the Crime Severity Index, see footnote 1.
Statistics Canada – Catalogue no. 85-225-X 15

Police Resources in Canada – 2012
Canada recorded a national weighted clearance rate of 39.4% in 2011 (the most recent year for which data areavailable), similar to the previous year. The weighted clearance rate has generally been increasing since 1998 whenit stood at 34.1%. Among municipal police services operating in areas with populations of 100,000 or more, thehighest weighted clearance rates in 2011 were reported by Durham Regional (49%), Kingston (47%), London (47%)and Trois-Rivières (46%).
Expenditures by Canadian police services totalled $12.9 billion in 2011
Police service operating expenditures totalled $12.9 billion in 2011. After adjusting for inflation, constant dollarspending declined slightly (-0.7%) from the previous year. This marked the first time since 1996 that constant dollarspending on policing has decreased (Table 10).
The decrease at the Canada level was driven by the conclusion of RCMP expenditures on national special eventssuch as the 2010 Olympic Games and G8/G20 Summits.
After controlling for inflation, Yukon (-2.5%) and Nova Scotia (-1.7%) were the only jurisdictions to report a decreasein spending. Spending increased the most in Alberta (+5.3%) and Saskatchewan (+4.9%) (Table 11).
Summary
Canada’s rate of police strength, defined as the number of police officers per 100,000 population, decreased slightlyin 2012. Most provinces and territories also reported decreases in police strength. Police strength in Canada hasgenerally been increasing since the late 1990s, while the volume and severity of crime has continued to decline.
Most police officers who left their police service did so to take their retirement. While 1 in 10 police officers wereeligible to retire in 2011, comparatively few actually did so.
The trend towards more women in policing continued in 2012. Female officers grew in number faster than their malecounterparts, especially within the higher ranks.
Expenditures on policing totalled $12.9 billion in 2011, a decrease of 0.7% from the previous year. This was the firstconstant-dollar spending decrease recorded since 1996.
References
Brennan, Shannon. 2012. "Police-reported crime statistics in Canada, 2011." Juristat. Statistics Canada Catalogueno. 85-002-X. (accessed October 4, 2012).
Canadian Human Rights Commission. 2007. A Guide to Screening and Selection in Employment. Minister of PublicWorks and Government Services. Catalogue no. HR21-21/2007E-PDF. (accessed October 10, 2012).
Lewis, Commissioner Chris D. 2011. "Effective recruitment, crime prevention and leadership development are OPPpriorities." Canadian Police Chief Magazine. Winter 2011. (accessed October 9, 2012).
Royal Canadian Mounted Police. 2010. National Recruitment Program Audit: Final Report. (accessedOctober 9, 2012).
Statistics Canada. 2008. Canada’s Ethnocultural Mosaic, 2006 Census. Statistics Canada Catalogue no. 97-562-X.(accessed October 10, 2012).
16 Statistics Canada – Catalogue no. 85-225-X
Related products
Selected CANSIM tables from Statistics Canada
254-0002 Trends in police personnel for Canada, provinces and territories, annual
Selected surveys from Statistics Canada
3301 Police Administration Survey
Selected summary tables from Statistics Canada
• Police officers, by province and territory
• Justice spending
Statistics Canada – Catalogue no. 85-225-X 17

Statistical tables

Police Resources in Canada – 2012
Table 1Trends in police personnel and expenditures, Canada, 1962 to 2012
Police officers 1 Civilian personnel 2Year
Total Per100,000
population
Percentagechange in
rate
Total Per100,000
population
Percentagechange in
rate
Totalpersonnel
Policeto
civilians
Totalexpen-ditures
3
CriminalCode
incidents4
Incidentsper
officer
Weightedclearance
rate5
number rate percent number rate percent number ratiodollars
(thousands) number rate
1962 26,129 140.6 … 5,699 30.7 … 31,828 4.6 … 514,986 19.7 ..1963 27,333 144.4 2.7 5,935 31.4 2.3 33,268 4.6 … 572,105 20.9 ..1964 28,823 149.4 3.5 6,655 34.5 9.9 35,478 4.3 … 626,038 21.7 ..1965 30,146 153.5 2.7 7,133 36.3 5.2 37,279 4.2 … 628,418 20.8 ..1966 32,086 160.3 4.4 7,583 37.9 4.4 39,669 4.2 … 702,809 21.9 ..1967 33,792 165.8 3.4 8,018 39.3 3.7 41,810 4.2 … 784,568 23.2 ..1968 34,887 168.5 1.6 8,351 40.3 2.5 43,238 4.2 … 897,530 25.7 ..1969 36,342 173.0 2.7 8,963 42.7 6.0 45,305 4.1 … 994,790 27.4 ..1970 37,949 178.2 3.0 9,936 46.7 9.4 47,885 3.8 … 1,110,066 29.3 ..1971 40,148 182.8 2.6 10,597 48.3 3.4 50,745 3.8 … 1,166,458 29.1 ..1972 41,214 185.5 1.5 11,762 52.9 9.5 52,976 3.5 … 1,189,805 28.9 ..1973 43,142 191.8 3.4 12,297 54.7 3.4 55,439 3.5 … 1,298,551 30.1 ..1974 45,276 198.5 3.5 12,085 53.0 -3.1 57,361 3.7 … 1,456,885 32.2 ..1975 47,713 206.2 3.9 13,794 59.6 12.5 61,507 3.5 … 1,585,805 33.2 ..1976 48,213 205.6 -0.3 14,377 61.3 2.9 62,590 3.4 … 1,637,704 34.0 ..1977 48,764 205.5 0.0 15,231 64.2 4.7 63,995 3.2 … 1,654,024 33.9 ..1978 48,705 203.2 -1.1 15,749 65.7 2.3 64,454 3.1 … 1,714,300 35.2 ..1979 48,990 202.4 -0.4 15,001 62.0 -5.6 63,991 3.3 … 1,855,271 37.9 ..1980 49,841 203.3 0.4 16,410 66.9 7.9 66,251 3.0 … 2,045,398 41.0 ..1981 50,563 203.7 0.2 16,999 68.5 2.4 67,562 3.0 … 2,168,202 42.9 ..1982 50,539 201.2 -1.2 17,738 70.6 3.1 68,277 2.8 … 2,203,665 43.6 ..1983 50,081 197.4 -1.9 17,342 68.4 -3.1 67,423 2.9 … 2,148,633 42.9 ..1984 50,010 195.3 -1.1 17,503 68.4 0.0 67,513 2.9 … 2,147,656 42.9 ..1985 50,351 194.8 -0.3 17,702 68.5 0.1 68,053 2.8 … 2,174,175 43.2 ..1986 51,425 197.0 1.1 18,273 70.0 2.2 69,698 2.8 3,771,205 2,277,749 44.3 ..1987 52,510 198.5 0.8 19,558 73.9 5.6 72,068 2.7 4,027,809 2,368,958 45.1 ..1988 53,312 199.0 0.3 19,407 72.4 -2.0 72,719 2.7 4,389,414 2,390,008 44.8 ..1989 54,211 198.7 -0.2 19,526 71.6 -1.1 73,737 2.8 4,684,760 2,425,936 44.7 ..1990 56,034 202.3 1.8 19,259 69.5 -2.9 75,293 2.9 5,247,646 2,627,197 46.9 ..1991 56,768 202.5 0.1 19,440 69.4 -0.1 76,208 2.9 5,426,887 2,898,989 51.1 ..1992 56,992 200.9 -0.8 20,059 70.7 1.9 77,051 2.8 5,716,833 2,847,981 50.0 ..1993 56,901 198.4 -1.2 19,956 69.6 -1.6 76,857 2.9 5,790,165 2,735,623 48.1 ..1994 55,859 192.6 -2.9 19,492 67.2 -3.4 75,351 2.9 5,783,656 2,646,209 47.4 ..1995 55,008 187.7 -2.5 19,259 65.7 -2.2 74,267 2.9 5,808,607 2,639,654 48.0 ..1996 54,323 183.5 -2.2 19,603 66.2 0.8 73,926 2.8 5,856,055 2,644,893 48.7 ..1997 54,719 183.0 -0.3 19,679 65.8 -0.6 74,398 2.8 5,989,022 2,534,766 46.3 ..1998 54,763 181.6 -0.8 19,383 64.3 -2.3 74,146 2.8 6,209,756 2,440,230 44.6 34.11999 55,321 182.0 0.2 20,168 66.3 3.1 75,489 2.7 6,395,380 2,339,376 42.3 35.22000 55,954 182.3 0.2 19,907 64.9 -2.1 75,861 2.8 6,798,531 2,334,451 41.7 35.52001 57,076 184.0 0.9 19,982 64.4 -0.8 77,058 2.9 7,269,977 2,353,330 41.3 35.02002 58,422 186.3 1.3 20,732 66.1 2.7 79,154 2.8 7,827,195 2,355,322 40.3 34.52003 59,412 187.8 0.8 21,476 67.9 2.7 80,888 2.8 8,324,176 2,458,482 41.4 33.52004 59,800 187.2 -0.3 22,212 69.5 2.5 82,012 2.7 8,758,213 2,427,370 40.6 33.62005 61,026 189.3 1.1 23,391 72.5 4.3 84,417 2.6 9,281,879 2,361,974 38.7 34.62006 62,461 191.7 1.3 23,911 73.4 1.2 86,372 2.6 9,877,071 2,359,804 37.8 35.72007 r 64,134 194.8 1.8 25,295 76.8 4.9 89,429 2.5 10,544,771 2,271,754 35.4 36.52008 r 65,283 195.9 0.6 25,630 76.9 0.1 90,913 2.5 11,449,955 2,204,643 33.8 37.92009 r 67,243 199.4 1.8 27,056 80.2 4.3 94,299 2.5 12,314,197 2,172,960 32.3 38.62010 r 69,068 202.4 1.5 27,357 80.2 -0.1 96,425 2.5 12,651,596 2,094,875 30.3 39.62011 r 69,424 201.3 -0.5 28,142 81.6 1.8 97,566 2.5 12,931,555 1,984,916 28.6 39.42012 69,539 199.4 -1.0 28,220 80.9 -0.9 97,759 2.5 .. .. .. ..
1. Represents the actual number of permanent, fully-sworn police officers of all ranks (or their full-time equivalents). This number also includes officers who aredeployed to contract positions and who are not available for general policing duties in their community. Police officers on long-term leave who are not beingpaid by the police service’s annual budget are excluded.
2. Counts include civilian and other personnel (e.g., clerical, dispatch, management, cadets, special constables, security officers, school crossing guards, by-lawenforcement officers) on the police department’s payroll as of May 15.
3. Expenditures amounts are shown in current dollars, which are not adjusted for inflation or deflation. Total operating expenditures include salaries, wages,benefits, and other operating expenses that are paid from the police service budget, as well as benefits paid from other government sources. Revenues,recoveries, and those costs that fall under a police service’s capital expenditures are excluded.
4. Data extracted from the Uniform Crime Reporting Survey, Canadian Centre for Justice Statistics. Excludes Criminal Code traffic incidents.5. Criminal incidents can either be cleared by charge or cleared otherwise (for example, through diversionary programs and other extrajudicial means in
instances where a charge could otherwise be laid). The weighted clearance rate is based on the same principle used to create the police-reported CrimeSeverity Index, whereby more serious offences are assigned a higher weight than less serious offences. Applying this concept to clearance rates meansthat, for example, the clearance of a homicide, robbery or break and enter receives a higher weight than the clearance of less serious offences such asminor theft, mischief and disturbing the peace.
Note(s): A new version of the Police Administration Survey was implemented in 1986. To maintain historical continuity, figures prior to 1986 have been adjusted.Source(s): Statistics Canada, Canadian Centre for Justice Statistics, Police Administration Survey and Uniform Crime Reporting Survey.
Statistics Canada – Catalogue no. 85-225-X 19
Police Resources in Canada – 2012
Table 2-1Police officers and selected crime statistics — Police officers by level of policing, by province and territory, 2012
Police services 2 Royal Canadian Mounted PoliceProvinceorterritory
2011population
1
Municipal Provincial Municipal Provincial Federal Other 3
Totalpolice
officers
Police officers per100,000 population
number rate
percentchange
2011 to2012
percentchange2002 to
2012
Newfoundland and Labrador 4 512,659 … 402 … 412 86 26 926 181 -0.9 20.5Prince Edward Island 146,105 98 … 9 105 25 10 247 169 0.9 8.1Nova Scotia 948,695 891 … 62 744 194 43 1,934 204 1.0 19.7New Brunswick 755,950 453 … 202 526 151 32 1,364 180 -1.0 3.5Quebec 8,054,756 9,394 5,588 … … 964 46 15,992 199 0.2 2.3Ontario 5 13,505,900 20,539 4,266 … … 1,377 92 26,274 195 -1.5 4.0Manitoba 1,267,003 1,634 … 190 649 199 34 2,706 214 3.1 11.3Saskatchewan 6 1,079,958 1,033 … 122 855 245 43 2,298 213 -2.4 5.6Alberta 3,873,745 3,977 … 1,060 1,331 359 60 6,787 175 -1.1 12.2British Columbia 4,622,573 2,617 … 3,472 1,825 811 162 8,887 192 -1.7 13.2Yukon 7 36,101 … … … 94 17 8 119 330 -4.4 -20.6Northwest Territories 7 43,349 … … … 176 13 10 199 459 3.0 19.5Nunavut 7 33,697 … … … 113 6 6 125 371 -4.3 -3.7Provincial and territorial total 34,880,491 40,636 10,256 5,117 6,830 4,447 572 67,858 195 -0.8 6.2Royal Canadian Mounted Police
Headquarters and Training Academy … … … … … … 1,681 1,681 … … …Canada 34,880,491 40,636 10,256 5,117 6,830 4,447 2,253 69,539 199 -1.0 7.0
1. Populations are based on preliminary postcensal estimates for 2012, Statistics Canada.2. Excludes the Royal Canadian Mounted Police.3. Includes National Police Services and Departmental and Divisional Administration.4. Newfoundland and Labrador does not have any municipal police services. The Royal Newfoundland Constabulary (a provincial police service) provides
policing to most of the larger municipalities.5. Excludes personnel from Royal Canadian Mounted Police Headquarters. The Ontario Provincial Police deploy 1,955 officers to provide municipal policing
services under contract and these are included as municipal, not provincial policing.6. Excludes personnel from Royal Canadian Mounted Police Training Academy.7. Yukon, Northwest Territories and Nunavut do not have any municipal police forces. The Royal Canadian Mounted Police is responsible for providing
policing to the territories.Note(s): Represents the actual number of permanent, fully-sworn police officers of all ranks (or their full-time equivalents) as of May 15, 2012. This number
also includes officers who are deployed to contract positions and who are not available for general policing duties in their community. Police officerson long-term leave who are not being paid by the police service’s annual budget are excluded.
Source(s): Statistics Canada, Canadian Centre for Justice Statistics, Police Administration Survey.
20 Statistics Canada – Catalogue no. 85-225-X

Police Resources in Canada – 2012
Table 2-2Police officers and selected crime statistics — Selected crime statistics, by province and territory, 2011
Provinceorterritory
Incidentsper
officer1,2
Weightedclearance
rate3
CrimeSeverity
Index4
number percent rate
Newfoundland and Labrador 35.2 34.4 74.0Prince Edward Island 37.3 33.3 65.8Nova Scotia 32.1 41.7 79.1New Brunswick 28.8 40.5 65.0Quebec 22.5 35.2 73.5Ontario 21.3 42.2 61.1Manitoba 43.4 43.7 117.5Saskatchewan 56.3 49.3 144.8Alberta 41.9 43.2 88.6British Columbia 40.3 29.7 95.1Yukon 59.4 60.1 159.2Northwest Territories 106.5 67.7 342.7Nunavut 99.9 77.6 326.1Canada 5 28.6 39.4 77.6
1. Includes police-reported incidents excluding traffic.2. Represents the actual number of permanent, fully-sworn police officers of all ranks (or their full-time equivalents) as of May 15, 2011. This number also includes
officers who are deployed to contract positions and who are not available for general policing duties in their community. Police officers on long-term leave whoare not being paid by the police service’s annual budget are excluded.
3. Criminal incidents can either be cleared by charge or cleared otherwise (for example, through diversionary programs and other extrajudicial means ininstances where a charge could otherwise be laid). The weighted clearance rate is based on the same principle used to create the police-reported CrimeSeverity Index, whereby more serious offences are assigned a higher weight than less serious offences. Applying this concept to clearance rates meansthat, for example, the clearance of a homicide, robbery or break and enter receives a higher weight than the clearance of less serious offences such asminor theft, mischief and disturbing the peace.
4. The Crime Severity Index takes into account both the volume and the seriousness of police-reported crime. In the calculation of the Crime Severity Index,each offence is assigned a weight, derived from average sentences handed down by criminal courts. The more serious the average sentence, the higherthe weight for that offence. As a result, more serious offences have a greater impact on changes in the index. All police-reported Criminal Code offences,including traffic offences and other federal statute offences, are included in the Crime Severity Index.
5. Includes Royal Canadian Mounted Police Headquarters and Training Academy.Source(s): Statistics Canada, Canadian Centre for Justice Statistics, Police Administration Survey and Uniform Crime Reporting Survey.
Statistics Canada – Catalogue no. 85-225-X 21
Police Resources in Canada – 2012
Table 3-1Police officers and crime rates — Police officers in census metropolitan areas, 2012
Censusmetropolitanarea
2011population
12012 number
of policeofficers
2
2012 policeofficers
per 100,000population
3
Percentagechange in rate
of officers2011 to 2012
2010 CrimeSeverity
Index4
number rate percent rate
Winnipeg 5 , 6 767,277 1,517 198 6 107.2Thunder Bay 119,999 228 190 -2 107.3Regina 222,125 422 190 -3 124.5Saint John 103,412 195 189 -6 79.2Saskatoon 277,504 497 179 -2 118.7St. John’s 188,653 336 178 -1 93.3Montréal 3,924,554 6,986 178 -1 80.9Windsor 331,284 589 178 -1 62.5Brantford 140,267 245 175 4 92.2Toronto 5,783,398 10,023 173 -3 54.9Halifax 5 408,000 698 171 0 87.4St. Catharines-Niagara 445,363 737 165 -3 60.7Calgary 1,270,927 2,081 164 3 65.8Vancouver 5 2,424,544 3,950 163 -2 94.5Edmonton 1,198,397 1,928 161 -2 89.4Greater Sudbury 162,892 262 161 1 78.9Barrie 200,602 313 156 1 58.3London 499,637 769 154 0 79.0Guelph 126,106 194 154 1 47.0Peterborough 123,094 189 154 -5 62.2Hamilton 737,330 1,129 153 0 65.2Victoria 362,264 552 152 -2 71.3Kitchener-Cambridge-Waterloo 530,248 802 151 5 62.9Ottawa 7 946,835 1,402 148 1 57.9Abbotsford-Mission 177,866 262 147 -3 87.9Kingston 161,350 234 145 -2 59.5Gatineau 8 311,644 435 140 4 63.6Sherbrooke 190,154 250 131 0 60.7Québec 759,446 998 131 3 52.2Trois-Rivières 149,761 189 126 -1 67.9Saguenay 145,506 179 123 0 71.1Kelowna 182,239 206 113 2 97.4Moncton 138,607 145 105 -8 68.8
1. Populations are based on preliminary postcensal estimates for 2011, Statistics Canada. Populations are adjusted to follow policing boundaries. Censusmetropolitan area populations for 2012 are not yet available.
2. Represents the actual number of permanent, fully-sworn police officers of all ranks (or their full-time equivalents) as of May 15, 2012. This number also includesofficers who are deployed to contract positions and who are not available for general policing duties in their community. Police officers on long-term leave whoare not being paid by the police service’s annual budget are excluded.
3. Based on the number of police officers in 2012 and census metropolitan area populations for 2011. Census metropolitan area populations for 2012 arenot yet available.
4. The Crime Severity Index takes into account both the volume and the seriousness of police-reported crime. In the calculation of the Crime Severity Index,each offence is assigned a weight, derived from average sentences handed down by criminal courts. The more serious the average sentence, the higherthe weight for that offence. As a result, more serious offences have a greater impact on changes in the index. All police-reported Criminal Code offences,including traffic offences and other federal statute offences, are included in the Crime Severity Index.
5. Police officer counts include officers deployed to contract positions (e.g. airport, port, United Nations Mission). Includes the South Coast British ColumbiaTransit Authority and the Lower Mainland Integrated Teams.
6. As of 2012, the Royal Canadian Mounted Police detachment of Selkirk, Manitoba (rural) is no longer included in the Census Metropolitan Area of Winnipeg,resulting in a higher rate of police strength than in previous years.
7. Represents the Ontario portion of the Ottawa-Gatineau census metropolitan area.8. Represents the Quebec portion of the Ottawa-Gatineau census metropolitan area.Note(s): A census metropolitan area consists of one or more neighbouring municipalities situated around a central core. A census metropolitan area must have a
total population of at least 100,000 of which 50,000 or more live in the central core. To be included in the census metropolitan area, other adjacentmunicipalities must have a high degree of integration with the central core, as measured by commuting flows derived from census data. A censusmetropolitan area typically comprises more than one police service. For a list of police services included in each census metropolitan area, please seeAppendix 1. The numbers in table 3-1 do not agree with those in table 3-2 (which report data at the level of individual police services) because mostcensus metropolitan areas comprise more than one police service. The census metropolitan area of Oshawa is not included due to incongruities betweenpolicing jurisdiction and census metropolitan area boundaries. Crimes investigated by Royal Canadian Mounted Police federal personnel within censusmetropolitan areas are included; however, police officer counts do not include Royal Canadian Mounted Police federal police officers. While table 3-1 maybe used to compare major metropolitan areas, table 3-2 may be used to compare major police services in Canada.
Source(s): Statistics Canada, Canadian Centre for Justice Statistics, Police Administration Survey and Uniform Crime Reporting Survey.
22 Statistics Canada – Catalogue no. 85-225-X

Police Resources in Canada – 2012
Table 3-2Police officers and crime rates — Police officers in the 30 largest municipal police services, 2012
Actual strength 3Policeservice
2011population
12012
authorizedstrength
2 2012 numberof police
officers
2012 policeofficers
per 100,000population
4
2011 CrimeSeverity
Index5
number rate
Toronto census metropolitan area police services 6
Toronto Police 2,743,738 5,574 5,568 203 70.9Peel Regional Police 1,298,905 1,937 1,911 147 50.3York Regional Police 1,069,409 1,495 1,454 136 39.4Montréal census metropolitan area police services 6
Montréal Police 1,969,242 4,597 4,480 227 99.6Longueuil Police 405,476 562 558 138 76.6Laval Police 404,046 531 547 135 70.4Vancouver census metropolitan area police services 6
Vancouver Police 7 669,867 1,327 1,352 202 103.4Surrey, Royal Canadian Mounted Police 8 450,191 641 615 137 129.9Burnaby, Royal Canadian Mounted Police 233,291 278 299 128 93.3Richmond, Royal Canadian Mounted Police 7 199,629 227 228 114 77.3Other large police servicesHalifax Regional Police 9 228,380 522 516 226 87.4Winnipeg Police 7 691,778 1,441 1,472 213 113.6Windsor Police 222,170 469 457 206 80.1Regina Police 201,030 385 385 192 130.0Saskatoon Police 233,987 435 446 191 128.8Edmonton Police 844,474 1,647 1,603 190 98.0St. John’s, Royal Newfoundland Constabulary 188,653 336 336 178 93.3Calgary Police 1,159,446 1,960 1,975 170 65.7Greater Sudbury Police 162,892 264 262 161 78.9Niagara Regional Police 445,363 704 702 158 60.3London Police 383,781 607 589 153 91.4Hamilton Police 540,234 813 820 152 76.1Gatineau Police 261,660 393 384 147 66.8Durham Regional Police 10 631,270 871 923 146 47.5Waterloo Regional Police 530,248 764 771 145 62.6Ottawa Police 909,862 1,363 1,312 144 58.6Québec Police 553,192 719 753 136 56.3Sherbrooke Regional Police 158,227 200 200 126 60.6Halton Regional Police 10 518,660 643 643 124 33.6Richelieu-Saint-Laurent Police 191,205 211 211 110 45.6
1. Populations are based on preliminary postcensal estimates for 2011, Statistics Canada. Populations are adjusted to follow policing boundaries. Populationsfor 2012 are not yet available.
2. Represents the number of fully sworn police officers the police department was allowed to employ during the calendar or fiscal year.3. Represents the actual number of permanent, fully-sworn police officers of all ranks (or their full-time equivalents) as of May 15, 2012. This number also includes
officers who are deployed to contract positions and who are not available for general policing duties in their community. Police officers on long-term leave whoare not being paid by the police service’s annual budget are excluded.
4. Based on the number of police officers in 2012 and populations for 2011. Populations are adjusted to follow policing boundaries. Populations for 2012 arenot yet available.
5. The Crime Severity Index takes into account both the volume and the seriousness of police-reported crime. In the calculation of the Crime Severity Index,each offence is assigned a weight, derived from average sentences handed down by criminal courts. The more serious the average sentence, the higherthe weight for that offence. As a result, more serious offences have a greater impact on changes in the index. All police-reported Criminal Code offences,including traffic offences and other federal statute offences, are included in the Crime Severity Index.
6. The police services listed under the Toronto, Montréal and Vancouver census metropolitan areas do not represent all the police services in these censusmetropolitan areas.
7. Police officer counts include officers deployed to contract positions (e.g. airport, port, United Nation mission).8. Included in this total are the positions that the Surrey detachment of the Royal Canadian Mounted Police authorizes for the Lower Mainland Integrated Teams.9. Crime statistics include the Royal Canadian Mounted Police Halifax District Detachment.10. Note that 62% of the crime handled by Halton Regional Police, and 30% of the crime handled by Durham Regional Police fall within Toronto census metropolitan
area boundaries.Note(s): The numbers in table 3-1 do not agree with those in table 3-2 (which report data at the level of individual police services) because most census
metropolitan areas comprise more than one police service. The census metropolitan area of Oshawa is not included due to incongruities between policingjurisdiction and census metropolitan area boundaries. Crimes investigated by Royal Canadian Mounted Police federal personnel within censusmetropolitan areas are included; however police officer counts do not include Royal Canadian Mounted Police federal police officers. While table 3-1 maybe used to compare major metropolitan areas, table 3-2 may be used to compare major police services in Canada.
Source(s): Statistics Canada, Canadian Centre for Justice Statistics, Police Administration Survey and Uniform Crime Reporting Survey.
Statistics Canada – Catalogue no. 85-225-X 23

Police Resources in Canada – 2012
Table 4Reported hirings and departures of police officers, Canada, provinces and territories, 2011/2012
Hirings 1 Departures 2Provinceorterritory
Total Experiencedpolice
officers3
Recruitgraduates
4Total Retirements Other
Net gainor loss:
hirings anddepartures
Policeofficerseligible
to retire5
number percent number percent number percent
Newfoundland and Labrador 6 .. .. .. .. .. .. .. ..Prince Edward Island 14 71 29 11 73 27 3 15.0Nova Scotia 43 80 20 57 75 25 -14 15.6New Brunswick 34 25 75 35 60 40 -1 16.8Quebec 423 26 74 396 63 37 27 12.1Ontario 647 19 81 836 69 31 -189 8.4Manitoba 190 6 94 82 51 49 108 11.1Saskatchewan 99 15 85 81 62 38 18 11.4Alberta 338 12 88 157 50 50 181 9.9British Columbia 252 29 71 252 63 37 0 10.6Yukon 2 .. .. 1 x x 1 10.9Northwest Territories 5 .. .. 1 x x 4 8.5Nunavut 3 .. .. 2 50 50 1 12.8Provincial and territorial total 7 2,050 20 80 1,911 64 36 139 10.3Royal Canadian Mounted Police Headquarters and Training Academy 1 x x 87 78 22 -86 41.5Canada 7 2,051 20 80 1,998 65 35 53 11.1
1. Information on hirings was not available for police services employing 1% of officers across Canada. In addition, police services employing 36% of officerswere unable to provide the level of experience (experienced police officers or recruit graduate) of their officers at time of hire. These police services areexcluded from the percentage calculations.
2. Information on reason for departure was not available for police services employing 2% of officers across Canada. These police services are excludedfrom the percentage calculations.
3. Includes senior officers, non-commissioned officers and constables who achieved the status of a fully-sworn officer prior to the calendar or fiscal year forwhich data are shown.
4. Includes paid police officers who achieved the status of fully-sworn police officer during the calendar or fiscal year prior to the year for which data are shown.5. Information on eligibility to retire was not available for police services employing 3% of police officers across Canada. These police services are excluded
from the percentage calculations.6. In 2012, 43% of officers in Newfoundland and Labrador were members of the Royal Newfoundland Constabulary. The Royal Newfoundland Constabulary
did not report data on hirings, departures and eligibility of officers to retire for 2011/2012. Therefore, hirings and departures data for Newfoundland andLabrador are not shown.
7. Excludes Newfoundland and Labrador.Note(s): Represents hirings, departures and eligibility to retire during the 2011 calendar or 2011/2012 fiscal year. The percent of officers eligible to retire is
calculated using these data, along with the number of fully sworn officers employed on May 15, 2012.Source(s): Statistics Canada, Canadian Centre for Justice Statistics, Police Administration Survey and Supplemental.
24 Statistics Canada – Catalogue no. 85-225-X

Police Resources in Canada – 2012
Table 5Hirings and departures of police officers by overall years of service, Canada, 2011/2012
Hirings 1 Departures 2Overallyears ofservice
Total Experiencedpolice
officers3
Recruitgraduates
4Total Retirements Other
Policeofficerseligible
to retire5
number percent number percent
Less than 5 years 1,906 48.7 99.9 291 0.4 41.4 0.15 to less than 10 years 71 25.1 0.1 125 0.2 17.7 0.110 to less than 15 years 43 15.1 0.0 92 0.6 12.2 0.115 to less than 20 years 6 2.2 0.0 41 0.5 5.1 0.220 to less than 25 years 10 3.6 0.0 131 6.0 7.7 9.125 to less than 30 years 9 3.2 0.0 270 16.9 7.4 38.530 to less than 35 years 5 1.8 0.0 678 49.2 6.1 40.635 years and over 1 0.4 0.0 355 26.1 2.5 11.2Information not available 0 … … 15 … … …Total 6 2,051 100.0 100.0 1,998 100.0 100.0 100.0
1. Information on hirings was not available for police services employing 1% of officers across Canada. In addition, police services employing 36% of officers wereunable to provide the years of service of their officers at time of hire. These officers are excluded from percentage calculations.
2. Information on reason for departure was not available for police services employing 2% of officers across Canada. These police services are excludedfrom the percentage calculations.
3. Includes senior officers, non-commissioned officers and constables who achieved the status of a fully-sworn officer prior to the calendar or fiscal year forwhich data are shown.
4. Includes paid police officers who achieved the status of fully-sworn police officer during the calendar or fiscal year prior to the year for which data are shown.5. Information on eligibility to retire was not available for police services employing 3% of police officers across Canada. These police services are excluded
from the percentage calculations.6. Excludes Newfoundland and Labrador.Note(s): Represents hirings, departures and eligibility to retire during the 2011 calendar or 2011/2012 fiscal year. The percent of officers eligible to retire is
calculated using these data, along with the number of fully sworn officers employed on May 15, 2012. Totals may not add to 100% due to rounding.Source(s): Statistics Canada, Canadian Centre for Justice Statistics, Police Administration Survey and Supplemental.
Statistics Canada – Catalogue no. 85-225-X 25

Police Resources in Canada – 2012
Table 6Hirings and departures of police officers at the largest police services, Canada, 2011/2012
Hirings 1 Departures 2Policeservices Total Experienced
policeofficers
3
Recruitgraduates
4Total Retirements Other
Net gainor loss:
hirings anddepartures
Policeofficerseligible
to retire5
number percent number percent number percent
National/provincial police services 6
Ontario Provincial Police 242 21 79 179 80 20 63 4Royal Canadian Mounted Police 516 .. .. 626 63 37 -110 19Royal Newfoundland Constabulary 7 .. .. .. .. .. .. .. ..Sûreté du Québec 186 .. .. 107 78 22 79 11Municipal police servicesToronto census metropolitan area police services
Toronto Police 0 0 0 208 75 25 -208 12Peel Regional Police 62 3 97 39 54 46 23 5York Regional Police 21 29 71 26 54 46 -5 4
Montréal census metropolitan area police servicesMontréal Police 0 0 0 58 x x -58 18Longueuil Police 1 x x 27 78 22 -26 6Laval Police 13 x x .. .. .. .. ..
Vancouver census metropolitan area police servicesVancouver Police 7 x x 41 80 20 -34 5Surrey, Royal Canadian Mounted Police 28 .. .. 12 33 67 16 7Burnaby, Royal Canadian Mounted Police 14 .. .. 3 33 67 11 7Richmond, Royal Canadian Mounted Police 8 .. .. 7 57 43 1 8
Other large police servicesHalifax Regional Police 20 x x 17 71 29 3 7Winnipeg Police 101 4 96 35 74 26 66 11Windsor Police 8 x x 12 67 33 -4 ..Regina Police 8 x x 17 82 18 -9 6Saskatoon Police 25 12 88 19 68 32 6 18Edmonton Police 100 9 91 0 0 0 100 10St. John’s, Royal Newfoundland Constabulary 7 .. .. .. .. .. .. .. ..Calgary Police 85 8 92 41 56 44 44 7Greater Sudbury Police 7 43 57 11 36 64 -4 3Niagara Regional Police 3 x x 16 x x -13 11London Police 26 x x 26 46 54 0 4Hamilton Police 37 11 89 37 59 41 0 22Gatineau Police 19 21 79 11 64 36 8 3Durham Regional Police 0 0 0 23 57 43 -23 7Waterloo Regional Police 68 9 91 26 46 54 42 2Ottawa Police 26 35 65 46 83 17 -20 5Québec Police 22 27 73 8 88 13 14 3Sherbrooke Regional Police 14 14 86 9 67 33 5 5Halton Regional Police 25 16 84 18 50 50 7 5Richelieu-Saint-Laurent Police 0 0 0 4 25 75 -4 0
1. Information on hirings was not available for police services employing 1% of officers across Canada. In addition, police services employing 36% of officerswere unable to provide the level of experience (experienced police officers or recruit graduate) of their officers at time of hire. These police services areexcluded from the percentage calculations.
2. Information on reason for departure was not available for police services employing 2% of officers across Canada. These police services are excludedfrom the percentage calculations.
3. Includes senior officers, non-commissioned officers and constables who achieved the status of a fully-sworn officer prior to the calendar or fiscal year forwhich data are shown.
4. Includes paid police officers who achieved the status of fully-sworn police officer during the calendar or fiscal year prior to the year for which data are shown.5. Information on eligibility to retire was not available for police services employing 3% of police officers across Canada. These police services are excluded
from the percentage calculations.6. Includes municipal contracts.7. This police service did not report data on hirings, departures and eligibility of officers to retire for 2011/2012.Note(s): Represents hirings, departures and eligibility to retire during the 2011 calendar or 2011/2012 fiscal year. The percent of officers eligible to retire is
calculated using these data, along with the number of fully sworn officers employed on May 15, 2012.Source(s): Statistics Canada, Canadian Centre for Justice Statistics, Police Administration Survey and Supplemental.
26 Statistics Canada – Catalogue no. 85-225-X
Police Resources in Canada – 2012
Table 7Police officers by sex, Canada, selected years
Year Male Female Total
number percent number percent number
1965 29,956 99.4 190 0.6 30,1461970 37,763 99.5 186 0.5 37,9491975 47,151 98.8 562 1.2 47,7131980 48,749 97.8 1,092 2.2 49,8411986 49,431 96.1 1,994 3.9 51,4251991 52,804 93.0 3,964 7.0 56,7681996 48,689 89.6 5,634 10.4 54,3232001 48,803 85.5 8,273 14.5 57,0762006 51,250 82.1 11,211 17.9 62,4612011 r 55,820 80.4 13,604 19.6 69,4242012 55,701 80.1 13,838 19.9 69,539
Source(s): Statistics Canada, Canadian Centre for Justice Statistics, Police Administration Survey.
Table 8Male and female police officers by rank, Canada, 1986 to 2012
Senior officers 1 Non-commissioned officers 2 ConstablesYear
Male Female Male Female Male Female
percent
1986 99.8 0.2 99.5 0.5 94.6 5.41987 99.8 0.2 99.4 0.6 93.9 6.11988 99.8 0.2 99.2 0.8 93.0 7.01989 99.7 0.3 98.9 1.1 92.1 7.91990 99.6 0.4 98.7 1.3 91.4 8.61991 99.6 0.4 98.6 1.4 90.5 9.51992 99.3 0.7 98.4 1.6 89.8 10.21993 98.8 1.2 98.2 1.8 89.2 10.81994 98.7 1.3 97.8 2.2 88.0 12.01995 98.4 1.6 97.3 2.7 87.2 12.81996 98.3 1.7 97.0 3.0 86.5 13.51997 97.9 2.1 96.6 3.4 85.7 14.31998 97.8 2.2 96.1 3.9 84.5 15.51999 97.2 2.8 95.3 4.7 83.8 16.22000 96.9 3.1 94.5 5.5 83.0 17.02001 96.5 3.5 93.7 6.3 82.2 17.82002 96.0 4.0 92.9 7.1 81.4 18.62003 95.3 4.7 92.3 7.7 80.9 19.12004 94.8 5.2 91.1 8.9 80.2 19.82005 94.5 5.5 90.3 9.7 79.3 20.72006 93.9 6.1 89.2 10.8 78.9 21.12007 92.8 7.2 88.0 12.0 78.5 21.52008 92.3 7.7 86.7 13.3 78.8 21.22009 91.7 8.3 85.6 14.4 78.6 21.42010 91.4 8.6 84.8 15.2 78.6 21.42011r 90.5 9.5 84.2 15.8 78.4 21.62012 90.1 9.9 83.6 16.4 78.2 21.8
1. Includes personnel who have obtained senior officer status, normally at the rank of lieutenant or higher, such as chiefs, deputy chiefs, staff superintendents,superintendents, staff inspectors, inspectors, lieutenants, and other equivalent ranks.
2. Includes personnel between the rank of constable and lieutenant, such as staff-sergeants, sergeants, detective-sergeants, corporals and all equivalent ranks.Note(s): Prior to 1986, data on the rank of police officers was not available. Represents the actual number of permanent, fully-sworn police officers (or their
full-time equivalents) as of May 15, 2012. This number also includes officers who are deployed to contract positions and who are not available for generalpolicing duties in their community. Police officers on long-term leave who are not being paid by the police service’s annual budget are excluded.
Source(s): Statistics Canada, Canadian Centre for Justice Statistics, Police Administration Survey.
Statistics Canada – Catalogue no. 85-225-X 27

Police Resources in Canada – 2012
Table 9Police officers by sex, provinces and territories, 2012
Provinceorterritory
Male Female Total
number percent number percent number
Newfoundland and Labrador 749 80.9 177 19.1 926Prince Edward Island 205 83.0 42 17.0 247Nova Scotia 1,610 83.2 324 16.8 1,934New Brunswick 1,151 84.4 213 15.6 1,364Quebec 12,171 76.1 3,821 23.9 15,992Ontario 21,357 81.3 4,917 18.7 26,274Manitoba 2,289 84.6 417 15.4 2,706Saskatchewan 1,874 81.5 424 18.5 2,298Alberta 5,613 82.7 1,174 17.3 6,787British Columbia 6,992 78.7 1,895 21.3 8,887Yukon 104 87.4 15 12.6 119Northwest Territories 173 86.9 26 13.1 199Nunavut 109 87.2 16 12.8 125Provincial and territorial total 54,397 80.2 13,461 19.8 67,858Royal Canadian Mounted Police Headquarters and Training Academy 1,304 77.6 377 22.4 1,681Canada 55,701 80.1 13,838 19.9 69,539
Note(s): Represents the actual number of permanent, fully-sworn police officers of all ranks (or their full-time equivalents) as of May 15, 2012. This numberalso includes officers who are deployed to contract positions and who are not available for general policing duties in their community. Police officerson long-term leave who are not being paid by the police service’s annual budget are excluded.
Source(s): Statistics Canada, Canadian Centre for Justice Statistics, Police Administration Survey.
28 Statistics Canada – Catalogue no. 85-225-X

Police Resources in Canada – 2012
Table 10Current and constant dollar expenditures on policing, Canada, 1985 to 2011
Current dollars 1 Constant dollars 2Year
Totalexpenditures
3Percentage
change fromprevious year
Percapita
cost
Totalexpenditures
3Percentage
change fromprevious year
Percapita
cost4
thousands of dollars percent dollars thousands of dollars percent dollars
1985 3,542,240 ... 137 5,622,603 … 2181986 3,771,205 6.5 144 5,748,788 2.2 2201987 4,027,809 6.8 152 5,880,013 2.3 2221988 4,389,414 9.0 164 6,164,907 4.8 2301989 4,684,760 6.7 172 6,263,048 1.6 2301990 5,247,646 12.0 189 6,693,426 6.9 2421991 5,426,887 3.4 194 6,554,211 -2.1 2341992 5,716,833 5.3 202 6,805,754 3.8 2401993 5,790,165 1.3 202 6,764,211 -0.6 2361994 5,783,656 -0.1 199 6,748,723 -0.2 2331995 5,808,607 0.4 198 6,630,830 -1.7 2261996 5,856,055 0.8 198 6,587,238 -0.7 2221997 5,989,022 2.3 200 6,625,024 0.6 2221998 6,209,756 3.7 206 6,801,485 2.7 2261999 6,395,380 3.0 210 6,884,155 1.2 2262000 6,798,531 6.3 222 7,126,343 3.5 2322001 7,269,977 6.9 234 7,433,514 4.3 2402002 7,827,195 7.7 250 7,827,195 5.3 2502003 8,324,176 6.3 263 8,097,447 3.5 2562004 8,758,213 5.2 274 8,365,055 3.3 2622005 9,281,879 6.0 288 8,674,653 3.7 2692006 9,877,071 6.4 303 9,053,227 4.4 2782007 r 10,544,771 6.8 320 9,457,194 4.5 2872008 r 11,449,955 8.6 344 10,035,018 6.1 3012009 r 12,314,197 7.5 365 10,764,158 7.3 3192010 r 12,651,596 2.7 371 10,859,739 0.9 3182011 12,931,555 2.2 375 10,785,284 -0.7 313
1. Dollars which express the cost of items in terms of the year in which the expenditure occurs.2. Dollars of a particular base year, which are adjusted (by inflation or deflation) to show changes in the purchasing power of the dollar. The Consumer Price Index
was used to calculate constant dollars over a base year of 2002 (2002=100). Note that historical constant dollar data are revised each year as the baseyear for calculation changes periodically.
3. Total operating expenditures include salaries, wages, benefits, and other operating expenses that are paid from the police force budget, as well as benefits paidfrom other government sources. Revenues, recoveries, and those costs that fall under a police service’s capital expenditures are excluded.
4. Per capita costs are calculated using populations statistics based on preliminary postcensal estimates for 2011, Statistics Canada, Demography Division.Source(s): Statistics Canada, Consumer Price Index and Canadian Centre for Justice Statistics, Police Administration Survey.
Statistics Canada – Catalogue no. 85-225-X 29
Police Resources in Canada – 2012
Table 11Total expenditures on policing, 2011
Provinceorterritory
Municipal 1 Provincial 1 Total 2 Changefrom
previousyear
3
Federal 4 Expenditurestotal
5Change
fromprevious
year3
thousands of dollars percent thousands of dollars percent
Newfoundland and Labrador 6 … 114,762 114,762 0.6 26,678 141,440 0.9Prince Edward Island 12,013 13,739 25,752 1.5 6,272 32,024 2.1Nova Scotia 125,274 99,611 224,885 -2.4 44,839 269,724 -1.7New Brunswick 89,522 69,465 158,987 0.3 32,028 191,015 0.7Quebec 1,466,636 923,406 2,390,042 3.6 … 2,390,042 3.6Ontario 3,577,714 748,499 4,326,213 -0.3 … 4,326,213 -0.3Manitoba 243,709 100,549 344,258 1.9 51,487 395,745 1.7Saskatchewan 7 159,968 132,367 292,335 4.9 59,768 352,103 4.9Alberta 870,778 230,396 1,101,174 5.2 123,746 1,224,920 5.3British Columbia 898,710 325,812 1,224,522 1.8 210,002 1,434,524 2.6Yukon … 18,362 18,362 -2.5 7,869 26,231 -2.5Northwest Territories … 35,643 35,643 2.5 15,275 50,918 2.5Nunavut … 29,845 29,845 4.0 12,791 42,636 4.0Provincial and territorial total 7,444,324 2,842,456 10,286,780 1.7 590,755 10,877,535 1.8Other Royal Canadian Mounted Police expenditures 8 … … … … 2,054,020 2,054,020 -12.2Canada 7,444,324 2,842,456 10,286,780 1.7 2,644,775 12,931,555 -0.7
1. Figures include the amount billed to the province, territory or municipality for Royal Canadian Mounted Police contract policing. In some provinces, municipalpolicing is subsidized by the provinces
2. The per capita cost field is not included as expenditures are not comparable. Per capita costs should not be calculated.3. Year to year percent change calcualations are based on constant dollar amounts. Constant dollars are adjusted (by inflation or deflation) to show changes in the
purchasing power of the dollar. The Consumer Price Index was used to calculate constant dollars over a base year of 2002 (2002=100).4. Federal expenditures include all other Royal Canadian Mounted Police contract expenditures which are not paid for by the municipality or the province and
territory for those provinces and territories with contracts with the Royal Canadian Mounted Police (see footnote 8).5. Includes municipal, provincial and territorial, federal and other Royal Canadian Mounted Police expenditures (see footnote 8).6. Provincial policing figures include both the Royal Newfoundland Constabulary and the Royal Canadian Mounted Police.7. Excludes Royal Canadian Mounted Police Training Academy.8. Includes headquarters, federal and international operations, and national policing services.Note(s): Totals may not add up due to rounding. Expenditure figures represent gross operating expenditures and include costs that are paid from police department
budgets and benefits paid from other sources. Revenues, recoveries and capital expenditures are excluded.Source(s): Statistics Canada, Canadian Centre for Justice Statistics, Police Administration Survey.
30 Statistics Canada – Catalogue no. 85-225-X
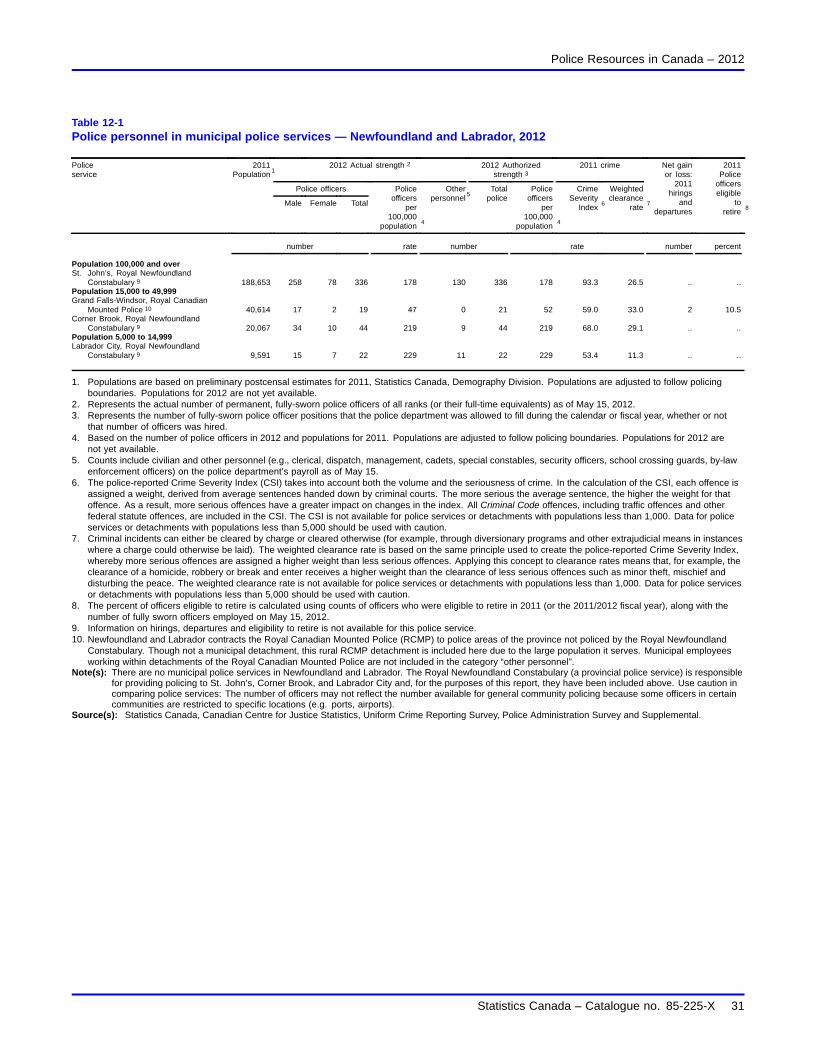
Police Resources in Canada – 2012
Table 12-1Police personnel in municipal police services — Newfoundland and Labrador, 2012
2012 Actual strength 2 2012 Authorizedstrength 3
2011 crime
Police officers
Policeservice
2011Population
1
Male Female Total
Policeofficers
per100,000
population4
Otherpersonnel
5Total
policePolice
officersper
100,000population
4
CrimeSeverity
Index6
Weightedclearance
rate7
Net gainor loss:
2011hirings
anddepartures
2011Police
officerseligible
toretire
8
number rate number rate number percent
Population 100,000 and overSt. John’s, Royal Newfoundland
Constabulary 9 188,653 258 78 336 178 130 336 178 93.3 26.5 .. ..Population 15,000 to 49,999Grand Falls-Windsor, Royal Canadian
Mounted Police 10 40,614 17 2 19 47 0 21 52 59.0 33.0 2 10.5Corner Brook, Royal Newfoundland
Constabulary 9 20,067 34 10 44 219 9 44 219 68.0 29.1 .. ..Population 5,000 to 14,999Labrador City, Royal Newfoundland
Constabulary 9 9,591 15 7 22 229 11 22 229 53.4 11.3 .. ..
1. Populations are based on preliminary postcensal estimates for 2011, Statistics Canada, Demography Division. Populations are adjusted to follow policingboundaries. Populations for 2012 are not yet available.
2. Represents the actual number of permanent, fully-sworn police officers of all ranks (or their full-time equivalents) as of May 15, 2012.3. Represents the number of fully-sworn police officer positions that the police department was allowed to fill during the calendar or fiscal year, whether or not
that number of officers was hired.4. Based on the number of police officers in 2012 and populations for 2011. Populations are adjusted to follow policing boundaries. Populations for 2012 are
not yet available.5. Counts include civilian and other personnel (e.g., clerical, dispatch, management, cadets, special constables, security officers, school crossing guards, by-law
enforcement officers) on the police department’s payroll as of May 15.6. The police-reported Crime Severity Index (CSI) takes into account both the volume and the seriousness of crime. In the calculation of the CSI, each offence is
assigned a weight, derived from average sentences handed down by criminal courts. The more serious the average sentence, the higher the weight for thatoffence. As a result, more serious offences have a greater impact on changes in the index. All Criminal Code offences, including traffic offences and otherfederal statute offences, are included in the CSI. The CSI is not available for police services or detachments with populations less than 1,000. Data for policeservices or detachments with populations less than 5,000 should be used with caution.
7. Criminal incidents can either be cleared by charge or cleared otherwise (for example, through diversionary programs and other extrajudicial means in instanceswhere a charge could otherwise be laid). The weighted clearance rate is based on the same principle used to create the police-reported Crime Severity Index,whereby more serious offences are assigned a higher weight than less serious offences. Applying this concept to clearance rates means that, for example, theclearance of a homicide, robbery or break and enter receives a higher weight than the clearance of less serious offences such as minor theft, mischief anddisturbing the peace. The weighted clearance rate is not available for police services or detachments with populations less than 1,000. Data for police servicesor detachments with populations less than 5,000 should be used with caution.
8. The percent of officers eligible to retire is calculated using counts of officers who were eligible to retire in 2011 (or the 2011/2012 fiscal year), along with thenumber of fully sworn officers employed on May 15, 2012.
9. Information on hirings, departures and eligibility to retire is not available for this police service.10. Newfoundland and Labrador contracts the Royal Canadian Mounted Police (RCMP) to police areas of the province not policed by the Royal Newfoundland
Constabulary. Though not a municipal detachment, this rural RCMP detachment is included here due to the large population it serves. Municipal employeesworking within detachments of the Royal Canadian Mounted Police are not included in the category “other personnel”.
Note(s): There are no municipal police services in Newfoundland and Labrador. The Royal Newfoundland Constabulary (a provincial police service) is responsiblefor providing policing to St. John’s, Corner Brook, and Labrador City and, for the purposes of this report, they have been included above. Use caution incomparing police services: The number of officers may not reflect the number available for general community policing because some officers in certaincommunities are restricted to specific locations (e.g. ports, airports).
Source(s): Statistics Canada, Canadian Centre for Justice Statistics, Uniform Crime Reporting Survey, Police Administration Survey and Supplemental.
Statistics Canada – Catalogue no. 85-225-X 31
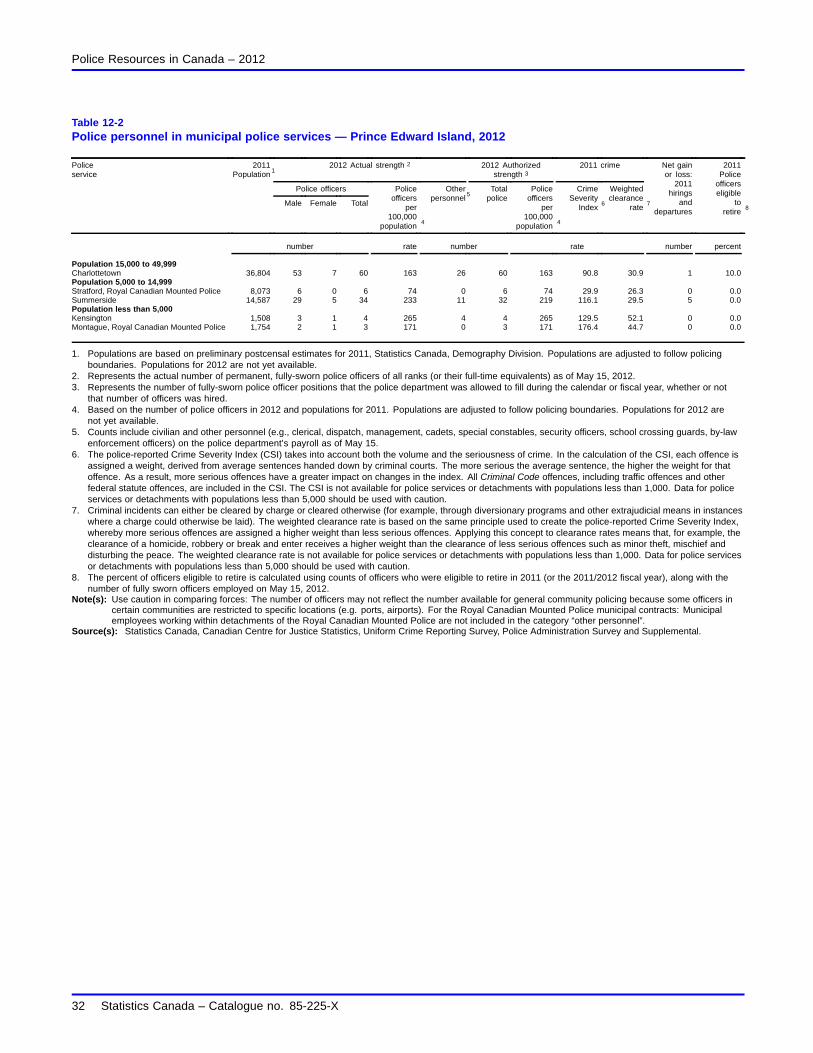
Police Resources in Canada – 2012
Table 12-2Police personnel in municipal police services — Prince Edward Island, 2012
2012 Actual strength 2 2012 Authorizedstrength 3
2011 crime
Police officers
Policeservice
2011Population
1
Male Female Total
Policeofficers
per100,000
population4
Otherpersonnel
5Total
policePolice
officersper
100,000population
4
CrimeSeverity
Index6
Weightedclearance
rate7
Net gainor loss:
2011hirings
anddepartures
2011Police
officerseligible
toretire
8
number rate number rate number percent
Population 15,000 to 49,999Charlottetown 36,804 53 7 60 163 26 60 163 90.8 30.9 1 10.0Population 5,000 to 14,999Stratford, Royal Canadian Mounted Police 8,073 6 0 6 74 0 6 74 29.9 26.3 0 0.0Summerside 14,587 29 5 34 233 11 32 219 116.1 29.5 5 0.0Population less than 5,000Kensington 1,508 3 1 4 265 4 4 265 129.5 52.1 0 0.0Montague, Royal Canadian Mounted Police 1,754 2 1 3 171 0 3 171 176.4 44.7 0 0.0
1. Populations are based on preliminary postcensal estimates for 2011, Statistics Canada, Demography Division. Populations are adjusted to follow policingboundaries. Populations for 2012 are not yet available.
2. Represents the actual number of permanent, fully-sworn police officers of all ranks (or their full-time equivalents) as of May 15, 2012.3. Represents the number of fully-sworn police officer positions that the police department was allowed to fill during the calendar or fiscal year, whether or not
that number of officers was hired.4. Based on the number of police officers in 2012 and populations for 2011. Populations are adjusted to follow policing boundaries. Populations for 2012 are
not yet available.5. Counts include civilian and other personnel (e.g., clerical, dispatch, management, cadets, special constables, security officers, school crossing guards, by-law
enforcement officers) on the police department’s payroll as of May 15.6. The police-reported Crime Severity Index (CSI) takes into account both the volume and the seriousness of crime. In the calculation of the CSI, each offence is
assigned a weight, derived from average sentences handed down by criminal courts. The more serious the average sentence, the higher the weight for thatoffence. As a result, more serious offences have a greater impact on changes in the index. All Criminal Code offences, including traffic offences and otherfederal statute offences, are included in the CSI. The CSI is not available for police services or detachments with populations less than 1,000. Data for policeservices or detachments with populations less than 5,000 should be used with caution.
7. Criminal incidents can either be cleared by charge or cleared otherwise (for example, through diversionary programs and other extrajudicial means in instanceswhere a charge could otherwise be laid). The weighted clearance rate is based on the same principle used to create the police-reported Crime Severity Index,whereby more serious offences are assigned a higher weight than less serious offences. Applying this concept to clearance rates means that, for example, theclearance of a homicide, robbery or break and enter receives a higher weight than the clearance of less serious offences such as minor theft, mischief anddisturbing the peace. The weighted clearance rate is not available for police services or detachments with populations less than 1,000. Data for police servicesor detachments with populations less than 5,000 should be used with caution.
8. The percent of officers eligible to retire is calculated using counts of officers who were eligible to retire in 2011 (or the 2011/2012 fiscal year), along with thenumber of fully sworn officers employed on May 15, 2012.
Note(s): Use caution in comparing forces: The number of officers may not reflect the number available for general community policing because some officers incertain communities are restricted to specific locations (e.g. ports, airports). For the Royal Canadian Mounted Police municipal contracts: Municipalemployees working within detachments of the Royal Canadian Mounted Police are not included in the category “other personnel”.
Source(s): Statistics Canada, Canadian Centre for Justice Statistics, Uniform Crime Reporting Survey, Police Administration Survey and Supplemental.
32 Statistics Canada – Catalogue no. 85-225-X
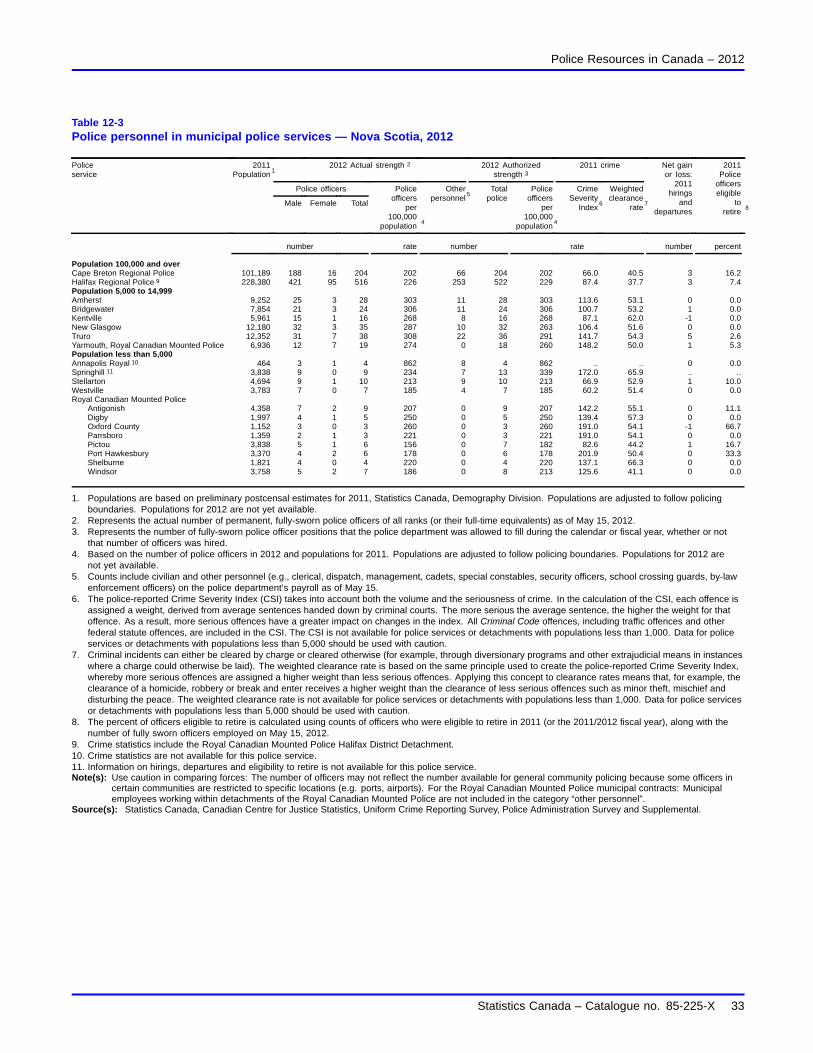
Police Resources in Canada – 2012
Table 12-3Police personnel in municipal police services — Nova Scotia, 2012
2012 Actual strength 2 2012 Authorizedstrength 3
2011 crime
Police officers
Policeservice
2011Population
1
Male Female Total
Policeofficers
per100,000
population4
Otherpersonnel
5Total
policePolice
officersper
100,000population
4
CrimeSeverity
Index6
Weightedclearance
rate7
Net gainor loss:
2011hirings
anddepartures
2011Police
officerseligible
toretire
8
number rate number rate number percent
Population 100,000 and overCape Breton Regional Police 101,189 188 16 204 202 66 204 202 66.0 40.5 3 16.2Halifax Regional Police 9 228,380 421 95 516 226 253 522 229 87.4 37.7 3 7.4Population 5,000 to 14,999Amherst 9,252 25 3 28 303 11 28 303 113.6 53.1 0 0.0Bridgewater 7,854 21 3 24 306 11 24 306 100.7 53.2 1 0.0Kentville 5,961 15 1 16 268 8 16 268 87.1 62.0 -1 0.0New Glasgow 12,180 32 3 35 287 10 32 263 106.4 51.6 0 0.0Truro 12,352 31 7 38 308 22 36 291 141.7 54.3 5 2.6Yarmouth, Royal Canadian Mounted Police 6,936 12 7 19 274 0 18 260 148.2 50.0 1 5.3Population less than 5,000Annapolis Royal 10 464 3 1 4 862 8 4 862 .. .. 0 0.0Springhill 11 3,838 9 0 9 234 7 13 339 172.0 65.9 .. ..Stellarton 4,694 9 1 10 213 9 10 213 66.9 52.9 1 10.0Westville 3,783 7 0 7 185 4 7 185 60.2 51.4 0 0.0Royal Canadian Mounted Police
Antigonish 4,358 7 2 9 207 0 9 207 142.2 55.1 0 11.1Digby 1,997 4 1 5 250 0 5 250 139.4 57.3 0 0.0Oxford County 1,152 3 0 3 260 0 3 260 191.0 54.1 -1 66.7Parrsboro 1,359 2 1 3 221 0 3 221 191.0 54.1 0 0.0Pictou 3,838 5 1 6 156 0 7 182 82.6 44.2 1 16.7Port Hawkesbury 3,370 4 2 6 178 0 6 178 201.9 50.4 0 33.3Shelburne 1,821 4 0 4 220 0 4 220 137.1 66.3 0 0.0Windsor 3,758 5 2 7 186 0 8 213 125.6 41.1 0 0.0
1. Populations are based on preliminary postcensal estimates for 2011, Statistics Canada, Demography Division. Populations are adjusted to follow policingboundaries. Populations for 2012 are not yet available.
2. Represents the actual number of permanent, fully-sworn police officers of all ranks (or their full-time equivalents) as of May 15, 2012.3. Represents the number of fully-sworn police officer positions that the police department was allowed to fill during the calendar or fiscal year, whether or not
that number of officers was hired.4. Based on the number of police officers in 2012 and populations for 2011. Populations are adjusted to follow policing boundaries. Populations for 2012 are
not yet available.5. Counts include civilian and other personnel (e.g., clerical, dispatch, management, cadets, special constables, security officers, school crossing guards, by-law
enforcement officers) on the police department’s payroll as of May 15.6. The police-reported Crime Severity Index (CSI) takes into account both the volume and the seriousness of crime. In the calculation of the CSI, each offence is
assigned a weight, derived from average sentences handed down by criminal courts. The more serious the average sentence, the higher the weight for thatoffence. As a result, more serious offences have a greater impact on changes in the index. All Criminal Code offences, including traffic offences and otherfederal statute offences, are included in the CSI. The CSI is not available for police services or detachments with populations less than 1,000. Data for policeservices or detachments with populations less than 5,000 should be used with caution.
7. Criminal incidents can either be cleared by charge or cleared otherwise (for example, through diversionary programs and other extrajudicial means in instanceswhere a charge could otherwise be laid). The weighted clearance rate is based on the same principle used to create the police-reported Crime Severity Index,whereby more serious offences are assigned a higher weight than less serious offences. Applying this concept to clearance rates means that, for example, theclearance of a homicide, robbery or break and enter receives a higher weight than the clearance of less serious offences such as minor theft, mischief anddisturbing the peace. The weighted clearance rate is not available for police services or detachments with populations less than 1,000. Data for police servicesor detachments with populations less than 5,000 should be used with caution.
8. The percent of officers eligible to retire is calculated using counts of officers who were eligible to retire in 2011 (or the 2011/2012 fiscal year), along with thenumber of fully sworn officers employed on May 15, 2012.
9. Crime statistics include the Royal Canadian Mounted Police Halifax District Detachment.10. Crime statistics are not available for this police service.11. Information on hirings, departures and eligibility to retire is not available for this police service.Note(s): Use caution in comparing forces: The number of officers may not reflect the number available for general community policing because some officers in
certain communities are restricted to specific locations (e.g. ports, airports). For the Royal Canadian Mounted Police municipal contracts: Municipalemployees working within detachments of the Royal Canadian Mounted Police are not included in the category “other personnel”.
Source(s): Statistics Canada, Canadian Centre for Justice Statistics, Uniform Crime Reporting Survey, Police Administration Survey and Supplemental.
Statistics Canada – Catalogue no. 85-225-X 33

Police Resources in Canada – 2012
Table 12-4Police personnel in municipal police services — New Brunswick, 2012
2012 Actual strength 2 2012 Authorizedstrength 3
2011 crime
Police officers
Policeservice
2011Population
1
Male Female Total
Policeofficers
per100,000
population4
Otherpersonnel
5Total
policePolice
officersper
100,000population
4
CrimeSeverity
Index6
Weightedclearance
rate7
Net gainor loss:
2011hirings
anddepartures
2011Police
officerseligible
toretire
8
number rate number rate number percent
Population 100,000 and overCodiac Region, Royal Canadian Mounted
Police 110,159 115 27 142 129 2 144 131 74.6 41.3 -6 22.5Population 50,000 to 99,999Fredericton 56,303 91 24 115 204 31 113 201 72.3 30.2 2 8.7Saint John 9 70,494 134 22 156 221 21 166 235 101.4 49.4 .. ..Population 15,000 to 49,999Edmundston 16,604 28 6 34 205 18 34 205 70.4 25.9 0 0.0Miramichi 17,929 29 3 32 178 21 32 178 64.2 52.7 0 6.3Rothesay Regional Police 28,658 28 7 35 122 5 38 133 29.5 71.9 1 2.9Population 5,000 to 14,999BNPP Regional Police 8,482 18 1 19 224 2 19 150 44.3 23.0 1 5.3Bathurst 12,674 25 5 30 237 16 30 354 78.5 48.3 -1 0.0Grand Falls 6,197 14 3 17 274 3 17 274 91.8 27.6 2 0.0Woodstock 5,129 14 1 15 292 2 14 273 100.1 34.0 0 13.3Royal Canadian Mounted Police
Campbellton 7,048 15 2 17 241 0 18 255 83.6 42.8 1 11.8Oromocto 9,032 13 0 13 144 0 14 155 58.8 36.8 0 7.7Sackville 5,945 7 3 10 168 0 10 168 73.0 30.9 0 0.0
Population less than 5,000Royal Canadian Mounted Police
Richibucto 1,318 2 0 2 152 0 3 228 190.9 37.1 0 0.0St. Andrews 1,817 3 0 3 165 0 3 165 33.5 36.4 0 33.3Bouctouche 2,356 3 0 3 127 0 3 127 98.3 36.2 0 0.0Saint Quentin 2,068 3 0 3 145 0 3 145 103.6 27.4 0 0.0Cap-Pelé 2,485 1 1 2 80 0 3 121 30.3 33.4 0 0.0McAdam 1,542 2 1 3 195 0 3 195 80.9 55.8 -1 0.0Hampton 4,260 4 0 4 94 0 5 117 47.2 41.1 0 0.0
1. Populations are based on preliminary postcensal estimates for 2011, Statistics Canada, Demography Division. Populations are adjusted to follow policingboundaries. Populations for 2012 are not yet available.
2. Represents the actual number of permanent, fully-sworn police officers of all ranks (or their full-time equivalents) as of May 15, 2012.3. Represents the number of fully-sworn police officer positions that the police department was allowed to fill during the calendar or fiscal year, whether or not
that number of officers was hired.4. Based on the number of police officers in 2012 and populations for 2011. Populations are adjusted to follow policing boundaries. Populations for 2012 are
not yet available.5. Counts include civilian and other personnel (e.g., clerical, dispatch, management, cadets, special constables, security officers, school crossing guards, by-law
enforcement officers) on the police department’s payroll as of May 15.6. The police-reported Crime Severity Index (CSI) takes into account both the volume and the seriousness of crime. In the calculation of the CSI, each offence is
assigned a weight, derived from average sentences handed down by criminal courts. The more serious the average sentence, the higher the weight for thatoffence. As a result, more serious offences have a greater impact on changes in the index. All Criminal Code offences, including traffic offences and otherfederal statute offences, are included in the CSI. The CSI is not available for police services or detachments with populations less than 1,000. Data for policeservices or detachments with populations less than 5,000 should be used with caution.
7. Criminal incidents can either be cleared by charge or cleared otherwise (for example, through diversionary programs and other extrajudicial means in instanceswhere a charge could otherwise be laid). The weighted clearance rate is based on the same principle used to create the police-reported Crime Severity Index,whereby more serious offences are assigned a higher weight than less serious offences. Applying this concept to clearance rates means that, for example, theclearance of a homicide, robbery or break and enter receives a higher weight than the clearance of less serious offences such as minor theft, mischief anddisturbing the peace. The weighted clearance rate is not available for police services or detachments with populations less than 1,000. Data for police servicesor detachments with populations less than 5,000 should be used with caution.
8. The percent of officers eligible to retire is calculated using counts of officers who were eligible to retire in 2011 (or the 2011/2012 fiscal year), along with thenumber of fully sworn officers employed on May 15, 2012.
9. Information on hirings, departures and eligibility to retire is not available for this police service.Note(s): Use caution in comparing forces: The number of officers may not reflect the number available for general community policing because some officers in
certain communities are restricted to specific locations (e.g. ports, airports). For the Royal Canadian Mounted Police municipal contracts: Municipalemployees working within detachments of the Royal Canadian Mounted Police are not included in the category “other personnel”.
Source(s): Statistics Canada, Canadian Centre for Justice Statistics, Uniform Crime Reporting Survey, Police Administration Survey and Supplemental.
34 Statistics Canada – Catalogue no. 85-225-X

Police Resources in Canada – 2012
Table 12-5Police personnel in municipal police services — Quebec, 2012
2012 Actual strength 2 2012 Authorizedstrength 3
2011 crime
Police officers
Policeservice
2011Population
1
Male Female Total
Policeofficers
per100,000
population4
Otherpersonnel
5Total
policePolice
officersper
100,000population
4
CrimeSeverity
Index6
Weightedclearance
rate7
Net gainor loss:
2011hirings
anddepartures
2011Police
officerseligible
toretire
8
number rate number rate number percent
Population 100,000 and overGatineau 261,660 301 83 384 147 155 393 150 66.8 45.3 8 2.9Laval 9 404,046 388 159 547 135 178 531 131 70.4 33.2 7 ..Lévis 137,505 115 31 146 106 63 146 106 40.3 42.6 -4 1.4Longueuil 405,476 390 168 558 138 233 562 139 76.6 29.6 -26 5.7Montréal 1,969,242 3,105 1,375 4,480 227 1,256 4,597 233 99.6 25.7 -58 18.1Québec 553,192 563 190 753 136 172 719 130 56.3 38.7 14 2.8Richelieu/St. Laurent 191,205 170 41 211 110 38 211 110 45.6 32.1 -4 0.0Roussillon, Régie intermunicipale 100,336 90 24 114 114 32 114 114 38.0 41.6 -10 7.9Saguenay 145,506 144 35 179 123 67 179 123 71.1 34.0 -3 2.2Sherbrooke 158,227 161 39 200 126 52 200 126 60.6 39.2 5 4.5Terrebonne 131,080 114 37 151 115 45 151 115 52.6 42.7 -4 0.7Trois-Rivières 130,557 131 29 160 123 60 160 123 70.4 46.2 2 0.0Population 50,000 to 99,999Châteauguay 76,046 83 27 110 145 22 112 147 52.0 34.1 -1 0.9Granby 64,314 66 12 78 121 33 78 121 59.6 47.3 7 0.0Mirabel 52,099 32 9 41 79 25 41 79 59.0 29.0 -2 0.0Repentigny 88,763 101 21 122 137 32 122 137 48.3 41.2 7 0.0Saint-Jean-sur-Richelieu 91,833 76 31 107 117 33 109 119 76.9 35.1 -1 0.0Saint-Jérôme 72,638 89 20 109 150 34 109 150 101.8 39.5 5 0.0Thérèse-De-Blainville 82,184 81 17 98 119 37 98 119 67.5 47.4 -13 3.1Population 15,000 to 49,999Blainville 48,249 61 14 75 155 32 75 155 53.3 39.5 4 1.3Deux-Montagnes, regional police service 43,058 46 9 55 128 18 50 116 53.3 29.8 1 0.0L’Assomption 21,710 24 8 32 147 14 38 175 49.0 32.9 -1 6.3Magog 31,927 44 6 50 157 13 44 138 61.2 55.8 1 8.0Mascouche 38,708 41 10 51 132 24 51 132 63.8 43.5 -1 0.0MRC des Collines-de-l’Outaouais 49,984 41 10 51 102 12 51 102 46.9 42.9 2 2.0Saint-Eustache 45,543 39 21 60 132 25 60 132 67.0 52.9 10 5.0Saint-Georges 30,442 26 4 30 99 8 30 99 55.6 48.7 2 0.0Thetford Mines 25,379 25 7 32 126 14 29 114 57.2 55.2 -1 0.0Population 5,000 to 14,999Bromont 6,519 18 9 27 414 4 31 476 52.3 57.6 5 0.0Eeyou Eenou Cree Region 10 14,977 60 15 75 501 26 82 548 179.9 0.0 .. ..Kahnawake First Nations 10,125 27 5 32 316 14 31 306 39.0 0.0 2 0.0Kativik Regional 11,366 42 4 46 405 21 66 581 54.9 88.6 -2 0.0Mont-Tremblant 9,310 26 6 32 344 16 32 344 136.8 46.9 2 0.0Sainte-Adèle 11,500 24 5 29 252 .. 29 252 119.9 27.0 0 24.1Sainte-Marie 12,326 12 2 14 114 6 14 114 37.7 49.8 0 0.0
See notes at the end of the table.
Statistics Canada – Catalogue no. 85-225-X 35

Police Resources in Canada – 2012
Table 12-5 – continued
Police personnel in municipal police services — Quebec, 2012
2012 Actual strength 2 2012 Authorizedstrength 3
2011 crime
Police officers
Policeservice
2011Population
1
Male Female Total
Policeofficers
per100,000
population4
Otherpersonnel
5Total
policePolice
officersper
100,000population
4
CrimeSeverity
Index6
Weightedclearance
rate7
Net gainor loss:
2011hirings
anddepartures
2011Police
officerseligible
toretire
8
number rate number rate number percent
Population less than 5,000Amérindienne de Manawan 10 1,813 13 1 14 772 4 17 938 36.7 0.0 .. ..Amérindienne de Wemotaci 11 1,038 .. .. .. .. .. .. .. 237.6 74.6 .. ..Amérindienne d’Odanak 12 627 5 1 6 957 1 6 957 .. .. -1 0.0Essipit 250 4 0 4 1,600 0 4 1,600 .. .. 0 0.0Eagle Village 11 264 .. .. .. .. .. .. .. .. .. .. ..Gesgapegiac Amerindian 12 509 3 3 6 1,179 0 4 786 .. .. 3 0.0Kitigan Zibi Anishinabeg 1,065 8 0 8 751 1 8 751 82.7 0.0 8 0.0Lac Simon 13 1,177 12 0 12 1,020 1 12 1,020 518.1 0.0 4 0.0Listuguj 1,407 9 0 9 640 5 13 924 220.0 0.8 0 0.0Mashteuiatsh 1,710 8 1 9 526 1 11 643 184.8 70.5 1 22.2Montagnais de Pakua Shipi 12 270 4 0 4 1,481 0 4 1,481 .. .. 1 0.0Naskapi 10 , 12 , 14 571 5 0 5 876 1 4 701 .. .. .. ..Obedjiwan 14 1,731 16 1 17 982 2 0 0 194.4 30.6 8 29.4Pessamit 11 2,224 .. .. .. .. .. .. .. 83.0 92.8 .. ..Pikogan 12 500 2 2 4 800 1 3 600 .. .. -2 0.0Timiskaming 463 7 1 8 1,728 1 8 1,728 .. .. 2 25.0Uashat Mak Mani-Utenam 11 2,320 .. .. .. .. .. .. .. 308.7 67.0 .. ..Wendake 1,783 15 0 15 841 1 15 841 72.7 31.9 0 0.0
1. Populations are based on preliminary postcensal estimates for 2011, Statistics Canada, Demography Division. Populations are adjusted to follow policingboundaries. Populations for 2012 are not yet available.
2. Represents the actual number of permanent, fully-sworn police officers of all ranks (or their full-time equivalents) as of May 15, 2012.3. Represents the number of fully-sworn police officer positions that the police department was allowed to fill during the calendar or fiscal year, whether or not
that number of officers was hired.4. Based on the number of police officers in 2012 and populations for 2011. Populations are adjusted to follow policing boundaries. Populations for 2012 are
not yet available.5. Counts include civilian and other personnel (e.g., clerical, dispatch, management, cadets, special constables, security officers, school crossing guards, by-law
enforcement officers) on the police department’s payroll as of May 15.6. The police-reported Crime Severity Index (CSI) takes into account both the volume and the seriousness of crime. In the calculation of the CSI, each offence is
assigned a weight, derived from average sentences handed down by criminal courts. The more serious the average sentence, the higher the weight for thatoffence. As a result, more serious offences have a greater impact on changes in the index. All Criminal Code offences, including traffic offences and otherfederal statute offences, are included in the CSI. The CSI is not available for police services or detachments with populations less than 1,000. Data for policeservices or detachments with populations less than 5,000 should be used with caution.
7. Criminal incidents can either be cleared by charge or cleared otherwise (for example, through diversionary programs and other extrajudicial means in instanceswhere a charge could otherwise be laid). The weighted clearance rate is based on the same principle used to create the police-reported Crime Severity Index,whereby more serious offences are assigned a higher weight than less serious offences. Applying this concept to clearance rates means that, for example, theclearance of a homicide, robbery or break and enter receives a higher weight than the clearance of less serious offences such as minor theft, mischief anddisturbing the peace. The weighted clearance rate is not available for police services or detachments with populations less than 1,000. Data for police servicesor detachments with populations less than 5,000 should be used with caution.
8. The percent of officers eligible to retire is calculated using counts of officers who were eligible to retire in 2011 (or the 2011/2012 fiscal year), along with thenumber of fully sworn officers employed on May 15, 2012.
9. Information on eligibility to retire is not available for this police service.10. Information on hirings, departures and eligibility to retire is not available for this police service.11. Non-respondent.12. Crime statistics are not available for this police service.13. This police force employs Native Special Constables. Native Special Constables are personnel with limited law enforcement authority. They provide a restrictive
policing role within Aboriginal communities and act as liaison between fully sworn police officers and Aboriginal members of the community.14. Personnel data for 2012 are not available; therefore, 2011 data were substituted.Note(s): Use caution in comparing forces: The number of officers may not reflect the number available for general community policing because some officers in
certain communities are restricted to specific locations (e.g. ports, airports).Source(s): Statistics Canada, Canadian Centre for Justice Statistics, Uniform Crime Reporting Survey, Police Administration Survey and Supplemental.
36 Statistics Canada – Catalogue no. 85-225-X
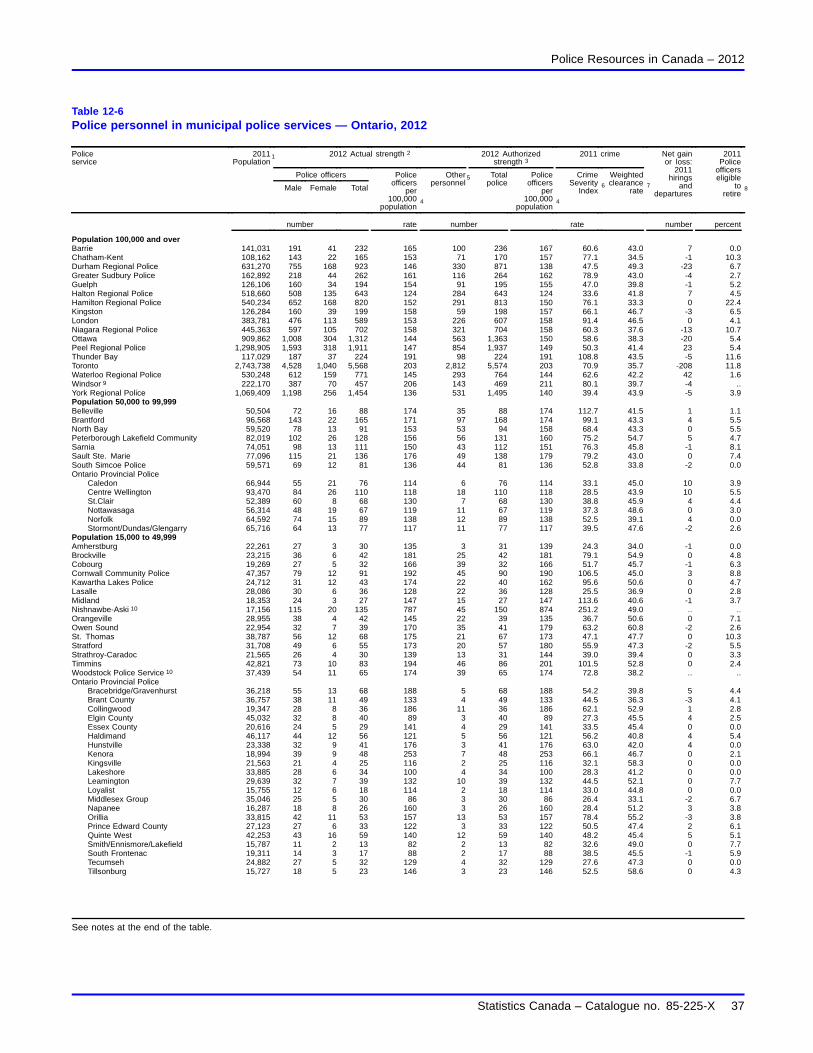
Police Resources in Canada – 2012
Table 12-6Police personnel in municipal police services — Ontario, 2012
2012 Actual strength 2 2012 Authorizedstrength 3
2011 crime
Police officers
Policeservice
2011Population
1
Male Female Total
Policeofficers
per100,000
population4
Otherpersonnel
5 Totalpolice
Policeofficers
per100,000
population4
CrimeSeverity
Index6
Weightedclearance
rate7
Net gainor loss:
2011hirings
anddepartures
2011Police
officerseligible
toretire
8
number rate number rate number percent
Population 100,000 and overBarrie 141,031 191 41 232 165 100 236 167 60.6 43.0 7 0.0Chatham-Kent 108,162 143 22 165 153 71 170 157 77.1 34.5 -1 10.3Durham Regional Police 631,270 755 168 923 146 330 871 138 47.5 49.3 -23 6.7Greater Sudbury Police 162,892 218 44 262 161 116 264 162 78.9 43.0 -4 2.7Guelph 126,106 160 34 194 154 91 195 155 47.0 39.8 -1 5.2Halton Regional Police 518,660 508 135 643 124 284 643 124 33.6 41.8 7 4.5Hamilton Regional Police 540,234 652 168 820 152 291 813 150 76.1 33.3 0 22.4Kingston 126,284 160 39 199 158 59 198 157 66.1 46.7 -3 6.5London 383,781 476 113 589 153 226 607 158 91.4 46.5 0 4.1Niagara Regional Police 445,363 597 105 702 158 321 704 158 60.3 37.6 -13 10.7Ottawa 909,862 1,008 304 1,312 144 563 1,363 150 58.6 38.3 -20 5.4Peel Regional Police 1,298,905 1,593 318 1,911 147 854 1,937 149 50.3 41.4 23 5.4Thunder Bay 117,029 187 37 224 191 98 224 191 108.8 43.5 -5 11.6Toronto 2,743,738 4,528 1,040 5,568 203 2,812 5,574 203 70.9 35.7 -208 11.8Waterloo Regional Police 530,248 612 159 771 145 293 764 144 62.6 42.2 42 1.6Windsor 9 222,170 387 70 457 206 143 469 211 80.1 39.7 -4 ..York Regional Police 1,069,409 1,198 256 1,454 136 531 1,495 140 39.4 43.9 -5 3.9Population 50,000 to 99,999Belleville 50,504 72 16 88 174 35 88 174 112.7 41.5 1 1.1Brantford 96,568 143 22 165 171 97 168 174 99.1 43.3 4 5.5North Bay 59,520 78 13 91 153 53 94 158 68.4 43.3 0 5.5Peterborough Lakefield Community 82,019 102 26 128 156 56 131 160 75.2 54.7 5 4.7Sarnia 74,051 98 13 111 150 43 112 151 76.3 45.8 -1 8.1Sault Ste. Marie 77,096 115 21 136 176 49 138 179 79.2 43.0 0 7.4South Simcoe Police 59,571 69 12 81 136 44 81 136 52.8 33.8 -2 0.0Ontario Provincial Police
Caledon 66,944 55 21 76 114 6 76 114 33.1 45.0 10 3.9Centre Wellington 93,470 84 26 110 118 18 110 118 28.5 43.9 10 5.5St.Clair 52,389 60 8 68 130 7 68 130 38.8 45.9 4 4.4Nottawasaga 56,314 48 19 67 119 11 67 119 37.3 48.6 0 3.0Norfolk 64,592 74 15 89 138 12 89 138 52.5 39.1 4 0.0Stormont/Dundas/Glengarry 65,716 64 13 77 117 11 77 117 39.5 47.6 -2 2.6
Population 15,000 to 49,999Amherstburg 22,261 27 3 30 135 3 31 139 24.3 34.0 -1 0.0Brockville 23,215 36 6 42 181 25 42 181 79.1 54.9 0 4.8Cobourg 19,269 27 5 32 166 39 32 166 51.7 45.7 -1 6.3Cornwall Community Police 47,357 79 12 91 192 45 90 190 106.5 45.0 3 8.8Kawartha Lakes Police 24,712 31 12 43 174 22 40 162 95.6 50.6 0 4.7Lasalle 28,086 30 6 36 128 22 36 128 25.5 36.9 0 2.8Midland 18,353 24 3 27 147 15 27 147 113.6 40.6 -1 3.7Nishnawbe-Aski 10 17,156 115 20 135 787 45 150 874 251.2 49.0 .. ..Orangeville 28,955 38 4 42 145 22 39 135 36.7 50.6 0 7.1Owen Sound 22,954 32 7 39 170 35 41 179 63.2 60.8 -2 2.6St. Thomas 38,787 56 12 68 175 21 67 173 47.1 47.7 0 10.3Stratford 31,708 49 6 55 173 20 57 180 55.9 47.3 -2 5.5Strathroy-Caradoc 21,565 26 4 30 139 13 31 144 39.0 39.4 0 3.3Timmins 42,821 73 10 83 194 46 86 201 101.5 52.8 0 2.4Woodstock Police Service 10 37,439 54 11 65 174 39 65 174 72.8 38.2 .. ..Ontario Provincial Police
Bracebridge/Gravenhurst 36,218 55 13 68 188 5 68 188 54.2 39.8 5 4.4Brant County 36,757 38 11 49 133 4 49 133 44.5 36.3 -3 4.1Collingwood 19,347 28 8 36 186 11 36 186 62.1 52.9 1 2.8Elgin County 45,032 32 8 40 89 3 40 89 27.3 45.5 4 2.5Essex County 20,616 24 5 29 141 4 29 141 33.5 45.4 0 0.0Haldimand 46,117 44 12 56 121 5 56 121 56.2 40.8 4 5.4Hunstville 23,338 32 9 41 176 3 41 176 63.0 42.0 4 0.0Kenora 18,994 39 9 48 253 7 48 253 66.1 46.7 0 2.1Kingsville 21,563 21 4 25 116 2 25 116 32.1 58.3 0 0.0Lakeshore 33,885 28 6 34 100 4 34 100 28.3 41.2 0 0.0Leamington 29,639 32 7 39 132 10 39 132 44.5 52.1 0 7.7Loyalist 15,755 12 6 18 114 2 18 114 33.0 44.8 0 0.0Middlesex Group 35,046 25 5 30 86 3 30 86 26.4 33.1 -2 6.7Napanee 16,287 18 8 26 160 3 26 160 28.4 51.2 3 3.8Orillia 33,815 42 11 53 157 13 53 157 78.4 55.2 -3 3.8Prince Edward County 27,123 27 6 33 122 3 33 122 50.5 47.4 2 6.1Quinte West 42,253 43 16 59 140 12 59 140 48.2 45.4 5 5.1Smith/Ennismore/Lakefield 15,787 11 2 13 82 2 13 82 32.6 49.0 0 7.7South Frontenac 19,311 14 3 17 88 2 17 88 38.5 45.5 -1 5.9Tecumseh 24,882 27 5 32 129 4 32 129 27.6 47.3 0 0.0Tillsonburg 15,727 18 5 23 146 3 23 146 52.5 58.6 0 4.3
See notes at the end of the table.
Statistics Canada – Catalogue no. 85-225-X 37

Police Resources in Canada – 2012
Table 12-6 – continued
Police personnel in municipal police services — Ontario, 2012
2012 Actual strength 2 2012 Authorizedstrength 3
2011 crime
Police officers
Policeservice
2011Population
1
Male Female Total
Policeofficers
per100,000
population4
Otherpersonnel
5 Totalpolice
Policeofficers
per100,000
population4
CrimeSeverity
Index6
Weightedclearance
rate7
Net gainor loss:
2011hirings
anddepartures
2011Police
officerseligible
toretire
8
number rate number rate number percent
Population 5,000 to 14,999Anishinabek 11 8,039 .. .. .. .. .. .. .. 27.0 81.8 .. ..Aylmer 7,599 10 3 13 171 4 13 171 37.3 44.5 0 0.0Dryden 8,489 16 5 21 247 13 21 247 67.6 57.3 2 9.5Espanola 5,273 10 2 12 228 6 12 228 62.8 66.3 0 0.0Gananoque 5,554 12 3 15 270 9 15 270 50.6 44.1 0 0.0Hanover 7,580 13 2 15 198 11 15 198 76.4 67.7 0 0.0Pembroke 14,610 24 1 25 171 26 30 205 68.5 45.3 -2 0.0Perth 6,319 13 2 15 237 8 15 237 70.0 50.0 0 0.0Port Hope 12,687 19 2 21 166 17 21 166 44.2 46.5 -1 0.0Saugeen Shores 12,203 18 4 22 180 3 22 180 41.4 52.8 0 0.0Shelburne 5,546 12 1 13 234 4 13 234 43.2 77.3 -1 7.7Six Nations Police 11 6,942 .. .. .. .. .. .. .. 249.4 29.0 .. ..Smiths Falls 9,623 22 3 25 260 10 25 260 103.3 52.2 11 4.0Stirling-Rawdon 5,043 10 0 10 198 1 10 198 29.6 40.3 -1 0.0Treaty Three Communities 6,595 69 16 85 1,289 23 87 1,319 707.9 83.5 2 0.0West Grey 12,730 20 2 22 173 1 22 173 49.9 57.8 0 0.0West Nipissing 13,937 20 2 22 158 7 23 165 45.7 57.2 0 0.0Ontario Provincial Police
Alnwick/Haldimand 7,150 6 1 7 98 1 7 98 30.9 27.3 0 0.0Augusta 7,824 5 1 6 77 0 6 77 24.1 38.1 0 0.0Beckwith 6,424 2 1 3 47 0 3 47 27.3 29.7 0 0.0Blandford-Blenheim 7,461 6 1 7 94 1 7 94 33.5 21.0 0 0.0Blue Mountains 7,290 15 3 18 247 1 18 247 46.9 35.4 0 0.0Brighton 10,729 9 3 12 112 1 12 112 43.7 48.1 0 0.0Brockton 9,952 14 3 17 171 1 17 171 53.3 43.2 0 11.8Carleton Place 9,755 13 4 17 174 2 17 174 85.0 44.4 0 0.0Cavan/Millbrook/North Monaghan 9,183 8 2 10 109 1 10 109 27.9 57.1 0 0.0Central Huron 12 .. 7 2 9 .. 1 9 .. .. .. .. ..Chatsworth 6,669 4 1 5 75 0 5 75 24.0 45.3 0 0.0Cramahe 6,118 6 2 8 131 1 8 131 31.8 43.1 0 0.0Douro-Dummer 7,965 4 0 4 50 1 4 50 25.4 42.0 0 0.0East-Zorra Tavistock 7,791 6 2 8 103 1 8 103 26.8 18.9 0 0.0Elliot Lake 11,866 16 3 19 160 5 19 160 63.4 52.4 2 5.3Fort Frances 8,163 14 4 18 221 1 18 221 73.7 55.6 -1 0.0Georgian Bluffs 10,979 6 2 8 73 0 8 73 21.5 49.7 0 0.0Peterborough County
(Galaway/Cavendish/Harvey) 5,588 5 1 6 107 1 6 107 43.4 28.8 0 0.0Goderich 7,735 10 3 13 168 2 13 168 66.0 35.9 3 0.0Grey Highlands 9,931 8 3 11 111 1 11 111 53.2 59.9 4 18.2Hamilton Township 11,335 7 3 10 88 1 10 88 31.2 29.6 0 0.0Hawkesbury 12,005 22 3 25 208 5 25 208 97.0 45.2 3 0.0Hearst 5,598 8 3 11 196 1 11 196 53.2 60.4 0 0.0Ingersoll Town 12,334 14 5 19 154 2 19 154 62.7 46.9 0 0.0Kapuskasing 8,523 10 4 14 164 2 14 164 71.0 70.6 5 0.0Kincardine 11,564 14 3 17 147 1 17 147 46.7 40.1 4 11.8Kirkland Lake 8,249 16 3 19 230 1 19 230 103.5 63.7 3 5.3Lanark Highlands 5,456 3 1 4 73 0 4 73 29.5 31.7 0 0.0Meaford 11,552 11 2 13 113 1 13 113 27.3 53.9 3 15.4Mississippi Mills 12,198 7 3 10 82 2 10 82 31.3 33.0 0 0.0Mono 7,808 6 2 8 102 1 8 102 25.5 39.5 2 0.0North Grenville 14,533 15 5 20 138 2 20 138 33.0 49.6 0 0.0North Perth 12,725 13 5 18 141 2 18 141 61.9 27.1 3 0.0Norwich 10,974 7 2 9 82 1 9 82 32.3 29.7 0 0.0Otonabee/South Monaghan 6,528 5 2 7 107 1 7 107 34.0 52.6 0 0.0Penetanguishene 10,435 11 6 17 163 1 17 163 66.5 58.0 1 5.9Petawawa 13,288 8 2 10 75 1 10 75 30.3 47.3 -3 0.0Renfrew 8,243 10 3 13 158 3 13 158 66.1 56.1 7 0.0Rideau Lakes 10,962 8 3 11 100 1 11 100 36.3 42.1 1 54.5Russell 14,704 12 3 15 102 1 15 102 28.5 38.3 -5 0.0Russell County/Hawkesbury (The
Nation) 11,453 7 2 9 79 1 9 79 42.9 51.8 0 0.0South Bruce Peninsula 8,745 14 2 16 183 1 16 183 47.4 42.9 0 12.5South Huron 10,159 9 3 12 118 1 12 118 44.9 36.9 6 0.0Southgate 7,398 5 1 6 81 0 6 81 42.8 42.3 0 0.0St. Marys 6,851 7 3 10 146 0 10 146 45.4 31.4 0 0.0Stone Mills 7,893 4 2 6 76 1 6 76 33.0 50.0 0 0.0Tay Valley Township 5,904 2 1 3 51 0 3 51 43.0 30.3 0 0.0Thames Centre 14,061 9 2 11 78 1 11 78 28.1 30.5 0 0.0Trent Hills 12,926 14 5 19 147 5 19 147 52.3 48.8 2 26.3West Perth 9,110 9 3 12 132 1 12 132 39.5 30.9 0 0.0
See notes at the end of the table.
38 Statistics Canada – Catalogue no. 85-225-X

Police Resources in Canada – 2012
Table 12-6 – continued
Police personnel in municipal police services — Ontario, 2012
2012 Actual strength 2 2012 Authorizedstrength 3
2011 crime
Police officers
Policeservice
2011Population
1
Male Female Total
Policeofficers
per100,000
population4
Otherpersonnel
5 Totalpolice
Policeofficers
per100,000
population4
CrimeSeverity
Index6
Weightedclearance
rate7
Net gainor loss:
2011hirings
anddepartures
2011Police
officerseligible
toretire
8
number rate number rate number percent
Population less than 5,000Akwesasne Mohawk 4,362 29 4 33 757 9 33 757 108.4 68.6 2 3.0Deep River 4,434 8 1 9 203 9 9 203 54.7 76.3 0 0.0Lac Seul 13 810 7 1 8 988 15 9 1,111 .. .. 0 0.0Rama Police Service 13 881 16 3 19 2,157 3 19 2,157 .. .. 2 0.0U.C.C.M. Anishnaabe Police 1,827 15 3 18 985 8 18 985 321.3 55.3 0 0.0Wikwemikong 2,373 17 1 18 759 14 18 759 553.9 124.0 0 5.6Wingham 2,870 7 0 7 244 1 7 244 68.6 60.3 0 0.0Ontario Provincial Police
Admaston-Bromley 13 474 1 0 1 211 0 1 211 .. .. 0 0.0Amaranth 4,193 3 0 3 72 0 3 72 23.8 21.1 0 0.0Asphodel-Norwood 4,484 5 0 5 112 0 5 112 38.2 69.5 0 0.0Atikokan 3,286 8 2 10 304 1 10 304 62.1 69.8 0 0.0Blind River 2,795 7 2 9 322 0 9 322 59.2 57.8 0 0.0Bonfield 2,028 2 0 2 99 0 2 99 49.5 51.7 0 0.0Bonnechere Valley 14 .. 3 1 4 .. 1 4 .. .. .. .. ..Bruce Mines 602 1 0 1 166 0 1 166 .. .. 0 0.0Casselman 3,505 5 1 6 171 1 6 171 74.6 48.4 0 0.0Cochrane 3,909 10 2 12 307 2 12 307 135.6 59.0 0 0.0Dymond 1,256 3 0 3 239 0 3 239 57.2 66.7 0 0.0East Ferris 4,376 1 1 2 46 0 2 46 13.2 56.9 0 0.0East Garafraxa 2,594 1 1 2 77 0 2 77 20.8 26.0 0 0.0East Luther-Grand Valley 3,026 3 0 3 99 0 3 99 22.1 29.9 0 0.0Havelock/Belmont/Methuen 4,914 5 1 6 122 1 6 122 82.9 45.1 0 0.0Highway 407 … 35 5 40 … 3 40 … … … -1 5.0Ignace 1,491 4 0 4 268 0 4 268 111.6 52.9 0 25.0Johnson 13 698 0 1 1 143 0 1 143 .. .. 0 0.0Laird 1,069 1 0 1 94 0 1 94 20.5 66.2 -1 0.0Laurentian Valley 2,262 2 0 2 88 0 2 88 25.7 55.9 0 0.0Macdonald/Meredith 1,515 1 0 1 66 0 1 66 39.9 37.7 -1 0.0Machin 13 995 1 0 1 101 0 1 101 .. .. 0 0.0Marathon 4,029 9 0 9 223 1 9 223 41.2 81.4 0 0.0Mattawa 3,898 6 1 7 180 1 7 180 74.6 61.3 -2 28.6Melancthon 3,157 2 0 2 63 0 2 63 26.7 39.4 0 0.0Merrickville 2,998 2 1 3 100 0 3 100 49.1 42.7 0 0.0Montague 3,337 3 0 3 90 0 3 90 47.2 32.6 0 0.0Mulmur 3,607 3 1 4 111 0 4 111 29.8 36.8 0 0.0New Liskeard (Temiskaming Shores) 4,606 8 1 9 195 1 9 195 72.0 60.3 2 0.0North Kawartha 2,482 3 1 4 161 1 4 161 72.0 22.1 0 0.0North Shore 13 570 0 0 0 0 0 0 0 .. .. 0 0.0Point Edward 2,071 6 0 6 290 0 6 290 59.8 38.8 0 0.0Port Hope 4,459 4 1 5 112 0 5 112 22.7 30.7 0 0.0Powassan 3,448 3 0 3 87 0 3 87 29.3 64.3 0 0.0Prescott 4,400 10 3 13 295 1 13 295 82.3 59.1 0 0.0Red Lake 4,656 13 3 16 344 1 16 344 81.3 66.8 10 0.0Red Rock 1,064 2 0 2 188 0 2 188 33.3 79.5 1 0.0
See notes at the end of the table.
Statistics Canada – Catalogue no. 85-225-X 39
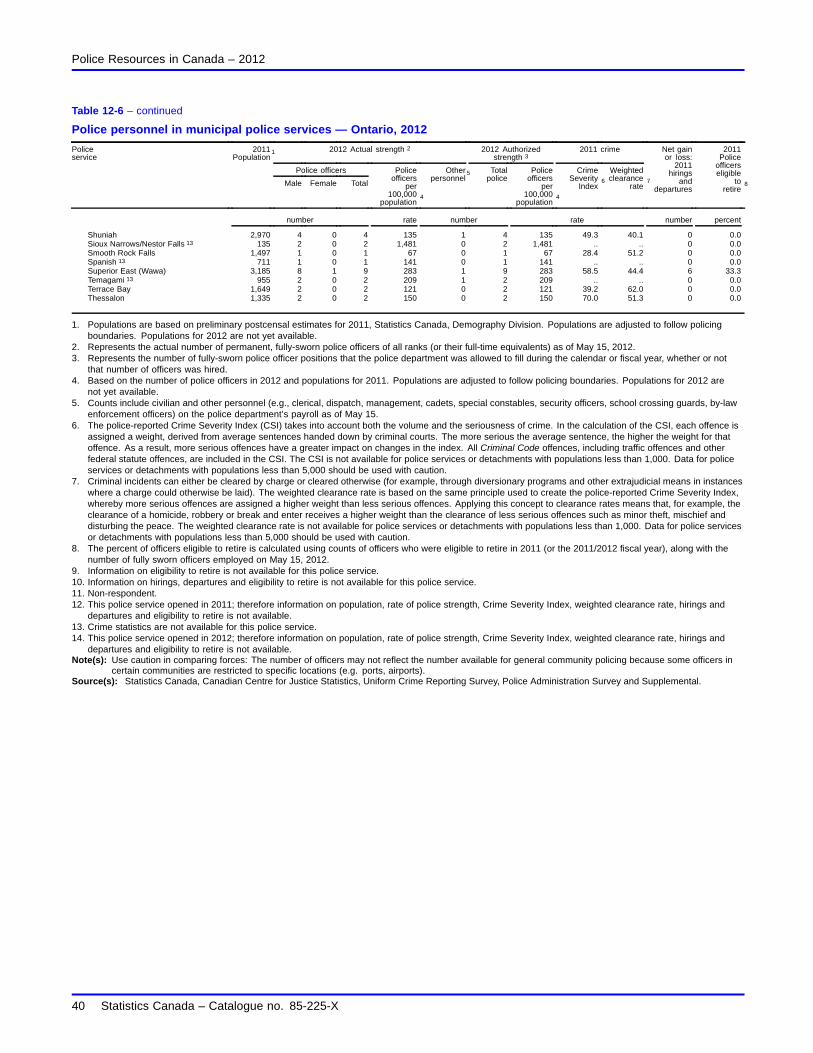
Police Resources in Canada – 2012
Table 12-6 – continued
Police personnel in municipal police services — Ontario, 2012
2012 Actual strength 2 2012 Authorizedstrength 3
2011 crime
Police officers
Policeservice
2011Population
1
Male Female Total
Policeofficers
per100,000
population4
Otherpersonnel
5 Totalpolice
Policeofficers
per100,000
population4
CrimeSeverity
Index6
Weightedclearance
rate7
Net gainor loss:
2011hirings
anddepartures
2011Police
officerseligible
toretire
8
number rate number rate number percent
Shuniah 2,970 4 0 4 135 1 4 135 49.3 40.1 0 0.0Sioux Narrows/Nestor Falls 13 135 2 0 2 1,481 0 2 1,481 .. .. 0 0.0Smooth Rock Falls 1,497 1 0 1 67 0 1 67 28.4 51.2 0 0.0Spanish 13 711 1 0 1 141 0 1 141 .. .. 0 0.0Superior East (Wawa) 3,185 8 1 9 283 1 9 283 58.5 44.4 6 33.3Temagami 13 955 2 0 2 209 1 2 209 .. .. 0 0.0Terrace Bay 1,649 2 0 2 121 0 2 121 39.2 62.0 0 0.0Thessalon 1,335 2 0 2 150 0 2 150 70.0 51.3 0 0.0
1. Populations are based on preliminary postcensal estimates for 2011, Statistics Canada, Demography Division. Populations are adjusted to follow policingboundaries. Populations for 2012 are not yet available.
2. Represents the actual number of permanent, fully-sworn police officers of all ranks (or their full-time equivalents) as of May 15, 2012.3. Represents the number of fully-sworn police officer positions that the police department was allowed to fill during the calendar or fiscal year, whether or not
that number of officers was hired.4. Based on the number of police officers in 2012 and populations for 2011. Populations are adjusted to follow policing boundaries. Populations for 2012 are
not yet available.5. Counts include civilian and other personnel (e.g., clerical, dispatch, management, cadets, special constables, security officers, school crossing guards, by-law
enforcement officers) on the police department’s payroll as of May 15.6. The police-reported Crime Severity Index (CSI) takes into account both the volume and the seriousness of crime. In the calculation of the CSI, each offence is
assigned a weight, derived from average sentences handed down by criminal courts. The more serious the average sentence, the higher the weight for thatoffence. As a result, more serious offences have a greater impact on changes in the index. All Criminal Code offences, including traffic offences and otherfederal statute offences, are included in the CSI. The CSI is not available for police services or detachments with populations less than 1,000. Data for policeservices or detachments with populations less than 5,000 should be used with caution.
7. Criminal incidents can either be cleared by charge or cleared otherwise (for example, through diversionary programs and other extrajudicial means in instanceswhere a charge could otherwise be laid). The weighted clearance rate is based on the same principle used to create the police-reported Crime Severity Index,whereby more serious offences are assigned a higher weight than less serious offences. Applying this concept to clearance rates means that, for example, theclearance of a homicide, robbery or break and enter receives a higher weight than the clearance of less serious offences such as minor theft, mischief anddisturbing the peace. The weighted clearance rate is not available for police services or detachments with populations less than 1,000. Data for police servicesor detachments with populations less than 5,000 should be used with caution.
8. The percent of officers eligible to retire is calculated using counts of officers who were eligible to retire in 2011 (or the 2011/2012 fiscal year), along with thenumber of fully sworn officers employed on May 15, 2012.
9. Information on eligibility to retire is not available for this police service.10. Information on hirings, departures and eligibility to retire is not available for this police service.11. Non-respondent.12. This police service opened in 2011; therefore information on population, rate of police strength, Crime Severity Index, weighted clearance rate, hirings and
departures and eligibility to retire is not available.13. Crime statistics are not available for this police service.14. This police service opened in 2012; therefore information on population, rate of police strength, Crime Severity Index, weighted clearance rate, hirings and
departures and eligibility to retire is not available.Note(s): Use caution in comparing forces: The number of officers may not reflect the number available for general community policing because some officers in
certain communities are restricted to specific locations (e.g. ports, airports).Source(s): Statistics Canada, Canadian Centre for Justice Statistics, Uniform Crime Reporting Survey, Police Administration Survey and Supplemental.
40 Statistics Canada – Catalogue no. 85-225-X

Police Resources in Canada – 2012
Table 12-7Police personnel in municipal police services — Manitoba, 2012
2012 Actual strength 2 2012 Authorizedstrength 3
2011 crime
Police officers
Policeservice
2011Population
1
Male Female Total
Policeofficers
per100,000
population4
Otherpersonnel
5Total
policePolice
officersper
100,000population
4
CrimeSeverity
Index6
Weightedclearance
rate7
Net gainor loss:
2011hirings
anddepartures
2011Police
officerseligible
toretire
8
number rate number rate number percent
Population 100,000 and overWinnipeg 691,778 1,244 228 1,472 213 464 1,441 208 113.6 36.1 66 10.7Population 15,000 to 49,999Brandon 44,658 76 11 87 195 27 87 195 82.3 48.0 1 8.0Population 5,000 to 14,999Altona 5,204 8 0 8 154 1 8 154 71.0 73.6 1 0.0Dakota Ojibway 5,366 19 8 27 503 11 31 578 833.0 57.8 3 0.0Morden 7,692 14 1 15 195 2 15 195 79.4 69.5 1 0.0Winkler 10,703 17 0 17 159 2 17 159 55.9 40.7 0 5.9Royal Canadian Mounted Police
Dauphin 7,782 14 4 18 231 0 16 206 194.6 41.8 2 0.0Flin Flon 5,985 7 2 9 150 0 10 167 165.3 60.4 1 0.0Portage la Prairie 13,093 27 4 31 237 0 28 214 217.1 41.8 3 0.0Selkirk 10,488 16 3 19 181 6 20 191 157.6 41.4 0 0.0Steinbach 13,226 11 1 12 91 2 13 98 85.9 39.3 2 0.0The Pas 5,756 13 2 15 261 0 16 278 305.7 55.6 1 13.3Thompson 14,784 24 11 35 237 0 40 271 273.2 62.1 1 2.9
Population less than 5,000Rivers 1,289 3 0 3 233 4 3 233 72.5 30.7 0 0.0Ste. Anne 1,806 5 0 5 277 0 5 277 52.7 40.8 0 0.0Royal Canadian Mounted Police
Beausejour 3,212 3 0 3 93 0 3 93 73.6 34.2 0 0.0Boissevan 1,489 1 1 2 134 0 2 134 44.8 24.8 1 0.0Carman 3,216 2 1 3 93 0 3 93 71.9 41.4 0 0.0Gillam 1,337 4 0 4 299 0 4 299 168.7 78.1 0 0.0Gimli 1,971 3 0 3 152 0 3 152 97.8 35.8 0 0.0Killarney 2,247 2 1 3 134 0 3 134 118.2 54.9 1 0.0Minnedosa 2,503 3 0 3 120 0 4 160 82.4 39.4 1 0.0Neepawa 3,360 2 2 4 119 0 4 119 91.4 35.0 0 0.0Pinawa 1,476 2 0 2 136 0 2 136 30.0 12.9 1 0.0Roblin 1,653 2 0 2 121 0 2 121 148.4 50.9 0 0.0Russell 1,505 2 0 2 133 0 2 133 101.1 48.1 0 0.0Souris 1,900 2 0 2 105 0 2 105 35.6 30.2 -1 0.0Stonewall 4,545 5 0 5 110 0 4 88 52.1 51.3 0 0.0Swan River 3,814 7 1 8 210 0 8 210 261.6 50.4 1 0.0Virden 3,165 5 0 5 158 0 5 158 70.6 45.7 0 0.0
1. Populations are based on preliminary postcensal estimates for 2011, Statistics Canada, Demography Division. Populations are adjusted to follow policingboundaries. Populations for 2012 are not yet available.
2. Represents the actual number of permanent, fully-sworn police officers of all ranks (or their full-time equivalents) as of May 15, 2012.3. Represents the number of fully-sworn police officer positions that the police department was allowed to fill during the calendar or fiscal year, whether or not
that number of officers was hired.4. Based on the number of police officers in 2012 and populations for 2011. Populations are adjusted to follow policing boundaries. Populations for 2012 are
not yet available.5. Counts include civilian and other personnel (e.g., clerical, dispatch, management, cadets, special constables, security officers, school crossing guards, by-law
enforcement officers) on the police department’s payroll as of May 15.6. The police-reported Crime Severity Index (CSI) takes into account both the volume and the seriousness of crime. In the calculation of the CSI, each offence is
assigned a weight, derived from average sentences handed down by criminal courts. The more serious the average sentence, the higher the weight for thatoffence. As a result, more serious offences have a greater impact on changes in the index. All Criminal Code offences, including traffic offences and otherfederal statute offences, are included in the CSI. The CSI is not available for police services or detachments with populations less than 1,000. Data for policeservices or detachments with populations less than 5,000 should be used with caution.
7. Criminal incidents can either be cleared by charge or cleared otherwise (for example, through diversionary programs and other extrajudicial means in instanceswhere a charge could otherwise be laid). The weighted clearance rate is based on the same principle used to create the police-reported Crime Severity Index,whereby more serious offences are assigned a higher weight than less serious offences. Applying this concept to clearance rates means that, for example, theclearance of a homicide, robbery or break and enter receives a higher weight than the clearance of less serious offences such as minor theft, mischief anddisturbing the peace. The weighted clearance rate is not available for police services or detachments with populations less than 1,000. Data for police servicesor detachments with populations less than 5,000 should be used with caution.
8. The percent of officers eligible to retire is calculated using counts of officers who were eligible to retire in 2011 (or the 2011/2012 fiscal year), along with thenumber of fully sworn officers employed on May 15, 2012.
Note(s): Use caution in comparing forces: The number of officers may not reflect the number available for general community policing because some officers incertain communities are restricted to specific locations (e.g. ports, airports). Note for the Royal Canadian Mounted Police municipal contracts: Municipalemployees working within detachments of the Royal Canadian Mounted Police are not included in the category “other personnel”.
Source(s): Statistics Canada, Canadian Centre for Justice Statistics, Uniform Crime Reporting Survey, Police Administration Survey and Supplemental.
Statistics Canada – Catalogue no. 85-225-X 41

Police Resources in Canada – 2012
Table 12-8Police personnel in municipal police services — Saskatchewan, 2012
2012 Actual strength 2 2012 Authorizedstrength 3
2011 crime
Police officers
Policeservice
2011Population
1
Male Female Total
Policeofficers
per100,000
population4
Otherpersonnel
5Total
policePolice
officersper
100,000population
4
CrimeSeverity
Index6
Weightedclearance
rate7
Net gainor loss:
2011hirings
anddepartures
2011Police
officerseligible
toretire
8
number rate number rate number percent
Population 100,000 and overRegina 9 201,030 293 92 385 192 156 385 192 130.0 43.0 -9 5.7Saskatoon 233,987 339 107 446 191 210 435 186 128.8 36.4 6 18.4Population 15,000 to 49,999Moose Jaw 33,356 50 3 53 159 24 53 159 114.6 40.3 1 0.0Prince Albert 36,938 81 10 91 246 33 91 246 217.1 50.9 2 5.5Royal Canadian Mounted Police
Lloydminster 10 … … … … … … … … … … … …Swift Current 15,533 12 6 18 116 0 18 116 119.6 38.9 1 5.6Yorkton 15,161 22 7 29 191 0 27 178 192.4 57.0 2 3.4
Population 5,000 to 14,999Estevan 10,785 19 4 23 213 9 25 232 156.7 40.1 0 13.0Weyburn 9,933 16 3 19 191 7 19 191 108.4 48.0 1 15.8Royal Canadian Mounted Police
Humboldt 5,388 4 1 5 93 0 5 93 63.7 53.9 0 0.0Martensville 5,794 3 1 4 69 0 5 86 65.2 50.7 0 0.0Meadow Lake 5,299 10 3 13 245 0 13 245 366.8 51.7 1 0.0Melfort 5,153 5 2 7 136 0 7 136 111.7 60.9 0 0.0North Battleford 14,007 29 5 34 243 0 35 250 361.0 50.3 -1 2.9Warman 6,937 5 1 6 86 0 6 86 41.8 51.3 0 0.0
Population less than 5,000Caronport 11 958 1 0 1 104 0 1 104 .. .. 0 0.0Corman Park Police 12 ... 6 0 6 … 3 7 … … … 2 66.7Dalmeny 1,809 2 1 3 166 0 3 166 50.2 41.8 0 0.0File Hills First Nations 1,894 3 2 5 264 5 7 370 312.6 72.2 0 20.0Luseland 11 587 1 0 1 170 1 1 170 .. .. 0 0.0Royal Canadian Mounted Police 13
Battleford 3,837 4 2 6 156 0 5 130 85.4 45.0 0 0.0
1. Populations are based on preliminary postcensal estimates for 2011, Statistics Canada, Demography Division. Populations are adjusted to follow policingboundaries. Populations for 2012 are not yet available.
2. Represents the actual number of permanent, fully-sworn police officers of all ranks (or their full-time equivalents) as of May 15, 2012.3. Represents the number of fully-sworn police officer positions that the police department was allowed to fill during the calendar or fiscal year, whether or not
that number of officers was hired.4. Based on the number of police officers in 2012 and populations for 2011. Populations are adjusted to follow policing boundaries. Populations for 2012 are
not yet available.5. Counts include civilian and other personnel (e.g., clerical, dispatch, management, cadets, special constables, security officers, school crossing guards, by-law
enforcement officers) on the police department’s payroll as of May 15.6. The police-reported Crime Severity Index (CSI) takes into account both the volume and the seriousness of crime. In the calculation of the CSI, each offence is
assigned a weight, derived from average sentences handed down by criminal courts. The more serious the average sentence, the higher the weight for thatoffence. As a result, more serious offences have a greater impact on changes in the index. All Criminal Code offences, including traffic offences and otherfederal statute offences, are included in the CSI. The CSI is not available for police services or detachments with populations less than 1,000. Data for policeservices or detachments with populations less than 5,000 should be used with caution.
7. Criminal incidents can either be cleared by charge or cleared otherwise (for example, through diversionary programs and other extrajudicial means in instanceswhere a charge could otherwise be laid). The weighted clearance rate is based on the same principle used to create the police-reported Crime Severity Index,whereby more serious offences are assigned a higher weight than less serious offences. Applying this concept to clearance rates means that, for example, theclearance of a homicide, robbery or break and enter receives a higher weight than the clearance of less serious offences such as minor theft, mischief anddisturbing the peace. The weighted clearance rate is not available for police services or detachments with populations less than 1,000. Data for police servicesor detachments with populations less than 5,000 should be used with caution.
8. The percent of officers eligible to retire is calculated using counts of officers who were eligible to retire in 2011 (or the 2011/2012 fiscal year), along with thenumber of fully sworn officers employed on May 15, 2012.
9. Number of personnel includes 62.3 federally or provincially funded officers and civilian personnel.10. The Saskatchewan portion of Lloydminster is policed by the Royal Canadian Mounted Police in Alberta.11. Crime statistics are not available for this police service.12. The Corman Park detachment of the Royal Canadian Mounted Police (RCMP) oversees municipal by-laws only. Criminal incidents are overseen by
neighbouring detachments of the RCMP.13. As part of the 2012 Police Service Agreement between the federal government and the province of Saskatchewan, several municipalities policed by the Royal
Canadian Mounted Police replaced their municipal policing contracts with provincial policing contracts. As a result, several municipal detachments of theRoyal Canadian Mounted Police that were listed in this publication in previous years are no longer included, as the detachments are now under provincialpolicing agreements. However, personnel counts and expenditures information for provincial policing agreements are included in data shown for the province ofSaskatchewan on tables 2-1, 2-2, 9 and 11 of this publication.
Note(s): Use caution in comparing forces: The number of officers may not reflect the number available for general community policing because some officers incertain communities are restricted to specific locations (e.g. ports, airports). Note for the Royal Canadian Mounted Police municipal contracts: Municipalemployees working within detachments of the Royal Canadian Mounted Police are not included in the category “other personnel”.
Source(s): Statistics Canada, Canadian Centre for Justice Statistics, Uniform Crime Reporting Survey, Police Administration Survey and Supplemental.
42 Statistics Canada – Catalogue no. 85-225-X
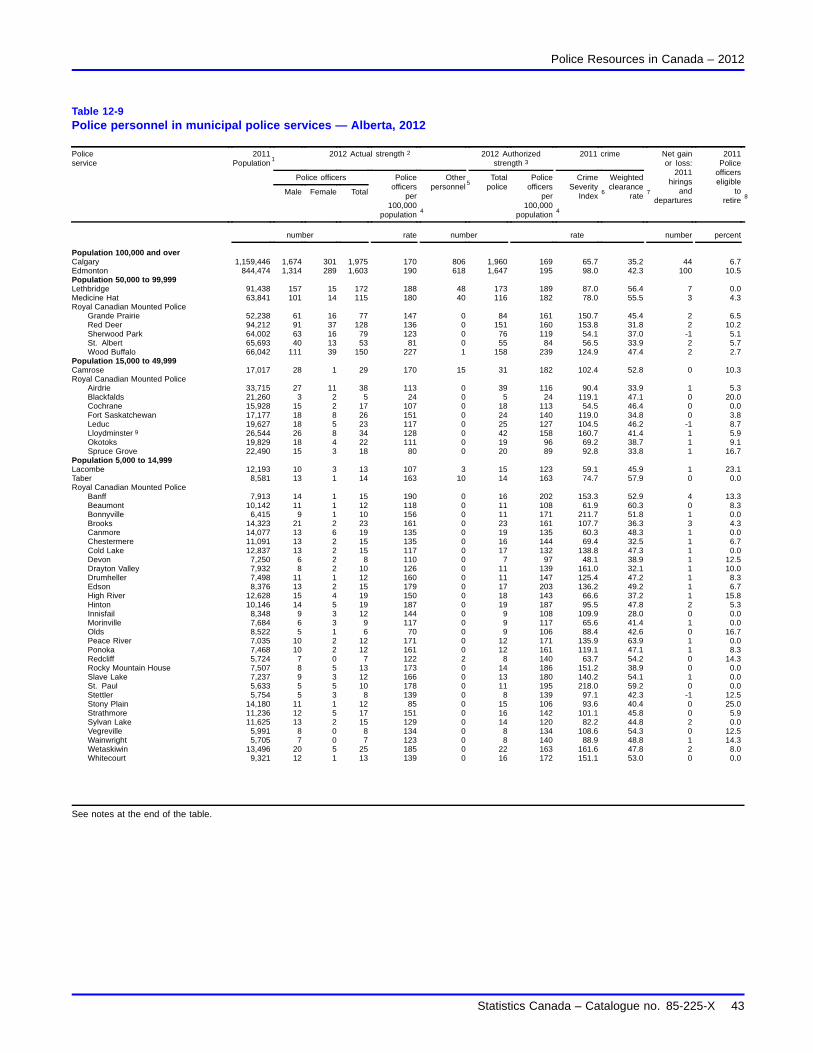
Police Resources in Canada – 2012
Table 12-9Police personnel in municipal police services — Alberta, 2012
2012 Actual strength 2 2012 Authorizedstrength 3
2011 crime
Police officers
Policeservice
2011Population
1
Male Female Total
Policeofficers
per100,000
population4
Otherpersonnel
5Total
policePolice
officersper
100,000population
4
CrimeSeverity
Index6
Weightedclearance
rate7
Net gainor loss:
2011hirings
anddepartures
2011Police
officerseligible
toretire
8
number rate number rate number percent
Population 100,000 and overCalgary 1,159,446 1,674 301 1,975 170 806 1,960 169 65.7 35.2 44 6.7Edmonton 844,474 1,314 289 1,603 190 618 1,647 195 98.0 42.3 100 10.5Population 50,000 to 99,999Lethbridge 91,438 157 15 172 188 48 173 189 87.0 56.4 7 0.0Medicine Hat 63,841 101 14 115 180 40 116 182 78.0 55.5 3 4.3Royal Canadian Mounted Police
Grande Prairie 52,238 61 16 77 147 0 84 161 150.7 45.4 2 6.5Red Deer 94,212 91 37 128 136 0 151 160 153.8 31.8 2 10.2Sherwood Park 64,002 63 16 79 123 0 76 119 54.1 37.0 -1 5.1St. Albert 65,693 40 13 53 81 0 55 84 56.5 33.9 2 5.7Wood Buffalo 66,042 111 39 150 227 1 158 239 124.9 47.4 2 2.7
Population 15,000 to 49,999Camrose 17,017 28 1 29 170 15 31 182 102.4 52.8 0 10.3Royal Canadian Mounted Police
Airdrie 33,715 27 11 38 113 0 39 116 90.4 33.9 1 5.3Blackfalds 21,260 3 2 5 24 0 5 24 119.1 47.1 0 20.0Cochrane 15,928 15 2 17 107 0 18 113 54.5 46.4 0 0.0Fort Saskatchewan 17,177 18 8 26 151 0 24 140 119.0 34.8 0 3.8Leduc 19,627 18 5 23 117 0 25 127 104.5 46.2 -1 8.7Lloydminster 9 26,544 26 8 34 128 0 42 158 160.7 41.4 1 5.9Okotoks 19,829 18 4 22 111 0 19 96 69.2 38.7 1 9.1Spruce Grove 22,490 15 3 18 80 0 20 89 92.8 33.8 1 16.7
Population 5,000 to 14,999Lacombe 12,193 10 3 13 107 3 15 123 59.1 45.9 1 23.1Taber 8,581 13 1 14 163 10 14 163 74.7 57.9 0 0.0Royal Canadian Mounted Police
Banff 7,913 14 1 15 190 0 16 202 153.3 52.9 4 13.3Beaumont 10,142 11 1 12 118 0 11 108 61.9 60.3 0 8.3Bonnyville 6,415 9 1 10 156 0 11 171 211.7 51.8 1 0.0Brooks 14,323 21 2 23 161 0 23 161 107.7 36.3 3 4.3Canmore 14,077 13 6 19 135 0 19 135 60.3 48.3 1 0.0Chestermere 11,091 13 2 15 135 0 16 144 69.4 32.5 1 6.7Cold Lake 12,837 13 2 15 117 0 17 132 138.8 47.3 1 0.0Devon 7,250 6 2 8 110 0 7 97 48.1 38.9 1 12.5Drayton Valley 7,932 8 2 10 126 0 11 139 161.0 32.1 1 10.0Drumheller 7,498 11 1 12 160 0 11 147 125.4 47.2 1 8.3Edson 8,376 13 2 15 179 0 17 203 136.2 49.2 1 6.7High River 12,628 15 4 19 150 0 18 143 66.6 37.2 1 15.8Hinton 10,146 14 5 19 187 0 19 187 95.5 47.8 2 5.3Innisfail 8,348 9 3 12 144 0 9 108 109.9 28.0 0 0.0Morinville 7,684 6 3 9 117 0 9 117 65.6 41.4 1 0.0Olds 8,522 5 1 6 70 0 9 106 88.4 42.6 0 16.7Peace River 7,035 10 2 12 171 0 12 171 135.9 63.9 1 0.0Ponoka 7,468 10 2 12 161 0 12 161 119.1 47.1 1 8.3Redcliff 5,724 7 0 7 122 2 8 140 63.7 54.2 0 14.3Rocky Mountain House 7,507 8 5 13 173 0 14 186 151.2 38.9 0 0.0Slave Lake 7,237 9 3 12 166 0 13 180 140.2 54.1 1 0.0St. Paul 5,633 5 5 10 178 0 11 195 218.0 59.2 0 0.0Stettler 5,754 5 3 8 139 0 8 139 97.1 42.3 -1 12.5Stony Plain 14,180 11 1 12 85 0 15 106 93.6 40.4 0 25.0Strathmore 11,236 12 5 17 151 0 16 142 101.1 45.8 0 5.9Sylvan Lake 11,625 13 2 15 129 0 14 120 82.2 44.8 2 0.0Vegreville 5,991 8 0 8 134 0 8 134 108.6 54.3 0 12.5Wainwright 5,705 7 0 7 123 0 8 140 88.9 48.8 1 14.3Wetaskiwin 13,496 20 5 25 185 0 22 163 161.6 47.8 2 8.0Whitecourt 9,321 12 1 13 139 0 16 172 151.1 53.0 0 0.0
See notes at the end of the table.
Statistics Canada – Catalogue no. 85-225-X 43

Police Resources in Canada – 2012
Table 12-9 – continued
Police personnel in municipal police services — Alberta, 2012
2012 Actual strength 2 2012 Authorizedstrength 3
2011 crime
Police officers
Policeservice
2011Population
1
Male Female Total
Policeofficers
per100,000
population4
Otherpersonnel
5Total
policePolice
officersper
100,000population
4
CrimeSeverity
Index6
Weightedclearance
rate7
Net gainor loss:
2011hirings
anddepartures
2011Police
officerseligible
toretire
8
number rate number rate number percent
Population less than 5,000Blood Tribe Police 4,330 28 2 30 693 22 31 716 328.8 61.3 0 0.0Lakeshore Regional Police 1,945 8 1 9 463 2 10 514 436.7 78.4 0 22.2North Peace Tribal 1,239 5 1 6 484 1 6 484 385.6 81.0 0 0.0Tsuu T’ina Nation 3,054 9 2 11 360 3 11 360 150.8 84.6 1 36.4
1. Populations are based on preliminary postcensal estimates for 2011, Statistics Canada, Demography Division. Populations are adjusted to follow policingboundaries. Populations for 2012 are not yet available.
2. Represents the actual number of permanent, fully-sworn police officers of all ranks (or their full-time equivalents) as of May 15, 2012.3. Represents the number of fully-sworn police officer positions that the police department was allowed to fill during the calendar or fiscal year, whether or not
that number of officers was hired.4. Based on the number of police officers in 2012 and populations for 2011. Populations are adjusted to follow policing boundaries. Populations for 2012 are
not yet available.5. Counts include civilian and other personnel (e.g., clerical, dispatch, management, cadets, special constables, security officers, school crossing guards, by-law
enforcement officers) on the police department’s payroll as of May 15.6. The police-reported Crime Severity Index (CSI) takes into account both the volume and the seriousness of crime. In the calculation of the CSI, each offence is
assigned a weight, derived from average sentences handed down by criminal courts. The more serious the average sentence, the higher the weight for thatoffence. As a result, more serious offences have a greater impact on changes in the index. All Criminal Code offences, including traffic offences and otherfederal statute offences, are included in the CSI. The CSI is not available for police services or detachments with populations less than 1,000. Data for policeservices or detachments with populations less than 5,000 should be used with caution.
7. Criminal incidents can either be cleared by charge or cleared otherwise (for example, through diversionary programs and other extrajudicial means in instanceswhere a charge could otherwise be laid). The weighted clearance rate is based on the same principle used to create the police-reported Crime Severity Index,whereby more serious offences are assigned a higher weight than less serious offences. Applying this concept to clearance rates means that, for example, theclearance of a homicide, robbery or break and enter receives a higher weight than the clearance of less serious offences such as minor theft, mischief anddisturbing the peace. The weighted clearance rate is not available for police services or detachments with populations less than 1,000. Data for police servicesor detachments with populations less than 5,000 should be used with caution.
8. The percent of officers eligible to retire is calculated using counts of officers who were eligible to retire in 2011 (or the 2011/2012 fiscal year), along with thenumber of fully sworn officers employed on May 15, 2012.
9. Includes the portion of Lloydminster that is located in Saskatchewan.Note(s): Use caution in comparing forces: The number of officers may not reflect the number available for general community policing because some officers in
certain communities are restricted to specific locations (e.g. ports, airports). Note for the Royal Canadian Mounted Police municipal contracts: Municipalemployees working within detachments of the Royal Canadian Mounted Police are not included in the category “other personnel”.
Source(s): Statistics Canada, Canadian Centre for Justice Statistics, Uniform Crime Reporting Survey, Police Administration Survey and Supplemental.
44 Statistics Canada – Catalogue no. 85-225-X

Police Resources in Canada – 2012
Table 12-10Police personnel in municipal police services — British Columbia, 2012
2012 Actual strength 2 2012 Authorizedstrength 3
2011 crime
Police officers
Policeservice
2011Population
1
Male Female Total
Policeofficers
per100,000
population4
Otherpersonnel
5Total
policePolice
officersper
100,000population
4
CrimeSeverity
Index6
Weightedclearance
rate7
Net gainor loss:
2011hirings
anddepartures
2011Police
officerseligible
toretire
8
number rate number rate number percent
Population 100,000 and overAbbotsford 139,362 179 38 217 156 76 216 155 78.6 29.6 7 2.8Delta 110,828 129 36 165 149 69 170 153 78.6 29.6 6 0.0Saanich 118,064 119 34 153 130 51 154 130 44.5 33.7 -1 3.3Vancouver 669,867 1,048 304 1,352 202 430 1,327 198 103.4 30.1 -34 5.0Victoria 106,206 187 56 243 229 96 243 229 124.1 34.6 0 4.9Royal Canadian Mounted Police
Burnaby 233,291 224 75 299 128 3 278 119 93.3 25.2 11 7.0Coquitlam 130,336 111 38 149 114 2 144 110 66.7 20.1 11 12.8Kelowna 121,070 116 38 154 127 1 157 130 113.0 33.9 3 13.6Langley Township 107,061 93 34 127 119 1 127 119 98.1 17.5 -2 5.5Richmond 199,629 179 49 228 114 1 227 114 77.3 21.4 1 7.9Surrey 450,191 493 122 615 137 11 641 142 129.9 20.2 16 7.3
Population 50,000 to 99,999New Westminster 67,231 89 21 110 164 44 108 161 102.1 26.3 7 3.6West Vancouver 51,156 71 15 86 168 22 81 158 40.1 36.6 1 4.7Royal Canadian Mounted Police
Chilliwack 80,380 72 36 108 134 2 103 128 112.6 21.5 4 16.7Kamloops 86,043 96 31 127 148 2 122 142 111.6 31.3 -2 12.6Maple Ridge 78,098 66 21 87 111 0 86 110 85.4 24.6 3 2.3Nanaimo 86,429 117 28 145 168 1 139 161 108.9 39.2 -8 13.1North Vancouver City 51,858 41 16 57 110 0 64 123 78.2 33.6 2 10.5North Vancouver District 93,646 60 20 80 85 0 88 94 42.0 22.6 3 12.5Port Coquitlam 59,658 49 12 61 102 0 63 106 66.7 19.8 4 9.8Prince George 72,321 93 31 124 171 0 127 176 159.5 32.5 -1 6.5
Population 15,000 to 49,999Central Saanich 16,967 21 4 25 147 6 23 136 32.9 38.2 1 28.0Oak Bay 19,446 22 4 26 134 3 26 134 42.4 23.1 -1 26.9Port Moody 31,140 45 8 53 170 20 50 161 47.7 34.8 4 0.0Royal Canadian Mounted Police
Campbell River 31,035 31 12 43 139 0 43 139 108.9 45.2 0 14.0Colwood 15,806 8 7 15 95 2 15 95 41.7 36.9 0 6.7Courtenay 23,523 23 7 30 128 8 30 128 108.8 42.5 -1 10.0Cranbrook 19,495 16 7 23 118 0 26 133 101.1 34.1 -1 17.4Fort St. John 18,714 26 8 34 182 0 34 182 163.6 36.4 2 5.9Langford 24,271 16 13 29 119 1 26 107 84.7 45.2 -2 13.8Langley 27,118 38 17 55 203 1 52 192 170.5 15.5 1 14.5Mission 38,504 33 12 45 117 1 49 127 121.7 21.7 -1 4.4North Cowichan 29,528 24 4 28 95 0 31 105 78.4 32.2 -1 7.1Penticton 32,716 42 4 46 141 0 45 138 132.7 43.6 -1 8.7Pitt Meadows 17,762 14 8 22 124 0 22 124 65.1 21.8 0 9.1Port Alberni 18,584 22 8 30 161 0 34 183 141.1 45.2 -2 10.0Salmon Arm 17,062 13 5 18 105 0 19 111 104.5 20.0 -1 5.6Squamish 17,860 16 10 26 146 0 24 134 106.5 25.9 4 3.8Vernon 37,984 49 8 57 150 0 61 161 121.4 33.5 -1 12.3West Kelowna 30,413 14 5 19 62 0 22 72 55.2 26.4 0 5.3White Rock 21,808 14 6 20 92 0 23 105 63.6 18.1 0 5.0
Population 5,000 to 14,999Nelson 9,732 16 1 17 175 7 17 175 98.2 43.2 -1 0.0Royal Canadian Mounted Police
Castlegar 7,685 11 4 15 195 0 13 169 96.1 39.1 1 6.7Coldstream District Municipal 9,826 4 3 7 71 0 7 71 39.6 20.7 0 14.3Comox 13,016 5 5 10 77 4 11 85 40.2 25.1 0 20.0Dawson Creek 11,769 16 5 21 178 0 24 204 136.8 43.3 2 0.0Hope 7,009 11 3 14 200 0 13 185 176.4 31.5 1 7.1Kent 5,754 5 0 5 87 0 5 87 106.8 41.0 1 0.0Kimberley 6,604 8 1 9 136 0 8 121 68.2 23.6 -1 0.0Kitimat 9,098 12 3 15 165 0 15 165 94.3 42.1 3 0.0Ladysmith 8,111 3 4 7 86 1 7 86 81.0 26.9 0 14.3Lake Country 10,739 9 2 11 102 0 12 112 69.3 35.3 0 36.4Merritt 7,530 13 3 16 212 0 15 199 166.1 35.8 1 6.3North Saanich 11,805 8 3 11 93 0 13 110 34.7 33.6 0 0.0Parksville 12,207 9 6 15 123 2 16 131 67.6 30.2 0 13.3Powell River 13,485 15 3 18 133 0 18 133 73.8 37.2 0 11.1Prince Rupert 12,852 23 6 29 226 0 36 280 181.9 46.3 3 3.4Qualicum Beach 9,498 6 2 8 84 2 8 84 31.1 22.0 -1 0.0Quesnel 9,538 22 1 23 241 0 21 220 181.9 45.7 2 4.3Revelstoke 7,610 8 2 10 131 0 12 158 87.9 22.0 -1 0.0
See notes at the end of the table.
Statistics Canada – Catalogue no. 85-225-X 45
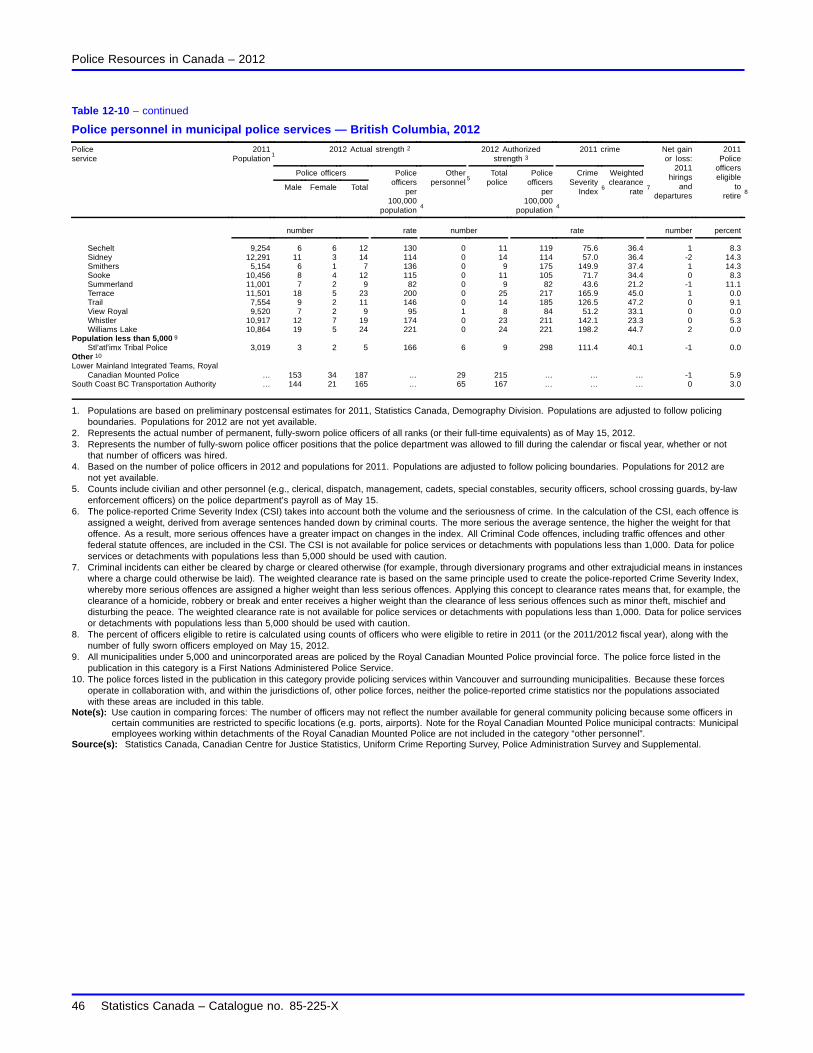
Police Resources in Canada – 2012
Table 12-10 – continued
Police personnel in municipal police services — British Columbia, 2012
2012 Actual strength 2 2012 Authorizedstrength 3
2011 crime
Police officers
Policeservice
2011Population
1
Male Female Total
Policeofficers
per100,000
population4
Otherpersonnel
5Total
policePolice
officersper
100,000population
4
CrimeSeverity
Index6
Weightedclearance
rate7
Net gainor loss:
2011hirings
anddepartures
2011Police
officerseligible
toretire
8
number rate number rate number percent
Sechelt 9,254 6 6 12 130 0 11 119 75.6 36.4 1 8.3Sidney 12,291 11 3 14 114 0 14 114 57.0 36.4 -2 14.3Smithers 5,154 6 1 7 136 0 9 175 149.9 37.4 1 14.3Sooke 10,456 8 4 12 115 0 11 105 71.7 34.4 0 8.3Summerland 11,001 7 2 9 82 0 9 82 43.6 21.2 -1 11.1Terrace 11,501 18 5 23 200 0 25 217 165.9 45.0 1 0.0Trail 7,554 9 2 11 146 0 14 185 126.5 47.2 0 9.1View Royal 9,520 7 2 9 95 1 8 84 51.2 33.1 0 0.0Whistler 10,917 12 7 19 174 0 23 211 142.1 23.3 0 5.3Williams Lake 10,864 19 5 24 221 0 24 221 198.2 44.7 2 0.0
Population less than 5,000 9
Stl’atl’imx Tribal Police 3,019 3 2 5 166 6 9 298 111.4 40.1 -1 0.0Other 10
Lower Mainland Integrated Teams, RoyalCanadian Mounted Police … 153 34 187 … 29 215 … … … -1 5.9
South Coast BC Transportation Authority … 144 21 165 … 65 167 … … … 0 3.0
1. Populations are based on preliminary postcensal estimates for 2011, Statistics Canada, Demography Division. Populations are adjusted to follow policingboundaries. Populations for 2012 are not yet available.
2. Represents the actual number of permanent, fully-sworn police officers of all ranks (or their full-time equivalents) as of May 15, 2012.3. Represents the number of fully-sworn police officer positions that the police department was allowed to fill during the calendar or fiscal year, whether or not
that number of officers was hired.4. Based on the number of police officers in 2012 and populations for 2011. Populations are adjusted to follow policing boundaries. Populations for 2012 are
not yet available.5. Counts include civilian and other personnel (e.g., clerical, dispatch, management, cadets, special constables, security officers, school crossing guards, by-law
enforcement officers) on the police department’s payroll as of May 15.6. The police-reported Crime Severity Index (CSI) takes into account both the volume and the seriousness of crime. In the calculation of the CSI, each offence is
assigned a weight, derived from average sentences handed down by criminal courts. The more serious the average sentence, the higher the weight for thatoffence. As a result, more serious offences have a greater impact on changes in the index. All Criminal Code offences, including traffic offences and otherfederal statute offences, are included in the CSI. The CSI is not available for police services or detachments with populations less than 1,000. Data for policeservices or detachments with populations less than 5,000 should be used with caution.
7. Criminal incidents can either be cleared by charge or cleared otherwise (for example, through diversionary programs and other extrajudicial means in instanceswhere a charge could otherwise be laid). The weighted clearance rate is based on the same principle used to create the police-reported Crime Severity Index,whereby more serious offences are assigned a higher weight than less serious offences. Applying this concept to clearance rates means that, for example, theclearance of a homicide, robbery or break and enter receives a higher weight than the clearance of less serious offences such as minor theft, mischief anddisturbing the peace. The weighted clearance rate is not available for police services or detachments with populations less than 1,000. Data for police servicesor detachments with populations less than 5,000 should be used with caution.
8. The percent of officers eligible to retire is calculated using counts of officers who were eligible to retire in 2011 (or the 2011/2012 fiscal year), along with thenumber of fully sworn officers employed on May 15, 2012.
9. All municipalities under 5,000 and unincorporated areas are policed by the Royal Canadian Mounted Police provincial force. The police force listed in thepublication in this category is a First Nations Administered Police Service.
10. The police forces listed in the publication in this category provide policing services within Vancouver and surrounding municipalities. Because these forcesoperate in collaboration with, and within the jurisdictions of, other police forces, neither the police-reported crime statistics nor the populations associatedwith these areas are included in this table.
Note(s): Use caution in comparing forces: The number of officers may not reflect the number available for general community policing because some officers incertain communities are restricted to specific locations (e.g. ports, airports). Note for the Royal Canadian Mounted Police municipal contracts: Municipalemployees working within detachments of the Royal Canadian Mounted Police are not included in the category “other personnel”.
Source(s): Statistics Canada, Canadian Centre for Justice Statistics, Uniform Crime Reporting Survey, Police Administration Survey and Supplemental.
46 Statistics Canada – Catalogue no. 85-225-X
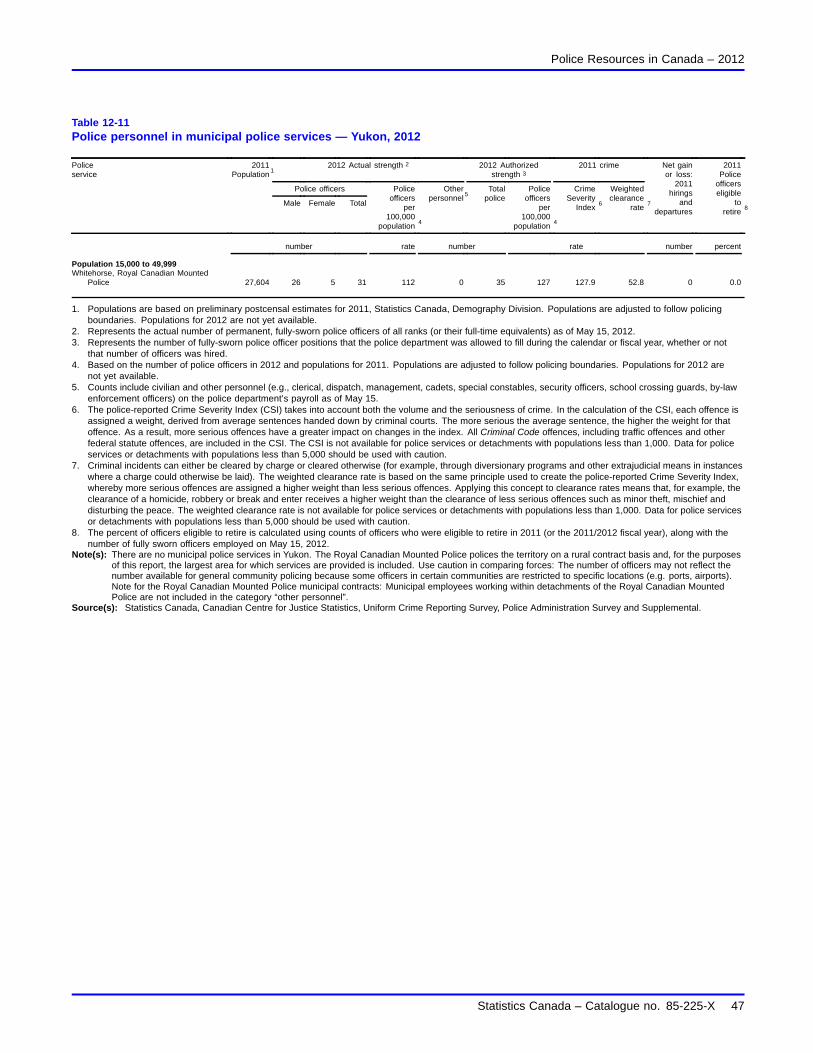
Police Resources in Canada – 2012
Table 12-11Police personnel in municipal police services — Yukon, 2012
2012 Actual strength 2 2012 Authorizedstrength 3
2011 crime
Police officers
Policeservice
2011Population
1
Male Female Total
Policeofficers
per100,000
population4
Otherpersonnel
5Total
policePolice
officersper
100,000population
4
CrimeSeverity
Index6
Weightedclearance
rate7
Net gainor loss:
2011hirings
anddepartures
2011Police
officerseligible
toretire
8
number rate number rate number percent
Population 15,000 to 49,999Whitehorse, Royal Canadian Mounted
Police 27,604 26 5 31 112 0 35 127 127.9 52.8 0 0.0
1. Populations are based on preliminary postcensal estimates for 2011, Statistics Canada, Demography Division. Populations are adjusted to follow policingboundaries. Populations for 2012 are not yet available.
2. Represents the actual number of permanent, fully-sworn police officers of all ranks (or their full-time equivalents) as of May 15, 2012.3. Represents the number of fully-sworn police officer positions that the police department was allowed to fill during the calendar or fiscal year, whether or not
that number of officers was hired.4. Based on the number of police officers in 2012 and populations for 2011. Populations are adjusted to follow policing boundaries. Populations for 2012 are
not yet available.5. Counts include civilian and other personnel (e.g., clerical, dispatch, management, cadets, special constables, security officers, school crossing guards, by-law
enforcement officers) on the police department’s payroll as of May 15.6. The police-reported Crime Severity Index (CSI) takes into account both the volume and the seriousness of crime. In the calculation of the CSI, each offence is
assigned a weight, derived from average sentences handed down by criminal courts. The more serious the average sentence, the higher the weight for thatoffence. As a result, more serious offences have a greater impact on changes in the index. All Criminal Code offences, including traffic offences and otherfederal statute offences, are included in the CSI. The CSI is not available for police services or detachments with populations less than 1,000. Data for policeservices or detachments with populations less than 5,000 should be used with caution.
7. Criminal incidents can either be cleared by charge or cleared otherwise (for example, through diversionary programs and other extrajudicial means in instanceswhere a charge could otherwise be laid). The weighted clearance rate is based on the same principle used to create the police-reported Crime Severity Index,whereby more serious offences are assigned a higher weight than less serious offences. Applying this concept to clearance rates means that, for example, theclearance of a homicide, robbery or break and enter receives a higher weight than the clearance of less serious offences such as minor theft, mischief anddisturbing the peace. The weighted clearance rate is not available for police services or detachments with populations less than 1,000. Data for police servicesor detachments with populations less than 5,000 should be used with caution.
8. The percent of officers eligible to retire is calculated using counts of officers who were eligible to retire in 2011 (or the 2011/2012 fiscal year), along with thenumber of fully sworn officers employed on May 15, 2012.
Note(s): There are no municipal police services in Yukon. The Royal Canadian Mounted Police polices the territory on a rural contract basis and, for the purposesof this report, the largest area for which services are provided is included. Use caution in comparing forces: The number of officers may not reflect thenumber available for general community policing because some officers in certain communities are restricted to specific locations (e.g. ports, airports).Note for the Royal Canadian Mounted Police municipal contracts: Municipal employees working within detachments of the Royal Canadian MountedPolice are not included in the category “other personnel”.
Source(s): Statistics Canada, Canadian Centre for Justice Statistics, Uniform Crime Reporting Survey, Police Administration Survey and Supplemental.
Statistics Canada – Catalogue no. 85-225-X 47

Police Resources in Canada – 2012
Table 12-12Police personnel in municipal police services — Northwest Territories, 2012
2012 Actual strength 2 2012 Authorizedstrength 3
2011 crime
Police officers
Policeservice
2011Population
1
Male Female Total
Policeofficers
per100,000
population4
Otherpersonnel
5Total
policePolice
officersper
100,000population
4
CrimeSeverity
Index6
Weightedclearance
rate7
Net gainor loss:
2011hirings
anddepartures
2011Police
officerseligible
toretire
8
number rate number rate number percent
Population 15,000 to 49,999Yellowknife, Royal Canadian Mounted
Police 20,020 26 7 33 165 0 34 170 218 62.4 0 6.1
1. Populations are based on preliminary postcensal estimates for 2011, Statistics Canada, Demography Division. Populations are adjusted to follow policingboundaries. Populations for 2012 are not yet available.
2. Represents the actual number of permanent, fully-sworn police officers of all ranks (or their full-time equivalents) as of May 15, 2012.3. Represents the number of fully-sworn police officer positions that the police department was allowed to fill during the calendar or fiscal year, whether or not
that number of officers was hired.4. Based on the number of police officers in 2012 and populations for 2011. Populations are adjusted to follow policing boundaries. Populations for 2012 are
not yet available.5. Counts include civilian and other personnel (e.g., clerical, dispatch, management, cadets, special constables, security officers, school crossing guards, by-law
enforcement officers) on the police department’s payroll as of May 15.6. The police-reported Crime Severity Index (CSI) takes into account both the volume and the seriousness of crime. In the calculation of the CSI, each offence is
assigned a weight, derived from average sentences handed down by criminal courts. The more serious the average sentence, the higher the weight for thatoffence. As a result, more serious offences have a greater impact on changes in the index. All Criminal Code offences, including traffic offences and otherfederal statute offences, are included in the CSI. The CSI is not available for police services or detachments with populations less than 1,000. Data for policeservices or detachments with populations less than 5,000 should be used with caution.
7. Criminal incidents can either be cleared by charge or cleared otherwise (for example, through diversionary programs and other extrajudicial means in instanceswhere a charge could otherwise be laid). The weighted clearance rate is based on the same principle used to create the police-reported Crime Severity Index,whereby more serious offences are assigned a higher weight than less serious offences. Applying this concept to clearance rates means that, for example, theclearance of a homicide, robbery or break and enter receives a higher weight than the clearance of less serious offences such as minor theft, mischief anddisturbing the peace. The weighted clearance rate is not available for police services or detachments with populations less than 1,000. Data for police servicesor detachments with populations less than 5,000 should be used with caution.
8. The percent of officers eligible to retire is calculated using counts of officers who were eligible to retire in 2011 (or the 2011/2012 fiscal year), along with thenumber of fully sworn officers employed on May 15, 2012.
Note(s): There are no municipal police services in the Northwest Territories. The Royal Canadian Mounted Police polices the territory on a rural contract basis and,for the purposes of this report, the largest area for which services are provided is included. Use caution in comparing forces: The number of officersmay not reflect the number available for general community policing because some officers in certain communities are restricted to specific locations(e.g. ports, airports). Note for the Royal Canadian Mounted Police municipal contracts: Municipal employees working within detachments of the RoyalCanadian Mounted Police are not included in the category “other personnel”.
Source(s): Statistics Canada, Canadian Centre for Justice Statistics, Uniform Crime Reporting Survey, Police Administration Survey and Supplemental.
48 Statistics Canada – Catalogue no. 85-225-X
Methodology
Survey definitions and coverage
This report is based upon data collected through the Police Administration Survey conducted by the Canadian Centrefor Justice Statistics. This survey collects data on police personnel and expenditures from each municipal, provincialand federal (RCMP) police service in Canada. First Nations police personnel and expenditures falling under thejurisdiction of the RCMP are reported under RCMP federal policing.
The following federal policing and security agencies are excluded from the survey: the Canadian Security IntelligenceService, railway and military police. Federal and provincial government departments deploying personnel to enforcespecific statutes in the areas of income tax, customs and excise, immigration, fisheries and wildlife are also excluded.As well, private security guards and private investigators are not included in this survey.
Data presented in this report represent police personnel as of May 15, 2012 and final expenditures for theyear 2011 (or 2011/2012 for those services operating on a fiscal year). Most municipal police services operate ona calendar year while the provincial services and the RCMP operate on a fiscal year. Policing expenditures arereferred to as calendar year (i.e., 2011) throughout this report.
Personnel counts are based on permanent, full-time equivalents; part-time employees are converted to full-timeequivalents (e.g., 4 employees working 10 hours per week would equal 1 full-time employee working a 40-hourweek). Police officers include the actual number of sworn police officers available for active duty as of May 15, 2012.Other employees include all other non-police personnel (civilians and special constables) (e.g., clerical, dispatch,management, cadets, special constables, security officers, school crossing guards, by-law enforcement officers).
Counts for temporary officers are not included in any of the police officer counts, as only permanent, full-time officers(and full-time equivalents) are included. Temporary police officers are hired to fill in, as needed, for permanentpolice officers. The province of Quebec employs more temporary police officers than any other jurisdiction. Ofthe 1,004 temporary officers reported in 2012, 895 or 89% were employed in Quebec.
Police expenditures are actual operating expenditures and include: salaries and wages, benefits, and otheroperating expenses such as accommodation costs, fuel, maintenance, etc. Capital expenditures, funding fromexternal sources, revenues and recoveries are not included.
Data from the Uniform Crime Reporting (UCR) Survey are also included in this report to provide appropriate caseloadcontext for the police in terms of the volume of criminal incidents coming to their attention. The UCR Survey collectspolice-reported crime and traffic offences reported by all police services in Canada, dating back to 1962, and is thebasis for crime rate, Crime Severity Index and clearance rate information.
Major survey revisions
1986 revision
The Police Administration Survey was revised in 1986 to collect police department expenditures (beginning in 1985)as well as more detailed information on police personnel and functions. As both the old and revised surveys wererun simultaneously in 1986, it was possible to examine the effects of the revised survey. An analysis of the datarevealed that there were some minor differences in the distribution of police personnel between the two surveys. Inorder to correct for these methodological differences, the data presented in Table 1 prior to 1986 have been adjustedat the national level.
Statistics Canada – Catalogue no. 85-225-X 49
Police Resources in Canada – 2012
1996 revision
In 1996, changes were made to the effective date for collecting personnel strength, moving from September 30 toJune 15. School crossing guards were added to the survey in 1996 as their numbers warranted a separate category.Prior to 1996, they were captured under the "other" category. Adjustments were made to civilian personnel to accountfor this change, back to 1986.
Also, expenses associated with the purchasing and leasing of vehicles were now to be included only if they werepart of the operational budget of the police service. Prior to 1995, all expenses related to the purchase and leaseof vehicles were included, regardless of the type of budget. Benefits were expanded to include those paid by othergovernment sources. The removal of expenses due to the capital purchases of vehicles and the addition of expensesdue to the inclusion of benefits paid by other government sources were examined in detail. It was estimated thatthese revisions accounted for an overall change of less than 1% in reported expenses.
2006 revision
In 2006, changes were made to the effective date for collecting personnel strength, moving from June 15 to May 15.This date change should not have any impact on the continuity of 2006 data with previous years.
2012 revision
In 2012, the Police Administration Survey Program included the Supplemental survey for the first time. Afterconsultations with the Canadian policing community, the Supplemental survey questionnaire was designed tocapture detailed information on human resources and staffing among police services. Aggregate information onhirings, departures, eligibility to retire, years of service, age, education, visible minority status and language wascollected.
The majority of the information collected through the Supplemental Police Administration Survey questionnaire isbased on the familiar May 15 survey snapshot day. Other data, such as those on annual hirings, departures andeligibility to retire, is collected based on the previous calendar year or fiscal year.
Some police services are unable to provide one or more of the data elements asked for on the SupplementalPolice Administration Survey questionnaire. In these cases, the police services are excluded from related percentcalculations and a note explaining coverage for the data element is included in the text or table.
Municipal police service data tables
Summary information on Canada’s municipal police services is presented in this report. Municipal policing includesall police services that are paid for by municipalities including contract policing provided to municipalities by provincialpolice services and the RCMP. It also includes self-administered First Nations police services. It should be noted thatoffences investigated by federal RCMP personnel within a municipal policing jurisdiction are included in the crimestatistics for that municipal police service; however, personnel and expenditures associated with the federal RCMPare not included.
Within each province, municipal police services are grouped into population ranges and the municipalities withineach group are listed alphabetically. Within these groupings, municipalities that are policed by the RCMP or OPPunder municipal contracts are separated from the other municipal police services.
Table 12 includes only personnel from municipal police services that existed on May 15, 2012. Municipal policeservices that ceased to exist and/or were amalgamated by other new police services on or before May 15, 2012 arenot included. Crime data for 2012 are not yet available; therefore data presented in Table 12 of the report are forthe year 2011.
50 Statistics Canada – Catalogue no. 85-225-X
Appendix I
Census metropolitan area (CMA) reference list
Police services included in CMAs 2011
Abbotsford-Mission
Abbotsford
Mission (RCMP Municipal)1
Barrie
Barrie
South Simcoe
Brantford
Brant County
Brantford
Six Nations
Calgary
Airdrie (RCMP Rural)
Airdrie (RCMP Municipal)
Beiseker (RCMP Rural)
Calgary
Chestermere (RCMP Municipal)
Cochrane (RCMP Rural)
Cochrane (RCMP Municipal)
Tsuu T’ina Nation
1. Royal Canadian Mounted Police.
Statistics Canada – Catalogue no. 85-225-X 51
Police Resources in Canada – 2012
Edmonton
Beaumont (RCMP Municipal)
Devon (RCMP Municipal)
Edmonton
Fort Saskatchewan (RCMP Municipal)
Leduc (RCMP Rural)
Leduc (RCMP Municipal)
Morinville (RCMP Rural)
Morinville (RCMP Municipal)
Redwater (RCMP Rural)
Spruce Grove (RCMP Municipal)
St. Albert (RCMP Municipal)
Stony Plain (RCMP Rural)
Stony Plain (RCMP Municipal)
Strathcona (RCMP Municipal)
Strathcona County (RCMP Rural)
Thorsby (RCMP Rural)
Gatineau (Québec portion of Ottawa-Gatineau CMA)
Gatineau
MRC des Collines de l’Outaouais
Greater Sudbury
Greater Sudbury
Guelph
Guelph
Halifax
Halifax County (RCMP Rural)
Halifax Regional
Hamilton
Burlington (OPP District)2
2. Ontario Provincial Police.
52 Statistics Canada – Catalogue no. 85-225-X

Police Resources in Canada – 2012
Halton Regional (38%)3
Hamilton
Kelowna
Kelowna (RCMP Municipal)
Kelowna (RCMP Rural)
Lake Country (RCMP Municipal)
West Kelowna (RCMP Municipal)
Kingston
Frontenac (South Frontenac ) (OPP Municipal)
Kingston
Loyalist (OPP Municipal)
Kitchener-Cambridge-Waterloo
Cambridge (OPP Highway Safety)
Waterloo Regional
London
London
Middlesex (OPP Municipal)
Middlesex (Strathroy) (OPP Rural)
St. Thomas
Strathroy-Caradoc
Thames Centre (OPP Municipal)
Moncton
Caledonia (RCMP Rural)
Codiac (RCMP Municipal)
Montréal
Blainville
Châteauguay
Deux-Montagnes MRC (SQ)4
Deux-Montagnes Regional
3. Includes the City of Burlington.4. Sûreté du Québec.
Statistics Canada – Catalogue no. 85-225-X 53
Police Resources in Canada – 2012
Kahnawake (Aboriginal Police Force)
L’Assomption
Laval
Longueuil
Mascouche
Mirabel
Montréal
Repentigny
Richelieu-Saint-Laurent (Régie)
Roussillon (Régie)
Saint-Eustache
Saint-Jérôme Métro
Terrebonne
Thérèse-De-Blainville
Vaudreuil-Soulange MRC (SQ)
Ottawa (Ontario portion of Ottawa-Gatineau CMA)
Ottawa
Ottawa (OPP Highway Safety)
Russel (OPP Municipal)
Russell County (Rockland) (OPP Rural)
Peterborough
Cavan/Millbrook/North Monaghan (OPP Municipal)
Douro-Dummer (OPP Municipal)
Otonabee/South Monaghan (OPP Municipal)
Peterborough County (Hiawatha/Curve Lake First Nation) (OPP Rural)
Peterborough - Lakefield Village
Smith/Ennismore/Lakefield (OPP Municipal)
Québec
Côte-de-Beaupré MRC (SQ)
Jacques Cartier MRC (SQ)
54 Statistics Canada – Catalogue no. 85-225-X

Police Resources in Canada – 2012
Lévis
L’Île-d’Orléans MRC (SQ)
Québec
Wendake
Regina
Lumsden (RCMP Rural)
Regina
Regina (RCMP Rural)
Saguenay
Saguenay
Saint John
Hampton (RCMP Municipal)
Rothesay Regional Police
Saint John
Saskatoon
Dalmeny
Martensville (RCMP Municipal)
Saskatoon
Saskatoon (RCMP Rural)
Warman (RCMP Rural)
Warman (RCMP Municipal)
Sherbrooke
Magog
Sherbrooke
Sherbrooke (SQ)
St. Catharines-Niagara
Niagara (OPP Highway Safety)
Niagara Regional
St. John’s
Royal Newfoundland Constabulary (St. John’s)
Statistics Canada – Catalogue no. 85-225-X 55

Police Resources in Canada – 2012
Thunder Bay
Shuniah (OPP Municipal)
Thunder Bay
Toronto
Aurora (OPP District)
Caledon (OPP Municipal)
Durham Regional (30%)5
Halton Regional (62%)6
Mono (OPP Municipal)
Nottawasaga (OPP Municipal)
Orangeville
Peel Regional
Port Credit (OPP Rural)
Toronto
Toronto (OPP Rural)
Whitby (OPP Rural)
York Regional
Trois-Rivières
Bécancour MRC (SQ)
Trois-Rivières
Vancouver
Bowen Island (RCMP Rural)
Burnaby (RCMP Municipal)
Coquitlam (RCMP Municipal)
Coquitlam (RCMP Rural)
Delta
Langley City (RCMP Municipal)
Langley Township (RCMP Municipal)
5. Includes the towns of Pickering and Ajax and the township of Uxbridge.6. Includes the towns of Milton, Halton Hills and Oakville.
56 Statistics Canada – Catalogue no. 85-225-X

Police Resources in Canada – 2012
Maple Ridge (RCMP Municipal)
New Westminster
North Vancouver (RCMP Rural)
North Vancouver City (RCMP Municipal)
North Vancouver District (RCMP Municipal)
Pitt Meadows (RCMP Municipal)
Port Coquitlam (RCMP Municipal)
Port Moody
Richmond (RCMP Municipal)
Squamish (RCMP Rural)
Surrey (RCMP Municipal)
Surrey (RCMP Rural)
University (RCMP Rural)
Vancouver
West Vancouver
White Rock (RCMP Municipal)
Victoria
Central Saanich
Colwood (RCMP Municipal)
Langford (RCMP Municipal)
North Saanich (RCMP Municipal)
Oak Bay
Saanich
Sidney (RCMP Municipal)
Sidney/North Saanich (RCMP Rural)
Sooke (RCMP Municipal)
Sooke (RCMP Rural)
Victoria
View Royal (RCMP Municipal)
Statistics Canada – Catalogue no. 85-225-X 57
Police Resources in Canada – 2012
West Shore (RCMP Rural)
Windsor
Amherstburg
Lakeshore (OPP Municipal)
LaSalle
Tecumseh (OPP Municipal)
Windsor
Winnipeg
East St. Paul (RCMP Rural)
Headingley (RCMP Rural)
Oakbank (RCMP Rural)
St. Pierre-Jolys (RCMP Rural)
Winnipeg
58 Statistics Canada – Catalogue no. 85-225-X