polen focus growth slide deck sept 2015
TRANSCRIPT

Polen Focus Growth

www.polencapital.com
Table of Contents
I. Presentation
Mission Statement p. 1
Firm Overview p. 2
Our Investment Team p. 3
Investment Philosophy p. 4
Investment Process p. 5
Sell Discipline p. 6
Portfolio Characteristics p. 7
Investing Across the Growth Spectrum p. 8
Portfolio Sector Classification p. 9
Active Share p. 10
Portfolio Factor Exposures p. 11
II. Performance
Historical Performance p. 12
Consistent Risk & Return Rankings p. 13
Excess Returns Quarterly Periods p. 14
Consistency through Varying Markets p. 15-16
Capital Drawdown & Recovery p. 17
III. Appendix
Portfolio Activity p. 18
Portfolio Attribution 3Q15 p. 19
Portfolio Attribution YTD p. 20
Portfolio Attribution Trailing 1 Year p. 21
Polen Capital vs Large Cap Universe p. 22
Annual Rates of Return p. 23
Biographies p. 24-26
GIPS Disclosure p. 27-28


www.polencapital.com
Our mission is to preserve and grow client assets to protect their present and enable
their future.
Mission Statement
Page 1

www.polencapital.com
Corporate, 17%
Endowment & Foundation, 4%
Public Fund, 19%
Union/Taft‐Hartley, 2%UMA, 27%
Healthcare, 2%
High Net Worth, 20%
Mutual Fund, 10%
• City of Milwaukee, Wisconsin• City of Orlando, Florida• Department of Treasury of the State of New Jersey• Fortune 100 Defined Benefit Plan• Hawaii Roofers Local Union 221• Southeastern PA Transportation Authority• Prominent Children’s Hospitals• Scotiabank • NORCAL Mutual Insurance Company• Pennsylvania Municipal Retirement System• Large European Corporate Pension Plan
$6.2 Billion
$2.7 Billion
$278 Million
6 Accounts > $100MM49 Clients > $10MM
Accounts
Representative Client List
Firm Overview (as of September 30, 2015)
Largest Client
Firm Assets
Total Assets
Institutional Assets
Firm Highlights
• Independently Owned and Employee Controlled
• Founded in 1979
• 32 employees
• Based in Boca Raton, Florida
• Investment Team with 87 years combined experience
• All employees invested in firm products
• Focus Growth and Global Growth Strategies:– Separately Managed Account – Mutual Fund– UCITS (for non-U.S. investors)
Client list should not be construed as a testimonial. It is not known whether the clients approve or disapprove of Polen or the advisory services provided. Polen used geographical and client diversity as the criterion for selecting these clients.
Page 2

www.polencapital.com
Our Investment Team
Mr. Morris joined Polen Capital in 2011. Prior to joining Polen Capital, Mr. Morris worked in research and marketing roles with Prudential Insurance and Millennium Global Asset Management, respectively,
and served for seven years in the U.S. Navy. During his naval career Mr. Morris navigated a warship on three deployments, taught at the U.S. Merchant Marine Academy and served with the U.S. Army in Iraq. Mr. Morris received a B.S. in History from the U.S. Naval Academy where he was a student athlete, and an MBA from Columbia Business School.
Todd Morris, Director of Research & Analyst* Stephen Atkins, Research AnalystMr. Atkins joined Polen Capital in 2012. Prior to joining Polen Capital, Mr. Atkins spent twelve years as a portfolio manager at Northern Trust Investments, including eight years as a mutual fund
co-manager. Before joining Northern Trust, Mr. Atkins spent two years as a portfolio manager at Carl Domino Associates, LP. Mr. Atkins received his B.S. in Business Administration from Georgetown University and a General Course degree from the London School of Economics. Mr. Atkins is a CFA charterholder and a member of the CFA Institute and the CFA Society of South Florida.
Brandon Ladoff, Research AnalystMr. Ladoff joined Polen Capital in 2013. Prior to joining Polen Capital, Mr. Ladoff spent over four years as a corporate lawyer at Willkie Farr & Gallagher LLP. Prior to that, he spent a
year as a Tax associate at PricewaterhouseCoopers LLP. Mr. Ladoff received his B.S. in Accounting from the University of Florida, where he graduated summa cum laude. He also completed a Certificate in Business Policy at the Wharton School of Business and earned a J.D. from the University of Pennsylvania Law School, where he graduated cum laude.
Mr. Pick joined Polen Capital in 2014. Mr. Pick is Portfolio Manager on the firm’s Global Growth strategy. Prior to joining Polen Capital, Mr. Pick spent the majority of his career as a Research Analyst and Portfolio Manager with Janus Capital in Denver, Colorado where he co-managed the Janus Institutional International Equity Portfolio and the Janus Advisor
International Equity Fund. His prior experience also includes working at Sands Capital Management in Arlington, Virginia as a Partner and Senior Portfolio Manager where he helped launch the Sands Global Growth Strategy. Mr. Pick also served as Managing Director of Global Equities with Deutsche Bank in London. Mr. Pick received his B.S. with Distinction in Economics from George Mason University, and is a CFA charterholder.
Julian Pick, Global Portfolio Manager & Analyst
Jeff Mueller, Research AnalystJeff joined Polen Capital in 2013. Prior to joining Polen Capital, Mr. Mueller spent 10 years in the U.S. Marine Corps, during which he flew over 250 combat missions in F/A-18s. Mr. Mueller received his B.A. in
Communications and Business Administration from Trinity University in San Antonio where he was Captain of the Men's Tennis Team, an All American and NCAA Champion. Jeff is a Tillman Scholar and earned his MBA from Columbia Business School where he was a graduate of the Value Investing Program. Mr. Mueller graduated from Columbia with Honors and Distinction.
87 years of Combined Investment Experience - *Equity Ownership - Open and Candid Communication
Teamwork Wins
Mr. Ficklin joined Polen Capital in 2003. Mr. Ficklin is Co-Portfolio Manager & Research Analyst on the firm’s flagship Focus Growth strategy. Prior to joining Polen Capital, Mr. Ficklin spent one year working as an equity analyst with Morningstar and four years as a tax consultant to Fortune 500 companies
with Price Waterhouse. Mr. Ficklin graduated Magna Cum Laude from the University of South Florida with a B.S. in Accounting, earned a M.S.A. from Appalachian State University, and earned an MBA with high honors from The University of Chicago Booth School of Business. He serves on the Investment Committee to the Board of the Make-A-Wish Foundation of Southern Florida. Mr. Ficklin is also a Certified Public Accountant (CPA).
Damon Ficklin, Portfolio Manager & Analyst*Mr. Davidowitz joined Polen Capital in 2005. Mr. Davidowitz leads the investment team and is the lead Portfolio Manager on the firm’s flagship Focus Growth strategy. Prior to joining Polen Capital, Mr. Davidowitz spent five years as Vice President and Research Analyst at Osprey Partners Investment Management. Before joining Osprey Partners, Mr. Davidowitz
spent one year as a Research Analyst at Value Line, Inc. and five years in the health care sector holding various analytical positions at Memorial Sloan-Kettering Cancer Center. Mr. Davidowitz received his B.S. with high honors in Public Health from Rutgers University and earned his MBA from the City University of New York, Baruch College ZicklinSchool of Business. Mr. Davidowitz is a CFA charterholder. He is a board member of the American Association of Caregiving Youth (AACY), a member of the CFA Institute and the CFA Society of South Florida.
Dan Davidowitz, CIO & Portfolio Manager*
Page 3

www.polencapital.com
High Active Share• Portfolio is constructed with approximately 20 high quality companies characterized by abundant
free cash flow, low debt, high ROE, strong revenue growth, stable to improving margins, and shareholder oriented management teams
• Best Ideas Portfolio – Impartial to index sector weightings and index position weightings
Time Arbitrage• Long-term focus on company fundamentals and competitive advantages• Portfolio returns are generated through the compound earnings growth of competitively advantaged companies
owned for many years – Share prices follow earnings growth• Portfolio has included slightly more than 100 companies since inception – Avg. holding period approximately five years
Weighing Machine vs. Voting Machine• No market predictions – fully invested at all times• Unemotional selling – an absolute return mentality
Risk Management (“Don’t lose” mentality)• Only invest in financially superior/competitively advantaged businesses – Margin of Safety• Do not over-diversify into marginal/poor businesses• Portfolio construction parameters include position size limits and sector weight limits• Strict and disciplined focus on long term preservation of capital
Time-Tested Process • Over 25 years of evidential success through consistent application of investment process
Competitive Advantages / Our Philosophy
Page 4
www.polencapital.com
$0.00
$0.50
$1.00
$1.50
$2.00
$2.50
$3.00
$3.50
$4.00
$0
$20
$40
$60
$80
$100
Ann
ual E
arni
ngs
Per S
hare
Year
-End
Sha
re P
rice
Annual Earnings per Share Year End Share Price
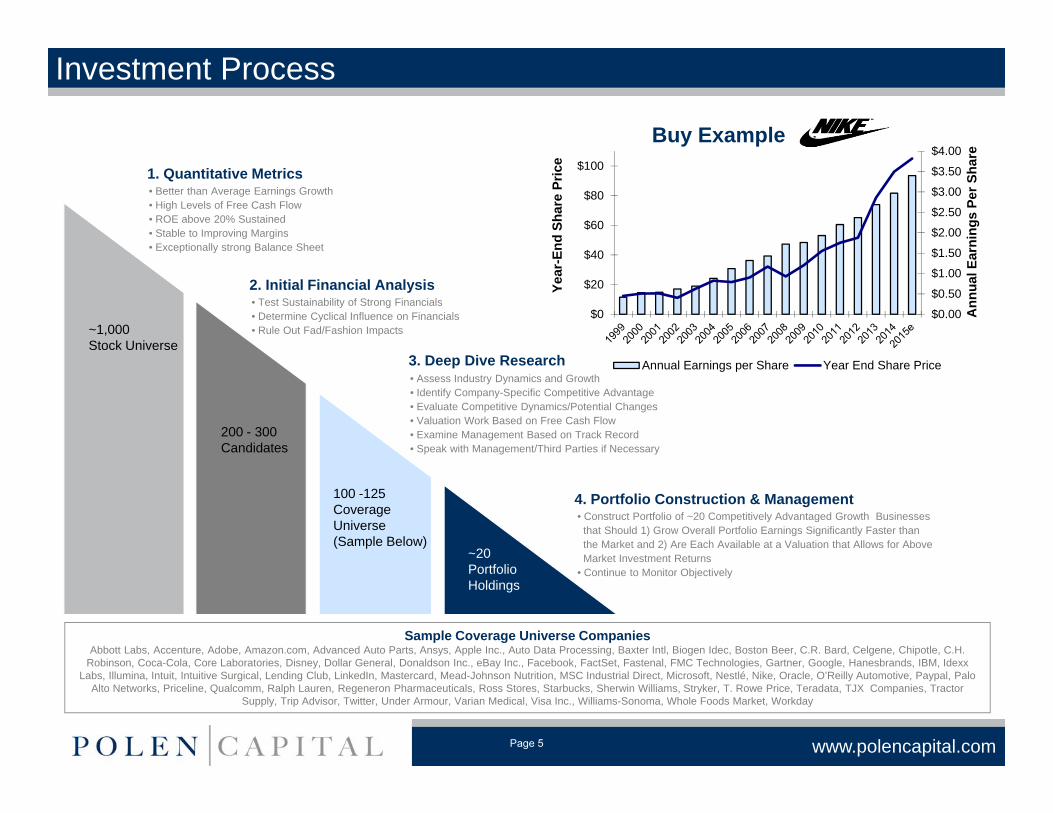
~1,000 Stock Universe
200 - 300Candidates
100 -125 Coverage Universe(Sample Below)
~20 PortfolioHoldings
• Better than Average Earnings Growth• High Levels of Free Cash Flow• ROE above 20% Sustained• Stable to Improving Margins• Exceptionally strong Balance Sheet
1. Quantitative Metrics
2. Initial Financial Analysis • Test Sustainability of Strong Financials• Determine Cyclical Influence on Financials• Rule Out Fad/Fashion Impacts
3. Deep Dive Research• Assess Industry Dynamics and Growth• Identify Company-Specific Competitive Advantage• Evaluate Competitive Dynamics/Potential Changes • Valuation Work Based on Free Cash Flow• Examine Management Based on Track Record• Speak with Management/Third Parties if Necessary
4. Portfolio Construction & Management • Construct Portfolio of ~20 Competitively Advantaged Growth Businesses
that Should 1) Grow Overall Portfolio Earnings Significantly Faster than the Market and 2) Are Each Available at a Valuation that Allows for Above Market Investment Returns
• Continue to Monitor Objectively
Sample Coverage Universe Companies Abbott Labs, Accenture, Adobe, Amazon.com, Advanced Auto Parts, Ansys, Apple Inc., Auto Data Processing, Baxter Intl, Biogen Idec, Boston Beer, C.R. Bard, Celgene, Chipotle, C.H.
Robinson, Coca-Cola, Core Laboratories, Disney, Dollar General, Donaldson Inc., eBay Inc., Facebook, FactSet, Fastenal, FMC Technologies, Gartner, Google, Hanesbrands, IBM, IdexxLabs, Illumina, Intuit, Intuitive Surgical, Lending Club, LinkedIn, Mastercard, Mead-Johnson Nutrition, MSC Industrial Direct, Microsoft, Nestlé, Nike, Oracle, O’Reilly Automotive, Paypal, Palo
Alto Networks, Priceline, Qualcomm, Ralph Lauren, Regeneron Pharmaceuticals, Ross Stores, Starbucks, Sherwin Williams, Stryker, T. Rowe Price, Teradata, TJX Companies, Tractor Supply, Trip Advisor, Twitter, Under Armour, Varian Medical, Visa Inc., Williams-Sonoma, Whole Foods Market, Workday
Buy Example
Investment Process
Page 5

www.polencapital.com
The following factors may influence a sell decision:
Qualitative Breakdown• Potential or actual impairment of the sustainable competitive
advantage, inability to quantify business or industry risk• Questionable quality of management decision making
(i.e. capital allocation decisions)
Quantitative Deterioration• Reduced Earnings Growth• Margin Compression
Valuation • As measured by Price to Earnings, Price to Cash Flow,
and Market Value vs. Intrinsic Value
Identification of a Superior Alternative
• A more attractive sustainable growth opportunity
Portfolio Construction Discipline
• Risk Management related to individual position size, sector weights, or similarity of positions
• Declining Return On Equity• Increasing Debt to Total Capital
• Historical annual turnover is less than 30% • Average holding period has been approximately 5 years
$0$2$4$6$8$10$12$14$16$18
$0$50
$100$150$200$250$300$350$400$450$500$550
Ann
ual E
arni
ngs
Per S
hare
Year
-End
Sha
re P
rice
Annual Earnings Per ShareYear-End Share Price
Sell Discipline
Page 6

www.polencapital.com
Source: FactSet*Our long-term estimates for the market indices are based off of 10 year historical data capturing different market cycles
The information provided in this report should not be construed as a recommendation to purchase or sell any particular security. There is no assurance that any securities discussed herein will remain in the composite at the time you receive this report or that the securities sold have not been repurchased. The securities discussed do not represent the composite’s entire portfolio. Actual holdings will vary depending on the size of the account, cash flows and restrictions. It should not be assumed that any of thesecurities transactions or holdings discussed were or will prove to be profitable or will equal the investment performance of the securities discussed herein. For a complete list of Polen’s past specific recommendations holdings report and current holdings as of the current quarter end, please contact [email protected].
NamePercentage of
PortfolioMarket Cap
(Millions)P/E Trailing 12 Months
P/E Forward 12 Months
Net Debt/Capital
Ratio %
Polen Long-Term EPS % Growth
Estimates
Return on Total Capital (Total Debt)
Return on Total Capital
(Net Debt)Abbott Laboratories 5.1% 59,946 17.3 17.1 -7.6 12.0 7.5 11.6Accenture Plc 4.7% 64,557 17.7 18.8 -67.4 12.0 50.8 158.0Adobe Systems Incorporated 4.1% 41,004 45.2 27.3 -20.2 25.0 5.5 9.5Apple Inc. 4.1% 629,306 12.0 11.3 10.9 10.0 28.2 34.9Automatic Data Processing, Inc. 4.6% 37,480 27.6 23.8 -34.4 12.0 28.7 43.8Celgene Corporation 3.3% 85,562 25.3 19.2 0.9 20.0 15.8 34.1Facebook, Inc. Class A 3.3% 252,979 47.6 34.9 -34.6 30.0 6.8 10.6Fastenal Company 3.4% 10,622 20.8 19.0 10.0 18.0 24.8 26.3Gartner, Inc. 3.3% 6,970 38.5 30.3 65.6 20.0 31.7 92.1Google Inc. Cl A 4.0% 427,331 23.8 19.6 -55.2 18.0 12.2 30.3Google Inc. Cl C 5.6% 427,331 22.7 18.7 -55.2 18.0 12.2 30.3MasterCard Incorporated Class A 2.0% 102,198 27.3 23.6 -64.9 17.5 47.6 293.3Nestle S.A. Sponsored ADR 4.7% 239,895 21.6 20.8 21.1 11.0 16.8 17.9NIKE, Inc. Class B 7.6% 105,385 31.1 27.4 -33.4 17.5 23.4 40.7O'Reilly Automotive, Inc. 4.1% 24,898 30.6 25.5 33.8 18.0 25.1 27.2Oracle Corporation 4.6% 154,666 13.5 13.3 -15.6 12.0 10.7 28.6Priceline Group Inc 5.4% 63,244 23.1 18.7 15.8 18.0 16.9 22.0Regeneron Pharmaceuticals, Inc. 4.7% 48,208 42.0 33.3 -5.8 20.0 12.4 14.8Starbucks Corporation 6.4% 84,737 37.4 30.3 7.9 18.0 30.8 41.1TJX Companies, Inc. 5.2% 48,164 21.7 19.9 -10.4 12.0 38.4 61.9Visa Inc. Class A 7.3% 154,297 27.3 23.3 -24.2 17.5 20.6 27.1
Cash 2.6%Polen Focus Growth (weighted average) 146,132 24.0 21.1 -12.9 16.7 21.8Russell 1000 Growth 126,234 19.1 17.0 18.5 7.2* 15.1S&P 500 127,291 15.8 15.1 22.8 7.0* 11.7
Quality - invest in companies with little to no debt and higher ROTC
Growth - construct a portfolio that can grow earnings in the mid-teens
Value - pay a modest premium for competitively advantaged businesses
Portfolio Characteristics
September 30, 2015
Page 7

www.polencapital.com
Stability with “underappreciated”
growth
Durable growth for a less than robust
environment
Strong secular growth at a
reasonable price
Big growth potential in a special asset
Investing Across the Growth Spectrum
As of September 30, 2015
Page 8

www.polencapital.com
Portfolio – Sector Classification
Health Care Technology Financials Producer Durables Consumer Discretionary Materials & Processing Consumer StaplesAbbott Labs Google Inc. Visa Inc Accenture Plc Nike Inc. Cl B Fastenal Company Nestlé S.A.
Regeneron Inc. Oracle MasterCard Automatic Data Processing Starbucks Corp.Celgene Corp. Apple Inc. Priceline Group, Inc.
Gartner, Inc. The TJX Companies, Inc.Adobe Systems Inc. O'Reilly Automotive
Facebook Inc.
Identify companies with competitive advantages -higher allocation to Technology and Healthcare
Avoid slow growing companies– little to no exposure to cyclical and capital intensive companies
Limit sector weights to 50% – impartial to index weightsHealth Care Technology Financial
ServicesProducerDurables
ConsumerDiscretionary
ConsumerStaples Energy Materials &
Processing Utilities Cash
Polen Capital 13.11 29.13 9.24 9.28 28.59 4.67 0.00 3.40 0.00 2.59R1000G 16.57 22.40 9.36 11.52 22.95 10.41 0.71 3.93 2.17 0.00
0.00
5.00
10.00
15.00
20.00
25.00
30.00
35.00Russell Sector Allocation
As of September 30, 2015
Supplemental information to the fully compliant composite performance which accompanies this presentation. Past performance is not indicative of future results.
Page 9

www.polencapital.com
Active Share is defined by K.J.Martijn Cremers and Antti Petajisto in a published research paper, How Active Is Your Fund Manager? A New Measure That Predicts Performance," Review of Financial Studies, Volume 22, Number 9, September 2009, pp. 3329-3365(37)
As of September 30, 2015
*Excludes cash
Portfolio’s Active Share
= 81%
• Consistently High Active Share – Active Management
• Look nothing like a benchmark
Consistent High Active Share Over Time
Supplemental information to the fully compliant composite performance which accompanies this presentation. Past performance is not indicative of future results.
0%
10%
20%
30%
40%
50%
60%
70%
80%
90%
100%
Q102
Q302
Q103
Q303
Q104
Q304
Q105
Q305
Q106
Q306
Q107
Q307
Q108
Q308
Q109
Q309
Q110
Q310
Q111
Q311
Q112
Q312
Q113
Q313
Q114
Q314
Q115
Q315
Act
ive
Sh
are
Historical Active Share vs R1000G
Polen R1000G Active*Weight% Weight% Weight %
7.6 0.8 6.7 NIKE, Inc. Class B9.6 3.7 5.9 Google Inc Class A & C7.3 1.4 5.9 Visa Inc. Class A6.4 0.9 5.6 Starbucks Corporation5.4 0.6 4.7 Priceline Group Inc5.2 0.5 4.7 TJX Companies, Inc.5.1 0.0 5.1 Abbott Laboratories4.7 0.4 4.3 Regeneron, Inc.4.7 0.6 4.1 Accenture Plc4.7 0.0 4.7 Nestle S.A. ADR4.6 0.7 3.9 Oracle Corporation4.6 0.3 4.3 Auto Data Processing4.1 6.4 -2.3 Apple Inc.4.1 0.4 3.7 Adobe Systems Inc.4.1 0.3 3.8 O'Reilly Automotive, Inc.3.4 0.1 3.3 Fastenal Company3.3 2.0 1.4 Facebook, Inc. Class A3.3 0.1 3.3 Gartner, Inc.3.3 0.9 2.4 Celgene Corporation2.0 0.9 1.1 MasterCard Incorporated
Page 10

www.polencapital.com
Portfolio Factor Exposures
Supplemental information to the fully compliant composite performance which accompanies this presentation. Past performance is not indicative of future results.
Source: Barra Portfolio Analytics
-0.80
-0.60
-0.40
-0.20
0.00
0.20
0.40
0.60
0.80
Dividend Yield Earnings Quality Earnings Yield Growth Leverage Profitability
Act
ive
Expo
sure
(Std
. Dev
iatio
n)
Active Style Exposure as of September 30, 2015
Vs. S&P 500 Vs. Russell 1000 Growth
Page 11


www.polencapital.com
*Returns are trailing through 9/30/15. Annualized returns are presented for periods greater than 1 year.
Historical Performance Review
Supplemental information to the fully compliant composite performance which accompanies this presentation. Past performance is not indicative of future results.
Polen Capital Performance as of September 30, 2015*Polen (Gross) R1000G S&P 500 Polen (Net)
3rd Quarter 2015 0.97% -5.29% -6.44% 0.84%YTD 2015 7.20% -1.54% -5.29% 6.77%1 Year 18.11% 3.17% -0.61% 17.48%3 Years 15.55% 13.61% 12.40% 14.91%5 Years 16.24% 14.47% 13.34% 15.53%7 Years 13.67% 11.73% 9.75% 12.89%10 Years 11.08% 8.09% 6.80% 10.27%15 Years 7.78% 2.20% 3.96% 6.93%20 Years 12.10% 7.49% 8.14% 11.14%25 Years 14.21% 9.50% 9.90% 13.17%Since Inception (1/1/89) 14.40% 9.67% 9.87% 13.34%
3rd Quarter 2015 Performance Summary:
During the third quarter of 2015, our Focus Growth Portfolio returned +0.97% gross of fees. Our positive return was in sharp contrast to the significant market decline during the quarter, with the Russell 1000 Growth and S&P 500 indices returning -5.29% and -6.44%, respectively.
As many factors have conspired to depress already modest underlying market growth during the trailing year, the strong and persistent earnings growth of our Portfolio has been more readily recognized.
While we have certainly made some good adjustments to the Portfolio during the past year or so and are pleased that several of our highest conviction ideas and largest Portfolio weightings are among our leading contributors, we think the main driver of our significant outperformance during the past year was due to maintaining our investment discipline and focus on the fundamentals, even when the fundamentals did not seem to be driving the market.
We believe that we have been able to outperform with such consistency over our 27-year history because owning a concentrated portfolio of the highest quality growth businesses drives stronger absolute earnings growth than the broader market can structurally deliver over the long term. Strong absolute earnings growth has driven strong absolute and relative returns for the Portfolio.
Page 12

www.polencapital.com
Source: eVestment Alliance Large Cap Growth Universe
Results were calculated for the trailing periods ending September 30, 2015Results for the periods 1, 3, 5, 7, 10, 15, and 20 years were calculated based on monthly returns
Polen/R1000G
Time Period Value Rank Value Rank Value Rank Value Rank Value Rank Value Rank Value Rank
1 Year 18.10 1 14.76 1 0.94 27 1.56 1 11.56 37 53.76 1 3.91 1
3 Years 15.55 15 3.54 4 0.86 4 1.58 4 9.78 9 75.00 1 0.42 20
5 Years 16.24 10 3.42 1 0.87 6 1.43 3 11.34 12 74.03 2 0.34 15
7 Years 13.67 11 3.27 2 0.87 8 0.91 2 14.95 11 79.27 3 0.33 14
10 Years 11.08 2 3.99 1 0.85 9 0.70 1 13.95 10 75.99 2 0.51 2
15 Years 7.79 4 6.07 4 0.68 9 0.47 3 13.12 9 61.61 6 0.68 7
20 Years 12.10 4 6.50 5 0.70 13 0.69 5 13.97 11 62.96 11 0.54 5
25 Years 14.22 1 7.01 3 0.71 15 0.77 3 14.76 14 54.20 9 0.55 2
Since Inception 1/1/89 14.41 1 7.01 1 0.72 5 0.75 1 14.81 10 54.67 5 0.56 1
DnSide Cap RatioSharpe Ratio Standard
DeviationInformation
RatioReturns (Gross) BetaAlpha
As of September 30, 2015
• Significant Alpha produced over 25 years with lower volatility than the benchmark and peers• Strong Downside Capture since inception
Consistent Risk and Return Rankings
Supplemental information to the fully compliant composite performance which accompanies this presentation. Past performance is not indicative of future results.
Page 13

www.polencapital.com
Polen Capital outperformed the R1000G in 77 of 88 periods (88%) for an average 5-year rolling excess return of 493 basis points since inception as of 9/30/15
Supplemental information to the fully compliant composite performance which accompanies this presentation. Past performance is not indicative of future results.
Excess Returns for Quarterly Rolling Periods
-5%
0%
5%
10%
15%Trailing 5-Year Annualized Gross Excess Returnson a Quarterly Basis vs. R1000G
-5%
0%
5%
10%
15%Trailing 7-Year Annualized Gross Excess Returns
on a Quarterly Basis vs. R1000G
Polen Capital outperformed the R1000G in 64 of 104 periods (62%) for an average 1-year rolling excess return of 369 basis points since inception as of 9/30/15
Polen Capital outperformed the R1000G in 72 of 96 periods (75%) for an average 3-year rolling excess return of 433 basis points since inception as of 9/30/15
Polen Capital outperformed the R1000G in 80 of 80 periods (100%) for an average 7-year rolling excess return of 524 basis points since inception as of 9/30/15
-5%
0%
5%
10%
15%
20%Trailing 3‐Year Annualized Gross Excess Returns on a Quarterly Basis vs. R1000G
-20%
-10%
0%
10%
20%
30%
40%Trailing 1-Year Gross Excess Returnson a Quarterly Basis vs. R1000G
Page 14

www.polencapital.com
‐30
‐20
‐10
0
10
20
30
40
‐30 ‐25 ‐20 ‐15 ‐10 ‐5 0 5 10 15 20 25 30 35 40
Polen Focus G
rowth Ann
ualized
Return (%
)
Russell 1000 Growth Annualized Return (%)
Rolling 3-Year Returns Since Inception (12/31/88)
Bear Markets Normal Up Markets
Speculative Up Markets
Market Environment
Bear Markets (<0% return)
Polen Focus Growth 1.71%
Russell 1000 Growth Index -8.47%
Relative Performance 10.18%
Normal Up Markets (0-15% return)
Polen Focus Growth 11.39%
Russell 1000 Growth Index 9.18%
Relative Performance 2.32%
Speculative Up Markets (>15% Return)
Polen Focus Growth 25.30%
Russell 1000 Growth Index 22.87%
Relative Performance 2.43%
Periods Outperformed 72
Periods Underperformed 24
Total Periods 96
Overall Batting Average 75%
Consistency Through Varying Markets
Returns as of September 30, 2015
Page 15

www.polencapital.com
Consistency Through Varying Markets
Market Environment
Bear Markets (<0% return)
Polen Focus Growth 3.71%
Russell 1000 Growth Index -3.14%
Relative Performance 6.85%
Normal Up Markets (0-15% return)
Polen Focus Growth 10.70%
Russell 1000 Growth Index 5.94%
Relative Performance 4.76%
Speculative Up Markets (>15% Return)
Polen Focus Growth 24.73%
Russell 1000 Growth Index 19.26%
Relative Performance 5.47%
Periods Outperformed 80
Periods Underperformed 0
Total Periods 80
Overall Batting Average 100%-10
-5
0
5
10
15
20
25
30
-10 -5 0 5 10 15 20 25 30
Pole
n Fo
cus
Gro
wth
Ann
ualiz
ed R
etur
n (%
)
Russell 1000 Growth Annualized Return (%)
Rolling 7-Year Returns Since Inception (12/31/88)
Bear Markets Normal Up Markets Speculative Up Markets
Returns as of September 30, 2015
Page 16

www.polencapital.com
$100
$80
$58
$25
$50
$75
$100
$125
Dec‐99
Feb‐00
Apr‐00
Jun‐00
Aug‐00
Oct‐00
Dec‐00
Feb‐01
Apr‐01
Jun‐01
Aug‐01
Oct‐01
Dec‐01
Feb‐02
Apr‐02
Jun‐02
Aug‐02
Oct‐02
Dec‐02
Feb‐03
Apr‐03
Jun‐03
Aug‐03
Oct‐03
Dec‐03
Drawdown & Recovery (Tech Bubble)December 31, 1999 to December 31, 2003
Polen Focus GrowthS&P 500R1000G
Polen Full Recovery3.3 Years
$100
$76
$81
$25
$50
$75
$100
$125
Oct‐07
Dec‐07
Feb‐08
Apr‐08
Jun‐08
Aug‐08
Oct‐08
Dec‐08
Feb‐09
Apr‐09
Jun‐09
Aug‐09
Oct‐09
Dec‐09
Drawdown & Recovery (Global Financial Crisis)October 31, 2007 to December 31, 2009
Polen Focus GrowthS&P 500R1000G
Polen Full Recovery2.2 Years
$311
$177
$137
$25
$50
$75
$100
$125
$150
$175
$200
$225
$250
$275
$300
$325
Dec‐99
Mar‐00
Jun‐00
Sep‐00
Dec‐00
Mar‐01
Jun‐01
Sep‐01
Dec‐01
Mar‐02
Jun‐02
Sep‐02
Dec‐02
Mar‐03
Jun‐03
Sep‐03
Dec‐03
Mar‐04
Jun‐04
Sep‐04
Dec‐04
Mar‐05
Jun‐05
Sep‐05
Dec‐05
Mar‐06
Jun‐06
Sep‐06
Dec‐06
Mar‐07
Jun‐07
Sep‐07
Dec‐07
Mar‐08
Jun‐08
Sep‐08
Dec‐08
Mar‐09
Jun‐09
Sep‐09
Dec‐09
Mar‐10
Jun‐10
Sep‐10
Dec‐10
Mar‐11
Jun‐11
Sep‐11
Dec‐11
Mar‐12
Jun‐12
Sep‐12
Dec‐12
Mar‐13
Jun‐13
Sep‐13
Dec‐13
Mar‐14
Jun‐14
Sep‐14
Dec‐14
Mar‐15
Jun‐15
Sep‐15
Drawdown to PresentDecember 31, 1999 to September 30, 2015
Polen Focus GrowthS&P 500R1000G
Recovery Time From Initial Drawdown
Polen 3.3 YearsS&P 500 6. 1 YearsR1000G 12.6 Years
Capital Drawdown & Recovery Periods
Supplemental information to the fully compliant composite performance which accompanies this presentation. Past performance is not indicative of future results.
Page 17

www.polencapital.com
Portfolio Activity
Initiations Ticker Date
Adobe Systems Inc ADBE March 2015
Facebook Inc FB May 2015
Sells Ticker Date
Allergan AGN February 2015
FactSet Research FDS June 2015
W.W. Grainger GWW August 2015
YTD as of September 30, 2015
Additions Ticker Date
Fastenal FAST March 2015
Nestle S.A. NSRGY August 2015
Automatic Data Processing ADP August 2015
Trims Ticker Date
FactSet Research FDS March 2015
Page 18

Polen Model AccountBenchmark: Russell 1000 GrowthCurrency: USDData from 6/30/2015 to 9/30/2015
Generated by FactSet Research Systems, Inc.
AttributionPortfolio Benchmark Variation Attribution Analysis
AverageWeight
TotalReturn
ContributionTo Return
AverageWeight
TotalReturn
ContributionTo Return
AverageWeight
TotalReturn
ContributionTo Return
AllocationEffect
SelectionEffect
TotalEffect
Total 100.00 0.95 0.95 100.00 -5.29 -5.29 -- 6.24 6.24 0.57 5.67 6.24Consumer Discretionary 27.00 9.47 2.40 22.60 -1.81 -0.39 4.40 11.29 2.79 0.17 2.88 3.05Technology 28.83 1.99 0.46 22.03 -4.17 -0.88 6.80 6.16 1.33 0.11 1.69 1.80Financial Services 9.27 2.26 0.18 9.17 -3.47 -0.37 0.10 5.73 0.55 0.00 0.53 0.53Producer Durables 9.71 -0.96 -0.05 11.58 -5.19 -0.59 -1.87 4.23 0.54 0.00 0.40 0.39[Unassigned] 3.88 4.27 0.14 -- -- -- 3.88 4.27 0.14 0.36 -- 0.36Health Care 14.85 -11.99 -1.72 17.67 -12.18 -2.16 -2.82 0.18 0.45 0.21 0.11 0.32Energy -- -- -- 0.82 -27.61 -0.25 -0.82 27.61 0.25 0.22 -- 0.22Materials & Processing 3.60 -12.60 -0.46 4.11 -14.17 -0.60 -0.51 1.57 0.14 0.05 0.06 0.11[Cash] 2.87 0.01 0.00 -- -- -- 2.87 0.01 0.00 0.07 -- 0.07Utilities -- -- -- 1.96 -5.43 -0.12 -1.96 5.43 0.12 0.01 -- 0.01Consumer Staples -- -- -- 10.05 1.15 0.07 -10.05 -1.15 -0.07 -0.62 -- -0.62
Allocation Effect
-0.6 -0.4 -0.2 0 0.2 0.4 0.6
Consumer Discretionary
Technology
Financial Services
Producer Durables
[Unassigned]
Health Care
Energy
Materials & Processing
[Cash]
Utilities
Consumer Staples
0.17
0.11
0.00
0.00
0.36
0.21
0.22
0.05
0.07
0.01
-0.62
Selection Effect
0 0.5 1 1.5 2 2.5 3 3.5
2.88
1.69
0.53
0.40
0.11
0.06
Total Effect
-0.5 0 0.5 1 1.5 2 2.5 3 3.5
3.05
1.80
0.53
0.39
0.36
0.32
0.22
0.11
0.07
0.01
-0.62
Top/Bottom Active ContributorsAvg
WeightTotal
ReturnTotal
EffectTop 5 28.67 3.66
NIKE, Inc. Class B 6.79 14.13 1.14Google Inc. Class C 5.51 16.89 0.76Starbucks Corporation 6.17 6.30 0.62TJX Companies, Inc. 4.93 8.26 0.57Priceline Group Inc 5.27 7.43 0.57
Bottom 5 20.85 -1.58Abbott Laboratories 5.90 -17.66 -0.79Fastenal Company 3.60 -12.60 -0.29Oracle Corporation 4.81 -10.04 -0.21W.W. Grainger, Inc. 1.23 -8.67 -0.16Regeneron Pharmaceuticals, Inc... 5.31 -8.82 -0.13
Attribution Over Time
7/02/2015 7/10/2015 7/17/2015 7/24/2015 7/31/2015 8/07/2015 8/14/2015 8/21/2015 8/28/2015 9/04/2015 9/11/2015 9/18/2015 9/25/2015 9/30/2015
0
1
2
3
4
5
6
Allocation Effect Selection Effect Total Effect (Cumulative)
Page 19
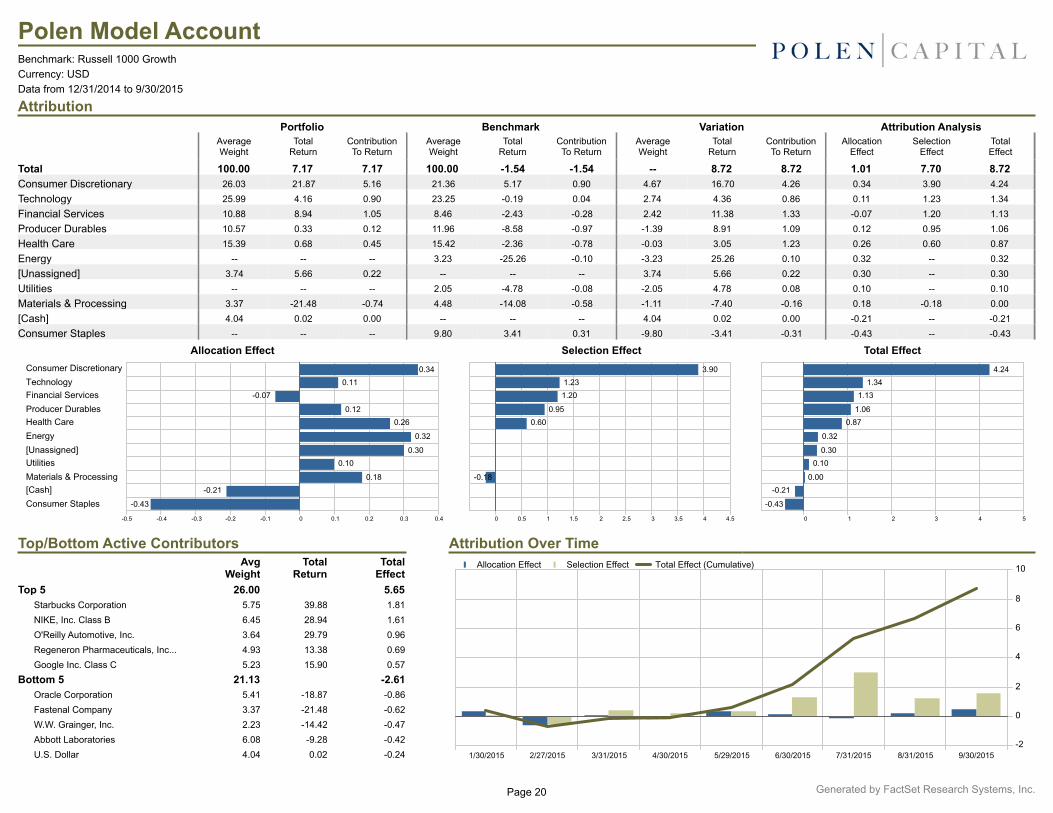
Polen Model AccountBenchmark: Russell 1000 GrowthCurrency: USDData from 12/31/2014 to 9/30/2015
Generated by FactSet Research Systems, Inc.
AttributionPortfolio Benchmark Variation Attribution Analysis
AverageWeight
TotalReturn
ContributionTo Return
AverageWeight
TotalReturn
ContributionTo Return
AverageWeight
TotalReturn
ContributionTo Return
AllocationEffect
SelectionEffect
TotalEffect
Total 100.00 7.17 7.17 100.00 -1.54 -1.54 -- 8.72 8.72 1.01 7.70 8.72Consumer Discretionary 26.03 21.87 5.16 21.36 5.17 0.90 4.67 16.70 4.26 0.34 3.90 4.24Technology 25.99 4.16 0.90 23.25 -0.19 0.04 2.74 4.36 0.86 0.11 1.23 1.34Financial Services 10.88 8.94 1.05 8.46 -2.43 -0.28 2.42 11.38 1.33 -0.07 1.20 1.13Producer Durables 10.57 0.33 0.12 11.96 -8.58 -0.97 -1.39 8.91 1.09 0.12 0.95 1.06Health Care 15.39 0.68 0.45 15.42 -2.36 -0.78 -0.03 3.05 1.23 0.26 0.60 0.87Energy -- -- -- 3.23 -25.26 -0.10 -3.23 25.26 0.10 0.32 -- 0.32[Unassigned] 3.74 5.66 0.22 -- -- -- 3.74 5.66 0.22 0.30 -- 0.30Utilities -- -- -- 2.05 -4.78 -0.08 -2.05 4.78 0.08 0.10 -- 0.10Materials & Processing 3.37 -21.48 -0.74 4.48 -14.08 -0.58 -1.11 -7.40 -0.16 0.18 -0.18 0.00[Cash] 4.04 0.02 0.00 -- -- -- 4.04 0.02 0.00 -0.21 -- -0.21Consumer Staples -- -- -- 9.80 3.41 0.31 -9.80 -3.41 -0.31 -0.43 -- -0.43
Allocation Effect
-0.5 -0.4 -0.3 -0.2 -0.1 0 0.1 0.2 0.3 0.4
Consumer Discretionary
Technology
Financial Services
Producer Durables
Health Care
Energy
[Unassigned]
Utilities
Materials & Processing
[Cash]
Consumer Staples
0.34
0.11
-0.07
0.12
0.26
0.32
0.30
0.10
0.18
-0.21
-0.43
Selection Effect
0 0.5 1 1.5 2 2.5 3 3.5 4 4.5
3.90
1.23
1.20
0.95
0.60
-0.18
Total Effect
0 1 2 3 4 5
4.24
1.34
1.13
1.06
0.87
0.32
0.30
0.10
0.00
-0.21
-0.43
Top/Bottom Active ContributorsAvg
WeightTotal
ReturnTotal
EffectTop 5 26.00 5.65
Starbucks Corporation 5.75 39.88 1.81NIKE, Inc. Class B 6.45 28.94 1.61O'Reilly Automotive, Inc. 3.64 29.79 0.96Regeneron Pharmaceuticals, Inc... 4.93 13.38 0.69Google Inc. Class C 5.23 15.90 0.57
Bottom 5 21.13 -2.61Oracle Corporation 5.41 -18.87 -0.86Fastenal Company 3.37 -21.48 -0.62W.W. Grainger, Inc. 2.23 -14.42 -0.47Abbott Laboratories 6.08 -9.28 -0.42U.S. Dollar 4.04 0.02 -0.24
Attribution Over Time
1/30/2015 2/27/2015 3/31/2015 4/30/2015 5/29/2015 6/30/2015 7/31/2015 8/31/2015 9/30/2015
-2
0
2
4
6
8
10Allocation Effect Selection Effect Total Effect (Cumulative)
Page 20

Polen Model AccountBenchmark: Russell 1000 GrowthCurrency: USDData from 9/30/2014 to 9/30/2015
Generated by FactSet Research Systems, Inc.
AttributionPortfolio Benchmark Variation Attribution Analysis
AverageWeight
TotalReturn
ContributionTo Return
AverageWeight
TotalReturn
ContributionTo Return
AverageWeight
TotalReturn
ContributionTo Return
AllocationEffect
SelectionEffect
TotalEffect
Total 100.00 18.12 18.12 100.00 3.17 3.17 -- 14.95 14.95 3.31 11.64 14.95Consumer Discretionary 25.48 35.02 7.90 21.02 12.61 2.24 4.47 22.41 5.66 0.47 4.89 5.35Financial Services 11.25 30.89 3.63 8.37 8.26 0.57 2.88 22.63 3.06 0.22 2.36 2.58Health Care 16.44 14.95 3.53 15.03 6.14 0.39 1.40 8.81 3.14 0.66 1.67 2.34Technology 25.04 9.89 2.18 23.38 2.62 0.66 1.66 7.27 1.53 0.17 1.91 2.08Energy -- -- -- 3.67 -39.07 -1.10 -3.67 39.07 1.10 1.75 -- 1.75Producer Durables 10.75 10.17 1.29 12.06 -0.32 0.14 -1.31 10.49 1.15 0.10 1.04 1.14Utilities -- -- -- 2.09 -8.95 -0.17 -2.09 8.95 0.17 0.35 -- 0.35Materials & Processing 3.17 -16.32 -0.59 4.55 -12.94 -0.52 -1.38 -3.38 -0.07 0.29 -0.02 0.28[Unassigned] 3.75 4.69 0.17 0.04 10.62 0.01 3.71 -5.93 0.16 0.35 -0.21 0.14[Cash] 4.11 0.02 0.00 -- -- -- 4.11 0.02 0.00 -0.44 -- -0.44Consumer Staples -- -- -- 9.78 10.53 0.95 -9.78 -10.53 -0.95 -0.60 -- -0.60
Allocation Effect
-0.5 0 0.5 1 1.5 2
Consumer Discretionary
Financial Services
Health Care
Technology
Energy
Producer Durables
Utilities
Materials & Processing
[Unassigned]
[Cash]
Consumer Staples
0.47
0.22
0.66
0.17
1.75
0.10
0.35
0.29
0.35
-0.44
-0.60
Selection Effect
0 1 2 3 4 5 6
4.89
2.36
1.67
1.91
1.04
-0.02
-0.21
Total Effect
0 1 2 3 4 5 6
5.35
2.58
2.34
2.08
1.75
1.14
0.35
0.28
0.14
-0.44
-0.60
Top/Bottom Active ContributorsAvg
WeightTotal
ReturnTotal
EffectTop 5 25.32 8.41
Starbucks Corporation 5.54 52.72 1.99NIKE, Inc. Class B 6.45 39.39 1.82O'Reilly Automotive, Inc. 3.52 66.27 1.64Visa Inc. Class A 7.16 31.52 1.51Allergan, Inc. 2.65 -- 1.45
Bottom 5 18.09 -2.13Fastenal Company 3.17 -16.32 -0.59W.W. Grainger, Inc. 2.44 -12.95 -0.59U.S. Dollar 4.11 0.02 -0.50Oracle Corporation 5.51 -4.40 -0.27Celgene Corporation 2.86 14.13 -0.17
Attribution Over Time
10/31/2014 11/28/2014 12/31/2014 1/30/2015 2/27/2015 3/31/2015 4/30/2015 5/29/2015 6/30/2015 7/31/2015 8/31/2015 9/30/2015
-2
0
2
4
6
8
10
12
14
16Allocation Effect Selection Effect Total Effect (Cumulative)
Page 21

www.polencapital.com
Polen Capital vs Large Cap Growth Universe
eVestment and its affiliated entities (collectively, “eVestment”) collect information directly from investment management firms and other sources believed to be reliable; however, eVestment does not guarantee or warrant the accuracy, timeliness, or completeness of the information provided and is not responsible for any errors or omissions. Performance results may be provided with additional disclosures available on eVestment’s systems and other important considerations such as fees that may be applicable. Not for general distribution. * All categories not necessarily included; Totals may not equal 100%. Copyright 2012-2013 eVestment, LLC. All Rights Reserved.
Supplemental information to the fully compliant composite performance which accompanies this presentation. Past performance is not indicative of future results.
Page 22

www.polencapital.com
-45%
-30%
-15%
0%
15%
30%
45%
Polen vs. Russell 1000 Growth & S&P 500January 1, 1989 through September 30, 2015
Downside Protection
PolenAvg. Annualized Return 14.4%
Annual Rates of Return
Supplemental information to the fully compliant composite performance which accompanies this presentation. Past performance is not indicative of future results.
1989 1990 1991 1992 1993 1994 1995 1996 1997 1998 1999 2000 2001 2002 2003 2004 2005 2006 2007 2008 2009 2010 2011 2012 2013 2014 YTD
Polen (Gross) 31.2% 13.1% 39.0% 4.8% 13.1% 10.1% 48.1% 32.0% 37.1% 31.6% 23.9% -3.5% -4.6% -6.7% 17.7% 8.8% -0.5% 15.1% 10.7% -27.8% 39.7% 15.7% 9.2% 12.4% 23.8% 17.6% 7.2%
Polen (Net) 29.8% 11.8% 37.5% 3.5% 11.9% 8.9% 46.3% 30.4% 35.6% 30.2% 22.6% -4.5% -5.5% -7.5% 16.7% 7.8% -1.4% 14.1% 9.8% -28.4% 38.5% 14.7% 8.2% 11.8% 23.0% 17.0% 6.8%
R1000G 35.9% -0.3% 41.3% 5.0% 2.9% 2.6% 37.2% 23.1% 30.5% 38.7% 33.2% -22.4% -20.4% -27.9% 29.8% 6.3% 5.3% 9.1% 11.8% -38.4% 37.2% 16.7% 2.6% 15.3% 33.5% 13.1% -1.5%
S&P 500 31.7% -3.1% 30.5% 7.6% 10.1% 1.3% 37.6% 23.0% 33.4% 28.6% 21.0% -9.1% -11.9% -22.1% 28.7% 10.9% 4.9% 15.8% 5.5% -37.0% 26.5% 15.1% 2.1% 16.0% 32.4% 13.7% -5.3%
Polen (Gross) Russell 1000 Growth S&P 500Polen (Net)
Page 23

www.polencapital.com
Biographies
Mr. Xuereb joined Polen Capital Management in 2011. Prior to joining Polen Capital, over a 15 year period, Mr. Xuereb served roles in equity research, portfolio specialist and Institutional client service for both domestic and global equity portfolios for AllianceBernstein in New York City. Before joining AllianceBernstein, Mr. Xuereb spent two years as an accountant at Dean Witter. He received his B.A. in accounting from the City University of New York, Queens College.
Anthony Xuereb, Relationship Manager
Ms. Bilsky joined Polen Capital Management in 2005. Prior to joining Polen Capital, Ms. Bilsky spent four and a half years with RCM Capital Management in San Francisco as a Senior Associate in the Client Relations and Marketing Group. In addition, she spent three years with TDWaterhouse as a Customer Relationship Officer. She received her B.A. in Economics from Rutgers University.
Svetlana Bilsky, Senior Relationship Associate
Mr. Jensen joined Polen Capital in 2013. Prior to joining Polen Capital, Eric was a student athlete at Wheaton College (MA) where he received his B.S. in Mathematics and Economics with a Statistics Minor. He graduated with magna cum laude honors from Wheaton and was a recipient of the Jean Mulcahy Keefe ’44 Prize in Economics. Mr. Jensen was named conference player of the year and was an Academic All-American 1st Team selection in 2013.
Eric Jensen, Performance AnalystMr. Haymes joined Polen Capital Management in 2013. Prior to joining Polen Capital, Mr. Haymes spent seven years with INTECH Investment Management as SVP Investment Specialist servicing consultant and client relationships. Prior to that, Mr. Haymes spent five years with CRA RogersCasey as Director, Investment Consulting. Prior to that, Mr. Haymes served as Director of Investments for the Communities Foundation of Texas. He also spent 10 years at NationsBank as a VP and
INSTITUTIONAL RELATIONS TEAM
Jim Haymes, Director of Institutional Relations
relationship manager. Mr. Haymes holds a B.B.A. in Finance from the University of North Texas. He holds FINRA Series 7 and 63 licenses. He is a CFA charterholder and a member of the CFA Institute and the CFA Society of South Florida.
Mr. Gunther joined Polen Capital Management in 2005. Prior to joining Polen Capital, Mr. Gunther spent the previous seven years within the Private Client Divisions of Wachovia Wealth Management, Oppenheimer & Co. and Deutsche Bank Alex. Brown. He has a B.A. in Finance from Loyola University in Maryland where he was a student athlete. Mr. Gunther is a Certified Investment Management Analyst and a Chartered Market Technician. He is also a member of the Investment Management Consultants Association and the Market Technicians Association.
John Gunther, Senior Relationship Manager
Mr. Baena joined Polen Capital Management in 2014. Prior to joining Polen Capital, Mr. Baena spent 4 years with Franklin Templeton Investments as a Client Service Business Analyst working with various institutional distribution teams. He received his B.S. in Finance and Multinational Business Operations from Florida State University. He holds FINRA Series 7 and 66 licenses.
Christian Baena, Relationship AssociateMr. Moss received his B.S. in Accounting and earned his MBA from the University of Alabama where he was a student athlete. Mr. Moss is a CFA charterholder and a Certified Public Accountant. He is a member of the Young Presidents’ Organization (YPO), the CFA Institute, the CFA Society of South Florida, and the AICPA. Mr. Moss currently serves on the Board of the Leukemia & Lymphoma Society, Palm Beach Chapter and formerly served on the Board of the Make-A-Wish Foundation of Southern Florida.
EXECUTIVE MANAGEMENT
Stan C. Moss, Chief Executive Officer Mr. Moss joined Polen Capital in 2003. Mr. Moss is responsible for the strategic direction of the firm. Mr. Moss leads distribution and business management for the firm, and serves as Chief Risk Officer. Prior to joining Polen Capital, Mr. Moss served in CFO, strategic planning, operational and business development capacities for AmSouth (now Regions) Wealth and Asset Management. Prior to AmSouth Mr. Moss was an Auditor for Coopers & Lybrand (now PWC) focusing on financial services companies.
Mr. Williams joined Polen Capital in 2015. Prior to joining Polen, he spent 25 years in London and brings extensive experience in sales and market-ing of alternative and long-only funds. Before co-founding his own Global Macro hedge fund in 2005, he was an entrepreneur in software and web applications. His career commenced in London with Goldman Sachs, then Lehman Brothers and Managing Partner of Cantor Fitzgerald’s global broker-dealer operation. He holds a B.A. and M.B.A. from Columbia University, where he was awarded a Congressional Fellowship.
Steve Williams, Senior Relationship Manager Mr. Jones joined Polen Capital in 2014. Prior to joining Polen Capital, Mr. Jones was a senior leader for over 23 years in the U.S. Marine Corps. A decorated combat veteran, Mr. Jones flew over 400 combat hours in F/A-18s. Mr. Jones received his B.A. in Business Management from the University of Colorado where he was a member of the football team. Mr. Jones earned his M.A. from King’s College of London where he
ADVISOR RELATIONS TEAMChip Jones, Director of Advisor Relations
graduated with merit. He is currently a MBA candidate at Northwestern University’s Kellogg School of Management. Mr. Jones serves on the Board of the Leukemia & Lymphoma Society, Palm Beach Chapter.
Page 24

www.polencapital.com
Mr. Gonzalez joined Polen Capital Management in 2014. Prior to joining Polen Capital, Mr. Gonzalez spent the previous three years as a Financial Advisor with Merrill Lynch. Prior to that role, Mr. Gonzalez spent over four years as a Country Research Director with the Oxford Business Group, a London-based research and consultancy firm. Mr. Gonzalez graduated from the University of Florida with a B.S. in Finance and B.A. in Economics. He holds FINRA Series 7 and 66 licenses.
Leonardo Gonzalez, Senior Relationship Associate
Biographies
Ms. Curtis joined Polen Capital in 2013. Prior to joining Polen Capital, Ms. Curtis spent two years with West Face Capital, Inc. in operations. Prior to that, Ms. Curtis spent one year as an Operations Analyst at Perimeter Financial and six years at TD Bank Financial Group in Toronto in various operational positions. Ms. Curtis has a Bachelor of Arts (Hon) in Economics and Political Science from York University of Toronto. Ms. Curtis is CFA Level II candidate. .
Irina Curtis, Sr. Associate, Operations
Mr. Driscoll joined Polen Capital Management in 2014. He has over 22 years of investment industry experience, evenly split between operations and trading. Prior to joining Polen Capital, Mr. Driscoll was a Vice President, senior Derivatives Operations Manager at BNY Mellon for one of the largest hedge funds in the world. Prior to that, he was a Futures and FX trader with John W. Henry & Co in Boca Raton, FL. for 7 ½ years. At Putnam Investments in Boston, Mass.,
Stephen Driscoll, Sr. Associate, Operations & Trading
Mr. Driscoll had been a Vice President, trading North and South American equities, as well as time spent trading Asian Emerging Market stocks. He began his career at State Street Bank in Fund Accounting and Derivatives Operations. Mr. Driscoll attended the University of New Hampshire with a B.S. degree in Business Administration. He is a CFA Charterholder and member of the CFA Society of South Florida and the South Florida Traders Association.
Mr. Finn joined Polen Capital in 2012. Prior to joining Polen Capital, Mr. Finn served over eight years as Vice President of Trading at Hansberger Global Investors. There he was responsible for trading in both developed and emerging markets for Institutional accounts. Mr. Finn began his industry career in 2001 as an Assistant Trader with Mackenzie Investment Management Inc., manager and distributor of the Ivy Funds. He earned a Bachelor of Arts degree from the University of North Carolina at Wilmington.
John Finn, Trader
Mr. Gross joined Polen Capital Management in 2011. Prior to joining Polen, Mr. Gross was a Regional Consultant with Goldman Sachs, and previously spent four years with Managers Investment Group. He received his B.A. in Economics and Business Administration from St. Norbert College. Mr. Gross is also a Chartered Alternative Investment Analyst.
John Gross, Relationship Manager
Mr. Powers joined Polen Capital in 2014. He has over 19 years of investment management technology experience. Prior to joining PolenCapital, Mr. Powers was Managing Director of Information Technology at Hansberger Global Investors. He began his career at the University of Miami managing the IT help desk and PC training program in addition to teaching in the School of Business Administration and the university’s
OPERATIONS AND TRADING TEAMAndrew Powers, Director of Information Technology
Information System Institute. Mr. Powers earned a Master of Science in Computer Information Systems, an MBA, a Certificate in Telecommunications Management as well as a BA in Finance all from the University of Miami.
Mr. Podbelski joined Polen Capital Management in 2008. Prior to joining Polen Capital, Mr. Podbelski spent the previous two years as a Regional Manager with Managers Investment Group. Prior to that role, Mr. Podbelski spent five years as a Financial Advisor at Morgan Stanley in Santa Monica, CA. He received his B.A. from Brandeis University where he was an all-conference baseball player. Mr. Podbelski is also a Chartered Alternative Investment Analyst.
Ian Podbelski, Senior Relationship ManagerMr. Yacko joined Polen Capital in 2010. He has over 16 years of investment industry experience encompassing operations, trading, and client service. Prior to joining Polen Capital, Mr. Yacko was Vice President, Trading for almost three years at NMF Asset Management, Inc. His experience also includes Manager of Operations and Trading at Carl Domino, Inc. and Relationship Officer with JP Morgan Private Bank. He began his career in operations with Brandywine
Brian Yacko, Manager of Operations & Trading
Asset Management. Mr. Yacko attended Southern Illinois University where he earned his B.S. in Business Management.
Mr. Fitzgerald joined Polen Capital Management in 2015. Prior to joining Polen Capital, Mr. Fitzgerald spent over 4 years in the Advertising industry. Mr. Fitzgerald graduated from the University of Alabama with a B.S. in Business Management and M.S. in Human Environmental Sciences, where he was also a member of the football team.
PJ Fitzgerald, Relationship Associate
Page 25

www.polencapital.com
Biographies
Mr. Devino joined Polen Capital Management in 2004. He has over 22 years of experience with investment management firms. Prior to joining Polen Capital, Mr. Devino was the Corporate Accounting Manager with Mackenzie Investment Management Inc., manager and distributor of the Ivy Funds. He attended Florida State University where he earned B.S. degrees in Accounting and Finance.
George Devino, Controller & Compliance Officer
Ms. Morales joined Polen Capital Management in 2004. Prior to joining Polen Capital, Ms. Morales spent six years with MBNA in various departments including Consumer Finance Customer Assistance. She attended Florida Atlantic University.
Delia Morales, Office Administrator
Mr. Goldberg joined Polen Capital Management in 2014. Prior to joining Polen Capital, Mr. Goldberg spent five years as a lawyer in the investment management practice of Seward & Kissel LLP in New York City, where he counseled registered investment adviser clients regarding diverse legal and compliance issues. Mr. Goldberg received his B.A. in Political Science with an Economics Minor from American University, where he graduated magna cum laude. He earned his J.D. from Columbia Law School.
BUSINESS MANAGEMENT TEAM
Brian D. Goldberg, Director of Legal and Compliance (CCO)
Ms. Forgea joined Polen Capital Management in 2013. Prior to joining Polen Capital, Ms. Forgea spent 10 years as an Executive Administrator in the medical industry. Prior to that, Ms. Forgea worked as an Administrative Assistant in the manufacturing and entrepreneurial start-up workspace. She will receive her A.A. in Business Administration from Broward College in 2015.
Jill Forgea, Executive Assistant
Ms. Welch joined Polen Capital in 2015. She received her Bachelor of Science in Computer Information Systems from Livingstone and received her MBA from Nova Southeastern University. She has over 7 years’ experience in the financial services sector as a Senior Accountant/Financial Analyst. She has worked with Credit Suisse Investment and Private Banking as a Financial Accountant, Norwegian Cruise Line as a lead Senior Accountant and Office Depot/Office Max merger as a Senior Accountant.
Tenielle Welch, Financial Analyst
Melanie Laroche, Executive AssistantMelanie Laroche joined Polen Capital Management in 2014. She has over 10 years of experience with investment management firms. Prior to joining Polen Capital, Mrs. Laroche was an Executive Secretary to a series of International Funds at Federated Investors Inc. in New York City. Mrs. Laroche received her B.F.A. in Computer Graphics and Interactive Media with an Art History Minor from Pratt Institute, Brooklyn.
Mrs. Rajoo joined Polen Capital in 2013. Prior to joining Polen Capital Mrs. Rajoo spent three years with Genspring Family Offices head quartered in Jupiter, Florida as a Reconciliation Specialist. In addition, she spent five years with American Securities Group as Trader and Billing Team Leader. She received her B.A. in Finance from Florida State University.
Kavita Rajoo, Associate, Operations
Page 26

www.polencapital.com
UMA Firm
Gross Net2015* 6,235 1,690 4,545 2,212 308 7.20% 6.77% -5.29% -1.54% 0.2% 9.78 9.74 10.142014 5,366 1,374 3,992 2,019 257 17.58% 16.95% 13.69% 13.05% 0.2% 10.66 9.10 9.732013 5,017 1,197 3,820 1,887 256 23.77% 23.05% 32.39% 33.48% 0.3% 11.91 12.11 12.352012 4,522 891 3,631 1,571 357 12.43% 11.75% 16.00% 15.26% 0.1% 16.01 15.30 15.882011 2,366 562 1,804 596 185 9.03% 8.24% 2.11% 2.64% 0.2% 15.97 18.97 18.012010 1,185 322 863 337 129 15.65% 14.69% 15.06% 16.71% 0.2% 20.16 22.16 22.422009 624 131 493 235 127 39.73% 38.49% 26.46% 37.21% 0.3% 16.99 19.91 20.012008 266 10 256 152 121 -27.82% -28.43% -37.00% -38.44% 0.2% 15.26 15.29 16.632007 682 - 682 504 152 10.78% 9.87% 5.49% 11.81% 0.2% 8.36 7.79 8.662006 730 - 730 533 224 15.00% 14.05% 15.80% 9.07% 0.1% 7.27 6.92 8.432005 1,849 - 1,849 986 430 -0.53% -1.43% 4.91% 5.26% 0.2% 8.10 9.17 9.672004 2,017 - 2,017 1,160 693 8.73% 7.76% 10.88% 6.30% 0.2% 10.09 15.07 15.662003 1,617 - 1,617 969 570 17.72% 16.67% 28.68% 29.75% 0.6% 12.98 18.32 22.982002 970 - 970 544 420 -6.69% -7.54% -22.06% -27.88% 0.4% 13.15 18.81 25.582001 703 - 703 417 305 -4.61% -5.50% -11.93% -20.42% 0.6% 13.58 16.94 25.562000 622 - 622 363 239 -3.50% -4.45% -9.10% -22.42% 0.5% 16.52 17.67 23.111999 640 - 640 385 233 23.89% 22.63% 21.04% 33.16% 0.6% 18.27 16.76 19.271998 418 - 418 266 205 31.61% 30.20% 28.58% 38.71% 0.7% 17.95 16.23 18.151997 252 - 252 147 160 37.14% 35.64% 33.36% 30.49% 0.9% 13.17 11.30 12.801996 140 - 140 94 125 31.95% 30.43% 22.96% 23.12% 0.7% 10.16 9.72 10.491995 70 - 70 46 63 48.08% 46.34% 37.58% 37.18% 1.1% 9.72 8.34 9.261994 32 - 32 18 28 10.11% 8.94% 1.32% 2.62% 1.6%1993 24 - 24 16 27 13.07% 11.85% 10.08% 2.87% 2.9%1992 16 - 16 11 24
Composite Assets Annual Performance Results
Composite
3 Year Standard Deviation**
Year End
Total (millions)
U.S. Dollars (millions)
Assets (millions)
Assets (millions)
Russell 1000 Growth
S&P 500 PCM Gross
Composite Dispersion
Russell 1000 Growth
S&P 500Number of Accounts
GIPS Disclosure
Polen Capital ManagementLarge Capitalization Equity Composite-Annual Disclosure Presentation
Total assets and UMA assets are supplemental information to the Annual Disclosure Presentation.*Performance represents partial period (January 1, 2015 through September 30, 2015), assets and accounts are as of 9/30/15. ** 2015 3 Year Standard Deviation is as of 9/30/15.
Page 27

www.polencapital.com
The Large Capitalization Equity Composite created on January 1, 2006 contains fully discretionary large cap equity accounts that are not managed within a wrap fee structure and for comparison purposes is measured against the S&P 500 and the Russell 1000 Growth indices. Polen Capital invests exclusively in a portfolio of high quality large cap and liquid companies.
Polen Capital Management claims compliance with the Global Investment Performance Standards (GIPS®) and has prepared and presented this report in compliance with the GIPS standards. Polen Capital Management has been independently verified by Ashland Partners & Company LLP for the periods April 1, 1992 through December 31, 2014.
Verification assesses whether (1) the firm has complied with all the composite construction requirements of the GIPS standards on a firm-wide basis and (2) the firm’s policies and procedures are designed to calculate and present performance in compliance with the GIPS standards. The Large Capitalization Equity Composite has been examined for the periods April 1, 1992 through December 31, 2014. The verification and performance examination reports are available upon request.Polen Capital Management is an independent registered investment adviser. The firm maintains a complete list and description of composites, which is available upon request. In July 2007, the firm was reorganized from an S-corporation into an LLC and changed names from Polen Capital Management, Inc. to Polen Capital Management, LLC.
Results are based on fully discretionary accounts under management, including those accounts no longer with the firm. As of July 1, 2002, composite policy requires the temporary removal of any portfolio incurring a client initiated significant cash outflow of 10% or greater of portfolio assets. The temporary removal of such an account occurs at the beginning of the month in which the significant cash flow occurs and the account re-enters the composite the first full month after the cash flow. Additional information regarding the treatment of significant cash flows is available upon request. Past performance is not indicative of future results.The U.S. Dollar is the currency used to express performance. Returns are presented gross and net of management fees and include the reinvestment of all income. Net of fee performance was calculated using actual management fees. The annual composite dispersion presented is an asset-weighted standard deviation calculated for the accounts in the composite the entire year. Policies for valuing portfolios, calculating performance, and preparing compliant presentations are available upon request.
The management fee schedule is as follows: Institutional: Per annum fees for managing accounts are 75 basis points (.75%) on the first $50 Million and 55 basis points (.55%) on all assets above $50 Million of assets under management. HNW: Per annum fees for managing accounts are 150 basis points (1.5%) of the first $500,000 of assets under management and 100 basis points (1.0%) of amounts above $500,000 of assets under management. Actual investment advisory fees incurred by clients may vary.
Past performance is not necessarily indicative of future results and future accuracy and profitable results cannot be guaranteed. Performance figures are presented gross of management fees and have been calculated after the deduction of all transaction costs and commissions. Polen Capital is a SEC registered investment advisor and its investment advisory fees are described in its Form ADV Part 2A. The advisory fees will reduce client’s returns. The chart below depicts the effect of a 1% management fee on the growth of one dollar over a 10 year period at 10% (9% after fees) and 20% (19% after fees) assumed rates of return.
The S&P 500® Index is a widely recognized, unmanaged index of 500 common stocks which are generally representative of the U.S. stock market as a whole. The Russell 1000® Growth Index is an unmanaged index that measures the performance of the large-cap growth segment of the U.S. equity universe. It includes those Russell 1000® Index companies with higher price-to-book ratios and higher forecasted growth values.
The information provided in this document should not be construed as a recommendation to purchase or sell any particular security. There is no assurance that any securities discussed herein will remain the composite or that the securities sold will not be repurchased. The securities discussed do not represent the composite’s entire portfolio. Actual holdings will vary depending on the size of the account, cash flows, and restrictions. It should not be assumed that any of the securities transactions or holdings discussed will prove to be profitable, or that the investment recommendations or decisions we make in the future will be profitable or will equal the investment performance of the securities discussed herein. A complete list of our past specific recommendations for the last year is available upon request.
Return 1 Year 2 Years 3 Years 4 Years 5 Years 6 Years 7 Years 8 Years 9 Years 10 Years
10% 1.1 1.21 1.33 1.46 1.61 1.71 1.95 2.14 2.36 2.59
9% 1.09 1.19 1.3 1.41 1.54 1.68 1.83 1.99 2.17 2.39
20% 1.2 1.44 1.73 2.07 2.49 2.99 3.58 4.3 5.16 6.19
19% 1.19 1.42 1.69 2.01 2.39 2.84 3.38 4.02 4.79 5.69
GIPS Disclosure
Page 28

www.polencapital.com
1825 NW Corporate Blvd., Suite 300Boca Raton, FL 33431-6394
1-561-241-2425 (Office)1-561-246-3011 (Fax)www.polencapital.com