polar winds eumetrain polar satellite week 2012 régis borde ([email protected])
TRANSCRIPT

Content
Wind extraction from satellite imagery
Polar winds
North Cape, NZAfter the Wind Workshop
Feb 2012

Content
Wind extraction from satellite imagery
Polar winds at EUMETSAT

For best results, models require information on both the mass field and the wind field.
AMVs are the only observation type to provide good coverage of upper tropospheric wind data over oceans and at high latitudes.
Sondes and wind profilers
Aircraft
For the AMVs each dot represents a single level wind not a wind profile
Why do we care about winds from satellites?
AMVs

AMV production centres:• EUMETSAT
• NOAA-NESDIS
• CIMSS
• JMA
• CMA
• KMA
Atmospheric Motion Vectors
AMVs from Geo. Sat.:• Meteosat 7, 8 and 9
• GOES 13, 15
• FY2E
• MTSAT-2
AMVs from Polar Sat.:• Metop-A (AVHRR)
• Terra, Aqua (MODIS)
• NOAA- 15, 16, 18 and 19 (AVHRR)

Polar windsWhy doing polar winds ?
GOES-13 MET-9 MET-7 MTSAT-2TERRA AQUA
GOES-15 AMVs under evaluation since December 2011
12-h sample coverage: used AMVs at ECMWF in 2012
Assimilation at ECMWF in 2002
Lack of observations inPolar regions

Polar windsHow doing polar winds ?
Needs:• Low orbit polar satellites: NPP, METOP...• Appropriate instruments: MODIS, AVHRR, VIIRS.
But some new challenges:• Large timeliness (~100 min)• Small areas to track features• Problems of view angles, parallax and varying pixels sizes• No cloudy product (AVHRR)• Polar region specificities like ground colder to air above•...

Courtesy of Dave Santek, CIMSSPolar windsProduct history

Unlike geostationary satellites at lower latitudes, it is not be possible to obtain complete polar coverage at a snapshot in time with one or two polar-orbiters. Instead, winds must be derived for areas that are covered by two or three successive orbits, an example of which is shown here. The gray area is the overlap between three orbits.
Courtesy of Dave Santek, CIMSS

One Day of Arctic Orbits
MODIS band 31 (11 m)
Courtesy of Dave Santek, CIMSS

Target selection
Tracking
Height assignment
Automatic quality control
Extraction of the motion (speed, direction)
Selection of the pixels used to set the altitude
Height Assignment
QI
EUMETSAT Atmospheric Motion VectorsAlgorithm description

Two main assumptions and ’limitations’
Feature tracked travels at the exactly same speed and direction than the local wind.
Detected motion represents the ‘cloud top’ motion. Then CTH methods are used to set the altitude
EUMETSAT Atmospheric Motion VectorsPhysical assumptions and limitations

T T + 15 minInfrared Imagery
Target Box / Tracer
24x24 pixels
Pixel – 3 km
Search Area
80 x 80 pixels centred on target box
New location determined by best match of individual pixel counts of target with all possible locations of target in search area.
Need to assign a height to the derived vector
Initial corrections (image navigation etc.)
Extraction of AMV speed and directionTarget identification and tracking

Pressure
EBBT 10.8
AMV Height AssignmentOpaque clouds, EBBT
B: Energy emittedT: Blackbody temperaturek: Boltzmann‘s constanth: Planck‘s constantc: speed of light: wavelenght
1
/2/
52
kThce
hcT
B

cbcdsuf
cbcdsuf
cdcf
cdcf
PIRRIRR
PCORCOR
IR
CO
IRRIRR
CORCOR
,
,
)(
)( 22222
Rcd : Measured cloudy radiance
Rcf : Measured cloud free radiance
Rbcd : Calculated Planck blackbody
radiance for a cloud at level Pc
Rsuf : Calculated clear air radiance
: Emissivities
)()( 2 IRCO Pc
Best fit
AMV Height AssignmentSemi-transparent clouds, CO2 slicing method

AMV Quality check
Several independent quality test applied
• Forecast consistency
• Spatial consistency
• Temporal consistency (vector, speed, direction)
• Temporal pressure consistency
• Image correlation (WV 6.2 / IR 10.8)
Final quality index (QI)
• Weighted mean of the individual tests

red wind vector would not pass the spatial consistency test, it would therefore get a low quality indicator (in a range from 0 to 1)
AMV Quality checkExample of Spatial consistency

AMV
AMV pressure
AMV Speed
PBest Fit level
pressure
USpeed bias
FC Speed at AMV pressure level
How check the quality of AMVs ?

AMV
AMValtitude
50 hPa
Pre
ssur
e L
atitu
de Longitude
RadioSonde
RS altitude
Collocation AMV / RS150 km
CGMS Reference
HOR. DIST. < 150 (Km) VERT. DIST. < 25 (hPa) QUALITY (Without FC test) >= 80 SPEED DIFF. < 30 (m/s) DIRECTION DIFF. < 60 (deg) AMV SPEED > 2.5 (m/s)

Image pairs:
• increase the coverage
• loose temporal quality checks between derived vectors
50 N
EUMETSAT Polar windsImage pairs or triplet ?

EUMETSAT Polar windsImage pairs or triplet ?
Example for retrieved polar cap winds for the Arctic on 19 January 2010.

EUMETSAT Polar windsHow to set the AMV heights with AVHRR ?
Main problems:• No WV or CO2 channels on AVHRR
• No cloudy product
Then...• Use IR window channel (EBBT method) for opaque clouds
• No clean solution for semi-transparent clouds
• Possibility to use low-level correction from model fields

• 24x24 AVHRR pixels target boxes
• IASI foot print sometimes in the box, sometimes not.
• Collocation IASI foot print /feature tracked
EUMETSAT Polar windsOpportunity to use IASI heights
24x24 AVHRR pixels

3 day period Nov 2011 : 060000Z and 120000Z 3 hour forecast data
Use of IASI co-located heights improves a bit wind quality
ARCTIC All Levels QI > 80
ANTARCTIC All Levels QI > 80
OLD NEWAll
NEWIASI
OLD NEW All
NEWIASI
Speed Bias (m/s) 1.14 0.75 0.80 2.57 1.58 1.72
Speed RMS (m/s) 5.62 4.81 5.11 5.58 4.26 4.53
Direction Bias (deg) 0.30 -0.51 -1.91 -4.69 0.04 -0.06
Direction RMS (deg) 14.95 28.20 15.71 19.28 14.55 11.15
NRMS 0.23 0.20 0.16 0.27 0.22 0.22
EUMETSAT Polar windsUse of IASI heights, Validation

EUMETSAT Polar windsNecessity to use the first guess !
Main problems:• Timeliness between consecutives images is very long, which makes the tracking difficult and noisy. • This problem is emphasised when using only pair of images
Use of the first guess improves the results, but:• Needs to estimate the altitude first• Refers to the model fields• Source of potential errors if first estimation of altitude is wrong
Altitude estimated from initial target box
Speed retrieved in the model fields that is then used to locate the search area
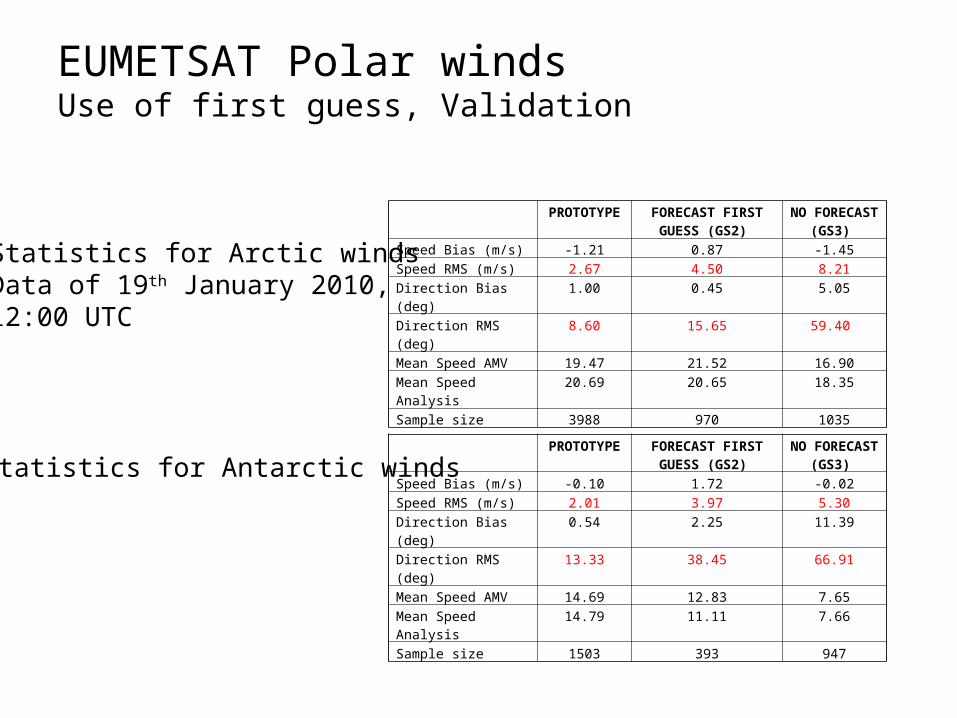
EUMETSAT Polar windsUse of first guess, Validation
PROTOTYPE FORECAST FIRST GUESS (GS2)
NO FORECAST (GS3)
Speed Bias (m/s) -1.21 0.87 -1.45Speed RMS (m/s) 2.67 4.50 8.21Direction Bias (deg) 1.00 0.45 5.05Direction RMS (deg) 8.60 15.65 59.40 Mean Speed AMV 19.47 21.52 16.90Mean Speed Analysis 20.69 20.65 18.35Sample size 3988 970 1035
PROTOTYPE FORECAST FIRST GUESS (GS2)
NO FORECAST (GS3)
Speed Bias (m/s) -0.10 1.72 -0.02Speed RMS (m/s) 2.01 3.97 5.30Direction Bias (deg) 0.54 2.25 11.39Direction RMS (deg) 13.33 38.45 66.91Mean Speed AMV 14.69 12.83 7.65Mean Speed Analysis 14.79 11.11 7.66Sample size 1503 393 947
Statistics for Arctic windsData of 19th January 2010, 12:00 UTC
Statistics for Antarctic winds

5 day period May 2011 : 060000Z and 120000Z 6 hour forecast
•
Low Level (>=700 hPa)
Mid Level (700-400 hPa)
High Level (<=400 hPa)
All Levels
OLD NEW OLD NEW OLD NEW OLD NEW
Speed Bias (m/s) 1.81 1.21 1.91 1.18 0.57 1.14 1.82 1.14
Speed RMS (m/s) 4.06 3.57 4.54 3.98 5.45 4.28 4.43 3.91
Direction Bias (deg) 0.44 2.51 0.66 0.49 2.26 -0.86 0.63 0.86
Direction RMS (deg) 16.00 18.41 12.77 13.75 10.96 10.04 13.83 14.70
Mean Speed AMV 16.64 15.43 21.62 20.21 29.23 26.51 20.33 19.53
Mean Speed Analysis
14.83 14.22 19.71 19.10 28.66 25.38 18.51 18.39
NRMS 0.27 0.25 0.23 0.21 0.19 0.17 0.24 0.21
Sample size 3002 2111 5909 5754 393 685 9268 8508
% of Winds 32 25 64 67 4 8 100 100
EUMETSAT Polar windsValidation against ECMWF analysis - Arctic QI > 80
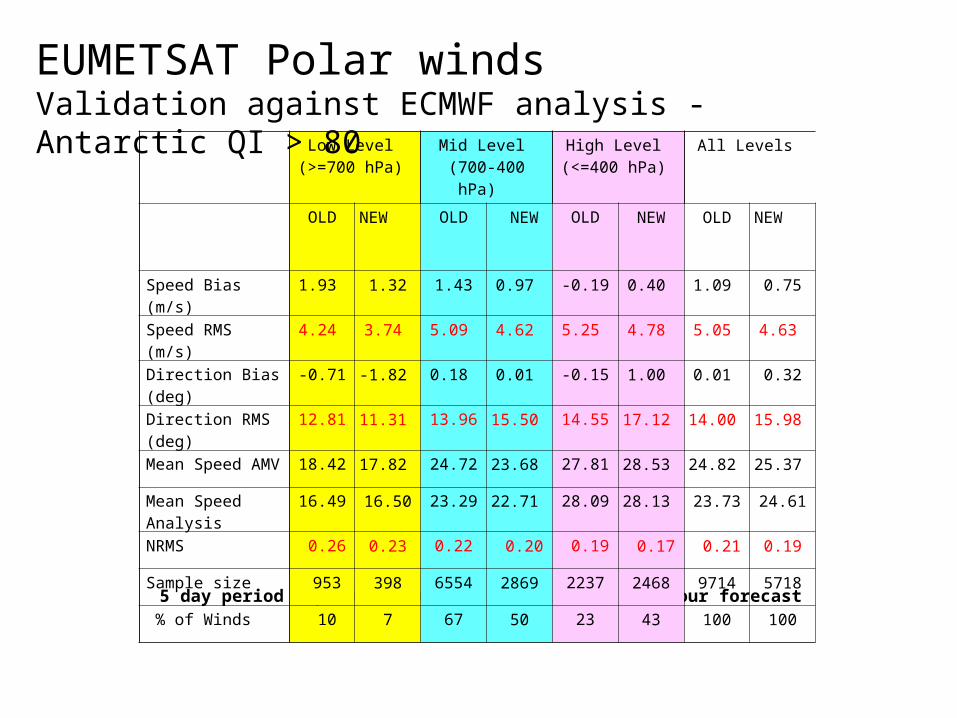
5 day period May 2011 : 060000Z and 120000Z 6 hour forecast
Low Level (>=700 hPa)
Mid Level (700-400 hPa)
High Level (<=400 hPa)
All Levels
OLD NEW OLD NEW OLD NEW OLD NEW
Speed Bias (m/s) 1.93 1.32 1.43 0.97 -0.19 0.40 1.09 0.75
Speed RMS (m/s) 4.24 3.74 5.09 4.62 5.25 4.78 5.05 4.63
Direction Bias (deg) -0.71 -1.82 0.18 0.01 -0.15 1.00 0.01 0.32
Direction RMS (deg) 12.81 11.31 13.96 15.50 14.55 17.12 14.00 15.98
Mean Speed AMV 18.42 17.82 24.72 23.68 27.81 28.53 24.82 25.37
Mean Speed Analysis
16.49 16.50 23.29 22.71 28.09 28.13 23.73 24.61
NRMS 0.26 0.23 0.22 0.20 0.19 0.17 0.21 0.19
Sample size 953 398 6554 2869 2237 2468 9714 5718
% of Winds 10 7 67 50 23 43 100 100
EUMETSAT Polar windsValidation against ECMWF analysis - Antarctic QI > 80

Current status AVHRR L1B IR-Window images from channel 4 (11µm) For METOP-AVHRR full spatial resolution Local Area Coverage (LAC)
data are available globally Use image pairs Use IASI heights when possible Use first guess to locate search area for tracking
Future Use triplet of images for METOP A and METOP B Derive dual METOP winds (global coverage)
Polar windsEUMETSAT product from AVHRR, summary

Polar windsExample of EUMETSAT AVHRR winds

Impact of AMVs from
MODIS,
Meteosat-7, -9,
GOES-11, -12
sliced by pressure intervals
AMV Impact on FC24 h ‘Forecast Error Contribution’ of the AMVs by instrument and for altitude intervals, June 2011 (C. Cardinali, ECMWF)
