polar phonon anomalies in single crystalline tbsco 3 · ... academy of sciences of the czech...
TRANSCRIPT

1
Polar phonon anomalies in single crystalline TbScO3
Stanislav Kamba,a,* Veronica Goian,a Dmitry Nuzhnyy,a Viktor Bovtun,a Martin Kempa,a
Jan Prokleška,b Margitta Bernhagen,c Reinhard Uecker,c and Darrell G. Schlomd,e
aInstitute of Physics, Academy of Sciences of the Czech Republic, Na Slovance 2, 182 21
Prague 8, Czech Republic bFaculty of Mathematics and Physics, Department of Condensed Matter Physics, Charles
University, Ke Karlovu 5, 121 16, Prague 2, Czech Republic cLeibniz Institute for Crystal Growth, Max-Born-Strasse 2, 12489 Berlin, Germany
dDepartment of Materials Science and Engineering, Cornell University, Ithaca, New York, 14853-1501, USA
eKavli Institute at Cornell for Nanoscale Science, Ithaca, New York, 14853-1501, USA
*Corresponding author. Email: [email protected] Polarized infrared reflectivity spectra of a (110)-oriented TbScO3 single crystal plate were
measured down to 10 K. The number of observed polar phonons active along the
crystallographic c axis at low temperatures is much higher than predicted by factor-group
analysis for the orthorhombic Pbnm- 162hD space group. Moreover, the lowest frequency
phonons active in E || c as well as in E || 1 1 0[ ] polarized spectra exhibit dramatic softening
tending to a lattice instability at low temperatures. The dielectric permittivity at microwave
frequencies does not show any ferroelectric-like anomaly, but the dielectric loss exhibits a
maximum at 100 K. The origin of the discrepancy between the number of predicted and
observed polar phonons as well as the tendency toward lattice instability are discussed.
Magnetic measurements reveal an antiferromagnetic phase transition near 3 K.
Keywords: phonons; infrared and microwave spectroscopy; antiferromagnetic phase transition, rare-earth scandates.
I. Introduction
Rare-earth scandates (REScO3, with RE = rare earth) have been intensively studied in the last
decade in both single crystalline1,2,3,4,5,6 and thin film7 form. They have rather large dielectric
constants (K=20-30) 8 and are chemically stable in contact with Si, 9 which makes them
potentially promising as high-K dielectrics for field-effect transistor applications.9,10
2
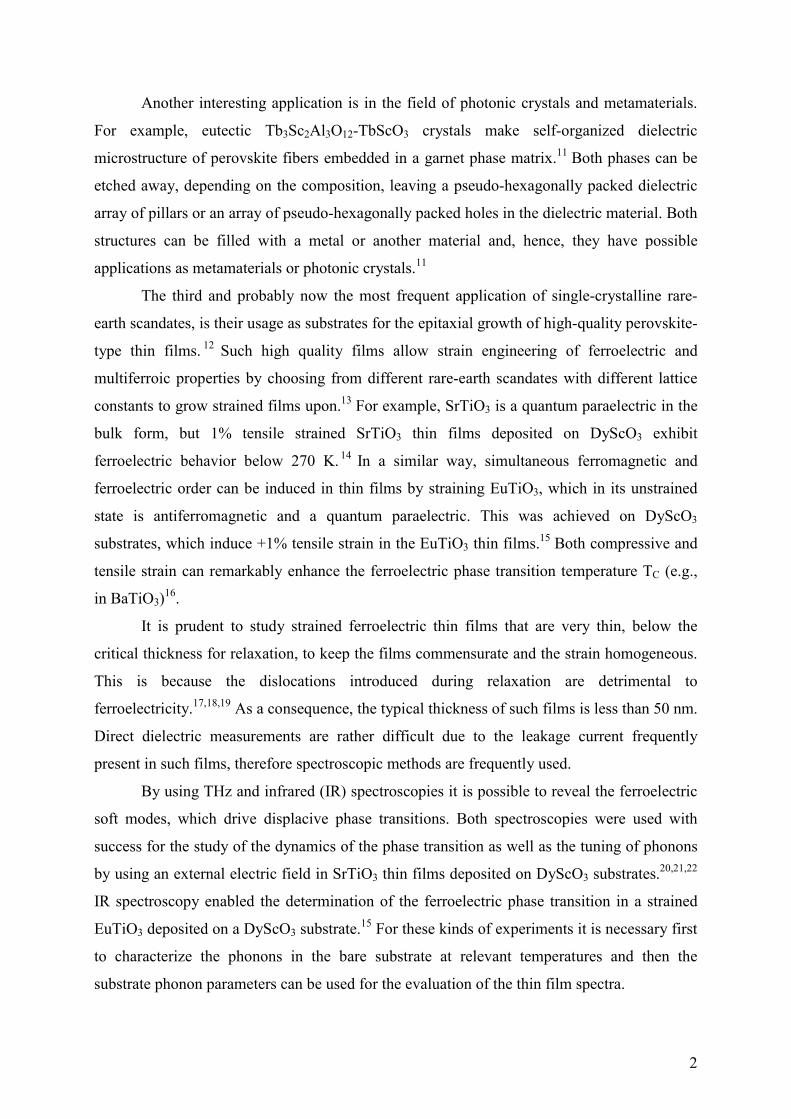
Another interesting application is in the field of photonic crystals and metamaterials.
For example, eutectic Tb3Sc2Al3O12-TbScO3 crystals make self-organized dielectric
microstructure of perovskite fibers embedded in a garnet phase matrix.11 Both phases can be
etched away, depending on the composition, leaving a pseudo-hexagonally packed dielectric
array of pillars or an array of pseudo-hexagonally packed holes in the dielectric material. Both
structures can be filled with a metal or another material and, hence, they have possible
applications as metamaterials or photonic crystals.11
The third and probably now the most frequent application of single-crystalline rare-
earth scandates, is their usage as substrates for the epitaxial growth of high-quality perovskite-
type thin films. 12 Such high quality films allow strain engineering of ferroelectric and
multiferroic properties by choosing from different rare-earth scandates with different lattice
constants to grow strained films upon.13 For example, SrTiO3 is a quantum paraelectric in the
bulk form, but 1% tensile strained SrTiO3 thin films deposited on DyScO3 exhibit
ferroelectric behavior below 270 K. 14 In a similar way, simultaneous ferromagnetic and
ferroelectric order can be induced in thin films by straining EuTiO3, which in its unstrained
state is antiferromagnetic and a quantum paraelectric. This was achieved on DyScO3
substrates, which induce +1% tensile strain in the EuTiO3 thin films.15 Both compressive and
tensile strain can remarkably enhance the ferroelectric phase transition temperature TC (e.g.,
in BaTiO3)16.
It is prudent to study strained ferroelectric thin films that are very thin, below the
critical thickness for relaxation, to keep the films commensurate and the strain homogeneous.
This is because the dislocations introduced during relaxation are detrimental to
ferroelectricity.17,18,19 As a consequence, the typical thickness of such films is less than 50 nm.
Direct dielectric measurements are rather difficult due to the leakage current frequently
present in such films, therefore spectroscopic methods are frequently used.
By using THz and infrared (IR) spectroscopies it is possible to reveal the ferroelectric
soft modes, which drive displacive phase transitions. Both spectroscopies were used with
success for the study of the dynamics of the phase transition as well as the tuning of phonons
by using an external electric field in SrTiO3 thin films deposited on DyScO3 substrates.20,21,22
IR spectroscopy enabled the determination of the ferroelectric phase transition in a strained
EuTiO3 deposited on a DyScO3 substrate.15 For these kinds of experiments it is necessary first
to characterize the phonons in the bare substrate at relevant temperatures and then the
substrate phonon parameters can be used for the evaluation of the thin film spectra.

3
Phonons in the rare-earth scandates have been investigated using first principles
calculations,8,23 but detailed experimental data are missing. DyScO3 has been studied using IR
spectroscopy, but Baldassare et al.24 published only unpolarized IR reflectivity spectra and
assigned the modes solely on the basis of the calculated phonon frequencies in Ref. 23.
Polarized IR reflectivity spectra of DyScO3 were published in the supplement of Ref. 15, but
without complete phonon parameters. Detailed Raman scattering spectra of DyScO3 and
GdScO3 were published by Chaix-Pluchery and Kreisel.25
TbScO3 is isostructural with and has similar lattice parameters to DyScO3.
Unpolarized room-temperature far-IR reflectivity spectra of TbScO3 were briefly published,
but no assignment of the polar phonons has been done.26 The aim of this paper is to study the
polarized IR reflectivity spectra of TbScO3 down to 10 K. Rather large phonon frequency
shifts with temperature were discovered. Their origin is discussed. In addition, we have
investigated the magnetic properties of TbScO3 and observe an antiferromagnetic phase
transition near 3 K.
II. Experimental
A single-crystalline plate of 1 1 0( ) TbScO3 with size 10x10x1 mm was utilized in this study.
The crystal growth is described in detail by Uecker et al.4 The crystal orientation allowed us
to perform polarized IR and THz experiments with the polarization of the electric vector of
the beam in the E || 1 1 0[ ] and E || [001] directions. It should be stressed that we use the non-
standard setting with space group Pbnm to describe the crystallography of TbScO3. In this
setting its axes lengths are a = 5.4543 Å, b = 5.7233 Å and c = 7.9147 Å The structure
determination of Veličkov et al. makes use of the standard setting of space group Pnma for
the structure of TbScO3 in the settings with c<a<b.27
For the THz time-domain transmission experiments we used a Ti:sapphire femtosecond
laser oscillator. Linearly polarized THz probing pulses were generated by an interdigitated
photoconducting GaAs switch and detected using the electro-optic sampling with a 1 mm
thick [110] ZnTe crystal. The complex dielectric spectra were taken in the range of 5-66 cm-1
(150 GHz – 2 THz) at temperatures from 10 to 300 K.
Near-normal IR reflectivity spectra were obtained using a Fourier transform IR
spectrometer Bruker IFS 113v. In both THz and IR measurements, an Optistat CF cryostat
(Oxford Instruments) with polyethylene (IR) and Mylar (THz) windows was used for

4
measurements between 10 and 300 K. The frequency range of the low-temperature IR
measurements was limited by the transparency of the polyethylene windows (up to 650 cm-1);
the measurements above room temperature were performed up to 3000 cm-1, which allowed
us to determine not only phonon parameters, but also ε∞, i.e. the sum of electronic
contributions to the permittivity.
The near-normal IR reflectivity can be expressed as
, (1)
where the complex dielectric function ε*(ω) can be expressed using a generalized oscillator
model with factorized form of the complex permittivity:
(2)
where TOjω and LOjω are the transverse and longitudinal frequencies of the j-th polar phonon,
respectively, TOjγ and LOjγ are their damping constants, and ∞ε denotes the high frequency
permittivity resulting from electronic absorption processes. The static permittivity ε(0) is
given by the sum of phonon and electronic contributions
. (3)
Here the dielectric strength ∆εj of the jth polar phonon is defined as
. (4)
Equations (1) – (2) were used for simultaneous fits of the IR reflectivity and complex THz
permittivity; Equations (3) and (4) were used to determine the static permittivity.
The dielectric properties of the TbScO3 plate at microwave frequencies were
characterized by a thin dielectric resonator method.28 A TE01δ resonance of the 0.486 mm
thick TbScO3 plate was excited in a cylindrical shielding cavity with low coupling. The
temperature dependence of the resonance frequency and quality factor was measured using an
2
*
*
1)(
1)()(
+
−=
ωε
ωεωR
∑=
∞+∆=n
jj
1)0( εεε
∏ +−+−
=−= ∞j TOjTOj
LOjLOj
ii
iωγωωωγωω
εωεωεωε 22
22* )(")(')(
∏∏
≠
∞
−
−=∆
jkTOjTOk
kTOjLOk
TOjj )(
)(
22
22
2 ωω
ωω
ωεε

5
Agilent E8364B network analyzer and a Janis closed-circle He cryostat. Then the temperature
dependence of the in-plane averaged dielectric parameters were calculated.28
Magnetic susceptibility and magnetization measurements were performed using
a Quantum Design PPMS9 equipped with a home-made induction coil that enables
measurements of ac magnetic susceptibility, χ, from 13 Hz to 10 kHz at temperatures between
1.8 and 300 K.
III. Results and discussion
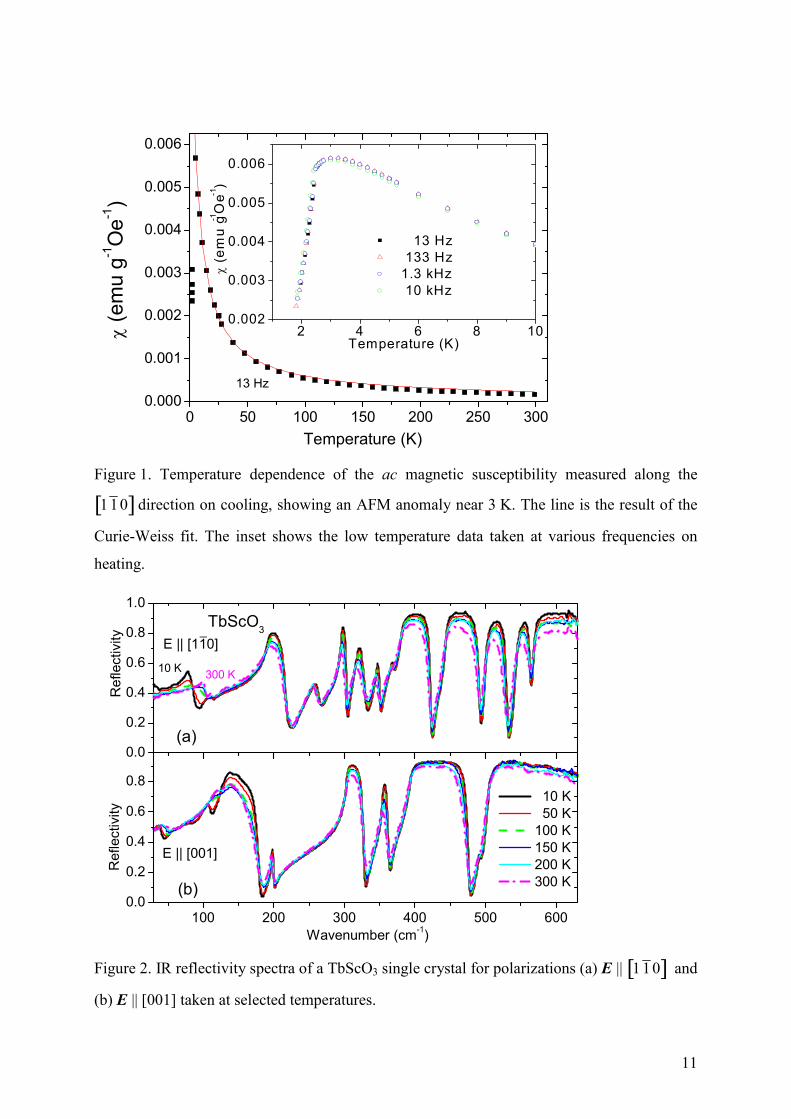
The result of magnetic susceptibility measurements is shown in Figure 1. Susceptibility
follows the Curie-Weiss Law θ
χ−
=T
CT )( (see the solid line in Figure 1) with an
extrapolated temperature θ = -5.1 K. The observed temperature dependence of the
susceptibility with a peak near 3.0 K is typical of antiferromagnetic (AFM) materials. The
magnetic properties of TbScO3 were never investigated before, but DyScO3 exhibits similar
behavior, because its Néel temperature is 3.1 K. 29 DyScO3 shows a strong magnetic
anisotropy with an easy axis along the [100] direction and a hard axis along the [001]
direction.29 Our measurements were performed in the 1 1 0[ ] direction, i.e., perpendicular to
the magnetically hard axis. In DyScO3 rather strong frequency dependence of magnetic
susceptibility was reported; the peak in χ(T) splits and the higher-temperature peak shifts to
higher temperature with increasing frequency. Such behavior is typical of a spin glass or spin
ice.29 In contrast to DyScO3, the susceptibility in TbScO3 exhibits no frequency dependence.
We also performed field-cooled susceptibility measurements in 0.1 T (not shown) and found
them to be the same as zero-field cooled measurements, i.e., our system does not exhibit any
spin glass behavior. Additionally, we performed magnetization measurements M(H) at 1.8 K
(not shown). The magnetization quickly increases with magnetic field H, starts to saturate
above 1 T, and reaches 110 emu/g at 5 T.
Polarized IR reflectivity spectra plotted at various temperatures are shown in Figure 2.
The spectra above 150 cm-1 show no dramatic temperature dependence. Phonon damping
classically decreases on cooling and therefore the intensity of reflection bands increases on
cooling. Non-trivial and unusual temperature dependence is, however, seen at low frequencies
in both of the polarized spectra. For example, in the E || 1 1 0[ ] spectra the lowest frequency
phonon softens and its damping increases on cooling down to 100 K. This is manifested in the
E || 1 1 0[ ] reflectivity spectra by the shift-down of the lowest frequency reflection band and

6
by a decrease of its strength on cooling to 100 K. Nevertheless, on further cooling to 10 K the
phonon damping decreases and therefore the strength of this mode again increases (see
Figure 2(a)). This temperature behavior is also clearly seen in the complex dielectric spectra
plotted in Figure 3(a) as well as in Figure 4(a), where the temperature dependence of the two
lowest phonon frequencies is shown. It follows from the sum rule that the oscillator strength 2TOjjjf ωε∆= of uncoupled phonons is usually temperature independent. The TO1 phonon
frequency softens on cooling, and therefore also the dielectric strength ∆ε1 of this mode
increases on cooling (see Figure 4). ∆ε1 increases, however, faster on cooling than follows
from the temperature independent oscillator strength. This is caused by a coupling with the
TO2 mode, which partially transfers its strength ∆ε2 to ∆ε1.
More complicated phonon behavior with temperature is seen in the E || [001] polarized
spectra (see Figures 2b, 3b and 5). One can also see that the broad reflection band between
100 and 180 cm-1 splits on cooling below 100 K. A detailed fit of reflectivity spectra in Figure
2 reveals that no new phonon activates in the spectra in this frequency range; all modes are
active up to room temperature, but the strength and damping of some of them exhibit strong
temperature dependences. This provides evidence of the mutual coupling among the modes.
Before we discuss the origin of the detected phonon anomalies with temperature, let us
compare the number of observed phonons with the factor group analysis. TbScO3 at room
temperature has an orthorhombic Pbnm perovskite structure with 4 formula units per unit
cell.27 (note that again we use crystal axes settings where a<b<c,8 while Ref. 27 uses settings
with c<a<b, where the space group is Pnma). Factor group analysis of the zone center
phonons gives
Γ=7Ag(x2)+8Au(-)+7B1g(xy) +5B2g(xz)+ 5B3g(yz) +8B1u(z) +10B2u(y) +10B3u(x) (5)
Symbols in brackets mark the activity of phonons in the IR and Raman spectra. It means that
8Au symmetry modes are silent (non-active), 24 phonons should be Raman active and 25
should be IR active (1B1u+1B2u+1B3u are acoustic phonons). According to this analysis 7 B1u
phonons should be IR active in the E || [001] spectra, while 18 modes (9B2u+9B3u) can be
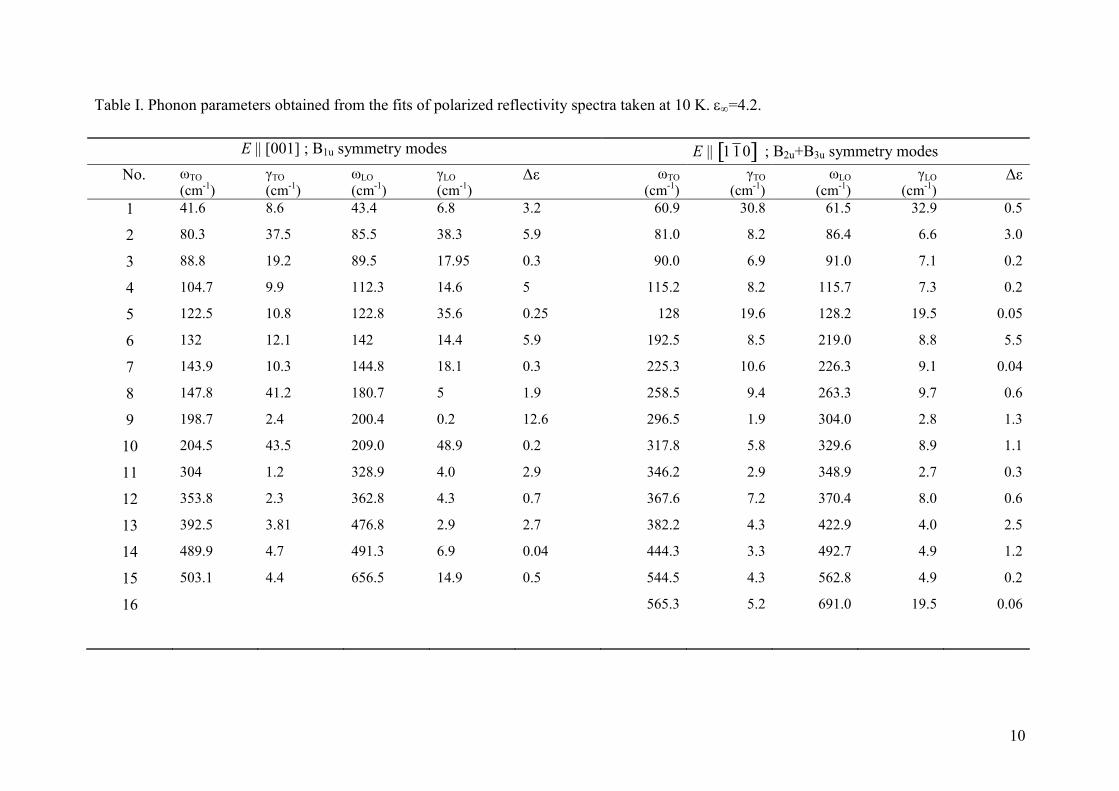
active in the E || 1 1 0[ ] polarized spectra. Parameters of all of the phonons observed in the
spectra at 10 K are summarized in Table I. In the E || 1 1 0[ ] polarized spectra we observed 17
of the 18 allowed modes. This is in very good agreement with the theory, that the missing
mode can be overlapped by some other mode. However, in the E || [001] spectra we see 15

7
polar modes instead of the 7B1u symmetry phonons expected. This is a rather large
discrepancy. In Figure 2b, 7 distinct reflection bands are seen, but a careful fit of the E || [001]
spectra reveal an additional 8 modes are present in the low-frequency range below 180 cm-1
(with the exception of the weak mode at 490 cm-1). There are several possible explanations of
this fact:
1) The additional modes are leakage from the B2u and B3u symmetry modes, which are seen in
the E || [001] spectra due to the non-perfect crystal orientation or non-ideal polarization of
the IR beam. In this case the additional weak modes should have counter-parts in the
E || 1 1 0[ ] spectra (and vice-versa). Unfortunately, the frequencies of the B2u and B3u
symmetry modes cannot be exactly distinguished and their frequencies can be partially
influenced by overlapping of both symmetry modes. Anyway, one can see that most of the
modes have no counter-parts in the different symmetry spectra.
2) The additional modes are not phonons, but electron transitions. Such excitations are
frequently seen in rare-earth compounds, but their frequencies are usually not temperature
dependent. In our case the low-frequency modes exhibit rather large temperature
dependences.
3) The sample has a different symmetry than the Pbnm space group reported up to now or the
unit cell contains more than 4 formula units.27 Phonon frequency changes with temperature
indicate some tendency toward lattice instability in TbScO3 (note the maximum of the
damping of the TO1 phonon seen near 100 K in the E || 1 1 0[ ] spectra and continuous
softening of the TO1 modes on cooling in both polarized spectra – see Figures 4a and 5),
but no clear new modes are observed to activate in the spectra on cooling. Practically all of
the modes are active at all temperatures below 300 K. These observations provide no
evidence for any structural change on cooling. Most of the additional modes are seen in the
low frequency region below 180 cm-1. If we assume multiplication of the unit cell (in
principle already near room temperature), Brillouin zone (BZ) folding occurs and some
new phonons can activate in the IR spectra. High-frequency phonon dispersion branches
usually exhibit small dispersion in the BZ, therefore the newly activated modes from the
BZ boundary have frequencies very close to the phonons from the BZ center and therefore
they are hardly distinguishable in the spectra. On the other hand, the low-frequency phonon
branches exhibit usually larger dispersion and the phonons from the BZ edge can have
completely different frequencies than the modes from the BZ center. Also the acoustic
mode from the BZ edge can become IR active after the BZ folding; these could be the

8
lowest-frequency modes observed in both polarized spectra. Up to now no low-temperature
structural studies have been performed, so it is not known whether the TbScO3 crystal
undergoes any structural phase transition. Microwave dielectric permittivity exhibits no
ferroelectric-like anomaly, it just continuously increases on cooling due to the phonon
softening. On the other hand, the dielectric loss exhibits a maximum near 100 K (see
Figure 4b), i.e., the temperature where the TO1 mode in the E || 1 1 0[ ] spectra exhibits
maximal damping. A maximum in dielectric loss can be a signature of some structural
phase transition, but it can also originate from some defects in the lattice.
It is worth noting that in the E || [001] polarization the DyScO3 and GdScO3 crystals
exhibit similar IR spectra as TbScO3, but their phonon frequencies are slightly shifted because
of the different masses of RE cations.30 The reflection band between 100 and 180 cm-1
exhibits smaller splitting than in TbScO3, but in all samples it can be fit with more than one
oscillator. In all of the above mentioned crystals more than the 7B1u modes are seen. It should
be also stressed that first-principles phonon calculations performed for all of the scandates
never gave phonon frequencies below 95 cm-1. 8,23 On the other hand, in REScO3 (RE = Dy,
Gd, Tb) crystals we always found a B1u phonon with a frequency around 40 cm-1. This shows
either that the calculations are not accurate or the crystal structure of REScO3 is different
(presumably with a larger unit cell).
IV. Conclusion
An antiferromagnetic phase transition has been discovered to occur in single crystalline
TbScO3 near 3 K. IR reflectivity spectra studied in both in-plane polarizations reveal softening
of the lowest-frequency phonons on cooling. Moreover, the TO1 phonon in spectra with
E || 1 1 0[ ] exhibits an unusual increase of damping on cooling with a maximum near 100 K.
We have performed factor group analysis of the BZ center phonons and compared them with
our IR spectra. 15 phonons rather than the 7B1u symmetry allowed modes have been observed
in spectra with E || [001]. The activation of additional modes could be explained by leakage
from other symmetry modes, but more probably by a lower crystal symmetry or a larger unit
cell. Clarification of this issue requires additional structural studies at low temperature, which
are in progress.
Acknowledgements
9
This work was supported by the Czech Science Foundation (Project No. P204/12/1163) and
MŠMT (COST MP0904 project LD12026). We thank J. Drahokoupil for his X-ray diffraction
measurements, Xianglin Ke for helpful discussions, and J. Petzelt for his careful reading of
the manuscript.
10
Table I. Phonon parameters obtained from the fits of polarized reflectivity spectra taken at 10 K. ε∞=4.2.
E || [001] ; B1u symmetry modes E || 1 1 0[ ] ; B2u+B3u symmetry modes No. ωTO
(cm-1) γTO (cm-1)
ωLO (cm-1)
γLO (cm-1)
∆ε ωTO (cm-1)
γTO (cm-1)
ωLO (cm-1)
γLO (cm-1)
∆ε
1 41.6 8.6 43.4 6.8 3.2 60.9 30.8 61.5 32.9 0.5
2 80.3 37.5 85.5 38.3 5.9 81.0 8.2 86.4 6.6 3.0
3 88.8 19.2 89.5 17.95 0.3 90.0 6.9 91.0 7.1 0.2
4 104.7 9.9 112.3 14.6 5 115.2 8.2 115.7 7.3 0.2
5 122.5 10.8 122.8 35.6 0.25 128 19.6 128.2 19.5 0.05
6 132 12.1 142 14.4 5.9 192.5 8.5 219.0 8.8 5.5
7 143.9 10.3 144.8 18.1 0.3 225.3 10.6 226.3 9.1 0.04
8 147.8 41.2 180.7 5 1.9 258.5 9.4 263.3 9.7 0.6
9 198.7 2.4 200.4 0.2 12.6 296.5 1.9 304.0 2.8 1.3
10 204.5 43.5 209.0 48.9 0.2 317.8 5.8 329.6 8.9 1.1
11 304 1.2 328.9 4.0 2.9 346.2 2.9 348.9 2.7 0.3
12 353.8 2.3 362.8 4.3 0.7 367.6 7.2 370.4 8.0 0.6
13 392.5 3.81 476.8 2.9 2.7 382.2 4.3 422.9 4.0 2.5
14 489.9 4.7 491.3 6.9 0.04 444.3 3.3 492.7 4.9 1.2
15 503.1 4.4 656.5 14.9 0.5 544.5 4.3 562.8 4.9 0.2
16 565.3 5.2 691.0 19.5 0.06
11
0 50 100 150 200 250 3000.000
0.001
0.002
0.003
0.004
0.005
0.006
2 4 6 8 100.002
0.003
0.004
0.005
0.006
χ (e
mu
g-1O
e-1)
Temperature (K)
13 Hz 133 Hz 1.3 kHz 10 kHz
χ (e
mu
g-1O
e-1)
Temperature (K)
13 Hz
Figure 1. Temperature dependence of the ac magnetic susceptibility measured along the
1 1 0[ ] direction on cooling, showing an AFM anomaly near 3 K. The line is the result of the
Curie-Weiss fit. The inset shows the low temperature data taken at various frequencies on
heating.
0.0
0.2
0.4
0.6
0.8
1.0
300 K
(b)
Ref
lect
ivity
10 K 50 K 100 K 150 K 200 K 300 K
10 K
_E || [110]
100 200 300 400 500 6000.0
0.2
0.4
0.6
0.8
Wavenumber (cm-1)
Ref
lect
ivity
TbScO3
E || [001]
(a)
Figure 2. IR reflectivity spectra of a TbScO3 single crystal for polarizations (a) E || 1 1 0[ ] and
(b) E || [001] taken at selected temperatures.
12
0 50 100 150 2000.1
1
10
100
300 K 250 K 200 K 150 K 100 K 50 K 10 K
ε"c
Wavenumber (cm-1)
(d)
10 K 300K
-75
-50
-25
0
25
50
75
ε'c
(c)
TbScO3
E || [001]
0 20 40 60 80 100 1200.01
0.1
1
10300 K10 K
Wavenumber (cm-1)
ε"ab 10 K 50 K 100 K 150 K 200 K 300 K
(b)
5
10
15
20
25
30
35
TbScO3
ε'ab
(a)10 K 300 K_
E || [110]
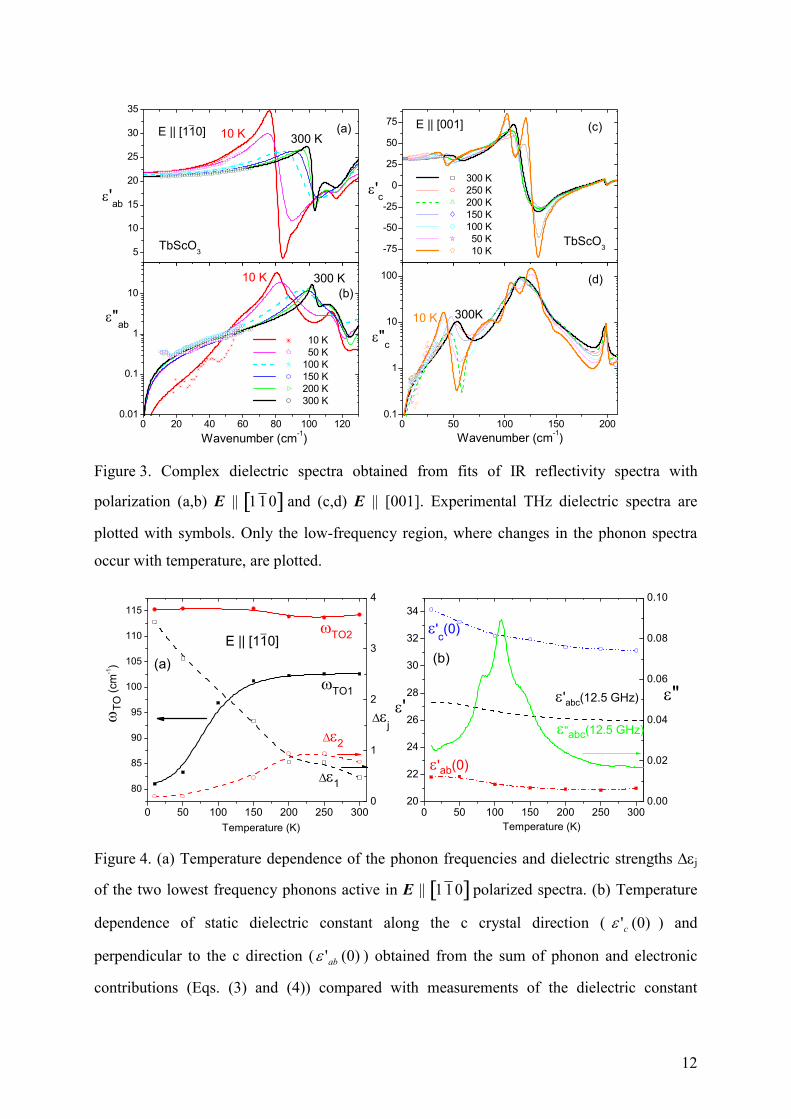
Figure 3. Complex dielectric spectra obtained from fits of IR reflectivity spectra with
polarization (a,b) E || 1 1 0[ ] and (c,d) E || [001]. Experimental THz dielectric spectra are
plotted with symbols. Only the low-frequency region, where changes in the phonon spectra
occur with temperature, are plotted.
0 50 100 150 200 250 30020
22
24
26
28
30
32
34
0.00
0.02
0.04
0.06
0.08
0.10
0 50 100 150 200 250 300
80
85
90
95
100
105
110
115
0
1
2
3
4
ε''abc(12.5 GHz)
ε'abc(12.5 GHz)
ε'c(0)
ε'ab(0)
ε'
Temperature (K)
ε"
(b)
ωTO
(cm
-1)
Temperature (K)
ωTO1
ωTO2_E || [110]
∆εj
∆ε1
∆ε2
(a)
Figure 4. (a) Temperature dependence of the phonon frequencies and dielectric strengths ∆εj
of the two lowest frequency phonons active in E || 1 1 0[ ] polarized spectra. (b) Temperature
dependence of static dielectric constant along the c crystal direction ( )0('cε ) and
perpendicular to the c direction ( )0('abε ) obtained from the sum of phonon and electronic
contributions (Eqs. (3) and (4)) compared with measurements of the dielectric constant

13
measured in the 1 1 0( ) crystal plane ( abc'ε ) at 12.5 GHz. Microwave dielectric loss abc''ε is
also shown on the scale on the right axis. The lines connecting points are guides for the eye.
0 50 100 150 200 250 30040
50
60
70
80
90
100
110
120
ωTO4
ωTO3
ωTO2
ωTO
(cm
-1)
Temperature (K)
E || [001]
ωTO1
Figure 5. Temperature dependence of the phonon frequencies seen in low-frequency polarized
IR spectra with E || [001]. The lines connecting the points are guides for the eye.
1 M.D. Biegalski, J.H. Haeni, S. Trolier-McKinstry, D.G. Schlom, C.D. Brandle, and A.J. Ven Graitis, Thermal Expansion of the New Perovskite Substrates DyScO3 and GdScO3, J. Mater. Res. 20 (2005), pp. 952-958. 2 R. Uecker, H. Wilke, D.G. Schlom, B. Velickov, P. Reiche, A. Polity, M. Bernhagen, and M. Rossberg, Spiral Formation during Czochralski Growth of Rare-Earth Scandates, J. Cryst. Growth 295 (2006), pp. 84-91. 3 B. Veličkov, V. Kahlenberg, R. Bertram, and M. Bernhagen, Crystal Chemistry of GdScO3, DyScO3, SmScO3, and NdScO3, Z. Kristallogr. 222 (2007), pp. 466-73. 4 R. Uecker, B. Velickov, D. Klimm, R. Bertram, M. Bernhagen, M. Rabe, M. Albrecht, R. Fornari, and D.G. Schlom, Properties of Rare-Earth Scandate Single Crystals (Re = Nd—Dy), J. Cryst. Growth 310 (2008), pp. 2649-2658. 5 V. Kahlenberg, D. Maier, and B. Velickov, Redetermination of EuScO3, Acta Cryst. E 65 (2009), i8. 6 X. Ke, C. Adamo, D.G. Schlom, M. Bernhagen, R. Uecker, and P. Schiffer, Low Temperature Magnetism in the Perovskite Substrate DyScO3, Appl. Phys. Lett. 94 (2009), p. 152503. 7 H.M. Christen, G.E. Jellison, I. Ohkubo, S. Huang, M.E. Reeves, E. Cicerrella, J.L. Freeouf, Y. Jia, and D.G. Schlom, Dielectric and optical properties of epitaxial rare-earth scandate films and their crystallization behavior, Appl. Phys. Lett. 88 (2006), p. 262906. 8 S. Coh, T. Heeg, J.H. Haeni, M.D. Biegalski, J. Lettieri, L.F. Edge, K.E. O’Brien, M. Bernhagen, P. Reiche, R. Uecker, S. Trolier-McKinstry, D.G. Schlom, and D. Vanderbilt, Si-Compatible Candidates for High-k Dielectrics with the Pbnm Perovskite Structure, Phys.

14
Rev. B 82 (2010), p. 064101. Supplementary information about calculated phonons are at http://prb.aps.org/epaps/PRB/v82/i6/e064101/supp.pdf 9 D.G. Schlom and J.H. Haeni, A Thermodynamic Approach to Selecting Alternative Gate Dielectrics, MRS Bulletin 27 (2002), pp. 198-204. 10 D.G. Schlom, S. Guha, and S. Datta, Gate Oxides Beyond SiO2, MRS Bulletin 33 (2008), pp. 1017-1025. 11 D.A. Pawlak, K. Kolodziejak, S. Turczynksi, J. Kisielewski, K. Rozniatowski, R. Diduszko, M. Kaczkan, M. Malinowski, Self-organize, rodlike, micrometer-scale microstruture of Tb3Sc2Al3O12-TbScO3:Pr eutectic, Chem. Mater. 18 (2006), pp. 2450-2457. 12 J. Schubert, O. Trithaveesak, A. Petraru, C.L. Jia, R. Uecker, P. Reiche, and D.G. Schlom, Structural and Optical Properties of Epitaxial BaTiO3 Thin Films Grown on GdScO3(110), Appl. Phys. Lett. 82 (2003), pp. 3460-3462. 13 D.G. Schlom, L.-Q. Chen, C.B. Eom, K.M. Rabe, S.K. Streiffer, and J.-M. Triscone, Strain tuning of ferroelectric thin films, Annu. Rev. Mater. Res. 37 (2007), pp. 589-626. 14 J.H. Haeni, P. Irvin, W. Chang, R. Uecker, P. Reiche, Y.L. Li, S. Choudhury, W. Tian, M.E. Hawley, B. Craigo, A.K. Tagantsev, X.Q. Pan, S.K. Streiffer, L.Q. Chen, S.W. KircVhoefer, J. Levy, and D.G. Schlom, Room-temperature ferroelectricity in strained SrTiO3, Nature (London) 430 (2004), pp. 758-761. 15 J.H. Lee, L. Fang, E. Vlahos, X. Ke, Y.W. Jung, L. Fitting Kourkoutis, J.W. Kim, P.J. Ryan, T. Heeg, M. Roeckerath, V. Goian, M. Bernhagen, R. Uecker, P.C. Hammel, K.M. Rabe, S. Kamba, J. Schubert, J.W. Freeland, D.A. Muller, C.J. Fennie, P.E. Schiffer, V. Gopalan, E. Johnston-Halperin, and D.G. Schlom, A strong ferroelectric ferromagnet creasted by means of spin-lattice coupling, Nature (London) 466 (2010), pp. 954-959; 476 (2011), p. 114. Details about IR studies can be found in electronic supplement [http://www.nature.com/nature/journal/v466/n7309/extref/nature 09331-s1.pdf]. 16 K.J. Choi, M. Biegalski, Y.L. Li, A. Sharan, J. Schubert, et al. Enhancement of ferroelectricity in strained BaTiO3 thin films. Science 306 (2004), pp. 1005-1009. 17 M.-W. Chu, I. Szafraniak, R. Scholz, C. Harnagea, D. Hesse, M. Alexe, and U. Gösele, Impact of misfit dislocations on the polarization instability of epitaxial nanostructured ferroelectric perovskites, Nature Mater. 3 (2004) pp. 87-90. 18 S. P. Alpay, I. B. Misirlioglu, V. Nagarajan, and R. Ramesh, Can interface dislocations degrade ferroelectric properties?, Appl. Phys. Lett. 85 (2004) 2044-2046. 19 V. Nagarajan, C. L. Jia, H. Kohlstedt, R. Waser, I. B. Misirlioglu, S. P. Alpay, and R. Ramesh, Misfit dislocations in nanoscale ferroelectric heterostructures, Appl. Phys. Lett. 86 (2005) p. 192910. 20 D. Nuzhnyy, J. Petzelt, S. Kamba, P. Kužel, C. Kadlec, V. Bovtun, M. Kempa, J. Schubert, C.M. Brooks, and D.G. Schlom, Soft mode behavior in SrTiO3/DyScO3 thin films: Evidence of ferroelectric and antiferrodistortive phase transitions, Appl. Phys. Lett. 95 (2009), p. 232902. 21 C. Kadlec, V. Skoromets, F. Kadlec, H. Němec, J. Hlinka, J. Schubert, G. Panaitov, and P. Kužel, Temperature and electric field tuning of the ferroelectric soft mode in a strained SrTiO3/DyScO3 heterostructure, Phys. Rev. B 80 (2009), p. 174116 . 22 V. Skoromets, C. Kadlec, P. Kužel, S. Kamba, and J. Schubert, Electric field tuning of hard polar phonons in strained SrTiO3 films, J. Appl. Phys. 107 (2010), p. 124116. 23 P. Delugas, V. Fiorentini, A. Filippetti, and G. Pourtois, Cation charge anomalies and high-K dielectric behavior in DyScO3: Ab initio density-functional and self-interaction-corrected calculations, Phys. Rev. B 75 (2007), p. 115126. 24 L. Baldassarre, A Perucchi, S Lupi, and P Dore, Far infrared properties of the rare-earth scandate DyScO3, J. Phys.: Condens. Matter 22 (2010), p. 355402.
15
25 O. Chaix-Pluchery and J Kreisel, Raman scattering of perovskite DyScO3 and GdScO3 single crystals, J. Phys.: Condens. Matter 21 (2009), p. 175901. 26 Z. Mrázková, D. Hrabovský, K. Postava, J. Pištora, S. Turczynski, K. Kolodziejak, and D.A. Pawlak, Far-infrared spectroscopy of terbium-scandium-aluminium garnet and terbium-scandium perovskite, Proc. SPIE 7746 (2010), p. 774617. 27 B. Veličkov, V. Kahlenberg, R. Bertram, and R. Uecker, Redetermination of terbium scandate, revealing a defect-type perovskite derivative, Acta Crystallogr. Sect. E 64 (2008), p. i79. 28 V. Bovtun, V. Pashkov, M. Kempa, S. Kamba, A. Eremenko, V. Molchanov, Y. Poplavko, Y. Yakimenko, J.H. Lee, D.G. Schlom, An electrode-free method of characterizing the microwave dielectric properties of high-permittivity thin films, J. Appl. Phys. 109 (2011), p. 024106. 29 X. Ke, C. Adamo, D.G. Schlom, M. Bernhagen, R. Uecker, and P. Schiffer, Low temperature magnetism in the perovskite substrate DyScO3, Appl. Phys. Lett. 94 (2009), p. 152503. 30 S. Kamba, V. Goian (unpublished).