pointsbet holdings limited a.b.n. 68 621 179 351 … › asxpdf › 20190829 › pdf ›...
TRANSCRIPT

PointsBet Holdings Limited A.B.N. 68 621 179 351
Appendix 4E – Final Report for the Year Ended 30 June 2019
Results for Announcement to the Market Results in accordance with Australian Accounting Standards
2019 2018 $ $ Revenue from ordinary activities 25,615,267 9,381,959 up 173% Net loss attributable to members (41,885,150) (6,657,582) up 529%
2019 Normalised Result (1) 2019 Statutory Result
$m % Movement $m %
Movement
Revenue from ordinary activities 25,615,267 173% 25,615,267 173% (Loss) before interest, tax, depreciation and amortisation
(32,650,439) 433% (37,168,797) 488%
Net loss attributable to members (34,352,812) 432% (41,885,150) 529% (1) Normalised results have been adjusted to exclude the impact of significant non-recurring items and adjustments. The Group believes that the normalised results are the best measure of viewing the performance of the business. Normalised results are a non-IFRS measure. See Review of Operations section of Annual Report for details.
Dividends Paid and Proposed
Amount per Security
Franked Amount per Security at 30% of Tax
Ordinary Shares 2019 Interim (2018: NIL) NIL NIL 2019 Final (2018: NIL) NIL NIL Dividend Reinvestment Plan There was no dividend reinvestment plan in operation during the financial year.
For
per
sona
l use
onl
y

2019 2018 Net tangible assets per share ($) 0.54 0.05 Weighted average number of ordinary shares 58,126,456 42,796,285 Basic and Diluted (Loss) Per Share (cents) (72.1) (15.6) Options have been excluded from the above calculations in the current and previous year as their inclusion will be anti-dilutive. On 16 May 2019, the company undertook a capital reconstruction by which each Share was split into 125.758 Shares. This resulted in the issued capital of the company increasing from 576,502 to 72,500,000 Shares. The 2018 comparatives have been presented on a post-share split basis.
Control Gained or Lost Over Entities in the Year - Not Applicable
Details of Associates and Joint Venture Entities – Not Applicable
Basis of Preparation
This report has been based on the consolidated financial statements which have been audited by RSM. The audit report is included within the Group’s Financial Report which accompanies this Appendix 4E.
Commentary on the Results for the Year
Refer to the commentary on the results for the year contained in the Review of Operations included within the Director's Report.
The Consolidated Statement of Profit or Loss and Comprehensive Income, Consolidated Statement of Financial Position, Consolidated Statement of Cash Flows, and Consolidated Statement of Changes in Equity are included within the 2019 Annual Financial Report.
Attachments:
The 2019 Annual Report, incorporating the Annual Financial Report for PointsBet Holdings Limited for the year ended 30 June 2019 has been attached.
For
per
sona
l use
onl
y

PointsBet Holdings Limited (ACN 621 179 351)
ANNUAL REPORT
2019
For
per
sona
l use
onl
y

1C O M P A N Y P R O F I L E A N D K E Y D A T E S
3O P E R A T I O N A L H I G H L I G H T S
4C H A I R M A N ’ S L E T T E R
6C E O ’ S R E P O R T
1 0B O A R D O F D I R E C T O R S
1 2D I R E C T O R S ’ R E P O R T
1 7A U D I T O R ’ S I N D E P E N D E N C E D E C L A R A T I O N
1 8R E M U N E R A T I O N R E P O R T
3 2R E V I E W O F O P E R A T I O N S
4 2C O R P O R A T E G O V E R N A N C E S T A T E M E N T
5 2F I N A N C I A L R E P O R T
5 7N O T E S T O T H E F I N A N C I A L S T A T E M E N T S
1 0 3D I R E C T O R S ’ D E C L A R A T I O N
1 0 4I N D E P E N D E N T A U D I T O R ’ S R E P O R T
1 0 9S H A R E H O L D E R I N F O R M A T I O N
I B CC O R P O R A T E D I R E C T O R Y
EVERY POINT MATTERS
P O I N T S B E T A N N U A L R E P O R T
For
per
sona
l use
onl
y

COMPANY PROFILE PointsBet is a licensed corporate bookmaker with operations in Australia and the United States. PointsBet has developed a scalable cloud-based wagering Platform through which it offers its clients innovative sports and racing wagering products. PointsBet’s product offering includes Fixed Odds Sports, Fixed Odds Racing and PointsBetting. PointsBet aims to provide more markets on the major sports than any other bookmaker. For further information visit the Group’s investors website at https://investors.pointsbet.com.au/.
KEY DATES*
2019
Annual General Meeting 24 October 2019
2020
Interim Results Announcement 26 February 2020 (6 months ending 31 December 2019)
Full Year Results Announcement 26 August 2020 (12 months ending 30 June 2020)
* Dates subject to change
2019 ANNUAL REPORT This 2019 PointsBet Holdings Limited Annual Report for the financial year ended 30 June 2019 complies with reporting requirements and contains statutory financial statements. This document is not a concise report prepared under section 314(2) of the Corporations Act. The PointsBet Group has not prepared a concise report for the 2019 financial year.
P O I N T S B E T A N N U A L R E P O R T / 1
For
per
sona
l use
onl
y

2 / P O I N T S B E T A N N U A L R E P O R T
For
per
sona
l use
onl
y
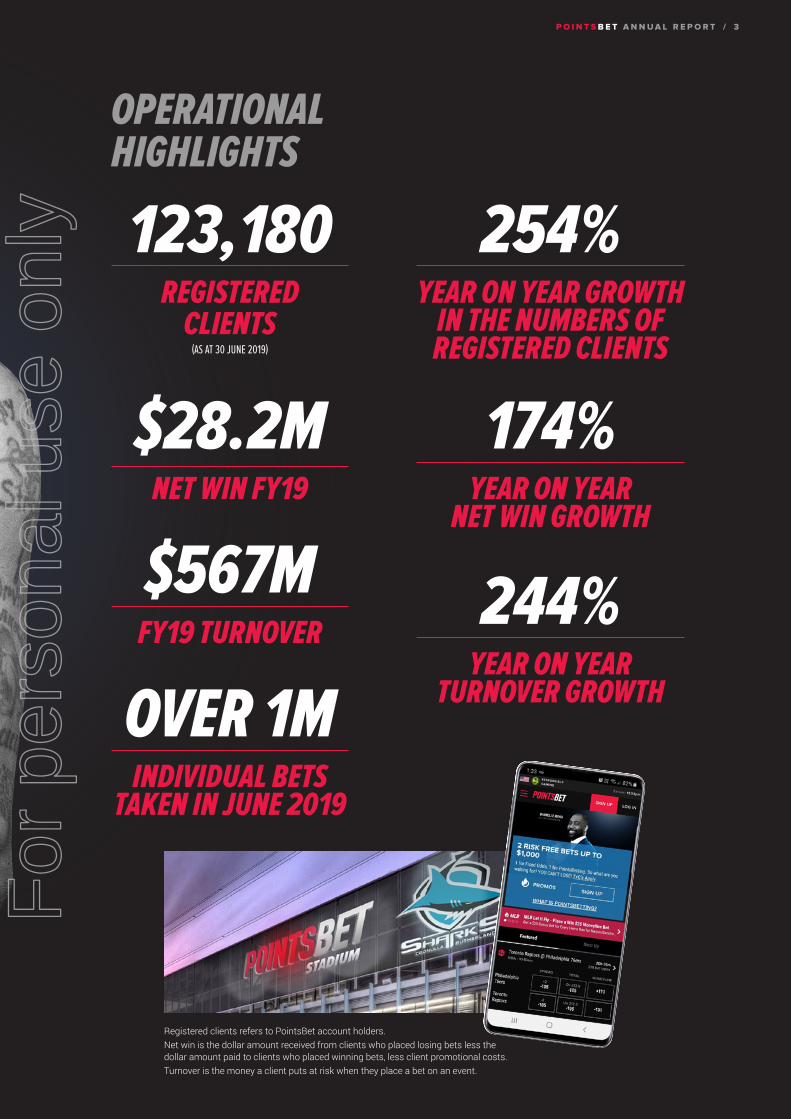
123,180REGISTERED
CLIENTS(AS AT 30 JUNE 2019)
174%YEAR ON YEAR
NET WIN GROWTH
254%YEAR ON YEAR GROWTH
IN THE NUMBERS OF REGISTERED CLIENTS
$567MFY19 TURNOVER
OVER 1MINDIVIDUAL BETS
TAKEN IN JUNE 2019
$28.2MNET WIN FY19
OPERATIONAL HIGHLIGHTS
244%YEAR ON YEAR
TURNOVER GROWTH
Registered clients refers to PointsBet account holders.Net win is the dollar amount received from clients who placed losing bets less the dollar amount paid to clients who placed winning bets, less client promotional costs.Turnover is the money a client puts at risk when they place a bet on an event.
P O I N T S B E T A N N U A L R E P O R T / 3
For
per
sona
l use
onl
y

Dear Shareholders,
It is my privilege to write to you on behalf of the Board in our first Annual Report since listing on the Australian Securities Exchange (ASX) in June 2019.
PointsBet is a corporate bookmaker, offering innovative sports and racing betting products and services direct to clients via its scalable cloud-based technology platform. Our listing on the ASX provided PointsBet with a strong balance sheet to support the Company’s global growth strategy and deliver on the potential outlined in our Prospectus.
WELL-POSITIONED FOR GROWTH IN FY20There is a significant market opportunity in the United States, as a result of the Professional and Amateur Sport Protection Act being overturned by the US Supreme Court in May 2018, and PointsBet has already taken significant steps towards capitalising on this opportunity.
In addition to the previously announced market access arrangements in New Jersey, New York, Illinois, Colorado and Iowa, on 1 August 2019, PointsBet announced it had partnered with Penn National Gaming, enabling the Company to operate PointsBet branded online sportsbook and gaming operations in the states of Ohio, Indiana, Missouri, West Virginia and Louisiana, subject to enabling legislation (as relevant) and licensure in each of those States.
Shareholders should be encouraged that Penn National Gaming sought to take an equity stake in the form of shares and a potential future equity stake in options in the Company as part of the transaction. Upon exercise of the options, should that occur, not only will the Company’s cash reserves be strengthened but both organisations will be further aligned to achieving growth and success in the critical United States market.
Over the Reporting Period, the Company saw a 254% increase in registered clients (123,180 at 30 June 2019) and took over 1 million individual bets in each of April, May and June 2019. These statistics validate our marketing and client acquisition strategy and highlight the robust and scalable nature of our proprietary platform.
4 / P O I N T S B E T A N N U A L R E P O R T
CHAIRMAN’S LETTER
“LISTING HAS PROVIDED POINTSBET WITH A STRONG BALANCE SHEET TO SUPPORT OUR GLOBAL GROWTH STRATEGY”
For
per
sona
l use
onl
y

A GREAT TEAM Our CEO and Co-founder, Sam Swanell, has done a tremendous job in leading the business through a period of substantial change over the past 12 months. In addition, our highly talented employees across our global footprint are a key asset, and the results we have been able to achieve are testament to their dedication, commitment and passion.
On behalf of the Board, I would like to thank all of our team for delivering on the opportunities we saw over FY19 and positioning the business for continued growth in FY20 and beyond.
I would also like to thank my fellow Directors for their support over a very busy past 12 months as we listed on the ASX and continued to grow and execute opportunities overseas.
Lastly, I would like to thank you, our shareholders, for your support and vote of confidence in the business and its team. We look forward to delivering on the opportunities we see for the business moving forward and growing shareholder value.
Yours sincerely,
BRETT PATON Chairman
P O I N T S B E T A N N U A L R E P O R T / 5
For
per
sona
l use
onl
y

The FY2019 financial year represented a transformative period for PointsBet Holdings Limited (PointsBet or the Company).
It started in July 2018 with the signing of the Company’s first market access agreements in the United States (US). The Company initially signed an agreement with New Meadowlands Racetrack, LLC for market access in New Jersey and then signed an option agreement with American Racing & Entertainment LLC, owner of the Tioga Downs Casino, for market access in New York, subject to the passing of enabling legislation and licensure in the State of New York. At the time, the Company did not have an office or any staff based in the US.
Sports betting had been legalised in New Jersey just one month earlier and our fantastic team immediately began working towards launching PointsBet’s online/mobile service. The Company set-up an office in Jersey City, transferred an initial round of key people from Australia and recruited market leading local talent. Within five months PointsBet had obtained its New Jersey Department of Gaming Enforcement (NJDGE) license which included verification of the Company’s scalable in-house technology platform.
The technology agility and operational focus that allowed PointsBet to launch so swiftly and effectively in New Jersey will be a significant competitive advantage as the Company launches in numerous States in FY2020 and beyond.
The Australian sports betting market is very advanced and PointsBet has taken the experience and expertise gained in the Australian market and combined it with the Company’s proven in-house technology and outstanding US team members to make an immediate impact in New Jersey. In June 2019 PointsBet represented 5.4% of New Jersey online sports betting turnover.
PointsBet is on the starting line of the nascent US sports betting opportunity. It is estimated that if all 50 States legalise online sports betting, the market revenue opportunity will be US$17.3 billion per annum. Pending favourable legislation, PointsBet already has market access agreements for ten US States with a combined population of approximately 81 million, with those States representing an estimated sports betting revenue market of US$4.6 billion per annum.1
The Australian business was the driving force behind a 174% year on year increase in Net Win to A$28.2 million in FY2019. It remains a vitally important part of our global business from both a revenue perspective and importantly, the Company’s one team global strategy.
5.4%JUNE 2019
ONLINE TURNOVER MARKET SHARE
NEW JERSEY
1. Source: Eilers & Krejcik Legal Sports Betting: Defining the US Opportunity, April 2019
6 / P O I N T S B E T A N N U A L R E P O R T
CEO’S REPORT
For
per
sona
l use
onl
y

I am very fortunate to lead an incredible Executive team that is backed by market leading talent in multiple locations, across all areas of the business. The team is laser focused on the clear opportunity ahead and is structured in such a way to deliver maximum economies of scale as we enter new markets. Through our in-house technology platform and one team global structure, PointsBet will benefit from operating margins that deliver a competitive advantage for the long term.
PointsBet has built an outstanding Board led by Chairman Brett Paton. The Non-Executive Directors are engaged in the Company’s exciting journey and help facilitate PointsBet’s high-performance culture. I thank them for their continued support and guidance.
I extend my thanks to you our shareholders and look forward to continuing the Company’s track record of delivering shareholder value as we capitalise on the clear opportunities ahead.
Thank you for your interest, and support.
SAM SWANELL Group Chief Executive Officer
FY2019 NORMALISED RESULT2
$M2019$000
2018$000
VARIANCE VS 2018%
Revenue 25,615 9,382 173
EBITDA loss (32,650) (6,128) 433
Loss for the year (34,353) (6,459) 432
Basic and diluted earnings per share (cents) (59.1) (15.1) 291
2. Normalised results excludes the impact of certain significant items and adjustments. Significant items and adjustments are items which are either individually or in aggregate, material to PointsBet and are either outside the ordinary course of business or part of the ordinary activities of the business but unusual due to their size and nature as detailed under the heading ‘Significant Items & Adjustments’ in the Review of Operations.
FY2019 REPORTED RESULT
$M2019$000
2018$000
VARIANCE VS 2018%
Revenue 25,615 9,382 173
EBITDA loss (37,169) (6,326) 488
Loss for the year (41,885) (6,658) 529
Basic and diluted earnings per share (cents) (72.1) (15.6) 362
“POINTSBET ACCEPTED MORE THAN 1 MILLION INDIVIDUAL BETS IN EACH OF APRIL, MAY AND JUNE 2019”
P O I N T S B E T A N N U A L R E P O R T / 7
For
per
sona
l use
onl
y
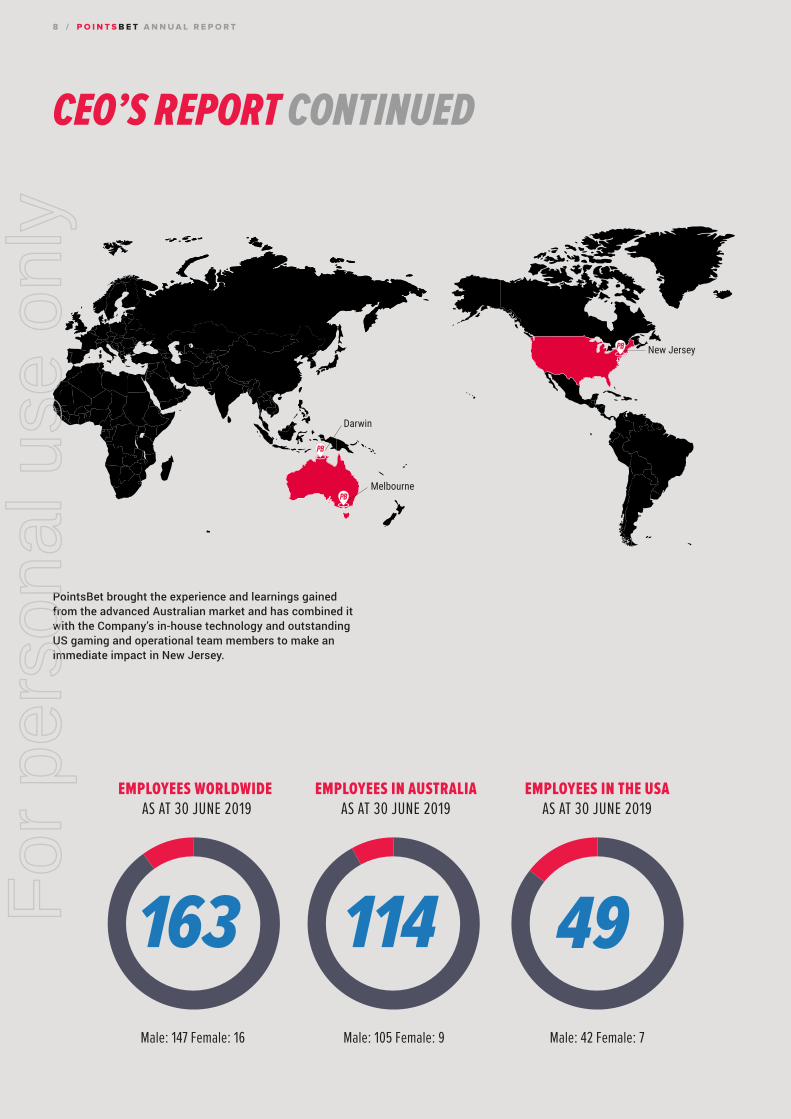
Darwin
Melbourne
New Jersey
EMPLOYEES WORLDWIDE AS AT 30 JUNE 2019
EMPLOYEES IN AUSTRALIA AS AT 30 JUNE 2019
EMPLOYEES IN THE USA AS AT 30 JUNE 2019
Male: 147 Female: 16 Male: 105 Female: 9 Male: 42 Female: 7
49114163
PointsBet brought the experience and learnings gained from the advanced Australian market and has combined it with the Company’s in-house technology and outstanding US gaming and operational team members to make an immediate impact in New Jersey.
8 / P O I N T S B E T A N N U A L R E P O R T
CEO’S REPORT CONTINUED
For
per
sona
l use
onl
y

Darwin
Melbourne
NY
NJOH
INIL
CO
IA
LA
WVMO
Legal and operational
New JerseyIowa
Legal pending licensure
IllinoisWest ViginiaIndiana
Pending legislation
ColoradoNew YorkOhioMissouriLouisiana
POINTSBET US MARKET ACCESS ROADMAPas at 28 August 2019
Enter new markets and commercial partnerships
Expand into new growth markets, particularly in North America.
Consider potential opportunities that complement the Company’s current business operations.
Enter into commercial partnerships.
Platform investment
The in-house development of PointBet’s scalable, cloud-based technology Platform, which:—— drives innovation
and automation;—— ensures speed and
security;—— promotes credibility
with clients;—— gives PointBet the
ability to scale across multiple jurisdictions; and—— enables the
Company’s data-driven focus to trading and risk management.
Product innovation
Ongoing commitment to product development.A focus on US sports.
Marketing and branding
Excellence in achieving a return on investment on its marketing spend.
Integrated multi-channel marketing strategy and in-depth analyses of category target audience.
Industry leading talent
Attracting, retaining and developing industry-leading talent.
P O I N T S B E T A N N U A L R E P O R T / 9
For
per
sona
l use
onl
y

BOARD OF DIRECTORS
BWF PATONNon-Executive Chairman (appointed Director in November, 2018)
B Ec Monash University, Chartered Accountant Member of the Remuneration and Nomination CommitteeMember of the Audit, Risk and Compliance Committee
Mr Paton entered the finance industry in 1980 as a Chartered Accountant and after 23 years at UBS, retired from his role in 2008 as Vice Chairman, having run the UBS Equity Capital Markets business for 14 years.
Following this he was Vice Chairman of the Institutional Clients Group for Australia and New Zealand at Citigroup Inc for five years.
Over his years at UBS and Citigroup, Brett’s respective teams assisted and advised companies, governments and government agencies on capital raisings totalling approximately $230 billion of equity.
Having served as a Non-Executive Director of Tabcorp and Chair of Audit and Risk for its demerged entity, Echo Entertainment, he has gained significant experience and valuable insights into the functions expected of ASX boards and companies in the Wagering Industry. Mr Paton has also served as a Council member of RMIT University where he chaired the Risk and Audit Committee and was also a foundation member of the ASX Capital Markets Advisory Panel.
SJ SWANELLCo-Founder, Managing Director and Group Chief Executive Officer (appointed Director in March, 2015)
B Com Monash University
Mr Swanell has substantial expertise and experience in the Wagering Industry including successfully managing the start-up of both tomwaterhouse.com and PointsBet.
For three years he was National Sales Manager with TOTE Tasmania responsible for all revenue channels including all retail and pub outlets. During his tenure, turnover and EBITDA increased 200%. This was followed by four years as Chief Operations Officer at tomwaterhouse.com , which involved responsibility for establishing and managing all functions of the business. tomwaterhouse.com grew rapidly to become a pre-eminent wagering brand in Australia until its sale to William Hill. Mr Swanell’s experience also includes international consulting assignments across North America and Europe and related verticals such as online casino and poker.
Mr Swanell has a deep understanding of the critical areas required to produce and manage a successful Sportsbook, which has been instrumental in the establishment and growth of PointsBet.
1 0 / P O I N T S B E T A N N U A L R E P O R T
For
per
sona
l use
onl
y

NJ FAHEYCo-Founder, Executive Director and Group Chief Commercial Officer (appointed Director in March, 2015)
B Bus University of Technology Sydney, Chartered Accountant
Mr Fahey has over 14 years’ experience in the accounting and finance sectors. Prior to co-founding PointsBet in 2015, he was a Consultant at PwC, a Financial Analyst at the Sydney Opera House and a Project Finance Analyst at Westfield. Whilst at Westfield, Mr Fahey provided financial feasibility studies for shopping centre developments, experience which has provided him with valuable insight into complex financial transactions and valuation methods.
Prior to his appointment as Chief Commercial Officer in July 2019, Mr Fahey was PointsBet’s Chief Financial Officer.
This varied financial experience and exposure has enabled Mr Fahey to structure the business and manage the ongoing financial stewardship of PointsBet to enable the Company to achieve its growth targets.
Mr Fahey has also volunteered with the Victorian Youth Referral and Independent Person Program (YRIPP) assisting young people to attend interviews at Police Stations without a guardian. The role provides an important opportunity to support young people at a critical time and help divert those at risk from further offending.
AP SYMONSNon-Executive Director (appointed Director in September, 2016)
B Com B Law University of Melbourne, Lawyer Chair of the Remuneration and Nomination CommitteeMember of the Audit, Risk and Compliance Committee
Mr Symons has over 20 years’ experience in corporate law and mergers and acquisitions, including four years with a global firm in Hong Kong.
Mr Symons is the Founder and Managing Director of Clarendon Lawyers, a corporate legal advisory firm specialising in mergers and acquisitions and equity capital markets. His extensive experience spans a wide range of corporate transactions involving large foreign listed companies, private equity funds, Australian listed companies, large private companies and family offices across a range of industries. He regularly advises on and coordinates complex transactions, often across multiple jurisdictions, and is consistently recognised in peer review based industry publications as a leading M&A lawyer in Australia.
PD MCCLUSKEYIndependent Non-Executive Director (appointed to the Board in November, 2017)
B Bus Swinburne University, Chartered AccountantChair of the Audit, Risk and Compliance CommitteeMember of the Remuneration and Nomination Committee
Mr McCluskey has been an insolvency and corporate reconstruction professional for 33 years. He has strong relationships within the Australian and international finance sectors. He has managed the conflicting agendas of diverse parties in large banking syndicates in some of the biggest restructuring assignments in Australia. He is currently a Special Advisor, Restructuring services at KPMG.
He was Managing Partner at Ferrier Hodgson’s Melbourne office for 12 years. During his tenure at Ferrier Hodgson, Mr McCluskey had exposure to a broad range of industries due to his engagement and oversight of several corporate restructuring and insolvency projects and is recognised for his ability to manage and resolve complex matters.
P O I N T S B E T A N N U A L R E P O R T / 1 1
For
per
sona
l use
onl
y
The Directors present their report together with the financial statements of the Company and its subsidiaries (the Group) for the 12 months ended 30 June 2019 (the financial year). The information in this report is current as at 28 August 2019 unless otherwise specified.
This Directors’ Report has been prepared in accordance with the requirements of Division 1 of Part 2M.3 of the Corporations Act 2001 (Cth) (the Act).
REVIEW AND RESULTS OF OPERATIONS A review of the operations of the Group for the financial year is set out in the Review of Operations which forms part of this Directors’ Report.
FINANCIAL RESULTS The reported result of the Group attributable to shareholders for the 12 months ended 30 June 2019 was a loss of $41,885,150 after providing for income tax (2018: loss of $6,657,582 after providing for income tax). Further details regarding the financial results of the Group are set out in the Review of Operations and Financial Statements.
DIVIDENDS No dividends have been declared during the financial year (2018: $Nil).
Given the stage of development of the Company, the Directors have no current intention to declare and pay a dividend.
In determining whether to declare future dividends, the Directors will have regard to the Group’s earnings, overall financial condition, capital requirements and the level of franking credits available.
REMUNERATION REPORT Details of the remuneration policies in respect of the Group’s Key Management Personnel are detailed in the Remuneration Report which forms part of this Directors’ Report.
ROUNDINGAny discrepancies between totals and sums of components in tables and figures contained in this Annual Report are due to rounding. Tables and figures contained in this Annual Report have not been amended by the Company to correct immaterial summation differences that may arise from this rounding convention.
DIRECTORS’ REPORT F O R T H E 1 2 M O N T H S E N D E D 3 0 J U N E 2 0 1 9
1 2 / P O I N T S B E T A N N U A L R E P O R T
For
per
sona
l use
onl
y

DIRECTORS’ PARTICULARS, EXPERIENCE AND SPECIAL RESPONSIBILITIES The Directors of the Company throughout the financial year and up to the date of this report are:
CURRENT DIRECTORS
DIRECTOR EXPERIENCE AND OTHER DIRECTORSHIPS SPECIAL RESPONSIBILITIES
BWF Patton B EcChartered Accountant
Appointed Director in November, 2018
�—Chair, management company of Escala Partners�—Chair, PLC Asset Management�—Former Vice Chairman, UBS Equity Capital Markets �—Former Vice Chairman, Institutional Clients Group ANZ,
Citigroup�—Former Director Tabcorp Holdings Limited
Non-Executive Chairman Member of each Board Committee
SJ Swanell B Com
Appointed Director in March, 2015
�—Former National Sales Manager, TOTE Tasmania�—Former Chief Operations Officer, tomwaterhouse.com
Co-Founder, Managing Director and Group Chief Executive Officer
AP SymonsB Com B Law
Appointed Director in September, 2016
�—Founder and Managing Director, Clarendon Lawyers�—Director, Connected Communities Melbourne,
Chair, Remuneration and Nomination Committee
Member, Audit, Risk and Compliance Committee
PD McCluskey B Bus Chartered Accountant
Appointed Director in November, 2017
�—Special Adviser, Restructuring Services, KPMG�—Former Managing Partner, Ferrier Hodgson Melbourne
Chair, Audit, Risk and Compliance Committee
Member, Remuneration and Nomination Committee
NJ Fahey B Bus Chartered Accountant
Appointed Director in March, 2015
�—Former Chief Financial Officer, PointsBet�—Former Project Finance Analyst, Westfield�—Former Financial Analyst, Sydney Opera House�—Former Consultant, PwC
Co-Founder, Executive Director and Group Chief Commercial Officer
Details about the Director’s interests in the Company are set out in the Remuneration Report which forms part of this Directors Report.
P O I N T S B E T A N N U A L R E P O R T / 1 3
For
per
sona
l use
onl
y

DIRECTOR INDEPENDENCEThe Company’s Board Charter sets out guidelines and thresholds of materiality to assist in considering the independence of Directors and has adopted a definition of independence that is based on that set out in the ASX Recommendations.
The Board considers that Peter McCluskey is independent of management and free of any business or other relationship that could materially interfere with, or could reasonably be perceived to materially interfere with, the exercise of their unfettered and independent judgment and is able to fulfil the role of independent Director for the purposes of the ASX Recommendations.
BWF Paton, SJ Swanell, NJ Fahey and AP Symons are not currently considered by the Board to be independent Directors given:�—in the case of SJ Swanell and NJ Fahey, their executive positions and ownership interests in the Company;�—in the case of BWF Paton, his ownership interest in the Company; and�—in the case of AP Symons, his position as Managing Director and majority owner of Clarendon Lawyers, a material service provider
to the Company.
The Board considers that each Director will add significant value given their considerable skills and experience and will bring objective and independent judgement to the Board.
DIRECTORS’ ATTENDANCE AT BOARD AND COMMITTEE MEETINGS DURING THE FINANCIAL YEAR The attendance of members of the Board at Board meetings and attendance of members of committees at committee meetings of which they are voting members is set out below.
BOARD2
DIRECTOR MEETINGS ATTENDED MEETINGS HELD
BWF Paton1 14 14
SJ Swanell 18 18
AP Symons 18 18
PD McCluskey 18 18
NJ Fahey 18 18
1. BWF Paton was appointed on 19 November 2018.2. Prior to listing on the ASX on 12 June 2019, meetings of the Audit, Risk and Compliance Committee and the Remuneration and Nominations Committee were held
contemporaneously with Board meetings as required.
COMPANY SECRETARY The Company Secretary is directly accountable to the Board, through the Chairman, for all governance matters that relate to the Board’s proper functioning. During the financial year, the Group had the following Company Secretaries:
A J H E N S H E RBA/LLB AJ Hensher joined the Company in January 2019 and was appointed as Company Secretary on 30 January 2019. Before joining the Company, Mr Hensher was Head of Legal and Regulatory Affairs at William Hill Australia and prior to that the GM, Company Secretarial and Corporate Counsel at Aristocrat Leisure Limited.
N J FA H E YB Bus, Chartered AccountantMr Fahey resigned from the position of Company Secretary effective 30 January 2019.
DIRECTORS’ REPORT CONTINUED
1 4 / P O I N T S B E T A N N U A L R E P O R T
For
per
sona
l use
onl
y

PRINCIPAL ACTIVITIES The principal activities of the Group during the financial year was the offering of innovative sports and racing betting products and services direct to clients via its scalable cloud-based technology platform.
SIGNIFICANT CHANGES IN THE STATE OF AFFAIRS Significant changes in the state of affairs of the group during the financial year were as follows.
The Group raised in total $23,960,896 from the issue of convertible notes in two equal tranches on 6 August 2018 and 31 October 2018.
The Group raised $1,411,360 from the exercise of share options on 31 October 2018.
The Group closed a share offer on 8 March 2019 raising $10,395,136.
The Group closed an initial public offering on 5 June 2019 raising $75,000,000.
Except as outlined above and elsewhere in this Directors’ Report, there were no significant changes in the state of affairs of the Group during the financial year.
EVENTS AFTER BALANCE DATE Since 30 June 2019, the Company has issued 6,127,451 shares and 10,372,549 options to Penn Interactive Ventures, LLC, a wholly owned subsidiary of Penn National Gaming Inc.
Other than set out above, in the interval between the end of the financial year and the date of this report, there has not arisen any item, transaction or event of a material and unusual nature likely, in the opinion of the Directors, to affect significantly the operations of the Group, the results of those operations, or the state of affairs of the Group, in future financial reporting periods.
LIKELY DEVELOPMENTS AND EXPECTED RESULTSInformation on likely developments in the operations of the Company and the expected results of operations have not been included in this report because the Directors believe it would be likely to result in unreasonable prejudice to the Company. However, the Group believes there is significant scope to increase revenue and profitability from its business strategy over the long term.
OPTIONS OVER SHARE CAPITALAs at the date of this report there were 21,606,656 ordinary shares under option.
Option holders do not have any right, by virtue of the option, to participate in any share issue of the Group or any related body corporate.
Details of the Company’s Employee Share Option Plan are disclosed in Note 34 to the financial statements.
INDEMNITIES AND INSURANCE PREMIUMS The Company’s Constitution provides that the Company will indemnify each officer of the Company against any liability incurred by that officer in or arising out of the conduct of the business of the Company or in or arising out of the discharge of that officer’s duties to the extent permitted by law.
An officer for the purpose of this provision includes any Director or Secretary of the Company or the Company’s subsidiaries, executive officers or employees of the Company or its subsidiaries and any person appointed as a trustee by, or acting as a trustee at the request of, the Company, and includes former Directors.
In accordance with the Company’s Constitution, the Company has entered into deeds of access, indemnity and insurance with each Director and nominated officers of the Company. No amount has been paid pursuant to those indemnities during the financial year to the date of this Directors’ Report.
The Company has paid a premium in respect of a contract insuring officers of the Company and its related bodies corporate against any liability incurred by them arising out of the conduct of the business of the Company or in or arising out of the discharge of their duties. In accordance with normal commercial practices, under the terms of the insurance contracts, the details of the nature and extent of the liabilities insured against and the amount of premiums paid are confidential.
P O I N T S B E T A N N U A L R E P O R T / 1 5
For
per
sona
l use
onl
y

ENVIRONMENTAL REGULATION AND SUSTAINABILITYThe Group endeavours to operate our business in ways that produce social, economic and environmental benefits for the Communities we serve in Australia and the United States.
The Directors understand that long-term future success depends upon continuously improving our reputation and enhancing employee morale. We pay attention to the expectations of our employees and stakeholders, while respecting and serving our communities as best we can.
The Group has a small environmental footprint and as such our largest impacts come from our travel, energy and consumables. We take steps to improve our environmental impact.
There are no matters that the Directors consider need to be included in this report. The Group is not subject to the reporting requirements of either the Energy Efficiency Opportunities Act 2006 or the National Greenhouse and Energy Reporting Act 2007.
PROCEEDINGS ON BEHALF OF THE COMPANY No proceedings have been brought on behalf of the Company under section 236 of the Act nor has any application been made in respect of the Company under section 237 of the Act.
AUDITOR RSM continues in office in accordance with section 327 of the Act.
NON-AUDIT SERVICES PROVIDED BY THE AUDITOR The Company, with the prior approval of the Chair of the Audit, Risk and Compliance Committee, may decide to employ RSM, the Company’s auditor, on assignments additional to its statutory audit duties where the auditor’s expertise and experience with the Company and/ or the Group are important.
The Company has a Charter which specifies those non-audit services which cannot be performed by the Company auditor. The Charter also sets out the procedures which are required to be followed prior to the engagement of the Company’s auditor for any non-audit related service. Details of the amounts paid or payable to the Company’s auditor, for audit and non-audit services provided during the financial year, are set out in Note 26 to the Financial Statements.
The Board of Directors has considered the position and, in accordance with the advice received from the Audit, Risk and Compliance Committee, is satisfied that the provision of the non-audit services as set out in Note 26(a)(ii) to the financial statements is compatible with the general standard of independence for auditors imposed by the Act for the following reasons:�—All non-audit services have been reviewed by the Audit, Risk and Compliance Committee to ensure they do not impact the
impartiality and objectivity of the auditor. �—None of the services undermine the general principles relating to auditor independence as set out in APES 110 Code of Ethics for
Professional Accountants, including reviewing or auditing the auditor’s own work, acting in a management or a decision-making capacity for the Company, acting as advocate for the Company or jointly sharing economic risk and rewards.
A copy of the auditor’s independence declaration is set out immediately after this Director’s report.
LOANS TO DIRECTORS AND EXECUTIVES No Director or executive held any loans with the Company during the financial year.
This report is made in accordance with a resolution of the Directors and is signed for and on behalf of the Directors.
Brett PatonChairman
28 August 2019
DIRECTORS’ REPORT CONTINUED
1 6 / P O I N T S B E T A N N U A L R E P O R T
For
per
sona
l use
onl
y

AUDITOR’S INDEPENDENCE DECLARATION
THE POWER OF BEING UNDERSTOODAUDIT | TAX | CONSULTING
RSM Australia Partners is a member of the RSM network and trades as RSM. RSM is the trading name used by the members of the RSM network. Each member of the RSM network is an independent accounting and consulting firm which practices in its own right. The RSM network is not itself a separate legal entity in any jurisdiction.
RSM Australia Partners ABN 36 965 185 036
Liability limited by a scheme approved under Professional Standards Legislation
RSM Australia Partners
Level 21, 55 Collins Street Melbourne VIC 3000 PO Box 248 Collins Street West VIC 8007
T +61 (0) 3 9286 8000 F +61 (0) 3 9286 8199
www.rsm.com.au
AUDITOR’S INDEPENDENCE DECLARATION
As lead auditor for the audit of the financial report of PointsBet Holdings Limited for the year ended 30 June 2019, I declare that, to the best of my knowledge and belief, there have been no contraventions of:
(i) the auditor independence requirements of the Corporations Act 2001 in relation to the audit; and
(ii) any applicable code of professional conduct in relation to the audit.
RSM AUSTRALIA PARTNERS
B Y CHAN Partner
Dated: 28 August 2019 Melbourne, Victoria
P O I N T S B E T A N N U A L R E P O R T / 1 7
For
per
sona
l use
onl
y

This Remuneration Report for the 12 months ended 30 June 2019 (Reporting Period) forms part of the Directors’ Report and has been audited as required by section 308(3C) of the Corporations Act 2001 (Cth) (the Act).
SECTION 1: MAINTAINING SUSTAINABLE PERFORMANCE The Company’s philosophy on remuneration is that Key Management Personnel (KMP) remuneration should be aligned with shareholder interests by providing levels of fixed remuneration and “at risk” pay sufficient to attract and retain individuals with the skills and experience required to build on and execute the Company’s business strategy. It aims to achieve this by ensuring “at risk” remuneration is contingent on outcomes that grow and/or protect shareholder value and by aligning the interests of Senior Executives and shareholders by ensuring a suitable proportion of remuneration is received as a share-based payment.
To ensure that the Company continues to attract, retain and motivate talented staff at a competitive cost, the Company will aim to align total fixed remuneration to the median rate of the relevant market, with consideration given to experience, qualifications, performance and other non-financial benefits.
The Remuneration and Nomination Committee recommends to the Board the remuneration packages for the Senior Executive team. It is intended that these will be reviewed annually. The Remuneration and Nomination Committee may seek external advice to determine the appropriate level and structure of the remuneration packages.
SECTION 2: REMUNERATION REPORT OVERVIEW This Remuneration Report has been prepared in accordance with section 300A of the Corporations Act 2001 (Cth) (the Act) for PointsBet Holdings Limited and its controlled entities (Group) for the year ended 30 June 2019.
This Report covers KMP of the Group, who are responsible for determining and executing the Group’s strategy.
TABLE 1: NON-EXECUTIVE DIRECTORS AND EXECUTIVE KMP
KMP POSITION TERM AS KMP
Non-Executive Director
BWF Paton Chair; Director Appointed 19 November 2018
AP Symons Director Full financial year
PD McCluskey Director Full financial year
Executive Director
SJ Swanell CEO and Managing Director Full financial year
NJ Fahey1 Chief Financial Officer and Executive Director Full financial year
Other KMP
AJ Mellor1 Chief Strategy Officer Commenced 18 January 2019
AJ Hensher Group General Counsel and Company Secretary Commenced 14 January 2019
1. On 22 July 2019, NJ Fahey transitioned into the role of Chief Commercial Officer and AJ Mellor became Chief Financial Officer. NJ Fahey remains an Executive Director.
REMUNERATION REPORT
1 8 / P O I N T S B E T A N N U A L R E P O R T
For
per
sona
l use
onl
y

SECTION 3: SENIOR EXECUTIVE REMUNERATION PHILOSOPHY AND FRAMEWORK
3.1 CORE PRINCIPLES The following three core principles guide the Group’s Senior Executive remuneration strategy and ‘pay for performance’ framework:
1 . A L I G N M E N T TO S H A R E H O L D E R I N T E R E STS A N D VA LU E C R E AT I O N
Provide a common interest between Senior Executives and shareholders by aligning the rewards that accrue to management to PointsBet’s performance.
2 . M A R K E T C O M P E T I T I V E
Be competitive in the markets in which PointsBet operates to attract, motivate and retain high calibre people. As the Company grows its footprint in the United States, the business must increasingly attract and retain leaders in the US market with technology and global management skills sets that is increasingly requiring an evolution in PointsBet’s approach to remuneration.
3 . P E R F O R M A N C E - B A S E D
Support the short, medium and long-term financial targets and business strategies of the Group as set out in the strategic business plans endorsed by the Board.
TABLE 2: ELEMENTS OF EXECUTIVE KMP REMUNERATION
ELEMENT FIXED REMUNERATION AT RISK STI AT RISK LTI
What does this component include?
Base salary, superannuation and other benefits (such as relocation allowances).
Reward for strong individual and Group performance during the year.
Reward for longer-term Group performance during a three or four-year performance period.
What does payment depend on?
The skills, performance, experience and role of each individual. The Group has implemented moderate fixed remuneration relative to market capitalisation in favour of higher at-risk components.
Achievement of financial and non-financial key performance indicators (KPIs) and subject to a financial gateway hurdle.
Achievement of financial and non-financial performance conditions.
How is this component delivered?
Cash. Cash. Typically, options vesting in three and four-year tranches.
What is the purpose of this remuneration component?
Providing ongoing remuneration in recognition of day-to-day accountabilities.
Motivate and reward excellent performance in the shorter term.
Typically, one-off grants designed to attract executive talent into the organisation, motivate and reward excellent performance in the long term and provide a retention element whilst aligning with shareholder outcomes through the award of equity.
P O I N T S B E T A N N U A L R E P O R T / 1 9
For
per
sona
l use
onl
y

SECTION 4: SENIOR EXECUTIVE REMUNERATION IN THE REPORTING PERIOD
4.1 FIXED REMUNERATIONAll Senior Executives receive fixed remuneration which includes cash and compulsory superannuation. As appropriate, KMP receive additional support including accommodation allowances and travel. KMP do not receive retirement benefits beyond superannuation.
When determining the level of fixed remuneration for each role, the Group considers the remuneration levels offered at organisations from which it sources talent and to whom it could potentially lose talent. Typically, fixed remuneration for the Group’s KMP is lower than the average of larger ASX listed companies given the focus on variable ‘at-risk’ remuneration.
4.2 EXECUTIVE STI AWARDS GRATED DURING THE REPORTING PERIODThe table below outlines the key terms and conditions applying to Senior Executive STI arrangements for KMP during the Reporting Period.
TABLE 3: DESCRIPTION OF EXECUTIVE STI IN THE REPORTING PERIOD
Overview of STI during the Reporting Period
STI arrangements are an at-risk component of executive remuneration involving the payment of a cash award if vesting conditions are met, including satisfaction of performance conditions.
Performance Period STI awards are measured over the 12-month financial year. Any STI award payments are made after performance is tested at the end of the performance period.
Performance Conditions Payment of cash bonuses is discretionary and determined by the Board based on individual and business KPIs.
Business KPIs may consist of financial and strategic components including revenue growth, customer acquisition and retention, new market access and trading margins.
Individual KPIs consist of personal business goals which align the Group’s strategies, as well as a compliance culture.
The Board believes that having a mix of financial and non-financial KPIs will provide measurable financial performance criteria strongly linked to increased year-on-year shareholder value and encourage the achievement of personal business goals consistent with the Group’s overall objectives.
To be eligible for the STI, participants must be employees in good standing of the Company at the date on which the bonus is payable.
Measurement of Performance Conditions
Performance against the KPIs is assessed annually by the Board on recommendations from the Remuneration and Nomination Committee after the end of the performance period as part of the broader performance review process for each KMP.
Treatment on Cessation of Employment
If a KMP ceases to be employed during the 12-month performance period in ‘good leaver’ circumstances, they may be entitled to a pro rata STI award unless the Board determined otherwise.
REMUNERATION REPORT CONTINUED
2 0 / P O I N T S B E T A N N U A L R E P O R T
For
per
sona
l use
onl
y
PERCENTAGE OF STI PAID AND FORFEITED DURING THE REPORTING PERIOD Details of the STI outcomes during the Reporting Period are outlined in the table below.
TABLE 4: EXECUTIVE KMP STI OUTCOMES
EXECUTIVE KMPMAXIMUM STI OPPORTUNITY
$ VALUE OF STIAWARD GRANTED
% OF MAXIMUM STI AWARD GRANTED
% OF MAXIMUM STI AWARD FORFEITED
SJ Swanell 66,060 33,030 50% 50%
NJ Fahey 40,363 20,182 50% 50%
AJ Mellor1 25,896 12,948 50% 50%
AJ Hensher2 27,555 13,778 50% 50%
1. AJ Mellor joined the Company on 18 January 2019 and was a full time employee from 1 March 2019. Figures represent a pro-rata of time employed during the Reporting Period.
2. AJ Hensher joined the Company on 14 January 2019. Figures represent a pro-rata of time employed during the Reporting Period.
4.3 EXECUTIVE LTI AWARDSThe Company has established a Long-Term Incentive (LTI) plan to assist in the reward, retention and motivation of participants and align their interests with those of shareholders. The LTI plan is an equity-based plan which is delivered in the form of options.
The rules of the LTI plan (Plan Rules) provide the framework under which the Plan and individual grants will operate.
The table below outlines the key terms and conditions applying to Senior Executive LTI arrangements for the KMPs during the Reporting Period.
TABLE 5: DESCRIPTION OF LTI
Overview of Senior Executive LTI Arrangements During the Reporting Period
Senior Executive LTI awards are an at-risk component of executive remuneration typically involving the one-off grant of options at the time the executive commences employment or following the change in the scope of their role or responsibilities. They are used to attract and retain key executive talent to the organisation.
The Group will continue to review its incentive arrangements on an ongoing basis to ensure they continue to meet the evolving needs of the Group. One-off LTI grants are likely to remain the key remuneration arrangement designed to attract executives and retain talent over the medium term.
Form of Awards The Plan Rules permit the Company to grant options, which are an entitlement to receive Company shares upon satisfaction of applicable conditions and payment of the applicable exercise price, subject to the terms of individual offers.
Options are granted for nil consideration as they are part of a Senior Executive’s remuneration.
Please refer to Table 11 for details of options awarded during the Reporting Period.
Performance Period LTI awards typically vest in two tranches after 3 and 4 years following the grant date (as appropriate). LTI awards only vest after performance against the performance conditions is measured after each of the relevant vesting dates.
P O I N T S B E T A N N U A L R E P O R T / 2 1
For
per
sona
l use
onl
y

Performance Conditions and Vesting
Vesting of options under the Plan is subject to any vesting or performance conditions determined by the Board and specified in the offer document.
Options must be exercised by the participant and the participant is required to pay the exercise price before shares are allocated.
Typically, each option will vest into a Company share upon satisfaction of prescribed vesting conditions, comprising: �—continuing service vesting conditions. �—target share price-based vesting conditions.
Cessation of employment Under the Plan Rules, the Board has a broad discretion in relation to the treatment of entitlements on cessation of employment.
Clawback and preventing inappropriate benefits
The Plan Rules provide the Board with broad “clawback” powers if, for example, the participant has acted fraudulently or dishonestly or there is a material financial misstatement.
Change of control The Board may determine that all or a specified number of a participant’s options will vest or cease to be subject to restrictions on a change of control event in accordance with the Plan Rules.
Reconstructions, corporate action, rights issues, bonus issues etc.
The Plan Rules include specific provisions dealing with rights issues, bonus issues and corporate actions and other capital reconstructions. These provisions are intended to ensure that there is no material advantage or disadvantage to the participant in respect of their incentives as a result of such corporate actions.
Restrictions on dealing Prior to vesting, the Plan Rules provide that participants must not sell, transfer, encumber, hedge or otherwise deal with their incentives. After vesting, certain participants may not dispose of options (or underlying shares) until the three-year anniversary of the grant of the options held by the relevant participants, unless otherwise approved by the Board.
All disposals of options and shares will be subject to the Company’s Securities Dealing Policy.
4.4 SENIOR EXECUTIVE CONTRACTSAll KMP have a written Executive Service Agreement with the Group. The key terms of these agreements are set out below.
TABLE 6: KEY TERMS OF KMP CONTRACTS
DURATION ONGOING TERM
Periods of Notice required to Terminate
In the case of:�—SJ Swanell, six months’ notice of termination by the employee and twelve months’ notice of
termination by the Company;�—NJ Fahey, five months’ notice of termination by the employee and nine months’ notice of
termination by the Company; �—AJ Mellor three months’ notice of termination by the employee and three months’ notice of
termination by the Company; and�—AJ Hensher, three months’ notice of termination by the employee and six months’ notice of
termination by the Company.
All payments on termination will be subject to the termination benefits cap under the Corporations Act. Shareholder approval was obtained prior to Listing for the provision of benefits on cessation of employment.
Restraints Non-compete and non-solicit restraints in Australia for each employee.
REMUNERATION REPORT CONTINUED
2 2 / P O I N T S B E T A N N U A L R E P O R T
For
per
sona
l use
onl
y

SECTION 5: REMUNERATION GOVERNANCE
5.1 OVERVIEWThe following table represents the Group’s remuneration decision making structure.
TABLE 7: REMUNERATION GOVERNANCE AND DECISION MAKING
BOARD
Review and approval.
Exercise of discretion in relation to targets, goals or funding pools.
REMUNERATION AND NOMINATION COMMITTEE
Board remuneration framework and policy.
Senior Executive KMP and Non-Executive Director remuneration outcome recommendations.
MANAGEMENT REMUNERATION ADVISORS
Proposals on executive remuneration outcomes.Implementing remuneration policies.
External and independent remunerationadvice and information.
5.2 BOARD AND REMUNERATION AND NOMINATION COMMITTEE RESPONSIBILITIESDetails of the composition and responsibilities of the Board and the Remuneration and Nomination Committee are set out in the Corporate Governance Statement (which forms part of this Annual Report).
5.3 USE OF REMUNERATION CONSULTANTS The Remuneration and Nominations Committee may seek and consider advice from external advisers from time to time to assist the Committee discharge its duties. Any advice from consultants is used to guide the Committee and Board, but does not serve as a substitute for thorough consideration by Non-Executive Directors.
Remuneration advisors may be engaged by the Chair of the Remuneration and Nominations Committee, however during the Reporting Period, no remuneration recommendations, as defined by the Act, were made by the remuneration advisors during the Reporting Period.
P O I N T S B E T A N N U A L R E P O R T / 2 3
For
per
sona
l use
onl
y
SECTION 6: NON-EXECUTIVE DIRECTOR REMUNERATIONDetails of the Non-Executive Directors of PointsBet Holdings Limited during the Reporting Period are provided in the Directors’ Report.
6.1 OVERVIEW OF POLICY In setting fee levels, the Remuneration and Nominations Committee, which makes recommendations to the Board, takes into account the demands and responsibilities associated with the Non-Executive Directors roles and the global scope and highly regulated environment in which the Group operates. The Board will continue to review its approach to Non-Executive Director remuneration to ensure it remains in line with high standards of corporate governance.
6.2 COMPONENTS AND DETAILS OF NON-EXECUTIVE DIRECTOR REMUNERATION Non-Executive Directors receive a fixed fee (inclusive of superannuation and committee memberships) for services to the Board. The Chair receives an additional fee for that service.
PointsBet is transforming into an expanding listed global business with scale, complexity and diversity, which has in turn significantly increased both Board and Committee workloads. In addition, recent developments in the corporate governance landscape are leading to increased expectations and demands of Non-Executive Directors on ASX boards.
Fees also reflect the regulatory requirements of the environment in which PointsBet operates, which imposes considerable demands on the Non-Executive Directors and their families who are required to disclose detailed personal and financial information and submit to interviews, including in foreign jurisdictions.
Non-Executive Directors are entitled to be reimbursed for all reasonable business-related expenses, including travel, as may be incurred in the discharge of their duties.
PointsBet does not make sign-on payments to new Non-Executive Directors and the Board does not provide for retirement allowances for Non-Executive Directors.
6.3 AGGREGATE FEE POOL AND DIRECTOR FEES Under the Constitution, the Board may decide the remuneration from the Company to which each Director is entitled for their services as a Non-Executive Director. However, under the Constitution and the ASX Listing Rules, the total aggregate amount provided to all Non-Executive Directors for their services must not exceed in any financial year the aggregate amount approved by shareholders at the Company’s general meeting. The amount has been fixed at $750,000 per annum.
The annual Non-Executive Director fees currently agreed to be paid by the Company to:�—the Chairman is $100,000 (inclusive of superannuation); and�—each of the other Non-Executive Directors is $80,000 (inclusive of superannuation).
Directors will not receive additional fees for being a member of a Board Committee.
REMUNERATION REPORT CONTINUED
2 4 / P O I N T S B E T A N N U A L R E P O R T
For
per
sona
l use
onl
y

SECTION 7: STATUTORY REMUNERATION TABLES AND DATA
7.1 DETAILS OF EXECUTIVE KMP REMUNERATION The following table reflects the accounting value of remuneration attributable to Executive KMP, derived from the various components of their remuneration. This does not necessarily reflect actual amounts paid to Executive KMP due to the conditional nature (for example, performance criteria) of some of these accrued amounts.
TABLE 8: STATUTORY EXECUTIVE KMP REMUNERATION TABLE
SHORT-TERM BENEFITS ($) POST-EMPLOYMENT BENEFITS ($) LONG-TERM SHARE-BASED4
KEY MANAGER’S NAME YEAR CASH SALARY
AND FEES1STI
CASH BONUSOTHER
BENEFITS2SUPER-
ANNUATION TERMINATION3
LONG SERVICE
LEAVEOPTIONS
($)TOTAL
($)
PERFORMANCE RELATED
%
SJ Swanell 2019 304,415 33,030 – 22,682 – 17,532 409,318 786,977 52
2018 256,667 – – 24,383 – – 20,204 301,254 7
NJ Fahey 2019 198,308 20,182 – 17,084 – 9,892 200,281 445,747 45
2018 149,167 – – 14,171 – – 20,204 183,542 11
AJ Mellor5 2019 122,677 12,948 – 9,781 – 2,202 19,083 166,691 11
2018 – – – – – – – – –
AJ Hensher6 2019 128,533 13,778 25,000 10,266 – 2,103 18,023 197,703 9
2018 – – – – – – – – –
Prior Year KMP7 2019 – – – – – – – – –
2018 371,446 – – 35,202 – – 13,563 420,211 3
Total KMP 2019 753,933 79,938 25,000 59,813 – 31,729 646,705 1,597,118 40
2018 777,280 – – 73,756 – – 53,971 905,007 6
1. Amounts shown as cash salary and fees include amounts sacrificed in lieu of other benefits at the discretion of the individual. To the extent that benefits are paid and subject to Fringe Benefits Tax (FBT), the above amount includes FBT.
2. Non-monetary benefits include insurance and travel costs, relocation costs, living away from home and expatriate related costs and associated FBT.3. Amounts reflect accruals in connection with the termination of employment (inclusive of any accruals for payments in lieu of notice).4. In accordance with the requirements of the Australian Accounting Standards, remuneration includes a proportion of the fair value of equity compensation granted or
outstanding during the year. The fair value of equity instruments which do not vest during the reporting period is determined as at the grant date and is progressively allocated over the vesting period. The amount included as remuneration is not related to or indicative of the benefit (if any) that individual Executive KMP may ultimately realise should the equity instruments vest. An independent accounting valuation for each tranche of options at their respective grant dates has been performed.
5. AJ Mellor joined the Company on 18 January 2019 and was a full time employee from 1 March 2019.6. AJ Hensher joined the Company on 14 January 2019.7. Previously identified KMP include N. Pinchuk, A. Fahey, J. Aitken, and T. Rundle. The Board have made an assessment and have determined that these personnel are
no longer KMP in 2019.
P O I N T S B E T A N N U A L R E P O R T / 2 5
For
per
sona
l use
onl
y

7.2 DETAILS OF NON-EXECUTIVE DIRECTOR REMUNERATION
TABLE 9: DETAILS OF NON-EXECUTIVE DIRECTOR REMUNERATION FOR THE REPORTING PERIOD
SHORT-TERM BENEFITS ($) POST-EMPLOYMENT BENEFITS ($) SHARE-BASED4
DIRECTORS YEAR CASH SALARY
AND FEES1FEES FOR
EXTRA SERVICES SUPERANNUATION2RETIREMENT
BENEFITS3 OPTIONS
($)TOTAL
($)
PERFORMANCE RELATED
%
BWF Paton5 2019 56,702 – 5,387 – – 62,089 –
2018 – – – – – – –
AP Symons 2019 59,361 – 5,639 – 52,368 117,368 45
2018 27,222 – 2,586 – 23,055 52,863 44
PD McCluskey 2019 59,361 – 5,639 – 12,974 77,974 17
2018 27,222 – 2,586 – – 29,808 –
Total 2019 175,424 – 16,665 – 65,342 257,431 25
2018 54,444 – 5,172 – 23,055 82,671 28
1. Amounts shown as cash salary and fees include amounts sacrificed in lieu of other benefits at the discretion of the individual. To the extent that any non-monetary benefits are subject to Fringe Benefits Tax (FBT), amounts shown include FBT.
2. Superannuation contributions include amounts required to satisfy the Group’s obligations under applicable Superannuation Guarantee legislation.3. Non-Executive Directors are not entitled to any retirement benefit.4. In accordance with the requirements of the Australian Accounting Standards, remuneration includes a proportion of the fair value of equity compensation granted or
outstanding during the year. The fair value of equity instruments which do not vest during the reporting period is determined as at the grant date and is progressively allocated over the vesting period. The amount included as remuneration is not related to or indicative of the benefit (if any) that individual Executive KMP may ultimately realise should the equity instruments vest. An independent accounting valuation for each tranche of options at their respective grant dates has been performed.
5. BWF Paton commenced on 19 November 2018.
7.3 SHARE-BASED COMPENSATIONThe terms and conditions of each grant of options issued by 30 June 2019 over ordinary shares affecting remuneration of Non-Executive Directors and other Executive KMP in this Reporting Period or future reporting periods are as follows:
REMUNERATION REPORT CONTINUED
2 6 / P O I N T S B E T A N N U A L R E P O R T
For
per
sona
l use
onl
y
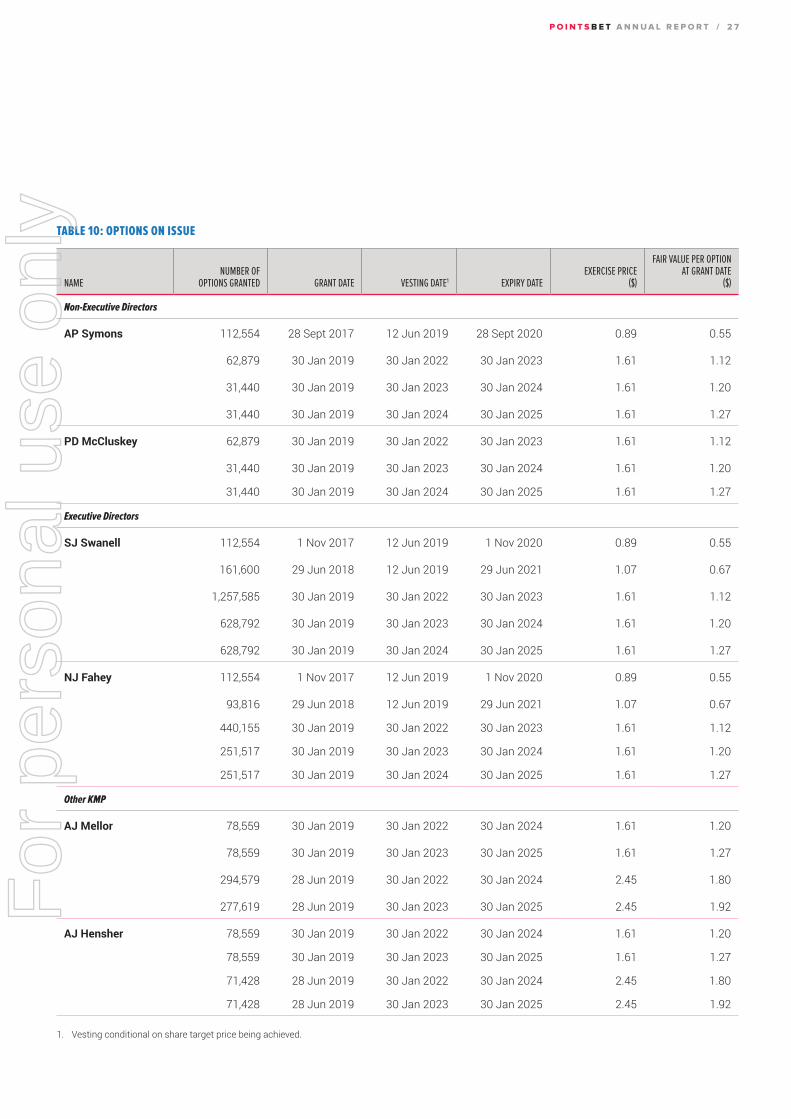
TABLE 10: OPTIONS ON ISSUE
NAMENUMBER OF
OPTIONS GRANTED GRANT DATE VESTING DATE1 EXPIRY DATEEXERCISE PRICE
($)
FAIR VALUE PER OPTION AT GRANT DATE
($)
Non-Executive Directors
AP Symons 112,554 28 Sept 2017 12 Jun 2019 28 Sept 2020 0.89 0.55
62,879 30 Jan 2019 30 Jan 2022 30 Jan 2023 1.61 1.12
31,440 30 Jan 2019 30 Jan 2023 30 Jan 2024 1.61 1.20
31,440 30 Jan 2019 30 Jan 2024 30 Jan 2025 1.61 1.27
PD McCluskey 62,879 30 Jan 2019 30 Jan 2022 30 Jan 2023 1.61 1.12
31,440 30 Jan 2019 30 Jan 2023 30 Jan 2024 1.61 1.20
31,440 30 Jan 2019 30 Jan 2024 30 Jan 2025 1.61 1.27
Executive Directors
SJ Swanell 112,554 1 Nov 2017 12 Jun 2019 1 Nov 2020 0.89 0.55
161,600 29 Jun 2018 12 Jun 2019 29 Jun 2021 1.07 0.67
1,257,585 30 Jan 2019 30 Jan 2022 30 Jan 2023 1.61 1.12
628,792 30 Jan 2019 30 Jan 2023 30 Jan 2024 1.61 1.20
628,792 30 Jan 2019 30 Jan 2024 30 Jan 2025 1.61 1.27
NJ Fahey 112,554 1 Nov 2017 12 Jun 2019 1 Nov 2020 0.89 0.55
93,816 29 Jun 2018 12 Jun 2019 29 Jun 2021 1.07 0.67
440,155 30 Jan 2019 30 Jan 2022 30 Jan 2023 1.61 1.12
251,517 30 Jan 2019 30 Jan 2023 30 Jan 2024 1.61 1.20
251,517 30 Jan 2019 30 Jan 2024 30 Jan 2025 1.61 1.27
Other KMP
AJ Mellor 78,559 30 Jan 2019 30 Jan 2022 30 Jan 2024 1.61 1.20
78,559 30 Jan 2019 30 Jan 2023 30 Jan 2025 1.61 1.27
294,579 28 Jun 2019 30 Jan 2022 30 Jan 2024 2.45 1.80
277,619 28 Jun 2019 30 Jan 2023 30 Jan 2025 2.45 1.92
AJ Hensher 78,559 30 Jan 2019 30 Jan 2022 30 Jan 2024 1.61 1.20
78,559 30 Jan 2019 30 Jan 2023 30 Jan 2025 1.61 1.27
71,428 28 Jun 2019 30 Jan 2022 30 Jan 2024 2.45 1.80
71,428 28 Jun 2019 30 Jan 2023 30 Jan 2025 2.45 1.92
1. Vesting conditional on share target price being achieved.
P O I N T S B E T A N N U A L R E P O R T / 2 7
For
per
sona
l use
onl
y

The number of options over ordinary shares in the Company held during the Reporting Period by each Non-Executive Director and other members of the Executive KMP of the Group, including their personally related parties, is set out below:
TABLE 11: MOVEMENT IN OPTIONS
NAMEBALANCE AT1 JULY 2018 GRANTED EXERCISED
EXPIRES/ FORFEITED/OTHER
BALANCE AT30 JUNE 2019
Non-Executive Director
AP Symons 112,554 125,759 – – 238,313
PD McCluskey – 125,759 – – 125,759
Executive Director
SJ Swanell 274,154 2,515,169 – – 2,789,323
NJ Fahey 206,370 943,189 – – 1,149,559
Other KMP
AJ Mellor – 729,316 – – 729,316
AJ Hensher – 299,974 – – 299,974
SECTION 8: EXECUTIVE KMP REMUNERATION RECEIVEDThe amounts disclosed in Table 12 below as Executive KMP remuneration for the Reporting Period reflect the actual benefits received by each KMP during the Reporting Period. The remuneration values disclosed below have been determined as follows:
FIXED REMUNERATION Fixed remuneration includes base salaries received, payments made to superannuation funds, the taxable value of non-monetary benefits received and any once-off payments such as sign-on bonuses or termination benefits.
Fixed remuneration excludes any accruals of annual or long-service leave.
SHORT-TERM INCENTIVES The cash STI benefits represent the bonuses that were awarded to each KMP in relation to Reporting Period.
LONG-TERM INCENTIVES The value of vested and exercised options was determined based on the intrinsic value of the options at the date of exercise, being the difference between the share price on that date and the exercise price payable by the KMP.
REMUNERATION REPORT CONTINUED
2 8 / P O I N T S B E T A N N U A L R E P O R T
For
per
sona
l use
onl
y

TABLE 12: ACTUAL REMUNERATION RECEIVED
EXECUTIVE FIXED REMUNERATION
($)AWARDED STI
($)
VESTED ANDEXERCISED LTI
($)OTHER BENEFITS
($)TOTAL VALUE
($)
SJ Swanell 327,097 33,030 – – 360,127
NJ Fahey 215,391 20,182 – – 235,573
AJ Mellor1 132,458 12,948 – – 145,406
AJ Hensher2 138,798 13,778 – 25,000 177,576
Total Executive KMP remuneration 813,744 79,938 – 25,000 918,682
1. AJ Mellor commenced employment on 18 January 2019 and was a full time employee from 1 March 2019.2. AJ Hensher commenced employment on 14 January 2019. AJ Hensher received a Living Away From Home Allowance in the Reporting Period.
The amounts disclosed in Table 12 above are not the same as the remuneration expensed in relation to each KMP in accordance with the accounting standards (see Table 8). The Directors believe that the remuneration received is more relevant to users for the following reasons: �—The statutory remuneration expensed is based on historic cost and does not reflect the value of the equity instruments when they
are actually received by the KMPs. �—The statutory remuneration shows benefits before they are actually received by the KMPs. �—Where options do not vest because a market-based performance condition is not satisfied (eg an increase in the company’s
share price), the Company must still recognise the full amount of expenses even though the KMPs will never receive any benefits.�— Share-based payment awards are treated differently under the accounting standards depending on whether the performance
conditions are market conditions (no reversal of expense) or non-market conditions (reversal of expense where shares fail to vest), even though the benefit received by the KMP is the same (nil where equity instruments fail to vest).
The information in this section has been audited together with the rest of the Remuneration Report.
P O I N T S B E T A N N U A L R E P O R T / 2 9
For
per
sona
l use
onl
y

SECTION 9: SHAREHOLDINGS
9.1 MOVEMENT IN SHARES The number of shares (excluding those unvested under the LTI plan) in the Company held during the year ended 30 June 2019 by each Non-Executive Director and Executive KMP, including their personally related entities, are set out below. No amounts are unpaid on any of the shares issued.
Where shares are held by the Director or Executive KMP and any entity under the joint or several control of the Director or Executive KMP, they are shown as ‘beneficially held’. Shares held by those who are defined by AASB 124 Related Party Disclosures as close members of the family of the Director or Executive KMP or are held through a nominee or custodian are shown as ‘non-beneficially held’.
The following sets out details of the movement in shares in the Company held by Non-Executive Directors or their related parties during the year:
TABLE 13: DETAILS OF NON-EXECUTIVE DIRECTOR SHAREHOLDINGS
NON-EXECUTIVE DIRECTORS
TYPEBALANCE AT1 JULY 2018
OPTIONS VESTEDAND EXERCISED
OTHER NET CHANGES DURING THE YEAR
BALANCE AS AT30 JUNE 2019
BWF Paton Beneficially held 5,648,818 – 3,582,984 9,231,802
Non-beneficially held 242,337 – 22,511 264,848
AP Symons Beneficially held 567,548 – – 567,548
Non-beneficially held – – – –
PD McCluskey Beneficially held 344,201 – – 344,201
Non-beneficially held – – – –
All equity instrument transactions between the Non-Executive Directors, including their related parties, and PointsBet during the year have been on arm’s length basis.
The following sets out details of the movement in shares in the Company held by Executive KMP or their related parties during the year:
REMUNERATION REPORT CONTINUED
3 0 / P O I N T S B E T A N N U A L R E P O R T
For
per
sona
l use
onl
y

TABLE 14: DETAILS OF EXECUTIVE KMP SHAREHOLDINGS NOT HELD UNDER AN EMPLOYEE SHARE PLAN
EXECUTIVE DIRECTORS AND OTHER EXECUTIVE KMPS
TYPEBALANCE AT1 JULY 2018
OPTIONS VESTEDAND EXERCISED
OTHER NET CHANGES DURING THE YEAR
BALANCE AS AT30 JUNE 2019
SJ Swanell Beneficially held – – – –
Non-beneficially held 3,631,024 – (421,417) 3,209,607
NJ Fahey Beneficially held 13,228,406 – (1,718,112) 11,510,294
Non-beneficially held – – – –
AJ Mellor Beneficially held – – 56,340 56,340
Non-beneficially held – – – –
AJ Hensher Beneficially held – – – –
Non-beneficially held – – 5,000 5,000
Other than share-based payment compensation effected through an employee share option plan, all equity instrument transactions between Executive KMP, including their related parties, and PointsBet during the year have been on arm’s length basis.
9.2 LOANS WITH KMP No KMP or their related parties held any loans from the Group during or at the end of the year ended 30 June 2019 or prior year.
9.3 OTHER KMP TRANSACTIONS AP Symons, a Non-Executive Director, is Managing Director and majority beneficial owner of Clarendon Lawyers, the Company’s Australian legal adviser and a material services provider to the Company. During the Reporting Period, the Company paid a total of $259,400 in legal fees in connection to the IPO and $230,753 in the provision of other legal services to Clarendon Lawyers.
P O I N T S B E T A N N U A L R E P O R T / 3 1
For
per
sona
l use
onl
y

REVIEW OF OPERATIONS
It has been a transformational year for the Company gaining market access in the United States (US), taking our first mobile bets in New Jersey and successfully listing on the Australian Securities Exchange (ASX: PBH).
Over the 12 months to 30 June 2019 (the Reporting Period or FY2019), PointsBet has continued to invest in our scalable cloud-based technology platform (Platform), both in Australia and the US. We have made key and strategic hires across marketing, US business development, finance and legal/compliance as well as our technology and product teams in order to provide our clients with a ‘best in class’ user experience. Further, as we look to progressively launch our application in additional States in FY2020 and beyond, the Company continues to invest in delivering significant economies of scale via our in-house Platform.
The Group’s Net Win for FY2019 was $28.2 million (Net Revenue of $25.6 million), a year-on-year (YoY) growth of 174%.
The Australian trading business segment continues to perform in line with expectations, achieving Net Win1 of $28.9 million (Net Revenue2 of $26.3 million) for FY2019, a year-on-year (YoY) growth of 181%. In the US, PointsBet utilised the experience and learnings from Australia alongside the Company’s in-house technology platform and outstanding US gaming and operational team members to deliver an immediate impact in New Jersey which has then further assisted business development efforts. Additionally, this resulted in achieving an online Turnover market share of 5.4% in June 2019 in New Jersey.
Since inception, PointsBet has experienced significant client growth, establishing a solid foundation from which to support domestic and international expansion.
Registered Clients3 grew from 34,779 at 30 June 2018 to 123,180 at 30 June 2019. Of these 80,008 are active clients, meaning they have placed a bet in the last 12 months.
PointsBet started FY2019 with the ambition of achieving US market access following the repeal of the Professional and Amateur Sports Protection Act of 1992 (United States) (PASPA) in May 2018. Having recently announced its partnership with Penn National Gaming, PointsBet starts FY2020 with market access agreements in place for nine States with an additional option agreement in place for New York, subject to enabling legislation.
1. Net Win is measured as Gross Win (the dollar amount received from Clients who placed losing bets less the dollar amount paid to Clients who placed winning bets, excluding the cost of pricing promotions) less promotional costs.
2. Net Revenue is measured at the fair value of consideration received or receivable from Clients less GST, free bets, promotions, bonuses and other fair value adjustments
3. A client who has opened an account with PointsBet.
3 2 / P O I N T S B E T A N N U A L R E P O R T
For
per
sona
l use
onl
y

BACKGROUND TO GROUP FINANCIAL RESULTSIn reviewing the results of the Group, it is important to note that the year ended 30 June 2019 was a period focused on establishing a platform for future growth. This was characterised by continued investment in market access, technology and product, people, executing on our marketing strategy to efficiently acquire clients and establishing on-the-ground operations in the United States.
EARNINGS SUMMARYThe information presented in this Review of Operations has not been audited in accordance with the Australian Auditing Standards.
The key performance indicators for the Reporting Period and prior period are set out below:
NORMALISED RESULTS4 2019$000
2018$000
VARIANCE %
Revenue 25,615 9,382 173
EBITDA loss (32,650) (6,128) 433
Loss for the year (34,353) (6,459) 432
Basic and diluted earnings per share (cents) (59.1) (15.1) 291
REPORTED RESULTS2019$000
2018$000
VARIANCE %
Revenue 25,615 9,382 173
EBITDA Loss (37,169) (6,326) 488
Loss for the year (41,885) (6,658) 529
Basic and diluted earnings per share (cents) (72.1) (15.6) 362
KEY OPERATING METRICS 2019 2018 VARIANCE %
Registrations (#) 88,401 29,756 +197
First time bettors (#) 61,492 22,729 +171
Turnover ($) 567,101,603 164,985,216 +244
Gross Win ($)5 52,685,294 16,876,419 +212
Net Win ($) 28,235,129 10,287,554 +174
4. Normalised results excludes the impact of certain significant items and adjustments. Significant items and adjustments are items which are either individually or in aggregate, material to PointsBet and are either outside the ordinary course of business or part of the ordinary activities of the business but unusual due to their size and nature as detailed under the heading ‘Significant Items and Adjustments’.
5. Gross win is calculated as the dollar amount received from clients who placed losing bets, less the dollar amount paid to clients who placed winning bets, excluding the cost of pricing promotions.
P O I N T S B E T A N N U A L R E P O R T / 3 3
For
per
sona
l use
onl
y

REVIEW OF OPERATIONS CONTINUED
S I G N I F I C A N T I T E M S A N D A DJ U ST M E N TS
SIGNIFICANT ITEMS AND ADJUSTMENTS NOTE2019$000
2018$000
IPO Transaction Costs 1 1,484 –
Interest on Convertible Notes 2 1,816 –
Fair Value Adjustments of Convertible Notes on Conversion 3 1,198 –
US Set up Costs 4 808 –
Share Based Payments 5 1,549 198
Unrealised FX losses 6 678 –
Total Significant Items and Adjustments 7,532 198
1. IPO Transaction CostsIPO Transaction Costs incurred by the Group in connection with its IPO completed on 12 June 2019. Costs incurred primarily related to legal fees, investigative accountant costs, audit and taxation related costs, roadshow costs and consulting costs that have not been capitalised in share capital.
2. Interest on Convertible NotesNotional interest calculated on the Convertible Notes from date of issue to the date of conversion.
3. Fair Value Adjustment of Convertible Notes on ConversionFair value adjustment of Convertible Notes issued on 6 Aug 2018 and 31 October 2018 that were converted to ordinary share capital on 8 March 2019 post completion of a qualifying funding round.
4. US Set Up CostsCosts associated with setting up operations in the US. Costs incurred primarily related to relocation costs of key management personnel transferred from the Australian business, hiring costs of key US management team members, legal fees, travel and accommodation, and one-off project manager and consultant costs.
5. Share based payments – Employee Share Option PlanAn adjustment for fair value of employee share option plan issuances to key management staff.
6. Unrealised FX lossesUnrealised FX losses on USD exposures that have yet to be realised.
C O N T I N U E D M O M E N T U M
The Group recorded a Net Revenue YoY increase of 173% to $25.6 million underpinned by a 244% increase in Turnover6 to $567 million reflective of growth in Registered Clients and a focus on obtaining a positive return on investment on the Company’s marketing initiatives.
As a result of the significant growth period for the Company’s operations, as it established its presence in the US market and continued investment in the Australian operations, the costs associated with marketing, staffing and administration resulted in a normalised earnings before interest, taxation, depreciation and amortisation (EBITDA) loss of $(32.7) million for the Reporting Period, in line with management expectations.
The Company is acutely aware that the State by State legalisation of the US sports betting market is only going to happen once and thus is focused on having the best team, technology and product on the starting line.
6. Turnover is the money a client puts at risk when they place a bet on an event.
3 4 / P O I N T S B E T A N N U A L R E P O R T
For
per
sona
l use
onl
y

TRACK RECORD OF ACHIEVING KEY MILESTONES
AUSTRALIAThere continues to be strong industry growth in Australia across racing and sports wagering, driven by consumer behavior trends, increased availability of internet access, smartphone penetration and product innovation, with the total size of the Australian racing and sports wagering market being $4.37 billion in revenue in 20177.
Despite the challenges facing the industry from increasing regulation, PointsBet’s Australian business performed in line with expectations over the year, as the Company effectively executed its strategy to acquire and retain clients using targeted media assets.
The introduction of the Point of Consumption Tax (PoC) across the States of Victoria, Queensland, New South Wales and South Australia impacted operational performance in the second half of the Reporting Period. The Company continues to be focused on developing strategies to grow Net Revenue given the structural challenges relating to sporting body fees and government taxes.
Net Win for the Australian business increased from $10.3 million to $28.9 million (Net Revenue of $26.3 million) over the Reporting Period as the business continued to increase its client base, focused on client retention and rolled out innovative product and technology enhancements. In addition, the depth and breadth of our market offering combined with improved trading risk functions resulted in an enhanced client experience over the period.
PointsBet aims to provide more markets on NBA, NFL, MLB, NHL and AFL than any other bookmaker and our Australian clients have been drawn to our international market offerings where the Company currently pays less product fees and taxes.
The Company’s marketing strategy maintains a focus on excellence in achieving a return on investment on the Company’s marketing spend via an integrated multi-channel effort and in-depth analysis of category target audience.
Utilising PointsBet’s global brand ambassador (11 time NBA All Star Allen Iverson) assisted greatly in brand awareness, leading to strong performance across client acquisition and retention. Broadcast partnerships with Channel 7 (Cricket and AFL) and Channel 9 (NRL), and strategic media placements within Fox Sports and ESPN programming across multiple sporting codes provided additional brand recognition. Furthermore, the Company was pleased to announce a four-year naming rights agreement and partnership with the Cronulla Sharks, with the NRL ground formerly known as Shark Park now re-named PointsBet Stadium.
The Company continues to utilise leading technology to deliver marketing campaigns across paid search, social media (paid and organic), programmatic content and media networks including YouTube, Google Display Network and affiliate partners. In addition, the Company anticipates additional product releases over the forthcoming 12 months will greatly assist with client acquisition, re-activation and retention in Australia.
Investment in our scalable cloud-based technology platform is a critical part of our global strategy. The Australian Trading segment recorded an EBITDA loss of $(10.8) million, in line with management expectations. This was reflective of continued investment in product and talent, and increased marketing spend as part of our client acquisition strategy, all of which will place the business in a strong position to grow in coming years.
7. Australian Gambling Statistics, 34th edition, 2016-1.
P O I N T S B E T A N N U A L R E P O R T / 3 5
For
per
sona
l use
onl
y

REVIEW OF OPERATIONS CONTINUED
UNITED STATES The US represents an extraordinary market opportunity as individual States introduce legislation permitting sports wagering following the 2018 Supreme Court decision to invalidate PASPA. PointsBet is well positioned to take advantage of this opportunity, with strong leadership, experienced management and scalable technology that has been successfully developed in the sophisticated Australian wagering market.
Immediately following the repeal of PASPA in May 2018, the Company’s strategy was to gain market access to the progressively legalising US sports wagering market. Its inaugural US access deal was signed in July 2018 with New Meadowlands Racecourse, providing the Company market access in New Jersey. This was expanded upon immediately with the option agreement with American Racing & Entertainment LLC, owner of the Tioga Downs Casino, for market access in New York, subject to the passing of enabling legislation and licensure in the State of New York.
The Company was licensed and operational in New Jersey by January 2019, launching its brand campaign on 17 January 2019. PointsBet had an immediate impact in the New Jersey market through its unique PointsBetting product, high quality user experience and innovative marketing campaigns, such as the Karma KommitteeTM. This resulted in achieving an online Turnover market share of 5.4% in June 2019 in New Jersey.
The Company’s ‘go to market’ strategy was for New Jersey to be the shopfront of its overall US growth plans and to create a brand and reputation that would assist PointsBet in gaining further market access.
PointsBet has leveraged the experience and learnings gained from the sophisticated Australian market and has combined it with the Company’s in-house technology and outstanding US gaming and operational team members to make an immediate impact in New Jersey which has then further assisted business development efforts.
This strategy resulted in PointsBet gaining market access in the following states up to 28 August 2019.
STATE MARKET ACCESS PARTNER
New Jersey New Meadowlands Racetrack
New York Option agreement with Tioga Downs Casino
Iowa Catfish Bend Casino
Colorado Double Eagle Casino
Illinois Hawthorne Racecourse
West Virginia Penn National Gaming
Indiana Penn National Gaming
Ohio Penn National Gaming
Missouri Penn National Gaming
Louisiana Penn National Gaming
This now provides PointsBet market access to up to 10 States, representing a total population of approximately 81 million.
3 6 / P O I N T S B E T A N N U A L R E P O R T
For
per
sona
l use
onl
y

US ONLINE SPORTS BETTING LEGISLATION(1):
PointsBet has taken a surgical and regional approach to partnering with brand ambassadors in the US, selecting Allen Iverson (11 time NBA All-Star) and Darelle Revis (7 time NFL Pro Bowler), to drive brand awareness and recognition in marketing campaigns along with in-app experiences.
The digital media strategy was enhanced when in June 2019 Google permitted legalised digital US sports wagering companies to market on their platforms including Adwords and Youtube.
As a new market entrant and brand in the US, the New Jersey strategy was to strategically invest our promotion and marketing budgets to build brand recognition and optimise client acquisition and retention. In some months our promotional costs were greater than our gross revenue result as the Company sought to capitalise on key seasonal customer acquisition and retention opportunities. This was in-line with management expectations and has seen demonstrable results, with the Company’s New Jersey online Turnover share for June 2019 being 5.4%, an increase from the first full operational month in February of 2.2%.
The Company’s US Gross Win in the Reporting Period was US$1.54 million whilst its client promotional costs for the period were US$2.06 million, thus resulting in negative Net Revenue of US$0.515 million for the period.
This significant growth period for the Company’s operations, as it established its presence in the US market, resulted in heightened costs associated with marketing, staffing and administration. This led to the US segment recording an EBITDA loss of $(20.0) million, in line with management expectations.
P O I N T S B E T A N N U A L R E P O R T / 3 7
For
per
sona
l use
onl
y

REVIEW OF OPERATIONS CONTINUED
TECHNOLOGY AND CORPORATEPointsBet’s Platform is specifically designed to be scalable and fast, utilising cloud-based platforms, specifically Microsoft Azure, that allow for PointsBet’s systems and features to be developed in a timely and cost-efficient manner compared to more traditional infrastructure and hosted solutions.
The Technology segment derives its revenue from licensing fees charged to the Australian Trading and the group’s subsidiaries in the United States. Please note this revenue is eliminated in the Company’s consolidated results.
The EBITDA loss for the Technology segment for the year ended 30 June 2019 was $(2.7 million) in line with management expectations.
Corporate administrative costs (Board, Finance, Legal, Human Resources, Property and other central functions) cannot be readily allocated to individual operating segments and are not used by the CODM (Chief Operating Decision Maker) for making operating and resource allocation decisions. The EBITDA loss for the Corporate Segment for the year ended 30 June 2019 was $(3.7 million) in line with management expectations.
IN SUMMARYThe Company is acutely aware that the State by State legalisation of the US sports betting market is only going to happen once and thus is focused on having the best team, technology and product on the starting line to capitalise on opportunities as they arise. The Company is pleased with its market access achievements to date and continues to assess future opportunities which will complement the Group’s existing operations and market access partners.
We are a high-growth company capitalising on the new market opportunity in the US and our first-mover advantage. The Company’s cash-flows and EBITDA are in-line with our expectations, reflecting the growth phase of the business, and we are taking a focused and disciplined approach on execution. The Company has appropriately planned for the requirements and demands presented by the US sports wagering opportunity and has been building the global capabilities of the team in preparation for the next phase of the US strategy.
MATERIAL BUSINESS RISKS TO STRATEGY AND FINANCIAL PERFORMANCE IN FUTURE PERIODSIdentifying and managing risks which may affect the success of our strategy and financial prospects for future years is an essential part of our governance framework. While the Group has a strong track record of managing a multitude of risks, some inherent risks remain, many of which are not directly within the control of the Group.
Our risk management approach involves the ongoing assessment, monitoring and reporting of risks which could impede our progress in delivering our strategic priorities. As the business continues to grow the material business risk profile continues to evolve.
The key risks affecting the Group are set out below. The Group may also face a range of other risks from time to time in conducting its business activities.
THE WAGERING INDUSTRY IS HIGHLY REGULATEDThe provision of wagering services is subject to extensive laws, regulations and, where relevant, licence conditions (Regulations) in most jurisdictions. The Regulations vary from jurisdiction to jurisdiction but typically address the responsibility, financial standing and suitability of owners, Directors and operators, marketing and promotional activity, the jurisdictions where an operator is permitted to undertake its business, the use of personal data and anti-money laundering laws. In addition, compliance costs associated with Regulations are material.
C H A N G E S TO R E G U L AT I O N S
Many of the Regulations are subject to change at any time and regulatory authorities may change their interpretation of the Regulations at any time, which may prohibit, restrict or further regulate the Company’s operations in the future. Any changes to Regulations may result in additional costs or compliance burden. Some aspects of compliance may be outside the control of the Company.
3 8 / P O I N T S B E T A N N U A L R E P O R T
For
per
sona
l use
onl
y

B R E AC H O F R E G U L AT I O N S
Failure by the Company to comply with relevant Regulations may lead to penalties, sanctions or ultimately the revocation of relevant operating licences and may have an impact on licences in other jurisdictions. Further, any regulatory investigations or settlements could cause the Company to incur substantial costs (either by way of fines and penalties or as a result of successful customer claims), or require it to change its business practices in a manner materially adverse to its business.
R E G U L AT I O N S D I F F E R AC R O S S J U R I S D I C T I O N S
The regulation of the wagering industry varies from jurisdiction to jurisdiction, from open regimes to licence-based regimes to complete illegality. In addition, the regulation of online wagering is subject to the determination of where online sports betting takes place and which jurisdiction has authority over the activities and participants.
The Company is currently operating in multiple jurisdictions and seeks to expand its operations in more jurisdictions. Accordingly, as the Company grows it will be subject to a wide range of different and at times conflicting Regulations in each jurisdiction, together with potential uncertainty around the application of laws. This is expected to place an increased burden on the Company and its compliance, administration and technology functions.
If the Company is not successful in managing this increased burden, or if the Company’s assessment of an area of legal uncertainty is found to be incorrect, the Company may breach a licence condition or applicable law, which could result in penalties, sanctions or ultimately the revocation of relevant operating licences.
UNITED STATES-SPECIFIC REGULATORY RISKSThe Company’s growth strategy includes expansion overseas, and in particular into the developing wagering industry in the United States.
The striking down by the United States Supreme Court of the Professional and Amateur Sports Protection Act of 1992 on 14 May 2018 paved the way for individual states to introduce legislation permitting sports betting. Each state may now introduce their own regulatory and licencing frameworks, however:�—there is no guarantee that states will move to legalise wagering; and�—the timing of any enabling legislation or regulations, and the issuance of licences, cannot be assessed with any certainly in states
that do move to legalise wagering.
There is also a risk that some states will delay legislation or impose significant barriers to entry (such as restricting the number of permitted sports betting operators or limiting sports betting operations to retail premises) which may preclude the Company from gaining access to those states or place the Company at a disadvantage should competitors gain early access.
In addition, should enabling legislation be enacted, there is a risk that the Company may be unable to secure a commercial licence to operate in a state because the Company is unable to find or agree commercial terms with a suitable licence holder (typically casino or racetrack owners).
THE COMPANY IS EXPOSED TO ADVERSE CHANGES IN PRODUCT FEES, LEVIES AND TAXESThe Company has commercial and regulatory payment obligations in the jurisdictions in which it operates. These obligations may be owed to a particular sporting body as “product fees” (for example, horse racing conducted in an Australian jurisdiction), payable under a commercial or statutory licence, or otherwise imposed by law as a tax, levy or fee. Any adverse changes to the Company’s commercial and regulatory payment obligations, or the imposition of new levies, taxes or other duties or charges in any of these jurisdictions could materially and adversely affect the operations, financial performance and prospects of the Company.
P O I N T S B E T A N N U A L R E P O R T / 3 9
For
per
sona
l use
onl
y

REVIEW OF OPERATIONS CONTINUED
SYSTEM DISRUPTIONS AND OUTAGESThe integrity, reliability and operational performance of the Company’s IT systems and third-party communication networks are critical to its operations. These IT systems and communication networks may be damaged or interrupted by increases in usage, human error, systems outages and failures, cyber-attacks, natural hazards or disasters, or similarly disruptive events. The Company’s current systems may be unable to support a significant increase in online traffic or increased customer numbers, especially during peak times or events.
Like other wagering operators, the Company has experienced instances of service disruption. Any material or persistent failure or disruption of the Company’s IT infrastructure or the telecommunications and/or other third-party infrastructure and services on which such infrastructure relies could lead to significant costs and disruptions that could reduce revenue, harm the Company’s business reputation and have a material adverse effect on the operations, financial performance and prospects of the Company.
CYBER SECURITY RISKSThe Company’s IT systems and networks, and those of its third-party service providers, may be vulnerable to cyber-attacks, unauthorised access, computer viruses and other security issues. These events could damage the integrity of the Company’s reputation and business.
Any failure by the Company to detect and prevent any intrusion or other security breaches, including sabotage, hackers, viruses, and cyberattacks, could have a material adverse effect on the operations, financial performance and prospects of the Company.
THE COMPANY MAY REQUIRE ADDITIONAL CAPITAL TO FUND ITS GROWTH PLANSThe Company is likely to require additional capital in order to support and implement its growth plans. The Company’s ability to obtain additional capital, if and when required, will depend on its business plans, investor demand, the capital markets and other factors. If the Company is unable to obtain additional capital when required, or is unable to obtain additional capital on satisfactory terms, its ability to continue to support its business growth or to respond to business opportunities, challenges or unforeseen circumstances could be adversely affected.
CARD PAYMENT RISKSSome clients may have difficulty making deposits into their PointsBet account due to specific policies by card issuers and banks to not allow gambling transactions, or to restrict transactions from merchants such as PointsBet whose main business is conducted online. If clients have difficulty making deposits into their PointsBet account and are unable or unwilling to deposit funds using alternative methods, this could result in lower turnover for PointsBet.
POINTSBET RELIES ON THIRD-PARTY SERVICE PROVIDERS FOR KEY BUSINESS FUNCTIONSThe Company relies upon various third-party service providers to maintain continuous operation of its Platform, servers, hosting services, payment processing, and various other key aspects of its business including the pricing and availability of its products.
There is a risk that these services and systems may be adversely affected by various factors such as damage, faulty or aging equipment, systems failures and outages, computer viruses, or misuse by staff or contractors. The Company may also have disputes with its service providers for a range of reasons, which could lead to service disruptions until the dispute is resolved or a new service provider is engaged. Any disruption to third-party services may result in a disruption to the Company’s services and have a material impact on the Company’s operations.
RISK OF FRAUDWagering operators are exposed to schemes to defraud and there is a risk that the Company’s products may be used for those purposes by its clients or employees. In these circumstances, the Company has a high degree of reliance on its employees.
While the Company has systems in place to protect against fraudulent play and other collusion between clients and employees, these systems may not be effective in all cases. This may require the Company to make unanticipated additional investments in its systems and processes.
If the Company suffers any fraudulent activities, the Company’s business, performance, prospects, value, financial condition, and results of operations could be adversely affected.
4 0 / P O I N T S B E T A N N U A L R E P O R T
For
per
sona
l use
onl
y

ANTI-MONEY LAUNDERINGThe wagering industry is exposed to schemes to launder money illegally and there is a risk that the Company’s products may be used for those purposes by its clients or employees.
In addition, the Company’s activities are subject to money laundering regulations and anti-corruption laws, which may increase the costs of compliance, limit or restrict the Company’s ability to do business or subject the Company to civil or criminal actions or proceedings.
RISKS RELATING TO THE MISUSE OR LOSS OF PERSONAL INFORMATIONThe Company processes personal customer data and therefore must comply with strict data protection and privacy laws in Australia and other jurisdictions. The Company is exposed to the risk that this data could be wrongfully accessed and/or used, whether by employees, customers or other third parties, or otherwise inadvertently lost or disclosed or processed in breach of applicable data protection regulations. If the Company or any of the third-party service providers on which it relies fails to transmit customer information and payment details online in a secure matter or if a misuse or loss of personal customer data were to occur, the Company and its officers could face fines or penalties. This could also give rise to reputational damage to the Company and its brand.
INABILITY TO MANAGE EXPECTED FUTURE GROWTHThe Company has experienced and expects to continue to experience rapid growth, which has placed, and may continue to place, significant demands on its management, operational and financial resources. As the Company grows, it may encounter capacity constraint issues and more resources will be required to manage growth initiatives. If the Company fails to successfully manage its anticipated growth and change, the quality of its products may suffer, which could negatively affect its brand and reputation and harm its ability to retain and attract customers.
RELIANCE ON KEY PERSONNELThe Company depends on the services of the management team as well as its technical, operational, marketing and management personnel.
Competition for suitably qualified personnel, including computer programmers and developers, is intense, and the Company cannot provide assurance that it will be able to attract or retain highly qualified personnel in the future.
If the Company is not able to retain its key employees and hire appropriate new employees, it may not be able to operate and grow it business as planned.
EXCHANGE RATE FLUCTUATIONS MAY IMPACT EARNINGSPointsBet’s financial reports are prepared in Australian dollars however a proportion of PointsBet’s revenues, costs and cash flows are generated in United States dollars. The proportion of overseas revenues, costs and cashflows generated by the Company is expected to grow and the Company will be exposed to additional currencies as it enters new markets.
Any adverse exchange rate fluctuations or volatility in the currencies in which PointsBet generates its revenues and cash flows, and incurs its costs, would have an adverse effect on the Company’s future performance and position.
P O I N T S B E T A N N U A L R E P O R T / 4 1
For
per
sona
l use
onl
y

CORPORATE GOVERNANCE STATEMENT F O R T H E 1 2 M O N T H S TO 3 0 J U N E 2 0 1 9
INTRODUCTION
OUR APPROACH TO CORPORATE GOVERNANCE The Board of PointsBet Holdings Limited (Company) is committed to maintaining high standards of effective corporate governance arrangements to help create, protect and enhance shareholder value and ensure the future sustainability of the Company.
The Company’s governance framework provides a solid structure for effective and responsible decision making and setting a culture of integrity, transparency and accountability that flows throughout the Company.
ASX CORPORATE GOVERNANCE PRINCIPLESThe Company confirms it has followed the majority of the ASX Corporate Governance Council Principles and Recommendations 3rd Edition (ASX Principles) during the 2018/19 financial year.
This Corporate Governance Statement sets out key features of our governance framework. The areas of compliance and non-compliance (and the reasons for such non-compliance) with the ASX Principles are set out below.
The Company is also actively reviewing the implications and application of the 4th edition ASX Principles recently released. In this regard, the Company has already early-adopted some of the new Principles including the establishment of an Anti-Bribery and Corruption Policy and a Whistleblower Policy.
The information in this statement is current as at 28 August 2019 and has been approved by the Board.
1. THE BOARD
1.1 THE ROLE OF THE BOARDThe Board has adopted a Board Charter to outline the manner in which its constitutional powers and responsibilities will be exercised and discharged. The Board Charter includes an overview of:�—the Board’s composition;�—the Board’s role and responsibilities;�—the relationship and interaction between the Board and management;�—the authority delegated by the Board to management and Board Committees; and�—the Board’s process.
The Board’s role is to:�—represent and serve the interests of Shareholders by overseeing and appraising the Company’s strategies, policies and performance;�—protect and optimise the Company’s performance and build sustainable value for Shareholders in accordance with any duties and
obligations imposed on the Board by law and the Company’s Constitution and within a framework of prudent and effective controls that enable risk to be assessed and managed;
�—set, review and monitor compliance with the Company’s values and governance framework (including establishing and observing high ethical standards); and
�—ensure Shareholders are kept informed of the Company’s performance and major developments affecting its state of affairs.
The Board, together with the Remuneration and Nomination Committee, determines the size and composition of the Board.
A copy of the Board Charter is available in the Governance section of the Company’s website https://investors.pointsbet.com.au/.
1.2 CEO AND DELEGATION TO MANAGEMENTThe Board has authorised the CEO to oversee the day-to-day business and operations, within the limits of specific authorities set out in the delegations approved by the Board.
The CEO has, in turn, approved sub-delegations of authority that apply to management. The CEO is accountable to the Board for the authority that is delegated by the Board. The Board monitors the decisions and actions of the CEO and the Group’s progress on achieving the short, medium and long-term objectives as set by the Board.
4 2 / P O I N T S B E T A N N U A L R E P O R T
For
per
sona
l use
onl
y

1.3 BOARD COMPOSITION AND SKILL SETAs at 30 June 2019, the Board comprised one independent Non-Executive Director, two non-independent Non-Executive Directors, the CEO/ Managing Director and the CFO / Executive Director.
The names of the Directors and their respective qualifications, experience and responsibilities are set out in the Directors’ Report within this Annual Report.
Members of the Board have been brought together to provide a blend of qualifications, skills and experience required for managing a company operating in the wagering industry.
The following table sets out the mix of skills and experience the Board considers necessary or desirable and the extent to which they are represented on the current Board:
SKILLS AND EXPERIENCE NUMBER OF DIRECTORS
Executive leadershipSignificant experience at a senior executive level
5
Capital management and corporate Senior experience in capital management strategies and corporate finance
3
Global business experience International business experience
3
Risk management Senior experience in risk management
5
Corporate governance, legal and regulatory Commitment to the highest standards of corporate governance and legal compliance, including experience with an organisation that is subject to rigorous governance and regulatory standards
5
Digital technology Senior experience in technology, especially in digital, software or computer industries and oversight of implementation of major technology projects
3
Wagering Senior executive or Board level experience in the gaming industry, including an in-depth knowledge of product and markets
3
Any skills that are not directly represented are augmented through management and external advisors.
1.4 DIRECTOR INDEPENDENCE All Directors, whether independent or not, are expected to bring an impartial judgement to bear on Board decisions and are subject to the Board’s policy regarding management of conflicts of interest, as well as common law and Corporations Act requirements.
The Board considers a Director to be independent where he or she is independent of management and free of any business or other relationship that could materially interfere with, or could reasonably be perceived to materially interfere with, the exercise of their unfettered and independent judgment.
The Remuneration and Nomination Committee will assess the independence of each Non-Executive Director in light of interests disclosed by them at least annually on a case-by-case basis. Each Non-Executive Director must provide the Board with all relevant information for this purpose.
The Company’s Board Charter sets out guidelines and thresholds of materiality to assist in considering the independence of Directors and has adopted a definition of independence that is based on that set out in the ASX Recommendations.
P O I N T S B E T A N N U A L R E P O R T / 4 3
For
per
sona
l use
onl
y

CORPORATE GOVERNANCE STATEMENT CONTINUEDF O R T H E 1 2 M O N T H S TO 3 0 J U N E 2 0 1 9
The Board considers that PD McCluskey is independent of management and free of any business or other relationship that could materially interfere with, or could reasonably be perceived to materially interfere with, the exercise of their unfettered and independent judgment and is able to fulfil the role of independent Director for the purposes of the ASX Recommendations.
BWF Paton, SJ Swanell, NJ Fahey and AP Symons are not currently considered by the Board to be independent Directors given:�—in the case of SJ Swanell and NJ Fahey, their executive positions and ownership interests in the Company;�—in the case of BWF Paton, his ownership interest in the Company; and�—in the case of AP Symons, his position as Managing Director and majority owner of Clarendon Lawyers, a material service provider
to the Company.
The Board considers that each Director will add significant value given their considerable skills and experience and will bring objective and independent judgement to the Board.
1.5 NON-EXECUTIVE DIRECTOR SELECTION The Board adopts a structured approach to Board selection planning. This process is continuous and the Board regularly evaluates and reviews its selection planning process to ensure the progressive and orderly addition of independence and appropriate skills.
Before a candidate is nominated by the Board, the candidate must confirm that they will have sufficient time to meet their obligations to the Company and that they expect to meet all wagering regulatory approval conditions.
The Company undertakes background and reference checks on candidates including employment, character reference, criminal history, bankruptcy and disqualified company director and officer checks.
In addition, gaming regulators conduct detailed suitability investigations on Non-Executive Director candidates and their families, requiring them to disclose historical and current personal and financial information and submit to interviews.
An election of directors is held each year. Any new Non-Executive Director nominated during the year is known as a Director (Elect) and will stand for election by shareholders at the subsequent AGM.
Shareholders are asked to approve the appointment of the Director (Elect) subject to the receipt of all necessary regulatory pre-approvals. Until the receipt of all necessary regulatory pre-approvals, a Director (Elect) may attend all meetings of the Company but will have no entitlement to vote on any resolutions proposed at any meeting of the Board or any committee.
The Company has appropriate procedures in place to ensure that material information relevant to a decision to elect or re-elect a Non-Executive Director (including whether Directors support the election or re-election), is disclosed in the notice of meeting provided to shareholders.
Non-Executive Director candidates are also invited to address the meeting and provide details of the relevant qualifications, experience and skills they bring to the Board.
1.6 APPOINTMENT TERMS New Non-Executive Directors receive a letter of appointment and a deed of access and indemnity. The letter of appointment outlines the Company’s expectations of Non-Executive Directors with respect to their participation, time commitment and compliance with the Company’s policies and regulatory requirements.
Each senior executive enters into a service contract which sets out the material terms of employment, including a description of position and duties, reporting lines, remuneration arrangements and termination rights and entitlements.
Key contract details of those senior executives who are Key Management Personnel (KMPs) are summarised in the Remuneration Report within this Annual Report.
4 4 / P O I N T S B E T A N N U A L R E P O R T
For
per
sona
l use
onl
y

1.7 INDUCTION AND ONGOING PROFESSIONAL DEVELOPMENT OPPORTUNITIES New Non-Executive Directors joining the Board participate in an induction program (which includes meeting with the Chair and senior executives) and are provided with the Director’s Handbook.
Recognising the importance of providing continuing education, Non-Executive Directors can take part in a range of training and continuing education programs.
Non-Executive Directors also receive regular business briefings at Board meetings on each area of the Company’s business, in particular regarding performance, key issues, risks and strategies for growth in the United States.
In addition, Non-Executive Directors have unfettered access to members of the Executive Leadership Team (ELT) and are encouraged to meet with the ELT to further their knowledge and understanding of the Company’s businesses.
Non-Executive Directors are also encouraged and given the opportunity to broaden their knowledge of the business by visiting offices in different locations.
1.8 ACCESS TO INFORMATION AND INDEPENDENT ADVICE Directors are entitled to the following: �—Unrestricted access to employees and records, subject to law. �—Independent professional advice at the Company’s expense, where reasonable and necessary to fulfil their duties and subject to
prior consultation with the Chairman, and for the Chairman, with the Chair of the Audit, Risk and Compliance Committee.
1.9 THE ROLE OF THE COMPANY SECRETARY The Company Secretary is accountable directly to the Board, through the Chairman, for the proper functioning of the Board and facilitating the Company’s corporate governance processes.
Each Director is entitled to access the advice and services of the Company Secretary. In accordance with the Company’s Constitution, the appointment or removal of the Company Secretary is a matter for the Board as a whole.
Details of the Company Secretary are set out in the Director’s Report within this Annual Report.
2. BOARD COMMITTEESThe Board may from time to time establish committees to streamline the discharge of its responsibilities. The permanent standing committees of the Board are the Audit, Risk and Compliance Committee and the Remuneration and Nomination Committee and the Disclosure Committee.
The Board may also delegate specific functions to ad hoc committees on an “as needs” basis. Directors are entitled to attend Board Committee meetings and receive Board Committee papers, and the Chair of each Board Committee will report back on committee meetings at Board meetings.
A copy of each Committee Charter is available in the Governance section of the Company’s website at https://investors.pointsbet.com.au/.
2.1 AUDIT, RISK AND COMPLIANCE COMMITTEE The Audit, Risk and Compliance Committee comprises three members, all of whom are Non-Executive Directors, and it is chaired by an independent Director who is not the chair of the Board (being PD McCluskey).
However the Audit, Risk and Compliance Committee does not comprise a majority of independent Directors (because only one Director is considered independent). Accordingly, ASX Recommendation 4.1 not been followed.
The Board considers that the two non-independent, Non-Executive Directors on the Audit, Risk and Compliance Committee will each bring the desired mix of skills and qualifications required to effectively assist the Board in matters relating to the Company’s audit, risk and compliance functions.
In particular, the Board considers that BWF Paton will add significant value to the Board given his qualifications and extensive experience in the finance industry. The Board considers that each of BWF Paton and AP Symons will each bring objective and independent judgement to their roles on the Audit, Risk and Compliance Committee.
P O I N T S B E T A N N U A L R E P O R T / 4 5
For
per
sona
l use
onl
y

CORPORATE GOVERNANCE STATEMENT CONTINUEDF O R T H E 1 2 M O N T H S TO 3 0 J U N E 2 0 1 9
The Committee’s key responsibilities and functions are to:�—oversee the preparation of financial statements and reports;�—maintain and continually improve the quality, accuracy and integrity of the Company’s external financial reporting and financial
statements;�—oversee internal and external audit functions;�—oversee the appointment, remuneration, independence and effective performance of the Company’s external auditors;�—oversee the Company’s relationship with its external auditors;�—ensure that the Company applies and maintains appropriate accounting and business policies and procedures;�—oversee the effectiveness of the Company’s legal and regulatory compliance framework, including with respect to wagering laws
and regulations, and conditions associated with the maintenance of the Company’s wagering licences;�—oversee the effectiveness of the Company’s risk management framework and internal controls; and�—manage the process of identification and management of risk.
The Company’s external auditor attends the Annual General Meeting of the Company and is available to answer questions from shareholders about the conduct of the audit and the preparation and content of the Audit Report.
2.2 REMUNERATION AND NOMINATIONS COMMITTEEThe Remuneration and Nomination Committee comprises three Directors, however it does not comprise a majority of independent Directors (only one member, PD McCluskey, is independent) and the chair (AP Symons) is not an independent Director. Accordingly, ASX Recommendations 2.1 and 8.1 have not be followed.
The Board considers that the two non-independent, Non-Executive Directors on the Remuneration and Nomination Committee will each bring the desired mix of skills and qualifications required to effectively assist the Board in matters relating to remuneration and succession planning.
In particular, the Board considers that AP Symons, as chair of the Remuneration and Nomination Committee, will add significant value to the Board given his extensive experience. The Board considers that each of AP Symons and BWF Paton will each bring objective and independent judgment to their roles on the Remuneration and Nomination Committee.
The role of the Committee is to assist and advise the Board on:�—Board succession planning generally;�—succession planning for the Group CEO and other direct reports to the Group CEO;�—continuing professional development programs for Directors;�—the development and implementation of a process for evaluating the performance of the Board, its Committees and Directors;�—the process for recruiting a new Director, including evaluating the balance of skills, knowledge, experience, independence and
diversity on the Board and, in light of this evaluation, preparing a description of the role and capabilities required for a particular appointment; and
�—the appointment and re-election of Directors, with the objective of having a Board of a size and composition conducive to making appropriate decisions, with the benefit of a variety of perspectives and skills and in the best interests of the Company as a whole.
The Committee also assists and advises the Board on remuneration policies and practices for the Board, the Group CEO, senior executives and other persons whose activities, individually or collectively, materially affect the operations of the Company. The Committee also provides recommendations regarding remuneration-related reporting in the Company’s financial statements and remuneration reports.
Non-Committee members, including members of management, may attend meetings of the Committee at the invitation of the Committee Chair.
4 6 / P O I N T S B E T A N N U A L R E P O R T
For
per
sona
l use
onl
y

3. PERFORMANCE EVALUATION AND REMUNERATION
3.1 BOARD PERFORMANCE EVALUATION PROCESS Following listing, the Board will carry out a review of the performance of the Board, its committees, and each Director.
The review will assess, amongst other things: �—The effectiveness of the Board and each committee in meeting the requirements of their Charters; �—Whether the Board and each committee has members with the appropriate mix of skills and experience to properly perform
their functions;�—The contribution made by each Director at meetings and in carrying out their responsibilities as Directors generally, including
preparing for meetings; and �—Whether the content, format and timeliness of agendas, papers and presentations provided to the Board and each committee are
adequate for them to properly perform their functions.
The results and any action plans following the assessment are documented, together with specific performance goals that are agreed by the Board.
Directors are encouraged to raise any issues of concern regarding the performance of any other Director with the Chairman, or if the concern relates to the Chairman, with the Chair of the Audit, Risk and Compliance Committee.
3.2 SENIOR EXECUTIVE PERFORMANCE EVALUATION PROCESS Each year the Board sets financial, operational, management and individual targets for the Group CEO. The Group CEO (in consultation with the Board), in turn sets targets for his direct reports.
Performance against these targets is assessed periodically throughout the year and a formal performance evaluation for senior management is completed for the year end.
Further details are set out in the Remuneration Report contained within the Annual Report. Performance evaluations of the Group CEO and his direct reports took place in the 2018/19 financial year in accordance with the processes described above.
3.3 REMUNERATION Details of the principles and amounts of remuneration of Directors and senior executives who are KMP are set out in the Remuneration Report contained within the Annual Report, which also includes disclosures on equity-based remuneration provided by the Company.
4. RECOGNISING AND MANAGING RISK
4.1 RISK OVERSIGHTThe Board recognises the importance of an effective framework of risk oversight, risk management and internal control for good corporate governance.
As set out in section 2.1 above, the Company has established an Audit, Risk and Compliance Committee which encompasses risk matters.
4.2 ANNUAL RISK REVIEW The Board is responsible for the oversight and management of risk, including the identification of material business risks on an ongoing basis and will be assisted by the Audit, Risk and Compliance Committees where required.
A review of material business risks has been conducted in the current period, which concluded that controls over risk management processes were adequate and effective.
P O I N T S B E T A N N U A L R E P O R T / 4 7
For
per
sona
l use
onl
y

CORPORATE GOVERNANCE STATEMENT CONTINUEDF O R T H E 1 2 M O N T H S TO 3 0 J U N E 2 0 1 9
4.3 INTERNAL AUDIT The Company does not have a formal internal audit function. To ensure compliance with the Company’s published policies and procedures and its legal and regulatory obligations, the Company continually review and refine processes and policies to enhance the effectiveness of the Group’s internal controls.
Any identified control and process issues are formally reported to the Audit, Risk and Compliance Committee and formalised action plans are put in place to address the issues.
4.4 SUSTAINABILITY RISKS The Company has determined there is a level of exposure to economic risk and the impact of economic conditions upon the Company may be either specific, or of a more general nature.
Economic downturns may have an adverse impact on the Company’s operating performance as a result of reduced wagering activity. Other factors include general outlook for economic growth and its impact on confidence.
The Group continues to actively monitor and manage all perceived economic risks to the business through monitoring the financial, economic and industry data available to the Company from internal and external sources.
For further information relating to the Company’s exposure to various financial risks, with explanations as to how this impacts the Company please refer to the Notes to the Consolidated Financial Statements: Risk section.
The Group has no material exposure to environmental sustainability risks.
4.5 MD AND CFO CERTIFICATION OF FINANCIAL STATEMENTS The Managing Director and Chief Financial Officer provide a statement to the Board and Audit, Risk and Compliance Committee in advance of seeking approval of any financial report to the effect that the Company’s risk management and internal compliance and control systems are operating efficiently and effectively in all material respects.
In accordance with the above, the Board has received a written assurance that the declaration provided under section 295A Corporations Act is based on a sound system of internal control and risk management, which is operating effectively in all respects in relation to material business risks and financial reporting.
5. COMMUNICATION WITH SHAREHOLDERS
5.1 PUBLICLY AVAILABLE INFORMATION ACCESSIBLE ON WEBSITE The Company keeps investors informed of its corporate governance, financial performance and prospects via its website, https://investors.pointsbet.com.au/.
5.2 INVESTOR RELATIONS PROGRAMS Through its shareholder communications, the Company aims to provide information that will enable existing and potential shareholders and financial analysts to make informed decisions about the Company’s value.
The Company will conduct regular market briefings including interim and full year results presentations, investor roadshows, and also attends industry conferences in order to facilitate communication with investors and other stakeholders.
All presentation material is provided to the ASX prior to these events and subsequently uploaded to the Company’s website ensure that all shareholders have timely access to information.
The Investor centre, located on the Company’s website also provides important information regarding compliance and corporate governance. The Group aims to ensure that all shareholders are well informed of all major developments affecting the Company through its ongoing commitment to continuous disclosure obligations.
4 8 / P O I N T S B E T A N N U A L R E P O R T
For
per
sona
l use
onl
y
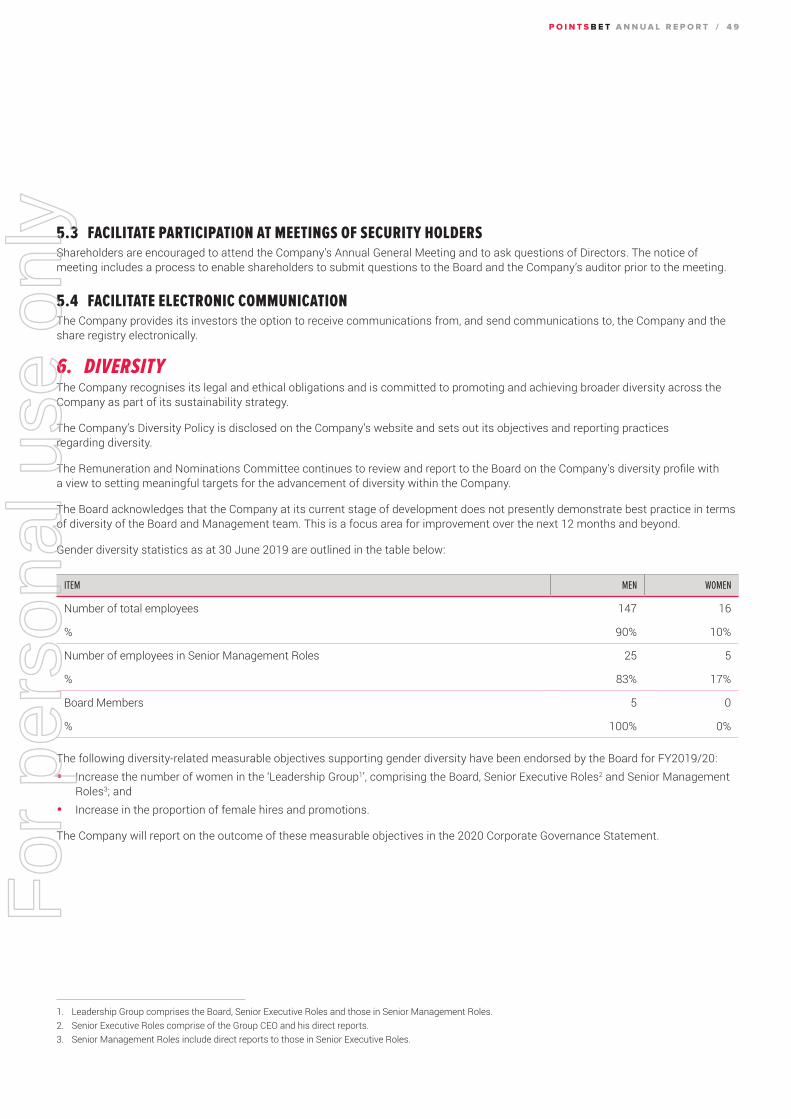
5.3 FACILITATE PARTICIPATION AT MEETINGS OF SECURITY HOLDERSShareholders are encouraged to attend the Company’s Annual General Meeting and to ask questions of Directors. The notice of meeting includes a process to enable shareholders to submit questions to the Board and the Company’s auditor prior to the meeting.
5.4 FACILITATE ELECTRONIC COMMUNICATION The Company provides its investors the option to receive communications from, and send communications to, the Company and the share registry electronically.
6. DIVERSITYThe Company recognises its legal and ethical obligations and is committed to promoting and achieving broader diversity across the Company as part of its sustainability strategy.
The Company’s Diversity Policy is disclosed on the Company’s website and sets out its objectives and reporting practices regarding diversity.
The Remuneration and Nominations Committee continues to review and report to the Board on the Company’s diversity profile with a view to setting meaningful targets for the advancement of diversity within the Company.
The Board acknowledges that the Company at its current stage of development does not presently demonstrate best practice in terms of diversity of the Board and Management team. This is a focus area for improvement over the next 12 months and beyond.
Gender diversity statistics as at 30 June 2019 are outlined in the table below:
ITEM MEN WOMEN
Number of total employees 147 16
% 90% 10%
Number of employees in Senior Management Roles 25 5
% 83% 17%
Board Members 5 0
% 100% 0%
The following diversity-related measurable objectives supporting gender diversity have been endorsed by the Board for FY2019/20: �—Increase the number of women in the ‘Leadership Group1’, comprising the Board, Senior Executive Roles2 and Senior Management
Roles3; and�—Increase in the proportion of female hires and promotions.
The Company will report on the outcome of these measurable objectives in the 2020 Corporate Governance Statement.
1. Leadership Group comprises the Board, Senior Executive Roles and those in Senior Management Roles.2. Senior Executive Roles comprise of the Group CEO and his direct reports. 3. Senior Management Roles include direct reports to those in Senior Executive Roles.
P O I N T S B E T A N N U A L R E P O R T / 4 9
For
per
sona
l use
onl
y
CORPORATE GOVERNANCE STATEMENT CONTINUEDF O R T H E 1 2 M O N T H S TO 3 0 J U N E 2 0 1 9
7. GOVERNANCE POLICIES Details of the Company’s Governance Policies are summarised below.
These Policies are available in the Governance section of the Company’s website, https://investors.pointsbet.com.au/.
7.1 CONTINUOUS DISCLOSURE POLICYThe Company has adopted a Continuous Disclosure Policy and a Communications Policy and established a Disclosure Committee (comprising the Chair of the Board, Group CEO, Group CFO and Company Secretary or their delegates) to ensure compliance with these requirements.
The Continuous Disclosure Policy applies to all Directors, officers, employees and consultants of the Company.
7.2 COMMUNICATION WITH SHAREHOLDERSThe Company aims to communicate all important information relating to the Company to its Shareholders. Additionally, the Company recognises that potential investors and other interested stakeholders may wish to obtain information about the Company from time to time.
To achieve this, the Company communicates information regularly to Shareholders and other stakeholders through a range of forums and publications, including the Company website, at the annual general meeting, through the Company’s Annual Report and ASX announcements.
7.3 SECURITIES DEALING POLICYThe Company has adopted a Securities Dealing Policy which is intended to explain the types of conduct in dealings in securities that are prohibited under the Corporations Act and explain the Company’s policy and procedure for the buying and selling of securities that protects the Company, Directors and employees against the misuse of unpublished information which could materially affect the price or value of securities.
The policy applies to Directors, officers, senior management and other employees, consultants and contractors of the Company.
7.4 CODE OF CONDUCTThe Board has adopted a formal Code of Conduct which outlines how the Company expects its representatives to behave and conduct business in the workplace and includes legal compliance and guidelines on appropriate ethical standards.
All employees of the Company (including temporary employees, contractors, Company Directors, officers, consultants and other persons that act on behalf of the Company) must comply with the Code of Conduct.
The objective of the Code of Conduct is to:�—provide a benchmark for professional behaviour throughout the Company;�—support the Company’s business reputation and corporate image within the community; and�—make Directors and employees aware of the consequences if they breach the policy.
7.5 DIVERSITY POLICYThe Board has formally adopted a Diversity Policy, which sets out the Company’s vision for diversity, incorporating a number of different factors including gender, ethnicity, age and educational experience.
The Diversity Policy has been approved in order to actively facilitate a more diverse and representative management and leadership structure.
The Board will include in its annual report each year a summary of the Company’s progress towards achieving the measurable objectives set under the Diversity Policy and the Company’s most recent “Gender Equality Indicators” as defined by the Workplace Gender Equality Act 2012 (Cth) (the Act) or, where the Company is not required to comply with the Act, the proportion of women employees, senior executives and Board members.
5 0 / P O I N T S B E T A N N U A L R E P O R T
For
per
sona
l use
onl
y

7.6 WHISTLEBLOWER POLICY The Company has adopted a Whistleblower Policy which encourages, supports and promotes honest and ethical behaviour by providing a framework for the escalation of ‘reportable conduct’. This includes conduct that is any one or more of the following: dishonest, fraudulent, corrupt, illegal, in breach of local laws, unethical, an unsafe work practice or a repeated breach of Company policy or procedure (including breaches of the Code of Conduct).
7.7 ANTI-BRIBERY AND ANTI-CORRUPTION POLICY The Company has adopted a Anti-bribery and Anti-Corruption Policy. This policy is designed to bring awareness to all employees, directors, officers, contractors and consultants that certain types of payments may constitute corruption, an illegal benefit or an act of bribery and that any such payments are prohibited.
The Company applies a “zero tolerance” approach to acts of bribery and corruption.
P O I N T S B E T A N N U A L R E P O R T / 5 1
For
per
sona
l use
onl
y

FINANCIAL REPORT3 0 J U N E 2 0 1 9
FINANCIAL STATEMENTS
Consolidated Statement of Profit or Loss and Other Comprehensive Income 53Consolidated Statement of Financial Position 54Consolidated Statement of Changes in Equity 55Consolidated Statement of Cash Flows 56Notes to the Consolidated Financial Statements 57Directors’ declaration 103
These financial statements are the consolidated financial statements for the group consisting of PointsBet Holdings Limited and its subsidiaries. A list of subsidiaries is included in note 30. The financial statements are presented in the Australian dollar ($).
PointsBet Holdings Limited is a company limited by shares, incorporated and domiciled in Australia. Its registered office and principal place of business is:
PointsBet Holdings LimitedLevel 2, 165 Cremorne StreetCremorne VIC 3121
The financial statements were authorised for issue by the directors on 28 August 2019. The directors have the power to amend and reissue the financial statements.
5 2 / P O I N T S B E T A N N U A L R E P O R T
For
per
sona
l use
onl
y

CONSOLIDATED STATEMENT OF PROFIT OR LOSS AND OTHER COMPREHENSIVE INCOMEF O R T H E Y E A R E N D E D 3 0 J U N E 2 0 1 9
NOTES2019
$2018
$
Continuing operations
Revenue 6 25,615,267 9,381,959
Cost of sales (14,760,922) (4,322,912)
Gross profit 10,854,345 5,059,047
(Other expense)/other income 7(a) (196,649) 442,640
Expenses
Depreciation and amortisation 8 (1,824,619) (359,862)
Marketing expenses (24,918,806) (6,188,451)
Occupancy expenses (823,390) (236,171)
Administration expenses (2,382,144) (415,534)
Other expenses (325,410) (62,600)
Consulting expenses (801,303) (14,866)
Information technology costs (1,938,956) (260,825)
Fees and permits (89,346) (27,906)
Employee benefits expenses 8 (15,649,511) (4,445,798)
Travel and accommodation expenses (897,627) (175,863)
Total Expenses (49,651,112) (12,187,876)
Finance income 7(b) 122,456 28,654
Finance expenses 7(b) (3,014,190) (47)
Finance (costs)/income – net (2,891,734) 28,607
Loss before income tax (41,885,150) (6,657,582)
Income tax expense 9 – –
Loss for the year (41,885,150) (6,657,582)
Other comprehensive income
Exchange differences on translation of foreign operations 25(a) 137,554 –
Total comprehensive loss for the year (41,747,596) (6,657,582)
Loss for the year is attributable to:
Owners of PointsBet Holdings Limited (41,885,150) (6,657,582)
Total comprehensive loss for the year is attributable to:
Owners of PointsBet Holdings Limited (41,747,596) (6,657,582)
Cents Cents
Earnings per share for loss attributable to the owners of PointsBet Holdings Limited:
Basic and Diluted earnings per share 33 (72.1) (15.6)
The above Consolidated Statement of Profit or Loss and Other Comprehensive Income should be read in conjunction with the accompanying notes.
P O I N T S B E T A N N U A L R E P O R T / 5 3
For
per
sona
l use
onl
y

CONSOLIDATED STATEMENT OFFINANCIAL POSITIONA S AT 3 0 J U N E 2 0 1 9
NOTES2019
$2018
$
ASSETS
Current assets
Cash and cash equivalents 10 75,885,880 7,540,201
Trade and other receivables 11 495,360 125,585
Other current assets 12 767,241 646,996
Total current assets 77,148,481 8,312,782
Non-current assets
Financial assets at amortised cost 13(a) 213,004 206,400
Plant and equipment 14 1,836,065 236,987
Intangible assets 15 14,783,989 2,191,508
Other non-current assets 17 559,354 92,909
Total non-current assets 17,392,412 2,727,804
Total assets 94,540,893 11,040,586
LIABILITIES
Current liabilities
Trade and other payables 18 9,623,355 2,395,576
Employee benefit obligations 20 622,134 210,738
Provisions 21 247,283 90,797
Other financial liabilities 22 861,963 321,338
Other current liabilities 23 8,591,300 3,628,660
Total current liabilities 19,946,035 6,647,109
Non-current liabilities
Employee benefit obligations 20 88,137 –
Total non-current liabilities 88,137 –
Total liabilities 20,034,172 6,647,109
Net assets 74,506,721 4,393,477
EQUITY
Share capital 24 124,641,045 14,329,174
Other reserves 25(a) 1,884,931 198,408
Accumulated losses 25(b) (52,019,255) (10,134,105)
Total equity 74,506,721 4,393,477
The above Consolidated Statement of Financial Position should be read in conjunction with the accompanying notes.
5 4 / P O I N T S B E T A N N U A L R E P O R T
For
per
sona
l use
onl
y

CONSOLIDATED STATEMENT OFCHANGES IN EQUITYF O R T H E Y E A R E N D E D 3 0 J U N E 2 0 1 9
ATTRIBUTABLE TO OWNERS OF POINTSBET HOLDINGS LIMITED
NOTESSHARE CAPITAL
$OTHER RESERVES
$ACCUMULATED LOSSES
$
TOTAL EQUITY
$
Balance at 1 July 2017 5,829,018 9,066 (3,476,523) 2,361,561
Loss for the year – – (6,657,582) (6,657,582)
Other comprehensive income – – – –
Total comprehensive loss for the year – – (6,657,582) (6,657,582)
Transactions with owners in their capacity as owners:
Capital raising 3,750,005 – – 3,750,005
Capital raising 3,750,060 – – 3,750,060
Share based payments for services 1,000,091 – – 1,000,091
Share options issue 25(a) – 189,342 – 189,342
Total for the year 8,500,156 189,342 – 8,689,498
Balance at 30 June 2018 14,329,174 198,408 (10,134,105) 4,393,477
Balance at 1 July 2018 14,329,174 198,408 (10,134,105) 4,393,477
Loss for the year – – (41,885,150) (41,885,150)
Other comprehensive income 25(a) – 137,554 – 137,554
Total comprehensive income/(loss) for the year – 137,554 (41,885,150) (41,747,596)
Transactions with owners in their capacity as owners:
Exercise of options 24 1,411,360 – – 1,411,360
Conversion of convertible notes to equity 24 26,974,876 – – 26,974,876
Capital raising 24 10,395,136 – – 10,395,136
Exercise of options 24 35,847 – – 35,847
IPO Capital raising 24 75,000,000 – – 75,000,000
Less: Share issue costs 24 (3,505,348) – – (3,505,348)
Share options issue 25(a) – 1,548,969 – 1,548,969
Total for the year 110,311,871 1,548,969 – 111,860,840
Balance at 30 June 2019 124,641,045 1,884,931 (52,019,255) 74,506,721
The above Consolidated Statement of Changes in Equity should be read in conjunction with the accompanying notes.
P O I N T S B E T A N N U A L R E P O R T / 5 5
For
per
sona
l use
onl
y
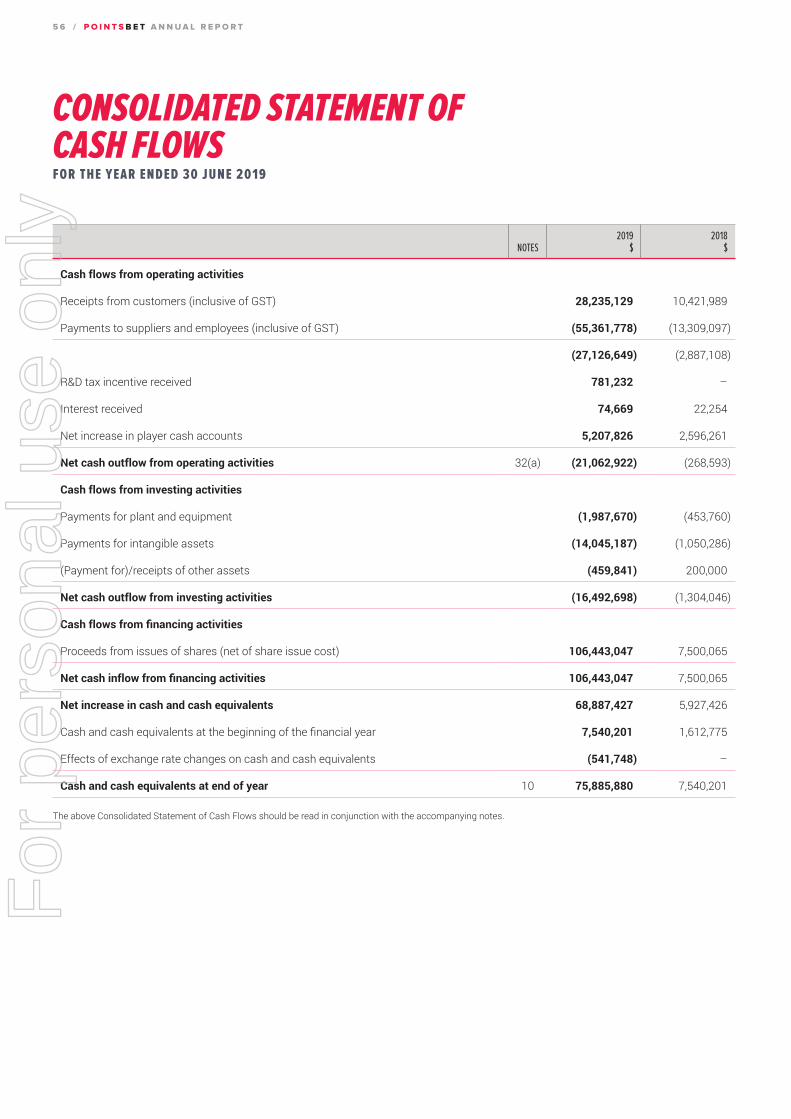
CONSOLIDATED STATEMENT OFCASH FLOWSF O R T H E Y E A R E N D E D 3 0 J U N E 2 0 1 9
NOTES2019
$2018
$
Cash flows from operating activities
Receipts from customers (inclusive of GST) 28,235,129 10,421,989
Payments to suppliers and employees (inclusive of GST) (55,361,778) (13,309,097)
(27,126,649) (2,887,108)
R&D tax incentive received 781,232 –
Interest received 74,669 22,254
Net increase in player cash accounts 5,207,826 2,596,261
Net cash outflow from operating activities 32(a) (21,062,922) (268,593)
Cash flows from investing activities
Payments for plant and equipment (1,987,670) (453,760)
Payments for intangible assets (14,045,187) (1,050,286)
(Payment for)/receipts of other assets (459,841) 200,000
Net cash outflow from investing activities (16,492,698) (1,304,046)
Cash flows from financing activities
Proceeds from issues of shares (net of share issue cost) 106,443,047 7,500,065
Net cash inflow from financing activities 106,443,047 7,500,065
Net increase in cash and cash equivalents 68,887,427 5,927,426
Cash and cash equivalents at the beginning of the financial year 7,540,201 1,612,775
Effects of exchange rate changes on cash and cash equivalents (541,748) –
Cash and cash equivalents at end of year 10 75,885,880 7,540,201
The above Consolidated Statement of Cash Flows should be read in conjunction with the accompanying notes.
5 6 / P O I N T S B E T A N N U A L R E P O R T
For
per
sona
l use
onl
y

NOTES TO THE FINANCIAL STATEMENTS3 0 J U N E 2 0 1 9
CONTENTS OF THE NOTES TO THE CONSOLIDATED FINANCIAL STATEMENTS
1. Summary of significant accounting policies 582. Changes in accounting policies 693. Financial risk management 704. Critical estimates, judgements and assumptions 765. Segment information 776. Revenue 807. (Other expense)/other income items 808. Expenses 819. Income tax expense 8110. Cash and cash equivalents 8211. Trade and other receivables 8312. Other current assets 8313. Financial assets at amortised cost 8414. Plant and equipment 8515. Intangible assets 8616. Deferred tax assets 8717. Other non-current assets 8718. Trade and other payables 8819. Borrowings 8820. Employee benefit obligations 8821. Provisions 8922. Other financial liabilities 8923. Other current liabilities 9024. Contributed equity 9025. Reserves and accumulated losses 9126. Remuneration of auditors 9227. Contingent liabilities and contingent assets 9228. Commitments 9329. Related party transactions 9430. Interests in other entities 9531. Events occurring after the reporting period 9532. Cash flow information 9633. Earnings per share 9634. Share-based payments 9835. Parent entity financial information 101
P O I N T S B E T A N N U A L R E P O R T / 5 7
For
per
sona
l use
onl
y
NOTES TO THE FINANCIAL STATEMENTS CONTINUED3 0 J U N E 2 0 1 9
1. SUMMARY OF SIGNIFICANT ACCOUNTING POLICIESThis note provides a list of the significant accounting policies adopted in the preparation of these consolidated financial statements to the extent they have not already been disclosed in the other notes below. These policies have been consistently applied to all the years presented, unless otherwise stated. The financial statements are for the group consisting of PointsBet Holdings Limited and its subsidiaries.
(A) BASIS OF PREPARATIONThese general purpose financial statements have been prepared in accordance with Australian Accounting Standards and Interpretations issued by the Australian Accounting Standards Board and the Corporations Act 2001. PointsBet Holdings Limited is a for-profit entity for the purpose of preparing the financial statements.
(i) Compliance with IFRSThe consolidated financial statements of the PointsBet Holdings Limited group also comply with International Financial Reporting Standards (IFRS) as issued by the International Accounting Standards Board (IASB).
(ii) Historical cost conventionThe financial statements have been prepared on a historical cost basis, except for the following:
�—certain financial assets and liabilities held at fair value through profit or loss (including derivative instruments) �—certain classes of plant and equipment – measured at fair value
(iii) New and amended standards adopted by the groupThe group has applied the following standards and amendments for first time in their annual reporting period commencing 1 July 2018:�—AASB 9 Financial Instruments�—AASB 15 Revenue from Contracts with Customers
The group had to change its accounting policies and make certain retrospective adjustments following the adoption of AASB 9 and AASB 15. This is disclosed in note 2.
(iv) New standards and interpretations not yet adoptedCertain new accounting standards and interpretations have been published that are not mandatory for 30 June 2019 reporting periods and have not been early adopted by the group. The group’s assessment of the impact of these new standards and interpretations is set out below.�—AASB 16 Leases
This standard is applicable to annual reporting periods beginning on or after 1 January 2019. The standard replaces AASB 117 ‘Leases’ and for lessees will eliminate the classifications of operating leases and finance leases.
Subject to exceptions, a ‘right-of-use’ asset will be capitalised in the statement of financial position, measured at the present value of the unavoidable future lease payments to be made over the lease term.
The exceptions relate to short-term leases of 12 months or less and leases of low-value assets (such as personal computers and small office furniture) where an accounting policy choice exists whereby either a ‘right-of-use’ asset is recognised or lease payments are expensed to profit or loss as incurred.
A liability corresponding to the capitalised lease will also be recognised, adjusted for lease prepayments, lease incentives received, initial direct costs incurred and an estimate of any future restoration, removal or dismantling costs.
Straight-line operating lease expense recognition will be replaced with a depreciation charge for the leased asset (included in operating costs) and an interest expense on the recognised lease liability (included in finance costs).
In the earlier periods of the lease, the expenses associated with the lease under AASB 16 will be higher when compared to lease expenses under AASB 117.
5 8 / P O I N T S B E T A N N U A L R E P O R T
For
per
sona
l use
onl
y

However EBITDA (Earnings Before Interest, Tax, Depreciation and Amortisation) results will be improved as the operating expense is replaced by interest expense and depreciation in profit or loss under AASB 16.
For classification within the Consolidated Statement of Cash Flows, the lease payments will be separated into both a principal (financing activities) and interest (either operating or financing activities) component.
For lessor accounting, the standard does not substantially change how a lessor accounts for leases.
The consolidated entity will adopt this standard from 1 July 2019 and its impact on adoption is expected to result in total assets increasing by $1,859,682, total liabilities increasing by $1,859,682 and with no change in net assets.
There are no other standards that are not yet effective and that would be expected to have a material impact on the entity in the current or future reporting years and on foreseeable future transactions.
(B) PRINCIPLES OF CONSOLIDATION AND EQUITY ACCOUNTING
(i) SubsidiariesSubsidiaries are all entities over which the group has control. The group controls an entity when the group is exposed to, or has rights to, variable returns from its involvement with the entity and has the ability to affect those returns through its power to direct the activities of the entity. Subsidiaries are fully consolidated from the date on which control is transferred to the group. They are deconsolidated from the date that control ceases.
The pooling interest method of accounting is used to account for business combinations by the group (refer to note 1(e)).
Intercompany transactions, balances and unrealised gains on transactions between group companies are eliminated. Unrealised losses are also eliminated unless the transaction provides evidence of an impairment of the transferred asset. Accounting policies of subsidiaries have been changed where necessary to ensure consistency with the policies adopted by the group.
Non-controlling interests in the results and equity of subsidiaries are shown separately in the Consolidated Statement of Profit or Loss and Other Comprehensive Income, Consolidated Statement of Changes in Equity and Consolidated Statement of Financial Position respectively.
(C) SEGMENT REPORTINGOperating segments are reported in a manner consistent with the internal management reports that have been provided to and reviewed by the Chief Executive Officer, who is identified as the Chief Operating Decision Maker (CODM) in assessing performance and in determining the allocation of resources. There is no aggregation of operating segments.
(D) FOREIGN CURRENCY TRANSLATION
(i) Functional and presentation currencyItems included in the financial statements of each of the group’s entities are measured using the currency of the primary economic environment in which the entity operates (‘the functional currency’). The consolidated financial statements are presented in Australian dollars ($), which is PointsBet Holdings Limited’s functional and presentation currency.
(ii) Transactions and balancesForeign currency transactions are translated into the functional currency using the exchange rates at the dates of the transactions. Foreign exchange gains and losses resulting from the settlement of such transactions and from the translation of monetary assets and liabilities denominated in foreign currencies at year end exchange rates are generally recognised in profit or loss. They are deferred in equity if they relate to qualifying cash flow hedges and qualifying net investment hedges or are attributable to part of the net investment in a foreign operation.
Foreign exchange gains and losses that relate to borrowings are presented in the Consolidated Statement of Profit or Loss, within finance costs. All other foreign exchange gains and losses are presented in the Consolidated Statement of Profit or Loss on a net basis within other income/(expenses).
P O I N T S B E T A N N U A L R E P O R T / 5 9
For
per
sona
l use
onl
y
NOTES TO THE FINANCIAL STATEMENTS CONTINUED3 0 J U N E 2 0 1 9
Non-monetary items that are measured at fair value in a foreign currency are translated using the exchange rates at the date when the fair value was determined. Translation differences on assets and liabilities carried at fair value are reported as part of the fair value gain or loss. For example, translation differences on non-monetary assets and liabilities such as equities held at fair value through profit or loss are recognised in profit or loss as part of the fair value gain or loss and translation differences on non-monetary assets such as equities classified as at fair value through other comprehensive income are recognised in other comprehensive income.
(iii) Group companiesThe results and financial position of foreign operations (none of which has the currency of a hyperinflationary economy) that have a functional currency different from the presentation currency are translated into the presentation currency as follows:�—assets and liabilities for each Consolidated Statement of Financial Position presented are translated at the closing rate at the date
of that Consolidated Statement of Financial Position;�—income and expenses for Consolidated Statement of Profit or Loss and Other Comprehensive Income are translated at average
exchange rates (unless this is not a reasonable approximation of the cumulative effect of the rates prevailing on the transaction dates, in which case income and expenses are translated at the dates of the transactions); and
�—all resulting exchange differences are recognised in other comprehensive income.
On consolidation, exchange differences arising from the translation of any net investment in foreign entities, and of borrowings and other financial instruments designated as hedges of such investments, are recognised in other comprehensive income. When a foreign operation is sold or any borrowings forming part of the net investment are repaid, the associated exchange differences are reclassified to profit or loss, as part of the gain or loss on sale.
Goodwill and fair value adjustments arising on the acquisition of a foreign operation are treated as assets and liabilities of the foreign operation and translated at the closing rate.
(E) BUSINESS COMBINATIONS UNDER COMMON CONTROL – POOLING OF INTERESTOn 28 September 2017, PointsBet Holdings Ltd (initially as a proprietary company and subsequently converted to a public company), a newly formed entity, issued shares exclusively to the existing shareholders of PointsBet Australia Pty Ltd and PointsBet Pty Ltd, so that the total number of shares they each held in the PointsBet business was unchanged. Immediately upon this share issue, all shares in PointsBet Australia Pty Ltd and PointsBet Pty Ltd were transferred to PointsBet Holdings Ltd for no consideration; and the shareholders entered into a new shareholder agreement, to ensure they retained their shared, collective control over the combined entity.
Therefore these group financial statements combine those of PointsBet Holdings Ltd and the commonly controlled entities as at 30 June 2019. Refer to note 30 for entities considered to be under common control.
All entities have a reporting date of 30 June.
The Pooling of Interest method has been adopted to account for the combination as a business combination carried out under common control. This means the assets and liabilities of the entities coming under common control have been transferred to the financial statements of PointsBet Holdings Ltd a book value without revaluation. There has been no consideration paid by PointsBet Holdings Ltd to acquire any of the entities therefore the value of the combined assets is represented as an entry directly to equity with no impact on the Consolidated Statement of Profit or Loss and Other Comprehensive Income, and no goodwill is recognised.
Intercompany transactions, balances and realised gains on transactions between entities in the group are eliminated. Unrealised losses are also eliminated unless the transaction provides evidence of the impairment of the asset transferred. Accounting policies of subsidiaries have been changed where necessary to ensure consistency with the policies adopted by the group.
(D) FOREIGN CURRENCY TRANSLATION (CONTINUED)
6 0 / P O I N T S B E T A N N U A L R E P O R T
For
per
sona
l use
onl
y
(F) REVENUE RECOGNITIONThe group recognises revenue when the amount of revenue can be reliably measured, it is probable that future economic benefits will flow to the entity and specific criteria have been met for each of the group’s activities as described below. The group bases its estimates on historical results, taking into consideration the type of customer, the type of transaction and the specifics of each arrangement.
Revenue is recognised for the major business activities using the methods outlined below.
Betting activities revenueThe group reports the gains and losses on all betting activities as revenue, which is measured at the fair value of the consideration received or receivable from customers less free bets, promotions, bonuses and other fair value adjustments. Revenue includes free bets, promotions and bonuses. Open betting positions (pending bets) are accounted for as derivative financial instruments and are carried at fair value. Gains and losses arising on the positions are recognised in revenue.
All revenue is stated net of the amount of goods and services tax.
R&D Tax IncentiveGrants that compensate the group for expenditures incurred are recognised in profit or loss on a systematic basis in the periods in which the expenditures are recognised. R&D tax offset receivables will be recognised in profit before tax and depreciation and amortisation over the periods necessary to match the benefit of the credit with the costs for which it is intended to compensate. Such periods will depend on whether the R&D costs are capitalised or expensed as incurred.
For R&D costs that have been capitalised, the grants related to those assets have been deferred and will be recognised over the useful economic life of asset.
(G) INCOME TAXThe income tax expense or credit for the year is the tax payable on the current year’s taxable income based on the applicable income tax rate for each jurisdiction adjusted by changes in deferred tax assets and liabilities attributable to temporary differences and to unused tax losses.
The current income tax charge is calculated on the basis of the tax laws enacted or substantively enacted at the end of the reporting year in the countries where the company and its subsidiaries and associates operate and generate taxable income. Management periodically evaluates positions taken in tax returns with respect to situations in which applicable tax regulation is subject to interpretation. It establishes provisions where appropriate on the basis of amounts expected to be paid to the tax authorities.
Deferred income tax is provided in full, using the liability method, on temporary differences arising between the tax bases of assets and liabilities and their carrying amounts in the consolidated financial statements. However, deferred tax liabilities are not recognised if they arise from the initial recognition of goodwill. Deferred income tax is also not accounted for if it arises from initial recognition of an asset or liability in a transaction other than a business combination that at the time of the transaction affects neither accounting nor taxable profit or loss. Deferred income tax is determined using tax rates (and laws) that have been enacted or substantially enacted by the end of the reporting year and are expected to apply when the related deferred income tax asset is realised or the deferred income tax liability is settled.
Deferred tax assets are recognised only if it is probable that future taxable amounts will be available to utilise those temporary differences and losses.
Deferred tax liabilities and assets are not recognised for temporary differences between the carrying amount and tax bases of investments in foreign operations where the company is able to control the timing of the reversal of the temporary differences and it is probable that the differences will not reverse in the foreseeable future.
Deferred tax assets and liabilities are offset when there is a legally enforceable right to offset current tax assets and liabilities and when the deferred tax balances relate to the same taxation authority. Current tax assets and tax liabilities are offset where the entity has a legally enforceable right to offset and intends either to settle on a net basis, or to realise the asset and settle the liability simultaneously.
Current and deferred tax is recognised in profit or loss, except to the extent that it relates to items recognised in other comprehensive income or directly in equity. In this case, the tax is also recognised in other comprehensive income or directly in equity, respectively.
P O I N T S B E T A N N U A L R E P O R T / 6 1
For
per
sona
l use
onl
y
NOTES TO THE FINANCIAL STATEMENTS CONTINUED3 0 J U N E 2 0 1 9
(H) CURRENT AND NON-CURRENT CLASSIFICATIONAssets and liabilities are presented in the Consolidated Statement of Financial Position based on current and non-current classification.
An asset is classified as current when: it is either expected to be realised or intended to be sold or consumed in the group’s normal operating cycle; it is held primarily for the purpose of trading; it is expected to be realised within 12 months after the reporting period; or the asset is cash or cash equivalent unless restricted from being exchanged or used to settle a liability for at least 12 months after the reporting period. All other assets are classified as non-current.
A liability is classified as current when: it is either expected to be settled in the group’s normal operating cycle; it is held primarily for the purpose of trading; it is due to be settled within 12 months after the reporting period; or there is no unconditional right to defer the settlement of the liability for at least 12 months after the reporting period. All other liabilities are classified as non-current.
Deferred tax assets and liabilities are always classified as non-current.
(I) LEASESLeases of plant and equipment where the group, as lessee, has substantially all the risks and rewards of ownership are classified as finance leases. Finance leases are capitalised at the lease’s inception at the fair value of the leased property or, if lower, the present value of the minimum lease payments. The corresponding rental obligations, net of finance costs, are included in other short-term and long-term payables. Each lease payment is allocated between the liability and finance cost. The finance cost is charged to profit or loss over the lease year so as to produce a constant periodic rate of interest on the remaining balance of the liability for each year. The plant and equipment acquired under finance leases is depreciated over the asset’s useful life or over the shorter of the asset’s useful life and the lease term if there is no reasonable certainty that the group will obtain ownership at the end of the lease term.
Leases in which a significant portion of the risks and rewards of ownership are not transferred to the group as lessee are classified as operating leases (note 28). Payments made under operating leases (net of any incentives received from the lessor) are charged to profit or loss on a straight-line basis over the period of the lease.
Lease income from operating leases where the group is a lessor is recognised in income on a straight-line basis over the lease term. The respective leased assets are included in the Consolidated Statement of Financial Position based on their nature.
(J) IMPAIRMENT OF ASSETSNon-financial assets are tested for impairment whenever events or changes in circumstances indicate that the carrying amount may not be recoverable. An impairment loss is recognised for the amount by which the asset’s carrying amount exceeds its recoverable amount. The recoverable amount is the higher of an asset’s fair value less costs of disposal and value in use. For the purposes of assessing impairment, assets are grouped at the lowest levels for which there are separately identifiable cash inflows which are largely independent of the cash inflows from other assets or groups of assets (cash-generating units). Non-financial assets other than goodwill that suffered an impairment are reviewed for possible reversal of the impairment at the end of each reporting year.
(K) CASH AND CASH EQUIVALENTSFor the purpose of presentation in the Consolidated Statement of Cash Flows, cash and cash equivalents includes cash on hand, deposits held at call with financial institutions, other short-term, highly liquid investments with original maturities of three months or less that are readily convertible to known amounts of cash and which are subject to an insignificant risk of changes in value.
(L) TRADE AND OTHER RECEIVABLESTrade receivables are recognised initially at fair value and subsequently measured at amortised cost using the effective interest method, less loss allowance. See note 11 for further information about the group’s accounting for trade receivables and note 3(b) for a description of the group’s impairment policies.
Other receivables are recognised at amortised cost, less any loss allowance.
6 2 / P O I N T S B E T A N N U A L R E P O R T
For
per
sona
l use
onl
y

(M) FINANCIAL ASSETS
(i) ClassificationFrom 1 July 2019, the group classifies its financial assets in the following measurement categories:�—those to be measured subsequently at fair value (either through other comprehensive income or through profit or loss); and�—those to be measured at amortised cost.
The classification depends on the entity’s business model for managing the financial assets and the contractual terms of the cash flows.
The classification depends on the purpose for which the investments were acquired. Management determines the classification of its investments at initial recognition and, in the case of assets classified as held-to-maturity, re-evaluates this designation at the end of each reporting period.
(ii) Recognition and derecognitionRegular way purchases and sales of financial assets are recognised on trade-date, the date on which the group commits to purchase or sell the asset. Financial assets are derecognised when the rights to receive cash flows from the financial assets have expired or have been transferred and the group has transferred substantially all the risks and rewards of ownership.
(iii) MeasurementAt initial recognition, the group measures a financial asset at its fair value plus, in the case of a financial asset not at fair value through profit or loss (FVPL), transaction costs that are directly attributable to the acquisition of the financial asset. Transaction costs of financial assets carried at FVPL are expensed in profit or loss.
Debt instrumentsSubsequent measurement of debt instruments depends on the group’s business model for managing the asset and the cash flow characteristics of the asset. The group classifies its debt instruments into the following measurement category:�—Amortised cost: Assets that are held for collection of contractual cash flows where those cash flows represent solely payments of
principal and interest are measured at amortised cost. Interest income from these financial assets is included in finance income using the effective interest rate method. Any gain or loss arising on derecognition is recognised directly in profit or loss and presented in other gains/(losses) together with foreign exchange gains and losses. Impairment losses are presented as separate line item in the Consolidated Statement of Profit or Loss and Other Comprehensive Income.
(iv) ImpairmentFor trade receivables, the group applies the simplified approach permitted by AASB 9 Financial Instruments, which requires expected lifetime losses to be recognised from initial recognition of the receivables, see note 3(b) for further details.
(v) Accounting policies applied until 30 June 2018The group has applied AASB 9 retrospectively, but has elected not to restate comparative information. As a result, the comparative information provided continues to be accounted for in accordance with the group’s previous accounting policy.
ClassificationUntil 30 June 2018, the group classified its financial assets in the following categories:�—financial assets at fair value through profit or loss,�—loans and receivables,�—held-to-maturity investments, and�—available-for-sale financial assets.
The classification depended on the purpose for which the investments were acquired. Management determined the classification of its investments at initial recognition and, in the case of assets classified as held-to-maturity, re-evaluated this designation at the end of each reporting year.
P O I N T S B E T A N N U A L R E P O R T / 6 3
For
per
sona
l use
onl
y

NOTES TO THE FINANCIAL STATEMENTS CONTINUED3 0 J U N E 2 0 1 9
ReclassificationThe group could choose to reclassify a non-derivative trading financial asset out of the held for trading category if the financial asset was no longer held for the purpose of selling it in the near term. Financial assets other than loans and receivables were permitted to be reclassified out of the held for trading category only in rare circumstances arising from a single event that was unusual and highly unlikely to recur in the near term. In addition, the group could choose to reclassify financial assets that would meet the definition of loans and receivables out of the held for trading or available-for-sale categories if the group had the intention and ability to hold these financial assets for the foreseeable future or until maturity at the date of reclassification.
Reclassifications were made at fair value as of the reclassification date. Fair value became the new cost or amortised cost as applicable, and no reversals of fair value gains or losses recorded before reclassification date were subsequently made. Effective interest rates for financial assets reclassified to loans and receivables and held-to-maturity categories were determined at the reclassification date. Further increases in estimates of cash flows adjust effective interest rates prospectively.
Subsequent measurementThe measurement at initial recognition did not change on adoption of AASB 9, see description above.
Subsequent to the initial recognition, loans and receivables and held-to-maturity investments were carried at amortised cost using the effective interest method.
Available-for-sale financial assets and financial assets at FVPL were subsequently carried at fair value. Gains or losses arising from changes in the fair value were recognised as follows:�—for financial assets at FVPL – in profit or loss within other gains/(losses)
ImpairmentThe group assessed at the end of each reporting year whether there was objective evidence that a financial asset or group of financial assets was impaired. A financial asset or a group of financial assets was impaired and impairment losses were incurred only if there was objective evidence of impairment as a result of one or more events that occurred after the initial recognition of the asset (a ‘loss event’) and that loss event (or events) had an impact on the estimated future cash flows of the financial asset or group of financial assets that could be reliably estimated. In the case of equity investments classified as available-for-sale, a significant or prolonged decline in the fair value of the security below its cost was considered an indicator that the assets are impaired.
Assets carried at amortised costFor loans and receivables, the amount of the loss was measured as the difference between the asset’s carrying amount and the present value of estimated future cash flows (excluding future credit losses that had not been incurred) discounted at the financial asset’s original effective interest rate. The carrying amount of the asset was reduced and the amount of the loss was recognised in profit or loss. If a loan or held-to-maturity investment had a variable interest rate, the discount rate for measuring any impairment loss was the current effective interest rate determined under the contract. As a practical expedient, the group could measure impairment on the basis of an instrument’s fair value using an observable market price.
If, in a subsequent year, the amount of the impairment loss decreased and the decrease could be related objectively to an event occurring after the impairment was recognised (such as an improvement in the debtor’s credit rating), the reversal of the previously recognised impairment loss was recognised in profit or loss.
Impairment testing of trade receivables is described in note 3(b).
(N) DERIVATIVE FINANCIAL INSTRUMENTSDerivative financial instruments are initially recognised at fair value on the date a derivative contract is entered into and are subsequently remeasured to their fair value at the end of each reporting year.
(M) FINANCIAL ASSETS (CONTINUED)
6 4 / P O I N T S B E T A N N U A L R E P O R T
For
per
sona
l use
onl
y

(O) PLANT AND EQUIPMENTPlant and equipment is stated at historical cost less accumulated depreciation and impairment. Historical cost includes expenditure that is directly attributable to the acquisition of the items.
Subsequent costs are included in the asset’s carrying amount or recognised as a separate asset, as appropriate, only when it is probable that future economic benefits associated with the item will flow to the group and the cost of the item can be measured reliably. The carrying amount of any component accounted for as a separate asset is derecognised when replaced. All other repairs and maintenance are charged to profit or loss during the reporting year in which they are incurred.
Depreciation is calculated using the straight-line method to allocate their cost or revalued amounts, net of their residual values, over their estimated useful lives or, in the case of leasehold improvements and certain leased plant and equipment, the shorter lease term as follows:�—Office equipment 2 – 10 years�—Computer equipment 2.5 – 6 years�—Leasehold improvements 2 – 5 years�—Assets under construction Nil years
The assets’ residual values and useful lives are reviewed, and adjusted if appropriate, at the end of each reporting year.
An asset’s carrying amount is written down immediately to its recoverable amount if the asset’s carrying amount is greater than its estimated recoverable amount (note 1(j)).
Gains and losses on disposals are determined by comparing proceeds with carrying amount. These are included in profit or loss. When revalued assets are sold, it is group policy to transfer any amounts included in other reserves in respect of those assets to retained earnings.
(P) INTANGIBLE ASSETS
(i) Licences and Market AccessSignificant costs associated with licences and market access are capitalised and amortised on a straight line basis over a period of their expected benefit, being the term of the licence term.
(ii) SoftwareSoftware costs are capitalised and amortised on a straight-line basis over the period of their expected benefit being their finite life of five years.
(iii) Betting platform developmentSignificant costs associated with the betting platform development are capitalised and amortised on a straight-line basis over the period of their expected benefit, being their finite life of 5 years.
(Q) TRADE AND OTHER PAYABLESThese amounts represent liabilities for goods and services provided to the group prior to the end of financial year which are unpaid. The amounts are unsecured and are usually paid within 30 days of recognition. Trade and other payables are presented as current liabilities unless payment is not due within 12 months from the reporting date. They are recognised initially at their fair value and subsequently measured at amortised cost using the effective interest method.
P O I N T S B E T A N N U A L R E P O R T / 6 5
For
per
sona
l use
onl
y
NOTES TO THE FINANCIAL STATEMENTS CONTINUED3 0 J U N E 2 0 1 9
(R) BORROWINGSBorrowings are initially recognised at fair value, net of transaction costs incurred. Borrowings are subsequently measured at amortised cost. Any difference between the proceeds (net of transaction costs) and the redemption amount is recognised in profit or loss over the year of the borrowings using the effective interest method. Fees paid on the establishment of loan facilities are recognised as transaction costs of the loan to the extent that it is probable that some or all of the facility will be drawn down. In this case, the fee is deferred until the draw down occurs. To the extent there is no evidence that it is probable that some or all of the facility will be drawn down, the fee is capitalised as a prepayment for liquidity services and amortised over the year of the facility to which it relates.
Borrowings are removed from the Consolidated Statement of Financial Position when the obligation specified in the contract is discharged, cancelled or expired. The difference between the carrying amount of a financial liability that has been extinguished or transferred to another party and the consideration paid, including any non-cash assets transferred or liabilities assumed, is recognised in profit or loss as other income or finance costs.
Borrowings are classified as current liabilities unless the group has an unconditional right to defer settlement of the liability for at least 12 months after the reporting year.
(S) BORROWING COSTSGeneral and specific borrowing costs that are directly attributable to the acquisition, construction or production of a qualifying asset are capitalised during the year of time that is required to complete and prepare the asset for its intended use or sale. Qualifying assets are assets that necessarily take a substantial year of time to get ready for their intended use or sale.
Other borrowing costs are expensed in the year in which they are incurred.
(T) PROVISIONSProvisions for legal claims, chargebacks and other obligations are recognised when the group has a present legal or constructive obligation as a result of past events, it is probable that an outflow of resources will be required to settle the obligation and the amount can be reliably estimated. Provisions are not recognised for future operating losses.
Where there are a number of similar obligations, the likelihood that an outflow will be required in settlement is determined by considering the class of obligations as a whole. A provision is recognised even if the likelihood of an outflow with respect to any one item included in the same class of obligations may be small.
Provisions are measured at the present value of management’s best estimate of the expenditure required to settle the present obligation at the end of the reporting year. The discount rate used to determine the present value is a pre-tax rate that reflects current market assessments of the time value of money and the risks specific to the liability. The increase in the provision due to the passage of time is recognised as interest expense.
(U) EMPLOYEE BENEFITS
(i) Short-term obligationsLiabilities for wages and salaries, including non-monetary benefits that are expected to be settled wholly within 12 months after the end of the period in which the employees render the related service are recognised in respect of employees’ services up to the end of the reporting period and are measured at the amounts expected to be paid when the liabilities are settled. The liabilities are presented as current employee benefit obligations in the Consolidated Statement of Financial Position.
(ii) Other long-term employee benefit obligationsIn some countries, the group also has liabilities for long service leave and annual leave that are not expected to be settled wholly within 12 months after the end of the year in which the employees render the related service. These obligations are therefore measured as the present value of expected future payments to be made in respect of services provided by employees up to the end of the reporting year using the projected unit credit method. Consideration is given to expected future wage and salary levels, experience of employee departures and years of service. Expected future payments are discounted using market yields at the end of the reporting year of high-quality corporate bonds with terms and currencies that match, as closely as possible, the estimated future cash outflows. Remeasurements as a result of experience adjustments and changes in actuarial assumptions are recognised in profit or loss.
The obligations are presented as current liabilities in the Consolidated Statement of Financial Position if the entity does not have an unconditional right to defer settlement for at least twelve months after the reporting date, regardless of when the actual settlement is expected to occur.
6 6 / P O I N T S B E T A N N U A L R E P O R T
For
per
sona
l use
onl
y

(iii) Share-based paymentsEquity-settled and cash-settled share-based compensation benefits are provided to employees.
Equity-settled transactions are awards of shares, or options over shares, that are provided to employees in exchange for the rendering of services.
The cost of equity-settled transactions are measured at fair value on grant date. Fair value is independently determined using a Binomial option pricing model that takes into account the exercise price, the term of the option, the impact of dilution, the share price at grant date and expected price volatility of the underlying share, the expected dividend yield and the risk free interest rate for the term of the option, together with non-vesting conditions that do not determine whether the consolidated entity receives the services that entitle the employees to receive payment. No account is taken of any other vesting conditions.
The cost of equity-settled transactions are recognised as an expense with a corresponding increase in equity over the vesting period. The cumulative charge to profit or loss is calculated based on the grant date fair value of the award, the best estimate of the number of awards that are likely to vest and the expired portion of the vesting period. The amount recognised in profit or loss for the period is the cumulative amount calculated at each reporting date less amounts already recognised in previous periods.
The cost of cash-settled transactions is initially, and at each reporting date until vested, determined by applying the Binomial option pricing model, taking into consideration the terms and conditions on which the award was granted. The cumulative charge to profit or loss until settlement of the liability is calculated as follows:�—during the vesting period, the liability at each reporting date is the fair value of the award at that date multiplied by the expired
portion of the vesting period; and�—from the end of the vesting period until settlement of the award, the liability is the full fair value of the liability at the reporting date.
All changes in the liability are recognised in profit or loss. The ultimate cost of cash-settled transactions is the cash paid to settle the liability.
Market conditions are taken into consideration in determining fair value. Therefore any awards subject to market conditions are considered to vest irrespective of whether or not that market condition has been met, provided all other conditions are satisfied.
If equity-settled awards are modified, as a minimum an expense is recognised as if the modification has not been made. An additional expense is recognised, over the remaining vesting period, for any modification that increases the total fair value of the share-based compensation benefit as at the date of modification.
If the non-vesting condition is within the control of the consolidated entity or employee, the failure to satisfy the condition is treated as a cancellation. If the condition is not within the control of the consolidated entity or employee and is not satisfied during the vesting period, any remaining expense for the award is recognised over the remaining vesting period, unless the award is forfeited.
If equity-settled awards are cancelled, it is treated as if it has vested on the date of cancellation, and any remaining expense is recognised immediately. If a new replacement award is substituted for the cancelled award, the cancelled and new award is treated as if they were a modification.
(iv) Reclassification of employee benefit obligations The group’s liabilities for annual leave and other long-term employee benefit obligations were previously presented as provisions in the Consolidated Statement of Financial Position. However, management considers it to be more relevant if all employee benefit obligations are presented in one separate line item in the Consolidated Statement of Financial Position. Prior year comparatives as at 30 June 2018 have been restated by reclassifying $210,738 from current provisions to current employee benefit obligations ($100,578 as at 1 July 2017).
P O I N T S B E T A N N U A L R E P O R T / 6 7
For
per
sona
l use
onl
y

NOTES TO THE FINANCIAL STATEMENTS CONTINUED3 0 J U N E 2 0 1 9
(V) FAIR VALUE MEASUREMENTWhen an asset or liability, financial or non-financial, is measured at fair value for recognition or disclosure purposes, the fair value is based on the price that would be received to sell an asset or paid to transfer a liability in an orderly transaction between market participants at the measurement date; and assumes that the transaction will take place either: in the principal market; or in the absence of a principal market, in the most advantageous market.
Fair value is measured using the assumptions that market participants would use when pricing the asset or liability, assuming they act in their economic best interests. For non-financial assets, the fair value measurement is based on its highest and best use. Valuation techniques that are appropriate in the circumstances and for which sufficient data are available to measure fair value, are used, maximising the use of relevant observable inputs and minimising the use of unobservable inputs.
(W) CONTRIBUTED EQUITYOrdinary shares are classified as equity.
Incremental costs directly attributable to the issue of new shares or options are shown in equity as a deduction, net of tax, from the proceeds.
(X) EARNINGS PER SHAREThe group presents basic and, when applicable, diluted earnings per share (“EPS”) data for its ordinary shares.
(i) Basic earnings per shareBasic earnings per share is calculated by dividing:�—the profit/(loss) attributable to owners of the company, excluding any costs of servicing equity other than ordinary shares,�—by the weighted average number of ordinary shares outstanding during the financial year.
(ii) Diluted earnings per shareDiluted earnings per share adjusts the figures used in the determination of basic earnings per share to take into account:�—the after income tax effect of interest and other financing costs associated with dilutive potential ordinary shares; and�—the weighted average number of additional ordinary shares that would have been outstanding assuming the conversion of all
dilutive potential ordinary shares.
The dilutive effect, if any, of outstanding options is reflected as additional share dilution in the computation of earnings per share.
(Y) GOODS AND SERVICES TAX (GST)Revenues, expenses and assets are recognised net of the amount of associated GST, unless the GST incurred is not recoverable from the taxation authority. In this case it is recognised as part of the cost of acquisition of the asset or as part of the expense.
Receivables and payables are stated inclusive of the amount of GST receivable or payable. The net amount of GST recoverable from, or payable to, the taxation authority is included with other receivables or payables in the Consolidated Statement of Financial Position.
Cash flows are presented on a gross basis. The GST components of cash flows arising from investing or financing activities which are recoverable from, or payable to the taxation authority, are presented as operating cash flows.
(Z) PARENT ENTITYIn accordance with the Corporations Act 2001, these financial statements present the results of the group only. Supplementary information about the parent entity is disclosed in note 35.
6 8 / P O I N T S B E T A N N U A L R E P O R T
For
per
sona
l use
onl
y

2. CHANGES IN ACCOUNTING POLICIESAs explained in note 1(a) above, the group has adopted a number of new or revised accounting standards this year that have resulted in changes in accounting policies and adjustments to the amounts recognised in the financial statements.
(A) AASB 9 FINANCIAL INSTRUMENTSAASB 9 Financial Instruments replaces the provisions of AASB 139 Financial Instruments: Recognition and Measurement that relate to the recognition, classification and measurement of financial assets and financial liabilities, derecognition of financial instruments, impairment of financial assets and hedge accounting.
The group’s revenue arising from betting activities falls within the scope of AASB 9, however it did not have a material impact on the group’s accounting for revenue as a result of the change in standards
There was no impact on the group’s retained earnings as at 1 July 2018 and 1 July 2017 as a result of the adoption of AASB 9. The following reclassifications were however required following adoption of the new standard:
(i) Classification and measurementOn 1 July 2018 (the date of initial application of AASB 9), the group’s management has assessed which business models apply to the financial assets held by the group and has classified its financial instruments into the appropriate AASB 9 categories.
(I) Reclassification from held-to-maturity to amortised costTerm deposits that would have previously been classified as held-to maturity are now classified at amortised cost. The group intends to hold the assets to maturity to collect contractual cash flows and these cash flows consist solely of payments of principal and interest on the principal amount outstanding. There was no difference between the previous carrying amount and the revised carrying amount of the other financial assets at 1 July 2018 to be recognised in opening retained earnings.
(II) Reclassifications of financial instruments on adoption of AASB 9On the date of initial application, 1 July 2018, the financial instruments of the group were as follows, with any reclassifications noted:
MEASUREMENT CATEGORY CARRYING AMOUNT
ORIGINAL (AASB 139) NEW (AASB 9)ORIGINAL
$NEW
$DIFFERENCE
$
Non-current financial assets
Term deposits Held to maturity Amortised cost 206,400 206,400 –
Current financial liabilities
Pending bets FVPL FVPL 321,338 321,338 –
(ii) Impairment of financial assetsThe group has one type of financial assets that are subject to AASB 9’s new expected credit loss model:�—trade receivables from the provision of betting services
The group was required to revise its impairment methodology under AASB 9 for each of these classes of assets.
While cash and cash equivalents are also subject to the impairment requirements of AASB 9, the identified impairment loss was immaterial.
Trade receivablesThe group applies the AASB 9 simplified approach to measuring expected credit losses which uses a lifetime expected loss allowance for all trade receivables.
There was no material change to the amounts accounted for in the group’s financial statements as a result of applying the new standard.
P O I N T S B E T A N N U A L R E P O R T / 6 9
For
per
sona
l use
onl
y

NOTES TO THE FINANCIAL STATEMENTS CONTINUED3 0 J U N E 2 0 1 9
(B) AASB 15 REVENUE FROM CONTRACTS WITH CUSTOMERSThe group has adopted AASB 15 Revenue from Contracts with Customers from 1 July 2018.
The group revenue from the receiving and settling of bets, which are deemed to fall under the scope of AASB 9 Financial Instruments (previously AASB 139) as the transactions involve the issuing of financial instruments. AASB 15 has therefore only impacted revenue that is not governed by AASB 9. The group therefore determined that there was no material impact as a result of the adoption of AASB 15.
3. FINANCIAL RISK MANAGEMENTThe group’s activities expose it to a variety of market risk (foreign exchange and cash flow and interest rate risk), credit risk and liquidity risk. The group’s overall risk management program focuses on the unpredictability of financial markets and seeks to minimise potential adverse effects on the financial performance of the group.
Risk management is carried out by management under policies approved by the Board of Directors (“the Board”). These policies include identification and analysis of the risk exposure of the group and appropriate procedures, controls and risk limits. Management identifies, evaluates and hedges financial risks within the group and reports to the Board on a regular basis.
(A) MARKET RISK
(i) Foreign exchange risk
ExposureThe group’s is exposed to foreign currency risk in respect of revenue, expenses, trade receivables, cash and cash equivalents, and other financial assets, and financial liabilities (primarily trade payables, accruals, and client liability balances) that are denominated in currencies that are not the functional currency of the group, being Australian Dollar (“AUD”). The primary currencies that the group is exposed to fluctuations are the US Dollar (“USD”).
As at 30 June 2019, the group’s exposure to United States dollar at the end of the reporting period, expressed in Australian dollar, was as follows:
30 JUNE 2019AUD
$
30 JUNE 2018AUD
$
Financial assets, cash and cash equivalents 62,220,539 –
Other assets 505,156 –
Trade and other payables and other liabilities (5,091,952) –
Derivative financial liabilities (pending bets) (427,076) (321,338)
Total 57,206,667 (321,338)
7 0 / P O I N T S B E T A N N U A L R E P O R T
For
per
sona
l use
onl
y

Instruments used by the groupThe group operates internationally and is exposed to foreign exchange risk, primarily the USD. Foreign exchange risk arises from future commercial transactions and recognised assets and liabilities denominated in a current that is not the functional currency of the relevant group entity.
Whilst the group does not actively hedge its foreign currency exposure on its trading cash flows, it monitors exposures to individual exposures and where appropriate and approved by the Board enter into spot or forward foreign exchange contracts.
Amounts recognised in profit or loss and other comprehensive incomeDuring the year, the following foreign-exchange related amounts were recognised in profit or loss and other comprehensive income:
2019 $
2018 $
Amounts recognised in profit or loss
Net foreign exchange loss included in other income/other expenses (682,442) –
Total net foreign exchange (losses) recognised in loss before income tax for the year (682,442) –
Net gain recognised in other comprehensive income (note 25(a))
Translation of foreign operations 137,544 –
Total net gain recognised in other comprehensive income for the year 137,544 –
Sensitivity
ASSETS LIABILITIES
2019 $
2018 $
2019 $
2018 $
US dollars 71,485,507 – 5,519,028 –
71,485,507 – 5,519,028 –
The group had financial assets denominated in foreign currencies of $45,195,444 as at 30 June 2019 (2018: $NIL). Based on this exposure, had the Australian dollar weakened by 5%/strengthened by 10% against these foreign currencies with all other variables held constant, the consolidated entity’s loss before tax for the year would have been $2,259,772 lower/$4,519,544 higher and equity would have been $2,259,772 lower/$4,519,544 higher.
(ii) Cash flow and fair value interest rate riskThe group is exposed to interest rate risk on certain of its cash and cash equivalents and any long term-borrowings. As at 30 June 2019, the group did not hold any long-term borrowings (30 June 2018: $nil). Excess cash and cash equivalents, where applicable are invested in interest-bearing term deposits on which the interest rate is fixed for the term of the deposit. At call deposits attract low interest rates and therefore do not materially impact the interest income earned by the group.
P O I N T S B E T A N N U A L R E P O R T / 7 1
For
per
sona
l use
onl
y

NOTES TO THE FINANCIAL STATEMENTS CONTINUED3 0 J U N E 2 0 1 9
(B) CREDIT RISKCredit risk refers to the risk that a counterparty will default on its contractual obligations resulting in financial loss to the group. The group has a strict code of credit, including obtaining agency credit information, confirming references and setting appropriate credit limits. The maximum exposure credit risk at the reporting date to recognised financial assets is the carrying amount, net of any provisions for impairment of those assets, as disclosed in the Consolidated Statement of Financial Position and Notes to the Consolidated Financial Statements.
(i) Impairment of financial assets
Trade receivablesThe group applies the AASB 9 simplified approach to measuring expected credit losses which uses a lifetime expected loss allowance for all trade receivables.
To measure the expected credit losses, trade receivables have been grouped based on shared credit risk characteristics and the days past due.
On that basis, the loss allowance as at 30 June 2019 and 1 July 2018 (on adoption of AASB 9) was determined as follows for both trade receivables:
CURRENT0 TO 3 MONTHS
OVERDUE3 TO 6 MONTHS
OVERDUEOVER 6 MONTHS
OVERDUE TOTAL
30 June 2019
Expected loss rate 1% 5% 10% 100%
Gross carrying amount – trade receivables – – – 99,366 99,366
Gross carrying amount – contract assets – – – – –
Loss allowance – – – 99,366 99,366
1 July 2018
Expected loss rate 1% 5% 10% 63%
Gross carrying amount – trade receivables – – – 339,750 339,750
Loss allowance – – 214,165 214,165
7 2 / P O I N T S B E T A N N U A L R E P O R T
For
per
sona
l use
onl
y

The closing loss allowances for trade receivables as at 30 June 2019 reconcile to the opening loss allowances as follows:
TRADE RECEIVABLES
2019$
2018$
At 30 June 2019 calculated under AASB 139 214,165 84,596
Amounts restated through opening retained earnings – –
Opening loss allowance as at 1 July 2017 – calculated under AASB 9 214,165 84,596
Increase in loss allowance recognised in profit or loss during the year – 129,569
Receivables written off during the year as uncollectible (30,730) –
Unused amount reversed (84,069) –
At 30 June 2019 99,366 214,165
Trade receivables are written off when there is no reasonable expectation of recovery. Indicators that there is no reasonable expectation of recovery include, amongst others, the failure of a debtor to engage in a repayment plan with the group, and a failure to make contractual payments for a period of greater than 365 days past due. As at 30 June 2019, all trade receivables have been provided for.
Impairment losses on trade receivables are presented as net impairment losses within operating profit. Subsequent recoveries of amounts previously written off are credited against the same line item.
Previous accounting policy for impairment of trade receivablesIn the prior year, the impairment of trade receivables was assessed based on the incurred loss model. Individual receivables which were known to be uncollectible were written off by reducing the carrying amount directly. The other receivables were assessed collectively to determine whether there was objective evidence that an impairment had been incurred but not yet been identified. For these receivables the estimated impairment losses were recognised in a separate provision for impairment. The group considered that there was evidence of impairment if any of the following indicators were present:�—significant financial difficulties of the debtor,�—probability that the debtor will enter bankruptcy or financial reorganisation, and�—default or late payments (more than 365 days overdue).
Receivables for which an impairment provision was recognised were written off against the provision when there was no expectation of recovering additional cash.
(ii) Net impairment losses on financial assets recognised in profit or lossDuring the year, the following gains/(losses) were recognised in profit or loss in relation to impaired financial assets:
2019 $
2018 $
Impairment (reversal)/losses
�—individually impaired receivables (previous accounting policy) – 129,569
�—movement in loss allowance for trade receivables (114,799) –
Net impairment (reversal)/losses on financial assets (114,799) 129,569
Of the above impairment (reversal)/losses, reversal of $114,799) (2018 – losses of $129,569) relate to receivables arising from contracts with customers.
P O I N T S B E T A N N U A L R E P O R T / 7 3
For
per
sona
l use
onl
y

NOTES TO THE FINANCIAL STATEMENTS CONTINUED3 0 J U N E 2 0 1 9
(C) LIQUIDITY RISKLiquidity risk management requires the group to maintain sufficient liquid assets (mainly cash and cash equivalents) and available borrowing facilities to be able to pay debts as and when they become due and payable.
(i) Maturities of financial liabilitiesThe tables below analyse the group’s financial liabilities into relevant maturity groupings based on their contractual maturities for:(a) all non-derivative financial liabilities, and
(b) net and gross settled derivative financial instruments for which the contractual maturities are essential for an understanding of the timing of the cash flows.
The amounts disclosed in the table are the contractual undiscounted cash flows of financial liabilities based on the earliest date on which the financial liabilities are required to be paid.
CONTRACTUAL MATURITIES OF FINANCIAL LIABILITIES1 YEAR OR LESS
$
BETWEEN 1 AND 2 YEARS
$
OVER 2 YEARS
$
TOTAL CONTRACTUAL
CASH FLOWS
$
At 30 June 2019
Non-derivatives
Trade and other payables 9,623,355 – – 9,623,355
Other liabilities 8,591,300 – – 8,591,300
Total non-derivatives 18,214,655 – – 18,214,655
Derivatives
Pending bets 861,963 – – 861,963
Total derivatives 861,963 – – 861,963
At 30 June 2018
Non-derivatives
Trade and other payables 2,395,576 – – 2,395,576
Other liabilities 3,628,660 – – 3,628,660
Total non-derivatives 6,024,236 – – 6,024,236
Derivatives
Pending bets 321,338 – – 321,338
Total derivatives 321,338 – – 321,338
The weighted average interest rate on all financial liabilities is 0% (2018: 0%).
7 4 / P O I N T S B E T A N N U A L R E P O R T
For
per
sona
l use
onl
y
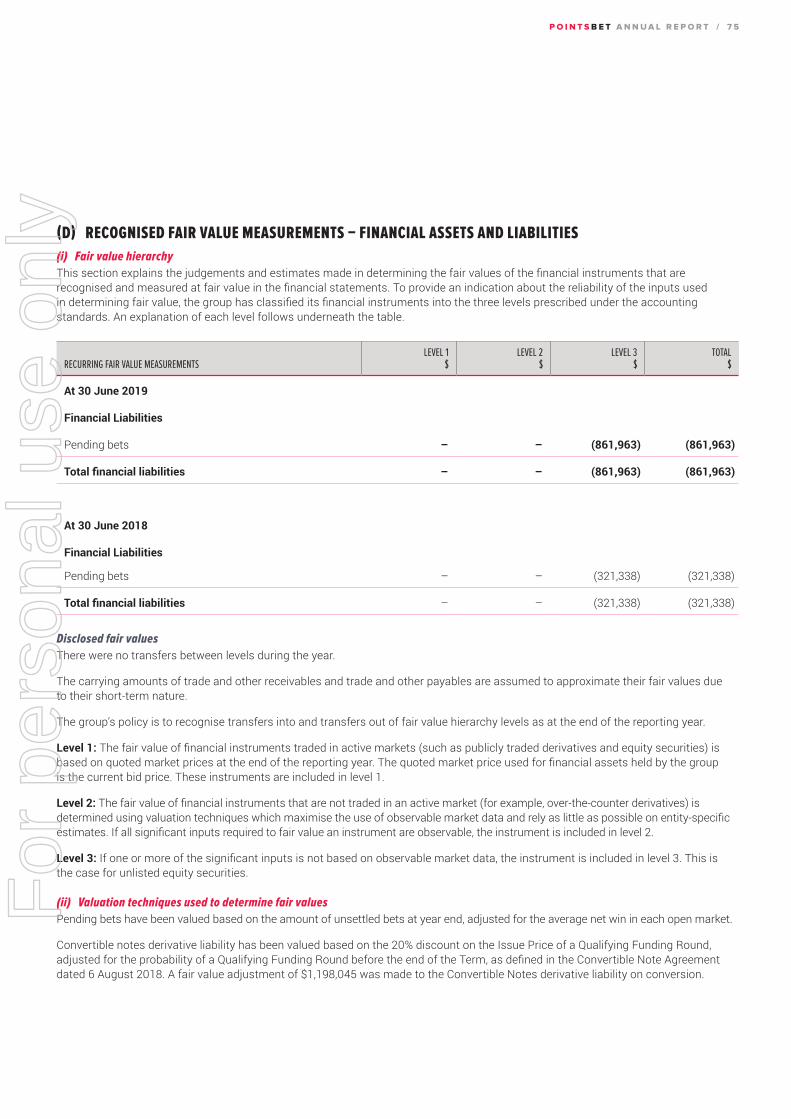
(D) RECOGNISED FAIR VALUE MEASUREMENTS – FINANCIAL ASSETS AND LIABILITIES
(i) Fair value hierarchyThis section explains the judgements and estimates made in determining the fair values of the financial instruments that are recognised and measured at fair value in the financial statements. To provide an indication about the reliability of the inputs used in determining fair value, the group has classified its financial instruments into the three levels prescribed under the accounting standards. An explanation of each level follows underneath the table.
RECURRING FAIR VALUE MEASUREMENTSLEVEL 1
$LEVEL 2
$LEVEL 3
$TOTAL
$
At 30 June 2019
Financial Liabilities
Pending bets – – (861,963) (861,963)
Total financial liabilities – – (861,963) (861,963)
At 30 June 2018
Financial Liabilities
Pending bets – – (321,338) (321,338)
Total financial liabilities – – (321,338) (321,338)
Disclosed fair valuesThere were no transfers between levels during the year.
The carrying amounts of trade and other receivables and trade and other payables are assumed to approximate their fair values due to their short-term nature.
The group’s policy is to recognise transfers into and transfers out of fair value hierarchy levels as at the end of the reporting year.
Level 1: The fair value of financial instruments traded in active markets (such as publicly traded derivatives and equity securities) is based on quoted market prices at the end of the reporting year. The quoted market price used for financial assets held by the group is the current bid price. These instruments are included in level 1.
Level 2: The fair value of financial instruments that are not traded in an active market (for example, over-the-counter derivatives) is determined using valuation techniques which maximise the use of observable market data and rely as little as possible on entity-specific estimates. If all significant inputs required to fair value an instrument are observable, the instrument is included in level 2.
Level 3: If one or more of the significant inputs is not based on observable market data, the instrument is included in level 3. This is the case for unlisted equity securities.
(ii) Valuation techniques used to determine fair valuesPending bets have been valued based on the amount of unsettled bets at year end, adjusted for the average net win in each open market.
Convertible notes derivative liability has been valued based on the 20% discount on the Issue Price of a Qualifying Funding Round, adjusted for the probability of a Qualifying Funding Round before the end of the Term, as defined in the Convertible Note Agreement dated 6 August 2018. A fair value adjustment of $1,198,045 was made to the Convertible Notes derivative liability on conversion.
P O I N T S B E T A N N U A L R E P O R T / 7 5
For
per
sona
l use
onl
y
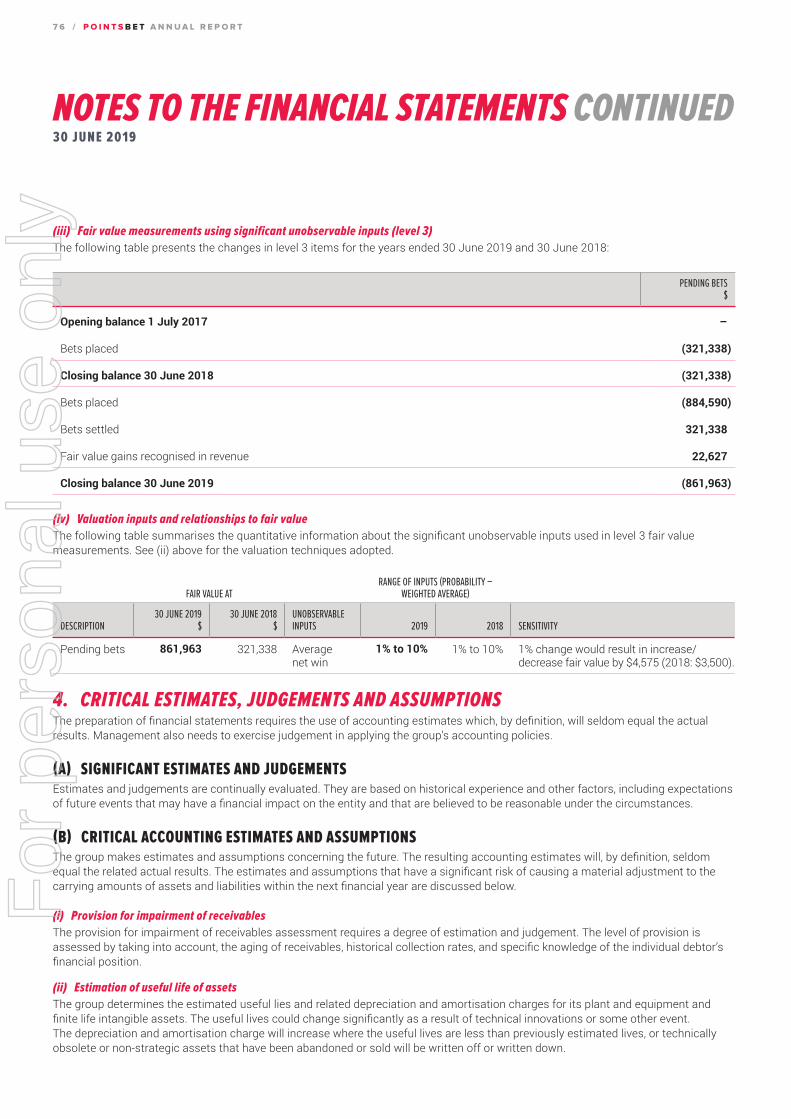
NOTES TO THE FINANCIAL STATEMENTS CONTINUED3 0 J U N E 2 0 1 9
(iii) Fair value measurements using significant unobservable inputs (level 3)The following table presents the changes in level 3 items for the years ended 30 June 2019 and 30 June 2018:
PENDING BETS $
Opening balance 1 July 2017 –
Bets placed (321,338)
Closing balance 30 June 2018 (321,338)
Bets placed (884,590)
Bets settled 321,338
Fair value gains recognised in revenue 22,627
Closing balance 30 June 2019 (861,963)
(iv) Valuation inputs and relationships to fair valueThe following table summarises the quantitative information about the significant unobservable inputs used in level 3 fair value measurements. See (ii) above for the valuation techniques adopted.
FAIR VALUE ATRANGE OF INPUTS (PROBABILITY –
WEIGHTED AVERAGE)
DESCRIPTION30 JUNE 2019
$30 JUNE 2018
$UNOBSERVABLE INPUTS 2019 2018 SENSITIVITY
Pending bets 861,963 321,338 Average net win
1% to 10% 1% to 10% 1% change would result in increase/decrease fair value by $4,575 (2018: $3,500).
4. CRITICAL ESTIMATES, JUDGEMENTS AND ASSUMPTIONSThe preparation of financial statements requires the use of accounting estimates which, by definition, will seldom equal the actual results. Management also needs to exercise judgement in applying the group’s accounting policies.
(A) SIGNIFICANT ESTIMATES AND JUDGEMENTSEstimates and judgements are continually evaluated. They are based on historical experience and other factors, including expectations of future events that may have a financial impact on the entity and that are believed to be reasonable under the circumstances.
(B) CRITICAL ACCOUNTING ESTIMATES AND ASSUMPTIONSThe group makes estimates and assumptions concerning the future. The resulting accounting estimates will, by definition, seldom equal the related actual results. The estimates and assumptions that have a significant risk of causing a material adjustment to the carrying amounts of assets and liabilities within the next financial year are discussed below.
(i) Provision for impairment of receivablesThe provision for impairment of receivables assessment requires a degree of estimation and judgement. The level of provision is assessed by taking into account, the aging of receivables, historical collection rates, and specific knowledge of the individual debtor’s financial position.
(ii) Estimation of useful life of assetsThe group determines the estimated useful lies and related depreciation and amortisation charges for its plant and equipment and finite life intangible assets. The useful lives could change significantly as a result of technical innovations or some other event. The depreciation and amortisation charge will increase where the useful lives are less than previously estimated lives, or technically obsolete or non-strategic assets that have been abandoned or sold will be written off or written down.
7 6 / P O I N T S B E T A N N U A L R E P O R T
For
per
sona
l use
onl
y

(iii) Income taxThe group is subject to income taxes in the jurisdictions in which it operates. Significant judgement is required in determining the provision for income tax. There are many transactions and calculations undertaken during the ordinary course of business for which the ultimate tax determination is uncertain. The group recognises liabilities for anticipated tax audit issues based on the group’s current understanding of the tax law. Where the final tax outcome of these matters is different from the carrying amounts, such differences will impact the current and deferred tax provisions in the period in which such determination is made.
(iv) Share-based payment transactionsThe group measures the cost of equity-settled transactions with employees by reference to the fair value of the equity instruments at the date at which they are granted. The fair value is determined by using a Binomial model taking into account the terms and conditions upon which the instruments were granted. The accounting estimates and assumptions relating to equity-settled share-based payments would have no impact on the carrying amounts of assets and liabilities within the next annual reporting period but may impact profit or loss and equity.
(v) Recovery of deferred tax assetsDeferred tax assets are recognised for deductible temporary differences only if the consolidated entity considers it is probable that future taxable amounts will be available to utilise those temporary differences and losses.
(vi) Employee benefits provisionAs discussed in note 1, the liability for employee benefits expected to be settled more than 12 months from the reporting date are recognised and measured at the present value of the estimated future cash flows to be made in respect of all employees at the reporting date. In determining the present value of the liability, estimates of attribution rates and pay increases through promotion and inflation have been taken account.
(vii) Impairment of non-financial assets other than goodwill and other indefinite life intangible assetsThe group assesses impairment of non-financial assets other than goodwill and other indefinite life intangible assets at each reporting date by evaluating conditions specific to the group and to the particular asset that may lead to impairment. If an impairment trigger exists, the recoverable amount of the asset is determined. This involves fair value less costs of disposal or value-in-use calculations, which incorporate a number of key estimates and assumptions.
5. SEGMENT INFORMATION
(A) DESCRIPTION OF SEGMENTS AND PRINCIPAL ACTIVITIESThe group has determined that its operating segments are its reportable segments. The group’s reportable segments are as follows:�—Australian Trading;�—Technology; and�—United States.
This is based on the internal management reports that are reviewed by the Chief Executive Officer who is identified as the Chief Operating Decision Maker (CODM) in assessing performance and in determining the allocation of resources. There is no aggregation of operating segments.
Australian trading revenue includes revenue from sports and race betting services provided to Australian customers. The group reports the gains and losses on all betting positions as revenue, which is measured at the fair value of the consideration received or receivable from customers less free bets, promotions, bonuses and other fair value adjustments net of GST.
The Technology segment derives its revenue from licensing fees charged to the Australian Trading segment and the group’s subsidiaries in the United States segment.
The United States segment derives revenue from sports and race betting services to United States customers.
Corporate administrative costs (Board, Finance, Legal, Human Resources, Property and other central functions) cannot be readily allocated to individual operating segments and are not used by the CODM for making operating and resource allocation decisions. Hence, these are shown in the reconciliation of reportable segments to Group totals.
P O I N T S B E T A N N U A L R E P O R T / 7 7
For
per
sona
l use
onl
y
NOTES TO THE FINANCIAL STATEMENTS CONTINUED3 0 J U N E 2 0 1 9
(B) SEGMENT RESULTSThe CODM primarily uses a measure of earnings before interest, tax, depreciation and amortisation (EBITDA, see below) to assess the performance of the operating segments. However, the CODM also receives information about the segments’ revenue and assets on a monthly basis. Information about segment revenue is disclosed as follows:
AUSTRALIAN TRADING$
USA$
TECHNOLOGY$
CORPORATE$
TOTAL$
2019
Segment revenue 26,336,518 (721,251) – – 25,615,267
Inter-segment revenue – – 1,627,107 – 1,627,107
Elimination of intersegment sales – – (1,627,107) – (1,627,107)
Revenue from external customers 26,336,518 (721,251) – – 25,615,267
2018
Segment revenue 9,381,959 – – – 9,381,959
Inter-segment revenue – – 630,060 – 630,060
Elimination of intersegment sales – – (630,060) – (630,060)
Revenue from external customers 9,381,959 – – – 9,381,959
(C) EBITDAEBITDA excludes discontinued operations and the effects of significant items of income and expenditure which may have an impact on the quality of earnings such as unrealised gains or losses on financial instruments.
Interest income and finance cost are not allocated to segments, as this type of activity is driven by the central treasury function, which manages the cash position of the group.
2019 $
2018 $
Australian Trading (10,796,089) (4,710,566)
USA (19,983,810) –
Technology (2,726,776) (978,386)
Corporate (3,662,122) (637,422)
Total EBITDA (37,168,797) (6,326,374)
7 8 / P O I N T S B E T A N N U A L R E P O R T
For
per
sona
l use
onl
y

EBITDA reconciles to operating profit before income tax as follows:
2019 $
2018 $
Total EBITDA (37,168,797) (6,326,374)
Finance costs (3,014,190) –
Interest revenue 122,456 28,654
Depreciation and amortisation (1,824,619) (359,862)
Loss before income tax from continuing operations (41,885,150) (6,657,582)
(D) SEGMENT ASSETS
2019$
2018$
Australian Trading 8,898,037 4,760,555
USA 26,379,441 –
Technology 8,098,375 2,704,895
Corporate 120,988,312 14,610,582
Total segment assets 164,364,165 22,076,032
Segment assets 164,364,165 22,076,032
Intersegment eliminations (69,823,272) (11,035,446)
Total assets as per the Consolidated Statement of Financial Position 94,540,893 11,040,586
(E) SEGMENT LIABILITIES
2019 $
2018 $
Australian Trading (24,067,753) (8,941,051)
USA (5,768,914) –
Technology (11,253,444) (2,636,336)
Corporate (740,958) (121,847)
Total segment liabilities (41,831,069) (11,699,234)
Intersegment eliminations 21,796,897 5,052,125
Total liabilities as per the Consolidated Statement of Financial Position (20,034,172) (6,647,109)
P O I N T S B E T A N N U A L R E P O R T / 7 9
For
per
sona
l use
onl
y
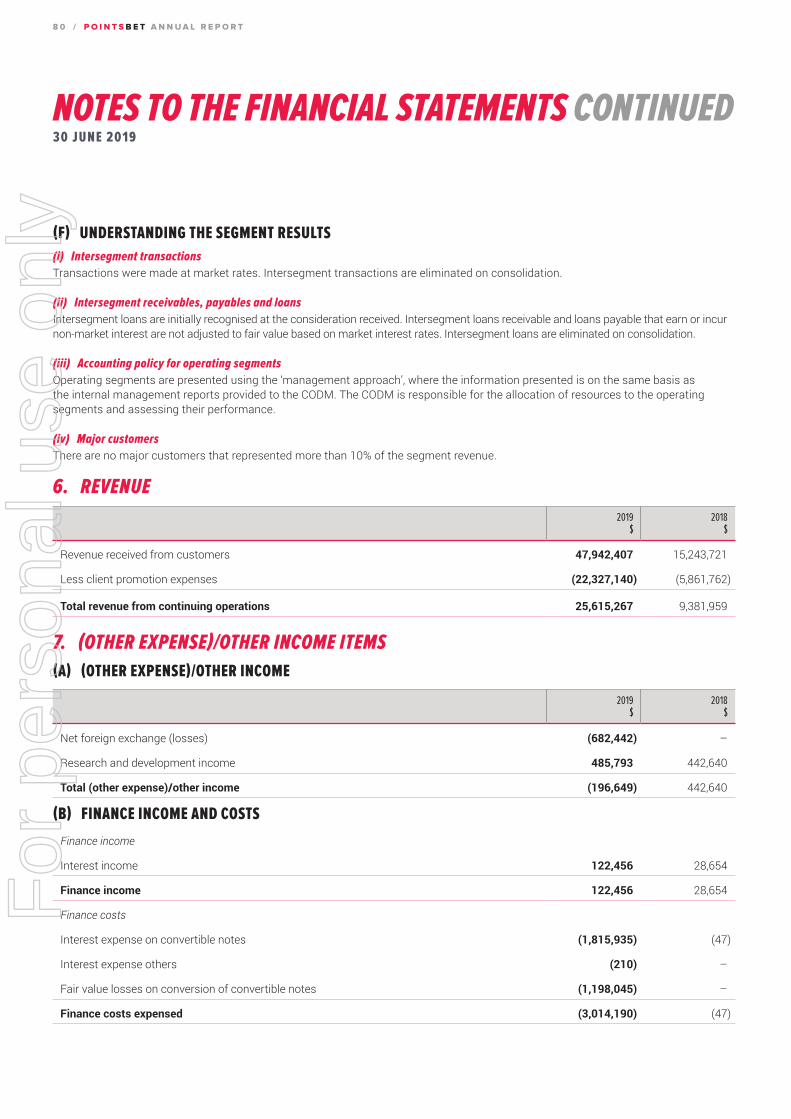
NOTES TO THE FINANCIAL STATEMENTS CONTINUED3 0 J U N E 2 0 1 9
(F) UNDERSTANDING THE SEGMENT RESULTS
(i) Intersegment transactionsTransactions were made at market rates. Intersegment transactions are eliminated on consolidation.
(ii) Intersegment receivables, payables and loansIntersegment loans are initially recognised at the consideration received. Intersegment loans receivable and loans payable that earn or incur non-market interest are not adjusted to fair value based on market interest rates. Intersegment loans are eliminated on consolidation.
(iii) Accounting policy for operating segmentsOperating segments are presented using the ‘management approach’, where the information presented is on the same basis as the internal management reports provided to the CODM. The CODM is responsible for the allocation of resources to the operating segments and assessing their performance.
(iv) Major customersThere are no major customers that represented more than 10% of the segment revenue.
6. REVENUE
2019 $
2018 $
Revenue received from customers 47,942,407 15,243,721
Less client promotion expenses (22,327,140) (5,861,762)
Total revenue from continuing operations 25,615,267 9,381,959
7. (OTHER EXPENSE)/OTHER INCOME ITEMS
(A) (OTHER EXPENSE)/OTHER INCOME
2019 $
2018 $
Net foreign exchange (losses) (682,442) –
Research and development income 485,793 442,640
Total (other expense)/other income (196,649) 442,640
(B) FINANCE INCOME AND COSTS
Finance income
Interest income 122,456 28,654
Finance income 122,456 28,654
Finance costs
Interest expense on convertible notes (1,815,935) (47)
Interest expense others (210) –
Fair value losses on conversion of convertible notes (1,198,045) –
Finance costs expensed (3,014,190) (47)
8 0 / P O I N T S B E T A N N U A L R E P O R T
For
per
sona
l use
onl
y
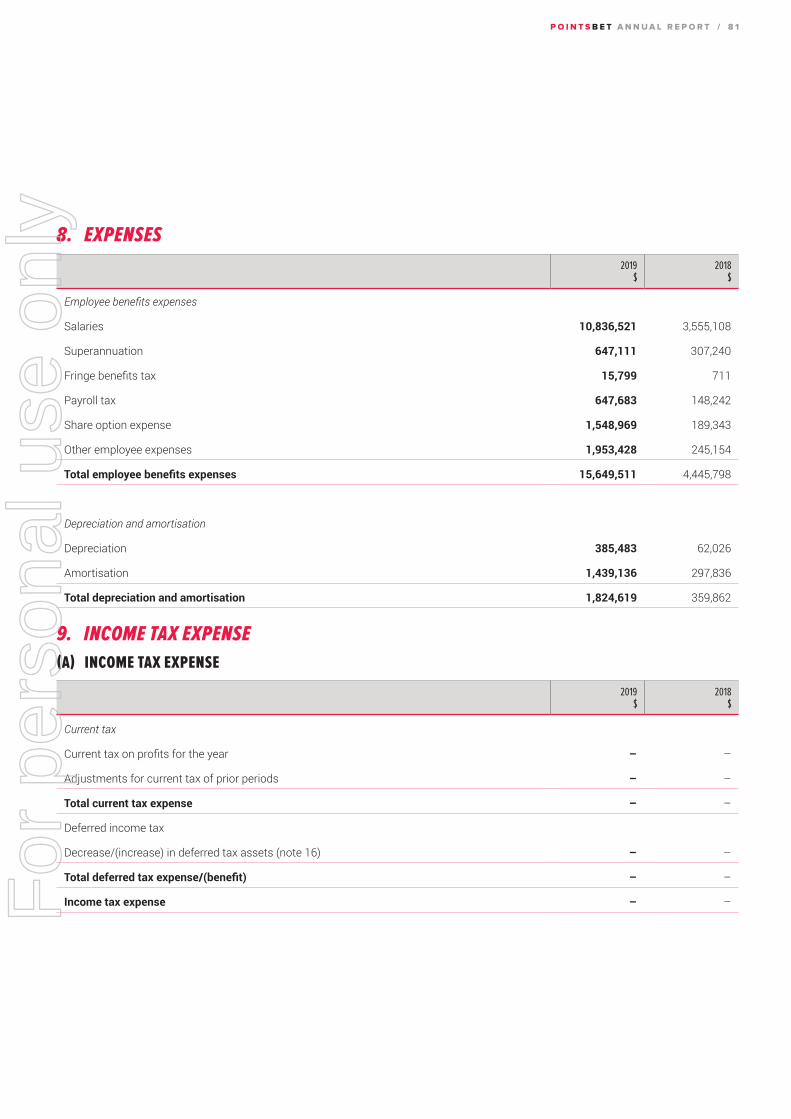
8. EXPENSES
2019 $
2018 $
Employee benefits expenses
Salaries 10,836,521 3,555,108
Superannuation 647,111 307,240
Fringe benefits tax 15,799 711
Payroll tax 647,683 148,242
Share option expense 1,548,969 189,343
Other employee expenses 1,953,428 245,154
Total employee benefits expenses 15,649,511 4,445,798
Depreciation and amortisation
Depreciation 385,483 62,026
Amortisation 1,439,136 297,836
Total depreciation and amortisation 1,824,619 359,862
9. INCOME TAX EXPENSE
(A) INCOME TAX EXPENSE
2019 $
2018 $
Current tax
Current tax on profits for the year – –
Adjustments for current tax of prior periods – –
Total current tax expense – –
Deferred income tax
Decrease/(increase) in deferred tax assets (note 16) – –
Total deferred tax expense/(benefit) – –
Income tax expense – –
P O I N T S B E T A N N U A L R E P O R T / 8 1
For
per
sona
l use
onl
y

NOTES TO THE FINANCIAL STATEMENTS CONTINUED3 0 J U N E 2 0 1 9
(B) NUMERICAL RECONCILIATION OF INCOME TAX EXPENSE TO PRIMA FACIE TAX PAYABLE
2019 $
2018 $
Loss from continuing operations before income tax expense (41,885,150) (6,657,582)
Tax at the Australian tax rate of 27.5% (2018 – 27.5%) (11,518,416) (1,830,835)
Impact of foreign tax rate differences 1,358,876 –
Tax effect of amounts which are not deductible (taxable) in calculating taxable income:
Non-deductible expenses related to separate R&D claim 137,500 537,541
Other permanent differences 1,201,589 –
Subtotal (8,820,451) (1,293,294)
Unrecognised deferred tax assets 8,820,451 1,293,294
Income tax expense – –
(i) Tax losses
2019 $
2018 $
Unused tax losses for which no deferred tax asset has been recognised 12,122,114 1,659,648
10. CASH AND CASH EQUIVALENTS
2019 $
2018 $
Current assets
Cash at bank and in hand 38,626,177 3,964,925
Player cash accounts 8,783,102 3,575,276
Term deposits 28,476,601 –
Total cash and cash equivalents 75,885,880 7,540,201
8 2 / P O I N T S B E T A N N U A L R E P O R T
For
per
sona
l use
onl
y
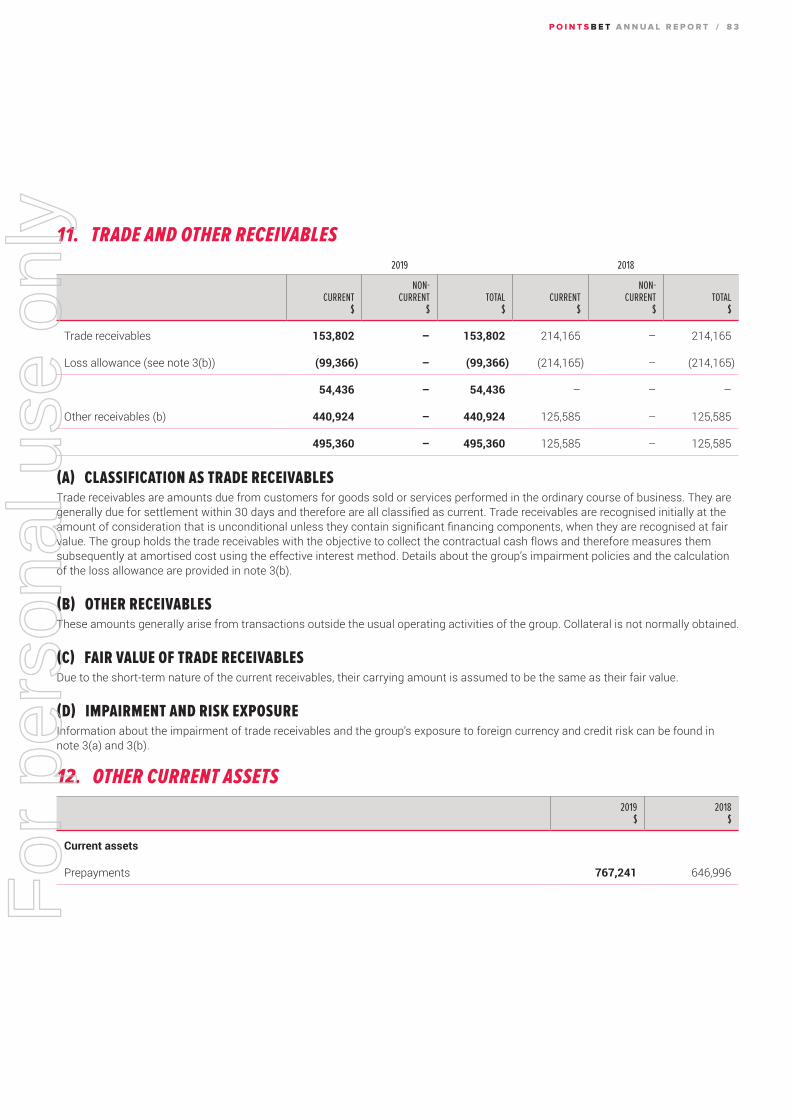
11. TRADE AND OTHER RECEIVABLES
2019 2018
CURRENT $
NON- CURRENT
$TOTAL
$CURRENT
$
NON- CURRENT
$TOTAL
$
Trade receivables 153,802 – 153,802 214,165 – 214,165
Loss allowance (see note 3(b)) (99,366) – (99,366) (214,165) – (214,165)
54,436 – 54,436 – – –
Other receivables (b) 440,924 – 440,924 125,585 – 125,585
495,360 – 495,360 125,585 – 125,585
(A) CLASSIFICATION AS TRADE RECEIVABLESTrade receivables are amounts due from customers for goods sold or services performed in the ordinary course of business. They are generally due for settlement within 30 days and therefore are all classified as current. Trade receivables are recognised initially at the amount of consideration that is unconditional unless they contain significant financing components, when they are recognised at fair value. The group holds the trade receivables with the objective to collect the contractual cash flows and therefore measures them subsequently at amortised cost using the effective interest method. Details about the group’s impairment policies and the calculation of the loss allowance are provided in note 3(b).
(B) OTHER RECEIVABLESThese amounts generally arise from transactions outside the usual operating activities of the group. Collateral is not normally obtained.
(C) FAIR VALUE OF TRADE RECEIVABLESDue to the short-term nature of the current receivables, their carrying amount is assumed to be the same as their fair value.
(D) IMPAIRMENT AND RISK EXPOSUREInformation about the impairment of trade receivables and the group’s exposure to foreign currency and credit risk can be found in note 3(a) and 3(b).
12. OTHER CURRENT ASSETS
2019 $
2018 $
Current assets
Prepayments 767,241 646,996
P O I N T S B E T A N N U A L R E P O R T / 8 3
For
per
sona
l use
onl
y
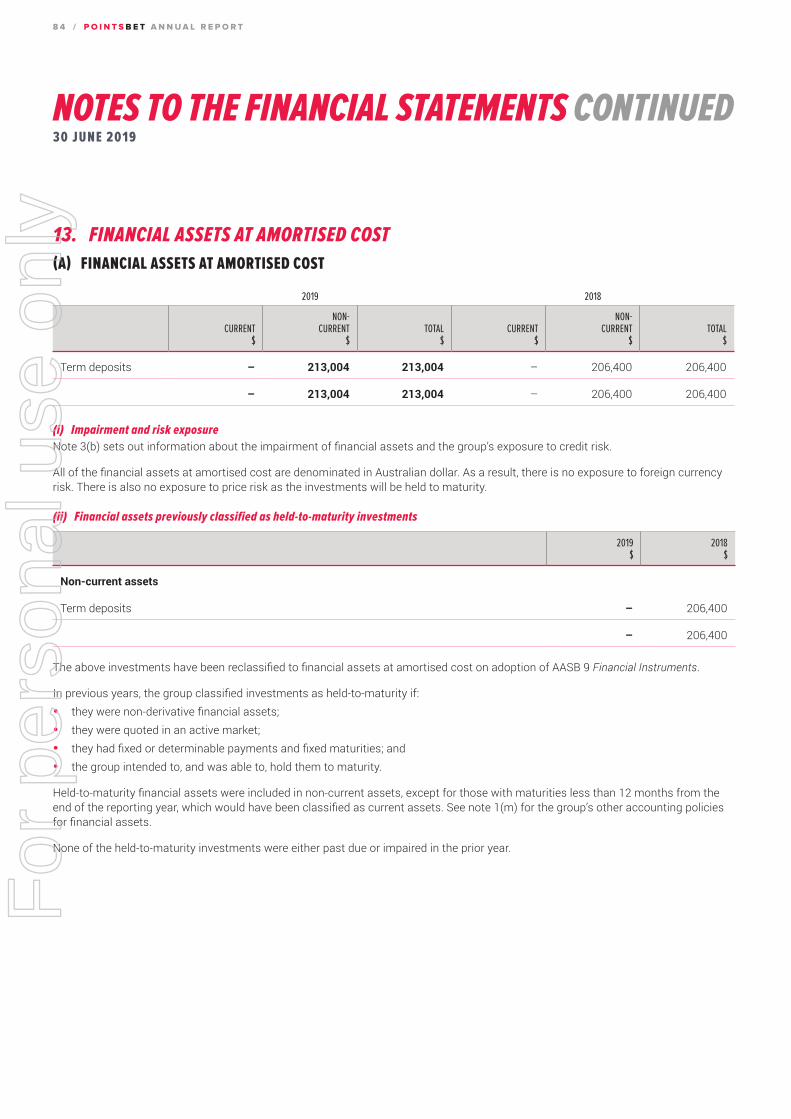
NOTES TO THE FINANCIAL STATEMENTS CONTINUED3 0 J U N E 2 0 1 9
13. FINANCIAL ASSETS AT AMORTISED COST
(A) FINANCIAL ASSETS AT AMORTISED COST
2019 2018
CURRENT $
NON- CURRENT
$TOTAL
$CURRENT
$
NON- CURRENT
$TOTAL
$
Term deposits – 213,004 213,004 – 206,400 206,400
– 213,004 213,004 – 206,400 206,400
(i) Impairment and risk exposureNote 3(b) sets out information about the impairment of financial assets and the group’s exposure to credit risk.
All of the financial assets at amortised cost are denominated in Australian dollar. As a result, there is no exposure to foreign currency risk. There is also no exposure to price risk as the investments will be held to maturity.
(ii) Financial assets previously classified as held-to-maturity investments
2019 $
2018 $
Non-current assets
Term deposits – 206,400
– 206,400
The above investments have been reclassified to financial assets at amortised cost on adoption of AASB 9 Financial Instruments.
In previous years, the group classified investments as held-to-maturity if:�—they were non-derivative financial assets;�—they were quoted in an active market;�—they had fixed or determinable payments and fixed maturities; and�—the group intended to, and was able to, hold them to maturity.
Held-to-maturity financial assets were included in non-current assets, except for those with maturities less than 12 months from the end of the reporting year, which would have been classified as current assets. See note 1(m) for the group’s other accounting policies for financial assets.
None of the held-to-maturity investments were either past due or impaired in the prior year.
8 4 / P O I N T S B E T A N N U A L R E P O R T
For
per
sona
l use
onl
y

14. PLANT AND EQUIPMENT
NON-CURRENTOFFICE EQUIPMENT
$COMPUTER EQUIPMENT
$
LEASEHOLD IMPROVEMENTS
$
ASSETS UNDER CONSTRUCTION
$TOTAL
$
At 1 July 2017
Cost 29,771 142,667 – – 172,438
Accumulated depreciation (1,692) (27,657) – – (29,349)
Net book amount 28,079 115,010 – – 143,089
Year ended 30 June 2018
Opening net book amount 28,079 115,010 – – 143,089
Additions 2,577 114,003 39,344 – 155,924
Depreciation charge (3,748) (51,171) (7,107) – (62,026)
Closing net book amount 26,908 177,842 32,237 – 236,987
At 30 June 2018
Cost 32,348 256,670 39,344 – 328,362
Accumulated depreciation (5,440) (78,828) (7,107) – (91,375)
Net book amount 26,908 177,842 32,237 – 236,987
Year ended 30 June 2019
Opening net book amount 26,908 177,842 32,237 – 236,987
Additions 45,547 648,806 933,727 356,481 1,984,561
Depreciation charge (9,297) (322,200) (53,986) – (385,483)
Closing net book amount 63,158 504,448 911,978 356,481 1,836,065
At 30 June 2019
Cost 77,875 907,353 973,270 356,481 2,314,979
Accumulated depreciation (14,717) (402,905) (61,292) – (478,914)
Net book amount 63,158 504,448 911,978 356,481 1,836,065
P O I N T S B E T A N N U A L R E P O R T / 8 5
For
per
sona
l use
onl
y

NOTES TO THE FINANCIAL STATEMENTS CONTINUED3 0 J U N E 2 0 1 9
15. INTANGIBLE ASSETS
LICENCES AND MARKET ACCESS
$SOFTWARE
$
BETTING PLATFORM DEVELOPMENT
$TOTAL
$
At 1 July 2017
Cost – – 1,206,150 1,206,150
Accumulated amortisation – – (64,928) (64,928)
Net book amount – – 1,141,222 1,141,222
Year ended 30 June 2018
Opening net book amount – – 1,141,222 1,141,222
Additions – – 1,348,122 1,348,122
Amortisation charge – – (297,836) (297,836)
Closing net book amount – – 2,191,508 2,191,508
At 30 June 2018
Cost – – 2,554,272 2,554,272
Accumulated amortisation – – (362,764) (362,764)
Net book amount – – 2,191,508 2,191,508
Year ended 30 June 2019
Opening net book amount – – 2,191,508 2,191,508
Additions 8,542,020 125,178 5,364,419 14,031,617
Amortisation charge (663,027) (2,452) (773,657) (1,439,136)
Closing net book amount 7,878,993 122,726 6,782,270 14,783,989
At 30 June 2019
Cost 8,555,540 125,228 7,918,691 16,599,459
Accumulated amortisation (676,547) (2,502) (1,136,421) (1,815,470)
Net book amount 7,878,993 122,726 6,782,270 14,783,989
8 6 / P O I N T S B E T A N N U A L R E P O R T
For
per
sona
l use
onl
y

16. DEFERRED TAX ASSETS
2019 $
2018 $
The balance comprises temporary differences attributable to:
Tax losses 12,016,483 348,911
Less: temporary differences not recognised (13,191,348) –
Annual leave 350,229 57,953
Deferred income – 103,049
Provisions for chargebacks 70,107 24,969
Black hole expenditure 956,921 –
Other accruals 396,849 –
Provision for doubtful debts 27,326 –
Carry-forward R&D tax offset credits 514,449 –
Total deferred tax assets 1,141,016 534,882
Foreign currency translations and revaluations (6,756) –
Intangible assets (884,835) (534,882)
Plant and equipment (249,425) –
Total deferred tax liabilities pursuant to set-off provisions (1,141,016) (534,882)
Net deferred tax assets – –
17. OTHER NON-CURRENT ASSETS
2019 $
2018 $
Non-current assets
Rental bond 559,354 92,909
P O I N T S B E T A N N U A L R E P O R T / 8 7
For
per
sona
l use
onl
y

NOTES TO THE FINANCIAL STATEMENTS CONTINUED3 0 J U N E 2 0 1 9
18. TRADE AND OTHER PAYABLES
2019 2018
CURRENT $
NON- CURRENT
$TOTAL
$CURRENT
$
NON- CURRENT
$TOTAL
$
Trade payables 4,858,109 – 4,858,109 1,045,093 – 1,045,093
Accrued expenses 4,340,768 – 4,340,768 1,089,545 – 1,089,545
Other payables 424,478 – 424,478 260,938 – 260,938
Total trade and other payables 9,623,355 – 9,623,355 2,395,576 – 2,395,576
Trade payables are unsecured and are usually paid within 30 days of recognition.
The carrying amounts of trade and other payables are considered to be the same as their fair values, due to their short-term nature.
19. BORROWINGSThe group issued convertible notes on 6 August 2018 and 31 October 2018 raising total funds of $23,960,896 under a Converting Note Agreement. The Term of the convertible notes is one year, expiring on 6 August 2019 and 31 October 2019. There is no interest payable on the convertible notes.
The convertible notes are entitled to a 20% discount on the Issue Price of a Qualifying Funding Round or where there has not been a Qualifying Funding Round before the end of the Term, a 20% discount on fair value of an Ordinary Share. The convertible notes were converted to Ordinary shares on 8 March 2019 after the completion of a Qualifying Funding Round. A fair value adjustment of $1,198,045 and total interest payable of $1,815,935 has been recognised in the year for the convertible notes.
20. EMPLOYEE BENEFIT OBLIGATIONS
2019 2018
CURRENT $
NON- CURRENT
$TOTAL
$CURRENT
$
NON- CURRENT
$TOTAL
$
Leave obligations (a) 622,134 88,137 710,271 210,738 – 210,738
(A) LEAVE OBLIGATIONSThe current portion of this liability includes all of the accrued annual leave, the unconditional entitlements to long service leave where employees have completed the required year of service and also for those employees that are entitled to pro-rata payments in certain circumstances. The entire amount of the annual leave provision of $622,134 (2018 – $210,738) is presented as current, since the group does not have an unconditional right to defer settlement for any of these obligations. However, based on past experience, the group does not expect all employees to take the full amount of accrued leave or require payment within the next 12 months. The following amounts reflect leave that is not to be expected to be taken or paid within the next 12 months.
8 8 / P O I N T S B E T A N N U A L R E P O R T
For
per
sona
l use
onl
y

21. PROVISIONS
2019 2018
CURRENT $
NON- CURRENT
$TOTAL
$CURRENT
$
NON- CURRENT
$TOTAL
$
Provision for chargebacks (a) 77,371 – 77,371 90,797 – 90,797
Provision for lease incentive (a) 169,912 – 169,912 – – –
247,283 – 247,283 90,797 – 90,797
(A) INFORMATION ABOUT INDIVIDUAL PROVISIONS AND SIGNIFICANT ESTIMATES
Provision for chargebacksProvision for chargebacks represents an estimate of expected payments for losses on fraudulent or disputed payment transactions.
Provision for lease incentive Provision for lease incentives represents a rental lease incentive provided for the group’s office leases and amortised over the contractual lease incentive period.
(B) MOVEMENTS IN PROVISIONSMovements in each class of provision during the financial year are set out below:
PROVISION FOR CHARGEBACKS
$
PROVISION FOR LEASE INCENTIVE
$TOTAL
$
2019
Carrying amount at start of year 90,797 – 90,797
Charged/(credited) to profit or loss
�—additional provisions recognised – 173,527 173,527
Amounts used during the year (13,426) (3,615) (17,041)
Carrying amount at end of year 77,371 169,912 247,283
2018
Carrying amount at start of year – – –
Charged/(credited) to profit or loss
�—additional provisions recognised 90,797 – 90,797
Carrying amount at end of year 90,797 – 90,797
22. OTHER FINANCIAL LIABILITIES
2019 2018
CURRENT $
NON- CURRENT
$TOTAL
$CURRENT
$
NON- CURRENT
$TOTAL
$
Pending bets – at fair value 861,963 – 861,963 321,338 – 321,338
P O I N T S B E T A N N U A L R E P O R T / 8 9
For
per
sona
l use
onl
y

NOTES TO THE FINANCIAL STATEMENTS CONTINUED3 0 J U N E 2 0 1 9
23. OTHER CURRENT LIABILITIES
2019 $
2018 $
Deferred income 670,161 374,722
Player cash accounts 7,921,139 3,253,938
8,591,300 3,628,660
24. CONTRIBUTED EQUITY
(A) SHARE CAPITAL
2019 SHARES
2018 SHARES
2019 $
2018 $
Ordinary shares
Fully paid 110,000,000 383,784 124,641,045 14,329,174
(B) MOVEMENTS IN ORDINARY SHARES:
DETAILS DATE SHARE PRICE ($) NUMBER OF SHARESTOTAL
$
Opening balance 1 July 2017 313,292 5,829,018
Capital raising 111.72 33,567 3,750,005
Capital raising 134.06 27,973 3,750,060
Share based payments for services 111.72 8,952 1,000,091
Balance 30 June 2018 383,784 14,329,174
Opening balance 1 July 2018 383,784 14,329,174
Exercise of options 31/10/2018 134.06 10,528 1,411,360
Conversion of convertible notes to equity 8/03/2019 178.30 134,409 26,974,876
Capital raising 8/03/2019 222.87 46,641 10,395,136
Exercise of options 30/04/2019 31.45 1,140 35,847
Balance Pre-Share Split 576,502 53,146,393
Shares on issue on 16 May 2019 upon Share Split 16/05/2019 72,500,000 53,146,393
IPO Capital raising 5/06/2019 2.00 37,500,000 75,000,000
Less: Share issue costs – (3,505,348)
Balance 30 June 2019 110,000,000 124,641,045
On 8 March 2019 PointsBet Holdings Limited raised $10,395,136 via an equity placement to new and existing shareholders; and converted $26,974,876 of convertible notes to equity.
On 16 May 2019, the company undertook a capital reconstruction by which each Share was split into 125.758 Shares and each Option was split into 125.758 Options. This resulted in the issued capital of the company increasing from 576,502 to 72,500,000 Shares and from 69,392 to 8,726,631 Options.
In addition, the company raised capital of $75,000,000 through an initial public offering (IPO) in June 2019.
9 0 / P O I N T S B E T A N N U A L R E P O R T
For
per
sona
l use
onl
y

(i) Ordinary sharesOrdinary shares entitle the holder to participate in dividends and the proceeds on winding up of the company in proportion to the number of and amounts paid on the shares held.
On a show of hands every holder of ordinary shares presents at a meeting in person or by proxy, is entitled to one vote, and upon a poll each share is entitled to one vote.
(C) RISK MANAGEMENTThe group’s objectives when managing capital is to safeguard its ability to continue as a going concern, so that it can provide returns for shareholders and benefits for other stakeholders and to maintain an optimum capital structure to reduce the cost of capital.
Capital is regarded as total equity, as recognised in the Consolidated Statement of Financial Position, plus net debt. Net debt is calculated as total borrowings less cash and cash equivalents.
In order to maintain or adjust the capital structure, the group may adjust the amount of dividends paid to shareholders, return capital to shareholders, issue new shares or sell assets to reduce debt as appropriate in managing its capital structure.
The group would only look to raise capital when an opportunity to invest in the company and seen as value adding relative to the current company’s share price at the time of the investment.
25. RESERVES AND ACCUMULATED LOSSES
(A) RESERVESThe following table shows a breakdown of the Consolidated Statement of Financial Position line item ‘other reserves’ and the movements in these reserves during the year. A description of the nature and purpose of each reserve is provided below the table.
NOTES
SHARE-BASED PAYMENTS
$
FOREIGN CURRENCY TRANSLATION
$
TOTAL OTHER RESERVES
$
At 1 July 2017 9,066 – 9,066
Transactions with owners in their capacity as owners
Share-based payment expenses 34 189,342 – 189,342
At 30 June 2018 198,408 – 198,408
At 1 July 2018 198,408 – 198,408
Other currency translation differences – 137,554 137,554
Transactions with owners in their capacity as owners
Share-based payment expenses 34 1,548,969 – 1,548,969
At 30 June 2019 1,747,377 137,554 1,884,931
P O I N T S B E T A N N U A L R E P O R T / 9 1
For
per
sona
l use
onl
y

NOTES TO THE FINANCIAL STATEMENTS CONTINUED3 0 J U N E 2 0 1 9
(i) Nature and purpose of other reserves
Share-based paymentsThe share-based payments reserve is used to recognise:�—the grant date fair value of options issued to employees but not exercised.
(ii) Foreign currency translationExchange differences arising on translation of the foreign controlled entity are recognised in other comprehensive income as described in note 1(d) and accumulated in a separate reserve within equity. The cumulative amount is reclassified to profit or loss when the net investment is disposed of.
(B) ACCUMULATED LOSSESMovements in accumulated losses were as follows:
2019 $
2018 $
Balance 1 July (10,134,105) (3,476,523)
Loss for the year (41,885,150) (6,657,582)
Balance 30 June (52,019,255) (10,134,105)
26. REMUNERATION OF AUDITORSDuring the year the following fees were paid or payable for services provided by the auditor of the parent entity and its related practice:
(A) RSM AUSTRALIA PARTNERS
(i) Audit and other assurance services
2019 $
2018 $
Audit and review of financial statements 148,200 43,500
Total remuneration for audit and other assurance services 148,200 43,500
(ii) Other services
Investigative accountant 36,500 –
Total remuneration for other services 36,500 –
Total auditors’ remuneration 184,700 43,500
27. CONTINGENT LIABILITIES AND CONTINGENT ASSETSThe group had no contingent liabilities nor contingent assets as at 30 June 2019 (2018: nil).
(A) RESERVES (CONTINUED)
9 2 / P O I N T S B E T A N N U A L R E P O R T
For
per
sona
l use
onl
y

28. COMMITMENTS
(A) CAPITAL COMMITMENTSSignificant capital expenditure contracted for at the end of the reporting year but not recognised as liabilities is as follows:
2019 $
2018 $
Sportsbook Fitout
Within one year 6,814,466 –
Total 6,814,466 –
Licences and market access
Within one year 15,891,912 –
Later than one year but not later than five years 7,129,615 –
Total 23,021,527 –
(B) LEASE COMMITMENTS: GROUP AS LESSEE
(i) Non-cancellable operating leasesThe group leases various offices under non-cancellable operating leases expiring within 1 to 4 years. The leases have varying terms, escalation clauses and renewal rights. On renewal, the terms of the leases are renegotiated.
2019 $
2018 $
Commitments for minimum lease payments in relation to non-cancellable operating leases are payable as follows:
Within one year 1,140,325 118,710
Later than one year but not later than five years 2,013,351 111,106
Total 3,153,676 229,816
Rental expense relating to operating leases
Total rental expense relating to operating leases 205,416 164,047
(C) OTHER COMMITMENTS
2019 $
2018 $
Commitments for the payment of marketing and operational expenses under long-term contracts in existence at the reporting date but not recognised as liabilities, payable:
Within one year 6,263,900 –
Later than one year but not later than five years 1,761,226 –
Total 8,025,126 –
P O I N T S B E T A N N U A L R E P O R T / 9 3
For
per
sona
l use
onl
y

NOTES TO THE FINANCIAL STATEMENTS CONTINUED3 0 J U N E 2 0 1 9
29. RELATED PARTY TRANSACTIONS
(A) PARENT ENTITIESThe group is controlled by the following entities:
OWNERSHIP INTEREST
NAME TYPEPLACE OF INCORPORATION 2019 2018
PointsBet Holdings Limited Immediate and ultimate Group parent entity Australia 100% 100%
(B) SUBSIDIARIESInterests in subsidiaries are set out in note 30(a).
(C) KEY MANAGEMENT PERSONNEL AND NON-EXECUTIVE DIRECTOR REMUNERATION COMPENSATION
2019 $
2018 $
Short-term employee benefits 1,034,294 831,723
Post-employment benefits 76,478 78,928
Long-term employee benefits 31,729
Share-based payments 712,047 77,027
1,854,548 987,678
(D) TRANSACTIONS WITH OTHER RELATED PARTIESThe following transactions occurred with related parties:
2019 $
2018 $
Sales and purchases of goods and services
Payment for services from AP Symons 490,153 44,203
AP Symons, a Non-Executive Director, is Managing Director and majority beneficial owner of Clarendon Lawyers, the company’s Australian legal advisor and material services provider to the company.
(E) OUTSTANDING BALANCES ARISING FROM SALES/PURCHASES OF GOODS AND SERVICESThe following balances are outstanding at the end of the reporting year in relation to transactions with related parties:
2019 $
2018 $
Current payables (purchases of goods and services)
Payables to N J Fahey – 42,145
(F) TERMS AND CONDITIONS
All transactions were made on normal commercial terms and conditions and at market rates.
9 4 / P O I N T S B E T A N N U A L R E P O R T
For
per
sona
l use
onl
y

30. INTERESTS IN OTHER ENTITIES
(A) MATERIAL SUBSIDIARIESThe group’s principal subsidiaries at 30 June 2019 are set out below. Unless otherwise stated, they have share capital consisting solely of ordinary shares that are held directly by the group, and the proportion of ownership interests held equals the voting rights held by the group. The country of incorporation or registration is also their principal place of business.
OWNERSHIP INTEREST HELD BY THE GROUP
NAME OF ENTITYPLACE OF BUSINESS/COUNTRY OF
INCORPORATION2019
%2018
% PRINCIPAL ACTIVITIES
PointsBet Australia Pty Ltd Australia 100 100 Online sports betting
PointsBet Pty Ltd Australia 100 100 Software development
PointsBet USA Holding Inc USA 100 – Holding company
PB Services Inc USA 100 – Holding company
USA Bet LLC USA 100 – Marketing services
PB Tech & Advisory LLC USA 100 – Gaming support services
PointsBet USA Inc USA 100 – Holding company
PointsBet New York LLC USA 100 – Dormant entity
PointsBet New Jersey LLC USA 100 – Online sports betting
PointsBet Colorado LLC USA 100 – Dormant entity
PointsBet Illinois LLC USA 100 – Online and retail sports betting
PointsBet Iowa LLC USA 100 – Online and retail sports betting
31. EVENTS OCCURRING AFTER THE REPORTING PERIODOn 1 August 2019, PointsBet USA Inc. (“PointsBet”) a wholly owned subsidiary of PointsBet Holdings Limited (“the group”) entered into an agreement with Penn National Gaming Inc. (NASDAQ: PENN) (“PNG”) for digital and gaming services in the United States.
Under the Online Services Framework Agreement , PNG granted PointsBet the right to develop, own market and operate under the authority of the PNG’s operating licenses, PointsBet branded online sportsbook and gaming operations in Ohio, Indiana, Missouri, West Virginia and Louisiana subject to enabling legislation (as relevant) and licensure in each of those States.
In consideration of the market access granted under the Agreement, the group entered into a subscription agreement with PNG, under which Penn Interactive Ventures, LLC, a wholly owned subsidiary of PNG, was issued 6,127,451 new fully paid ordinary shares in the company (equivalent to a 5.28% stake) on 1 August 2019.
The company also issued PNG 10,372,549 options exercisable at $4.75 per option on or before 12 September 2021.
No other matters or circumstances have occurred subsequent to year end that has significantly affected, or may significantly affect, the operations of the group, the results of those operations or the state of affairs of the group or economic entity in subsequent financial years.
P O I N T S B E T A N N U A L R E P O R T / 9 5
For
per
sona
l use
onl
y

NOTES TO THE FINANCIAL STATEMENTS CONTINUED3 0 J U N E 2 0 1 9
32. CASH FLOW INFORMATION
(A) RECONCILIATION OF LOSS FOR THE YEAR TO NET CASH OUTFLOW FROM OPERATING ACTIVITIES
NOTES2019
$2018
$
Loss for the year (41,885,150) (6,657,582)
Adjustments for:
Depreciation and amortisation 8 1,824,619 359,862
Share-based payments 854,844 769,355
Share option expense 1,548,969 189,342
Fair value loss on conversion of convertible notes 1,198,045 –
Net exchange differences 695,981 –
Interest expenses on convertible notes 1,815,935 –
Change in operating assets and liabilities
(Increase)/decrease in trade and other receivables (369,775) 24,659
Decrease/(increase) in other assets (133,453) (158,284)
Increase in trade and other payables and deferred income 7,523,218 2,406,837
Increase in player cash accounts 5,207,826 2,596,261
Increase in provisions 656,019 200,957
Net cash outflow from operating activities (21,062,922) (268,593)
33. EARNINGS PER SHARE
(A) BASIC AND DILUTED EARNINGS PER SHARE
2019 CENTS
2018 CENTS
From continuing operations attributable to the ordinary equity holders of the company (72.1) (15.6)
Total basic and diluted earnings per share attributable to the ordinary equity holders of the company (72.1) (15.6)
9 6 / P O I N T S B E T A N N U A L R E P O R T
For
per
sona
l use
onl
y

(B) RECONCILIATIONS OF EARNINGS USED IN CALCULATING EARNINGS PER SHARE
2019 $
2018 $
Basic earnings per share
Loss attributable to the ordinary equity holders of the company used in calculating basic earnings per share:
From continuing operations (41,885,150) (6,657,582)
(41,885,150) (6,657,582)
(C) WEIGHTED AVERAGE NUMBER OF SHARES USED AS THE DENOMINATOR
2019 NUMBER
2018 NUMBER
Weighted average number of ordinary shares used as the denominator in calculating basic earnings per share 58,126,456 42,796,285
Adjustments for calculation of diluted earnings per share:
Options 9,883,150 1,982,707
Weighted average number of ordinary and potential ordinary shares used as the denominator in calculating diluted earnings per share 68,009,606 44,778,992
(D) INFORMATION CONCERNING THE CLASSIFICATION OF SECURITIES
(i) OptionsOptions granted to employees under the Employee Option Plan are considered to be potential ordinary shares. They have been included in the determination of diluted earnings per share if the required vesting condition have been met based on the company share price performance and time-based vesting condition and to the extent to which they are dilutive. The options have not been included in determination of basic earnings per share.
Options have been excluded from the above calculations in the current and previous year as their inclusion will be anti-dilutive.
P O I N T S B E T A N N U A L R E P O R T / 9 7
For
per
sona
l use
onl
y

NOTES TO THE FINANCIAL STATEMENTS CONTINUED3 0 J U N E 2 0 1 9
34. SHARE-BASED PAYMENTS
(A) EMPLOYEE OPTION PLANEmployee Share Option Plan (ESOP) – The terms of the ESOP was disclosed in the Prospectus dated 16 May 2019. The ESOP is designed to provide options over ordinary shares in PointsBet Holdings Limited for senior managers and key management personnel to deliver long-term shareholder returns. Under the plan, participants are granted options which only vest if certain performance standards are met. Participation in the plan is at the board’s discretion and no individual has a contractual right to participate in the plan or to receive any guaranteed benefits.
Set out below are summaries of options granted under the plan:
2019 2018
AVERAGE EXERCISE PRICE PER
SHARE OPTION NUMBER OF OPTIONS
AVERAGE EXERCISE PRICE PER
SHARE OPTION* NUMBER OF OPTIONS*
As at 1 July $0.74 1,982,707 $0.29 791,272
Granted during the year $1.83 8,043,802 $0.94 1,394,158
Exercised during the year** $0.25 (143,359) – –
Forfeited during the year – – $0.39 (202,723)
As at 30 June $0.94 9,883,150 $0.74 1,982,707
Vested and exercisable at 30 June $0.78 1,998,931 – –
* Average exercise price per share and number of options in 2018 have been presented on a post share-split basis.** The weighted average share price at the date of exercise of options exercised during the year ended 30 June 2019 was $1.55 (2018: $0.76).
9 8 / P O I N T S B E T A N N U A L R E P O R T
For
per
sona
l use
onl
y
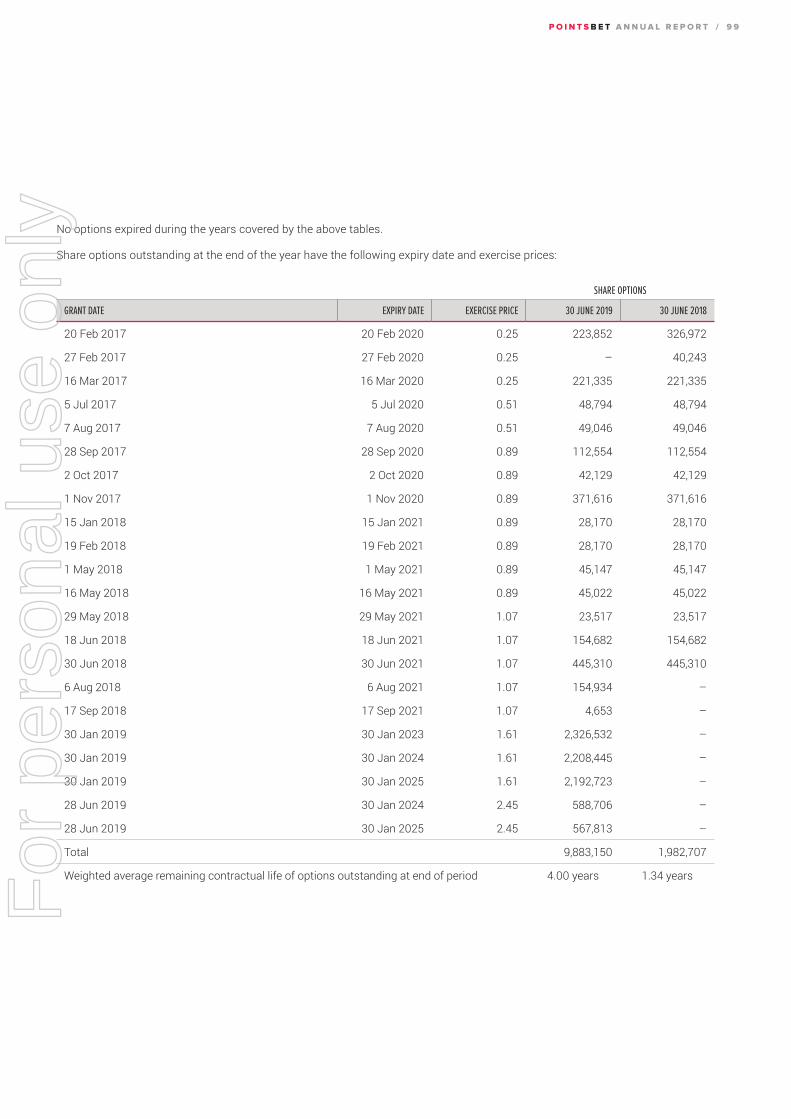
No options expired during the years covered by the above tables.
Share options outstanding at the end of the year have the following expiry date and exercise prices:
SHARE OPTIONS
GRANT DATE EXPIRY DATE EXERCISE PRICE 30 JUNE 2019 30 JUNE 2018
20 Feb 2017 20 Feb 2020 0.25 223,852 326,972
27 Feb 2017 27 Feb 2020 0.25 – 40,243
16 Mar 2017 16 Mar 2020 0.25 221,335 221,335
5 Jul 2017 5 Jul 2020 0.51 48,794 48,794
7 Aug 2017 7 Aug 2020 0.51 49,046 49,046
28 Sep 2017 28 Sep 2020 0.89 112,554 112,554
2 Oct 2017 2 Oct 2020 0.89 42,129 42,129
1 Nov 2017 1 Nov 2020 0.89 371,616 371,616
15 Jan 2018 15 Jan 2021 0.89 28,170 28,170
19 Feb 2018 19 Feb 2021 0.89 28,170 28,170
1 May 2018 1 May 2021 0.89 45,147 45,147
16 May 2018 16 May 2021 0.89 45,022 45,022
29 May 2018 29 May 2021 1.07 23,517 23,517
18 Jun 2018 18 Jun 2021 1.07 154,682 154,682
30 Jun 2018 30 Jun 2021 1.07 445,310 445,310
6 Aug 2018 6 Aug 2021 1.07 154,934 –
17 Sep 2018 17 Sep 2021 1.07 4,653 –
30 Jan 2019 30 Jan 2023 1.61 2,326,532 –
30 Jan 2019 30 Jan 2024 1.61 2,208,445 –
30 Jan 2019 30 Jan 2025 1.61 2,192,723 –
28 Jun 2019 30 Jan 2024 2.45 588,706 –
28 Jun 2019 30 Jan 2025 2.45 567,813 –
Total 9,883,150 1,982,707
Weighted average remaining contractual life of options outstanding at end of period 4.00 years 1.34 years
P O I N T S B E T A N N U A L R E P O R T / 9 9
For
per
sona
l use
onl
y

NOTES TO THE FINANCIAL STATEMENTS CONTINUED3 0 J U N E 2 0 1 9
(i) Fair value of options grantedFor the options granted during the current financial year, the valuation model inputs used to determine the fair value at the grant date, are as follows:
GRANT DATE EXPIRY DATESHARE PRICE AT
GRANT DATE EXERCISE PRICEEXPECTED
VOLATILITY DIVIDEND YIELDRISK-FREE
INTEREST RATEFAIR VALUE AT
GRANT DATE
6 August 2018 6 August 2021 1.07 1.07 100.00% 0.00% 1.95% 0.67
17 September 2018 17 September 2021 1.07 1.07 100.00% 0.00% 1.95% 0.67
30 January 2019 30 January 2023 1.61 1.61 100.00% 0.00% 1.85% 1.12
30 January 2019 30 January 2024 1.61 1.61 100.00% 0.00% 1.91% 1.20
30 January 2019 30 January 2025 1.61 1.61 100.00% 0.00% 1.91% 1.27
28 June 2019 30 January 2024 2.45 2.45 100.00% 0.00% 1.07% 1.80
28 June 2019 30 January 2025 2.45 2.45 100.00% 0.00% 1.07% 1.92
(B) EXPENSES ARISING FROM SHARE-BASED PAYMENT TRANSACTIONSTotal expenses arising from share-based payment transactions recognised during the year as part of employee benefit expense were as follows:
2019 $
2018 $
Options issued under employee option plan 1,548,969 189,343
(C) OTHER SHARE-BASED PAYMENT TRANSACTIONSTotal value of shares issued in consideration for Marketing related services were as follows:
2019 $
2018 $
Shares issued in consideration for Marketing related services 854,844 1,150,104
(A) EMPLOYEE OPTION PLAN (CONTINUED)
1 0 0 / P O I N T S B E T A N N U A L R E P O R T
For
per
sona
l use
onl
y

35. PARENT ENTITY FINANCIAL INFORMATION
(A) SUMMARY FINANCIAL INFORMATIONThe individual financial statements for the parent entity show the following aggregate amounts:
2019 $
2018 $
Balance sheet
Current assets 72,886,634 8,627,266
Non-current assets 48,389,021 5,983,321
Total assets 121,275,655 14,610,587
Current liabilities 708,865 121,847
Non-current liabilities 31,729 –
Total liabilities 740,594 121,847
Net assets 120,535,061 14,488,740
Share capital 124,641,045 14,329,174
Other reserves 1,747,377 198,408
Accumulated losses (5,853,361) (38,842)
Total equity 120,535,061 14,488,740
Loss for the year (5,814,519) (38,842)
Total comprehensive loss (5,814,519) (38,842)
P O I N T S B E T A N N U A L R E P O R T / 1 0 1
For
per
sona
l use
onl
y

NOTES TO THE FINANCIAL STATEMENTS CONTINUED3 0 J U N E 2 0 1 9
(B) GUARANTEES ENTERED INTO BY THE PARENT ENTITYThe parent entity did not enter any guarantees as at 30 June 2019 or 30 June 2018.
(C) CONTINGENT LIABILITIES OF THE PARENT ENTITYThe parent entity did not have any contingent liabilities as at 30 June 2019 or 30 June 2018. For information about guarantees given by the parent entity, please see above.
(D) CONTRACTUAL COMMITMENTS FOR THE ACQUISITION OF PLANT OR EQUIPMENTThe parent entity did not have contractual commitment as at 30 June 2019 or 30 June 2018.
(E) DETERMINING THE PARENT ENTITY FINANCIAL INFORMATIONThe financial information for the parent entity has been prepared on the same basis as the consolidated financial statements, except as set out below.
(i) Investments in subsidiaries, associates and joint venture entitiesInvestments in subsidiaries, associates and joint venture entities are accounted for at cost in the financial statements of PointsBet Holdings Limited. Dividends received from associates are recognised in the parent entity’s profit or loss when its right to receive the dividend is established.
(ii) Financial guaranteesWhere the parent entity has provided financial guarantees in relation to loans and payables of subsidiaries for no compensation, the fair values of these guarantees are accounted for as contributions and recognised as part of the cost of the investment.
(iii) Share-based paymentsThe grant by the company of options over its equity instruments to the employees of subsidiary undertakings in the group is treated as a capital contribution to that subsidiary undertaking. The fair value of employee services received, measured by reference to the grant date fair value, is recognised over the vesting year as an increase to investment in subsidiary undertakings, with a corresponding credit to equity.
1 0 2 / P O I N T S B E T A N N U A L R E P O R T
For
per
sona
l use
onl
y

DIRECTORS’ DECLARATION
In the Directors’ opinion:
(a) the financial statements and notes set out on pages 53 to 102 are in accordance with the Corporations Act 2001, including:(i) complying with Accounting Standards, the Corporations Regulations 2001 and other mandatory professional reporting
requirements, and(ii) giving a true and fair view of the consolidated entity’s financial position as at 30 June 2019 and of its performance for the
financial year ended on that date, and(b) there are reasonable grounds to believe that the company will be able to pay its debts as and when they become due and payable.
The directors have been given the declarations by the chief executive officer and chief financial officer required by section 295A of the Corporations Act 2001.
This declaration is made in accordance with a resolution of directors.
BWF PatonDirector
Cremorne 28 August 2019
P O I N T S B E T A N N U A L R E P O R T / 1 0 3
For
per
sona
l use
onl
y

INDEPENDENT AUDITOR’S REPORT
THE POWER OF BEING UNDERSTOODAUDIT | TAX | CONSULTING
RSM Australia Partners is a member of the RSM network and trades as RSM. RSM is the trading name used by the members of the RSM network. Each member of the RSM network is an independent accounting and consulting firm which practices in its own right. The RSM network is not itself a separate legal entity in any jurisdiction.
RSM Australia Partners ABN 36 965 185 036
Liability limited by a scheme approved under Professional Standards Legislation
RSM Australia Partners
Level 21, 55 Collins Street Melbourne VIC 3000 PO Box 248 Collins Street West VIC 8007
T +61 (0) 3 9286 8000 F +61 (0) 3 9286 8199
www.rsm.com.au
INDEPENDENT AUDITORʼS REPORT To the Members of PointsBet Holdings Limited
Opinion
We have audited the financial report of PointsBet Holdings Limited (the Company), and its subsidiaries (the Group), which comprises the consolidated statement of financial position as at 30 June 2019, the consolidated statement of profit or loss and other comprehensive income, the consolidated statement of changes in equity and the consolidated statement of cash flows for the year then ended, and notes to the financial statements, including a summary of significant accounting policies, and the directors' declaration.
In our opinion the accompanying financial report of the Group is in accordance with the Corporations Act 2001, including:
(i) giving a true and fair view of the Group's financial position as at 30 June 2019 and of its financial performance for the year then ended; and
(ii) complying with Australian Accounting Standards and the Corporations Regulations 2001.
Basis for Opinion
We conducted our audit in accordance with Australian Auditing Standards. Our responsibilities under those standards are further described in the Auditor's Responsibilities for the Audit of the Financial Report section of our report. We are independent of the Group in accordance with the auditor independence requirements of the Corporations Act 2001 and the ethical requirements of the Accounting Professional and Ethical Standards Board's APES 110 Code of Ethics for Professional Accountants (the Code) that are relevant to our audit of the financial report in Australia. We have also fulfilled our other ethical responsibilities in accordance with the Code.
We confirm that the independence declaration required by the Corporations Act 2001, which has been given to the directors of the Company, would be in the same terms if given to the directors as at the time of this auditor's report.
We believe that the audit evidence we have obtained is sufficient and appropriate to provide a basis for our opinion.
Key Audit Matters
Key audit matters are those matters that, in our professional judgement, were of most significance in our audit of the financial report of the current period. These matters were addressed in the context of our audit of the financial report as a whole, and in forming our opinion thereon, and we do not provide a separate opinion on these matters.
1 0 4 / P O I N T S B E T A N N U A L R E P O R T
For
per
sona
l use
onl
y

Key Audit Matter How our audit addressed this matter
Betting wins and losses Refer to Note 6 in the financial statements The Group earned revenue from customers of $25,615,267 from net betting wins.
The completeness and accuracy of revenue recognised is dependent on the interfacing systems within the betting platform, and is reliant on the IT control environment and the manual controls around reconciling reports received from the betting platform.
Due to the complexity of this environment there is a risk that revenue errors are undetected or are not detected on a timely basis
Our audit procedures in relation to betting wins and losses included: Evaluating and testing the effectiveness of the
manual controls in the revenue cycle including reconciliations of player cash accounts, pending bets, betting turnover and betting wins and losses by product class.
Testing IT general controls of the systems within the betting platform including the interface between these systems and the completeness and accuracy of reports generated from the betting platform;
Performing substantive analytical review procedures over betting wins and losses;
Performing detailed testing on a sample of bets placed to confirm their appropriate settlement and that the win or loss was recorded correctly; and
Performing detailed testing on a sample of player accounts to confirm the existence of the customer and compliance with Know Your Customer verifications checks.
Share based payments Refer to Note 34 in the financial statements PointsBet have an employee share option plan (“ESOP”) as part of the remuneration packages of employees.
We identified share-based payments as a key risk due the complexity in the valuation of the options issued, and the estimates made by management in relation to the achievement of vesting conditions.
Our audit procedures in relation to share based payments included: Reviewing the reasonableness of option valuation
inputs into the Binomial Options Pricing Model including assessment of the share volatility rates applied in comparison to entities in the similar industry; and
Performing a recalculation of the Binomial Options Pricing Model for a sample of options issued;
Testing a sample of options issued to signed ESOP agreements;
Reviewing the accounting for the share-based payments in accordance with AASB 2 Share-based Payments; and
Reviewing the reasonableness of managementʼs estimates of the likelihood of the achievement of vesting conditions for the options issued.
P O I N T S B E T A N N U A L R E P O R T / 1 0 5
For
per
sona
l use
onl
y

INDEPENDENT AUDITOR’S REPORT CONTINUED
Key Audit Matter How our audit addressed this matter
Accounting for intangible asset Refer to Note 15 in the financial statements At 30 June 2019 the Group has intangible assets with a carrying value of $14,783,989, being development costs in respect of the betting platform, and the US bookmaker licences.
We focused on this are due to the size of the intangible asset balance and the risk that the amounts capitalised do not meet the recognition and measurement criteria under AASB 138 Intangible Assets.
In addition, there is a risk that the carrying value is impaired under AASB 136 Impairment of Assets.Management has performed an impairment assessment over the balance of intangible assets in each cash-generating unit (“CGU”).
Our audit procedures in relation to the capitalisation of intangibles assets included; Assessing whether the Groupʼs capitalisation
policies were in compliance with AASB 138; Testing a sample of capitalised assets to ensure
they met the recognition and measurement criteria of AASB 138;
Reviewing the reasonableness of managementʼs assessment of expected future economic benefits that are attributable to the intangible assets; and
Testing the completeness of the capitalised asset by reviewing expense nominal ledgers for costs not capitalised
Our audit procedures in relation to management's assessment of impairment included: Reviewing managementʼs identification of each
CGU based on the group of assets which generate independent cashflows;
Assessing the valuation methodology used in the impairment assessment of each CGU;
Where the valuation methodology is based on a value in use discounted cashflow model, challenging the reasonableness of key assumptions, including the cashflow projections, revenue growth rates, discount rates, and sensitivities used; and checking the mathematical accuracy of the cashflow model, and reconciling input data to supporting evidence, such as approved budgets and considering the reasonableness of these budgets;
Where the valuation methodology is based on fair value less cost of disposal, reviewing evidence of fair value that would be received to sell the asset in an orderly transaction; and
Reviewing the accuracy of disclosures of critical estimates and assumptions in the financial report in relation to the valuation methodologies.
1 0 6 / P O I N T S B E T A N N U A L R E P O R T
For
per
sona
l use
onl
y

Other Information
The directors are responsible for the other information. The other information comprises the information included in the Group's annual report for the year ended 30 June 2019, but does not include the financial report and the auditor's report thereon.
Our opinion on the financial report does not cover the other information and accordingly we do not express any form of assurance conclusion thereon.
In connection with our audit of the financial report, our responsibility is to read the other information and, in doing so, consider whether the other information is materially inconsistent with the financial report or our knowledge obtained in the audit or otherwise appears to be materially misstated.
If, based on the work we have performed, we conclude that there is a material misstatement of this other information, we are required to report that fact. We have nothing to report in this regard.
Responsibilities of the Directors for the Financial Report
The directors of the Company are responsible for the preparation of the financial report that gives a true and fair view in accordance with Australian Accounting Standards and the Corporations Act 2001 and for such internal control as the directors determine is necessary to enable the preparation of the financial report that gives a true and fair view and is free from material misstatement, whether due to fraud or error.
In preparing the financial report, the directors are responsible for assessing the ability of the Group to continue as a going concern, disclosing, as applicable, matters related to going concern and using the going concern basis of accounting unless the directors either intend to liquidate the Group or to cease operations, or have no realistic alternative but to do so.
Auditor's Responsibilities for the Audit of the Financial Report
Our objectives are to obtain reasonable assurance about whether the financial report as a whole is free from material misstatement, whether due to fraud or error, and to issue an auditor's report that includes our opinion. Reasonable assurance is a high level of assurance, but is not a guarantee that an audit conducted in accordance with the Australian Auditing Standards will always detect a material misstatement when it exists. Misstatements can arise from fraud or error and are considered material if, individually or in the aggregate, they could reasonably be expected to influence the economic decisions of users taken on the basis of this financial report.
A further description of our responsibilities for the audit of the financial report is located at the Auditing and Assurance Standards Board website at: www.auasb.gov.au/auditors_responsibilities/ar2.pdf. This description forms part of our auditor's report.
P O I N T S B E T A N N U A L R E P O R T / 1 0 7
For
per
sona
l use
onl
y

INDEPENDENT AUDITOR’S REPORT CONTINUED
Report on the Remuneration Report
Opinion on the Remuneration Report
We have audited the Remuneration Report included in the directors' report for the year ended 30 June 2019.
In our opinion, the Remuneration Report of PointsBet Holdings Limited, for the year ended 30 June 2019, complies with section 300A of the Corporations Act 2001.
Responsibilities
The directors of the Company are responsible for the preparation and presentation of the Remuneration Report in accordance with section 300A of the Corporations Act 2001. Our responsibility is to express an opinion on the Remuneration Report, based on our audit conducted in accordance with Australian Auditing Standards.
RSM AUSTRALIA PARTNERS
B Y CHAN Partner
Dated: 28 August 2019 Melbourne, Victoria
1 0 8 / P O I N T S B E T A N N U A L R E P O R T
For
per
sona
l use
onl
y
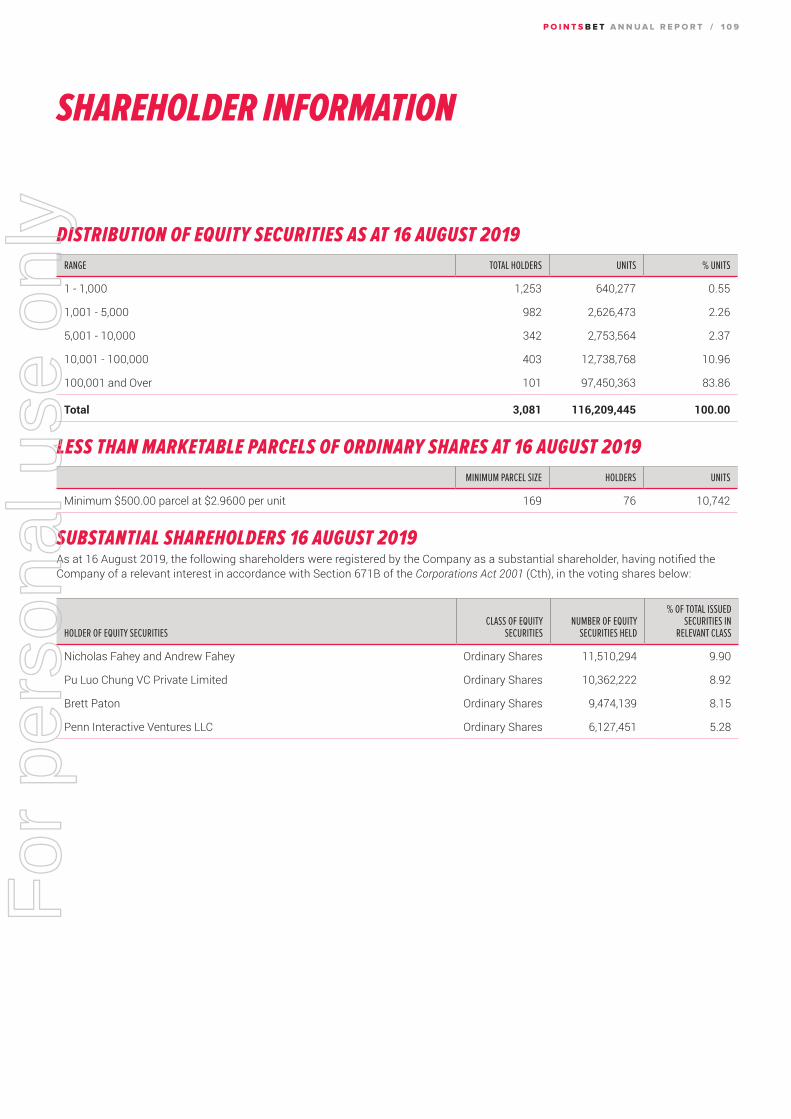
DISTRIBUTION OF EQUITY SECURITIES AS AT 16 AUGUST 2019
RANGE TOTAL HOLDERS UNITS % UNITS
1 - 1,000 1,253 640,277 0.55
1,001 - 5,000 982 2,626,473 2.26
5,001 - 10,000 342 2,753,564 2.37
10,001 - 100,000 403 12,738,768 10.96
100,001 and Over 101 97,450,363 83.86
Total 3,081 116,209,445 100.00
LESS THAN MARKETABLE PARCELS OF ORDINARY SHARES AT 16 AUGUST 2019
MINIMUM PARCEL SIZE HOLDERS UNITS
Minimum $500.00 parcel at $2.9600 per unit 169 76 10,742
SUBSTANTIAL SHAREHOLDERS 16 AUGUST 2019As at 16 August 2019, the following shareholders were registered by the Company as a substantial shareholder, having notified the Company of a relevant interest in accordance with Section 671B of the Corporations Act 2001 (Cth), in the voting shares below:
HOLDER OF EQUITY SECURITIESCLASS OF EQUITY
SECURITIESNUMBER OF EQUITY
SECURITIES HELD
% OF TOTAL ISSUED SECURITIES IN
RELEVANT CLASS
Nicholas Fahey and Andrew Fahey Ordinary Shares 11,510,294 9.90
Pu Luo Chung VC Private Limited Ordinary Shares 10,362,222 8.92
Brett Paton Ordinary Shares 9,474,139 8.15
Penn Interactive Ventures LLC Ordinary Shares 6,127,451 5.28
SHAREHOLDER INFORMATION
P O I N T S B E T A N N U A L R E P O R T / 1 0 9
For
per
sona
l use
onl
y

TWENTY LARGEST ORDINARY SHAREHOLDERS AS AT 19 AUGUST 2019RANK NAME UNITS % UNITS
1 HSBC CUSTODY NOMINEES (AUSTRALIA) LIMITED 9,776,316 8.41
2 CITICORP NOMINEES PTY LIMITED 9,716,236 8.36
3 N J FAHEY PTY LTD <FAHEY FAMILY 1 A/C> 7,784,700 6.70
4 PENN INTERACTIVE VENTURES LLC 6,127,451 5.27
5 MRS MELISSAH MULLIN 4,181,846 3.60
6 ELMSLIE SUPERANNUATION COMPANY PTY LTD <ELMSLIE FAMILY S/F A/C> 4,111,169 3.54
7 N J FAHEY PTY LTD <FAHEY FAMILY 2 A/C> 3,433,080 2.95
8 VANESSA SWANELL <BIG SWAN A/C> 3,209,607 2.76
9 ARKINDALE PTY LTD <B N SINGER(NO 2)FAMILY A/C> 2,954,265 2.54
10 MR BRETT WILLIAM FISHER PATON + MRS VICKI ANNE PATON <BRETT PATON FAMILY SUPER A/C> 2,705,812 2.33
11 NATIONAL NOMINEES LIMITED 2,097,413 1.80
12 TYARA PTY LIMITED <BRUCE WC WILSON PROPERTY A/C> 1,906,990 1.64
13 MR RICHARD FISH 1,874,430 1.61
14 MR BRETT WILLIAM FISHER PATON 1,823,570 1.57
15 UBS NOMINEES PTY LTD 1,626,940 1.40
16 BRETT PATON SUPERANNUATION PTY LTD <BRETT PATON SUPER FUND A/C> 1,494,316 1.29
17 MERRILL LYNCH (AUSTRALIA) NOMINEES PTY LIMITED 1,420,396 1.22
18 PU LUO CHUNG VC PRIVATE LTD 1,328,931 1.14
19 DOUG PASCOE INVESTMENTS PTY LTD <DOUG PASCOE INVESTMENT A/C> 1,206,120 1.04
20 CS FOURTH NOMINEES PTY LIMITED <HSBC CUST NOM AU LTD 11 A/C> 1,195,343 1.03
Totals: Top 20 holders of ORDINARY FULLY PAID SHARES (Total) 69,974,931 60.21
Total Remaining Holders Balance 46,234,514 39.79
SHAREHOLDER INFORMATION CONTINUED
1 1 0 / P O I N T S B E T A N N U A L R E P O R T
For
per
sona
l use
onl
y

SECURITIES SUBJECT TO VOLUNTARY ESCROW AS AT 19 AUGUST 2019
CLASS OF RESTRICTED SECURITIES NUMBER OF SECURITIES END DATE OF ESCROW PERIOD
Ordinary Shares 6,127,451 1 August 2020
Ordinary Shares 225,353 20 February 2020
VOTING RIGHTS At meetings of shareholders, each shareholder may vote in person or by proxy, attorney or (if the shareholder is a body corporate) corporate representative. On a show of hands, every person present who is a shareholder or a representative of a shareholder has one vote and on a poll every shareholder present in person or by proxy or attorney has one vote for each fully-paid ordinary share. Performance share right holders have no voting rights.
REGULATORY CONSIDERATIONS AFFECTING SHAREHOLDERS PointsBet Holdings Limited and its subsidiaries could be subject to disciplinary action by wagering and gaming authorities in some jurisdictions if, after receiving notice that a person is unsuitable to be a shareholder, that person continues to be a shareholder. Because of the importance of licensing to the Company and its subsidiaries, the Constitution contains provisions that may require shareholders to provide information and also gives the Company powers to divest or require divestiture of shares, suspend voting rights and withhold payments of certain amounts to shareholders or other persons who may be unsuitable.
SHAREHOLDER ENQUIRIES You can access information about PointsBet Holdings Limited and your holdings via the internet. PointsBet’s investor website, https://investors.pointsbet.com.au/, has the latest information on Company announcements, presentations and reports. In addition, there is a link to the Australian Securities Exchange to provide current share prices. The share registry manages all your shareholding details. Visit https://www-au.computershare.com/investor/ and access a wide variety of holding information, make changes to your holding record and download forms. You can access this information via a security login using your Securityholder Reference Number (SRN) or Holder Identification Number (HIN).
DIVIDENDS The payment of dividends by the Company is at the complete discretion of the Directors. Given the stage of development of the Company, the Directors have no current intention to declare and pay a dividend.
In determining whether to declare future dividends, the Directors will have regard to PointsBet’s earnings, overall financial condition, capital requirements and the level of franking credits available.
ON-MARKET BUY-BACKAs at the date of this Annual Report, there is no current on-market buy-back.
USE OF CASHThe Company’s use of cash (and assets in a form readily convertible to cash) that it had at the time of admission to the Australian Securities Exchange is consistent with its business objectives as set out in the Review of Operations forming part of this Annual Report.
P O I N T S B E T A N N U A L R E P O R T / 1 1 1
For
per
sona
l use
onl
y

This page has been left intentionally blank.
1 1 2 / P O I N T S B E T A N N U A L R E P O R T
For
per
sona
l use
onl
y

CORPORATE DIRECTORY
P O I N T S B E T A N N U A L R E P O R T
DIRECTORS BWF Paton Non-Executive Chairman
SJ SwanellChief Executive Officer and Managing Director
PD McCluskey Non-Executive Director
AP SymonsNon-Executive Director
NJ FaheyChief Commercial Officer and Executive Director
COMPANY SECRETARY AJ Hensher
GLOBAL HEADQUARTERS P O I N TS B E T H O L D I N G S L I M I T E D
Level 2165 Cremorne StreetCremorne Victoria 3121 Australia
UNITED STATESSuite 1710, 185 Hudson Street, Jersey City New Jersey 07311United States of America
INVESTOR CONTACTS S H A R E R E G I ST RY
Computershare Investor Services Pty Limited 452 Johnston StreetAbbotsford Victoria 3067Australia
Telephone: 1300 555 159 (Australia) and +61 3 9415 4062 (Overseas) Website: www-au.computershare.com/investor
AUDITOR R S M AU ST R A L I A
Level 21 55 Collins StreetMelbourne Victoria 3000
LAWYERSC L A R E N D O N L AW Y E R S
Level 29 55 Collins StreetMelbourne Victoria 3000
AUSTRALIA STOCK EXCHANGE LISTING PointsBet Holdings Limited Ordinary shares are listed on the Australian Securities Exchange CODE: PBH
INTERNET SITE https://investors.pointsbet.com.au/
INVESTOR EMAIL ADDRESS Investors may send email queries to: [email protected]
For
per
sona
l use
onl
y

For
per
sona
l use
onl
y