points of the lactation were surveyed with gene ontology
TRANSCRIPT

Page 1/26
Transcriptome signature of the lactation process ina fat-tailed sheep identi�es with integrativeapproach of RNA-Seq and Supervised MachineLearning modelsMohammad Farhadian ( [email protected] )
University of TabrizSeyed Abbas Rafat
University of TabrizBahman Panahi
ABRIIEsmaeil Ebrahimie
The University of Adelaide
Research article
Keywords: RNA-Seq, Milk, Sheep, Gene network, Gene Ontology
Posted Date: July 18th, 2019
DOI: https://doi.org/10.21203/rs.2.11678/v1
License: This work is licensed under a Creative Commons Attribution 4.0 International License. Read Full License

Page 2/26
AbstractBackground The mammary gland is a vital organ in mammalian that undergoes a substantialphysiological transformation during the lactation process. Understanding the underlying molecularmechanism of the lactation process in the mammary gland is essential to unravel of the complexity ofmilk production process. This study was investigated the transcriptome pro�les of milk between two timepoint of lactation (day 20 as before peak time point (BF) and day 70 as after peak(AF)) in Iranian fat-tailed Ghezel sheep breed. Functional impacts of differentially expressed genes (DEGs) between two timepoints of the lactation were surveyed with Gene Ontology (GO) and Protein-Protein Interaction (PPI)network analysis. Moreover, to identify the transcriptome signature of the lactation process, supervisedmachine learning algorithms were integrated. Results Totally, 75 genes were de�ned as DEGs between BFand AF of lactation. Gene ontology of DEGs mainly enriched in metabolic process and oxidativephosphorylation. Moreover, PPI networks analysis highlighted the contribution of peroxisome proliferator-activated receptors (PPAR) signaling in the lactation process, oxidative phosphorylation and metabolicpathways. These pathways mainly involved in the quality of dairy products and energy generation formilk production. Dissection of DEGs also indicated that the genes encoding for caseins, whey proteins,and enzymes lactose synthesis are dominantly up-regulated after the lactation peak. More interestingly,the genes involved in fat metabolism dominantly down-regulated after the lactation peak. Contribution ofnineteen DEGs such as HNRNPA2, CHCHD2, COX1, COX2, GTF3C3, and MRPL11 has veri�ed with morethan seven attribute ranking algorithms, which are being proposed as a signature of the lactation processin Ghezel sheep. Conclusions The results of this study highlighted the energy generation, development ofimmunity, and activation of the immune system in lactation process. To best of our knowledge, this is the�rst study comparing the underlying mechanism of Ghezel sheep before and after the lactation peak andprovides new insight regarding the transcriptional responses for the lactation process.
BackgroundMilk is a white liquid food and nutrient-rich that is consumed by mammalian infants and secret bymammalian during the lactation period. The lactation stage can be divided into three phases; the early,mid and late lactation [1]. Human and cow milk [2] and sheep milk [3] have a signi�cant difference in thephysicochemical features. Also, there are many differences between each stage of lactation processes indifferent phases. Fat and protein contents of sheep milk are higher than goat and cow milk. Moreover, incomparison with cows, buffaloes, and goats milks, lactose content of sheep milk is higher [4].
Milk contains a different percentage of fat, protein, lactose, casein and whey protein in early, mid and latelactation in sheep [3], cow and human [5]. These sheep milk properties make it appropriate for dairyproducts such as yoghurt and cheese making.
The milk transcriptome has been characterized in human [6, 7], bovine [8, 9] and sheep [10]. In Spanishsheep breed the number of 573 DEGs introduced across lactation points (10, 50, 120 and 150 days), with

Page 3/26
the most considerable divergences being found, between day 10 and day 150 [10]. It has been alsoreported that immune and stress responsive genes are important pathways in the lactation process [10].
Transcriptome pro�ling technologies, such as cDNA library, microarray, and RNA-sequencing is versatiletools to get new insight of underlying mechanism of different biological functions and cellular activities[11-16]. To tarnscriptome level study of lactation process, mammary gland biopsies [6], milk fat globules(MFGs) [7] and milk somatic cells (MSCs) [8] is commonly used.
Among them, MFG transcriptome represents the RNA pro�les from mammary epithelial cells (MEC) andmammary gland in lactation processes studies [7, 9, 17, 18].
Sheep milk is mainly used for cheese production, so its quality directly in�uences cheese yield [19].Ghezel sheep has originated from northwestern provinces of Iran (East and west Azerbaijan) and west ofTurkey and is commonly tolerated to dry and cold circumstances [20]. Ghezel sheep’s is commonly usedfor its dairy products characteristics, Lighvan cheese is a famous traditional cheese made from Ghezelsheep milk in the village of Lighvan located in the northwest Iran, East Azerbaijan province [21]. So, it isan ideal model breed for studding the milk production underlying mechanisms.
In this study, RNA-Seq transcriptome pro�ling were integrated with Machine Learning modeling to obtainthe signature of two distinct time point of lactation (before peak and after peak lactation) in Ghezelsheep.
MethodsAnimals and sampling
Two healthy Ghezel sheep at the second lactation stage were involved in this study. These sheep werekept in free stall housing; feeding with the same rations and without water restrictions. Milk samples werecollected with a hand at two lactation stages: the before peak stage (on day 20 after lambing) and afterpeak stage (on day 75 after lambing). Collected samples were stored in sterile and RNase-free 50-mltubes for MFG extraction.
Collection of MGFs and RNA isolation
Samples were centrifuged at 2000 g for 10 min at four 0C in order to isolate milk fat. The supernatant fatlayer was transferred to a new RNase-free 15-ml tube using an RNase-free spoon. A 500-µl quantity of fatwas put into a 15-ml tube, and 1.5 ml of Trizol reagent (Invitrogen Life Technology) was added todissolve the fat layer. Total RNA from MFG was extracted by using a TRIzol LS solution (Invitrogen LifeTechnologies Inc.) following the manufacturer’s protocol, with minor modi�cations. Brie�y, to removelipids, centrifugation was performed at 12,000 × g for 10 min at 4°C. A 400-μL quantity of chloroform wasthen added to the remaining solution and the mix was shaken vigorously. After centrifugation, the upperaqueous layer (approximately 60%), which were contained RNA, was carefully pipetted, and RNA was

Page 4/26
precipitated by adding 750 μL of isopropanol/1 mL of TRIzol LS used for extraction. After centrifugation(12,000 × g for 10 min at 4°C), RNA pellets were washed with 75% ethanol, dissolved in 30 μL of RNase-free water, and �nally stored at -80°C until further processing. Genomic DNA contaminations wereremoved by DNase I (Qiagen, Hilden, Germany). Then, the quality and quantity of isolated RNA weresurveyed with agarose gel electrophoresis and Nano drop spectrophotometry, respectively.
RNA sequencing and Data analysis
The RNA integrity value (RIN) of the samples selected to be sequenced ranged between 7 and 8. Paired-end libraries fragmented into short fragments (200-700 bp) by using the fragmentation buffer. Thefragments were sequenced on an Illumina Hi-Seq 4000 sequencer, according to the manufacturer’sinstructions (BGI). For each library, 60 million paired-end 100 bp reads were generated during thesequencing run. The quality of raw data was evaluated using FastQC (Version 0.11.8) (ANDREWS et al.2016) program. Reads with quality score below 30 were trimmed out using PRINSEQ [22] andTrimmomatics [23]. Then, clean reads were mapped to the sheep reference genome Oar_v3.1 (available atEnsemble) using TOPHAT (v2.1.1) (KIM et al. 2013). Transcripts were assembled by Cu�inks (version2.2.0) [24], then Cufmerge (version 2.1.1) [24] was used for merging into a single transcriptomeannotation. Finally, cuffdiff (version 2.2.1) was used to detect DEGs between the BF and AF samples.Differentially expressed genes at each lactation time point using cummeRbund (R package), gene lengthand library size were normalized using (Fragments Per Kilobase Million) FPKM index [10].
Gene Ontology enrichment of DEGs
To analyze the functions of DEGs, GO enrichment of DEGs was performed in three Biological processes,molecular function and cellular component categories [25]. The adj-value ≤ 0.05 was set as cutoffthreshold for enrichment analysis.
Protein-Protein Network analysis
To better understanding of the dynamic process of a complex process such as lactation, informationabout the functions of genes/proteins is needed[15]. In this regard, the protein-protein interaction networkof DEGs was �rstly constructed using the STRING (https://string-db.org/) database. Experimentallyvalidated, text mining, databases, co-expression, and neighborhood interactions were considered for thenetwork construction [25]. Then, to de�ne the functional modules, constructed networks were clusteredwith the K means algorithm. K-means is a popular clustering algorithm which is widely used in anomaly-based intrusion detection. It tries to classify a given data set into k (a prede�ned number) categories [26].
Selection of transcriptome signature using the Attribute weighting algorithms
To identify the transcriptome signature of the lactation process, attribute weighting algorithms wereimplied on genes with signi�cant expression in two time point of lactation. First, the two-stepstandardization procedure was carried out on expression data as previously proposed [27-30]. Then,stage of lactation (AF and BF) and FPKM values of DEGs was set as label attribute target, respectively.

Page 5/26
Ten attribute weighting algorithms including the Information Gain, Information Gain Ratio, Chi-Squared,Deviation, Rule, SVM, Gini Index, Uncertainty, Relief, and PCA were separately applied on the DEGs dataset. The DEGs with weighting value higher than 0.7 were considered as signature [31-33].
ResultsSummary statistics for the RNA-Seq data
Milk samples of Ghezel sheep from two lactation time points including the D20 (BF period) and D75 oflactation (AF period) with two biological replicates were sequenced. A total of 243,063,312 paired-endreads, ~60 million reads per sample were obtained from transcriptome sequencing of milk samples(n=4). Alignment of the reads to the Ovis arise genome Oar_v4.1 was 73.25% at mean (Table 1).
Table 1: General statistic of reads in pre and post-trimming and mapping results
AP: After Peak, BP: Before Peak
The mapping ratio for each samples were described in Table 2. According to the FPKM value, mappedgenes were divided into the high, moderate and low expression for genes with 500> FPKM, 10<FPKM<500 and <10 FPKM, respectively. Genes with > 0.02 FPKM were considered as a signi�cant expression[8]. Totally, 23148 and 22362 genes were de�ned as expressed genes in BF and AF, respectively.
Table 2: RNA-Seq gene expression distribution for the Ghezel sheep breed in the BF and AF of lactation
It is apparent from Table 2 that the majority of the genes have had low expression across lactationstages.
Analysis of the some most expressed genes in each stage of lactation
The normalization index makes simplify the comparison of expressed genes within a sample [34], soFPKM index were used to determine the DEGs. Table 2 shows the number of genes with the highestFPKM (≥500) at BF and AF of lactation. Distribution of FPKM values were provided in Figure 1. It isapparent from �gure 1 that ATP6, PAEP, CSN1S1, CSN2, LALBA, RPS29, CYTB and CSN1S2 genes haveincreased expression in progress of lactation. Whereas, decreased expression of ND1, ND6 and ZNF33Bgenes were shown in the AF in comparison with BF of lactation.
Differentially expressed genes between BF vs. AF

Page 6/26
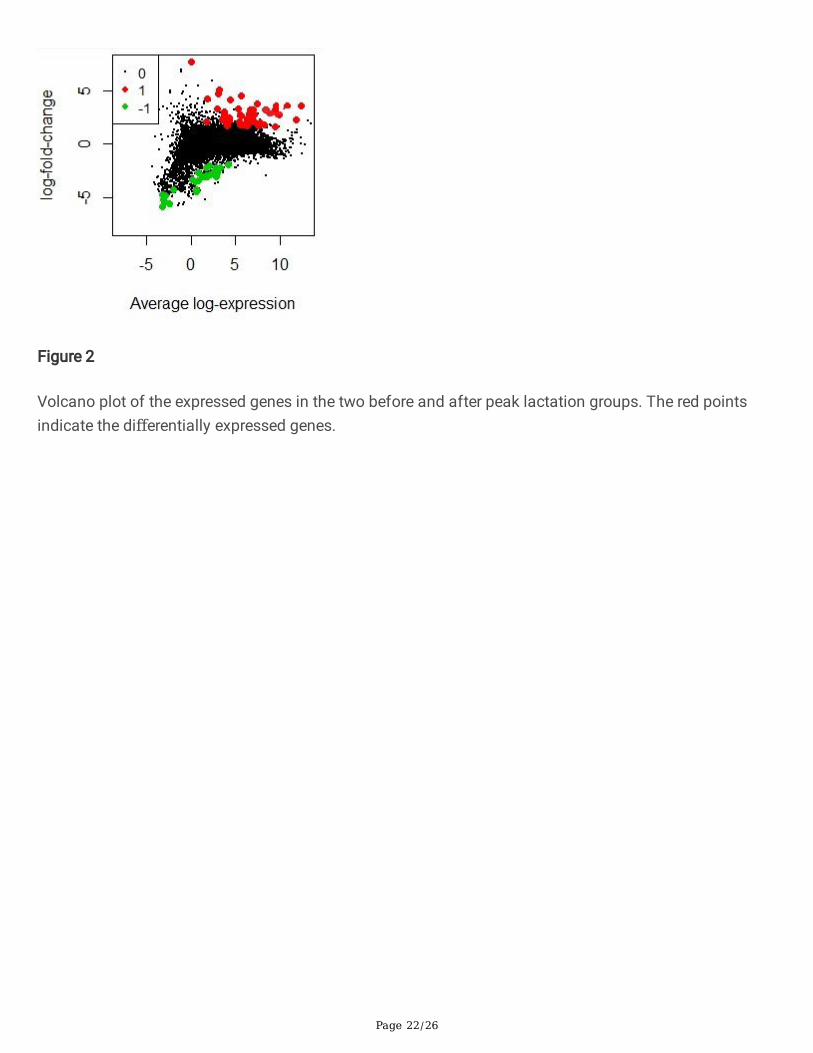
Differential expression analysis with edgeR package has de�ned the 75 genes as DEGs between twostages of lactation. Among these DEGs, 60 and 15 genes were up- and down-regulated, respectively (Fig.2)
Gene ontology
To indicate possible functions of DEGs identi�ed in the milk samples, the genes were classi�ed into threemain categories (biological process, molecular function, cellular component) according to the GOalgorithm (Fig 3). In the biological process category, “oxidation-reduction process”, “metabolic process”,“cation transport”, and “oxidative phosphorylation” dominantly enriched.
In the “Cellular components” category “cell”, “membrane part” “cytoplasmic part”, and “mitochondrialmembrane” were dominant. Finally, in the “molecular function” category “catalytic activity”,“oxidoreductase activity”, and “binding” were enriched.
Expression of genes encoding for caseins, whey proteins and lactose synthesis pathway enzymes
Caseins (CN) and whey proteins are two common milk proteins. Caseins such as αs1-CN, αs1-CN, β-CN,and -CN are encoded by CSN1S1, CSN1S2, CSN2, and CSN3, respectively [35]. Most of the genesinvolved in casein synthesis were unregulated in the BF time point of lactation. However, the CSN2 andCSN3 genes have down-regulated in BF time point of lactation.
Lactose is encoded by B4GALTL and LALBA. As shown in Figure 4, both B4GALTL and LALBA genes thatare involved in lactose synthesis had increased expression in BF versus AF period of lactation. Theexpression of lactose encoded genes patterns showed a positive correlation with the lactoseconcentration in milk, which is decreased with advanced lactation [8, 36].
The expression pro�le of the genes involved in fat metabolism
Most of the key genes involved in milk fat metabolism are differentially expressed in FMG duringlactation stages (Fig 5). Fatty acid uptake is the �rst process in milk fat metabolism. Lipoprotein lipase(LPL) and very low-density lipoprotein receptor (VLDLR) binds and increases the catabolism ofapolipoprotein Etriglyceride– rich lipoproteins [8]. LPL indicated high expression in BF period and alongwith lactation progress, its expression decreased. VLDLR also showed a similar expression pattern.
De novo fatty acid synthesis is the second process of fat metabolism. The rate-limiting enzyme in fattyacid synthesis is encoded by Acetyl-coenzyme A carboxylase alpha (ACACA). Results showed that ACACAexpression is decreased after the lactation peak. Fatty acid synthase (FASN) gene is other important gene

Page 7/26
in de novo fatty acid synthesis, which showed similar expression pattern with ACACA during two timepoints of lactation peak.
Coordinate expression of ACACA and FASN genes in lactation stages has been also reported by [37].Next process in milk fat metabolism is fatty acid desaturation. Generally, fatty acids can be divided intotwo groups: mono fatty acids and very long fatty acids. The mono fatty acids unsaturated by Stearoyl-CoA desaturase (SCD1) [38, 39]; whereas, desaturation of very long fatty acids is performed by fatty aciddesaturase 1 and two encoded by FADS1 and FADS2. All of the mentioned genes involved in fatty aciddesaturation showed increased expression in BF and decreased expression in the AF period. This resultsin agreement with the results of previous �ndings in bovine [8, 40] and rat [41].
In the fatty acid esteri�cation step, the number of four genes include Glycerol-3-phosphate O-acyltransferase (GPAM), 1- acylglycerol-3-phosphate O-acyltransferase 6 (AGPAT6) and Diacylglyceroltransferase 1 and 2 (DGAT1, DGAT2) genes. GPAM and AGPAT6 genes encode for the esteri�cation inmono- and diacylglycerol synthesis whereas DAGT1 and DAGT2 genes encode for triacylglycerol (TAG)synthesis. All of these genes, except DAGT2, have showed increased expression in BF and decreasedexpression in AF.
One of the most important processes in milk fat metabolism is fatty acid esteri�cation. The key genesinvolved in this step are Sterol regulatory element-binding proteins 1 and 2(SREBF1, SREBF2), Insulin-induced 1 and two genes (INSIG1, INSIG2), and sterol-sensing proteins (SCAP).All of the genes involved in fatty acid esteri�cation showed increased and decreased expression in BFand AF time point of lactation peak, respectively. It has been proposed that SREBF2 and SREBF2 play animportant role in transcription regulation of fatty acid esteri�cation in mouse [42] [43]. The �nal processin fat milk metabolism is milk fat secretion where Butyrophilin (BTN1A1) and Xanthine dehydrogenase(XDH) are main proteins involved in [40]. These genes showed higher expression in BF time point andwith the progress of lactation, their expression decreased. Most of the genes involved in milk fatmetabolism in MFG samples of Ghezel sheep breed had higher expression in BF rather than AF period.
Gene network
Functional impacts of DEGs were also surveyed in system levels analysis with PPI network construction.The constructed network was consisting of 55 nodes (DEGs) and 182 edges which strength of interactionscore set on > 0.4(Fig 6). Disconnected nodes in the network were removed. The generated network isclustered into three functional modules. The �rst module which highlighted with blue color, annotated inoxidative phosphorylation and metabolic pathways. The second module annotated as PPAR signalingpathway based on KEGG database.
Ribosomal pathway includes RPL and RPS gene family which they have an important role in mammarygland development [44, 45] and also, reported that the growth of the mammary gland is a critical processin milk production [46].

Page 8/26
Finally, the third module enriched in ribosome pathway. Peroxisome proliferator-activated receptors(PPARs) are nuclear hormone receptors that are activated by fatty acids and their derivatives [47].
Attribute weighting algorithms and ranking of DEGs
Ten different Attribute weightings (AWs) model was applied to identify important DEGs. Data werenormalized and were used for model construction. All weighted values ranged between 0 and 1.0. The 1.0value indicates that a given gene is an important gene. FTH1 gene was the most important gene pointedout by 80% of the AWs (8 from 10 AWs); followed by HNRNPA2, CHCHD2, COX1, COX2, GTF3C3, MRPL11,RPL12, RPL14, RPL18A, RPL22, RPL32, RPL37, RPL8, RPS10, RPS11, RPS21, and SLC25A4. A tablecontaining the DEGs with all weights given by 10 AWs was shown in a supplementary �le (Supplementary1). A complete list of high relevant genes that were con�rmed by the majority of AWs (with a weightabove 0.7) is presented in Table 3.
Table 3: the most important attributes (DEGs introduced by analysis of sheep MFGs) ranked based on 10AWs
DiscussionStudying of milk transcriptome pro�les in needed to identify the candidate genes in milk production traits.Among the different of RNA milk transcriptome sources, MFGs reported that is an appropriate sourcethan others [9]. The average expression levels for Ghezel sheep were in agreement with previous reportson the milk transcriptome of the other ruminant species [8, 10, 48]. About 65% of the transcripts wereannotated as intergenic transcripts. It is also in line with the results of ovine muscle transcriptome ofsmall-tailed Han and Dorper sheep [49] and milk transcriptome of Churra and Assaf sheep breeds [10]. Itseems there is need to do efforts for the completion and improvement of sheep transcriptomeannotation.
The FPKM index distribution were applied for identify the DEGs between two time points of lactation.
Results of GO results, Oxidation-reduction (redox status) enriched in BP category, is the most importantphysicochemical features in quality and �avor determination of dairy products [50]. All of the genesinvolved in the “redox” process has up regulated in BF which milk fat is higher than the AF time point oflactation. Other term activates is “oxidative phosphorylation” process which contains a series of ATPasesin the metabolic pathway to energy generation [51], and milk production is a process that needs highenergy [52, 53]. Less oxidative phosphorylation is a major mechanism contributing to the low milkproduction in mammalian. Some genes like COX and ND family genes which are involved in the oxidativephosphorylation pathway, have up-regulated in BF time point of lactation. It has been also demonstratedthat redox status has a signi�cant positive correlation with fat content in milk [54] which is in agreementwith the results of this study. Oxidative phosphorylation process which main process for providing energy

Page 9/26
for milk production take place in mitochondrial [55]. In this study we used MFGs as a RNA source to theevaluation of milk pro�le gene expression. Milk fat global is the most important part of the milk andsome milk fat globules secreted from the cytoplasm [56]. The enriched binding term in milk refers tobinding some mineral and enzyme activity in the milk [57, 58]. Results of GO analysis con�rmed thefunctional role of the DEGs on milk production. The biological importance of “Redox” and “Oxidativephosphorylation” is in the quality of dairy product and energy generation for milk production.
Among the CN gene family, CSN2 gene showed the highest expression in Ghezel milk. It is in agreementwith the caseins pro�les which has been reported by [59]. Moreover, expression pro�les of casein geneswere similar to the somatic cell transcriptome of bovine milk [8]. β-lactoglobulin and α-lactalbumin aretwo major components of whey proteins which are encoded by the LGB and LALBA genes, respectively.The LGB gene has not annotated in the sheep genome. Similar expression pattern were shown betweenLALBA and CN genes (Figure 4). Whey proteins and lactose synthesis involved genes down-regulatedafter the lactation peak (Figure 3). It is, in contrast, with the previous reports [8, 10].
Previous studies have been reported that during the lactation progress, expression of whey proteins andlactose synthesis in the Assaf and Churra sheep breed are not changed [8, 10]. In contrast, results of ourstudy showed that the CN and whey genes are down-regulated in BF time points. It has been indicatedthat the total milk protein from early to end lactation has increased rate [60]. It is may be due to cleavingof caseins and whey proteins are broken into bio-active peptides in the early lactation, so theirconcentration is not re�ected in milk proteins pro�les [61, 62].
Based on the results of network analysis, “oxidative phosphorylation”, is the main function for energygeneration for milk production [55].PPAR pathway includes three subtypes ((PPARalpha, beta/delta, andgamma) which encoded by speci�c genes and bound fatty acids [47]. PPARalpha plays a role in cellularlipids by gene expression involved in lipid metabolism and loss of this expression in mammary epithelialincrease immune risks in the mammary gland [63]. Lipid oxidation and cell proliferation is thePPARbeta/delta function [64]. PPARgamma is involved in adipocyte differentiation promotion to enhanceblood glucose uptake [65].
attribute weighting algorithms results revealed that the FTH1 gene is one the important and theimportance of these genes has been previously highlighted by microarray meta-analysis [46]. Also theimportance of theses gene in lactation process of goat milk has been con�rmed by RNA-seq method [66].RPL and RPS gene family which are an important part of the eukaryotic ribosome and may also have animportant role in mammary development [44, 45], is de�ned as another signature for lactation process.Applying eight statistically different attribute weighting algorithms and selection of the key featuresbased on the overall (intersection) of these algorithms reinforced the importance of the selected genes.
ConclusionTo best of our knowledge, this is the �rst study that transcriptome of Ghezel sheep MFGs in two distinctlactation periods were pro�led with RNA-Seq technology. Results of our analysis de�ned the 75 genes as

Page 10/26
responsive genes between two time points of lactation peak. Among them, caseins, whey proteins,lactose biosynthesis, and fat metabolism involved genes, have signi�cantly up-regulated before lactationpeak. Network analysis also highlighted the “oxidative phosphorylation”, “metabolic pathways” and“PPAR signaling pathways” contribution in lactation process. Integration of data mining approaches withRNA-Seq technology proposed that the genes involved in energy generation, development and activationof the immune system as transcriptome signature of lactation process in Ghezel sheep MFGs. Our novelintegrated approach provides new avenue to unravel of underlying transcriptome mechanism andproposed some transcriptome signature of lactation process for future studies.
AbbreviationsBF: Before peak; AF: After peak; DEGs: Differentially expressed genes; PPI: Protein-Protein Interaction;PPAR: Peroxisome proliferator-activated receptors; GO: Gene Ontology; MFGs: Milk fat globules; MSCs:Milk somatic cells; MECs: Mammary epithelial cells; RIN: RNA integrity value; FPKM: Fragments perKilobase Million; CN: Caseins; LPL: Lipoprotein lipase; VLDLR: Very low-density lipoprotein receptor;ACACA: Acetyl-coenzyme A carboxylase alpha; FASN: Fatty acid synthase; SCD1: Stearoyl-CoAdesaturase; GPAM: Glycerol-3-phosphate O-acyltransferase; AGPAT6: Acylglycerol-3-phosphate O-acyltransferase 6; DGAT1: Diacylglycerol transferase 1; DGAT2: Diacylglycerol transferase 2; TAG:Triacylglycerol; SREBF1: Sterol regulatory element-binding proteins 1; SREBF2: Sterol regulatory element-binding proteins 2; INSIG1: Insulin-induced 1; INSIG2: Insulin-induced 2; SCAP: Sterol-sensing proteins;BTN1A1: Butyrophilin; XDH: Xanthine dehydrogenase; AWs: Attribute weightings; Redox status: Oxidation-reduction.
DeclarationsAcknowledgments
The authors like to acknowledge the Research Center of computational and Department of Animalscience of Tabriz University.
Authors’ contributions
All authors read and approved the �nal manuscript. MF and BP research concept and design, dataanalysis and interpretation, wrote the article, and �nal approval of the article. SR wrote the article. EE dataanalysis and interpretation, critical revision of the article, and �nal approval of the article.
Funding
The authors would like to thank the Iran National Science Foundation (INSF) for supporting this research(Grant No. 95814261). The funding agencies had no role in the study design, data collection andanalysis, decision to publish, or preparation of the manuscript.

Page 11/26
Availability of data and materials
The datasets generated and analyzed during the current study are not publicly available due furtheranalysis will be performed but are available from the corresponding author on reasonable request. Pleasecontact author for data requests.
Authors’ contributions
All authors have read and approved the manuscript. MF: research concept and design, data analysis andinterpretation, wrote the article, and �nal approval of the article. SR: wrote the article. EE and BP: dataanalysis and interpretation, critical revision of the article, and �nal approval of the article.
Ethics approval and consent to participate
Two female sheep were obtained from the local farm in Tabriz University station, Tabriz, Iran. We haveobtained the written consent to use the animals in our study from the Tabriz University farm section.Animal use protocol of this project was conducted in accordance with the national guidelines andapproved by the Local Ethics Committee University in Tabriz, Iran. At the end of the study, the sheepreturned to the Tabriz University farm section
Consent for publication
Not applicable.
Competing interestsThe authors declare that they have no competing interests
References1 Strucken EM, Laurenson YC, Brockmann GA: Go with the �ow—biology and genetics of thelactation cycle. Frontiers in genetics 2015, 6:118.
. 2 Sabikhi L: Designer milk. Advances in Food and Nutrition Research 2007, 53:161-198.

Page 12/26
. 3 Albenzio M, Santillo A, Caroprese M, d’Angelo F, Marino R, Sevi A: Role of endogenous enzymesin proteolysis of sheep milk. Journal of dairy science 2009, 92(1):79-86.
. 4 Graeub BE, Chappell MJ, Wittman H, Ledermann S, Kerr RB, Gemmill-Herren B: The state offamily farms in the world. World development 2016, 87:1-15.
. 5 Järvinen K-M, Chatchatee P, Bardina L, Beyer K, Sampson HA: IgE and IgG binding epitopes on α-lactalbumin and β-lactoglobulin in cow’s milk allergy. International archives of allergy and immunology2001, 126(2):111-118.
. 6 Lemay DG, Ballard OA, Hughes MA, Morrow AL, Horseman ND, Nommsen-Rivers LA: RNAsequencing of the human milk fat layer transcriptome reveals distinct gene expression pro�les at threestages of lactation. PloS one 2013, 8(7):e67531.
. 7 Maningat PD, Sen P, Rijnkels M, Sunehag AL, Hadsell DL, Bray M, Haymond MW: Geneexpression in the human mammary epithelium during lactation: the milk fat globule transcriptome.Physiological genomics 2009, 37(1):12-22.
. 8 Wickramasinghe S, Rincon G, Islas-Trejo A, Medrano JF: Transcriptional pro�ling of bovine milkusing RNA sequencing. BMC genomics 2012, 13(1):45.
. 9 Yang J, Jiang J, Liu X, Wang H, Guo G, Zhang Q, Jiang L: Differential expression of genes in milkof dairy cattle during lactation. Animal genetics 2016, 47(2):174-180.
. 10 Suárez-Vega A, Gutiérrez-Gil B, Klopp C, Robert-Granie C, Tosser-Klopp G, Arranz JJ:Characterization and comparative analysis of the milk transcriptome in two dairy sheep breeds usingRNA sequencing. Scienti�c reports 2015, 5:18399.

Page 13/26
. 11 Bansal M, Belcastro V, Ambesi‐Impiombato A, Di Bernardo D: How to infer gene networks fromexpression pro�les. Molecular systems biology 2007, 3(1):78.
. 12 Moreno-Risueno MA, Busch W, Benfey PN: Omics meet networks—using systems approaches toinfer regulatory networks in plants. Current opinion in plant biology 2010, 13(2):126-131.
. 13 Less H, Angelovici R, Tzin V, Galili G: Coordinated gene networks regulating Arabidopsis plantmetabolism in response to various stresses and nutritional cues. The Plant Cell 2011, 23(4):1264-1271.
. 14 Friedel S, Usadel B, Von Wirén N, Sreenivasulu N: Reverse engineering: a key component ofsystems biology to unravel global abiotic stress cross-talk. Frontiers in plant science 2012, 3:294.
. 15 Panahi B, Mohammadi SA, Khakse�di RE, Fallah Mehrabadi J, Ebrahimie E: Genome-wideanalysis of alternative splicing events in Hordeum vulgare: Highlighting retention of intron-based splicingand its possible function through network analysis. FEBS letters 2015, 589(23):3564-3575.
. 16 Panahi B, Mohammadi SA, Ruzicka K, Abbasi Holaso H, Zare Mehrjerdi M: Genome-wideidenti�cation and co-expression network analysis of nuclear factor-Y in barley revealed potentialfunctions in salt stress. Physiology and Molecular Biology of Plants 2019, 25(2):485-495.
. 17 Cánovas A, Rincón G, Bevilacqua C, Islas-Trejo A, Brenaut P, Hovey RC, Boutinaud M,Morgenthaler C, VanKlompenberg MK, Martin P: Comparison of �ve different RNA sources to examine thelactating bovine mammary gland transcriptome using RNA-Sequencing. Scienti�c reports 2014, 4:5297.
. 18 Brenaut P, Bangera R, Bevilacqua C, Rebours E, Cebo C, Martin P: Validation of RNA isolated frommilk fat globules to pro�le mammary epithelial cell expression during lactation and transcriptionalresponse to a bacterial infection. Journal of dairy science 2012, 95(10):6130-6144.

Page 14/26
. 19 Suárez-Vega A, Gutiérrez-Gil B, Arranz J: Transcriptome expression analysis of candidate milkgenes affecting cheese-related traits in 2 sheep breeds. Journal of dairy science 2016, 99(8):6381-6390.
. 20 Tavakkolian J: The genetic resources of native farm animals of Iran. Animal Science ResearchInstitute of Iran, Karaj, Iran(in Persian) 1999.
. 21 Valiloo RH, Rafa SA: Ghezel sheep breeding and traditional cheese making in Iran. FAO,Sustainability Pathways 2009.
. 22 Schmieder R, Lim YW, Rohwer F, Edwards R: TagCleaner: Identi�cation and removal of tagsequences from genomic and metagenomic datasets. BMC bioinformatics 2010, 11(1):341.
. 23 Bolger AM, Lohse M, Usadel B: Trimmomatic: a �exible trimmer for Illumina sequence data.Bioinformatics 2014, 30(15):2114-2120.
. 24 Trapnell C, Roberts A, Goff L, Pertea G, Kim D, Kelley DR, Pimentel H, Salzberg SL, Rinn JL,Pachter L: Differential gene and transcript expression analysis of RNA-seq experiments with TopHat andCu�inks. Nature protocols 2012, 7(3):562.
. 25 Szklarczyk D, Franceschini A, Wyder S, Forslund K, Heller D, Huerta-Cepas J, Simonovic M, Roth A,Santos A, Tsafou KP: STRING v10: protein–protein interaction networks, integrated over the tree of life.Nucleic acids research 2014, 43(D1):D447-D452.
. 26 Le V-H, Kim S-R: K-strings algorithm, a new approach based on Kmeans. In: Proceedings of the2015 Conference on research in adaptive and convergent systems: 2015. ACM: 15-20.
. 27 Ebrahimi M, Lakizadeh A, Agha-Golzadeh P, Ebrahimie E, Ebrahimi M: Prediction ofthermostability from amino acid attributes by combination of clustering with attribute weighting: a newvista in engineering enzymes. PloS one 2011, 6(8):e23146.
Page 15/26
. 28 Ebrahimie E, Nurollah Z, Ebrahimi M, Hemmatzadeh F, Ignjatovic J: Unique ability of pandemicin�uenza to downregulate the genes involved in neuronal disorders. Molecular biology reports 2015,42(9):1377-1390.
. 29 Mohammadi-Dehcheshmeh M, Niazi A, Ebrahimi M, Tahsili M, Nurollah Z, Khakse�d RE, EbrahimiM, Ebrahimie E: Uni�ed transcriptomic signature of arbuscular mycorrhiza colonization in roots ofMedicago truncatula by integration of machine learning, promoter analysis, and direct merging meta-analysis. Frontiers in Plant Science 2018, 9.
. 30 Ebrahimie E, Ebrahimi F, Ebrahimi M, Tomlinson S, Petrovski KR: A large-scale study of indicatorsof sub-clinical mastitis in dairy cattle by attribute weighting analysis of milk composition features:highlighting the predictive power of lactose and electrical conductivity. Journal of Dairy Research 2018,85(2):193-200.
. 31 Shari� S, Pakdel A, Ebrahimi M, Reecy JM, Farsani SF, Ebrahimie E: Integration of machinelearning and meta-analysis identi�es the transcriptomic bio-signature of mastitis disease in cattle. PloSone 2018, 13(2):e0191227.
. 32 Jamali AA, Ferdousi R, Razzaghi S, Li J, Safdari R, Ebrahimie E: DrugMiner: comparative analysisof machine learning algorithms for prediction of potential druggable proteins. Drug discovery today 2016,21(5):718-724.
. 33 Bakhtiarizadeh MR, Moradi-Shahrbabak M, Ebrahimi M, Ebrahimie E: Neural network and SVMclassi�ers accurately predict lipid binding proteins, irrespective of sequence homology. Journal ofTheoretical Biology 2014, 356:213-222.
. 34 Dillies M-A, Rau A, Aubert J, Hennequet-Antier C, Jeanmougin M, Servant N, Keime C, Marot G,Castel D, Estelle J: A comprehensive evaluation of normalization methods for Illumina high-throughputRNA sequencing data analysis. Brie�ngs in bioinformatics 2013, 14(6):671-683.

Page 16/26
. 35 Caroli A, Chessa S, Erhardt G: Invited review: Milk protein polymorphisms in cattle: Effect onanimal breeding and human nutrition. Journal of dairy science 2009, 92(11):5335-5352.
. 36 Fox P, Kelly A: Chemistry and biochemistry of milk constituents. Food Biochemistry and FoodProcessing 2006:425-452.
. 37 Bong JJ, Jeong JY, Rajasekar P, Cho YM, Kwon EG, Kim HC, Paek BH, Baik M: Differentialexpression of genes associated with lipid metabolism in longissimus dorsi of Korean bulls and steers.Meat science 2012, 91(3):284-293.
. 38 Ntambi JM, Miyazaki M: Recent insights into stearoyl-CoA desaturase-1. Current opinion inlipidology 2003, 14(3):255-261.
. 39 Bakhtiarizadeh MR, Moradi-Shahrbabak M, Ebrahimie E: Underlying functional genomics of fatdeposition in adipose tissue. Gene 2013, 521(1):122-128.
. 40 Bionaz M, Loor JJ: Gene networks driving bovine milk fat synthesis during the lactation cycle.BMC genomics 2008, 9(1):366.
. 41 Rodriguez-Cruz M, Tovar AR, Palacios-González B, del Prado M, Torres N: Synthesis of long-chainpolyunsaturated fatty acids in lactating mammary gland: role of Δ5 and Δ6 desaturases, SREBP-1,PPARα, and PGC-1. Journal of lipid research 2006, 47(3):553-560.
. 42 Anderson SM, Rudolph MC, McManaman JL, Neville MC: Key stages in mammary glanddevelopment. Secretory activation in the mammary gland: it's not just about milk protein synthesis!Breast Cancer Research 2007, 9(1):204.
. 43 Varvikko T, Vanhatalo A, Jalava T, Huhtanen P: Lactation and metabolic responses to gradedabomasal doses of methionine and lysine in cows fed grass silage diets. Journal of dairy science 1999,

Page 17/26
82(12):2659-2673.
. 44 Coleman-Krnacik S, Rosen JM: Differential temporal and spatial gene expression of �broblastgrowth factor family members during mouse mammary gland development. Molecular Endocrinology1994, 8(2):218-229.
. 45 Provost E, Weier CA, Leach SD: Multiple ribosomal proteins are expressed at high levels indeveloping zebra�sh endoderm and are required for normal exocrine pancreas development. Zebra�sh2013, 10(2):161-169.
. 46 Farhadian M, Rafat SA, Hasanpur K, Ebrahimi M, Ebrahimie E: Cross-species meta-analysis oftranscriptomic data in combination with supervised machine learning models identi�es the commongene signature of lactation process. Frontiers in genetics 2018, 9.
. 47 Tyagi S, Gupta P, Saini AS, Kaushal C, Sharma S: The peroxisome proliferator-activated receptor:A family of nuclear receptors role in various diseases. Journal of advanced pharmaceutical technology &research 2011, 2(4):236.
. 48 Lin J, Bao ZK, Zhang Q, Hu WW, Yu QH, Yang Q: Transcriptome analysis of the mammary glandfrom GH transgenic goats during involution. Gene 2015, 565(2):228-234.
. 49 Zhang C, Wang G, Wang J, Ji Z, Liu Z, Pi X, Chen C: Characterization and comparative analysesof muscle transcriptomes in Dorper and small-tailed Han sheep using RNA-Seq technique. PloS one 2013,8(8):e72686.
. 50 Caldeo V: Oxidation-reduction potential and its in�uence on Cheddar cheese quality. 2015.
. 51 Nath S, Villadsen J: Oxidative phosphorylation revisited. Biotechnology and bioengineering 2015,112(3):429-437.

Page 18/26
. 52 McManaman JL, Neville MC: Mammary physiology and milk secretion. Advanced drug deliveryreviews 2003, 55(5):629-641.
. 53 Ebrahimie E, Ebrahimi F, Ebrahimi M, Tomlinson S, Petrovski KR: Hierarchical pattern recognitionin milking parameters predicts mastitis prevalence. Computers and electronics in agriculture 2018, 147:6-11.
. 54 Pastushenko V, Matthes H, Heinrich H: Effect of fat content on the redox potential behaviour ofmilk. Milchwissenschaft 2000, 55(10):547-549.
. 55 Berg JM, Tymoczko J, Stryer L: Glycolysis is an energy-conversion pathway in many organisms.Biochemistry 5th ed New York: WH Freeman 2002.
. 56 Huston GE, Patton S: Factors related to the formation of cytoplasmic crescents on milk fatglobules. Journal of dairy science 1990, 73(8):2061-2066.
. 57 Pacheco HA, da Silva S, Sigdel A, Mak CK, Galvão KN, Texeira RA, Dias LT, Peñagaricano F: GeneMapping and Gene-Set Analysis for Milk Fever Incidence in Holstein Dairy Cattle. Frontiers in Genetics2018, 9(465).
. 58 Farhadian M, Rafat SA, Hasanpur K, Ebrahimi M, Ebrahimie E: Cross-Species Meta-Analysis ofTranscriptomic Data in Combination With Supervised Machine Learning Models Identi�es the CommonGene Signature of Lactation Process. Frontiers in Genetics 2018, 9(235).
. 59 Farrell Jr H, Jimenez-Flores R, Bleck G, Brown E, Butler J, Creamer L, Hicks C, Hollar C, Ng-Kwai-Hang K, Swaisgood H: Nomenclature of the proteins of cows’ milk—Sixth revision. Journal of dairyscience 2004, 87(6):1641-1674.

Page 19/26
. 60 Balthazar C, Pimentel T, Ferrão L, Almada C, Santillo A, Albenzio M, Mollakhalili N, Mortazavian A,Nascimento J, Silva M: Sheep milk: Physicochemical characteristics and relevance for functional fooddevelopment. Comprehensive reviews in food science and food safety 2017, 16(2):247-262.
. 61 Schanbacher F, Talhouk R, Murray F: Biology and origin of bioactive peptides in milk. LivestockProduction Science 1997, 50(1-2):105-123.
. 62 Silva SV, Malcata FX: Studies pertaining to coagulant and proteolytic activities of plant proteasesfrom Cynara cardunculus. Food Chemistry 2005, 89(1):19-26.
. 63 Apostoli AJ, Skelhorne‐Gross GE, Rubino RE, Peterson NT, Di Lena MA, Schneider MM, SenGuptaSK, Nicol CJ: Loss of PPARγ expression in mammary secretory epithelial cells creates a pro‐breasttumorigenic environment. International journal of cancer 2014, 134(5):1055-1066.
. 64 Kilgore KS, Billin AN: PPARbeta/delta ligands as modulators of the in�ammatory response.Current opinion in investigational drugs (London, England: 2000) 2008, 9(5):463-469.
. 65 Spiegelman BM: PPAR-gamma: adipogenic regulator and thiazolidinedione receptor. Diabetes1998, 47(4):507-514.
. 66 Crisà A, Ferrè F, Chillemi G, Moioli B: RNA-Sequencing for pro�ling goat milk transcriptome incolostrum and mature milk. BMC veterinary research 2016, 12(1):264.
Figure LegendsFig 1
Expressed genes in MFGs at 20 and 70 days of lactation in Ghezel sheep. Log10 FPKM values arerepresented in the X-axis and the gene names are represented in Y-axis. A color code is used to presentthe two time points studied, red color for AF (after peak) and green color for BP (before peak) of lactationperiod.

Page 20/26
Fig 2
Volcano plot of the expressed genes in the two before and after peak lactation groups. The red pointsindicate the differentially expressed genes.
Fig 3
Gene Ontology enrichment of DEGs in two lactation stage. BP: Biological process, CC: Cellularcomponent, MF: molecular function.
Fig 4
Expression changes in genes encoding whey protein, caseins and enzymes in lactose in BF and AFperiod of lactation in MFG samples of Ghezel sheep breed. Gene symbols are shown in X-axis and thelog RPKMexpression values shown in Y-axis.
Fig 5
Expression changes in milk fat metabolism pathway genes during lactation. Stages of lactation and theFPKM value gene expression are shown in x-axis and y-axis respectively. The six part of fat metabolismin milk include: A) Fatty acid uptake, B) De novo fatty acid synthesis, C) Fatty acid desaturation, D) Fattyacid esteri�cation, E) Regulation of fatty acid synthesis, F) Milk fat secretion. All of the genes in milk fatmetabolism showed higher expression in BF than AF period. Gene names are in the legend.
Fig 6
STRING analysis shows that DEGs are involved in known and predicted protein-protein interactions.Network nodes represent genes. Lines of different color represent seven types of evidence used inpredicting associations. Red line: fusion evidence; green line: neighborhood evidence; blue line: co-occurrence evidence; purple line: experimental evidence; yellow line: text mining evidence; light blue line:database evidence; black line: co-expression evidence. Interaction score > 0.4.
TablesDue to technical limitations, tables are only available as a download in the supplemental �les section.

Page 21/26
Figures
Figure 1
Expressed genes in MFGs at 20 and 70 days of lactation in Ghezel sheep. Log10 FPKM values arerepresented in the X-axis and the gene names are represented in Y-axis. A color code is used to presentthe two time points studied, red color for AF (after peak) and green color for BP (before peak) of lactationperiod.
Page 22/26
Figure 2
Volcano plot of the expressed genes in the two before and after peak lactation groups. The red pointsindicate the differentially expressed genes.

Page 23/26
Figure 3
Gene Ontology enrichment of DEGs in two lactation stage. BP: Biological process, CC: Cellularcomponent, MF: molecular function.

Page 24/26
Figure 4
Expression changes in genes encoding whey protein, caseins and enzymes in lactose in BF and AF periodof lactation in MFG samples of Ghezel sheep breed. Gene symbols are shown in X-axis and the logRPKMexpression values shown in Y-axis.

Page 25/26
Figure 5
Expression changes in milk fat metabolism pathway genes during lactation. Stages of lactation and theFPKM value gene expression are shown in x-axis and y-axis respectively. The six part of fat metabolismin milk include: A) Fatty acid uptake, B) De novo fatty acid synthesis, C) Fatty acid desaturation, D) Fattyacid esteri�cation, E) Regulation of fatty acid synthesis, F) Milk fat secretion. All of the genes in milk fatmetabolism showed higher expression in BF than AF period. Gene names are in the legend.

Page 26/26
Figure 6
STRING analysis shows that DEGs are involved in known and predicted protein-protein interactions.Network nodes represent genes. Lines of different color represent seven types of evidence used inpredicting associations. Red line: fusion evidence; green line: neighborhood evidence; blue line: co-occurrence evidence; purple line: experimental evidence; yellow line: text mining evidence; light blue line:database evidence; black line: co-expression evidence. Interaction score > 0.4.
Supplementary Files
This is a list of supplementary �les associated with this preprint. Click to download.
supplement1.pdf
supplement2.pdf
supplement3.pdf