point prevalence survey of hospital-acquired infections
TRANSCRIPT

Point Prevalence Survey of Hospital‐Acquired Infections &
Antimicrobial Use in European Acute Care Hospitals: May 2012
REPUBLIC OF IRELAND: NATIONAL REPORT ‐ NOVEMBER 2012
Report Authors: Karen Burns, Margaret Foley & Sheila Donlon, HPSC
Suggested Citation: Health Protection Surveillance Centre, Point Prevalence Survey of Hospital Acquired Infections & Antimicrobial Use in European Acute Care Hospitals: May
2012 – Republic of Ireland National Report: November 2012.
P a g e | i
Table of Contents Acknowledgements ....................................................................................................................... iii
Executive Summary ....................................................................................................................... iv
Future Priorities ............................................................................................................................. vi
Plain Language Summary .............................................................................................................. vii
1.0 Introduction ....................................................................................................................... 1
2.0 Methods ............................................................................................................................. 2
3.0 Participating Hospitals ........................................................................................................ 5
4.0 Results .............................................................................................................................. 7
4.1 Participant Feedback ......................................................................................................... 7
4.2 Characteristics of Participating Hospitals .......................................................................... 7
4.2.1 Hospital Characteristics .......................................................................................... 7
4.2.2 Ward Characteristics ............................................................................................ 10
4.3 Characteristics of the Patient Population ....................................................................... 11
4.3.1 Demographics of Patients Surveyed .................................................................... 11
4.3.2 Patient Location by Ward and Admitting Consultant Specialty ........................... 12
4.3.3 Patient Risk Factors for HAI .................................................................................. 13
4.4 Hospital‐Acquired Infections (HAI) .................................................................................. 15
4.4.1 Overall Prevalence of Hospital‐Acquired Infections ............................................ 15
4.4.2 HAI Patient Risk Factors ....................................................................................... 16
4.4.3 HAI Prevalence by Gender, Age and McCabe Score............................................. 17
4.4.4 HAI Prevalence by Ward Speciality and Admitting Consultant Specialty ............. 18
4.4.5 HAI Prevalence by Surgery and Length‐of‐Admission Prior to HAI Onset............ 19
4.4.6 Onset and Origin of HAI ........................................................................................ 21
4.4.7 Distribution of HAI by Type .................................................................................. 22
4.5 Microbiology and Key Antimicrobial Resistance Markers ............................................... 27
4.5.1 Microbiology and Antimicrobial Resistance Data ................................................ 27
4.5.2 Causative Pathogens of the Most Common HAI Types ........................................ 29
4.6 Antimicrobial Use ............................................................................................................ 30
4.6.1 Overall Prevalence of Antimicrobial Use .............................................................. 30
4.6.2 Antimicrobial Use Patient Risk Factors ................................................................ 31
4.6.3 Antimicrobial Use Prevalence by Gender, Age and McCabe Score ...................... 32
4.6.4 Antimicrobial Use Prevalence by Ward Specialty and Admitting Consultant Specialty ............................................................................................................... 33
4.6.5 Route of Administration of Antimicrobial ............................................................ 34
4.6.6 Documentation of Indication and Compliance with Local Policy ......................... 34
4.6.7 Description of Prescribed Antibacterials .............................................................. 36
4.6.8 Description of Prescribed Antifungals .................................................................. 36
HSE‐Health Protection Surveillance Centre (HPSC) Tel: +353 1 8765 300 www.hpsc.ie 25‐27 Middle Gardiner Street, Dublin 1, Ireland. Fax: +353 1 856 1299 2012 ECDC PPS of HAI & AMU: IRELAND NATIONAL REPORT

P a g e | ii
HSE‐Health Protection Surveillance Centre (HPSC) Tel: +353 1 8765 300 www.hpsc.ie 25‐27 Middle Gardiner Street, Dublin 1, Ireland. Fax: +353 1 856 1299 2012 ECDC PPS of HAI & AMU: IRELAND NATIONAL REPORT
4.6.9 Indication for Antimicrobial Prescribing ............................................................... 37
4.6.10 Antimicrobials Prescribed for Treatment of Infection ......................................... 37
4.6.11 Surgical Antimicrobial Prophylaxis ....................................................................... 41
4.6.12 Medical Prophylaxis ............................................................................................. 42
4.7 Prevalence of HAI and Antimicrobial Use by Hospital Type and Participating Hospitals 43
5.0 Previous Prevalence Surveys .............................................................................................. 47
5.1 Hospital Infection Society (HIS): Third Prevalence Survey of Healthcare‐Associated Infections in Acute Hospitals – 2006 ............................................................................... 47
5.2 European Surveillance of Antimicrobial Consumption (ESAC) Hospitals Care Point Prevalence Surveys .......................................................................................................... 50
6.0 Prevalence of HAI and AMU: Republic of Ireland and Neighbouring Countries ................... 51
7.0 Discussion .......................................................................................................................... 53
8.0 Priorities for Implementation ............................................................................................ 56
8.1 Immediate Priorities ........................................................................................................ 56
8.2 Short‐term Priorities – Implement within the Next Year ................................................ 57
8.3 Medium‐to‐Longer Term Priorities – Implement within the Next Five Years ................. 57
9.0 References ......................................................................................................................... 60
10.0 Appendices ........................................................................................................................ 63
Appendix A: PPS Steering Group Membership .................................................................. 63
Appendix B: List of Acronyms ............................................................................................. 64
Appendix C: List of Participating Hospitals Categorised by Hospital Type ......................... 66
Appendix D: HAI & AMU Prevalence by Ward Specialty and Admitting Consultant Specialty ......................................................................................................... 67
Appendix E: PPS Data Collection Forms ............................................................................. 69
Appendix F: Latest Available HCAI Surveillance Data for Ireland (Source: HPSC) ............. 74
List of Tables 75
List of Figures 77

P a g e | iii
Acknowledgements The members of the PPS Steering Group would like to sincerely acknowledge the commitment of the following healthcare staff who volunteered to participate and who supported the 2012 PPS:
PPS Team Leaders
PPS Data Collectors
Administrative Staff, who inputted local PPS data
Ward Nursing & Midwifery Staff who completed Ward Lists and assisted with data collection
Clinicians, who assisted with data collection
Antimicrobial and General Pharmacists, who assisted with data collection
Ms Anne Keane, HSE Quality & Patient Safety Auditor
Ms Patricia McNamara, HSE Quality & Patient Safety Auditor
Ms Edwina Dunne, Director, HSE Quality & Patient Safety Audit
Participating Hospital Managers & Chief Executive Officers
Dr Michael Shannon, HSE Nursing and Midwifery Services Director
Ms Orla Bannon, Senior Executive, Corporate Services, HPSC
Dr Darina O’Flanagan, Director HPSC
Dr Kevin Kelleher, Assistant National Director, ISD – Health Protection
Dr Philip Crowley, HSE Quality & Patient Safety Director
Mr Gerard McIlvenny, Surveillance Manager, Health Protection, Public Health Agency, Northern Ireland
Mr Mark McConaghy, Public Health Agency, Northern Ireland
Ms Rachel Spiers, Public Health Agency, Northern Ireland
Dr Lourda Geoghegan, Health Protection Consultant, HCAI Lead, Public Health Agency, Northern Ireland
Dr Carl Suetens, European Centre for Disease Prevention and Control, Sweden
HSE‐Health Protection Surveillance Centre (HPSC) Tel: +353 1 8765 300 www.hpsc.ie 25‐27 Middle Gardiner Street, Dublin 1, Ireland. Fax: +353 1 856 1299 2012 ECDC PPS of HAI & AMU: IRELAND NATIONAL REPORT

P a g e | iv
Executive Summary
Hospital & Eligible Patient Characteristics
In May 2012, 50 acute Irish hospitals (42 public and eight private) participated in the voluntary European Centre for Disease Prevention and Control (ECDC) point prevalence survey (PPS) of hospital‐acquired infections (HAI) and antimicrobial use (AMU). The breakdown of participating hospitals by type included: 15 primary/general, ten secondary/regional, six tertiary, 11 specialist public, one specialist private and seven other private hospitals
The average number of acute beds in the 42 public hospitals ranged from 135 to 603, depending on the hospital type. The average proportion of single patient rooms was lowest in public primary hospitals (14.8%) and highest in private hospitals (36.8%)
One hospital reported having no infection prevention and control nurse (IPCN) and 17 hospitals (34%) reported having no designated infection prevention and control doctor (IPCD). Both public and private hospitals reported having 0.70 IPCN per 100 beds. Private hospitals reported having 0.19 IPCD per 100 beds, which was higher than the 0.11 IPCD/100 beds reported by public hospitals
Of the 9,030 eligible patients surveyed, there was a slight female preponderance at 53.7%, with 12% of the population aged <16 and 48% aged ≥65 years
Eighteen percent of patients had undergone surgery since hospital admission and 49% had at least one invasive device in situ (e.g., peripheral vascular catheter or urethral catheter)
Hospital‐Acquired Infections
There were 501 active HAI identified in 467 patients. The overall HAI prevalence was 5.2%. The majority of the HAI occurred in patients aged ≥16 years (92.9%)
The overall HAI prevalence, by hospital type was highest for tertiary hospitals (7.5%) and lowest for private hospitals (2.5%)
Patients with HAI were more likely to have risk factors, such as surgery since hospital admission and invasive medical devices in situ, than the overall eligible population
The prevalence of HAI was highest in augmented care units [adult and paediatric intensive care units (ICU), neonatal intensive care units (NICU) and high dependency units (HDU)] (16.5%), followed by surgical wards (6.7%). Psychiatric wards and obstetrics/gynaecology wards had the lowest HAI prevalence (1.5%)
The top four HAI types reported were:
o Surgical site infection (91 cases; 18.2%) o Pneumonia (86 cases; 17.2%) o Urinary tract infection (75 cases; 15%) o Bloodstream infection (66 cases; 13%)
Of the bloodstream infections, 28 (42%) were due to infection of an indwelling vascular catheter
HSE‐Health Protection Surveillance Centre (HPSC) Tel: +353 1 8765 300 www.hpsc.ie 25‐27 Middle Gardiner Street, Dublin 1, Ireland. Fax: +353 1 856 1299 2012 ECDC PPS of HAI & AMU: IRELAND NATIONAL REPORT

P a g e | v
There were 29 patients with Clostridium difficile infection, accounting for 5.7% of all HAI The most frequent group of pathogens causing HAI were the Enterobacteriaceae and of those,
one‐in‐four were resistant to broad spectrum third generation cephalosporins. Staphylococcus aureus was the next most frequent pathogen causing HAI, and 37% of Staphylococcus aureus was resistant to flucloxacillin (i.e., meticillin‐resistant Staphylococcus aureus or MRSA)
Antimicrobial Use The survey collected information on all patients who were prescribed antimicrobials, not just
those being treated for a HAI. There were 3,108 patients who were prescribed 4,532 systemic antimicrobials. The overall AMU prevalence was 34%. The majority of antimicrobial use occurred in patients aged ≥16 years (91%)
The overall AMU prevalence, by hospital type was highest for tertiary hospitals (37.4%) and lowest for specialist hospitals (20.3%)
The prevalence of AMU, by ward type was highest in augmented care units [e.g., ICU, NICU, HDU] (50.4%) and lowest in psychiatric units (5.5%)
The parenteral (i.e., intravenous) route accounted for most prescribed antimicrobials (63%)
There was a documented indication for the antimicrobial prescription in 3,767 cases (83%). The indication for prescription was for treatment of infection in 78% of cases, surgical antimicrobial prophylaxis in 11% of cases and medical prophylaxis in 8% of cases
Treatment of community‐associated infections represented the majority of antimicrobial prescriptions (69%), followed by hospital‐associated infections, which accounted for 29% of prescriptions. The most common infection sites for which antimicrobials were prescribed included; respiratory tract (35%), skin /soft tissue/wound (14%), abdominal (11%) and lower urinary tract infections (7%)
The majority of surgical antimicrobial prophylaxis (73%) exceeded single‐dose and almost half (47%) of surgical antimicrobial prophylaxis was continued beyond 24 hours duration
Although the indication for prescription of antimicrobials for medical prophylaxis was not specifically recorded, broad spectrum agents including, co‐amoxiclav and ciprofloxacin accounted for 8.6% and 4.4% of medical prophylaxis, respectively
Broad spectrum β lactam‐β lactamase inhibitor combination antimicrobials (i.e., co‐amoxiclav and piperacillin‐tazobactam) together accounted for 35% of prescribed antimicrobials. Fluoroquinolones (ciprofloxacin, levofloxacin, moxifloxacin and olfloxacin) combined ranked fourth (8%) and meropenem ranked tenth (3%) in the top 20 agents prescribed
For the purposes of reporting, the individual HAI and AMU prevalence results of the 42 acute public hospitals are grouped by HSE administrative region. The individual HAI and AMU prevalence results of the seven private and the one specialist private hospital are grouped separately. Owing to differences in hospital types and case mix, direct comparison of HAI and AMU prevalence in acute hospitals within the same HSE region is not recommended and likewise, direct comparison of HAI and AMU prevalence between private hospitals is not recommended
HSE‐Health Protection Surveillance Centre (HPSC) Tel: +353 1 8765 300 www.hpsc.ie 25‐27 Middle Gardiner Street, Dublin 1, Ireland. Fax: +353 1 856 1299 2012 ECDC PPS of HAI & AMU: IRELAND NATIONAL REPORT

P a g e | vi
Future Priorities
1. Ensure all acute hospital staff have been made aware of the local and national results of the 2012 PPS.
2. Provide ongoing education and training for healthcare workers, regarding the importance and impact of HAI and antimicrobial resistance.
3. Improve hand hygiene compliance in all staff.
4. Implement plans to prevent infections associated with medical devices (intravascular catheters, urinary catheters, devices for respiratory tract intubation and prosthetic surgical devices).
5. Monitor and measure infections associated with medical devices and implement prospective surveillance programmes.
6. Implement the core, high impact interventions to promote prudent antimicrobial prescribing.
7. Ensure that frontline healthcare worker staffing levels reflect patient case mix and dependency levels.
8. Ensure that key infection prevention and control, antimicrobial stewardship and surveillance staff are not diverted to tasks outside their designated roles and that activities related to prevention of antimicrobial resistance and HAI are appropriately resourced.
9. Ensure that future strategic developments in Irish healthcare facilities include infrastructure and information technology that support the prevention of HAI and antimicrobial resistance.
10. Plan for periodic repeat prevalence surveys, locally and nationally to monitor and measure improvements in HAI prevalence and antimicrobial prescribing practices.
HSE‐Health Protection Surveillance Centre (HPSC) Tel: +353 1 8765 300 www.hpsc.ie 25‐27 Middle Gardiner Street, Dublin 1, Ireland. Fax: +353 1 856 1299 2012 ECDC PPS of HAI & AMU: IRELAND NATIONAL REPORT

P a g e | vii
Plain Language Summary
Background
During May 2012, 50 Irish hospitals took part in a European hospital survey. The survey was coordinated in Ireland by the Health Protection Surveillance Centre (HPSC). The HPSC is the national centre for the surveillance of infections in Ireland. The survey has been carried out in all of the European Union countries.
During April 2012, staff members from the 50 hospitals went to a training day, where they were taught how to perform the survey. The survey was then carried out in each hospital by a team of the hospital’s own staff, using the same set of instructions in each hospital across the country. Once the survey was completed, the results from each hospital were collected and checked at the HPSC. The results have been put together to produce this national report for Ireland. The results for every hospital that took part have also been returned to each individual hospital, so they can be used to help the staff to make future plans to further improve patient care.
The survey was done for the following reasons:
1. To count the number of patients with an infection, which may have occurred as a result of being admitted to hospital. A so‐called ‘hospital‐acquired infection’ or HAI for short.
2. To count the number of patients in the hospitals who were prescribed antibiotics. 3. To provide the Irish Government, Department of Health, Health Service Executive, the
managers, doctors and nurses in all of the hospitals that took part, with information about HAI and antibiotic prescribing in Irish hospitals in 2012. This information is important to plan future ways to reduce the numbers of patients who get HAI and to reduce the chance that antibiotics may be prescribed unnecessarily.
4. To provide members of the public with more information about HAI in Ireland and which types of infections are most commonly seen in Irish hospitals.
The count of the patients with a HAI and the patients prescribed antibiotics is called ‘prevalence’. These results provide us with a picture or a snapshot of the number of patients who had a HAI and the number of patients who were prescribed antimicrobials in the Irish hospitals that took part in the survey in May 2012.
Hospital‐Acquired Infections (HAI)
During this survey, a HAI was defined as an infection that developed more than two days after a patient was admitted to a hospital, or an infection that developed because of a medical device being inserted or a wound infection that occurred within a defined time limit after an operation. HAI are very important because they can cause harm to patients. Not every HAI can be prevented from happening, but every chance should be taken to prevent HAI, whenever possible.
There were 9,030 patients counted during the survey across 50 Irish hospitals. Of those patients, 467 had a HAI at the time of the survey. This means that the prevalence of HAI across all of the hospitals was 5.2%. There were some hospitals with a HAI prevalence that was higher and other hospitals with a HAI prevalence that was lower than the overall figure of 5.2%. This means that about one‐in‐twenty patients admitted to Irish hospitals in May 2012 had a HAI. However, because different hospitals may admit different types of patients and have different types of medical and surgical
HSE‐Health Protection Surveillance Centre (HPSC) Tel: +353 1 8765 300 www.hpsc.ie 25‐27 Middle Gardiner Street, Dublin 1, Ireland. Fax: +353 1 856 1299 2012 ECDC PPS of HAI & AMU: IRELAND NATIONAL REPORT

P a g e | viii
HSE‐Health Protection Surveillance Centre (HPSC) Tel: +353 1 8765 300 www.hpsc.ie 25‐27 Middle Gardiner Street, Dublin 1, Ireland. Fax: +353 1 856 1299 2012 ECDC PPS of HAI & AMU: IRELAND NATIONAL REPORT
specialists working within the hospital, it is not possible to directly compare the results of one hospital with those of another hospital.
The most common types of infections reported in the survey were as follows:
1. Surgical site infections, which are also known as wound infections. 2. Pneumonia, which is also known as a chest infection. 3. Urinary tract infections, which may include infections of the bladder or kidneys. 4. Bloodstream infections. 5. Gastrointestinal infections, which may include bowel infections or gastroenteritis.
In this survey, it was found that the patients who had a HAI were more likely to have some of the common ‘risk factors’ for developing a HAI, when they were compared with the patients who did not have a HAI. Well‐known risk factors for developing HAI can include: having had an operation, having a drip or a bladder catheter, being in an intensive care unit, being older or very young in age and receiving antibiotics. Recent antibiotic use can also be a risk factor for developing Clostridium difficile diarrhoea. Twenty‐nine patients were reported to have Clostridium difficile diarrhoea during the survey.
Antibiotics are an extremely important resource for treatment of infections caused by bacteria. There is concern around the world that bacteria are becoming more and more resistant to antibiotics, so they no longer work to treat common infections. This problem is made worse by the fact that there have been very few new types of antibiotics developed to overcome this problem of resistance. It is very important that antibiotics are only used when they are absolutely necessary and that they are not used in the incorrect circumstances, such as to try and treat infections caused by viruses. It is also very important that antibiotics are not used for too long and that the course of treatment is kept as short as possible. During this survey, 17 patients were reported to have HAI caused by meticillin resistant Staphylococcus aureus (MRSA), nine patients were reported to have HAI caused by vancomycin resistant enterococci (VRE) and 26 patients were reported to have HAI caused by resistant Enterobacteriaceae.
Antibiotic Use
This survey found that of the 9,030 patients who were counted, 3,108 were prescribed antibiotics. This means that the prevalence of antibiotic use across all of the Irish hospitals was 34%. However, because different hospitals may admit different types of patients and have different types of medical and surgical specialists working within the hospital, it is not possible to directly compare the results of one hospital with those of another hospital.
About one‐in‐three patients who were admitted to Irish hospitals in May 2012 were prescribed an antibiotic. This survey showed that antibiotic prescribing is very common in Irish hospitals. Many patients are admitted to hospital from home because they need to get antibiotic treatment for an infection. Patients who develop an infection whilst in hospital for other reasons (a so‐called HAI) will often need antibiotic treatment. The results of the survey show that it is very important to make sure that antibiotic prescribing in hospitals is done properly and that antibiotics are prescribed appropriately. This in turn, will reduce the chances of antibiotic resistant bacteria emerging in our hospitals and preserve the use of antibiotics for treatment of patients in the future.

P a g e | 1
1.0 Introduction
This report outlines the findings of a national survey conducted in May 2012 to assess the prevalence of HAI and antimicrobial prescribing practices in Irish hospitals.
Hospital‐acquired infections (HAI) have the potential to cause harm to patients and in some cases, severe illness and death. The HAI types most likely to cause severe infection or patient mortality include; bloodstream infections (BSI) caused by infected vascular catheters and ventilator‐associated pneumonia (VAP).1 HAI are not an inevitable consequence of healthcare. It has been estimated that up to 70% of vascular‐catheter related BSI and 55% of VAP and surgical site infection (SSI) cases may be reasonably prevented.1
Many HAI can be prevented, provided every healthcare worker applies simple measures, which include, but are not limited to: consistent compliance with the World Health Organisation (WHO) ‘Five moments for hand hygiene’, to prevent cross‐transmission of pathogens that cause HAI and the use of evidence‐based interventions, such as care bundles or quality improvement tools, which may be applied to prevent device‐related infections and surgical site infections.2,3 National Standards for the Prevention and Control of Healthcare‐Associated Infections were published by the Health Information and Quality Authority (HIQA) in May 2009 and in June 2012, HIQA published National Standards for Safer Better Healthcare, to describe how a service provides high quality, safe and reliable care through eight themes, relating to quality, safety, capacity and capability.4,5
National guidelines for antimicrobial stewardship were published in 2009 and outline a number of core high‐impact interventions for antimicrobial stewardship.6 Antimicrobial consumption is the major driver of antimicrobial resistance. HAI that are caused by antimicrobial resistant organisms, also known as multi‐drug resistant organisms (MDRO) [e.g., meticillin resistant Staphylococcus aureus (MRSA), vancomycin resistant enterococci (VRE), extended spectrum β lactamase (ESBLs) and carbapenemase‐producing Enterobacteriaceae (CRE)] are associated with higher healthcare costs, increased length‐of‐stay and higher mortality than HAI that are caused by antimicrobial‐susceptible organisms.7 It is estimated that 25,000 people die in the European Union (EU) annually from infections caused by MDRO combined, with an associated cost of €1.5 billion.8 Prior to the introduction of antimicrobials, infectious diseases were a leading cause of mortality. The ‘antibiotic era’ facilitated many advances in medicine, such as transplantation, chemotherapy and insertion of prosthetic devices. However, increased antimicrobial consumption, coupled with stagnation in discovery of novel antimicrobial agents has led to emergence and worldwide dissemination of MDRO, which are well‐described in Ireland and in some cases, are now endemic in Irish hospitals.
In Ireland, hand hygiene compliance audit scores, C. difficile infection rates, antimicrobial consumption and antimicrobial resistance in key pathogens causing bloodstream infections are monitored on an ongoing basis by the Health Protection Surveillance Centre (HPSC) (Appendix F – Latest Available HCAI Surveillance Indicators for Ireland). This data demonstrates that despite initial improvements in 2009 and 2010, hospital and community antimicrobial consumption has been increasing, antimicrobial resistance has also been increasing, especially in Enterobacteriaceae and enterococci, C. difficile infection rates are higher than they should be and hand hygiene compliance audit scores have been gradually increasing, although some groups of healthcare workers fall behind others, with regard to hand hygiene compliance (Source: HPSC).
The results of this survey provide additional information outlining the most prevalent HAI types and further details on antimicrobial prescribing practices in Irish hospitals. This information will be used widely at hospital, regional and national levels to plan future improvement and preventative programmes.
HSE‐Health Protection Surveillance Centre (HPSC) Tel: +353 1 8765 300 www.hpsc.ie 25‐27 Middle Gardiner Street, Dublin 1, Ireland. Fax: +353 1 856 1299 2012 ECDC PPS of HAI & AMU: IRELAND NATIONAL REPORT

P a g e | 2
2.0 Methods
A point prevalence survey (PPS) of HAI and antimicrobial use (AMU) took place in Ireland between May 8th and 25th 2012. Fifty acute hospitals volunteered to participate in this study, which was coordinated in Ireland by the HPSC. The survey was conducted across Europe using a standardised protocol devised by the European Centre for Disease Prevention and Control (ECDC) and HAI were defined using standardised European definitions of infection, where available:
Hospitals in Europe Link for Infection Control through Surveillance (HELICS) HAIICU definitions for bloodstream infection, pneumonia, catheter‐related infection and urinary tract infection
HELICS HAISSI definitions for surgical site infection European Society for Clinical Microbiology and Infectious Diseases Study Group on C. difficile
(ESCMID‐ESGCD) definitions for C. difficile infection German HCAI surveillance network (KISS) definitions for neonatal infections US Centers for Disease Control and Prevention (CDC) definitions were used for other
infections with no existing European definitions
In December 2011, a multi‐disciplinary PPS steering group was convened under the Royal College of Physicians of Ireland (RCPI) Clinical Advisory Group (CAG) for Healthcare‐Associated Infections (HCAI) and Antimicrobial Resistance (AMR) (Appendix A). The steering group met on seven occasions between January and November 2012 to plan for the PPS and report on the PPS findings.
Throughout 2012, there was ongoing collaboration between the HPSC and the Public Health Agency (PHA), Northern Ireland with regards to planning of the PPS, preparation of the all‐Ireland PPS protocol, training of data collectors, management, analysis and reporting of the 2012 PPS data.
During April 2012, 207 healthcare workers attended one of nine regional training days to learn about the survey protocol and methodology. The schedule of presentations for each training day included; an introductory presentation describing content, completion instructions for the PPS data collection forms, presentations and practical case studies to enable trainees to practice completion of the PPS data collection form (Appendix E). Following attendance at a training day, each participant was forwarded an additional twenty practice case studies along with completed PPS data collection forms. All PPS training materials were posted on a dedicated PPS section of the HPSC website. A practical guide on PPS preparation was also produced and circulated to the nominated PPS team leader of each hospital.
During the PPS, all eligible patients in each hospital were surveyed by a multidisciplinary local PPS team for anonymous demographic details, risk factors, antimicrobial use and the presence of active HAI.
A dedicated PPS e‐mail address and telephone helpdesk were established at the HPSC to address any queries that arose before, during and after the PPS. A frequently‐asked questions (FAQ) section was also maintained on the HPSC website to address the most commonly encountered queries during the PPS. PPS information leaflets were also prepared for patients and for healthcare workers.
All study documentation related to the PPS, including protocol and data collection forms were posted on a dedicated PPS section of the HPSC website: http://www.hpsc.ie/hpsc/A‐Z/MicrobiologyAntimicrobialResistance/InfectionControlandHAI/Surveillance/HospitalPointPrevalenceSurveys/2012/
HSE‐Health Protection Surveillance Centre (HPSC) Tel: +353 1 8765 300 www.hpsc.ie 25‐27 Middle Gardiner Street, Dublin 1, Ireland. Fax: +353 1 856 1299 2012 ECDC PPS of HAI & AMU: IRELAND NATIONAL REPORT

P a g e | 3
Data Management & Analysis
Data were collected on paper forms (Appendix E) and subsequently entered electronically by hospital staff to an on‐line data capture system (Formic Fusion Version 5.4.1). Each participating hospital was provided with password‐protected secure remote access to this web‐based system to allow electronic data submission.
Once submitted, data were cleaned and quality checks were performed. All hospitals received a summary of submitted data with any inconsistent, missing or potentially inaccurate data highlighted for correction. Example of such possible errors included invalid admission or survey dates and patient ages that did not correspond with the named ward speciality type.
There were 43 patients who were recorded as having a HAI or receiving antimicrobials, but had no HAI or antimicrobial details completed. There were an additional 38 patients who were recorded as having no HAI or receiving no antimicrobials but had details completed. There were also 76 patients for whom either the HAI or antimicrobial questions had not been completed. All of these errors were followed up with the relevant hospital.
Finalised data were analysed using SPSS Version 16.0 (SPSS Inc., Illinois) and STATA Version 11 (STATA Corporation, Texas). The prevalence of HAI, antimicrobial use and device use were calculated with 95% confidence intervals (CI) using Wilson’s Score method. Univariate analysis using Chi‐squared tests was conducted for categorical risk factors and statistical significance was set as a level of 5% (0.05).
Data Validation
A validation study was conducted to assess the validity and consistency of applying the PPS protocol and definitions. For this purpose, a national PPS validation team (VT) was trained and coordinated by HPSC to act as the “Gold Standard” against which the data collected by the hospital PPS teams could be compared. This team included five members, two national PPS coordinators, two Quality and Patient Safety Auditors and a member of the HSE Healthcare‐Associated Infection & Antimicrobial Resistance Clinical Programme.
Participating hospitals were grouped by type and ten were randomly selected to undergo validation. Two members of the VT, including at least one national PPS coordinator, visited each of the ten hospitals and conducted validation on one or two pre‐selected wards. The hospital types visited for validation included; Primary (n=2), secondary (n=3), tertiary (n=2), specialist (n=2) and private (n=1).
The VT conducted repeat collection of basic demographic data, HAI data and AMU data for all eligible patients on the selected wards, with exact application of the PPS protocol and case definitions. Data collection by the VT was performed at the same time as the hospital PPS teams, to ensure that the information available to both teams was equal. However, there was no communication or consultation between the hospital and validation teams during data collection.
HSE‐Health Protection Surveillance Centre (HPSC) Tel: +353 1 8765 300 www.hpsc.ie 25‐27 Middle Gardiner Street, Dublin 1, Ireland. Fax: +353 1 856 1299 2012 ECDC PPS of HAI & AMU: IRELAND NATIONAL REPORT

P a g e | 4
The sensitivity, specificity and kappa statistic for HAI and antimicrobial identification are presented in Table 2.1. The sensitivity and specificity for ‘patient on antimicrobials’ were excellent, signifying that the hospital PPS teams were able to correctly identify whether or not a patient was receiving antimicrobials. The kappa value (0.95) indicates a high level of agreement between the VT team and the hospital PPS teams.
The specificity for ‘patient has active HAI’ was also excellent meaning hospital PPS teams were able to correctly identify when a patient did not have a HAI. Sensitivity for ‘patient has active HAI’ was lower, indicating that hospital PPS teams were less likely to correctly apply the case definition when identifying a patient with a HAI.
Table 2.1: Validation results for HAI and antimicrobial identification
PPS Data Collection Form Question
Sensitivity Specificity Kappa value
Patient on antimicrobials 95.5% 98.9% 0.95
Patients has active HAI 63.3% 99.0% 0.71
HSE‐Health Protection Surveillance Centre (HPSC) Tel: +353 1 8765 300 www.hpsc.ie 25‐27 Middle Gardiner Street, Dublin 1, Ireland. Fax: +353 1 856 1299 2012 ECDC PPS of HAI & AMU: IRELAND NATIONAL REPORT
P a g e | 5
3.0 Participating Hospitals
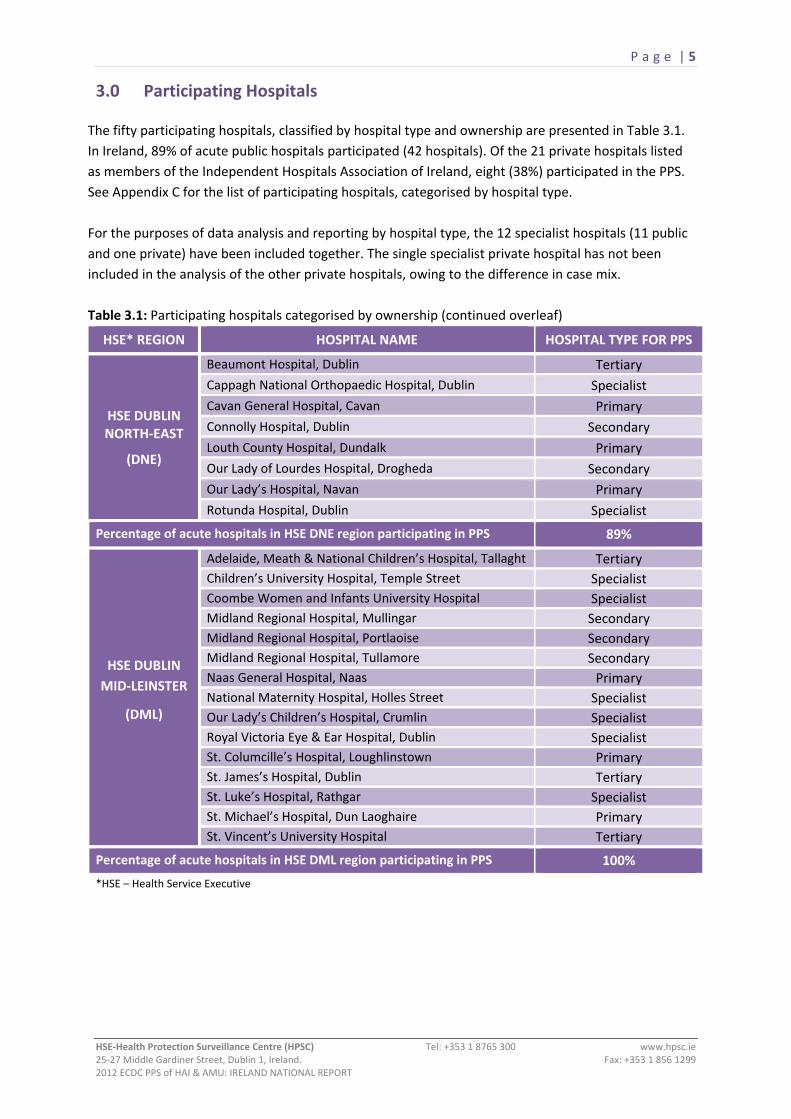
The fifty participating hospitals, classified by hospital type and ownership are presented in Table 3.1. In Ireland, 89% of acute public hospitals participated (42 hospitals). Of the 21 private hospitals listed as members of the Independent Hospitals Association of Ireland, eight (38%) participated in the PPS. See Appendix C for the list of participating hospitals, categorised by hospital type. For the purposes of data analysis and reporting by hospital type, the 12 specialist hospitals (11 public and one private) have been included together. The single specialist private hospital has not been included in the analysis of the other private hospitals, owing to the difference in case mix. Table 3.1: Participating hospitals categorised by ownership (continued overleaf)
HSE* REGION HOSPITAL NAME HOSPITAL TYPE FOR PPS
HSE DUBLIN NORTH‐EAST
(DNE)
Beaumont Hospital, Dublin Tertiary Cappagh National Orthopaedic Hospital, Dublin Specialist Cavan General Hospital, Cavan Primary Connolly Hospital, Dublin Secondary Louth County Hospital, Dundalk Primary Our Lady of Lourdes Hospital, Drogheda Secondary Our Lady’s Hospital, Navan Primary Rotunda Hospital, Dublin Specialist
Percentage of acute hospitals in HSE DNE region participating in PPS 89%
HSE DUBLIN MID‐LEINSTER
(DML)
Adelaide, Meath & National Children’s Hospital, Tallaght Tertiary Children’s University Hospital, Temple Street Specialist Coombe Women and Infants University Hospital Specialist Midland Regional Hospital, Mullingar Secondary Midland Regional Hospital, Portlaoise Secondary Midland Regional Hospital, Tullamore Secondary Naas General Hospital, Naas Primary National Maternity Hospital, Holles Street Specialist Our Lady’s Children’s Hospital, Crumlin Specialist Royal Victoria Eye & Ear Hospital, Dublin Specialist St. Columcille’s Hospital, Loughlinstown Primary St. James’s Hospital, Dublin Tertiary St. Luke’s Hospital, Rathgar Specialist St. Michael’s Hospital, Dun Laoghaire Primary St. Vincent’s University Hospital Tertiary
Percentage of acute hospitals in HSE DML region participating in PPS 100%
*HSE – Health Service Executive
HSE‐Health Protection Surveillance Centre (HPSC) Tel: +353 1 8765 300 www.hpsc.ie 25‐27 Middle Gardiner Street, Dublin 1, Ireland. Fax: +353 1 856 1299 2012 ECDC PPS of HAI & AMU: IRELAND NATIONAL REPORT

P a g e | 6
HSE REGION HOSPITAL NAME HOSPITAL TYPE FOR PPS
HSE WEST
Galway University Hospitals Tertiary
Letterkenny General Hospital Secondary
Mid‐Western Regional Hospital, Dooradoyle Tertiary
Mid‐Western Regional Hospital, Ennis Primary
Mid‐Western Regional Hospital, Nenagh Primary Mid‐Western Regional Maternity Hospital Specialist
Mid‐Western Regional Orthopaedic Hospital, Croom Specialist
Portiuncula Hospital, Ballinasloe Secondary
Roscommon County Hospital Primary
Sligo General Hospital Secondary
St. John’s Hospital, Limerick Primary
Percentage of acute hospitals in HSE West region participating in PPS 92%
HSE SOUTH
Kerry General Hospital Primary Lourdes Orthopaedic Hospital, Kilcreene Specialist Mercy University Hospital, Cork Secondary South Infirmary‐Victoria Hospital, Cork Primary South Tipperary General Hospital, Clonmel Primary St. Luke’s General Hospital, Kilkenny Primary Waterford Regional Hospital Secondary Wexford General Hospital Primary
Percentage of acute hospitals in HSE South region participating in PPS 73%
PRIVATE HOSPITALS
Bon Secours, Cork Private Bon Secours, Galway Private Bon Secours, Dublin Private Bon Secours, Tralee Private Galway Clinic, Doughiska Private Mater Private Hospital Private UPMC Beacon Hospital, Dublin Private St. Patrick’s University Hospital^ Specialist
Percentage of private hospitals participating in PPS 38%
TOTAL NUMBER OF PARTICIPATING HOSPITALS 50 *HSE – Health Service Executive ^ For the purpose of data analysis, St. Patrick’s University Hospital is included in the specialist hospital category along with the 11 public specialist hospitals.
HSE‐Health Protection Surveillance Centre (HPSC) Tel: +353 1 8765 300 www.hpsc.ie 25‐27 Middle Gardiner Street, Dublin 1, Ireland. Fax: +353 1 856 1299 2012 ECDC PPS of HAI & AMU: IRELAND NATIONAL REPORT
P a g e | 7
4.0 Results
4.1 Participant Feedback
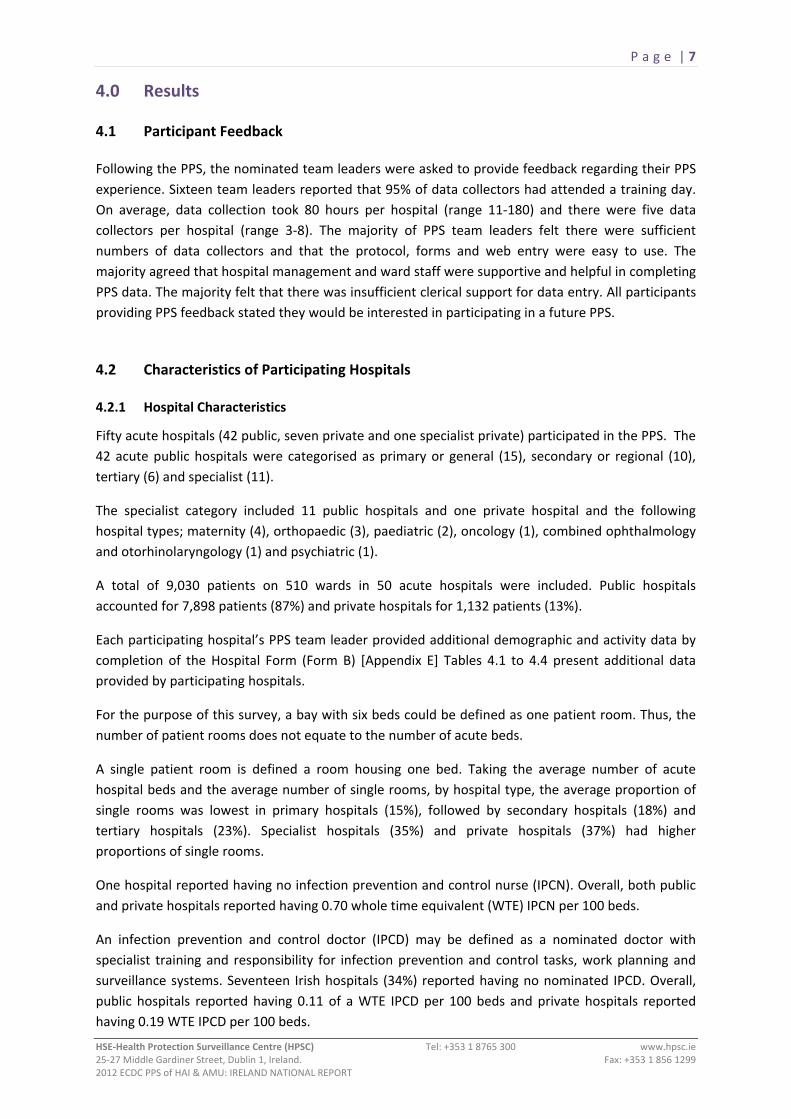
Following the PPS, the nominated team leaders were asked to provide feedback regarding their PPS experience. Sixteen team leaders reported that 95% of data collectors had attended a training day. On average, data collection took 80 hours per hospital (range 11‐180) and there were five data collectors per hospital (range 3‐8). The majority of PPS team leaders felt there were sufficient numbers of data collectors and that the protocol, forms and web entry were easy to use. The majority agreed that hospital management and ward staff were supportive and helpful in completing PPS data. The majority felt that there was insufficient clerical support for data entry. All participants providing PPS feedback stated they would be interested in participating in a future PPS.
4.2 Characteristics of Participating Hospitals
4.2.1 Hospital Characteristics
Fifty acute hospitals (42 public, seven private and one specialist private) participated in the PPS. The 42 acute public hospitals were categorised as primary or general (15), secondary or regional (10), tertiary (6) and specialist (11).
The specialist category included 11 public hospitals and one private hospital and the following hospital types; maternity (4), orthopaedic (3), paediatric (2), oncology (1), combined ophthalmology and otorhinolaryngology (1) and psychiatric (1).
A total of 9,030 patients on 510 wards in 50 acute hospitals were included. Public hospitals accounted for 7,898 patients (87%) and private hospitals for 1,132 patients (13%).
Each participating hospital’s PPS team leader provided additional demographic and activity data by completion of the Hospital Form (Form B) [Appendix E] Tables 4.1 to 4.4 present additional data provided by participating hospitals.
For the purpose of this survey, a bay with six beds could be defined as one patient room. Thus, the number of patient rooms does not equate to the number of acute beds.
A single patient room is defined a room housing one bed. Taking the average number of acute hospital beds and the average number of single rooms, by hospital type, the average proportion of single rooms was lowest in primary hospitals (15%), followed by secondary hospitals (18%) and tertiary hospitals (23%). Specialist hospitals (35%) and private hospitals (37%) had higher proportions of single rooms.
One hospital reported having no infection prevention and control nurse (IPCN). Overall, both public and private hospitals reported having 0.70 whole time equivalent (WTE) IPCN per 100 beds.
An infection prevention and control doctor (IPCD) may be defined as a nominated doctor with specialist training and responsibility for infection prevention and control tasks, work planning and surveillance systems. Seventeen Irish hospitals (34%) reported having no nominated IPCD. Overall, public hospitals reported having 0.11 of a WTE IPCD per 100 beds and private hospitals reported having 0.19 WTE IPCD per 100 beds.
HSE‐Health Protection Surveillance Centre (HPSC) Tel: +353 1 8765 300 www.hpsc.ie 25‐27 Middle Gardiner Street, Dublin 1, Ireland. Fax: +353 1 856 1299 2012 ECDC PPS of HAI & AMU: IRELAND NATIONAL REPORT

P a g e | 8
Table 4.1: Participating hospitals; Overall demographic and activity data
Hospitals Number of Participating Hospitals
Average Number of Acute Beds
Average Number of Admissions
Average Number of Patient Days
Average Length‐of‐ Stay (LOS)
Number of Wards Surveyed
Number of Patients Surveyed
Public Hospitals 42 226 13,664 73,903 5.7 451 7,898
Private Hospitals 8 170 8,070 47,918 8.4 59 1,132
Overall 50 217 12,769 69,746 6.1 510 9,030
Table 4.2: Participating hospitals; Overall infection prevention and control resources
Hospitals (Number)
Average Number of Patient Rooms
Average Number of Single Rooms
Average Number of WTE IPCN
Number of WTE IPCN per 100 Inpatient
beds
Average Number of WTE IPCD
Number of WTE IPCD per 100 Inpatient
Beds
Public Hospitals (42) 86 47 1.71 0.70 0.26 0.11
Private Hospitals (8) 109 76 1.37 0.70 0.38 0.19
Overall (50) 90 51 1.65 0.70 0.28 0.12
WTE: Whole time equivalent; IPCN: Infection Prevention and Control Nurse; IPCD: Infection Prevention and Control Doctor
HSE‐Health Protection Surveillance Centre (HPSC) Tel: +353 1 8765 300 www.hpsc.ie 25‐27 Middle Gardiner Street, Dublin 1, Ireland. Fax: +353 1 856 1299 2012 ECDC PPS of HAI & AMU: IRELAND NATIONAL REPORT

P a g e | 9
Table 4.3: Participating hospitals; demographic and activity data, by hospital type
Hospital Type Number of Participating Hospitals
Average Number of Acute Beds
Average Number of Admissions
Average Number of Patient Days
Average Length of
Stay
Number of Wards Surveyed
Number of Patients Surveyed
Primary 15 135 9,856 45,785 5.2 108 1,624
Secondary 10 251 15,267 82,011 5.6 124 2,100
Tertiary 6 603 24,544 204,529 8.7 159 3,080
Specialist^ 12 137 10,745 39,069 7.4 70 1,379
Private 7 152 8,821 40,628 4.6 49 847
Primary = general hospital, secondary = regional hospital
^ For the purpose of data analysis by hospital type, the private specialist hospital has been included in the specialist hospital category along with the 11 public specialist hospitals. Of the 1,379 patients in specialist hospitals, 1,094 were in 11 public hospitals and 285 were in one private hospital. The private specialist hospital has not been included in the private hospital category.
Table 4.4: Participating hospitals; infection prevention and control resources, by hospital type
Hospital Type (Number)
Average Number Patient Rooms
Average Number of
Single Rooms
Average Number of WTE IPCN
Number of WTE IPCN per 100 Inpatient
beds
Average Number of WTE IPCD
Number of WTE IPCD per 100 Inpatient
Beds
Primary (15) 43 20 1.29 0.91 0.20 0.14
Secondary (10) 92 46 1.74 0.64 0.31 0.11
Tertiary (6) 244 139 3.58 0.54 0.37 0.06
Specialist (12)^ 69 48 1.14 0.80 0.23 0.16
Private (7) 90 56 1.51 0.85 0.41 0.23
WTE: Whole time equivalent; IPCN: Infection Prevention and Control Nurse; IPCD: Infection Prevention and Control Doctor
Primary = general hospital, secondary = regional hospital
^ For the purpose of data analysis by hospital type, the private specialist hospital has been included in the specialist hospital category along with the 11 public specialist hospitals. Thus, the private specialist hospital has not been included in the private hospital category.
HSE‐Health Protection Surveillance Centre (HPSC) Tel: +353 1 8765 300 www.hpsc.ie 25‐27 Middle Gardiner Street, Dublin 1, Ireland. Fax: +353 1 856 1299 2012 ECDC PPS of HAI & AMU: IRELAND NATIONAL REPORT
P a g e | 10
4.2.2 Ward Characteristics
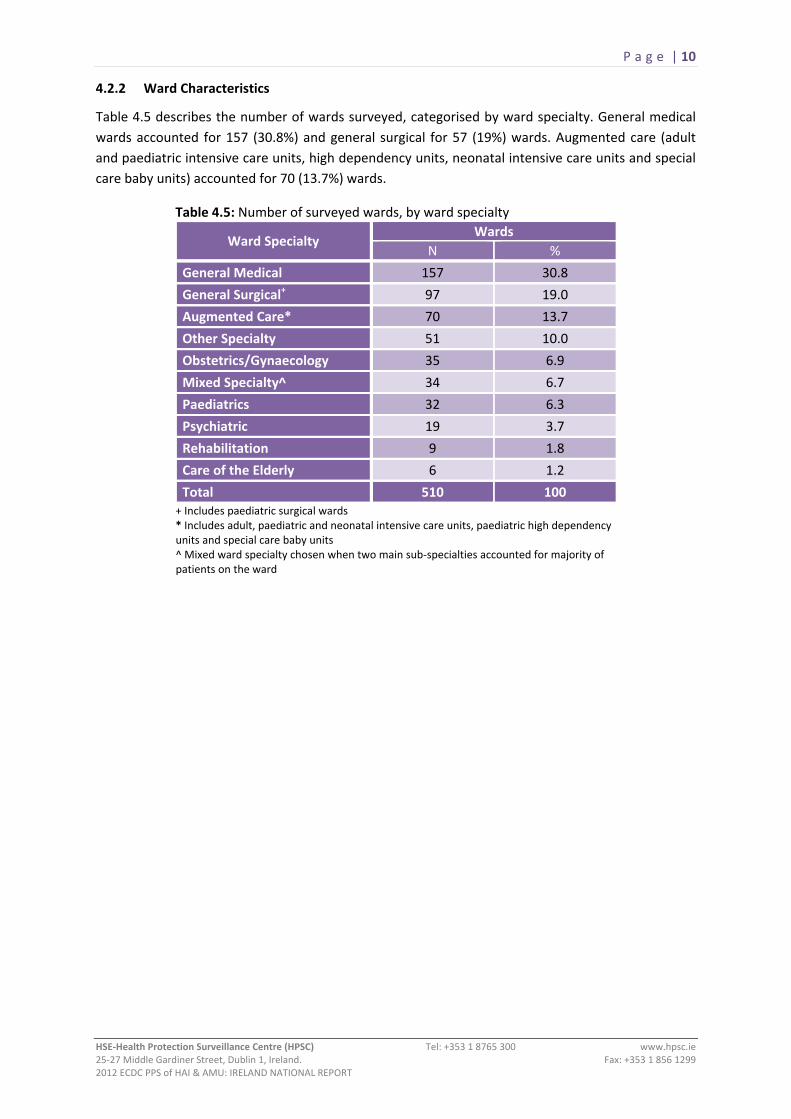
Table 4.5 describes the number of wards surveyed, categorised by ward specialty. General medical wards accounted for 157 (30.8%) and general surgical for 57 (19%) wards. Augmented care (adult and paediatric intensive care units, high dependency units, neonatal intensive care units and special care baby units) accounted for 70 (13.7%) wards.
Table 4.5: Number of surveyed wards, by ward specialty
Ward Specialty Wards
N %
General Medical 157 30.8
General Surgical+ 97 19.0
Augmented Care* 70 13.7
Other Specialty 51 10.0
Obstetrics/Gynaecology 35 6.9
Mixed Specialty^ 34 6.7
Paediatrics 32 6.3
Psychiatric 19 3.7
Rehabilitation 9 1.8
Care of the Elderly 6 1.2
Total 510 100 + Includes paediatric surgical wards * Includes adult, paediatric and neonatal intensive care units, paediatric high dependency units and special care baby units ^ Mixed ward specialty chosen when two main sub‐specialties accounted for majority of patients on the ward
HSE‐Health Protection Surveillance Centre (HPSC) Tel: +353 1 8765 300 www.hpsc.ie 25‐27 Middle Gardiner Street, Dublin 1, Ireland. Fax: +353 1 856 1299 2012 ECDC PPS of HAI & AMU: IRELAND NATIONAL REPORT

P a g e | 11
4.3 Characteristics of the Patient Population 4.3.1 Demographics of Patients Surveyed
Data was gathered on 9,030 eligible patients, 53.7% females, with a median age of 63 years (inter‐quartile range [IQR] 36‐77 years). Patient age and gender distribution is presented as a population pyramid in Figure 4.1. Females accounted for a higher proportion of patients aged between 15 and 44 years and also those aged over 80 years. The median age of males was higher than that of females [65 years (IQR 43‐77) versus 61 years (IQR 33‐78)].
Forty‐eight percent (n=4,330) of the survey population were aged ≥65 years. Twelve percent (n=1,092) were aged <16 years and of those, 73% (n=793) were aged under two years.
Figure 4.1: Population pyramid: Percentage of patients surveyed, by age and gender
HSE‐Health Protection Surveillance Centre (HPSC) Tel: +353 1 8765 300 www.hpsc.ie 25‐27 Middle Gardiner Street, Dublin 1, Ireland. Fax: +353 1 856 1299 2012 ECDC PPS of HAI & AMU: IRELAND NATIONAL REPORT

P a g e | 12
4.3.2 Patient Location by Ward and Admitting Consultant Specialty
Over half of the eligible patient population (n=5,022; 55.6%) were admitted to medical and surgical wards (Table 4.6). Further analysis of the HAI & AMU prevalence, by ward specialty and admitting consultant specialty is outlined in Appendix D.
Table 4.6: Number of patients surveyed, by ward specialty
Ward Specialty Patients
N %
Medical 3,042 33.7
Surgical+ 1,980 21.9
Obstetrics/Gynaecology 1,017 11.3
Other Specialty 819 9.1
Mixed Specialty ^ 587 6.5
Psychiatric 456 5.0
Augmented Care* 419 4.6
Paediatrics 407 4.5
Care of the Elderly 161 1.8
Rehabilitation 142 1.6
Total 9,030 100 + Includes patients on paediatric surgical wards ^ Mixed ward specialty chosen when two main sub‐specialties accounted for majority of patients on the ward. * Includes patients in adult, paediatric and neonatal intensive care units, paediatric high dependency units and special care baby units
Table 4.7 describes the number of patients by admitting consultant specialty. Nearly half of all patients were under the care of a medical consultant (46.0%) and just over one quarter were under the care of a surgical consultant (26.0%).
Table 4.7: Number of patients surveyed, by admitting consultant specialty
Consultant Specialty Patients
N %
Medical 4,157 46.0
Surgical 2,346 26.0
Obstetrics/Gynaecology 887 9.8
Paediatrics 642 7.1
Psychiatric 460 5.1
Care of the Elderly 376 4.2
Intensive Care (Neonatal) 120 1.3
Rehabilitation 17 0.2
Other Specialty 25 0.3
Total 9,030 100
HSE‐Health Protection Surveillance Centre (HPSC) Tel: +353 1 8765 300 www.hpsc.ie 25‐27 Middle Gardiner Street, Dublin 1, Ireland. Fax: +353 1 856 1299 2012 ECDC PPS of HAI & AMU: IRELAND NATIONAL REPORT

P a g e | 13
4.3.3 Patient Risk Factors for HAI
Risk factors for HAI in the eligible patient population are described in Figure 4.2. Of the 9,030 eligible patients, 1,591 (18%; 95% CI 16.8‐18.4) had a history of a surgical procedure since admission to the participating hospital and 4,428 patients (49%) had at least one invasive device in situ. The intensive care unit (ICU) accounted for the highest rate of device utilisation, with 67.8% of ICU patients having at least one invasive device in situ, followed by 61.0% of patients in surgical wards and 59.7% of patients in paediatric wards.
A peripheral vascular catheter (PVC) was documented in 3,679 patients [prevalence 41% (95% CI 39.7‐41.8)]. PVC prevalence was highest in paediatric wards (57.0%) followed by surgical wards (52.1%) and ICU (50.1%). A central vascular catheter (CVC) was documented in 544 patients [prevalence 6% (95% CI 5.6‐6.5)]. CVC prevalence was highest in ICU (33.4%) followed by surgical (6.0%) and medical wards (5.9%).
A urethral catheter was documented in 1,119 patients [prevalence 12% (95% CI 11.7‐13.1)]. The prevalence of urethral catheters was higher in males (14.3%) than females (10.7%) and by location, was highest in ICU (39.6%) followed by surgical (16.5%) and care of the elderly wards (14.3%).
Intubation of the respiratory tract (endotracheal tube or tracheostomy), with or without mechanical ventilation was recorded for 127 patients [prevalence 1% (95% CI 1.1‐1.7)]. Within ICU, 24.1% of patients were intubated versus ≤0.5% of patients admitted to all other ward specialties.
Figure 4.2: Percentage of patients surveyed, by history of surgery since admission and device utilisation
HSE‐Health Protection Surveillance Centre (HPSC) Tel: +353 1 8765 300 www.hpsc.ie 25‐27 Middle Gardiner Street, Dublin 1, Ireland. Fax: +353 1 856 1299 2012 ECDC PPS of HAI & AMU: IRELAND NATIONAL REPORT

P a g e | 14
Eligible patients were categorised using the McCabe Score, a subjective patient score assigned on severity of the underlying medical condition(s) (Table 4.8).9 The majority (73.9%) of patients were deemed to have a ‘non‐fatal prognosis’ (life expectancy greater than five years), 21.7% were deemed to have an ‘ultimately fatal or life‐limiting prognosis’ (life expectancy between one and four years) and 3.4% were deemed to have a ‘rapidly fatal or end‐of‐life prognosis’ (life expectancy less than one year). The disease prognosis was reported ‘not known’ for 91 patients.
Table 4.8: Number of patients surveyed, by McCabe Score
Disease Prognosis Patients
N % Non‐fatal 6,673 73.9
Ultimately fatal 1,955 21.7
Rapidly fatal 311 3.4
Not known 91 1.0
HSE‐Health Protection Surveillance Centre (HPSC) Tel: +353 1 8765 300 www.hpsc.ie 25‐27 Middle Gardiner Street, Dublin 1, Ireland. Fax: +353 1 856 1299 2012 ECDC PPS of HAI & AMU: IRELAND NATIONAL REPORT

P a g e | 15
4.4 Hospital‐Acquired Infections (HAI) The PPS HAI results should be reviewed and interpreted in conjunction with the HAI definitions used in this survey. They are available in the PPS All Ireland Protocol Version 1.3 [Appendix B pages 60 – 85], which may be accessed on the HPSC website:
http://www.hpsc.ie/hpsc/A‐Z/MicrobiologyAntimicrobialResistance/InfectionControlandHAI/Surveillance/PointPrevalenceSurvey/2012/Protocol/
4.4.1 Overall Prevalence of Hospital‐Acquired Infections
Of the 9,030 eligible patients, 467 were classified as having an active HAI, resulting in a HAI prevalence of 5.2% (95% CI 4.7‐5.6). Overall, 501 active HAI were identified, which equates to 1.07 HAI per infected patient. At the time of survey, 32 patients had two active HAI and one patient had three active HAI (Table 4.9).
Table 4.9: Number of HAI per patient Number of HAI reported per
patient Patients
N % 0 8,563 94.8
1 434 4.8
2 32 0.4
3 1 0.0
Total 9,030 100
The breakdown of HAI prevalence, by hospital type and for each of the 50 participating hospitals is provided in Section 4.7.
HSE‐Health Protection Surveillance Centre (HPSC) Tel: +353 1 8765 300 www.hpsc.ie 25‐27 Middle Gardiner Street, Dublin 1, Ireland. Fax: +353 1 856 1299 2012 ECDC PPS of HAI & AMU: IRELAND NATIONAL REPORT

P a g e | 16
4.4.2 HAI Patient Risk Factors
A greater proportion of the 467 patients with active HAI had a history of surgery since admission to
the participating hospital in comparison with the overall cohort of 9,030 eligible patients (35% versus
18%). The prevalence of invasive device utilisation was also greater for all devices across the HAI
patient cohort than the overall eligible patient cohort [peripheral vascular catheter (PVC): 57 versus
41%, central vascular catheter (CVC): 27 versus 6%, urethral catheterisation 31% versus 12% and
respiratory tract intubation 9 versus 1%]
Figure 4.3: Prevalence of HAI risk factors in patients with HAI
HSE‐Health Protection Surveillance Centre (HPSC) Tel: +353 1 8765 300 www.hpsc.ie 25‐27 Middle Gardiner Street, Dublin 1, Ireland. Fax: +353 1 856 1299 2012 ECDC PPS of HAI & AMU: IRELAND NATIONAL REPORT

P a g e | 17
4.4.3 HAI Prevalence by Gender, Age and McCabe Score
The prevalence of HAI by gender, age and McCabe score, with univariate odds ratio (OR) analysis is presented in Table 4.10.
Of the 467 patients with HAI, males accounted for 244 (52.2%). However, the HAI prevalence was significantly higher in males (5.8%) when compared with females (4.6%) [OR=1.29, 95% CI 1.07‐1.55; p=0.008].
The vast majority of patients with HAI (92.9%; n=434) were aged ≥16 years. The remaining 33 patients with HAI (7.1%) were aged 0 to 15 years. The highest prevalence of HAI was recorded for patients aged 50‐64 years (6.2%) and 65‐79 years (6.1%). There was a significant association between patient age and HAI prevalence (p<0.001), with HAI prevalence significantly lower in the <1 month, 2‐15 years and 16‐29 years age groups when compared with the 80+ years age group. There were no significant differences in HAI prevalence between the 1‐23 months, 30‐49 years, 50‐64 years and 65‐79 years age groups when compared with the 80+ age group.
The underlying disease prognosis, as measured by the McCabe score, was also significantly associated with HAI prevalence (p<0.001). The odds ratio increased with the severity of the McCabe score. The highest HAI prevalence was reported for patients with a ‘rapidly fatal’ McCabe score (10.9%; 95% CI 7.9‐14.9).
Table 4.10: HAI prevalence, by gender, age and McCabe score
Risk Factor
Category
Num
ber of
Patie
nts
Num
ber of
Patie
nts
with
HAI
HAI
Prevalen
ce
(%)
95% CI Odd
s Ra
tio Odds Ratio 95% CI
P‐value
Lower Upper Lower Upper
Gender Male 4,180 244 5.8 5.2 6.6 1.29 1.07 1.55 0.008
Female* 4,850 223 4.6 4.0 5.2 1 ‐ ‐
Age Group <1 month 526 16 3.0 1.9 4.9 0.51 0.30 0.87
<0.001
1‐23 months 267 9 3.4 1.8 6.3 0.57 0.28 1.13
2‐15 years 299 8 2.7 1.4 5.2 0.45 0.22 0.92
16‐29 years 636 14 2.2 1.3 3.7 0.37 0.21 0.64
30‐49 years 1,411 65 4.6 3.6 5.8 0.78 0.57 1.07
50‐64 years 1,561 97 6.2 5.1 7.5 1.08 0.81 1.43
65‐79 years 2,453 149 6.1 5.2 7.1 1.05 0.81 1.35
80+ years* 1,877 109 5.8 4.8 7.0 1 ‐ ‐
McCabe Score
Non‐fatal* 6,673 270 4.0 3.6 4.5 1 ‐ ‐
<0.001Ultimately fatal 1,955 157 8.0 6.9 9.3 2.07 1.69 2.54
Rapidly fatal 311 34 10.9 7.9 14.9 2.91 2.00 4.24
Not known 91 6 6.6 3.1 13.6 1.67 0.73 3.87
* Reference group for odds ratio calculation
HSE‐Health Protection Surveillance Centre (HPSC) Tel: +353 1 8765 300 www.hpsc.ie 25‐27 Middle Gardiner Street, Dublin 1, Ireland. Fax: +353 1 856 1299 2012 ECDC PPS of HAI & AMU: IRELAND NATIONAL REPORT

P a g e | 18
4.4.4 HAI Prevalence by Ward Specialty and Admitting Consultant Specialty
The prevalence of HAI by ward specialty is shown in Table 4.11. HAI prevalence was highest in augmented care units [adult and paediatric ICUs, high dependency units, neonatal ICUs and special care baby units] (16.5%) followed by mixed specialty wards (7.3%) and surgical wards (6.7%). Psychiatric wards (1.5%) and obstetrics and gynaecology wards (1.1%) had the lowest HAI prevalence.
Table 4.11: HAI prevalence, by ward specialty
Ward Specialty Total Number of Patients
Number of patients with
HAI
HAI Prevalence (%)
95% Confidence Interval
Augmented Care* 419 69 16.5 13.2 ‐ 20.3 Mixed Specialty^ 587 43 7.3 5.5 ‐ 9.7 Surgical+ 1,981 133 6.7 5.7 ‐ 7.9 Rehabilitation 142 8 5.6 2.9 ‐ 10.7 Medical 3,042 146 4.8 4.1 ‐ 5.6 Care of the Elderly 161 7 4.3 2.1 ‐ 8.7 Other Specialty 819 33 4.0 2.9 ‐ 5.6 Paediatrics 406 10 2.5 1.3 ‐ 4.5 Psychiatric 465 7 1.5 0.7 ‐ 3.1 Obstetrics/Gynaecology 1,017 11 1.1 0.6 ‐ 1.9 Total 9,030 467 5.2 4.7 ‐ 5.6 * Includes patients in adult, paediatric and neonatal intensive care units, paediatric high dependency units and special care baby units ^ Mixed ward specialty chosen when two main sub‐specialties accounted for majority of patients on the ward. + Includes patients on paediatric surgical wards The prevalence of HAI by admitting consultant specialty is shown in Table 4.12. The highest HAI prevalence (24%) was recorded for the category ‘other specialty’ which included 25 patients, 18 of whom were specifically recorded as being admitted under the care of a consultant in intensive care medicine, one was admitted under a consultant in paediatric intensive care medicine and the remaining six patients were admitted under the category of ‘other consultants – not specified’. All six HAI recorded in this category occurred in the patients admitted under a consultant in intensive care medicine. In Ireland, the majority of paediatric and adult patients admitted to augmented care units tend not to be admitted under the care of a named consultant in intensive care medicine. Rather, such patients tend to be admitted under the care of a medical or surgical consultant.
The HAI prevalence for patients admitted under the care of a neonatologist was 10%. The HAI prevalence for 2,346 patients admitted under a surgical consultant was 8.1% (95% CI 7.1‐9.3) and for 4,157 patients admitted under a medical consultant, the HAI prevalence was 5.1% (95% CI 4.5‐5.8).
HSE‐Health Protection Surveillance Centre (HPSC) Tel: +353 1 8765 300 www.hpsc.ie 25‐27 Middle Gardiner Street, Dublin 1, Ireland. Fax: +353 1 856 1299 2012 ECDC PPS of HAI & AMU: IRELAND NATIONAL REPORT

P a g e | 19
Table 4.12: HAI prevalence, by admitting consultant specialty
Consultant Specialty Total Number of Patients
Number of Patients with
HAI
HAI Prevalence (%)
95% Confidence Interval
Other Specialty 25 6 24.0 11.5 ‐ 43.4
Intensive Care (Neonatal) 120 12 10.0 5.8 ‐ 16.7
Surgical 2,346 190 8.1 7.1 ‐ 9.3
Rehabilitation 17 1 5.9 1.0 ‐ 27.0
Medical 4,157 212 5.1 4.5 ‐ 5.8
Care of the Elderly 376 14 3.7 2.2 ‐ 6.2
Obstetrics/Gynaecology 887 16 1.8 1.1 ‐ 2.9
Psychiatric 460 7 1.5 0.7 ‐ 3.1
Paediatrics 642 9 1.4 0.7 ‐ 2.6
Total 9030 467 5.2 4.7 ‐ 5.6 4.4.5 HAI Prevalence by Surgery and Length‐of‐Admission Prior to HAI Onset
Of the 9,030 eligible patients, 1,591 (18%) were documented as having a history of surgery since admission to the participating hospital. During the PPS, surgical procedures could be classified into two categories:
1. National Healthcare Safety Network (NHSN) Operative Procedures: Classified by the US Centers for Disease Control & Prevention (CDC).10 A NHSN procedure takes place during a single trip to the operating room, where a surgeon makes at least one incision through the skin or mucous membrane, including laparoscopic approach, and closes the incision before the patient leaves the operating room.
2. Non‐NHSN Operative Procedures: Operative procedures which do not meet the definition of an NHSN procedure. For example, transurethral resection of the prostate, operation where wound healing is by secondary intention, external ventricular drain or hysteroscopic removal of fibroids.
The prevalence of all HAI for patients who had undergone a NHSN operative procedure was higher than that of patients who had undergone a non‐NHSN operative procedure (11.5 versus 5.9%) (Table 4.13).
Table 4.13: HAI prevalence, by history of surgery since admission
Risk Factor
Category
Num
ber of
Patie
nts
Num
ber of
Patie
nts
with
HAI
HAI
Prevalen
ce
(%)
95% CI
Odd
s Ra
tio Odds Ratio
95% CI
P‐value
Lower Upper Lower Upper
Surgery since admission
No Surgery* 7,439 302 4.1 3.6 4.5 1 ‐ ‐
<0.001 NHSN surgery 1,268 146 11.5 9.9 13.4 3.08 2.50 3.78
Non‐NHSN surgery 323 19 5.9 3.8 9.0 1.48 0.92 2.38 * Reference group for odds ratio calculation
HSE‐Health Protection Surveillance Centre (HPSC) Tel: +353 1 8765 300 www.hpsc.ie 25‐27 Middle Gardiner Street, Dublin 1, Ireland. Fax: +353 1 856 1299 2012 ECDC PPS of HAI & AMU: IRELAND NATIONAL REPORT

P a g e | 20
The length‐of‐admission was also significantly associated with HAI prevalence (p<0.001). Patients who were admitted for four to seven days by the time of survey or HAI onset date had a lower HAI prevalence than patients who were admitted for 15 to 21 days by the time of survey or HAI onset date (5.1% versus 11.4%). Beyond 22 days of admission, the HAI prevalence declined to 7.3% (Table 4.14).
Table 4.14: HAI prevalence, by length‐of‐admission prior to date of survey or HAI onset
Risk Factor
Category
Num
ber of
Patie
nts
Num
ber of
Patie
nts with
HAI
HAI
Prevalen
ce
(%)
95% CI
Odd
s Ra
tio Odds Ratio
95% CI
P‐value
Lower Upper Lower Upper
Length of admission (prior to PPS/HAI onset)
1‐3 days* 2,993 47 1.6 1.2 2.1 1 ‐ ‐
<0.001
4‐7 days 2,075 105 5.1 4.2 6.1 3.34 2.36 4.74
8‐14 days 1,511 113 7.5 6.3 8.9 5.07 3.58 7.16
15‐21 days 590 67 11.4 9.0 14.2 8.03 5.47 11.79
22+ days 1,861 135 7.3 6.2 8.5 4.9 3.50 6.87
* Reference group for odds ratio calculation
HSE‐Health Protection Surveillance Centre (HPSC) Tel: +353 1 8765 300 www.hpsc.ie 25‐27 Middle Gardiner Street, Dublin 1, Ireland. Fax: +353 1 856 1299 2012 ECDC PPS of HAI & AMU: IRELAND NATIONAL REPORT

P a g e | 21
4.4.6 Onset and Origin of HAI
Table 4.15 and Figure 4.4 describe the patient’s location when the signs or symptoms of the HAI began (onset). Table 4.15 and Figure 4.5 describe where the patient acquired the HAI (origin).
Of the 501 active HAI, 119 (24%) were already evident upon admission of the patient to the current hospital (i.e. HAI onset prior to current hospital admission). Of the 119 HAI with onset prior to admission to the current hospital, 53 (45%) had origin in the current hospital (i.e. HAI related to a prior admission to the current hospital, which developed subsequent to discharge from the current hospital) and 66 (55%) had origin in another facility [57 acute hospital, 9 non‐acute hospital], (i.e., HAI related to a prior admission to another hospital, which developed either in or subsequent to discharge from that hospital). Of the 501 active HAI, 68 (14%) were attributable to a hospital other than the participating hospital
Table 4.15: Number and percentage of HAI, by onset and origin
Origin of HAI HAI Present at Admission Total
N (%) Yes (%) No (%) Current hospital 53 (12) 380 (88) 433 (86) Other acute hospital 57 (97) 2 (3) 59 (12) Other non‐acute hospital 9 (100) 0 (0) 9 (2) Total 119 (24) 382 (76) 501
Figure 4.4: Percentage of HAI, by HAI onset
Figure 4.5: Percentage of HAI, by HAI origin
HSE‐Health Protection Surveillance Centre (HPSC) Tel: +353 1 8765 300 www.hpsc.ie 25‐27 Middle Gardiner Street, Dublin 1, Ireland. Fax: +353 1 856 1299 2012 ECDC PPS of HAI & AMU: IRELAND NATIONAL REPORT

P a g e | 22
4.4.7 Distribution of HAI by Type
Table 4.16 and Figure 4.6 present the distribution of the 501 active HAI encountered during the PPS. The most common infections were surgical site infections and pneumonia.
Table 4.16: Number, percentage and prevalence of HAI, by HAI type
Rank Order
HAI Infection Site HAI
N % Prevalence (%)
1 Surgical site infections 91 18.2 1.0
2 Pneumonia 86 17.2 1.0
3 Urinary tract infections 75 15.0 0.8
4 Bloodstream infections 66 13.2 0.7
5 Gastrointestinal system infections 49 9.8 0.5
6 Systemic infections 38 7.6 0.4 7 Eye, ear, nose, throat or mouth infections 23 4.6 0.3
8 Bone and joint infections 19 3.8 0.2
9 Skin and soft tissue infections 16 3.1 0.2
10 Neonatal specific infections 14 2.8 2.7*
11 Reproductive tract infections 7 1.4 0.1
12 Lower respiratory tract infections 7 1.4 0.1
13 Catheter‐related infections 5 1.0 0.1
14 Central nervous system infections 3 0.6 <0.1
15 Cardiovascular system infections 2 0.4 <0.1 Total 501 100
*Prevalence of neonatal specific infections in the 526 surveyed patients who were ≤4 weeks old.
Figure 4.6: Percentage of HAI, by HAI type
HSE‐Health Protection Surveillance Centre (HPSC) Tel: +353 1 8765 300 www.hpsc.ie 25‐27 Middle Gardiner Street, Dublin 1, Ireland. Fax: +353 1 856 1299 2012 ECDC PPS of HAI & AMU: IRELAND NATIONAL REPORT

P a g e | 23
Surgical Site Infection (SSI)
The most frequent HAI reported was surgical site infection (SSI), with 91 (18%) cases. Of the SSI, 44% were classified as superficial incisional and 56% were classified as either deep incisional or organ/space SSI (Figure 4.7).
Figure 4.7: Percentage of SSI, by type
Superficial: Superficial incisional; Deep: Deep incisional;
Organ/Space: Organ or space
Pneumonia (PN)
Pneumonia (PN) was the second most common HAI, with 86 (17%) cases reported. Whilst patients with pneumonia were required to meet strict radiological and clinical criteria, in accordance with the case definition, 79% of hospital‐acquired pneumonia cases were not microbiologically confirmed. Of the 86 pneumonia cases, 17 (20%) were associated with intubation of the respiratory tract. Figure 4.8 illustrates the classification of PN types. Table 4.17 demonstrates the percentage of PN cases associated with intubation.
Figure 4.8: Percentage of pneumonia, by type
PN1: Protected sample + quantitative culture; PN2: Non‐protected sample + quantitative sample; PN3: Alternative microbiological criteria; PN4: Sputum bacteriology or non‐
quantitative ETA; PN5: No microbiology
HSE‐Health Protection Surveillance Centre (HPSC) Tel: +353 1 8765 300 www.hpsc.ie 25‐27 Middle Gardiner Street, Dublin 1, Ireland. Fax: +353 1 856 1299 2012 ECDC PPS of HAI & AMU: IRELAND NATIONAL REPORT

P a g e | 24
Urinary Tract Infection (UTI)
Urinary tract infection (UTI) was the third most common HAI, with 75 cases (15%) reported. Just over half of the UTI (55%) were microbiologically confirmed. Of the 75 UTI cases, 31 (41%) were associated with the presence of a urinary catheter. Figure 4.9 illustrates the distribution of UTI, where UTI‐A is microbiologically confirmed and UTI‐B is not microbiologically confirmed. Table 4.17 demonstrates the percentage of UTI cases associated with presence of a urinary catheter.
Figure 4.9: Percentage of UTI, by type
UTI‐A: Microbiologically confirmed; UTI‐B: Not microbiologically confirmed
Bloodstream Infection (BSI)
The fourth most commonly encountered HAI was bloodstream infection (BSI), of which there were 66 cases (13%). BSI may be classified as primary BSI (which may be due to an infected vascular catheter/line or of unknown origin, where no source is identifiable) or secondary BSI, which may be further classified based on the underlying infection site. Of the 66 BSI, 44 (67%) were classified as primary BSI, 21 (32%) as BSI arising secondary to infection elsewhere in the body and for one BSI (1%), there was no additional information available to enable determination of the underlying source.
Figure 4.10 illustrates the breakdown of primary BSI and Table 4.17 demonstrates the percentage of primary BSI cases associated with presence of an indwelling vascular catheter. Of the 44 primary BSI, 36 (82%) occurred in the presence of an indwelling vascular catheter, with the vascular catheter implicated as the source of the primary BSI in 28 (64%) cases. Of the 28 vascular catheter related BSI, 25 were due to central line infection (57% of primary BSI) and three were due to peripheral line infection (7% of primary BSI). For the remaining 16 primary BSI (36%), an underlying source was not identified upon review of the patient’s healthcare record and relevant microbiology results. Eight of those patients had documentation of an indwelling vascular catheter, but there was no clinical or microbiological evidence linking the vascular catheter to the patient’s bloodstream infection.
HSE‐Health Protection Surveillance Centre (HPSC) Tel: +353 1 8765 300 www.hpsc.ie 25‐27 Middle Gardiner Street, Dublin 1, Ireland. Fax: +353 1 856 1299 2012 ECDC PPS of HAI & AMU: IRELAND NATIONAL REPORT

P a g e | 25
Figure 4.11 illustrates the breakdown of secondary BSI. Of the 21 secondary BSI, equal proportions arose as a consequence of either digestive tract infection or urinary tract infection [6 cases (29%) for each] and three secondary BSI cases (14%) were detected as a consequence of surgical site infection.
Figure 4.10: Percentage of primary BSI, by origin Figure 4.11: Percentage of secondary BSI, by origin
Central line: Central vascular catheter infection; Peripheral line: Peripheral vascular catheter infection;
UO: Primary BSI of unknown origin
Secondary to: DIG: Digestive tract infection; UTI: Urinary tract infection; SSI: Surgical site infection; SST: Skin/soft tissue infection;
OTH: Other infection; UNK: Unknown source
Table 4.17: Number and percentage of device‐associated HAI
HAI Type HAI
N % Pneumonia: Respiratory tract intubation present 17 20 Respiratory tract intubation absent 69 80 Total 86 100 Urinary tract infection: Urinary catheterisation present 31 41 Urinary catheterisation absent 44 59 Total 75 100 Primary blood stream infection: Vascular catheter present* 36 82 Vascular catheter absent 8 18 Total 44 100 *A vascular catheter was documented as the underlying source for 28 of the primary BSI. For the remaining 8 primary BSI, where a vascular catheter was present, the vascular catheter was not the underlying source of infection.
HSE‐Health Protection Surveillance Centre (HPSC) Tel: +353 1 8765 300 www.hpsc.ie 25‐27 Middle Gardiner Street, Dublin 1, Ireland. Fax: +353 1 856 1299 2012 ECDC PPS of HAI & AMU: IRELAND NATIONAL REPORT

P a g e | 26
Gastrointestinal Infections
Gastrointestinal (GI) infections were the fifth most common HAI, with 49 cases (10%) reported. Of those, Clostridium difficile infections (CDI) accounted for the majority, with 29 cases (59%) reported. Therefore, CDI accounted for 5.7% of all HAI in the PPS. There was one case of hospital‐acquired gastroenteritis, which was microbiologically confirmed to be due to rotavirus. There were no microbiologically‐confirmed cases of norovirus infection reported. During the PPS, the national level of norovirus activity was reported to be at low‐to‐medium levels. PPS data collection teams were advised to exclude wards from data collection in the event of an ongoing outbreak of norovirus infection. Of note, one hospital reported a norovirus outbreak during the PPS. Within that hospital, one ward was excluded from PPS data collection. Figure 4.12 illustrates the breakdown of GI infections.
Figure 4.12: Percentage of gastrointestinal infections, by type
CDI: Clostridium difficile infection; GE: Gastroenteritis; GIT: Gastrointestinal tract;
IAB: Intraabdominal
HSE‐Health Protection Surveillance Centre (HPSC) Tel: +353 1 8765 300 www.hpsc.ie 25‐27 Middle Gardiner Street, Dublin 1, Ireland. Fax: +353 1 856 1299 2012 ECDC PPS of HAI & AMU: IRELAND NATIONAL REPORT

P a g e | 27
4.5 Microbiology and Key Antimicrobial Resistance Markers The PPS microbiology and antimicrobial resistance results should be reviewed and interpreted in conjunction with the definitions used in this survey. They are available in the PPS All Ireland Protocol Version 1.3 [Appendix A – Tables 8 & 9 (pages 55 – 59)], which may be accessed on the HPSC website:
http://www.hpsc.ie/hpsc/A‐Z/MicrobiologyAntimicrobialResistance/InfectionControlandHAI/Surveillance/PointPrevalenceSurvey/2012/Protocol/
4.5.1 Microbiology and Antimicrobial Resistance Data
Of the 501 active HAI identified, positive microbiology results were available for 261 (52%) with a total of 310 microorganisms identified from relevant specimens sent to the microbiology laboratory. Figure 4.13 illustrates the microorganism distribution and Figure 4.15 illustrates microorganism breakdown by key antimicrobial resistance markers.
Figure 4.13: HAI microorganism distribution
HSE‐Health Protection Surveillance Centre (HPSC) Tel: +353 1 8765 300 www.hpsc.ie 25‐27 Middle Gardiner Street, Dublin 1, Ireland. Fax: +353 1 856 1299 2012 ECDC PPS of HAI & AMU: IRELAND NATIONAL REPORT

P a g e | 28
Of the 310 microorganisms, Enterobacteriaceae were the most frequently detected (n=109; 35%). Enterobacteriaceae is the term used to describe groups of Gram‐negative bacilli, which are associated with the gastrointestinal tract of humans and animals and related bacteria that occur in the environment. Of the Enterobacteriaceae, Escherichia coli (n=61; 56%), Klebsiella pneumoniae (n=15; 14%) and Proteus mirabilis (n=8; 7%) were most commonly isolated (Figure 4.14). The majority of Enterobacteriaceae (60%) retained susceptibility to third generation cephalosporins (3GC) and carbapenems (Figure 4.15). However, 3GC resistance was reported in 27 (25%) and carbapenem resistance in two (2%) Enterobacteriaceae isolated from clinical specimens. There were 26 patients with HAI caused by resistant Enterobacteriaceae.
Figure 4.14: Percentage of Enterobacteriaceae isolates, by species (N=109)
Staphylococcus aureus was the second most frequent pathogen detected (n=46; 15%). The majority of S. aureus causing HAI (59%) retained susceptibility to flucloxacillin (MSSA). However, over one third (37%) of S. aureus causing HAI were reported as flucloxacillin resistant (MRSA). There were 17 patients with HAI caused by MRSA.
The third most frequent pathogen reported in the survey were enterococci (n=34; 11%). Of the enterococci, just over one‐in‐four (26%) were reported as resistant to glycopeptides (vancomycin resistant enterococci/VRE). There were nine patients with HAI caused by VRE.
Of the 310 microorganisms, Clostridium difficile accounted for 29 (9%).
HSE‐Health Protection Surveillance Centre (HPSC) Tel: +353 1 8765 300 www.hpsc.ie 25‐27 Middle Gardiner Street, Dublin 1, Ireland. Fax: +353 1 856 1299 2012 ECDC PPS of HAI & AMU: IRELAND NATIONAL REPORT

P a g e | 29
Figure 4.15: Microorganism breakdown, by key antimicrobial resistance markers
3GC‐S: Third generation cephalosporin sensitive; 3GC‐R: Third generation cephalosporin resistant;
Car‐S: Carbapenem sensitive; Car‐R: Carbapenem resistant
MSSA: Flucloxacillin sensitive; MRSA: Flucloxacillin resistant
VSE: Vancomycin teicoplanin glycopeptide sensitive; VRE: Vancomycin teicoplanin glycopeptide resistant
Car‐S: Carbapenem sensitive; Car‐R: Carbapenem resistant
4.5.2 Causative Pathogens of the Most Common HAI Types
Surgical site infections: Of the 91 SSI, positive microbiology results were reported for 55 (60%). S. aureus was the most common pathogen isolated (20; 26%) followed by Enterococcus spp. (13; 17%) and E. coli (7; 9%).
Pneumonia: Of the 86 PN cases, positive microbiology results were reported for 17 (20%), with E. coli (5; 22%) and Pseudomonas aeruginosa (3; 13%) the most common pathogens isolated.
Urinary tract infections: Of the 75 UTIs, positive microbiology results were reported for 48 (64%), with E. coli (26; 54%), Klebsiella spp. (5; 10%) and Proteus mirabilis (5; 10%) the most common pathogens isolated.
Bloodstream infections: Of the 66 BSI, the causative pathogen was reported for 63 (95%). S. aureus (13; 19%), E. coli (11; 16%) and coagulase negative staphylococci (9; 13%) were the most common pathogens isolated.
Clostridium difficile infection: All 29 cases of Clostridium difficile infection were microbiologically confirmed. HSE‐Health Protection Surveillance Centre (HPSC) Tel: +353 1 8765 300 www.hpsc.ie 25‐27 Middle Gardiner Street, Dublin 1, Ireland. Fax: +353 1 856 1299 2012 ECDC PPS of HAI & AMU: IRELAND NATIONAL REPORT

P a g e | 30
4.6 Antimicrobial Use
The PPS antimicrobial use results should also be reviewed and interpreted in conjunction with the methodology and definitions used in this survey. They are available in the PPS All Ireland Protocol Version 1.3 [Section 4.6.4 (pages 32 – 36) and Appendix A: Tables 4 & 5 (pages 50 – 52)], which may be accessed on the HPSC website:
http://www.hpsc.ie/hpsc/A‐Z/MicrobiologyAntimicrobialResistance/InfectionControlandHAI/Surveillance/PointPrevalenceSurvey/2012/Protocol/
4.6.1 Overall Prevalence of Antimicrobial Use
Of the 9,030 eligible patients, 3,108 were classified as receiving systemic antimicrobials, resulting in an antimicrobial use (AMU) prevalence of 34% (95% CI 33.4%‐35.4%). Overall, 4,532 antimicrobials were prescribed (antibacterials = 4,369, antifungals = 163), equating to 1.5 antimicrobials per patient. At the time of survey, 894 patients were prescribed two antimicrobials and 223 patients were prescribed three or more antimicrobials (Table 4.18).
Table 4.18: Number of antimicrobials prescribed per patient
Number of antimicrobials prescribed per patient
Patients
N % 0 5,922 65.6
1 1,991 22.0
2 894 9.9
3 158 1.8
4 46 0.5
5 19 0.2
Total 9,030 100
The breakdown of antimicrobial use prevalence, by hospital type and for each of the 50 participating hospitals is provided in Section 4.7.
HSE‐Health Protection Surveillance Centre (HPSC) Tel: +353 1 8765 300 www.hpsc.ie 25‐27 Middle Gardiner Street, Dublin 1, Ireland. Fax: +353 1 856 1299 2012 ECDC PPS of HAI & AMU: IRELAND NATIONAL REPORT

P a g e | 31
4.6.2 Antimicrobial Use Patient Risk Factors
Figure 4.16 illustrates the prevalence of risk factors in patients prescribed antimicrobials. A greater proportion of the 3,108 patients receiving antimicrobials had a history of surgery since admission to the participating hospital, in comparison with the overall cohort of 9,030 eligible patients (24% versus 18%). The patients with a history of surgery since admission were prescribed 1,098 antimicrobials, of which; 563 (51%) were for treatment of infection, 451 (41%) for surgical antimicrobial prophylaxis and 84 (8%) for other indications. The prevalence of invasive device utilisation was also greater for all devices across the antimicrobial use patient cohort than the overall eligible patient cohort [peripheral vascular catheter (PVC); 67 versus 41%, central vascular catheter (CVC); 12 versus 6%, urethral catheterisation; 20% versus 12% and respiratory tract intubation; 3 versus 1%]. It should be noted that as 63% of antimicrobials were administered via the parenteral route, the presence of an intravascular catheter may also have been for administration of antimicrobials rather than solely as a risk factor for the patient being prescribed antimicrobials.
Figure 4.16: Prevalence of risk factors in patients on antimicrobials
HSE‐Health Protection Surveillance Centre (HPSC) Tel: +353 1 8765 300 www.hpsc.ie 25‐27 Middle Gardiner Street, Dublin 1, Ireland. Fax: +353 1 856 1299 2012 ECDC PPS of HAI & AMU: IRELAND NATIONAL REPORT

P a g e | 32
4.6.3 Antimicrobial Use Prevalence, by Gender, Age and McCabe Score
The prevalence of antimicrobial use by gender, age and McCabe Score, with univariate odds ratio (OR) analysis is presented in Table 4.19.
Of the 3,108 patients receiving antimicrobials, females accounted for 1,605 (52%). However, the antimicrobial use prevalence was significantly higher in males (36.0%) when compared with females (33.1%; p= 0.004).
The vast majority of patients receiving antimicrobials (91%; n=2,838) were aged ≥16 years. The remaining 270 patients (9%) were aged 0 to 15 years. Overall, the highest prevalence of antimicrobial use was recorded for patients aged between two and 15 years (41.8%). In the adult population, the antimicrobial use prevalence was highest in the group aged 65 to 79 years (38.9%).
The underlying disease prognosis, as measured by the McCabe score, was also significantly associated with antimicrobial use prevalence (p<0.001). The odds ratio increased with the severity of the McCabe score. The highest antimicrobial use prevalence was reported for patients with a ‘rapidly fatal’ McCabe score (49.5%; 95% CI 44.0‐55.0).
Table 4.19: Antimicrobial use prevalence, by gender, age and McCabe score
Risk Factor
Category
Num
ber of
Patie
nts
Num
ber of
Patie
nts
with
AMU
AMU
Prevalen
ce
(%)
95% CI
Odd
s Ra
tio Odds Ratio
95% CI
P‐value
Lower Upper Lower Upper
Gender Male 4,180 1,503 36.0 34.5 37.4 1.14 1.04 1.24 0.004
Female* 4,850 1,605 33.1 31.8 34.4 ‐ ‐ ‐
Age Group <1 month 526 62 11.8 9.3 14.8 0.24 0.18 0.32
<0.001
1‐23 months 267 83 31.1 25.8 36.9 0.82 0.62 1.08
2‐15 years 299 125 41.8 36.4 47.5 1.30 1.01 1.67
16‐29 years 636 204 32.1 28.6 35.8 0.85 0.71 1.03
30‐49 years 1,411 430 30.5 28.1 32.9 0.79 0.68 0.92
50‐64 years 1,561 583 37.3 35.0 39.8 1.08 0.94 1.24
65‐79 years 2,453 953 38.9 36.9 40.8 1.15 1.02 1.30
80+ years* 1,877 668 35.6 33.5 37.8 ‐ ‐ ‐
McCabe Score
Non‐fatal* 6,673 2,087 31.3 30.2 32.4 ‐ ‐ ‐
<0.001Ultimately fatal 1,955 842 43.1 40.9 45.3 1.66 1.50 1.84
Rapidly fatal 311 154 49.5 44.0 55.0 2.16 1.72 2.71
Not known 91 25 27.5 19.4 37.4 0.83 0.52 1.32
* Reference group for odds ratio calculation
HSE‐Health Protection Surveillance Centre (HPSC) Tel: +353 1 8765 300 www.hpsc.ie 25‐27 Middle Gardiner Street, Dublin 1, Ireland. Fax: +353 1 856 1299 2012 ECDC PPS of HAI & AMU: IRELAND NATIONAL REPORT

P a g e | 33
4.6.4 Antimicrobial Use Prevalence, by Ward Specialty and Admitting Consultant Specialty
The prevalence of antimicrobial use by ward specialty is shown in Table 4.20. Antimicrobial use prevalence was highest in augmented care units [adult and paediatric ICUs, high dependency units, neonatal ICUs and special care baby units] (50.4%), followed by mixed specialty (46.2%) and surgical wards (40.5%). The lowest antimicrobial use prevalence was recorded in psychiatric wards (5.5%).
The prevalence of antimicrobial use by admitting consultant specialty is shown in Table 4.21. The highest antimicrobial use prevalence, at 44.5% (95% CI 42.5‐46.5), was recorded for the 2,346 patients admitted under the care of a surgical consultant, followed by 38.2% (95% CI 36.7‐39.6) antimicrobial use prevalence for the 4,157 patients admitted under the care of a medical consultant.
Table 4.20: Antimicrobial use prevalence, by ward specialty
Ward Specialty Number of Patients
Number of Patients Receiving Antimicrobials
Prevalence (%) 95% Confidence
Interval
Augmented Care* 419 211 50.4 45.6 ‐ 55.1
Mixed Specialty^ 587 271 46.2 42.2 – 50.2
Surgical+ 1,981 802 40.5 38.4 ‐ 42.7
Other Specialty 819 330 40.3 37.0 – 43.7
Paediatrics 406 153 37.7 33.1 ‐ 42.5
Medical 3,042 1,110 36.5 34.8 ‐ 38.2
Care of the Elderly 161 31 19.3 13.9 ‐ 26.0
Obstetrics/Gynaecology 1,017 159 15.6 13.5 ‐ 18.0
Rehabilitation 142 16 11.3 7.1 – 17.5
Psychiatric 456 25 5.5 3.7 – 8.0
Total 9,030 3,108 34.0 33.4 ‐ 35.4 * Includes patients in adult, paediatric and neonatal intensive care units, paediatric high dependency units and special care baby units ^ Mixed ward specialty chosen when two main sub‐specialties accounted for majority of patients on the ward + Includes patients on paediatric surgical wards Table 4.21: Antimicrobial use prevalence, by admitting consultant specialty
Consultant Specialty Number
of Patients
Number of Patients Receiving Antimicrobials
Prevalence (%)
95% Confidence Interval
Surgical 2,346 1,043 44.5 42.5 ‐ 46.5
Medical 4,157 1,586 38.2 36.7 ‐ 39.6
Care of the Elderly 376 86 22.9 18.9 ‐ 27.4
Obstetrics/Gynaecology 887 196 22.1 19.5 ‐ 24.9
Intensive Care (Neonatal) 120 25 20.8 14.5 ‐ 28.9
Paediatrics 642 129 20.1 17.2 ‐ 23.4
Rehabilitation 17 1 5.9 1.0 ‐ 27.0
Psychiatric 460 25 5.4 3.7 ‐ 7.9
Other 25 17 68.0 48.4 ‐ 82.8
Total 9,030 3,108 34.0 33.4 ‐ 35.4
HSE‐Health Protection Surveillance Centre (HPSC) Tel: +353 1 8765 300 www.hpsc.ie 25‐27 Middle Gardiner Street, Dublin 1, Ireland. Fax: +353 1 856 1299 2012 ECDC PPS of HAI & AMU: IRELAND NATIONAL REPORT

P a g e | 34
4.6.5 Route of Administration of Antimicrobial
The route of administration of the 4,532 prescribed antimicrobials is described in Table 4.22. The majority (n=2,855; 63%) were administered via the parenteral (i.e., intravenous) route.
Table 4.22: Number and percentage of antimicrobials, by route of administration
25‐27 Middle Gardiner Street, Dublin 1, Ireland. Fax: +353 1 856 1299 2012 ECDC PPS of HAI & AMU: IRELAND NATIONAL REPORT
Route of Administration
Antimicrobials Prescribed
N %
Parenteral 2,855 63.0
Enteral 1,657 36.6
Inhalation 20 0.4
Total 4,532 100
4.6.6 Documentation of Indication and Compliance with Local Policy
For 3,767 of 4,532 antimicrobial prescriptions (83%), the indication was documented in the patient’s healthcare record and/or medication chart (Figure 4.17).
Of the 4,532 prescriptions, the choice of prescribed agent was deemed assessable against a local prescribing policy for 3,258 (72%).
The circumstances in which a prescription may be deemed non‐assessable include:
There is no local prescribing policy available for that indication
The patient has a documented antimicrobial allergy which prevents them being prescribed the recommended agent
The indication for prescription is for medical prophylaxis or use of erythromycin as a pro‐kinetic agent
The antimicrobial has been advised on advice from a clinical microbiologist or infectious diseases (ID) physician
The reason for the prescription cannot be determined from review of the patient’s notes and discussion with staff caring for the patient or the information is missing from the ward
HSE‐Health Protection Surveillance Centre (HPSC) Tel: +353 1 8765 300 www.hpsc.ie

P a g e | 35
Of the 3,258 assessable prescriptions, 877 (27%) were deemed to be non‐compliant with the local prescribing policy. Figure 4.18 demonstrates the breakdown of the 3,258 assessable prescriptions.
Figure 4.17: Documented indication for the prescribed antimicrobial
Figure 4.18: Percentage of assessable prescriptions,compliant with local prescribing policy (n=3,258)
HSE‐Health Protection Surveillance Centre (HPSC) Tel: +353 1 8765 300 www.hpsc.ie 25‐27 Middle Gardiner Street, Dublin 1, Ireland. Fax: +353 1 856 1299 2012 ECDC PPS of HAI & AMU: IRELAND NATIONAL REPORT

P a g e | 36
4.6.7 Description of Prescribed Antibacterials
The 20 most commonly prescribed agents collectively accounted for over 90% of all antimicrobials prescribed (3,982). The most commonly prescribed antibacterial class was the β lactam/β lactamase inhibitor combination agents (co‐amoxiclav and piperacillin‐tazobactam) which together accounted for 1,553 (35%) antibacterial prescriptions. Table 4.23 demonstrates the breakdown of the 4,369 prescribed antibacterials.
Table 4.23: Number and percentage of prescribed antibacterials
Rank Order
Antibacterial Agent Antibacterials Prescribed
N % 1 Co‐amoxiclav 974 22 2 Piperacillin‐tazobactam 579 13 3 Metronidazole 359 8 4 Ciprofloxacin 287 7 5 Clarithromycin 242 6 6 Flucloxacillin 242 6 7 Gentamicin 208 5 8 Cefuroxime 182 4 9 Vancomycin 174 4 10 Meropenem 130 3 11 Benzylpenicillin 123 3 12 Trimethoprim 63 1 13 Cefotaxime 59 1 14 Nitrofurantoin 56 1 15 Amoxicillin 55 1 16 Trimethoprim & sulphamethoxazole (co‐trimoxazole) 55 1 17 Levofloxacin 54 1 18 Linezolid 51 1 19 Clindamycin 49 1 20 Erythromycin 40 1 21 Other agents 387 9
Total 4,369 100 4.6.8 Description of Prescribed Antifungals
Table 4.24 demonstrates the breakdown of the 163 prescribed antifungals.
Table 4.24: Number and percentage of prescribed antifungals Rank Order Antifungal Agent
Antifungals Prescribed N %
1 Fluconazole 68 42 2 Nystatin 39 24 3 Caspofungin 22 13 4 Amphotericin B 15 9 5 Posaconazole 8 5 6 Anidulafungin 7 4 7 Voriconazole 4 2
Total 163 100
HSE‐Health Protection Surveillance Centre (HPSC) Tel: +353 1 8765 300 www.hpsc.ie 25‐27 Middle Gardiner Street, Dublin 1, Ireland. Fax: +353 1 856 1299 2012 ECDC PPS of HAI & AMU: IRELAND NATIONAL REPORT

P a g e | 37
4.6.9 Indication for Antimicrobial Prescribing
Table 4.25 describes the prescriber’s indication for the antimicrobial prescribed. The majority of prescriptions (n=3,526; 78%) were for the treatment of infection. Surgical antimicrobial prophylaxis accounted for 508 prescriptions (11%) and medical prophylaxis for 361 prescriptions (8%).
Table 4.25: Number and percentage of antimicrobials, by prescriber’s indication
Prescriber’s Indication Antimicrobials Prescribed N %
Treatment of infection 3,526 78 Surgical antimicrobial prophylaxis 508 11 Medical prophylaxis 361 8 Other 38 1 Unknown 99 2 Total 4,532 100
4.6.10 Antimicrobials Prescribed for Treatment of Infection
Of the 3,526 prescriptions for treatment of infection, the majority were for treatment of community‐associated infections (2,415 prescriptions; 69%) followed by hospital‐associated infections (1,025 prescriptions; 29%) and long‐term care facility‐associated infections (86 prescriptions; 2%) (Figure 4.19).
The prescriber’s diagnosis or suspected site for the infection being treated was also recorded (Figure 4.20). The respiratory tract accounted for 1,247 (35%) prescriptions [pneumonia 961 (27%) and bronchitis 286 (8%)], skin, wound or soft tissue infections for 481 (14%), intra‐abdominal infection for 396 (11%) and cystitis/urinary tract infection for 258 (7%) prescriptions.
Figure 4.19: Percentage of antimicrobials prescribed for treatment of infection, by origin of infection (N=3,526)
Figure 4.20: Percentage of antimicrobials prescribed for treatment of infection, by site of infection (N=3,526)
CI: Community‐associated infection; LI: Infection associated with long‐term care facility;
HI: Hospital‐associated infection
PNEU: Pneumonia; SST: Skin and soft tissue infection; IA: Intraabdominal infection; BRON: Bronchitis; CYS: Cystitis or symptomatic lower urinary tract
infection
HSE‐Health Protection Surveillance Centre (HPSC) Tel: +353 1 8765 300 www.hpsc.ie 25‐27 Middle Gardiner Street, Dublin 1, Ireland. Fax: +353 1 856 1299 2012 ECDC PPS of HAI & AMU: IRELAND NATIONAL REPORT

P a g e | 38
Figures 4.21 to 4.24 and Table 4.26 demonstrate the most common agents (number and cumulative percentage) used to treat the most common infection types, as diagnosed by prescribers.
Figure 4.21: Number and cumulative percentage of antimicrobials prescribed to treat respiratory infections, including pneumonia and bronchitis (N=1,247)
Figure 4.22: Number and cumulative percentage of antimicrobials prescribed to treat skin and soft tissue infections, including cellulitis, wound and deep soft tissue infections (N=481)
HSE‐Health Protection Surveillance Centre (HPSC) Tel: +353 1 8765 300 www.hpsc.ie 25‐27 Middle Gardiner Street, Dublin 1, Ireland. Fax: +353 1 856 1299 2012 ECDC PPS of HAI & AMU: IRELAND NATIONAL REPORT

P a g e | 39
Figure 4.23: Number and cumulative percentage of antimicrobials prescribed to treat intra‐abdominal infections (N=396)
Figure 4.24: Number and cumulative percentage of antimicrobials prescribed to treat cystitis or symptomatic lower urinary tract infections (N=258)
HSE‐Health Protection Surveillance Centre (HPSC) Tel: +353 1 8765 300 www.hpsc.ie 25‐27 Middle Gardiner Street, Dublin 1, Ireland. Fax: +353 1 856 1299 2012 ECDC PPS of HAI & AMU: IRELAND NATIONAL REPORT

P a g e | 40
Table 4.26: Number and percentage of antimicrobials prescribed for treatment of common infection types
Diagnosis/Site of Infection being Treated
Antimicrobial Agent Antimicrobial Prescribed
N %
Respiratory
Co‐amoxiclav 338 27.1 Piperacillin‐tazobactam 301 24.1 Clarithromycin 208 16.7 Meropenem 46 3.7 Ciprofloxacin 45 3.6 Levofloxacin 37 3.0 Vancomycin 35 2.8 Tobramycin 18 1.4 Gentamicin 17 1.4 Amoxicillin 16 1.3 Other 186 14.9 Total 1,247 100
Skin and soft tissue infection
Flucloxacillin 163 33.9 Benzylpenicillin 48 10.0 Co‐amoxiclav 39 8.1 Metronidazole 33 6.9 Clindamycin 32 6.7 Piperacillin‐tazobactam 28 5.8 Phenoxymethylpenicillin 27 5.6 Ciprofloxacin 24 5.0 Vancomycin 20 4.2 Meropenem 9 1.9 Other 58 12.1 Total 481 100
Intra‐abdominal infection
Metronidazole 99 25.0 Co‐amoxiclav 75 18.9 Piperacillin‐tazobactam 71 17.9 Ciprofloxacin 35 8.8 Meropenem 24 6.1 Gentamicin 23 5.8 Cefuroxime 15 3.8 Vancomycin 14 3.5 Caspofungin 6 1.5 Fluconazole 6 1.5 Other 28 7.1 Total 396 100
Cystitis or symptomatic lower urinary tract infection
Co‐amoxiclav 108 41.9 Ciprofloxacin 38 14.7 Nitrofurantoin 30 11.6 Trimethoprim 21 8.1 Piperacillin‐tazobactam 16 6.2 Amoxicillin 7 2.7 Gentamicin 7 2.7 Meropenem 6 2.3 Cefalexin 3 1.2 Cefotaxime 3 1.2 Other 19 7.4 Total 258 100
HSE‐Health Protection Surveillance Centre (HPSC) Tel: +353 1 8765 300 www.hpsc.ie 25‐27 Middle Gardiner Street, Dublin 1, Ireland. Fax: +353 1 856 1299 2012 ECDC PPS of HAI & AMU: IRELAND NATIONAL REPORT

P a g e | 41
4.6.11 Surgical Antimicrobial Prophylaxis
Surgical antimicrobial prophylaxis accounted for 508 (11%) prescriptions, with just 138 of those (27%) single‐dose prescriptions. In this survey, 370 (73%) surgical antimicrobial prophylaxis prescriptions exceeded one dose, and of those 237 (47% of overall) exceeded 24 hours duration (Figure 4.25). Table 4.27 demonstrates the antimicrobial agents prescribed by name, number and percentage.
Figure 4.25: Duration of surgical antimicrobial prophylaxis (N=508)
Table 4.27: Agents prescribed for surgical antimicrobial prophylaxis
Rank Order
Antimicrobial Agent Antimicrobials Prescribed
N %
1 Co‐amoxiclav 199 39.2 2 Cefuroxime 134 26.4 3 Metronidazole 56 11.0 4 Gentamicin 30 5.9 5 Ciprofloxacin 26 5.1 6 Vancomycin 14 2.8 7 Teicoplanin 7 1.4 8 Amoxicillin 5 1.0 9 Flucloxacillin 5 1.0 10 Piperacillin‐tazobactam 5 1.0 11 Others 27 5.3
Total 508 100
HSE‐Health Protection Surveillance Centre (HPSC) Tel: +353 1 8765 300 www.hpsc.ie 25‐27 Middle Gardiner Street, Dublin 1, Ireland. Fax: +353 1 856 1299 2012 ECDC PPS of HAI & AMU: IRELAND NATIONAL REPORT

P a g e | 42
4.6.12 Medical Prophylaxis
Medical prophylaxis accounted for 361 (8%) prescriptions. Table 4.28 demonstrates the antimicrobial agents prescribed as medical prophylaxis by name, number and percentage. The indication for medical prophylaxis was not recorded during the PPS. The broad spectrum agents, co‐amoxiclav accounted for 8.6% and ciprofloxacin for 4.4% of medical prophylaxis, respectively.
Table 4.28: Agents prescribed for medical prophylaxis Rank Order Antimicrobial Agent
Antimicrobials Prescribed N %
1 Trimethoprim & sulphamethoxazole (co‐trimoxazole) 42 11.6 2 Trimethoprim 32 8.9 3 Co‐amoxiclav 31 8.6 4 Gentamicin 30 8.3 5 Benzylpenicillin 23 6.4 6 Nitrofurantoin 21 5.8 7 Nystatin 20 5.5 8 Azithromycin 17 4.7 9 Ciprofloxacin 16 4.4 10 Erythromycin 12 3.3 11 Others 117 32.4
Total 361 100
HSE‐Health Protection Surveillance Centre (HPSC) Tel: +353 1 8765 300 www.hpsc.ie 25‐27 Middle Gardiner Street, Dublin 1, Ireland. Fax: +353 1 856 1299 2012 ECDC PPS of HAI & AMU: IRELAND NATIONAL REPORT

P a g e | 43
4.7 Prevalence of HAI and Antimicrobial Use, by Hospital Type and Participating Hospitals
Fifty acute hospitals (42 public, seven private and one private specialist) participated in the survey. The overall HAI prevalence for the 42 public hospitals was over twice that in the eight private hospitals (5.6 versus 2.1%). The overall antimicrobial use prevalence for the 42 acute public hospitals was 35.2% versus 29.2% for the eight private hospitals (Table 4.29). Table 4.30, Figures 4.26 and 4.27 demonstrate the prevalence of HAI and antimicrobial use by hospital type. For the purposes of HAI and AMU analysis by hospital type, the 11 specialist public and one specialist private hospital have been grouped together. The specialist private hospital has not been included in the analysis of the private hospitals. The HAI prevalence was highest in tertiary hospitals (7.5%) and lowest in private hospitals (2.5%). The prevalence of antimicrobial use was quite similar across primary, secondary, tertiary and private hospitals and was lowest in specialist hospitals (20.3%). Despite having a lower prevalence of HAI, the prevalence of antimicrobial use was higher for the seven private hospitals (37.3%) compared to the overall prevalence (34.0%). However, private hospitals had a higher percentage of patients on surgical wards (35%) in comparison to public hospitals (21%), a factor which may have contributed to the higher prevalence of antimicrobial use in private hospitals. Table 4.31 demonstrates the prevalence of HAI and antimicrobial use by participating hospital. The HAI prevalence by participating hospital has been further broken down into the overall HAI prevalence and the prevalence of HAI acquired in the participating hospital. For the purposes of reporting, 42 public hospitals are grouped by HSE administrative region and eight private hospitals are grouped separately. Direct comparison of HAI and AMU prevalence in acute hospitals within the same HSE region is not recommended, owing to differences in hospital type and case mix. Likewise, direct comparison of HAI and AMU prevalence between private hospitals is not recommended. Inter‐hospital comparisons between similar hospital types should be undertaken with caution, as individual hospitals have differing patient case mix and workloads. For example, elective admissions only versus both elective and emergency admissions, predominance of day surgery versus major cardiothoracic surgery, admissions to an on‐site critical care unit versus no on‐site critical care unit etc. Such factors will have significant impact on the prevalence of HAI and AMU within an individual hospital and limit the validity of inter‐hospital comparisons.
Table 4.29: Participating hospitals; overall prevalence of HAI and antimicrobial use
Hospitals Number of Participating Hospitals
Number of Eligible Patients
HAI Prevalence
(%)
95% Confidence Interval (%)
Antimicrobial Use
Prevalence (%)
95% Confidence Interval (%)
Public Hospitals 42 7,898 5.6 5.1 – 6.1 35.2 34.1 – 36.2
Private Hospitals 8 1,132 2.1 1.4 – 3.1 29.2 26.7 – 32.0
Overall 50 9,030 5.2 4.7 – 5.6 34.0 33.4 – 35.4
HSE‐Health Protection Surveillance Centre (HPSC) Tel: +353 1 8765 300 www.hpsc.ie 25‐27 Middle Gardiner Street, Dublin 1, Ireland. Fax: +353 1 856 1299 2012 ECDC PPS of HAI & AMU: IRELAND NATIONAL REPORT
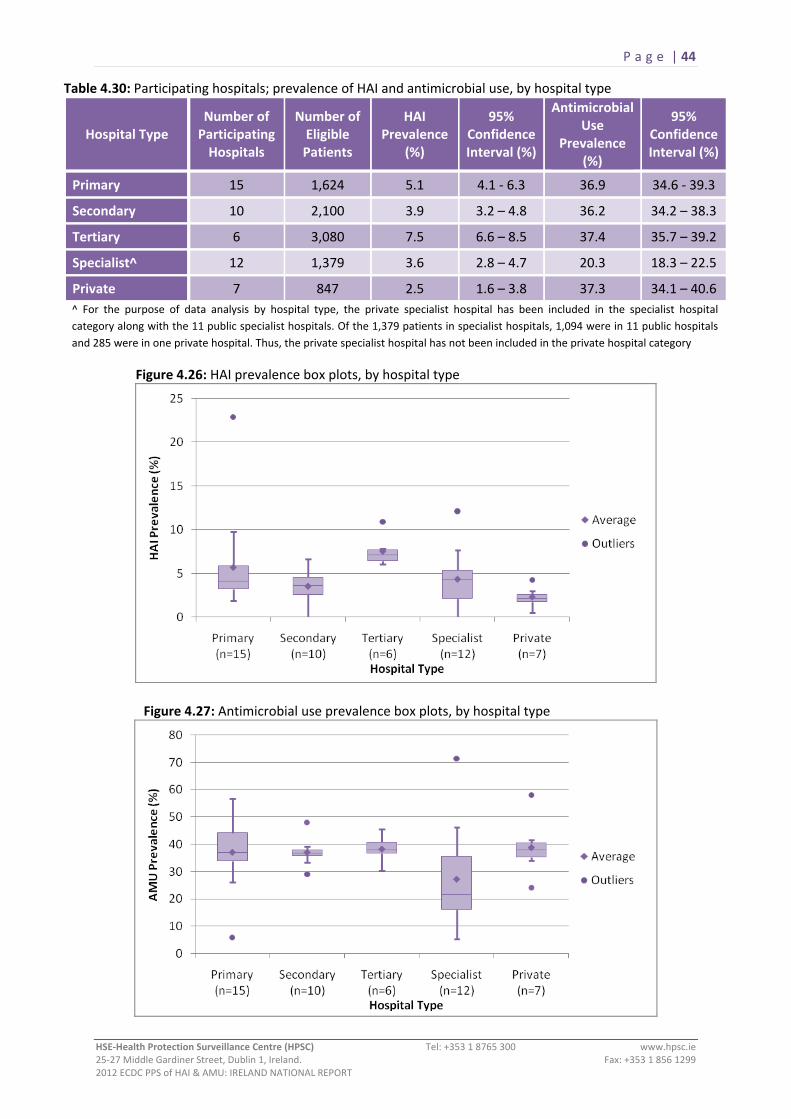
P a g e | 44
Table 4.30: Participating hospitals; prevalence of HAI and antimicrobial use, by hospital type
Hospital Type Number of Participating Hospitals
Number of Eligible Patients
HAI Prevalence
(%)
95% Confidence Interval (%)
Antimicrobial Use
Prevalence (%)
95% Confidence Interval (%)
Primary 15 1,624 5.1 4.1 ‐ 6.3 36.9 34.6 ‐ 39.3
Secondary 10 2,100 3.9 3.2 – 4.8 36.2 34.2 – 38.3
Tertiary 6 3,080 7.5 6.6 – 8.5 37.4 35.7 – 39.2
Specialist^ 12 1,379 3.6 2.8 – 4.7 20.3 18.3 – 22.5
Private 7 847 2.5 1.6 – 3.8 37.3 34.1 – 40.6 ^ For the purpose of data analysis by hospital type, the private specialist hospital has been included in the specialist hospital category along with the 11 public specialist hospitals. Of the 1,379 patients in specialist hospitals, 1,094 were in 11 public hospitals and 285 were in one private hospital. Thus, the private specialist hospital has not been included in the private hospital category
Figure 4.26: HAI prevalence box plots, by hospital type
Figure 4.27: Antimicrobial use prevalence box plots, by hospital type
HSE‐Health Protection Surveillance Centre (HPSC) Tel: +353 1 8765 300 www.hpsc.ie 25‐27 Middle Gardiner Street, Dublin 1, Ireland. Fax: +353 1 856 1299 2012 ECDC PPS of HAI & AMU: IRELAND NATIONAL REPORT

P a g e | 45
HSE‐Health Protection Surveillance Centre (HPSC) Tel: +353 1 8765 300 www.hpsc.ie 25‐27 Middle Gardiner Street, Dublin 1, Ireland. Fax: +353 1 856 1299 2012 ECDC PPS of HAI & AMU: IRELAND NATIONAL REPORT
Table 4.31: Prevalence of HAI and antimicrobial use, by participating hospital (continued overleaf)
HSE REGION HOSPITAL NAME NUMBER OF ELIGIBLE PATIENTS
HAI PREVALENCE ANTIMICROBIAL USE PREVALENCE All HAI Current Hospital*
N % N % N %
HSE DUBLIN NORTH‐EAST
Beaumont Hospital, Dublin 558 61 10.9% 57 10.2% 208 37.3% Cappagh National Orthopaedic Hospital, Dublin 26 2 7.7% 2 7.7% 9 34.6% Cavan General Hospital, Cavan 206 7 3.4% 7 3.4% 76 36.9% Connolly Hospital, Dublin 189 6 3.2% 6 3.2% 69 36.5% Louth County Hospital, Dundalk 33 1 3.0% 1 3.0% 2 6.1% Our Lady of Lourdes Hospital, Drogheda 340 14 4.1% 13 3.8% 126 37.1% Our Lady’s Hospital, Navan 105 2 1.9% 2 1.9% 32 30.5% Rotunda Hospital, Dublin 196 9 4.6% 9 4.6% 37 18.9% TOTAL FOR HSE DUBLIN NORTH‐EAST 1,653 102 6.2% 97 5.9% 559 33.8%
HSE DUBLIN MID‐LEINSTER
Adelaide, Meath & National Children’s Hospital, Tallaght 496 30 6.0% 27 5.4% 192 38.7% Children’s University Hospital, Temple Street 72 4 5.6% 3 4.2% 27 37.5% Coombe Women’s and Infant’s University Hospital 197 8 4.1% 7 3.6% 43 21.8% Midland Regional Hospital, Mullingar 186 6 3.2% 5 2.7% 73 39.2% Midland Regional Hospital, Portlaoise 108 0 0.0% 0 0.0% 39 36.1% Midland Regional Hospital, Tullamore 152 6 3.9% 6 3.9% 73 48.0% Naas General Hospital, Naas 169 10 5.9% 10 5.9% 83 49.1% National Maternity Hospital, Holles Street 171 4 2.3% 2 1.2% 31 18.1% Our Lady’s Children’s Hospital, Crumlin 151 8 5.3% 6 4.0% 70 46.4% Royal Victoria Eye & Ear Hospital, Dublin 20 1 5.0% 1 5.0% 7 35.0% St. Columcille’s Hospital, Loughlinstown 104 6 5.8% 5 4.8% 38 36.5% St. James’s Hospital, Dublin 727 46 6.3% 38 5.2% 218 30.0% St. Luke’s Hospital, Rathgar 66 8 12.1% 8 12.1% 14 21.2% St. Michael’s Hospital, Dun Laoghaire 67 3 4.5% 3 4.5% 26 38.8% St. Vincent’s University Hospital 354 26 7.3% 20 5.6% 129 36.4% TOTAL FOR HSE DUBLIN MID‐LEINSTER 3,040 166 5.5% 141 4.6% 1,063 35.0%
*HAI which were acquired in the current hospital

P a g e | 46
HSE‐Health Protection Surveillance Centre (HPSC) Tel: +353 1 8765 300 www.hpsc.ie 25‐27 Middle Gardiner Street, Dublin 1, Ireland. Fax: +353 1 856 1299 2012 ECDC PPS of HAI & AMU: IRELAND NATIONAL REPORT
HSE REGION HOSPITAL NAME NUMBER OF ELIGIBLE PATIENTS
HAI PREVALENCE ANTIMICROBIAL USE PREVALENCE All HAI Current Hospital*
No. % No. % No. %
HSE WEST
Galway University Hospitals 600 41 6.8% 38 6.3% 249 41.5% Letterkenny General Hospital 293 7 2.4% 6 2.0% 105 35.8% Mid‐Western Regional Hospital, Dooradoyle 345 27 7.8% 22 6.4% 157 45.5% Mid‐Western Regional Hospital, Ennis 51 3 5.9% 2 3.9% 24 47.1% Mid‐Western Regional Hospital, Nenagh 49 2 4.1% 1 2.0% 17 34.7% Mid‐Western Regional Maternity Hospital 149 2 1.3% 2 1.3% 15 10.1% Mid‐Western Regional Orthopaedic Hospital, Croom 32 1 3.1% 1 3.1% 2 6.3% Portiuncula Hospital, Ballinasloe 136 3 2.2% 3 2.2% 52 38.2% Roscommon County Hospital 48 11 22.9% 6 12.5% 20 41.7% Sligo General Hospital 191 9 4.7% 9 4.7% 64 33.5% St. John’s Hospital, Limerick 37 1 2.7% 0 0.0% 21 56.8% TOTAL FOR HSE WEST 1,931 107 5.5% 90 4.7% 726 37.6%
HSE SOUTH
Kerry General Hospital 221 9 4.1% 9 4.1% 58 26.2% Lourdes Orthopaedic Hospital, Kilcreene 14 0 0.0% 0 0.0% 10 71.4% Mercy University Hospital, Cork 158 8 5.1% 6 3.8% 58 36.7% South Infirmary‐Victoria Hospital, Cork 91 5 5.5% 2 2.2% 34 37.4% South Tipperary General Hospital, Clonmel 139 14 10.1% 12 8.6% 65 46.8% St. Luke’s General Hospital, Kilkenny 148 3 2.0% 3 2.0% 49 33.1% Waterford Regional Hospital 347 23 6.6% 20 5.8% 101 29.1% Wexford General Hospital 156 6 3.8% 5 3.2% 54 34.6% TOTAL FOR HSE SOUTH 1,274 68 5.3% 57 4.5% 429 33.7%
PRIVATE HOSPITALS
Bon Secours, Cork 199 6 3.0% 6 3.0% 48 24.1% Bon Secours, Galway 48 1 2.1% 1 2.1% 20 41.7% Bon Secours, Dublin 101 2 2.0% 1 1.0% 37 36.6% Bon Secours, Tralee 89 1 1.1% 0 0.0% 35 39.3% Galway Clinic, Doughiska 141 6 4.3% 6 4.3% 48 34.0% Mater Private Hospital 140 3 2.1% 3 2.1% 53 37.9% UPMC Beacon Hospital, Dublin 129 2 1.6% 2 1.6% 75 58.1% TOTAL FOR PRIVATE HOSPITALS 847 21 2.5% 19 2.2% 316 37.3% St. Patrick’s University Hospital – private specialist hospital 285 3 1.1% 3 1.1% 15 5.3%
TOTAL FOR ALL PARTICIPATING HOSPITALS 9,030 467 5.2% 407 4.5% 3,108 34.0% *HAI which were acquired in the current hospital

P a g e | 47
5.0 Previous Prevalence Surveys
5.1 Hospital Infection Society (HIS): Third Prevalence Survey of Healthcare‐Associated Infections in Acute Hospitals – 2006
In 2006, 44 acute hospitals in Ireland participated in the Hospital Infection Society (HIS) Third Prevalence Survey of Healthcare‐Associated Infections.11,12 In 2012, 38 of those 44 acute hospitals went on to participate in the first ECDC PPS of HAI and AMU. An additional 12 hospitals also participated in 2012, giving a total of 50 acute hospitals.
Direct comparison of the results of the 2006 and 2012 surveys is not possible, owing to differences in survey methodology and the use of different definitions for some of the most commonly reported infections (pneumonia, bloodstream infections and urinary tract infections). Table 5.1 describes the major differences between the 2006 and 2012 point prevalence surveys, which prevent direct comparison of results between the two surveys.
HSE‐Health Protection Surveillance Centre (HPSC) Tel: +353 1 8765 300 www.hpsc.ie 25‐27 Middle Gardiner Street, Dublin 1, Ireland. Fax: +353 1 856 1299 2012 ECDC PPS of HAI & AMU: IRELAND NATIONAL REPORT

P a g e | 48
HSE‐Health Protection Surveillance Centre (HPSC) Tel: +353 1 8765 300 www.hpsc.ie 25‐27 Middle Gardiner Street, Dublin 1, Ireland. Fax: +353 1 856 1299 2012 ECDC PPS of HAI & AMU: IRELAND NATIONAL REPORT
Table 5.1: Methodological differences between the 2006 and 2012 point prevalence surveys
PPS PROTOCOL 2006 2012
Patient sampling strategy
Hospital size ≤200 beds: All patients surveyed
Hospital size >200 beds: At least 80% of patients surveyed
All eligible patients surveyed
PPS timeline National survey conducted over 12 weeks between February and May 2006
National survey conducted over three weeks during May 2012
PPS data collectors Local infection prevention and control team and external data collectors completed survey within a hospital
Local multi‐disciplinary PPS team completed survey within a hospital
No external data collectors
Patient inclusion and exclusion criteria
1. Patients aged <15 years excluded
2. Acute psychiatric patients excluded 3. Admitted patients in emergency
department (ED), day ward, acute medical assessment unit excluded
1. No age limitations on eligible patients
2. Acute psychiatric patients could be included
3. Admitted patients in ED, day ward, acute medical assessment unit included
Origin of HCAI Infections acquired in hospital other than participating hospital excluded
All HAI included, regardless of location where HAI acquired
Infection definitions: 1. Pneumonia (PN)
2. Urinary tract infection (UTI)
3. Bloodstream infection (BSI)
4. Systemic Infection – Clinical Sepsis
(SYS‐CSEP)
US CDC case definition
US CDC case definition (included asymptomatic bacteriuria)
US CDC – Primary BSI BSI secondary to other HCAI could
also be recorded but were not reported as separate HCAI
Not included in 2006 PPS
ECDC HELICS case definition
ECDC HELICS case definition (excluded asymptomatic bacteriuria)
ECDC HELICS case definition included primary and secondary BSI, with secondary BSI reported as separate HAI
Included in 2012 PPS – For use as a last resort definition where no other potential focus for HAI exists
Questionnaire items:
Indwelling urinary catheter in situ at time of survey or in previous seven days
Mechanical ventilation at time of survey or in previous seven days
Surgery within last 30 days (no implant) or implant surgery within previous year
Urethral catheter in situ at time of survey
Respiratory tract intubation (with or without mechanical ventilation) at time of survey. Not comparable with 2006
Surgery since admission. Not comparable with 2006
Positive microbiology and key antimicrobial resistance markers
If HCAI caused by meticillin resistant S. aureus (MRSA), this could be recorded
Active C. difficile diarrhoea could be recorded
All relevant positive microbiology results recorded for each HAI
Antimicrobial resistance markers recorded for key pathogens
Antimicrobial Use Only two questions regarding antibiotic use: 1. Patient currently receiving systemic
antibiotics – Yes/No 2. IV antibiotics – Yes/No
Section of patient form dedicated to systemic antimicrobial use: agent, route, prescriber’s indication, diagnosis site, documented indication, compliance with local policy

P a g e | 49
In 2006, 7,541 patients were surveyed, 369 of whom were reported to have at least one healthcare‐associated infection, giving a national prevalence of 4.9%. In total, 386 infections were identified. Table 5.2 describes the prevalence of comparable patient risk factors in 2006 and 2012. Table 5.3 describes the breakdown of infections by type, as reported in the 2006 and 2012 prevalence surveys. Table 5.2: 2006 and 2012 point prevalence surveys: comparable patient risk factor prevalence
2006 2012
Total number of surveyed patients 7,541 9,030
Total number of patients aged <16 years
6* 1,092
Median age (years) [IQR] 68 [51‐79] 63 [36‐77]
Number (%) of patients aged ≥65 4,168 (55) 4,330 (48)
Number (%) of patients with peripheral line (PVC) in situ at the time of survey
3,024 (40) 3,679 (41)
Number (%) of patients with a central line (CVC) in situ at the time of survey
426 (6) 544 (6)
Number (%) of patients with a catheter in situ at the time of survey
Urinary catheter
1,134 (15)
Urethral catheter
1,119 (12)
*All six patients were aged 15 years
Table 5.3: 2006 and 2012 point prevalence surveys: breakdown of infection types
HAI Type 2006 PPS 2012 PPS
Rank N % Rank N %
Surgical site infections =1 83 21.5 1 91 18.2
Pneumonia 2 65 15.8 2 86 17.2
Urinary tract infections* =1 83 21.5 3 75 15.0
Bloodstream infections** 4 37 9.6 4 66 13.2
Gastrointestinal system infections 3 45 11.7 5 49 9.8
Systemic infections 11 1 0.3 6 38 7.6
Eye, ear, nose or mouth infections 7 11 2.8 7 23 4.6
Bone and joint infections 9 3 0.8 8 19 3.8
Skin and soft tissue infections 5 36 9.3 9 16 3.1
Neonatal specific infections NA NA NA 10 14 2.8
Other ‐ 22 5.7 ‐ 24 4.8
Total ‐ 386 100 ‐ 501 100 *2006 PPS included asymptomatic bacteriuria, which was not included in 2012. Asymptomatic bacteriuria accounted for 31% of UTI in 2006
**2006 PPS included a case definition for primary BSI only. 2012 PPS included one case definition for BSI which enabled classification and reporting of both primary and secondary BSI
HSE‐Health Protection Surveillance Centre (HPSC) Tel: +353 1 8765 300 www.hpsc.ie 25‐27 Middle Gardiner Street, Dublin 1, Ireland. Fax: +353 1 856 1299 2012 ECDC PPS of HAI & AMU: IRELAND NATIONAL REPORT

P a g e | 50
For the reasons outlined above, direct comparison of HAI types and HAI prevalence between 2006 and 2012 surveys is not possible.
Data from the 2012 PPS have been stratified in an attempt to provide an estimate of the overall national HAI prevalence for the PPS in 2012 versus 2006, using a similar denominator. The reported infection prevalence in 2006 was 4.9% and the adjusted infection prevalence in 2012 is 5.0% (Table 5.4).
Table 5.4: Estimate of the difference in national HAI prevalence between 2006 and 2012 PPS
Year Patients
included in Original Analysis
Patients included in
Revised Analysis
HAI included in Revised Analysis
HAI Prevalence
2006 7,541 NA NA 4.9% 2012 9,030 7,486* 372** 5.0%
*The revised denominator for 2012 PPS has been calculated by excluding: patients aged ≤15 years of age and acute psychiatric patients. It was not possible to identify admitted patients in ED, day wards or acute medical assessment units from the 2012 patient population. Such patients would have been excluded in the 2006 survey.
** The revised HAI numerator for 2012 PPS has been calculated by excluding HAI in patients aged ≤15 years of age, HAI in acute psychiatric patients and HAI acquired in another hospital.
5.2 European Surveillance of Antimicrobial Consumption (ESAC) Hospitals Care Point Prevalence Surveys
The ESAC coordinated an annual European hospital point prevalence survey of antimicrobial consumption in 200913, 2010 14 and 2011 (Source: HPSC). The annual ESAC survey is coordinated in Ireland by the HPSC and the Irish Antimicrobial Pharmacists Group (IAPG). As the methodology and definitions used in antimicrobial use component of the 2012 PPS were similar to that of the previous ESAC PPS, the findings of previous ESAC surveys conducted in Ireland and the 2012 ECDC PPS are comparable and are demonstrated in Table 5.5.
Table 5.5: Previous ESAC PPS findings compared with ECDC 2012 PPS of AMU
ESAC 2009 PPS ESAC 2010 PPS ESAC 2011 PPS ECDC 2012 PPS
Number of participating hospitals
21 28 33 50
Number of included patients 5,824 6,414 7,468 9,030
Number of patients receiving systemic antimicrobial therapy
2,000 2,309 2,586 3,108
Median prevalence of antimicrobial use in Ireland
34.3% 36.5% 40.7% 36.6%
Antimicrobials via parenteral route
62.2% 57.4% 59.8% 63.0%
Documented indication for antimicrobial use
75.3% 83.5% 85.3% 83.1%
HSE‐Health Protection Surveillance Centre (HPSC) Tel: +353 1 8765 300 www.hpsc.ie 25‐27 Middle Gardiner Street, Dublin 1, Ireland. Fax: +353 1 856 1299 2012 ECDC PPS of HAI & AMU: IRELAND NATIONAL REPORT
P a g e | 51
6.0 Prevalence of HAI and AMU: Republic of Ireland and Neighbouring Countries
England, Scotland and Wales performed the ECDC PPS during Autumn 2011 and published individual national PPS reports in 2012.15,16,17 Table 6.1 summarises the HAI prevalence and top five HAI reported in England, Scotland, Wales and Republic of Ireland (ROI) and Table 6.2 summarises the AMU prevalence and proportion of antimicrobials prescribed via the parenteral (i.e., intravenous) route and proportion with a documented indication reported in England, Scotland, Wales and ROI.
Northern Ireland performed the ECDC PPS during May and June 2012. The PPS results for Northern Ireland were not published by the time of completion of this report.
The HAI prevalence in the ROI (5.2%) was lower than that reported by England (6.4%) and higher than that reported by Scotland (4.9%) and Wales (4.3%)
The top three HAI reported in each country were similar with differences in the rank order of each HAI type. SSI was the most common HAI reported in ROI and Wales, ranking second in Scotland and third in England. PN was the second most common HAI reported in ROI, ranking first in England and third in both Scotland and Wales. UTI was the third most common HAI reported in ROI, ranking first in Scotland and second in both England and Wales
The AMU prevalence in the ROI (34.0%) was slightly lower than that reported by England (34.7%) and higher than that reported by Scotland (32.3%) and Wales (32.7%)
The percentage of antimicrobials administered via the parenteral route was highest in ROI (63%) followed by England (56%), Scotland (47.8%) and Wales (47.7%)
The percentage of antimicrobial prescriptions with a documented indication was highest in Scotland (89.1%), followed by England (84.7%), ROI (83.1%) and Wales (76.1%)
HSE‐Health Protection Surveillance Centre (HPSC) Tel: +353 1 8765 300 www.hpsc.ie 25‐27 Middle Gardiner Street, Dublin 1, Ireland. Fax: +353 1 856 1299 2012 ECDC PPS of HAI & AMU: IRELAND NATIONAL REPORT

P a g e | 52
Table 6.1: HAI prevalence and top five HAI reported by neighbouring countries
ENGLAND15 SCOTLAND16 WALES17 REPUBLIC OF IRELAND
Eligible patients 52,443 11,604 6,588 9,030
Patients with active HAI
3,360 559 282 467
HAI prevalence % (95% CI)
6.4 (4.7 – 8.7)
4.9 (4.4 – 5.4)
4.3 (3.8 – 4.8)
5.2 (4.7 – 5.6)
Number of HAI 3,506 601 299 501
TOP FIVE HAI: NUMBER (%)
1 PN
642 (18.3) UTI
136 (22.6) SSI
71 (23.7) SSI
91 (18.2)
2 UTI
605 (17.2) SSI
112 (18.6) UTI
50 (16.7) PN
86 (17.2)
3 SSI
551 (15.7) PN
105 (17.5) PN
37 (12.4) UTI
75 (15)
4 SYS‐CSEP 367 (10.5)
BSI 65 (10.8)
GI 35 (11.7)
BSI 66 (13.2)
5 GI
309 (8.8) EENT* 55 (9.2)
BSI 33 (11.0)
GI 49 (9.8)
*EENT = Eye, Ear, Nose, Throat or Mouth Infection
Table 6.2: Antimicrobial use reported by neighbouring countries
ENGLAND15 SCOTLAND16 WALES17 REPUBLIC OF IRELAND
Eligible patients 52,443 11,604 6,588 9,030
Patients receiving systemic antimicrobials
18,219 3,728 2,156 3,108
AMU prevalence % (95% CI)
34.7 (30.5 – 39.6)
32.3 (30.9 – 33.8)
32.7 (31.6 – 33.9)
34.0 (33.4 – 35.4)
Number of systemic antimicrobials
25,942 5,664 Not specified in
report 4,532
Number via parenteral route (%)
14,525 (56)
2,147 (47.8)
1,466 (47.7)
2,855 (63)
Number with documented indication (%)
21,984 (84.7)
3,912 (89.1)
2,337 (76.1)
3,767 (83.1)
HSE‐Health Protection Surveillance Centre (HPSC) Tel: +353 1 8765 300 www.hpsc.ie 25‐27 Middle Gardiner Street, Dublin 1, Ireland. Fax: +353 1 856 1299 2012 ECDC PPS of HAI & AMU: IRELAND NATIONAL REPORT

P a g e | 53
7.0 Discussion
There was excellent participation across Ireland in this voluntary survey with 50 acute hospitals, from both the public and private sector contributing data on 9,030 patients. The number of participating hospitals increased from 44 in the 2006 HIS prevalence survey. The findings of the 2006 and 2012 prevalence surveys cannot be directly compared, as previously described. However, the 2012 ECDC PPS was conducted in accordance with a common protocol, using standardised HAI case definitions across EU Member States, making it the first and largest survey of its kind to be performed in Europe. Ireland’s PPS data has been submitted to ECDC for inclusion in the European PPS report, which is expected to be published in the spring of 2013. The ECDC plan that the European PPS should be repeated periodically, using the same methodology to facilitate ongoing measurement of HAI prevalence and antimicrobial prescribing.
Of the 50 participating hospitals, one reported having no infection prevention and control nurse (IPCN). A 2003 survey of acute hospital infection control resources in Ireland reported that ten hospitals (15%) had no IPCN.18 Seventeen hospitals (34%) reported having no nominated infection prevention and control doctor (IPCD). Hospitals were not requested to provide information regarding antimicrobial pharmacist or surveillance scientist staffing as part of the PPS. These questions should be included in any future point prevalence survey. Information received from the Irish Antimicrobial Pharmacists Group (IAPG) in November 2012, indicates that there are approximately 22.1 whole‐time equivalent (WTE) designated antimicrobial pharmacist posts across Irish hospitals, the vast majority of which, are located in public hospitals (96%).
The average proportion of single patient rooms was lowest in public primary or general hospitals (15%) and highest in private hospitals (37%). National infection prevention and control building guidelines for existing and new acute hospitals in Ireland were published in 2009 and recommend that newly‐built inpatient accommodation should comprise 100% single‐patient rooms. The guidelines also recommend that acute hospitals develop plans to minimise multiple‐patient rooms and maximise single‐patient rooms over the next decade.19
The findings of the 2012 PPS demonstrate the prevalence of some well‐described risk factors that place hospitalised patients at higher risk of infection, in comparison with otherwise well individuals in the community setting. Hospital patients who developed infection tended to be older, to have more severe underlying disease prognosis, longer length‐of‐admission, to have had surgery during the current admission and invasive medical devices in situ (e.g., vascular catheters, urethral catheters, intubation of the respiratory tract). The prevalence of HAI was higher in certain clinical areas, such as augmented care units and surgical wards and the HAI prevalence was higher in tertiary hospitals in comparison with other hospital types. Because the individual participating hospitals may have a very different patient case mix and may offer different levels of acuity of care, inter‐hospital comparisons are not recommended when interpreting the findings of this survey.
Overall, 14% of the HAI reported in this survey had originated in another hospital. This illustrates that HAI detected in a hospital may not always be attributable to or preventable by that hospital. It is for that reason that the overall HAI prevalence and the HAI prevalence attributable to each participating hospital have been reported in Section 4.7, Table 4.31.
HSE‐Health Protection Surveillance Centre (HPSC) Tel: +353 1 8765 300 www.hpsc.ie 25‐27 Middle Gardiner Street, Dublin 1, Ireland. Fax: +353 1 856 1299 2012 ECDC PPS of HAI & AMU: IRELAND NATIONAL REPORT

P a g e | 54
Surgical site infections (SSI) were the most common HAI encountered in this survey. It is likely that this survey has underestimated the true burden of SSI in Ireland, in particular the category of superficial incisional SSI. In the era of increasing day surgery and shorter length‐of‐postoperative stay, it is likely that many superficial incisional SSI are diagnosed and managed following patient discharge from hospital, either by the patient’s general practitioner or via the hospital’s outpatient department.
Prevention of SSI is multi‐factorial and encompasses pre‐, intra‐ and postoperative‐interventions, description of which is beyond the scope of this report. One evidence‐based measure to prevent SSI, applicable to certain categories of surgery, is the administration of surgical antimicrobial prophylaxis, within one hour prior to skin incision. There is an increasing body of evidence and international best practice guidelines to support this practice. Indeed, this policy was adopted by the English Department of Health, Advisory Committee on Antimicrobial Resistance and Healthcare‐Associated Infections in 2011.20,21,22 Continuation of surgical antimicrobial prophylaxis may be indicated with a further one‐to‐two doses administered in the event of significant intra‐operative blood loss (over 1.5 litres in an adult) or when a procedure exceeds four hours duration.20 In Ireland, the majority of prophylaxis administered during the PPS exceeded single dose (73%) and almost half exceeded 24 hours duration (47%). Extended prophylaxis may increase the patient’s risk of subsequent C. difficile infection and select for colonisation with multi‐drug resistant organisms. In the event that a SSI subsequently develops, it may be due to a pathogen which is more resistant and thus, more difficult and costly to treat. Additionally, as prophylaxis is usually given via the intravenous route, extended durations of intravenous administration may increase the risk of infected intravascular devices and wastes valuable nursing time.
The survey did not involve further classification of the surgical procedures for which prophylaxis was administered. Surgical procedures may be classified into the following categories; clean, clean‐implant, clean‐contaminated and dirty.20 This classification should be included in future surveys to ensure that antimicrobials administered for ‘dirty’ surgical procedures are accurately categorised as treatment of infection and not as surgical antimicrobial prophylaxis.
Respiratory tract infections were the number one reason for which prescribers recommended antimicrobials in the PPS (including both community and hospital‐acquired pneumonia cases). Pneumonia (PN) was the second most common HAI reported in the PPS, with one‐in‐five cases associated with intubation of the respiratory tract. Although patients classified as having PN were required to meet specific radiological and clinical criteria, unlike other HAI, the majority of hospital‐acquired pneumonia cases were not microbiologically confirmed. Thus, the underlying pathogens and their antimicrobial susceptibility is less certain in such cases. Of the 17 hospital‐acquired pneumonia cases with microbiological confirmation, Gram‐negative bacilli were the most common causative pathogens. It is likely that the same difficulty with microbiological diagnosis applies for community‐acquired pneumonia, although the causative pathogens and their likely antimicrobial susceptibility are more predictable in this scenario. Regardless, hospital‐acquired pneumonia presents a challenge with regard to antimicrobial use. Where broad spectrum empiric antimicrobial therapy is chosen, because of the lack of microbiological confirmation, it may be difficult to de‐escalate to a narrower spectrum agent to complete the treatment course, due to the absence of a microbiological diagnosis. Indeed, other respiratory conditions may present with radiological signs and clinical symptoms which are not too dissimilar to pneumonia. Therefore, the potential for use of biomarkers, such as procalcitonin to guide discontinuation of antimicrobials warrants further research and consideration.23
HSE‐Health Protection Surveillance Centre (HPSC) Tel: +353 1 8765 300 www.hpsc.ie 25‐27 Middle Gardiner Street, Dublin 1, Ireland. Fax: +353 1 856 1299 2012 ECDC PPS of HAI & AMU: IRELAND NATIONAL REPORT

P a g e | 55
Bloodstream infections (BSI) ranked fourth most common HAI in Ireland during the PPS. In comparison with neighbouring countries (England, Scotland and Wales), the proportion of BSI that were due to infected vascular catheters was higher in Ireland.15,16,17 The prevalence of intravascular device use in Ireland was also higher than that of neighbouring countries. BSI are potentially serious infections, which often require lengthy courses of intravenous antimicrobials, may result in metastatic infection to cardiac valves, bones and joints and are associated with patient morbidity and mortality. BSI associated with intravascular catheter infections are potentially preventable via simple measures, which include; avoiding unnecessary use of catheters, inserting and maintaining catheters with care and removing catheters when they are no longer required. These interventions form part of intravascular catheter care bundles, which have already been successfully implemented in many Irish hospitals and are recommended in national guidelines.3
During the PPS in Ireland, Enterobacteriaceae were the most common pathogens isolated from HAI. Approximately one‐in‐four Enterobacteriaceae causing HAI displayed resistance to third‐generation cephalosporins, a marker for the potential production of extended spectrum β lactamases (ESBLs) and multi‐drug resistance. This proportion was much higher than that reported from England, where 12% of Enterobacteriaceae causing HAI were resistant to third‐generation cephalosporins.15 This finding is also consistent with the observation of increasing resistance in Enterobacteriaceae causing BSI in Ireland, which are reported via the European Antimicrobial Resistance Surveillance Network (EARS‐Net). Such resistance is a cause for concern as HAI caused by these bacteria are difficult and more expensive to treat and associated with increased patient morbidity and mortality. Indeed, the emergence of carbapenem resistant Enterobacteriaceae (CRE) has been reported worldwide over the past decade, and has emerged in Ireland, especially over the past two years.24,25,26 There are extremely limited treatment options for CRE infections and there will be no new antimicrobials available in the foreseeable future.
In this PPS, 34% of patients were prescribed antimicrobials. Antimicrobial use is a well‐known risk factor for antimicrobial resistance. The prevalence of antimicrobial use increased with age and was higher in certain clinical areas (e.g., augmented care units). The prevalence of was highest in tertiary (37.4%) and private hospital types (37.3%). Although this may partly be explained by a higher proportion of surgical patients in private hospitals, it is important that all hospitals ensure that the recommendations on the prudent use of antimicrobials and good prescribing practices from the HIQA National Standards for the Prevention and Control of Healthcare‐Associated Infections and the Guidelines for Antimicrobial Stewardship are being implemented locally.4,6 Data from the IAPG indicates that the antimicrobial pharmacist role has not yet been implemented in the majority of private hospitals in Ireland. The registered nurse prescriber role has been introduced in Ireland in recent years. Antimicrobial agents accounted for approximately 10% of prescriptions by registered nurse prescriber’s between January 1st and November 9th 2012 [Source: Director of Nursing and Midwifery (Prescribing)]. The registered nurse prescriber role incorporates a decision‐making framework for prescribing.27 Adaption of such a framework by doctors, specifically for antimicrobial prescribing, may be a useful tool to improve prescribing practices.
In Ireland, the proportion of antimicrobials prescribed via the parenteral (i.e., intravenous) route was 63%, higher than the figures reported from neighbouring countries. Also, broad spectrum agents (co‐amoxiclav, piperacillin‐tazobactam and ciprofloxacin) accounted for a higher proportion of antimicrobials in Ireland than in neighbouring countries.15,16,17 The antimicrobial use findings of the 2012 PPS demonstrate that there is room for significant improvement with regard to compliance, documentation and choice of route of administration of antimicrobials.
HSE‐Health Protection Surveillance Centre (HPSC) Tel: +353 1 8765 300 www.hpsc.ie 25‐27 Middle Gardiner Street, Dublin 1, Ireland. Fax: +353 1 856 1299 2012 ECDC PPS of HAI & AMU: IRELAND NATIONAL REPORT

P a g e | 56
8.0 Priorities for Implementation
8.1 Immediate Priorities
1. Ensure that the local and national results of the 2012 PPS have been shared with all staff and that each hospital’s local results have been reviewed in detail. Local implementation priorities and action plans should be developed, based on individual hospital PPS results and case mix.
2. Ensure that all healthcare workers receive ongoing education and training regarding the importance and impact of healthcare‐associated infections and antimicrobial resistance, including preventative strategies outlined below.
3. Improve hand hygiene compliance in all staff. The World Health Organisation (WHO) five moments for hand hygiene should be consistently observed by all staff.2 Hand hygiene compliance should be audited regularly, with feedback of results to staff.
4. Ensure compliance with the HIQA National Standards for Prevention & Control of Healthcare‐Asssociated Infections, specifically Standard 8: ‘Invasive medical device‐related infections are prevented or reduced’.4
a. Implement routine daily review of intravascular devices on clinical team ward rounds and ensure ongoing audit and improvement with peripheral and central line care bundle compliance, in line with national guidelines for prevention of intravascular catheter related infections.3
b. Implement the recommendations of the national guidelines for the prevention of catheter‐associated urinary tract infections, which includes the use of locally‐adapted care bundles for management of urinary catheters.28
c. Implement the recommendations of the national guidelines for the prevention of ventilator‐associated pneumonia (VAP) in adults, which includes the use of a VAP care bundle.29
5. Ensure compliance with the HIQA National Standards for Prevention & Control of Healthcare‐Asssociated Infections, specifically Standard 12: ‘There are systems in place to reduce and control antimicrobial resistance’.4
6. Implement the core, high impact interventions to promote prudent antimicrobial prescribing recommended in the national guidelines for antimicrobial stewardship.6
a. Routine review of suitability for intravenous to oral antimicrobial switch after 48 hours (and daily thereafter) on clinical team ward rounds.
b. Improve antimicrobial prescribing documentation by all prescribers.
c. Improve compliance with hospital prescribing policies, including empiric prescribing for infection and surgical antimicrobial prophylaxis. Where policies are not available, they should be developed, based on local case mix.
HSE‐Health Protection Surveillance Centre (HPSC) Tel: +353 1 8765 300 www.hpsc.ie 25‐27 Middle Gardiner Street, Dublin 1, Ireland. Fax: +353 1 856 1299 2012 ECDC PPS of HAI & AMU: IRELAND NATIONAL REPORT

P a g e | 57
7. Ensure that frontline healthcare worker staffing levels reflect patient case mix and dependency levels.
8. Ensure that key infection prevention and control, antimicrobial stewardship and surveillance staff are not diverted to tasks outside their designated roles.
9. Educate patients on their role in preventing HAI, including the importance of hand hygiene and care of indwelling medical devices.
8.2 Short‐term Priorities – Implement within the Next Year
1. Implement the Royal College of Physicians of Ireland (RCPI) & Royal College of Surgeons in Ireland (RCSI) Antibiotic Care Bundle, once it is launched nationally on November 21st 2012.
2. Introduce the HSE medication prescription and administration record, once it has been launched.
3. Implement the RCSI Surgical Quality Improvement Tool, once it has been launched.
4. Plan for implementation of pilot surgical site infection surveillance programmes, to inform the resources required to develop and implement prospective and ongoing SSI surveillance, based on local case mix and clinical need. Device‐related surgical procedures should receive priority for surveillance.
5. Plan for implementation of pilot critical care‐acquired infection surveillance programmes, to inform the resources required to develop and implement prospective and ongoing critical care infection surveillance. Bloodstream infection surveillance and device‐related infection surveillance (vascular catheter‐related infection, ventilator‐associated pneumonia and catheter‐related urinary tract infections) should be prioritised.
8.3 Medium‐to‐Longer Term Priorities – Implement within the Next Five Years
1. Ensure that there is round‐the‐clock access in every hospital to the advice of an infection management specialist (clinical microbiologist, infectious diseases physician) and access to accredited microbiological laboratory services.4,6
2. A healthcare environment that promotes HAI prevention practices, including adequate space, isolation capacity and a physical environment conducive to decontamination is a critical component in safe patient care. Single‐patient room accommodation capacity should be reviewed within each hospital and plans put in place to minimise multiple‐patient room accommodation, in line with national guidelines.19
3. Ensure that any hospital information technology (IT) redevelopment plans incorporate modern technology such as; electronic prescribing with prescriber decision support, electronic patient records and laboratory information systems. Such developments have enormous potential to positively impact on suboptimal prescribing practices, medication errors, improve documentation, manage demand on resources and to reduce waste.
HSE‐Health Protection Surveillance Centre (HPSC) Tel: +353 1 8765 300 www.hpsc.ie 25‐27 Middle Gardiner Street, Dublin 1, Ireland. Fax: +353 1 856 1299 2012 ECDC PPS of HAI & AMU: IRELAND NATIONAL REPORT
P a g e | 58
4. Ensure that infection prevention and control, healthcare‐associated infection surveillance and antimicrobial stewardship staffing and initiatives are resourced appropriately.
5. Develop new and strengthen existing national reference laboratory capacity, to support the ongoing epidemiological surveillance and resistance monitoring of the key pathogens, frequently implicated in HAI, which includes but is not limited to; Clostridium difficile, Enterococcus spp., Enterobacteriaceae and Staphylococcus aureus.30,31,32
6. It is anticipated that the national PPS of hospital‐acquired infections and antimicrobial use may be repeated in five years.
a. In the interim, consideration should be given to annual participation in the ESAC Hospitals Care point prevalence survey of antimicrobial use, which is coordinated by the Irish Antimicrobial Pharmacists Group and the Health Protection Surveillance Centre.
b. In the interim, consideration should be given to performing periodic local mini‐prevalence surveys of hospital‐acquired infections on selected wards. The protocol and HAI definitions used in the 2012 PPS should be used for conducting repeat local surveys.
Table 8.1 demonstrates some key areas for immediate to short‐term improvement, with examples of indicators or measures to track improvement.
HSE‐Health Protection Surveillance Centre (HPSC) Tel: +353 1 8765 300 www.hpsc.ie 25‐27 Middle Gardiner Street, Dublin 1, Ireland. Fax: +353 1 856 1299 2012 ECDC PPS of HAI & AMU: IRELAND NATIONAL REPORT

P a g e | 59
Table 8.1: Key improvement areas and indicators to track improvement
Area Aim Element Example of indicator (s)
Focus on prevention of infection associated with vascular catheters/ IV lines
Good line insertion practices
Education and training of staff inserting IV lines Central line insertion checklists Improve hand hygiene before aseptic tasks
Presence of educational programme (i.e., hand hygiene / IV line insertion / aseptic technique)
% staff receiving education
% central lines inserted with completed checklist
Audit of checklist components
Hand hygiene audit results (breakdown by 5 moments and staff group)
Reduce number of IV lines that are no longer required
IV line maintenance care bundle Implementation of IV to oral antimicrobial switch policy
% wards implementing peripheral IV line bundle See below
Track IV line infection
Root cause/systems analysis of hospital‐acquired IV line related bloodstream infections (BSI) Surveillance of IV‐line related BSI
% IV line‐related BSI, where root cause analysis performed % BSI associated with IV lines IV line associated infection rates
Good antimicrobial stewardship
Improve antimicrobial prescribing
Implement IV to oral switch policy Implement the RCPI/RCSI antibiotic care bundle, which will be launched on 21st November 2012 Improve documentation of indication and duration of antimicrobials
Audit % prescriptions where IV to oral decision recorded at 48/72 hours Audit compliance with care bundle Audit % prescription where indication and review date recorded
Monitor antimicrobial consumption
Antimicrobial consumption surveillance
Hospital antibiotic consumption expressed as defined daily doses per 100 bed days used (DDD/100 BDU)
Surgical site infection
Prevent infection
Implement single dose surgical antimicrobial prophylaxis policy Implement RCSI quality improvement tool for prevention of SSI (due to be published late 2012) Monitor infection associated with surgery – if no surveillance programme in place, consider pilot
Audit % prescriptions where surgical prophylaxis is single dose Audit of tool elements Surgical site infection rates
HSE‐Health Protection Surveillance Centre (HPSC) Tel: +353 1 8765 300 www.hpsc.ie 25‐27 Middle Gardiner Street, Dublin 1, Ireland. Fax: +353 1 856 1299 2012 ECDC PPS of HAI & AMU: IRELAND NATIONAL REPORT

P a g e | 60
9.0 References
1. Umscheid CA, Mitchell MD, Doshi JA, Agarwal R, Williams K, Brennan PJ. Estimating the Proportion of Healthcare‐Associated Infections That Are Reasonably Preventable and the Related Mortality and Costs. Infect Control Hosp Epidemiol 2011;32:101‐114.
2. World Health Organisation. Guidelines on Hand Hygiene in Healthcare. 2009 ISBN 978 92 4 159790 6 http://www.who.int/gpsc/5may/tools/9789241597906/en/
3. Strategy for the Control of Antimicrobial Resistance in Ireland. Health Protection Surveillance Centre. Prevention of Intravascular Catheter‐related Infection in Ireland. December 2009. http://www.hpsc.ie/hpsc/A‐Z/MicrobiologyAntimicrobialResistance/InfectionControlandHAI/IntravascularIVlines/Publications/#d.en.4115
4. Health Information & Quality Authority. National Standards for the Prevention and Control of Healthcare Associated Infections: May 2009. http://www.hiqa.ie/standards/health/healthcare‐associated‐infections
5. Health Information & Quality Authority. National Standards for Safer Better Healthcare: June 2012. http://www.hiqa.ie/standards/health/safer‐better‐healthcare
6. Strategy for the Control of Antimicrobial Resistance in Ireland. Health Protection Surveillance Centre. Guidelines for Antimicrobial Stewardship in Hospitals in Ireland. December 2009. http://www.hpsc.ie/hpsc/A‐Z/MicrobiologyAntimicrobialResistance/StrategyforthecontrolofAntimicrobialResistanceinIrelandSARI/AntibioticStewardship/Publications/
7. Neidell MJ, Cohen B, Furuya Y, Hill J, Jeon CY, Glied S, Larson EL. Costs of Healthcare and Community Associated Infections With Antimicrobial Resistant Versus Antimicrobial Susceptible Organisms. Clin Infect Dis 2012;55:807‐815.
8. European Centre for Disease Prevention & Control & European Medicines Agency. ECDC/EMEA Technical Report. The bacterial challenge: Time to react – 2009. http://www.ecdc.europa.eu/en/publications/Publications/Forms/ECDC_DispForm.aspx?ID=444
9. McCabe WR, Jackson GG. Gram‐negative bacteraemia: etiology and ecology. Arch Int Med 1962;110:847‐852.
10. Centers for Disease Control and Prevention, National Healthcare Safety Network. Procedure‐associated Events: Surgical Site Infection (SSI) Event January 2012. http://www.cdc.gov/nhsn/CPTcodes/ssi‐cpt.html
11. Smyth ETM, McIlvenny G, Enstone JE, Emmerson AM, Humphreys, Fitzpatrick F et al. Four Country Healthcare Associated Infection Prevalence Survey 2006: overview of the results. J Hosp Infect 2008;69:230‐248.
12. Fitzpatrick F, McIlvenny G, Oza A, Newcombe RG, Humphreys H, Cunney R et al. Hospital Infection Society Prevalence Survey of Healthcare Associated Infection 2006: comparison of results between Northern Ireland and the Republic of Ireland. J Hosp Infect 2008;69:265‐273.
13. Health Service Executive ‐ Health Protection Surveillance Centre, Annual Report 2009. ISSN 1649‐0436. http://www.hpsc.ie/hpsc/AboutHPSC/AnnualReports/
14. Health Service Executive ‐ Health Protection Surveillance Centre, Annual Report 2010. ISSN 1649‐0436. http://www.hpsc.ie/hpsc/AboutHPSC/AnnualReports/
15. Health Protection Agency. (2012) English National Point Prevalence Survey on Healthcare Associated Infections and Antimicrobial Use, 2011: Preliminary Data. Health Protection Agency: London. http://www.hpa.org.uk/Publications/InfectiousDiseases/AntimicrobialAndHealthcareAssociatedInfections/1205HCAIEnglishPPSforhcaiandamu2011prelim/
HSE‐Health Protection Surveillance Centre (HPSC) Tel: +353 1 8765 300 www.hpsc.ie 25‐27 Middle Gardiner Street, Dublin 1, Ireland. Fax: +353 1 856 1299 2012 ECDC PPS of HAI & AMU: IRELAND NATIONAL REPORT

P a g e | 61
16. Health Protection Scotland. Scottish National Point Prevalence Survey of Healthcare Associated Infection and Antimicrobial Prescribing 2011. Health Protection Scotland, 2012 [Report]. http://www.hps.scot.nhs.uk/haiic/publicationsdetail.aspx?id=51028
17. Public Health Wales NHS Trust: Report of the Point Prevalence Survey of Antimicrobial Usage, Healthcare Associated Infections and Medical Device Usage, 2011 – Wales. http://www.wales.nhs.uk/sites3/page.cfm?orgid=379&pid=56207
18. Cunney R, Humphreys H, Murphy N. Survey of acute hospital infection control resources and services in the Republic of Ireland. J Hosp Infect 2006;64:63‐68.
19. Strategy for the Control of Antimicrobial Resistance in Ireland. Health Protection Surveillance Centre. Infection Prevention and Control Building Guidelines for Acute Hospitals in Ireland. 2009.
20. Scottish Intercollegiate Guidelines Network. Antibiotic Prophylaxis in Surgery. A National Clinical Guideline (104) July 2008. ISBN 978 1 905813 34 6. http://www.sign.ac.uk/guidelines/fulltext/104/index.html
21. National Institute of Clinical Excellence & National Collaborating Centre for Women’s and Children’s Health. Prevention and Treatment of Surgical Site Infection. October 2008. http://guidance.nice.org.uk/CG74/Guidance/pdf/English
22. Department of Health Advisory Committee on Antimicrobial Resistance and Healthcare Associated Infections (Antimicrobial Stewardship Subgroup). Antimicrobial Stewardship – ‘Start Smart ‐ Then Focus’. Guidance for Antimicrobial Stewardship in Hospitals (England); November 2011. http://www.dh.gov.uk/en/Publicationsandstatistics/Publications/PublicationsPolicyAndGuidance/DH_131062
23. Reinhart K, Bauer M, Riedemann NC, Hartog CS. New Approaches to Sepsis: Molecular Diagnostics and Biomarkers. Clin Microbiol Rev 2012;25:609‐634.
24. Morris D, Boyle F, Morris C, Condon I, Delannoy‐Vieillard AS, Power L et al. Inter‐hospital outbreak of Klebsiella pneumoniae producing KPC‐2 carbapenemase in Ireland. J Antimicrob Chemother 2012;67:2367‐2372.
25. O’Brien DE, Wrenn C, Roche C, Rose L, Fenelon C, Flynn A et al. First isolation and outbreak of OXA‐48‐producing Klebsiella pneumoniae in an Irish hospital, March to June 2011. Eurosuveill 2011;16(29):4‐6.
26. McDermott H, Morris D, McArdle E, O’Mahony G, Kelly S, Cormican M et al. Isolation of NDM‐1‐producing Klebsiella pneumoniae in Ireland, July 2011. Eurosurveill 2012;17(7):6‐8.
27. An Bord Altranais. Practice Standards and Guidelines for Nurses and Midwives with Prescriptive Authority. September 2010. http://www.nursingboard.ie/en/publications_current.aspx
28. Strategy for the Control of Antimicrobial Resistance in Ireland. Health Protection Surveillance Centre. Guidelines for the Prevention of Catheter‐associated Urinary Tract Infections. 2011. http://www.hpsc.ie/hpsc/A‐Z/MicrobiologyAntimicrobialResistance/InfectionControlandHAI/UrinaryCatheters/Publications/
29. Strategy for the Control of Antimicrobial Resistance in Ireland. Health Protection Surveillance Centre. Guidelines for the prevention of ventilator‐associated pneumonia in adults in Ireland. 2011. http://www.hpsc.ie/hpsc/Publications/
30. Strategy for the Control of Antimicrobial Resistance in Ireland. Health Protection Surveillance Centre. The Control and Prevention of MRSA in Hospitals and in the Community. 2005. http://www.hpsc.ie/hpsc/A‐Z/MicrobiologyAntimicrobialResistance/EuropeanAntimicrobialResistanceSurveillanceSystemEARSS/ReferenceandEducationalResourceMaterial/SaureusMRSA/Guidance/
HSE‐Health Protection Surveillance Centre (HPSC) Tel: +353 1 8765 300 www.hpsc.ie 25‐27 Middle Gardiner Street, Dublin 1, Ireland. Fax: +353 1 856 1299 2012 ECDC PPS of HAI & AMU: IRELAND NATIONAL REPORT

P a g e | 62
31. Health Protection Surveillance Centre. Clostridium difficile Sub‐Committee. Surveillance, Diagnosis and Management of Clostridium difficile‐associated disease in Ireland. 2008. http://www.hpsc.ie/hpsc/A‐Z/Gastroenteric/Clostridiumdifficile/Publications/#d.en.2936
32. RCPI Clinical Advisory Group for Healthcare Associated Infections and Antimicrobial Resistance. Guidelines for the control and prevention of multi‐drug resistant organisms, excluding MRSA, in the healthcare setting. Draft for consultation 2011. http://www.hpsc.ie/hpsc/A‐Z/MicrobiologyAntimicrobialResistance/InfectionControlandHAI/Guidelines/
HSE‐Health Protection Surveillance Centre (HPSC) Tel: +353 1 8765 300 www.hpsc.ie 25‐27 Middle Gardiner Street, Dublin 1, Ireland. Fax: +353 1 856 1299 2012 ECDC PPS of HAI & AMU: IRELAND NATIONAL REPORT

P a g e | 63
10.0 Appendices
Appendix A: PPS Steering Group Membership
Dr Karen Burns, Consultant Clinical Microbiologist, Health Protection Surveillance Centre (HPSC) & Beaumont Hospital (Chairperson & Report Author)
Ms Margaret Foley, PPS Data Manager, HPSC (Report Author)
Ms Sheila Donlon, Infection Prevention & Control Nurse Manager, HPSC (Report Author)
Ms Siobhan Dowling, Administrative Assistant, HPSC
Dr Fidelma Fitzpatrick, Consultant Clinical Microbiologist, HPSC, Beaumont Hospital & HSE & RCPI HCAI & AMR Clinical Programme Lead
Dr Robert Cunney, Consultant Clinical Microbiologist, HPSC & Children’s University Hospital
Ms Margaret Nadin, HSE HCAI & AMR Clinical Programme
Ms Mary O’Rourke‐Keenan, HSE HCAI & AMR Clinical Programme Business Manager
Mr Myles Houlden, IT Manager, HPSC
Mr Stephen Murchan, Surveillance Scientist, HPSC
Ms Anne Marie Meenan, Surveillance Scientist, Coombe Women & Infants University Hospital
Professor Hilary Humphreys, Consultant Clinical Microbiologist, Beaumont Hospital & Professor of Microbiology, Royal College of Surgeons in Ireland
Mr John Walsh, Infection Prevention & Control Nurse, Beaumont Hospital
Ms Mary Mooney, Infection Prevention & Control Nurse, Wexford General Hospital
Ms Marie T Kehoe, Regional General Manager, QPSD, HSE South
Ms Siobhan Barrett, Antimicrobial Pharmacist, Midwestern Regional Hospital, Limerick
Ms Clare MacGabhann, Interim Director of Nursing & Midwifery (Prescribing). Office of the Nursing & Midwifery Services Director
Ms Annette Cuddy, Assistant Director of Nursing & Midwifery (Prescribing). Office of the Nursing and Midwifery Services Director
Dr Caroline Fielding, Clinical Microbiology Specialist Registrar, Galway University Hospital
Dr Sarah Bergin, Clinical Microbiology Specialist Registrar, Cork University Hospital
Ms Ruth Maher, Head of Monitoring, HSE Quality & Patient Safety Directorate (QPSD)
HSE‐Health Protection Surveillance Centre (HPSC) Tel: +353 1 8765 300 www.hpsc.ie 25‐27 Middle Gardiner Street, Dublin 1, Ireland. Fax: +353 1 856 1299 2012 ECDC PPS of HAI & AMU: IRELAND NATIONAL REPORT

P a g e | 64
Appendix B: List of Acronyms
AMR Antimicrobial Resistance
AMU Antimicrobial Use
BMT Bone Marrow Transplant
BSI Bloodstream Infection
CAG Clinical Advisory Group
CDC US Centers for Disease Control and Prevention
CDI Clostridium difficile infection
CRE Carbapenem Resistant Enterobacteriaceae
CVC Central Vascular Catheter
DML Dublin Mid‐Leinster
DNE Dublin North‐East
EARS‐Net European Antimicrobial Resistance Surveillance Network
ECDC European Centre for Disease Prevention and Control
ED Emergency Department
EENT Eye, Ear, Nose, Throat or Mouth Infection
ESAC European Surveillance of Antimicrobial Consumption
ESBL Extended Spectrum β Lactamase
ESCMID‐ESGCD European Society for Clinical Microbiology and Infectious Diseases Study Group on C. difficile
EU European Union
FAQ Frequently‐asked Questions
GI Gastrointestinal
HAI Hospital‐Acquired Infections
HCAI Healthcare Associated Infections
HELICS Hospitals in Europe Link for Infection Control through Surveillance
HIQA Health Information & Quality Authority
HIS Hospital Infection Society
HPSC Health Protection Surveillance Centre
HSE Health Service Executive
IAPG Irish Antimicrobial Pharmacists Group
ICU Intensive Care Unit
ID Infectious Disease
IPCD Infection Prevention & Control Doctor
IPCN Infection Prevention & Control Nurse
HSE‐Health Protection Surveillance Centre (HPSC) Tel: +353 1 8765 300 www.hpsc.ie 25‐27 Middle Gardiner Street, Dublin 1, Ireland. Fax: +353 1 856 1299 2012 ECDC PPS of HAI & AMU: IRELAND NATIONAL REPORT

P a g e | 65
IQR Interquartile Range
KISS Krankenhaus‐Infektions‐Surveillance‐System, Germany
LOS Length‐of‐Stay
MDRO Multi‐Drug Resistant Organisms
MRSA Meticillin/Flucloxacillin Resistant Staphylococcus aureus
MSSA Meticillin/Flucloxacillin Susceptible Staphylococcus aureus
NHSN National Healthcare Safety Network
OR Odds Ratio
PHA Public Health Agency
PN Pneumonia
PPS Point Prevalence Survey
PVC Peripheral Vascular Catheter
RCPI Royal College of Physicians of Ireland
RCSI Royal College of Surgeons in Ireland
ROI Republic of Ireland
SSI Surgical Site Infection
SYS‐CSEP Systemic Infection – Clinical Sepsis
UTI Urinary Tract Infection
VAP Ventilator‐Associated Pneumonia
VRE Vancomycin Resistant Enterococci
VT Validation Team
WHO World Health Organisation
WTE Whole Time Equivalent
3GC Third‐Generation Cephalosporin
HSE‐Health Protection Surveillance Centre (HPSC) Tel: +353 1 8765 300 www.hpsc.ie 25‐27 Middle Gardiner Street, Dublin 1, Ireland. Fax: +353 1 856 1299 2012 ECDC PPS of HAI & AMU: IRELAND NATIONAL REPORT
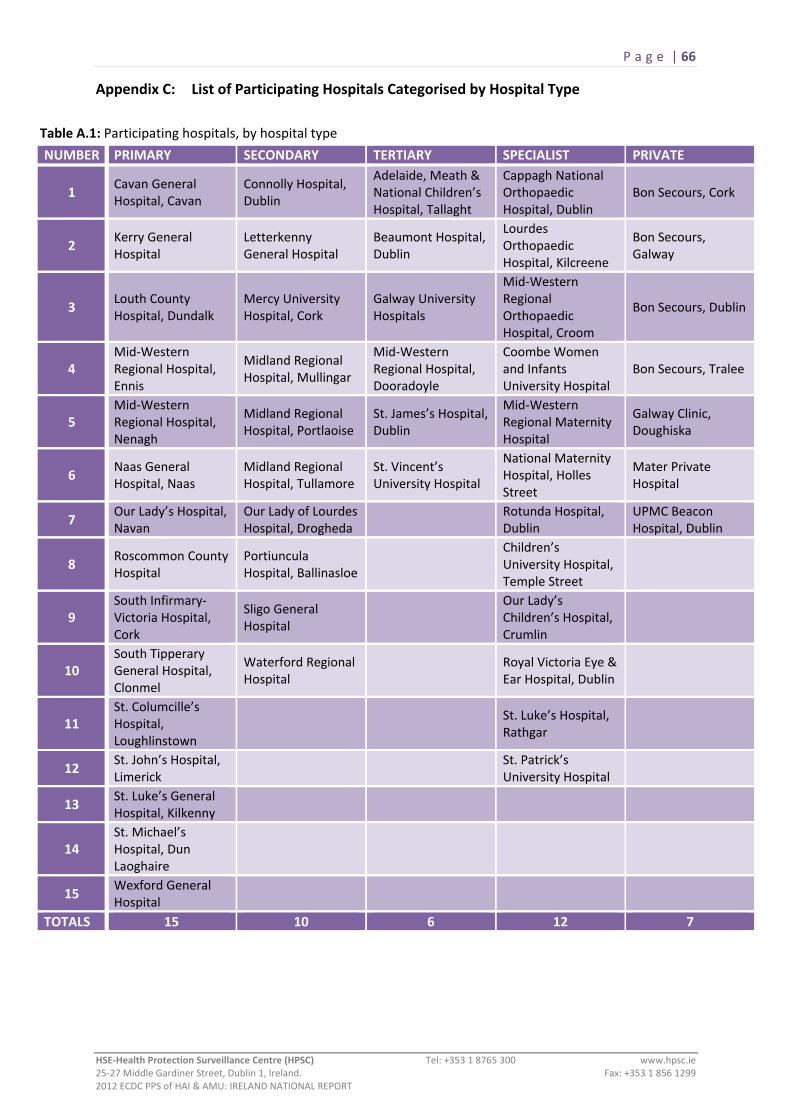
P a g e | 66
HSE‐Health Protection Surveillance Centre (HPSC) Tel: +353 1 8765 300 www.hpsc.ie 25‐27 Middle Gardiner Street, Dublin 1, Ireland. Fax: +353 1 856 1299 2012 ECDC PPS of HAI & AMU: IRELAND NATIONAL REPORT
Appendix C: List of Participating Hospitals Categorised by Hospital Type
Table A.1: Participating hospitals, by hospital type
NUMBER PRIMARY SECONDARY TERTIARY SPECIALIST PRIVATE
1 Cavan General Hospital, Cavan
Connolly Hospital, Dublin
Adelaide, Meath & National Children’s Hospital, Tallaght
Cappagh National Orthopaedic Hospital, Dublin
Bon Secours, Cork
2 Kerry General Hospital
Letterkenny General Hospital
Beaumont Hospital, Dublin
Lourdes Orthopaedic Hospital, Kilcreene
Bon Secours, Galway
3 Louth County Hospital, Dundalk
Mercy University Hospital, Cork
Galway University Hospitals
Mid‐Western Regional Orthopaedic Hospital, Croom
Bon Secours, Dublin
4 Mid‐Western Regional Hospital, Ennis
Midland Regional Hospital, Mullingar
Mid‐Western Regional Hospital, Dooradoyle
Coombe Women and Infants University Hospital
Bon Secours, Tralee
5 Mid‐Western Regional Hospital, Nenagh
Midland Regional Hospital, Portlaoise
St. James’s Hospital, Dublin
Mid‐Western Regional Maternity Hospital
Galway Clinic, Doughiska
6 Naas General Hospital, Naas
Midland Regional Hospital, Tullamore
St. Vincent’s University Hospital
National Maternity Hospital, Holles Street
Mater Private Hospital
7 Our Lady’s Hospital, Navan
Our Lady of Lourdes Hospital, Drogheda
Rotunda Hospital, Dublin
UPMC Beacon Hospital, Dublin
8 Roscommon County Hospital
Portiuncula Hospital, Ballinasloe
Children’s University Hospital, Temple Street
9 South Infirmary‐Victoria Hospital, Cork
Sligo General Hospital
Our Lady’s Children’s Hospital, Crumlin
10 South Tipperary General Hospital, Clonmel
Waterford Regional Hospital
Royal Victoria Eye & Ear Hospital, Dublin
11 St. Columcille’s Hospital, Loughlinstown
St. Luke’s Hospital, Rathgar
12 St. John’s Hospital, Limerick
St. Patrick’s University Hospital
13 St. Luke’s General Hospital, Kilkenny
14 St. Michael’s Hospital, Dun Laoghaire
15 Wexford General Hospital
TOTALS 15 10 6 12 7

P a g e | 67
HSE‐Health Protection Surveillance Centre (HPSC) Tel: +353 1 8765 300 www.hpsc.ie 25‐27 Middle Gardiner Street, Dublin 1, Ireland. Fax: +353 1 856 1299 2012 ECDC PPS of HAI & AMU: IRELAND NATIONAL REPORT
Appendix D: HAI & AMU Prevalence by Ward Specialty and Admitting Consultant Specialty Table A.2: Number of patients, HAI prevalence and AMU prevalence, by ward specialty
Ward Specialty Total
number of Patients
Number of Patients with
HAI
HAI Prevalence
(%)
Number of Patients with
AMU
AMU Prevalence
(%) Medical 3,042 146 4.8 1,110 36.5 General medicine 2,490 102 4.1 905 36.3 Cardiology/Coronary care unit 178 8 4.5 58 32.6 Oncology 178 18 10.1 66 37.1 Nephrology 60 6 10.0 22 36.7 Neurology 44 1 2.3 5 11.4 Respiratory 36 1 2.8 18 50.0 Haematology / BMT mix 19 5 26.3 14 73.7 Infectious diseases 11 ‐ ‐ 6 54.5 Hepatology 11 3 27.3 7 63.6 Haematology 9 2 22.2 7 77.8 Bone marrow transplantation 2 ‐ ‐ 2 100.0 Other medical 4 ‐ ‐ ‐ ‐
Surgical 1,980 133 6.7 802 40.5 General surgery 1,016 75 7.4 472 46.5 Orthopaedics 584 43 7.4 194 33.2 Urology 93 3 3.2 43 46.2 Cardiac surgery 68 4 5.9 16 23.5 Neurosurgery 60 6 10.0 12 20.0 Paediatric general surgery 48 ‐ ‐ 26 54.2 Burns care 25 1 4.0 8 32.0 ENT 17 1 5.9 8 47.1 Ophthalmology 13 ‐ ‐ 4 30.8 Transplantation surgery 13 ‐ ‐ 10 76.9 Vascular surgery 11 ‐ ‐ 1 9.1 Thoracic surgery 9 ‐ ‐ 1 11.1 Other surgery 23 ‐ ‐ 7 30.4
Obstetrics/Gynaecology 1,017 11 1.1 159 15.6 Obstetrics / Maternity 988 11 1.1 150 15.2 Gynaecology 29 ‐ ‐ 9 31.0
Augmented Care 419 69 16.5 211 50.4 Mixed General ICU 151 39 25.8 114 75.5 Medical ICU 2 ‐ ‐ 1 50.0 Surgical ICU 8 2 25.0 7 87.5 Specialised ICU 18 5 27.8 15 83.3 Neonatal ICU 101 11 10.9 27 26.7 Paediatric ICU 15 4 26.7 9 60.0 Other ICU 124 8 6.5 38 30.6 Paediatrics 407 10 2.5 153 37.6 General paediatrics 374 7 1.9 145 38.8 Neonatology 33 3 9.1 8 24.2 Psychiatric 456 7 1.5 25 5.5
Rehabilitation 142 8 5.6 16 11.3
Care of the elderly 161 7 4.3 31 19.3
Other specialty 819 33 4.0 330 40.3
Mixed specialties 587 43 7.3 271 46.2

P a g e | 68
HSE‐Health Protection Surveillance Centre (HPSC) Tel: +353 1 8765 300 www.hpsc.ie 25‐27 Middle Gardiner Street, Dublin 1, Ireland. Fax: +353 1 856 1299 2012 ECDC PPS of HAI & AMU: IRELAND NATIONAL REPORT
Table A.3: Number of patients, HAI prevalence and AMU prevalence, by admitting consultant specialty
Consultant Specialty Total
number of Patients
Number of Patients with
HAI
HAI Prevalence
(%)
Number of Patients with
AMU
AMU Prevalence
(%)
Medical 4,157 212 5.1 1,586 38.2 General medicine 2,121 88 4.1 809 38.1 Cardiology 355 11 3.1 88 24.8 Respiratory 351 13 3.7 166 47.3 Oncology 313 29 9.3 132 42.2 Gastroenterology 219 7 3.2 78 35.6 Endocrinology 197 10 5.1 70 35.5 Nephrology 134 13 9.7 58 43.3 Rheumatology 127 7 5.5 45 35.4 Neurology 110 3 2.7 16 14.5 Haematology 109 22 20.2 70 64.2 Infectious diseases 27 ‐ ‐ 15 55.6 Hepatology 24 2 8.3 10 41.7 Haematology / BMT* mix 20 6 30.0 15 75.0 Dermatology 11 ‐ ‐ 3 27.3 Bone marrow transplantation 2 ‐ ‐ 2 100.0 Other medical specialty 37 1 2.7 9 24.3
Surgical 2,346 190 8.1 1,043 44.5 General surgery 840 72 8.6 419 49.9 Orthopaedics 602 49 8.1 209 34.7 Urology 156 6 3.8 79 50.6 Vascular surgery 140 16 11.4 71 50.7 Digestive tract/bowel surgery 135 20 14.8 64 47.4 ENT 122 1 0.8 65 53.3 Neurosurgery 81 9 11.1 19 23.5 Cardiac surgery 70 8 11.4 25 35.7 Plastic and reconstructive surgery 48 4 8.3 28 58.3 Paediatric general surgery 40 1 2.5 22 55.0 Ophthalmology 31 1 3.2 8 25.8 Thoracic surgery 17 1 5.9 5 29.4 Maxillo‐facial surgery 15 ‐ ‐ 7 46.7 Burns care 12 1 8.3 4 33.3 Transplantation surgery 9 ‐ ‐ 6 66.7 Surgery for cancer 5 ‐ ‐ 2 40.0 Other surgical specialty 23 1 4.3 10 43.5
Obstetrics/Gynaecology 887 16 1.8 196 22.1 Obstetrics/Maternity 743 12 1.6 139 18.7 Gynaecology 144 4 2.8 57 39.6
Paediatrics 642 9 1.4 129 20.1 General paediatric 390 6 1.5 103 26.4 Neonatology 252 3 1.2 26 10.3
Psychiatric 460 7 1.5 25 5.4
Care of the Elderly 376 14 3.7 86 22.9
Neonatal Intensive Care 120 12 10.0 25 20.8
Rehabilitation 17 1 5.9 1 5.9
Other 25 6 24.0 17 68.0

P a g e | 69
Appendix E: PPS Data Collection Forms Ward List (Form A)
HSE‐Health Protection Surveillance Centre (HPSC) Tel: +353 1 8765 300 www.hpsc.ie 25‐27 Middle Gardiner Street, Dublin 1, Ireland. Fax: +353 1 856 1299 2012 ECDC PPS of HAI & AMU: IRELAND NATIONAL REPORT

P a g e | 70
Hospital Form (Form B)
HSE‐Health Protection Surveillance Centre (HPSC) Tel: +353 1 8765 300 www.hpsc.ie 25‐27 Middle Gardiner Street, Dublin 1, Ireland. Fax: +353 1 856 1299 2012 ECDC PPS of HAI & AMU: IRELAND NATIONAL REPORT

P a g e | 71
Patient Form (Form C) Page 1 of 3
HSE‐Health Protection Surveillance Centre (HPSC) Tel: +353 1 8765 300 www.hpsc.ie 25‐27 Middle Gardiner Street, Dublin 1, Ireland. Fax: +353 1 856 1299 2012 ECDC PPS of HAI & AMU: IRELAND NATIONAL REPORT

P a g e | 72
Patient Form (Form C) Page 2 of 3
HSE‐Health Protection Surveillance Centre (HPSC) Tel: +353 1 8765 300 www.hpsc.ie 25‐27 Middle Gardiner Street, Dublin 1, Ireland. Fax: +353 1 856 1299 2012 ECDC PPS of HAI & AMU: IRELAND NATIONAL REPORT

P a g e | 73
Patient Form (Form C) Page 3 of 3
HSE‐Health Protection Surveillance Centre (HPSC) Tel: +353 1 8765 300 www.hpsc.ie 25‐27 Middle Gardiner Street, Dublin 1, Ireland. Fax: +353 1 856 1299 2012 ECDC PPS of HAI & AMU: IRELAND NATIONAL REPORT

P a g e | 74
HSE‐Health Protection Surveillance Centre (HPSC) Tel: +353 1 8765 300 www.hpsc.ie 25‐27 Middle Gardiner Street, Dublin 1, Ireland. Fax: +353 1 856 1299 2012 ECDC PPS of HAI & AMU: IRELAND NATIONAL REPORT
Appendix F: Latest Available HCAI Surveillance Data for Ireland (Source: HPSC) Hand Hygiene Compliance & Alcohol Hand Rub Consumption:
http://www.hpsc.ie/hpsc/A‐Z/Gastroenteric/Handwashing/HandHygieneAudit/HandHygieneAuditResults/
http://www.hpsc.ie/hpsc/A‐Z/Gastroenteric/Handwashing/AlcoholHandRubConsumptionSurveillance/QuarterlyReports/
Hospital Antimicrobial Consumption:
http://www.hpsc.ie/hpsc/A‐Z/MicrobiologyAntimicrobialResistance/EuropeanSurveillanceofAntimicrobialConsumptionESAC/SurveillanceReports/
Clostridium difficile Infection Enhanced Surveillance:
http://www.hpsc.ie/hpsc/A‐Z/Gastroenteric/Clostridiumdifficile/CdifficileSurveillance/CdifficileEnhancedSurveillance/Reports/
Staphylococcus aureus Bacteraemia/Bloodstream Infection Surveillance:
http://www.hpsc.ie/hpsc/A‐Z/MicrobiologyAntimicrobialResistance/EuropeanAntimicrobialResistanceSurveillanceSystemEARSS/ReferenceandEducationalResourceMaterial/SaureusMRSA/LatestSaureusMRSAdata/
Surveillance of Key Antimicrobial Resistance Data by Pathogen and Year:
http://www.hpsc.ie/hpsc/A‐Z/MicrobiologyAntimicrobialResistance/EuropeanAntimicrobialResistanceSurveillanceSystemEARSS/EARSSSurveillanceReports/

P a g e | 75
HSE‐Health Protection Surveillance Centre (HPSC) Tel: +353 1 8765 300 www.hpsc.ie 25‐27 Middle Gardiner Street, Dublin 1, Ireland. Fax: +353 1 856 1299 2012 ECDC PPS of HAI & AMU: IRELAND NATIONAL REPORT
List of Tables
Table 2.1: Validation results for HAI and antimicrobial identification 4
Table 3.1: Participating hospitals categorised by ownership 5
Table 4.1: Participating hospitals; Overall demographic and activity data 8
Table 4.2: Participating hospitals; Overall infection prevention and control resources 8
Table 4.3: Participating hospitals; demographic and activity data, by hospital type 9
Table 4.4: Participating hospitals; infection prevention and control resources, by hospital type
9
Table 4.5: Number of surveyed wards, by ward specialty 10
Table 4.6: Number of patients surveyed, by ward specialty 12
Table 4.7: Number of patients surveyed, by admitting consultant specialty 12
Table 4.8: Number of patients surveyed, by McCabe Score 14
Table 4.9: Number of HAI per patient 15
Table 4.10: HAI prevalence, by gender, age and McCabe score 17
Table 4.11: HAI prevalence, by ward specialty 18
Table 4.12: HAI prevalence, by admitting consultant specialty 19
Table 4.13: HAI prevalence, by history of surgery since admission 19
Table 4.14: HAI prevalence, by length‐of‐admission prior to date of survey or HAI onset 20
Table 4.15: Number and percentage of HAI, by onset and origin 21
Table 4.16: Number, percentage and prevalence of HAI, by HAI type 22
Table 4.17: Number and percentage of device‐associated HAI 25
Table 4.18: Number of antimicrobials prescribed per patient 30
Table 4.19: Antimicrobial use prevalence, by gender, age and McCabe score 32
Table 4.20: Antimicrobial use prevalence, by ward specialty 33
Table 4.21: Antimicrobial use prevalence, by admitting consultant specialty 33
Table 4.22: Number and percentage of antimicrobials, by route of administration 34
Table 4.23: Number and percentage of prescribed antibacterials 36
Table 4.24: Number and percentage of prescribed antifungals 36
Table 4.25: Number and percentage of antimicrobials, by prescriber’s indication 37
Table 4.26: Number and percentage of antimicrobials prescribed for treatment of common infection types
40
Table 4.27: Agents prescribed for surgical antimicrobial prophylaxis 41
Table 4.28: Agents prescribed for medical prophylaxis 42
Table 4.29: Participating hospitals; overall prevalence of HAI and antimicrobial use 43

P a g e | 76
HSE‐Health Protection Surveillance Centre (HPSC) Tel: +353 1 8765 300 www.hpsc.ie 25‐27 Middle Gardiner Street, Dublin 1, Ireland. Fax: +353 1 856 1299 2012 ECDC PPS of HAI & AMU: IRELAND NATIONAL REPORT
Table 4.30: Participating hospitals; prevalence of HAI and antimicrobial use, by hospital type
44
Table 4.31: Prevalence of HAI and antimicrobial use, by participating hospital 45
Table 5.1: Methodological differences between the 2006 and 2012 point prevalence surveys
48
Table 5.2: 2006 and 2012 point prevalence surveys: comparable patient risk factor prevalence
49
Table 5.3: 2006 and 2012 point prevalence surveys: breakdown of infection types 49
Table 5.4: Estimate of the difference in national HAI prevalence between 2006 and 2012 PPS
50
Table 5.5: Previous ESAC PPS findings compared with ECDC 2012 PPS of AMU 50
Table 6.1: HAI prevalence and top five HAI reported by neighbouring countries 52
Table 6.2 Antimicrobial use reported by neighbouring countries 52
Table 8.1: Key improvement areas and indicators to track improvement 59
Table A.1: Participating hospitals, by hospital type 66
Table A.2: Number of patients, HAI prevalence and AMU prevalence, by ward specialty 67
Table A.3: Number of patients, HAI prevalence and AMU prevalence, by admitting consultant specialty
68
P a g e | 77
HSE‐Health Protection Surveillance Centre (HPSC) Tel: +353 1 8765 300 www.hpsc.ie 25‐27 Middle Gardiner Street, Dublin 1, Ireland. Fax: +353 1 856 1299 2012 ECDC PPS of HAI & AMU: IRELAND NATIONAL REPORT
List of Figures
Figure 4.1: Population pyramid: Percentage of patients surveyed, by age and gender 11
Figure 4.2: Percentage of patients surveyed, by history of surgery since admission and device utilisation
13
Figure 4.3: Prevalence of HAI risk factors in patients with HAI 16
Figure 4.4: Percentage of HAI, by HAI onset 21
Figure 4.5: Percentage of HAI, by HAI origin 21
Figure 4.6: Percentage of HAI, by HAI type 22
Figure 4.7: Percentage of SSI, by type 23
Figure 4.8: Percentage of pneumonia, by type 23
Figure 4.9: Percentage of UTI, by type 24
Figure 4.10: Percentage of primary BSI, by origin 25
Figure 4.11: Percentage of secondary BSI, by origin 25
Figure 4.12: Percentage of gastrointestinal infections, by type 26
Figure 4.13: HAI microorganism distribution 27
Figure 4.14: Percentage of Enterobacteriaceae isolates, by species 28
Figure 4.15: Microorganism breakdown, by key antimicrobial resistance markers 29
Figure 4.16: Prevalence of risk factors in patients on antimicrobials 31
Figure 4.17: Documented indication for the prescribed antimicrobial 35
Figure 4.18: Percentage of assessable prescriptions, compliant with local prescribing policy 35
Figure 4.19: Percentage of antimicrobials prescribed for treatment of infection, by origin of infection
37
Figure 4.20: Percentage of antimicrobials prescribed for treatment of infection, by site of infection
37
Figure 4.21: Number and cumulative percentage of antimicrobials prescribed to treat respiratory infections, including pneumonia and bronchitis
38
Figure 4.22: Number and cumulative percentage of antimicrobials prescribed to treat skin and soft tissue infections, including, wound and deep soft tissue infections
38
Figure 4.23: Number and cumulative percentage of antimicrobials prescribed to treat intra‐abdominal infections
39
Figure 4.24: Number and cumulative percentage of antimicrobials prescribed to treat cystitis or symptomatic lower urinary tract infections
39
Figure 4.25: Duration of surgical antimicrobial prophylaxis 41
Figure 4.26: HAI prevalence box plots, by hospital type 44
Figure 4.27: Antimicrobial use prevalence box plots, by hospital type 44