pocketdata: repeatable benchmarking for mobile data
TRANSCRIPT

PocketData: Repeatable Benchmarking for Mobile DataManagement Systems
Carl Nuessle, Grant Wrazen∗
, Lukasz Ziarek, Geoffrey Challen, Oliver KennedyUniversity at Buffalo
{grantwra, carlnues, lziarek, challen, okennedy}@buffalo.edu
ABSTRACTEmbedded database engines such as SQLite provide devel-opers with a common and convenient data persistence layer.They and the applications that use them have spread tomany types of systems, including interactive devices likesmartphones. Embedded databases appear in all major mo-bile operating systems. Their performance affects the re-sponse times and resource consumption of millions of smart-phone apps and billions of smartphone users. Given theirwide use and impact, it is critical that we improve embeddeddatabase engines by making them both faster and more effi-cient. As usual, the first step is determining how to measureexisting alternatives. We argue that traditional databasebenchmarking methods produce misleading results when ap-plied to mobile devices. To rectify this, we present Pocket-Data, a new benchmark for mobile data management basedon database usage metrics collected from actual user-facingdevices. Furthermore, we go step-by-step through numer-ous typical assumptions made when benchmarking server-class databases, show how these assumptions can producemisleading experimental results, and discuss how we ad-dressed each in PocketData. We present an analysis ofdifferent Android-compatible embedded databases and key-value stores and compare their features, performance, andresource consumption.
1. INTRODUCTIONGeneral-purpose, embedded database libraries like SQLite
and BerkeleyDB provide app developers with full relationaldatabase functionality, contained entirely within their app’snamespace. The power, simplicity, and self-contained na-ture of database libraries has led to an extensive deploy-ment across embedded, low-power devices. For example,consumer-oriented embedded devices like smartphones andtablets rely on SQLite to persist structured private data. Asanother example, many Internet of Things devices use a vari-
∗The first two authors contributed equally.
If This Variable ...Is This Result Affected?Is Changed... CPU Block Delay
Time Time TimeDatabase Used Yes Yes No
(SQLite or BDB)Benchmark Yes Yes No
Workload (A-H)Benchmark Yes, if CPUs No YesDelay Time Are Unpinned
CPUs: Pinned Yes, if Delay No Noor Unpinned Is Nonzero
Figure 1: Which Variables Affect Which Results.
ety of database libraries to push intelligence to the edge andreduce load on data harvesting infrastructures. As a conse-quence of their popularity, a plethora of database librarieshave emerged, targeting the embedded device space. Attime of writing, Wikipedia1 identified ten distinct databaselibraries for mobile platforms. Picking the right system fora given mix of structured data persistence and in-device an-alytics in can be overwhelming. Thus, we initially set outto do a measurement study comparing database libraries onsmartphones.
What we encountered (at first) was a minefield of unre-peatable or misleading experimental results caused by OSand hardware optimizations, background noise, and a hostof other factors, several of which are summarized in Fig-ure 1. In short, existing database benchmarking proto-cols [2, 14, 20], all of which target server-class databases,make fundamental assumptions about the environment inwhich they are run. These assumptions render them unsuit-able for benchmarking mobile data management systems.The primary contribution of this paper is an attempt to rec-tify the situation with a new mobile benchmarking toolkitcalled PocketData. Specifically, we outline a range of as-sumptions typically made when benchmarking server-classdatabases and show how these assumptions can create mis-leading results when benchmarking database libraries on em-bedded devices. The result is a toolkit for obtaining reli-able, reproducable results when evaluating data managementtechnologies on mobile platforms like smartphones, tablets,or IoT devices2. To build PocketData, we extended theAndroid Operating System Platform (AOSP) [3] with newlogging capabilities, control over relevant system properties,and a benchmark-runner app.
1https://en.wikipedia.org/wiki/Mobile database2Available for download at http://pocketdata.info

Feature Server-Class Pocket-ClassThroughput Relevant Irrelevant
Latency Relevant RelevantStartup Cost Irrelevant Relevant
Energy Relevant CrucialSimultaneous Clients 10k+ 1
Max Workload 100k+/s 100/sHardware Sharing None or VM Shared
Figure 2: Differences between evaluating databasesfor server-class and pocket-class workloads
Of course, we also convey the results of using Pocket-Data for a comparative evaluation of different database li-braries, as we had originally set out to do. Detailed re-sults are given in Section 4, but for the impatient: SQLiteand BerkeleyDB were clear winners among the databases wetested. Specifically, SQLite’s native C implementation madeit generally faster and more efficient per-query. However, be-cause it relies on a single global filesystem lock, BerkeleyDBwas faster on write-heavy and heavily parallel workloads.
The initial design of PocketData was based on the re-sults of a month-long user study [5], where participant’sphones were instrumented to log all queries processed bySQLite. One key insight from this work was that key-valuestore queries formed the majority of the workload: 24 out of179 distinct apps used only key-value queries, while the me-dian app’s workload was over 80% queries of this type. Thisled us to begin our exploration with YCSB [2], a popularbenchmark that targets key-value stores for cloud services.
Assumption #1: Performance at Saturation is Representative
The output of YCSB is a chart similar to the one in Fig-ure 3, and relates throughput and latency as progressivelymore load is applied to the system. Each point representsanother thread worth of load being offered to the database3.Specifically shown in Figure 3 are three database libraries(SQLite, BerkeleyDB, and H2) evaluated on YCSB’s work-load A (50% reads, 50% writes), with Java’s concurrent hashmap used as an upper-bound on performance. The point atwhich the slope of these elbow graphs begins to turn verticalis the point at which the system has reached saturation. Theresult is seemingly a clear victory for BerkeleyDB (BDB),which supports parallel updates and consequently scales tonearly an order of magnitude more throughput than SQLite.
However, actual query throughput on smartphones is farfrom the thousands of operations per second supported byBDB. Our user study [5] found smartphone database in-stances averaging 2 operations per second, with bursts ofat most a few hundred queries. Hence, the regime we areinterested in for mobile platforms falls below the maximumthroughput of even a single thread. At this scale, BDB’shigher per-query coordination overheads are more evident,and SQLite is competitive, or even faster in many cases.
This observation was the first of several that led us to be-lieve that a specialized benchmarking toolkit would be re-quired for mobile platforms. In this paper, we address thisneed by: 1. Identifying classical assumptions often madewhile benchmarking server-class database systems that donot scale down to mobile settings, 2. Introducing Pocket-Data, a common infrastructure for benchmarking mobile
3small points are individual runs, large points are averagesof 10 runs
SQLiteBerkeleyDBH2java.util.TreeMap
00
5
10
15
20
25
30
35
500 1000 1500 2000 2500Average Throughput (queries/sec)
Ave
rage
Lat
ency
(ms)
Regime of Interest
Figure 3: Typical visualization of database perfor-mance on YCSB workload A
data management solutions, and 3. Using PocketData toevaluate several popular database libraries.
2. THE POCKETDATA BENCHMARKIn March 2015, we conducted a user study [5] on the
PhoneLab smartphone experimental platform [11]. Overthe course of one month, 11 participants used an instru-mented Android smartphone as their primary device. AllSQL processed by Android’s built-in SQLite library wasanonymized, logged, and harvested when the phone wasplugged in. These results serve as the baseline and initialmotivation for our evaluation study and benchmark.
A key insight from this study was that the majority ofqueries recorded were effectively key-value store queries, ei-ther single-row equality-predicate lookups or full table scans.24 out of 179 distinct apps encountered during the studyused only queries of this type, while 80% of the median app’sworkload fit the same pattern. In short, mobile databaseworkloads are dominated by key-value style queries. Ac-cordingly, we decided to start with YCSB [2], an industrystandard key-value store benchmark.
A second insight from this study was that workloads arebursty, with short (1-2 second) periods of moderate (100sof queries) work, followed by longer periods of inactivity orlight background noise. Put differently, databases on mobiledevices almost never operate at saturation. This is in directcontrast to YCSB, which attempts to measure a through-put/latency curve that our measured workloads do not ap-proach. Hence, while we adapt and extend the six canonicalkey-value workloads (A-F) of YCSB, we develop our ownmobile-centric experimental protocol for performance mea-surement. The PocketData benchmark focuses on morecommon mobile device bottlenecks: CPU, IO, and QueryLatency. Query latency is a factor important for device re-sponsiveness [21], while CPU and IO represent shared re-sources. In addition to pressure from other apps, as well asthe app invoking the query, they also factor in to anothermajor bottleneck in mobile devices: power consumption.
Workloads. The YCSB benchmark [2] provides 6 canonicalworkloads (A-F). These workloads each feature a differentmix of operations including write (upsert a new record),append (add a new record with a monotonically increasingkey field), update (read one field of a record, modify it, and

Workload DescriptionYCSB-A 50% write, 50% read zipfianYCSB-B 5% write, 95% read zipfianYCSB-C 100% read zipfianYCSB-D 5% append, 95% read latestYCSB-E 5% append, 95% scan zipfianYCSB-F 50% update, 50% read zipfianPocket-G 40/10/10/40; TemporalPocket-H 40/10/10/40; Spatial
Figure 4: The six core YCSB key/value workloadsand two PocketData workloads
write it back), read (recover all fields of a record), and scan(read the 1000 records following a given key). A summaryof the distribution of operations for each workload is givenin Figure 4.
In addition to the six YCSB workloads, we add two micro-benchmark workloads (G-H) that use the YCSB schema andgenerate workloads consisting of 10% update, 10% insert,40% scan. This distribution matches results presented inour previous study [5]. The remaining 40% of the work-load follows one of two patterns: In Pocket-G, the remain-ing workload queries filter data based on a 1-dimensionalrange predicate, modeling a temporal query (e.g., GoogleMail or the Facebook news feed). In Pocket-H, the remain-ing workload queries filter data based on a 2-dimensionalrange predicate, modeling a spatial query (e.g., Maps).
As noted in the introduction, a single thread dedicatedto issuing queries produces query throughputs that are toohigh. Accordingly, we artificially reduce query throughputby sleeping the query thread according to one of three inter-query timing rates: 1. Zero delay, or performance at satu-ration, 2. A fixed 1ms delay in between queries, and 3. Alognormally distributed delay, mirroring typical app behav-ior in our previous study [5].
Benchmark Overview. The PocketData benchmarkingtoolkit is the result of extensive trials, validation, and refine-ment that we discuss in Section 3. For now, we provide ahigh-level overview of the benchmarking process.
The benchmark itself consists of a driver application anda rooted version of the standard Android platform with cus-tomized performance parameters. The application part ofthe benchmark connects to an embedded database througha modular driver. We have developed drivers for: 1. An-droid OS’s native SQLite integration, 2. BerkeleyDB andH2 through JDBC, 3. BerkeleyDB’s native key-value inter-face, 4. A naive in-memory key-value store implemented us-ing Java’s TreeMap and ConcurrentMap. The applicationoperates in two phases: initialization and query. On itsfirst run, the application initializes the database, creatingdatabase files (if needed), creating tables, and pre-loadinginitial data. After initializing the database the app finishesand exits.
When invoked a second time, the runner loads the work-load — a sequence of SQL statements — into memory. Thechoice to use a pre-defined, pre-loaded trace was made fortwo reasons. First, this ensures that overheads from work-load generation remain constant across experiments; thereis no cost for assembling the SQL query string representa-tion. Second, having the same exact sequence of queriesallows for repeatable experiments across database enginesand with different instrumentation configurations.
Optionally, query traces provided to the app may be an-
notated with an equivalent key-value operation (e.g., PUT,GET, SCAN). Annotated traces can be run on a key-valuebackend like BerkeleyDB’s native interface or our naive in-memory TreeMap-based store.
Reference Platform. All benchmark data presented isfrom a Nexus 5 device, running Android OS 5.1.1 (Lollipop),with 2GB of RAM, and a Quad-core 2.3 GHz CPU.
Metrics. Log data was collected using Android’s ftrace sys-tem. We instrumented the Android kernel and driver appli-cation to log and timestamp the following types of events:1. IO operations including FSync, Read, and Write; 2. Con-text switches into and out of the app’s namespace; 3. Changesin CPU voltage scaling; 4. Query start and end times; and5. (optionally) Inter-query delay start and end times.
Logging context switches allows us to track points wherethe app was scheduled on-core, track background applica-tion use, and see when cores are idling. This is crucial,as unlike in server-class database measurement, we are in-tentionally operating the embedded database at well belowsaturation. Logging intentional delays from the benchmarkworkload permitted examination of system activity duringperiods of requested delays.
The Cleanroom. In Section 3 we discuss, in depth, anoma-lies that we found while benchmarking these systems. In aneffort to help PocketData’s users to understand and ex-plain performance anomalies stemming from these issues, wedeveloped an additional configuration environment. This en-vironment, dubbed the “Cleanroom”, establishes a reliable,reproduceable baseline for measurements. In the Cleanroomenvironment, all cores (4 cores on the Nexus 5) on the de-vices are activated, pinned to their highest frequencies, andAndroid’s ability to manage the cores is disabled. The pur-pose of this setup is to identify behaviors relating to CPUfrequency changes – a commonplace occurrence on smart-phones – that affect the benchmark in the normal unpinnedsetting (which we call the “Real World”).
3. MOBILE BENCHMARKING 101: HOWTO DO IT (AND PITFALLS TO AVOID)
While designing PocketData, we found a number of keyassumptions often made when benchmarking server-class datamanagement systems that do not scale down to mobile de-vices. Broadly, the issues we found fall under three cate-gories. First, mobile devices rely on numerous Hardware-and OS-level optimizations for power management. Theseoptimizations not only create a noisy environment, but caninteract poorly with existing database optimizations. Sec-ond, benchmarking at the lower throughputs typical of mo-bile database workloads produces a far weaker signal, andthe effects of measurement activities like logging have a farmore pronounced effect on results. Finally, even small in-consistencies in test configurations can significantly impactexperimental outcomes on mobile platforms. We visit eachof these erroneous assumptions in turn, show their implica-tions on the results of an evaluation, and discuss how weavoid them in PocketData.
3.1 Frequency ScalingAs already discussed, we used database workloads with
short delays between queries to model the usage patternsseen in our prior study [5]. Once these delays were intro-duced, both total runtimes and total time spent off-core in-

SQLite
0ms1ms
lognormal BDB
0ms1ms
lognormal BDB100
0ms1ms
lognormal
0
5000
10000
15000
20000
25000
Tota
l Run
tim
e (m
s)
YCSB Workload CUnscheduled TimeCPU Time
(a) Realworld Configuration
SQLite
0ms1ms
lognormal BDB
0ms1ms
lognormal BDB100
0ms1ms
lognormal
0
2000
4000
6000
8000
10000
12000
14000
Tota
l Run
tim
e (m
s)
YCSB Workload C
Unscheduled TimeCPU Time
(b) Cleanroom Configuration
Figure 5: Results for YCSB Workload C. One result is presented for each delay parameter.
creased for all workloads, as might be expected. However,we started seeing an unexpected effect in workloads B-D(e.g., Figure 5) As expected, adding delays increased timespent off-core (light-red), but SQLite and BerkeleyDB spentmore time on-core (dark blue) as well. Was the increase inCPU requirements due to some additional computation orbatching optimizations?
Assumption #2: Assume a CPU Speed is (mostly) a constant
Battery-powered mobile devices such as the Nexus 5 re-main perpetually concerned with conserving energy usage.As such, they employ a feature called frequency scaling thatallows the operating system to adjust CPU performance dy-namically. During periods of low load, the OS can lowerCPU frequencies or disable CPU cores altogether. The OSmakes this decision on the basis of factors such as core satu-ration and length of scheduler queue. Although this reducesperformance, it also reduces power consumption and pro-longs battery life. The issue is critical enough that mobilephones have many speeds to support changing demands (theNexus 5 has 14) and change them frequently. By contrast,a saturated server-class machine has less reason to considerenergy conservation and scales infrequently, if at all.
This CPU frequency scaling plays a significant role in em-bedded database performance. Repeated idling – such asthose that occur in typical mobile bursty database usagepatterns – are interpreted by the OS as a lack of work to bedone and a signal to scale down cores to save power. Addi-tionally, the scaling operation is itself expensive: No activitycan be scheduled for several milliseconds while the core isscaled up or down. Hence, the database takes a double per-formance hit: first from having a slower CPU and secondfrom having the core scaled up. Ironically, this means thata database can improve latencies by being less efficient.
We needed to confirm, however, that frequency scalingwas the cause of the changes in CPU time that we observedwhen running our benchmark tests. Hence, we ran all (72)of our tests under two different settings: One with all CPUcores manually enabled and pinned (the Cleanroom), andagain with the CPUs unpinned and left to normal OS man-agement (the Real World). The result was that, with CPUspinned (the Cleanroom), the variance across delay settingsdisappeared: CPU time was essentially the same, for a givendatabase and a given workload, for all 3 delays (zero de-lay, 1ms and lognormal). Figures 5a and 5b illustrate this
pattern: the changes in CPU time observed in the formerdisappear with in the later. Put differently, CPU scaling, aproduct of typical usage patterns, significantly impacts CPUtime and system performance on mobile devices.
Had we run a benchmarking study based on a more tradi-tional modeling that would have kept the CPUs saturated,we would only have gotten the simpler, but misleading, set ofresults from the Cleanroom setting. We would have missedthe significant variations in CPU time that result from thefrequency scaling that are endemic to lightly loaded mobiledevices (but alien to traditional database servers).
3.2 Mobile Benchmarking Artifacts Are HugeIn debugging frequency scaling, we wanted to measure
how much more on-core time was spent processing queries.To confirm the exact amount, we injected event markers be-fore and after each delay period. This allowed us to confirmthat the total delay time for a particular run remains essen-tially invariant across configurations involving different com-binations of databases, workloads, and CPU pin settings.We discuss this issue in depth in Section 4.2 below. Theinjection of these trace markers, used to study nonsched-uled time, not unsurprisingly affected CPU time. What wassurprising was the magnitude of the effect.
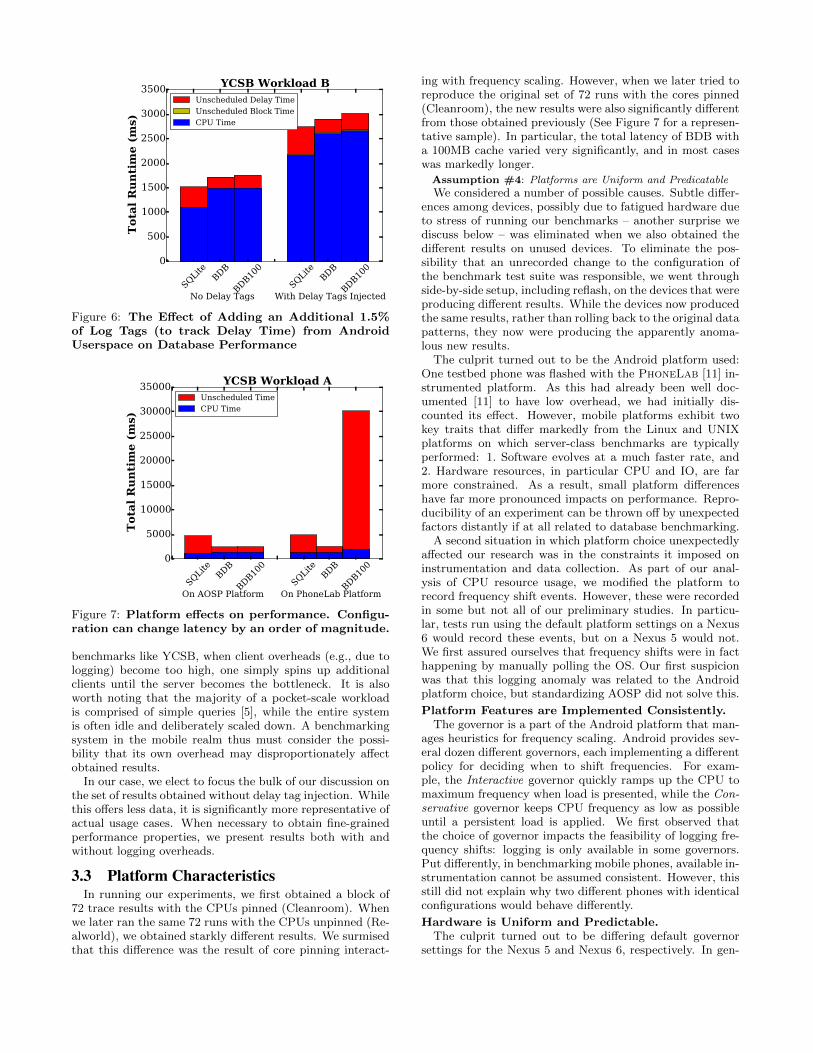
Figure 6 illustrates the effect starkly. We compare runs forworkload B with CPUs unpinned (Realworld) and with zerodelay. The result set obtained when injecting the additionaltrace markers shows significantly poorer performance. Theadditional loglines comprised 3598 lines, or about 1.9% ofthe total. The impact on CPU time and latency was farhigher: CPU time for SQLite and BDB increased by 97%and 75%, and total latency by 75% and 69% respectively.
Assumption #3: All measurement overheads are the same
The reason for this outsized effect is the mobile platformitself. While the bulk of our data collection was performedentirely within the the Linux ftrace framework, injection ofdelay start and stop times originated at the app level. Com-pared to the majority of the log; log messages originatingwithin the app have additional overheads from the managedAndroid platform, and in particular the transition betweenmanaged and native code. This type of error is unique to em-bedded database libraries, which necesarilly operate withinthe scope of the application. By contrast, in server-class
No Delay TagsSQLit
eBDB
BDB100
With Delay Tags InjectedSQLit
eBDB
BDB100
0
500
1000
1500
2000
2500
3000
3500
Tota
l Run
tim
e (m
s)
YCSB Workload BUnscheduled Delay TimeUnscheduled Block TimeCPU Time
Figure 6: The Effect of Adding an Additional 1.5%of Log Tags (to track Delay Time) from AndroidUserspace on Database Performance
On AOSP PlatformSQLit
eBDB
BDB100
On PhoneLab PlatformSQLit
eBDB
BDB100
0
5000
10000
15000
20000
25000
30000
35000
Tota
l Run
tim
e (m
s)
YCSB Workload AUnscheduled TimeCPU Time
Figure 7: Platform effects on performance. Configu-ration can change latency by an order of magnitude.
benchmarks like YCSB, when client overheads (e.g., due tologging) become too high, one simply spins up additionalclients until the server becomes the bottleneck. It is alsoworth noting that the majority of a pocket-scale workloadis comprised of simple queries [5], while the entire systemis often idle and deliberately scaled down. A benchmarkingsystem in the mobile realm thus must consider the possi-bility that its own overhead may disproportionately affectobtained results.
In our case, we elect to focus the bulk of our discussion onthe set of results obtained without delay tag injection. Whilethis offers less data, it is significantly more representative ofactual usage cases. When necessary to obtain fine-grainedperformance properties, we present results both with andwithout logging overheads.
3.3 Platform CharacteristicsIn running our experiments, we first obtained a block of
72 trace results with the CPUs pinned (Cleanroom). Whenwe later ran the same 72 runs with the CPUs unpinned (Re-alworld), we obtained starkly different results. We surmisedthat this difference was the result of core pinning interact-
ing with frequency scaling. However, when we later tried toreproduce the original set of 72 runs with the cores pinned(Cleanroom), the new results were also significantly differentfrom those obtained previously (See Figure 7 for a represen-tative sample). In particular, the total latency of BDB witha 100MB cache varied very significantly, and in most caseswas markedly longer.
Assumption #4: Platforms are Uniform and Predicatable
We considered a number of possible causes. Subtle differ-ences among devices, possibly due to fatigued hardware dueto stress of running our benchmarks – another surprise wediscuss below – was eliminated when we also obtained thedifferent results on unused devices. To eliminate the pos-sibility that an unrecorded change to the configuration ofthe benchmark test suite was responsible, we went throughside-by-side setup, including reflash, on the devices that wereproducing different results. While the devices now producedthe same results, rather than rolling back to the original datapatterns, they now were producing the apparently anoma-lous new results.
The culprit turned out to be the Android platform used:One testbed phone was flashed with the PhoneLab [11] in-strumented platform. As this had already been well doc-umented [11] to have low overhead, we had initially dis-counted its effect. However, mobile platforms exhibit twokey traits that differ markedly from the Linux and UNIXplatforms on which server-class benchmarks are typicallyperformed: 1. Software evolves at a much faster rate, and2. Hardware resources, in particular CPU and IO, are farmore constrained. As a result, small platform differenceshave far more pronounced impacts on performance. Repro-ducibility of an experiment can be thrown off by unexpectedfactors distantly if at all related to database benchmarking.
A second situation in which platform choice unexpectedlyaffected our research was in the constraints it imposed oninstrumentation and data collection. As part of our anal-ysis of CPU resource usage, we modified the platform torecord frequency shift events. However, these were recordedin some but not all of our preliminary studies. In particu-lar, tests run using the default platform settings on a Nexus6 would record these events, but on a Nexus 5 would not.We first assured ourselves that frequency shifts were in facthappening by manually polling the OS. Our first suspicionwas that this logging anomaly was related to the Androidplatform choice, but standardizing AOSP did not solve this.
Platform Features are Implemented Consistently.The governor is a part of the Android platform that man-
ages heuristics for frequency scaling. Android provides sev-eral dozen different governors, each implementing a differentpolicy for deciding when to shift frequencies. For exam-ple, the Interactive governor quickly ramps up the CPU tomaximum frequency when load is presented, while the Con-servative governor keeps CPU frequency as low as possibleuntil a persistent load is applied. We first observed thatthe choice of governor impacts the feasibility of logging fre-quency shifts: logging is only available in some governors.Put differently, in benchmarking mobile phones, available in-strumentation cannot be assumed consistent. However, thisstill did not explain why two different phones with identicalconfigurations would behave differently.
Hardware is Uniform and Predictable.The culprit turned out to be differing default governor
settings for the Nexus 5 and Nexus 6, respectively. In gen-

eral, OS and hardware vendors will work together to selectheuristics that make sense for a given piece of hardware.For example, a more inefficient governor might be used ona device designed with a large battery to give the impres-sion of better performance. The issue of governor choice alsohighlights a second lesson: mobile devices are not only re-source limited, they can be feature limited, and these toolsetlimits can hamper experiments. Surprisingly, such distinc-tions can even appear on seemingly identical devices [19].Small differences in CPU manufacturing quality can lead tosignificant differences in the chip’s performance profile andthermal characteristics.
3.4 Hardware LimitationsThe hardware in our case is obviously starkly different
from that of the traditional database model: it is a small em-bedded device not designed for heavy workloads. We burnedout multiple devices during the runs; Even with the thermalprotection built in to the Nexus devices, the ongoing loadof the runs proved too much. Mobile benchmark makersneed to be aware that extensive stress testing is often sim-ply beyond the capabilities of the devices studied. At thevery least, researchers should have a steady supply of testdevices.
Related to this, we observed that phones at a hardwarelevel periodically ignore requests made at the software levelto pin CPUs and force minor frequency downshifting to pre-vent thermal burnout. While the effect was slight, it waspresent and unavoidable. Traditional database studies canassume that the hardware is designed for and can deliverthe requested maximum output. A mobile benchmark – ab-sent refrigeration that would be unrepresentative of typicalusage – cannot expect this. More generally, mobile studiesmust be aware that the results they get may be the resultof conditions different from those that they request. This istrue even when attempting to control for all factors, as inour cleanroom configuration.
3.5 Garbage CollectionGarbage collection (GC) can be a source of potential slow
down for apps, especially if they leverage a lot of heap space.However, in our experiments GC rarely played a significantrole. Where we did see GC interference was during the setupphase of our experiments, namely during workload genera-tion prior to the queries being executed. While individ-ual GC delays could be significant, with pauses upwards of50ms during workload generation. We observed no signifi-cant pauses during the measured portion of the benchmarks.If GC did occur, it was scheduled on a core, for our phonesthis was core 4, which was not executing our benchmark.We suspect GC will be a larger issue if a query workload iscoupled with a computation.
4. RESULT OVERVIEWWe begin with a high-level overview of our results. The
sets of stacked graphs (Figures 5, 8 - 9, 11 and 12) showmacro-scale database performance in terms of three broadmetrics: Latency, or the total time needed to execute thecomplete workload, is a measure of responsiveness. Lowerlatencies mean snappier interfaces and less total time spentactive. CPU Time, or the total time the benchmark appis actively using the CPU, impacts latency but also mea-sures of how cooperative the database is. For a given total
latency, a lower CPU time helps overall device performanceand efficiency. In this situation, the process is I/O bound– hence either background tasks can be scheduled and runor voltage scaling can be used to reduce power consumptionif there are few currently runnable tasks. Nonscheduledtime is the time the benchmark is idle but not yet complete,and is a combination of blocking for IO, plus blocking delaysexplicitly requested by the workload. As previously noted,the logging required to explicitly distinguish blocking for IOand workload delays is infeasible, so in our main discussion,these times are combined and reported jointly as nonsched-uled time. We also, however, report and draw results froman analagous set of graphs of all runs with blocking and de-lay times separated. I/Os, or the number of fsyncs, reads,and writes, impact latency and also measure the amount ofwear and tear on the phone’s SSD and suggest opportuni-ties for removing costly transfers of data between levels ofthe memory hierarchy. The volume and pattern of I/Os alsooffers insight into blocking latency.
4.1 Platforms TestedWe evaluated 4 storage solutions, including 3 databases:
(1) SQLite, the native provider for Android’s relational per-sistent storage library, (2) BerkeleyDB-SQL (BDB), a pop-ular embedded on-disk transactional key-value store with aSQL interface, (3) H2, a multi-purpose open-source embed-ded relational database engine, and (4) Java’s TreeMapfor comparison, a purely in-memory key-value data struc-ture, using Java serialization for inter-run persistence. Weadditionally explore a configuration variant of the base sys-tems. BerkeleyDB uses a low 256k default upper limit on itsin-memory cache. In addition to this default configuration,we evaluate a configuration (BDB100) compiled to use a100MB cache.
In practice, H2 performed quite poorly compared to itsalternatives. Latency for given workloads was higher in ev-ery case, sometimes sharply more, than that of all othertested solutions (Figure 3). As one of the end goals of ourstudy is to help developers identify good storage solutions,we therefore omit detailed analysis of H2 from subsequentdiscussion. In contrast, the TreeMap key-value not sur-prisingly strongly outperformed its alternatives. While itsmetrics serve as an upper bound on storage solution perfor-mance, TreeMap lacks durability and is thus also omittedfrom further study.
4.2 Configurations UsedThe balance of the paper therefore concerns itself with
an evaluation of SQLite, BDB with standard cache, andBDB with a 100MB cache (BDB100). These 3 platformswere each evaluated under 8 workloads – the 6 cannonicalYCSB benchmark suites (A-F) and the two custom work-loads (Pocket-G, Pocket-H ) – for each of 3 delay scenarios(zero delay, 1ms, and lognormal time). For each of these 72setups, the following results were calculated: CPU runtime,nonscheduled time, and total benchmark runtime (latency).This group of 72 setups in turn was evaluated in both corepinned (cleanroom) and unpinned (realworld) settings. Fi-nally, we re-ran each of these 144 combinations, this timetracking the amount of benchmark delay times so as to sep-arate this from blocking nonscheduled time.
These combinations produced a total of 288 experiments

that were obtained and analyzed4. In total, there were 5dimensions that contributed to the configuration of a runthat produced a single tracefile: the database used (SQLite,BDB, or BDB with 100MB cache), the benchmark test (YCSBA-F or Pocket-G/ 2), the intra-query delay used (0, 1ms orlognormal), the core pin setting (cleanroom or realworld),and the delay monitoring setting (recorded or not). Fromthe tracefiles obtained, we also calculated for all 3 platformsunder 8 workloads, the number and type of block-level I/Oevents were obtained for these 24 situations under 1ms delay– we unsurprisingly observed that the the number and typeof I/O events does not vary appreciably due to benchmarkdelay time or core pinning setting
In our discussion, we focus on the group of 72 tracefilesobtained in the core unpinned (Realworld) setting and with-out injection of benchmark start and stop delay tags Thiswas selected for two reasons. First, it represents what appswill most often deal with in actual usage, based on the in-termittent delays observed in our previous mobile databaseusage study [5].
Second, it illustrates the effect of benchmark delays onCPU runtime. In the unpinned (Cleanroom) case, thesedelays trigger frequency scaling that in turn significantlyaffects observed CPU time. In the pinned scenario, CPUruntime for a given database and workload is essentially un-affected in most cases by changing benchmark delay times,as discussed previously in section 3.1. Overall latency andnonscheduled time also remain essentially constant, asidefrom the added delay time itself.
The tracefiles that contain benchmark delay start and stoptags are useful to confirm this, as the total amount of un-scheduled time for each run is essentially fixed. The 1msdelay workload introduces 2s of delay, while the lognormaldelay setting introduces 12s. This means that, for a given de-lay setting, meaningful differences observed in non-scheduledtime are due to other factors such as I/O blocking.
However, the injection of benchmark start and stop timesfrom the app level noticeably affects the results themselves.As discussed previously in section 3.2, this instrumentationincreases the observed CPU time significantly due to plat-form overhead. We therefore focus the bulk of our studyon the trace results that were obtained without injection ofstart and stop tags. This situation is reflective of typical us-age situations, and we have already obtained confirmationof the static effect of benchmark delays.
4.3 Results ObtainedHeavily Read Favored Workloads. To summarize ourfindings, SQLite exhibits better latencies than BDB underthe YCSB workloads that are very read intensive: B, C, Dand E. C is read-only; in the other three, reads account for95% of operations. The better performance of SQLite inthese cases is always attributable to CPU time savings inexecuting database code. In two of these cases, workloadsB and D, the total nonscheduled time of SQLite is notablylonger than that of BDB: SQLite actually blocks more onIO than BDB. However, in both of these cases, this delay isoutbalanced by CPU time savings. A second general obser-vation is that SQLite strongly outperforms BDB in work-loads involving scans. This is evident in the low CPUtime
4Obviously, due to space limitations we do not report thefull suite of experimental results here. All results may beobtained at http://pocketdata.info
and total latency of SQLite in workload E, which substitutesscans in lieu of general reads.
Looking at the read-only workload, C, we focus on resultsobtained under the realworld (cores unpinned) setting (Fig-ure 5a). The latencies of all 3 databases when executingonly read operations are due nearly entirely to CPU time(plus explicit benchmark delays). The results of the 3 zero-delay cases in 5a exhibits this most clearly; there is littlenon-scheduled time. The non-scheduled times for the 1msand lognormal cases for all 3 databases, when compared tothat of the zero delay case, took approximately 2s and 12slonger respectively, i.e. essentially the totals of the delaysrequested by the benchmark app. There was very little I/Oactivity under C, nearly all of it immediately at the startof the workload. Hence, I/O operations did not contributesignificantly to subsequent performance differences. We ob-serve that, for typical mobile DB usages, read requests canbe serviced mostly from cache and there is little blocking.This exposes the lower CPU time of SQLite compared tothat of BDB.
The nonscheduled times that are explicitly requested bythe benchmark app in the 1ms and lognormal delay caseshave two effects that we observe across all databases and8 workloads. Unsurprisingly, the nonscheduled time of agiven run increases by the total amount of the delays: ap-proximately 2s and 12s respectively. Additionally however,CPU time for all 3 databases also increases with an increasein benchmark delay times. It climbs from 1s-1.4s under thezero-delay case to about 3.4s-3.6s for 1ms delay and 6.1s-9.3s for lognormal. By contrast, CPU times remain essen-tially fixed in the face of different benchmark delay timeswhen CPU cores are pinned (see Figure 5b). The resultof frequency scaling with cores unpinned is that decreasingtemporal locality of queries hurts performance. Takeaway:For typical mobile workload situations that are read-only,SQLite is notably the better choice. Apps for all 3 databasesshould consider batching requests to improve performance.
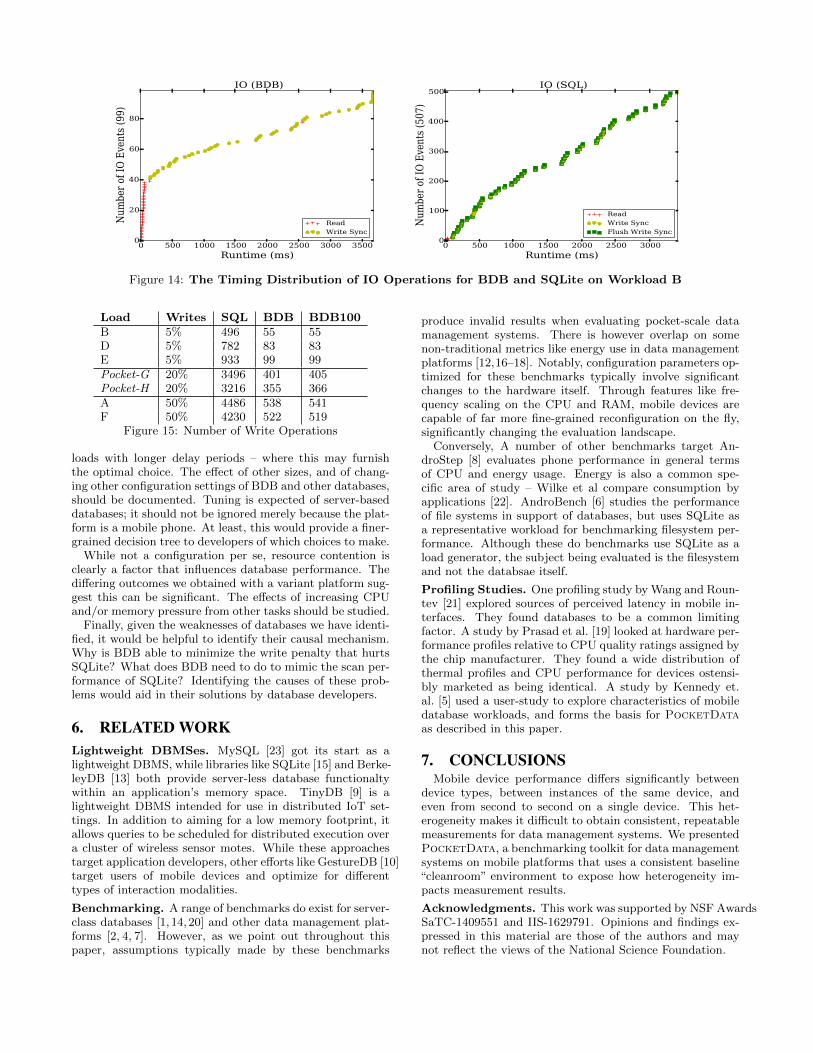
In workloads B, D, E, which all contain 5% write opera-tions, SQLite continues to exhibit better performance thanBDB. We discuss the results of workload B first (see Figure8a). SQLite again shows better performance in both CPUtime and latency for workload B. As before, CPU time scaleswith an increase in delay time for all databases. In termsof I/O operations, BDB commenced with 44 reads under B,similar to that under C. However, it also performed 55 writeoperations during the rest of the run (Figure 10a). SQLalso started with a batch of reads (11), but added 496 addi-tional writing operations. These results, obtained using 1msdelays, are virtually identical across delay settings.
Figure 14 illustrates the chronological distribution of theseI/O events. The pattern of BDB and SQLite commencingwith about 45 and 10 read operations respectively, with eachfollowed by a significantly varying number of write opera-tions, is common to all database - workload combinations.Hence we focus our further interest on the number of writesand their effect.
We now look at the effect of introducing write operationsby comparing the results of B with C in three areas. First,looking at CPU time, the results for B and C are similar forthe zero and lognormal delay cases. While CPU times under1ms delay are somewhat different, this variance appears tobe an anomaly peculiar to this workload: We observe thatthe CPU times for B track those of C for all 3 delay settings

Zero DelaySQLit
eBDB
BDB100
1ms DelaySQLit
eBDB
BDB100
Lognormal DelaySQLit
eBDB
BDB100
0
5000
10000
15000
20000
25000
Tota
l Run
tim
e (m
s)
YCSB Workload BUnscheduled TimeCPU Time
(a) Realworld Configuration
Zero DelaySQLit
eBDB
BDB100
1ms DelaySQLit
eBDB
BDB100
Lognormal DelaySQLit
eBDB
BDB100
0
2000
4000
6000
8000
10000
12000
14000
Tota
l Run
tim
e (m
s)
YCSB Workload BUnscheduled TimeCPU Time
(b) Cleanroom Configuration
Figure 8: Results for YCSB Workload B. One result is presented for each delay parameter.
Zero DelaySQLit
eBDB
BDB100
1ms DelaySQLit
eBDB
BDB100
Lognormal DelaySQLit
eBDB
BDB100
0
5000
10000
15000
20000
25000
Tota
l Run
tim
e (m
s)
YCSB Workload DUnscheduled TimeCPU Time
(a) Realworld time spent by Workload D
Zero DelaySQLit
eBDB
BDB100
1ms DelaySQLit
eBDB
BDB100
Lognormal DelaySQLit
eBDB
BDB100
0
10000
20000
30000
40000
50000
60000
70000
Tota
l Run
tim
e (m
s)
YCSB Workload EUnscheduled TimeCPU Time
(b) Realworld time spent by Workload E
Figure 9: Realworld Configuration results for YCSB Workloads D and E.
when the cores are pinned (compare the sets of Cleanroomresults in Figure 8b with 5b).
Second, comparing benchmark delay times for B and C(nearly 0 for zero delay, 2s total for 1ms delay, and 12s totalfor lognormal delay), these also remain essentially constant,as they do across all workloads and all databases for a givendelay setting. We have discussed this general observationpreviously in sections 3.2 and 4.2.
The third area of comparison between B and C, the non-scheduled, non-benchmark delay time, is higher for B thanfor C for all three databases. Additionally, this additionaldelay for B is proportionately higher still for the SQLitecases than for the two BDB runs. It is not, however, enoughto cancel out the overall advantage of SQLite. We observethat, unlike reads, even a small proportion of writes (5%)incurs significant blocking penalties on mobile databases.Secondly, we note that BDB appears better to handle thispenalty than does SQLite. This is the beginning of a deeptrend that carries through most workloads.
The results of workload D follow this pattern (See fig-ure 9a). The comparative results of workload D are largelysimilar to the observations made from B: SQLite outper-forms BDB in both CPU time and total latency. CPUtime for workload D is similar to that for C in all 3 de-
lay scenarios. Nonscheduled time for workload D grows forall 3, but proportionately more so for SQLite. I/O underBDB was also nearly the same as under workload B (Figure10a); as with B, the performance edge of SQL is not re-tarded by a magnitude greater count of IO’s. As before, thegreater increase in non-scheduled time for SQLite comparedto BDB is not enough to outweigh the CPU time advantageof SQLite. Takeaway: As always, apps on lightly loaded de-vices should consider batching requests. Introducing writesinto database operations increases the nonscheduled time forall database cases, but particularly for SQLite. However, formobile DB usages with a relatively low proportion of writeoperations, SQLite remains the better choice of databases.
Workload E results differ significantly from previous re-sults in two respects. First, observed latencies for bothdatabases and all delay settings for workload E were muchhigher for both databases compared to those of workloadsB, C, and D. All of these cases include 5% write operationsas before. The load of I/O operations also remained similar(Figure 10a). However, workload E reads are scan opera-tions. The increase in latency for workload E is mostly dueto sharply higher CPU time, with marginally greater non-scheduled non-benchmark delay time, as shown most clearlyby the zero-delay case. This penalty is due to additional ac-

Workload BSQLit
eBDB
BDB100
Workload DSQLit
eBDB
BDB100
Workload ESQLit
eBDB
BDB100
0
200
400
600
800
1000
Num
ber
of I
O O
pera
tion
s Read OperationsWrite Operations
(a) I/O Ops Under Workloads B, D, and E
Workload Pocket-GSQLit
eBDB
BDB100
Workload Pocket-HSQLit
eBDB
BDB100
0
500
1000
1500
2000
2500
3000
3500
4000
Num
ber
of I
O O
pera
tion
s Read OperationsWrite Operations
(b) I/O Ops Under Workloads Pocket-G and Pocket-H
Figure 10: IO operations under Read-Heavy workloads
tual computation rather than frequency scaling: Unlike withprevious workloads, CPU time for E remains relatively unaf-fected by increased benchmark delay settings in all but onecase (SQLite under lognormal delay). Looking at E, DB us-ages involving significant scans can still be serviced largelyfrom cache, but they incur computation penalties.
The second significant difference exposed by workload E isthat the comparative performance advantage of SQLite com-pared to BDB is much greater than that observed in previousworkloads (B, C, D). While CPU time increases sharply forboth databases under workload E compared to workloads BC and D, the increase by almost an additional magnitudefor BDB. Hence, under E, the advantage of SQLite com-pared to BDB in both CPU time and total latency is higherby nearly a magnitude. SQLite is much more optimized tohandle scan operations than is BDB – a pattern we observein other workloads and discuss below.
Takeaway: We look at the results of workloads B throughE thusfar. For mobile app developers, SQLite offers bet-ter performance in all read-only and read-intensive usagecases than does BDB, and significantly better performancein scan-heavy cases. For mobile database developers, we ob-serve that caching is good – the existing size is adequate toservice typical mobile read-heavy loads with minimal I/Oblocking. Write operations do incur nonscheduled time.Batching operations – as long as they are not scans – maysignificantly benefit performance under light loads. Scanperformance suggests that indexing policies for BDB couldbe optimized.
Moderately Read Favored Workloads. The results ofthe two custom workloads, Pocket-G and Pocket-H , are shownin Figures 11a and 11b. These workloads both contain 20%write operations, in between that of B D and E (5%) andA and F (50%, discussed below). We unsurprisingly observethat the performance characteristic of increased write oper-ations (specifically, increased I/O block time favoring BDB)exhibited by Pocket-G and Pocket-H lies inbetween that ofthese other two groups. The increase in writes is reflectedin significantly increased I/O operations. Write operationsunder workloads Pocket-G and Pocket-H increased nearlya magnitude with both databases (Figures 10b). At thislevel, the time spent on I/O blocking become significant; itis particularly observable under the zero-delay scenarios for
Pocket-G and Pocket-H .Additionally, Pocket-G and Pocket-H both contain 40%
scan operations, in between that of E (95%) and other work-loads (none). We similarly observe the performance charac-teristic of scan operations (specifically, increased CPU timefavoring SQLite) shown by Pocket-G and Pocket-H to to bein the middle of the later two groups.
We observe the continuation of two major trends in theperformance results of Pocket-G and Pocket-H . Comparingthe zero delay results of in Figures 11a and 11b with those ofFigures 8a, 9a and 9b most clearly illustrates these trends.First, we earlier observed that the introduction of 5% writeoperations in loads B and D had the effect of increasing thenon-scheduled, non-benchmark delay time of the runs. Fur-ther, this increase disproportionately hurt SQLite relativeto BDB. Loads Pocket-G and Pocket-H , with 20% writes,show further increases in this delay, from about .5s (SQLite)and .2s (BDB) for B and D to about 2s and 1s for Pocket-G and Pocket-H . The performance of SQLite remains wellahead in terms of total latency, however, due to a significantadvantage in CPU time, a product of the second trend.
Second, we earlier noted that the scan operations of work-load E (95%) increased the CPU time of both databasesbut particularly that of BDB: 8s for SQLite and 48s forBDB. Loads Pocket-G and Pocket-H , containing 40% scans,have lower CPU times, about 3s (SQLite) and 11s (BDB).This outweighs the disproportionate increase in nonsched-uled time for SQLite, and keeps SQLite ahead in total la-tency. Takeaway: The two conflicting trends in relativedatabase performance suggest that, in mobile database se-lection, developers should consider the proportion and typesof database operations of their apps. Scan-heavy apps shoulduse SQLite; write-heavy ones should consider BDB.
Write Heavy Workloads. When the proportion of writesrises to 50%, BDB finally begins to offer performance ad-vantages. In the two workloads involving half reads and halfwrites, A and F, BDB performs about 500 writes, and SQLin the 4000’s (Figure 13. At this point, the greater numberof I/O operations and blocking time of SQLite begins to out-weigh SQLite’s CPU runtime advantages. Figures 12a and12b illustrate the benchmark results of these two workloads.The CPUtime for SQLite falls .2s - 2.3s lower than that forBDB. Much lower nonscheduled time, however, gives BDB

Zero DelaySQLit
eBDB
BDB100
1ms DelaySQLit
eBDB
BDB100
Lognormal DelaySQLit
eBDB
BDB100
0
5000
10000
15000
20000
25000
30000
35000
Tota
l Run
tim
e (m
s)
PocketData Workload GUnscheduled TimeCPU Time
(a) Realworld time spent by Workload Pocket-G
Zero DelaySQLit
eBDB
BDB100
1ms DelaySQLit
eBDB
BDB100
Lognormal DelaySQLit
eBDB
BDB100
0
5000
10000
15000
20000
25000
30000
Tota
l Run
tim
e (m
s)
PocketData Workload HUnscheduled TimeCPU Time
(b) Realworld time spent by Workload Pocket-H
Figure 11: Timing results for write-heavy workloads on the Realworld configuration.
Zero DelaySQLit
eBDB
BDB100
1ms DelaySQLit
eBDB
BDB100
Lognormal DelaySQLit
eBDB
BDB100
0
5000
10000
15000
20000
25000
Tota
l Run
tim
e (m
s)
YCSB Workload AUnscheduled TimeCPU Time
(a) Realworld time spent by Workload A
Zero DelaySQLit
eBDB
BDB100
1ms DelaySQLit
eBDB
BDB100
Lognormal DelaySQLit
eBDB
BDB100
0
5000
10000
15000
20000
25000
Tota
l Run
tim
e (m
s)
YCSB Workload FUnscheduled TimeCPU Time
(b) Realworld time spent by Workload F
Figure 12: Timing results for PocketData workloads on the Realworld configuration.
a total latency advantage of .1s-2.2s.Workloads A and F culminate the trend observed previ-
ously, that increased write operations results in increasednonscheduled non-benchmark (blocking) time, and that thisincrease disproportionately hurts SQLite. A and F, withthe highest proportion yet of write operations, show highernonscheduled times under all delay settings than any of theread-heavy workloads. The relative advantage of BDB innonscheduled time is now enough to counterbalance the ad-vantage of SQLite in CPU time and give BDB the overalllatency advantage for A and F under all delay settings.
Additionally, with BDB, CPU time is actually somewhatlower, by about .1s, in the write-heavy loads than in theread-heavy ones, suggesting that BDB is particularly tunedto handle write operations. Finally, CPU time for A and Fcontinues to scale with benchmark delays due to frequencyscaling. Takeaway: Mobile apps should continue to con-sider operation batching to reduce CPU time with bothdatabases. They should also evaluate the proportion of writeoperations in their database usage. Those with a high pro-portion of writes should use BDB rather than SQLite. Therelatively poor scaling of SQLite under write events suggeststhat write algorithms could be looked at.
4.4 Results SummaryWe went through a number of unexpected convolutions
in designing an effective database benchmark for mobile de-vices. In the end, we were able to discern several informativepatterns of database performance. We summarize these be-low, along with prescriptive suggestions for developers.
Effect of Write Operations. Reads typically comprisethe bulk of database operations on mobile phones. How-ever, the presence of even a small proportion of writes has anoticeable and assymetric effect on performance. CPU timeremains basically fixed – that is, trading reads for writes doesnot affect computation overhead. Blocking time, however,grows significantly for both mobile databases. As the perfor-mance hit for is in the form of increased blocking, writes willhurt the performance of the originating app but likely notthat of other tasks. Comparing databases, SQLite is dispro-portionately hurt by writes compared with BDB. Whetherthis outweighs the performance advantage that SQLite hasover BDB in CPU time depends on the proportion of writes.Apps whose database operations are majority writes shouldconsider using BDB in lieu of SQLite.
Effect of Scan Operations. Table scans, when they occur

Workload ASQLit
eBDB
BDB100
Workload FSQLit
eBDB
BDB100
0
500
1000
1500
2000
2500
3000
3500
4000
4500
Num
ber
of I
O O
pera
tion
s Read OperationsWrite Operations
Figure 13: I/O Operations For Workloads A and F
in significant proportion, also have a noticeable and skewedeffect on database performance on mobile devices. Thistime, blocking time is relatively unaffected. It is CPU timethat is hurt significantly by scans, and BDB performanceis the disproportionate victim versus SQLite. Further, asthis performance hit is due to computation rather than fre-quency scaling, other tasks running on the system may alsosuffer a performance hit.
Effect of Benchmark Delay Times. Our benchmarkapp, in order to mimic actual observed usage patterns of mo-bile databases, deliberately injects sleep periods inbetweenqueries. This obviously increases the nonscheduled time ofa given run, and does so by a fixed amount – 0 in the zero-delay case, and approximately 2s and 12s total in the 1msand lognormal delay cases. It does not noticeably changethe amount of additional nonscheduled time (i.e. blocking).This type of app inactivity does, however, trigger CPU fre-quency scaling in the typical case where the system is oth-erwise relatively idle. Scaling in turn results in increasedCPU time that grows with increased periods of app delays.Put differently, idle periods when cores are unpinned causesincreased CPU time. We suggest that app designers batchdatabase requests, where possible, in order to minimize thisphenomonon and boost performance.
Effect of Core Pinning and Frequency Scaling. Tra-ditional databases are expected to operate with their CPUssaturated. On mobile devices, typically idle CPUs result inlonger database computation times due to voltage scaling forapps with intermittent activity. Pinning the cores removesthis effect in most cases. Where it does not is when appactivity does not pause (modeled by our app’s zero-delaysetting). Instead, observed CPU time is unaffected by de-lay periods. Batching database operations will thus be lessbeneficial in two cases: where the app itself or other CPU-intensive tasks are already keeping CPU frequency high.
When to Choose Which Database. For read-only andread-intensive workloads, regardless of the delay scenario im-posed by the testbed app, SQLite always outperforms bothBDB configurations on both CPU runtime and total latency.SQLite holds a particularly significant advantage for appswhose workload is scan heavy. Only when the proportion ofwrite operations becomes significant – around 50% – does
BDB begin to exhibit better performance in terms of over-all latency. BDB would be a good choice for an app thatperforms continuous logging operations. Apps that issue amixture of both writes (favoring BDB) and scans (favoringSQL) will likely need to benchmark both choices to deter-mine which outweighs the other.
When to Adjust BDB Cache Size. We now considerthe performance effect of adjusting the cache size of BDB.Under the bulk of configurations, the default cache size of256k furnishes better performance. With CPUs pinned, thedefault cache yields better CPU time in 16 of 24 runs andbetter total latency on all 24. The differences in all casesare very slight in most cases. In the more realistic unpinnedRealworld setting, the default setting yield better CPU timein 17 of 24 cases and better total latency in 19 of 24 cases.The differences are again slight in all but 2 cases.
We were be tempted to conclude that it would be best toleave the cache size alone. However, in the last set of results– those run under lognormal delay – an expanded 100MBcache yields better latency in the majority of cases. Indeed,for one run, F, it provides the best latency overall includingSQLite. Mobile apps that produce workloads involving sig-nificant delays may well consider making this adjustment.The issue of changed cache sizes suggests further study.
5. OPPORTUNITIESSystematic benchmarking of mobile databases is a new
area. We have described the general procedure that needs tobe followed along with pitfalls that must be avoided. Theseitems, unique but unavoidable on mobile phones, will haveto be followed by future studies in order to achieve in orderto achieve correct and reproducible results. Our study fo-cuses on basic typical usage of presently available databases.Many areas remain unexplored, however.
We have identified several general trends that should guideapp developers in their selection and usage of mobile databases.Read-heavy workloads perform better under SQLite; write-heavy ones on BDB. Under what proportion of write oper-ations does this tradeover occur? At what point does thepresence of scans tip favorability back toward SQLite? Fre-quency scaling, with its detrimental effect on CPU time,suggests that database write operations should be batchedwhere possible. To what extent is this practical, given theneed for data integrity? Corruption is always an issue, al-though mobile phones, with soldered-in batteries, may bemore immune in certain cases.
We would like to see a broader analysis of available toolsand configuration settings. We restricted our study to on-device storage options. Cloud storage is becomming an in-creasingly viable storage alternative in general. Under whatcircumstances would it make sense in the context of mobiledevices? Networks, given increasing performance, may makesense for write-heavy situations that suffer high local latencyor scan-heavy ones where data can be cached remotely.
Database configuration, which also affect performance,should be explored much further. Generally, default set-tings are there for a reason – they are best in the mostcommon typical case. However, they are variable in orderto accommodate less common usage situations. As a prelim-inary step, we explored the effect of a single configurationsetting, viz., altering the cache size of BDB to 100MB. It ap-pears that there may indeed be a scenario – write-intensive
0 500 1000 1500 2000 2500 3000 3500Runtime (ms)
0
20
40
60
80Nu
mbe
r of I
O Ev
ents
(99)
IO (BDB)
ReadWrite Sync
0 500 1000 1500 2000 2500 3000Runtime (ms)
0
100
200
300
400
500
Num
ber o
f IO
Even
ts (5
07)
IO (SQL)
ReadWrite SyncFlush Write Sync
Figure 14: The Timing Distribution of IO Operations for BDB and SQLite on Workload B
Load Writes SQL BDB BDB100B 5% 496 55 55D 5% 782 83 83E 5% 933 99 99Pocket-G 20% 3496 401 405Pocket-H 20% 3216 355 366A 50% 4486 538 541F 50% 4230 522 519
Figure 15: Number of Write Operations
loads with longer delay periods – where this may furnishthe optimal choice. The effect of other sizes, and of chang-ing other configuration settings of BDB and other databases,should be documented. Tuning is expected of server-baseddatabases; it should not be ignored merely because the plat-form is a mobile phone. At least, this would provide a finer-grained decision tree to developers of which choices to make.
While not a configuration per se, resource contention isclearly a factor that influences database performance. Thediffering outcomes we obtained with a variant platform sug-gest this can be significant. The effects of increasing CPUand/or memory pressure from other tasks should be studied.
Finally, given the weaknesses of databases we have identi-fied, it would be helpful to identify their causal mechanism.Why is BDB able to minimize the write penalty that hurtsSQLite? What does BDB need to do to mimic the scan per-formance of SQLite? Identifying the causes of these prob-lems would aid in their solutions by database developers.
6. RELATED WORKLightweight DBMSes. MySQL [23] got its start as alightweight DBMS, while libraries like SQLite [15] and Berke-leyDB [13] both provide server-less database functionaltywithin an application’s memory space. TinyDB [9] is alightweight DBMS intended for use in distributed IoT set-tings. In addition to aiming for a low memory footprint, itallows queries to be scheduled for distributed execution overa cluster of wireless sensor motes. While these approachestarget application developers, other efforts like GestureDB [10]target users of mobile devices and optimize for differenttypes of interaction modalities.
Benchmarking. A range of benchmarks do exist for server-class databases [1, 14, 20] and other data management plat-forms [2, 4, 7]. However, as we point out throughout thispaper, assumptions typically made by these benchmarks
produce invalid results when evaluating pocket-scale datamanagement systems. There is however overlap on somenon-traditional metrics like energy use in data managementplatforms [12,16–18]. Notably, configuration parameters op-timized for these benchmarks typically involve significantchanges to the hardware itself. Through features like fre-quency scaling on the CPU and RAM, mobile devices arecapable of far more fine-grained reconfiguration on the fly,significantly changing the evaluation landscape.
Conversely, A number of other benchmarks target An-droStep [8] evaluates phone performance in general termsof CPU and energy usage. Energy is also a common spe-cific area of study – Wilke et al compare consumption byapplications [22]. AndroBench [6] studies the performanceof file systems in support of databases, but uses SQLite asa representative workload for benchmarking filesystem per-formance. Although these do benchmarks use SQLite as aload generator, the subject being evaluated is the filesystemand not the databsae itself.
Profiling Studies. One profiling study by Wang and Roun-tev [21] explored sources of perceived latency in mobile in-terfaces. They found databases to be a common limitingfactor. A study by Prasad et al. [19] looked at hardware per-formance profiles relative to CPU quality ratings assigned bythe chip manufacturer. They found a wide distribution ofthermal profiles and CPU performance for devices ostensi-bly marketed as being identical. A study by Kennedy et.al. [5] used a user-study to explore characteristics of mobiledatabase workloads, and forms the basis for PocketDataas described in this paper.
7. CONCLUSIONSMobile device performance differs significantly between
device types, between instances of the same device, andeven from second to second on a single device. This het-erogeneity makes it difficult to obtain consistent, repeatablemeasurements for data management systems. We presentedPocketData, a benchmarking toolkit for data managementsystems on mobile platforms that uses a consistent baseline“cleanroom” environment to expose how heterogeneity im-pacts measurement results.
Acknowledgments. This work was supported by NSF AwardsSaTC-1409551 and IIS-1629791. Opinions and findings ex-pressed in this material are those of the authors and maynot reflect the views of the National Science Foundation.

8. REFERENCES[1] D. Bitton, D. J. DeWitt, and C. Turbyfill.
Benchmarking database systems A systematicapproach. In VLDB, pages 8–19. Morgan Kaufmann,1983.
[2] B. F. Cooper, A. Silberstein, E. Tam,R. Ramakrishnan, and R. Sears. Benchmarking cloudserving systems with YCSB. In SOCC, 2010.
[3] Google. Android open source project.https://source.android.com/.
[4] A. Gupta, K. C. Davis, and J. Grommon-Litton.Performance comparison of property map and bitmapindexing. In DOLAP, pages 65–71. ACM, 2002.
[5] O. Kennedy, J. A. Ajay, G. Challen, and L. Ziarek.Pocket Data: The need for TPC-MOBILE. InTPC-TC, 2015.
[6] J. Kim and J. Kim. Androbench: Benchmarking thestorage performance of android-based mobile devices.In ICFCE, volume 133 of Advances in Intelligent andSoft Computing, pages 667–674. Springer, 2011.
[7] J. Klein, I. Gorton, N. A. Ernst, P. Donohoe,K. Pham, and C. Matser. Performance evaluation ofnosql databases: A case study. In PABS@ICPE, pages5–10. ACM, 2015.
[8] K. Lee. Mobile benchmark tool (mobibench).
[9] S. R. Madden, M. J. Franklin, J. M. Hellerstein, andW. Hong. TinyDB: An acquisitional query processingsystem for sensor networks. ACM TODS,30(1):122–173, Mar. 2005.
[10] A. Nandi, L. Jiang, and M. Mandel. Gestural queryspecification. PVLDB, 7(4):289–300, 2013.
[11] A. Nandugudi, A. Maiti, T. Ki, F. Bulut,M. Demirbas, T. Kosar, C. Qiao, S. Y. Ko, andG. Challen. PhoneLab: A large programmablesmartphone testbed. In SenseMine, pages 4:1–4:6,2013.
[12] R. Niemann. Towards the prediction of theperformance and energy efficiency of distributed datamanagement systems. In ICPE Companion, pages23–28. ACM, 2016.
[13] M. A. Olson, K. Bostic, and M. I. Seltzer. BerkeleyDB. In USENIX Annual Technical Conference,FREENIX Track, pages 183–191. USENIX, 1999.
[14] P. E. O’Neil, E. J. O’Neil, and X. Chen. The starschema benchmark (ssb), 2007.
[15] M. Owens and G. Allen. SQLite. Springer, 2010.
[16] M. Poess and R. O. Nambiar. Energy cost, the keychallenge of today’s data centers: a powerconsumption analysis of TPC-C results. PVLDB,1(2):1229–1240, 2008.
[17] M. Poess, R. O. Nambiar, and K. Vaid. Optimizingbenchmark configurations for energy efficiency. InICPE, pages 217–226. ACM, 2011.
[18] M. Poess, R. O. Nambiar, K. Vaid, J. M. Stephens,K. Huppler, and E. Haines. Energy benchmarks: adetailed analysis. In e-Energy, pages 131–140. ACM,2010.
[19] G. P. Srinivasa, R. Begum, S. Haseley, M. Hempstead,and G. Challen. Separated by birth: Hiddendifferences between seemingly-identical smartphonecpus. In HotMobile, pages 103–108. ACM, 2017.
[20] Transaction Processing Performance Council. TPC-H,TPC-C, and TPC-DS specifications.http://www.tpc.org/.
[21] Y. Wang and A. Rountev. Profiling the responsivenessof android applications via automated resourceamplification. In MOBILESoft, pages 48–58. ACM,2016.
[22] C. Wilke, C. Piechnick, S. Richly, G. Puschel, S. Gotz,and U. Aßmann. Comparing mobile applications’energy consumption. In SAC, pages 1177–1179. ACM,2013.
[23] R. J. Yarger, G. Reese, and T. King. MySQL andmSQL - databases for moderate-sized organizationsand websites. O’Reilly, 1999.