plgit - the pennsylvania local government investment trust · existing solely for your success...
TRANSCRIPT
Existing Solely for Your Success
PLGIT - The Pennsylvania Local Government Investment Trust
Annual Report
December 31, 2016
A series of professionally managed investment portfolios designed exclusively for Pennsylvania Boroughs, Cities, Counties, Municipal Authorities, School Districts, Townships of the First Class,
Townships of the Second Class, and other governmental type entities.

Table of Contents
President’s Letter . . . . . . . . . . . . . . . . . . . . . . . . . . . . . . . . . . . . . . . . . . . . . . . . . . . . . . . . . . . . . 1
Management’s Discussion and Analysis . . . . . . . . . . . . . . . . . . . . . . . . . . . . . . . . . . . . . . . . . . . 2
Programs at a Glance . . . . . . . . . . . . . . . . . . . . . . . . . . . . . . . . . . . . . . . . . . . . . . . . . . . . . . . . . 8
Report of Independent Auditors . . . . . . . . . . . . . . . . . . . . . . . . . . . . . . . . . . . . . . . . . . . . . . . . . . 9
Statements of Net Position . . . . . . . . . . . . . . . . . . . . . . . . . . . . . . . . . . . . . . . . . . . . . . . . . . . . 10
Statements of Changes in Net Position . . . . . . . . . . . . . . . . . . . . . . . . . . . . . . . . . . . . . . . . . . . 11
Notes to Financial Statements. . . . . . . . . . . . . . . . . . . . . . . . . . . . . . . . . . . . . . . . . . . . . . . . . . 12
Supplementary Information – Schedules of Investments (unaudited) . . . . . . . . . . . . . . . . . . . . 22
This information is for institutional investor use only, not for further distribution to retail investors, and does not represent an offer to sell or a solicitation of an offer to buy or sell any fund or other security. Investors should consider the investment objectives, risks, charges and expenses before investing in any of the Trust’s portfolios. This and other information about the Trust’s portfolios is available in the current Information Statement, which should be read carefully before investing. A copy of the Information Statement may be obtained by calling 1-800-572-1472 or is available on the Trust’s website at www.plgit.com. While the PLGIT, PLGIT/ARM and PLGIT/PRIME portfolios seek to maintain a stable net asset value of $1.00 per share and the PLGIT/TERM portfolio seeks to achieve a net asset value of $1.00 per share at its stated maturity, it is possible to lose money investing in the Trust. An investment in the Trust is not insured or guaranteed by the Federal Deposit Insurance Corporation or any other government agency. Shares of the Trust’s portfolios are distributed by PFM Fund Distributors, Inc., member Financial Industry Regulatory Authority (FINRA) (www.fi nra.org) and Securities Investor Protection Corporation (SIPC) (www.sipc.org). PFM Fund Distributors, Inc. is a wholly owned subsidiary of PFM Asset Management LLC.
A description of the PLGIT CD Program is contained in the PLGIT Information Statement. The Information Statement contains important information and should be read carefully before investing. Investors may purchase Certifi cates of Deposit through the PLGIT CD Program only by executing an investment advisory agreement with the Program’s Investment Adviser, PFM Asset Management LLC.SMPLGIT, PLGIT-Class Shares, PLGIT/PLUS-Class Shares, PLGIT/I-Class Shares, PLGIT/PRIME, PLGIT/TERM, PLGIT-CD, PLGIT/ARM, PLGIT/SAM, and PLGIT-CAP are service marks of the Pennsylvania Local Government Investment Trust.
PLGIT Annual Report | December 31, 2016 1
President’s Letter
Dear Investor,
Happy Anniversary to us! 2016 marks 35 years of cooperative investing for PLGIT. Who would have guessed that from our humble beginnings with a few million in assets from two initial investors in May of 1981 that PLGIT would have grown to become the premier investment choice for the majority of local governments, school districts, municipal authorities, and others in the Commonwealth of Pennsylvania? Our ranks continue to swell as we added 20 new investors to the Trust in 2016, ending the year with 2,966 entities. Investor Number 3,000 is just around the corner!
2016 was a landmark year for the Trust as it marked the end of a fi ve year goal set forth by a resolution for the PLGIT Board to expand permitted investments for all public investors in the Commonwealth with the passage of Act 10 of 2016. Market forces and a limited array of available investment choices had deprived Pennsylvania’s governments of interest income seen by local governments in other states, and with increased scrutiny on taxation, spending, and scarcity of state subsidies our investors need to maximize their interest earnings now more than ever.
A concerted effort led by our sponsoring associations and supported by the investment professionals from PFM and counsel from Saul Ewing helped to keep momentum moving forward on this legislation. It amazed me that Act 10 was one of very few pieces of legislation to pass through the 2015-16 session, as the bigger issue of the state budget dominated the conversation. 2016 was a year of unpredicted wins in sports, politics, and culture, and I would like to add Act 10 to that list of wins. Great job by our team!
Following the passage of Act 10, PLGIT quickly incorporated the newly permitted securities into the PLGIT/PRIME and PLGIT/TERM programs. Investors have fl ocked to these two programs and their higher yields than their non-Act 10 investment choices. As the PLGIT marketing team continues its outreach to current and prospective investors, I anticipate further interest in PRIME and TERM programs.
PLGIT’s volunteer Board of Trustees is comprised of local government, school, and municipal authority offi cials and staff who oversee the actions of the Trust’s service providers. The Board works to ensure that the goals of the Trust—safety, liquidity, and a competitive market rate of return—continue to be met. PLGIT’s Board also continues to invest in programs to suit the needs of our Investor base and manage costs to the Trust. Our Participant Services Committee has been on the forefront of redesigning our program offerings. In 2016, they recommended the Board of Trustees eliminate some fees that had been passed through to Investors, and to eliminate some little-utilized services. In 2017, they have asked PFM to circulate a survey to our members and non-members for more feedback on PLGIT’s services and trends in municipal and school fi nance.
Though I plan to continue to serve the Trust as a Board member, my term as President of the PLGIT Board of Trustees will end in May 2017. I want to thank my fellow Board members, our sponsoring associations, and our service providers for a coordinated effort to move Act 10 forward into law during a diffi cult year for the legislature. I am excited to see what the future holds for the Trust and I know that I will pass the baton off into good hands with the next Board President.
PLGIT continues to stand as an enduring example of intergovernmental cooperation in our Commonwealth. As we look forward to another successful year of growth, I truly believe that together our cooperation will pay dividends.
Sincerely,
Thomas J. McElhone
President PLGIT Board of Trustees

2 PLGIT Annual Report | December 31, 2016
Management’s Discussion and Analysis
We are pleased to present the Annual Report for the Pennsylvania Local Government Investment Trust (the “Trust”) for the year ended December 31, 2016. Management’s Discussion and Analysis is designed to focus the reader on signifi cant fi nancial items and provide an overview of the Trust’s activities for the periods ended December 31, 2016. The Trust’s PLGIT Portfolio, PLGIT/PRIME Portfolio and PLGIT/ARM Portfolio have adopted Governmental Accounting Standards Board (“GASB”) Statement No. 79, which became effective for fi scal years beginning after June 15, 2015. In conjunction with this change, the fi nancial statements presented within this Annual Report have been prepared in conformity with the reporting framework prescribed by GASB for local government investments pools. There was no impact on the net position of the Trust’s portfolios as a result of adopting the GASB reporting framework.
Economic UpdateFollowing a sluggish fi rst half of 2016, the U.S. economy experienced a turnaround, gaining unexpected momentum in the third and fourth quarters. The second half of the year was marked by improving economic conditions and a surprising post-election domestic equity rally that was fueled by market optimism for 2017. These positive signs prompted the Federal Reserve (“Fed”) to raise rates on December 14, 2016, following an unusually long 12-month period since its previous rate hike. In a signifi cant indication of economic improvement, U.S. gross domestic product (“GDP”) grew at the fastest rate in two years during the third quarter. After hovering around 5.0% for most of 2016, the unemployment rate fell to 4.6% in November — a new post-recession low.
When the U.S. central bank raised the target range for the federal funds rate by 0.25% near year’s end, it established a new target range of 0.50% to 0.75%. Federal Open Market Committee (“FOMC”) members noted further progress made toward their dual mandates of price stability and full employment as catalysts for the increase. The Fed predicted modest improvements in GDP and unemployment for the year ahead and indicated the possibility of three 0.25% hikes in 2017, followed by three more hikes in 2018, potentially boosting the short-term rate to approximately 2%.
Although market-based interest rates remained low for most of 2016, the yield curve steepened following the November 8 presidential election as long-term rates rose due to higher infl ation expectations and growth optimism. In addition, domestic equity markets responded favorably to the unexpected election outcome. The S&P 500 Index, Dow Jones Industrial Average and Nasdaq Composite hit record highs in a post-election rally due to President Donald Trump’s promises to reduce government regulations, cut corporate tax rates, and boost infrastructure spending. However, 2017 has ushered in an unusually high level of uncertainty as it remains unclear which policies the Trump administration will pursue and the ultimate form those policies will take.
Prior to the United States’ economic turnaround in the second half of 2016, much of the year was characterized by slow growth. Although the Fed had indicated in December 2015 that it would raise rates as many as four times in 2016, it took no action during most of the year due to mixed economic data, rising levels of global risk, and uncertainty leading up to Britain’s “Brexit” vote to leave the European Union (“EU”) and the U.S. presidential election.
The global economy did not experience the same third-quarter turnaround as the U.S. economy. Developed markets strengthened modestly while emerging markets were pressured. Uncertainty remained high due to concerns of a slowdown in the Chinese economy, uneasiness over the future direction of Europe, and a decline in many commodity prices. Misgivings about global growth prompted central banks to keep interest rates at or near historically low rates. In some cases, they continued negative interest rate policies in an attempt to spur growth. Central banks in Europe and Japan have expressed their willingness to further ease monetary policy if needed. The June 23 Brexit vote shocked markets, but the market impact faded quickly as investors came to terms with the fact that it would take at least two years for Britain to negotiate the details of its exit from the EU. Remaining concern over the impact on trade between Britain and the EU’s member countries has depressed the British currency and led the Bank of England to lower rates. In addition to Brexit, the EU faces uncertainty due to 2017 elections in the trade bloc’s two largest economies — Germany and France.
Markets have also been impacted by new regulations of the Securities and Exchange Commission (“SEC”) governing prime money market funds, which took effect October 14. The rules implementing variable net asset value for shares, redemption gates, and fees for prime institutional funds have driven many investors out of prime funds and into government funds, which generally have lower yields but are exempt from these restrictions. This shift had the effect of depressing demand for commercial paper and negotiable certifi cates of deposit (“CDs”), increasing the demand for short-term government securities, and widening the interest rate spreads between these sectors.
PFM Asset Management LLC’s Portfolio StrategyAt PFM Asset Management LLC (“PFMAM”), we utilized active management in the PLGIT Portfolio, PLGIT/PRIME Portfolio and PLGIT/ARM Portfolio throughout the 12-month period to take advantage of opportunities that markets presented. In each of these portfolios, we maintained the weighted average maturity toward the maximum permitted by the fund’s investment policy to take
PLGIT Annual Report | December 31, 2016 3
advantage of higher yields offered by securities with somewhat longer maturities, especially those offered by high quality commercial paper and CDs. However, in the weeks leading up to the Fed’s December rate hike, we shortened maturities to position the portfolios for higher rates. Due to prospects of further Fed tightening in 2017, we started the new year with a defensive posture by maintaining a shorter weighted average maturity to position the portfolio for further rate increases.
Changes to Pennsylvania law that governs investment by local governments and schools led to a notable increase in assets of the PLGIT/PRIME portfolio and the addition of high-quality commercial paper and negotiable CDs, which helped to boost yield. In the PLGIT/TERM portfolios, we sought opportunities to invest funds in commercial paper and CDs with maturities of three to 12 months to benefi t from the wider sector spreads that have been available as a result of the outfl ow of investors from prime institutional money market funds. We believe that the combination of PLGIT’s liquid and Term investment options represent attractive alternatives to prime money market funds and lower-yielding government money market funds.
As we observed in 2016, outlooks and markets change. We will be on alert for indicators that the pace of rate hikes could accelerate due to quickening economic activity or rising infl ation — or diminish due to rising risk as in 2016. We are ready to adjust portfolio strategy in either case. As always, our primary objectives are to protect the value of each portfolio’s shares and to provide liquidity for investors. We will work hard to achieve these goals, and to increase investment yield after eight years of near-zero interest rates.
Financial Statement OverviewManagement’s Discussion and Analysis provides an overview of the fi nancial statements of the Trust’s PLGIT Portfolio, PLGIT/PRIME Portfolio, PLGIT/ARM Portfolio, PLGIT/TERM Series DEC 17 and PLGIT/TERM Series MMM (each a “Portfolio” and, collectively, the “Portfolios”). The fi nancial statements for each Portfolio include a Statement of Net Position and Statement of Changes in Net Position. These fi nancial statements are supported by the Notes to Financial Statements. In addition, Schedules of Investments for the PLGIT Portfolio, PLGIT/PRIME Portfolio, PLGIT/ARM Portfolio and PLGIT/TERM Series DEC 17 are included as Supplementary Information following the Notes to Financial Statements. PLGIT/TERM Series MMM ceased to operate on December 31, 2016 and has no investment outstanding as of that date, therefore no Schedule of Investments is shown for that Portfolio.
Condensed Financial Information and AnalysisYearly variances in the gross income generated by the Portfolios are impacted by the overall rate environment described in the preceding paragraphs. Average net assets also impact the net investment income, as well as certain of the expense line items that are based on a percent of portfolio net assets and other fi xed costs allocated based on average net assets.
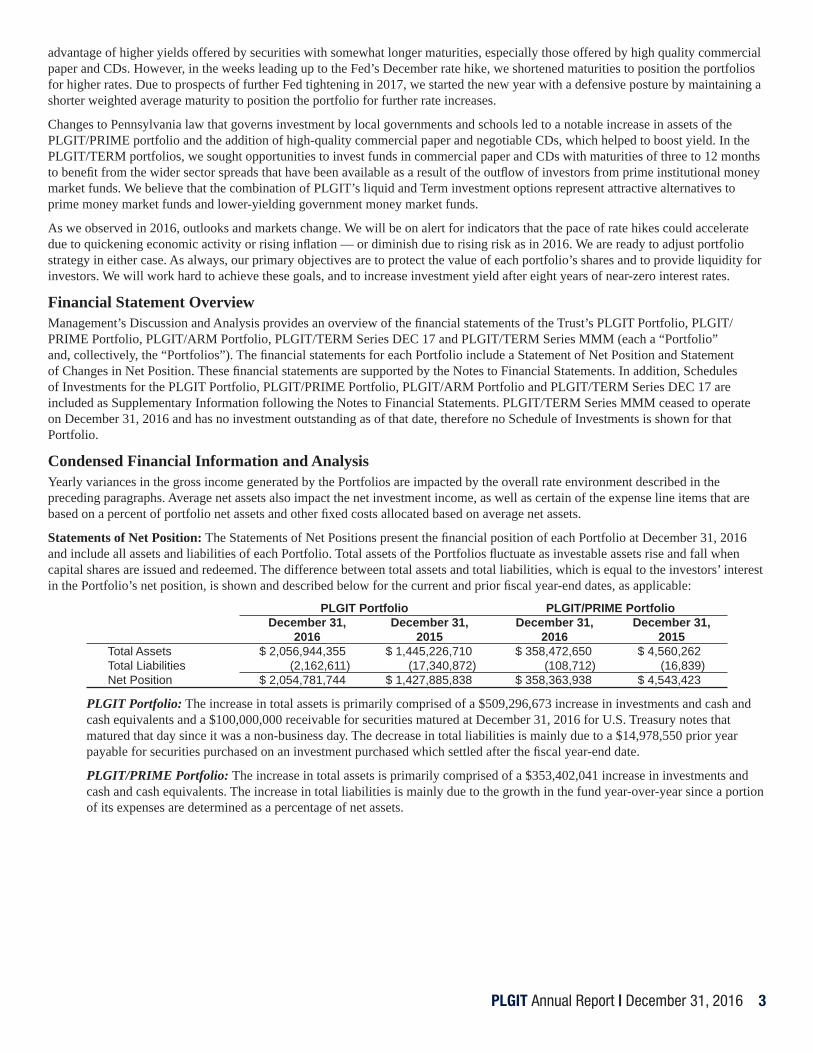
Statements of Net Position: The Statements of Net Positions present the fi nancial position of each Portfolio at December 31, 2016 and include all assets and liabilities of each Portfolio. Total assets of the Portfolios fl uctuate as investable assets rise and fall when capital shares are issued and redeemed. The difference between total assets and total liabilities, which is equal to the investors’ interest in the Portfolio’s net position, is shown and described below for the current and prior fi scal year-end dates, as applicable:
PLGIT Portfolio PLGIT/PRIME Portfolio December 31, December 31, December 31, December 31, 2016 2015 2016 2015 Total Assets $ 2,056,944,355 $ 1,445,226,710 $ 358,472,650 $ 4,560,262 Total Liabilities (2,162,611) (17,340,872) (108,712) (16,839) Net Position $ 2,054,781,744 $ 1,427,885,838 $ 358,363,938 $ 4,543,423
PLGIT Portfolio: The increase in total assets is primarily comprised of a $509,296,673 increase in investments and cash and cash equivalents and a $100,000,000 receivable for securities matured at December 31, 2016 for U.S. Treasury notes that matured that day since it was a non-business day. The decrease in total liabilities is mainly due to a $14,978,550 prior year payable for securities purchased on an investment purchased which settled after the fi scal year-end date.
PLGIT/PRIME Portfolio: The increase in total assets is primarily comprised of a $353,402,041 increase in investments and cash and cash equivalents. The increase in total liabilities is mainly due to the growth in the fund year-over-year since a portion of its expenses are determined as a percentage of net assets.
4 PLGIT Annual Report | December 31, 2016
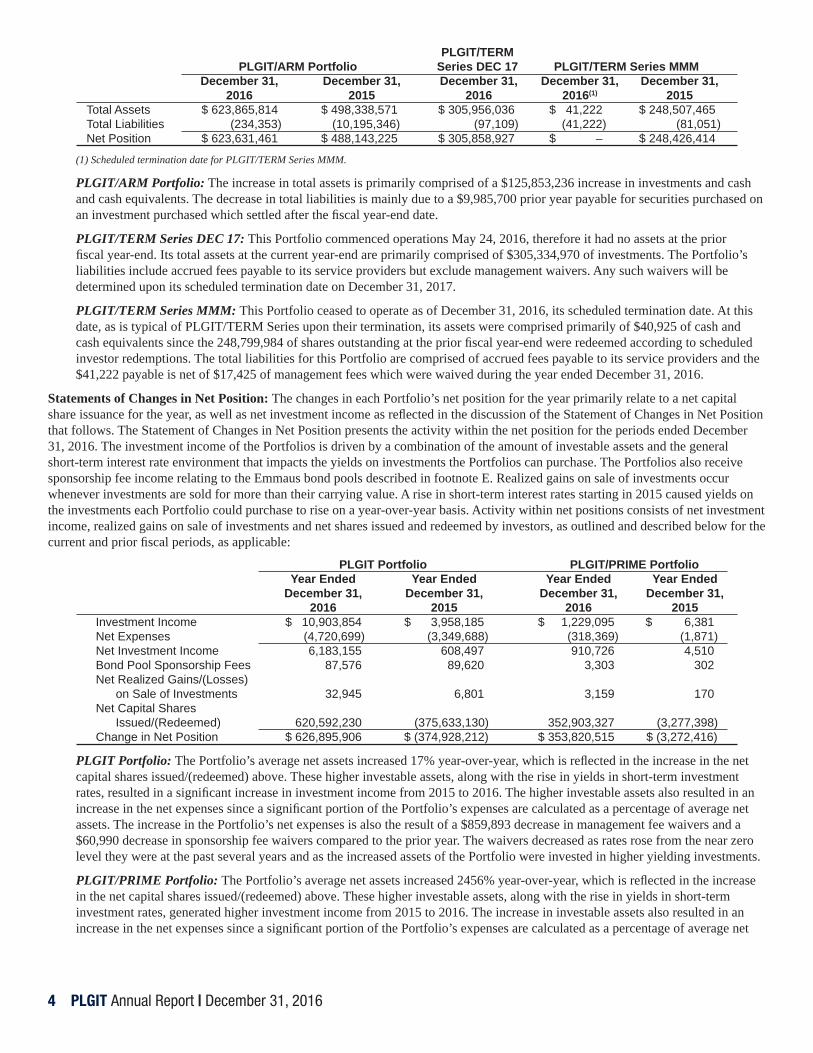
PLGIT/TERM PLGIT/ARM Portfolio Series DEC 17 PLGIT/TERM Series MMM December 31, December 31, December 31, December 31, December 31, 2016 2015 2016 2016(1) 2015
Total Assets $ 623,865,814 $ 498,338,571 $ 305,956,036 $ 41,222 $ 248,507,465Total Liabilities (234,353) (10,195,346) (97,109) (41,222) (81,051)Net Position $ 623,631,461 $ 488,143,225 $ 305,858,927 $ – $ 248,426,414
(1) Scheduled termination date for PLGIT/TERM Series MMM.
PLGIT/ARM Portfolio: The increase in total assets is primarily comprised of a $125,853,236 increase in investments and cash and cash equivalents. The decrease in total liabilities is mainly due to a $9,985,700 prior year payable for securities purchased on an investment purchased which settled after the fi scal year-end date.
PLGIT/TERM Series DEC 17: This Portfolio commenced operations May 24, 2016, therefore it had no assets at the prior fi scal year-end. Its total assets at the current year-end are primarily comprised of $305,334,970 of investments. The Portfolio’s liabilities include accrued fees payable to its service providers but exclude management waivers. Any such waivers will be determined upon its scheduled termination date on December 31, 2017.
PLGIT/TERM Series MMM: This Portfolio ceased to operate as of December 31, 2016, its scheduled termination date. At this date, as is typical of PLGIT/TERM Series upon their termination, its assets were comprised primarily of $40,925 of cash and cash equivalents since the 248,799,984 of shares outstanding at the prior fi scal year-end were redeemed according to scheduled investor redemptions. The total liabilities for this Portfolio are comprised of accrued fees payable to its service providers and the $41,222 payable is net of $17,425 of management fees which were waived during the year ended December 31, 2016.
Statements of Changes in Net Position: The changes in each Portfolio’s net position for the year primarily relate to a net capital share issuance for the year, as well as net investment income as refl ected in the discussion of the Statement of Changes in Net Position that follows. The Statement of Changes in Net Position presents the activity within the net position for the periods ended December 31, 2016. The investment income of the Portfolios is driven by a combination of the amount of investable assets and the general short-term interest rate environment that impacts the yields on investments the Portfolios can purchase. The Portfolios also receive sponsorship fee income relating to the Emmaus bond pools described in footnote E. Realized gains on sale of investments occur whenever investments are sold for more than their carrying value. A rise in short-term interest rates starting in 2015 caused yields on the investments each Portfolio could purchase to rise on a year-over-year basis. Activity within net positions consists of net investment income, realized gains on sale of investments and net shares issued and redeemed by investors, as outlined and described below for the current and prior fi scal periods, as applicable:
PLGIT Portfolio PLGIT/PRIME Portfolio Year Ended Year Ended Year Ended Year Ended December 31, December 31, December 31, December 31, 2016 2015 2016 2015 Investment Income $ 10,903,854 $ 3,958,185 $ 1,229,095 $ 6,381 Net Expenses (4,720,699) (3,349,688) (318,369) (1,871) Net Investment Income 6,183,155 608,497 910,726 4,510 Bond Pool Sponsorship Fees 87,576 89,620 3,303 302 Net Realized Gains/(Losses) on Sale of Investments 32,945 6,801 3,159 170 Net Capital Shares Issued/(Redeemed) 620,592,230 (375,633,130) 352,903,327 (3,277,398) Change in Net Position $ 626,895,906 $ (374,928,212) $ 353,820,515 $ (3,272,416)
PLGIT Portfolio: The Portfolio’s average net assets increased 17% year-over-year, which is refl ected in the increase in the net capital shares issued/(redeemed) above. These higher investable assets, along with the rise in yields in short-term investment rates, resulted in a signifi cant increase in investment income from 2015 to 2016. The higher investable assets also resulted in an increase in the net expenses since a signifi cant portion of the Portfolio’s expenses are calculated as a percentage of average net assets. The increase in the Portfolio’s net expenses is also the result of a $859,893 decrease in management fee waivers and a $60,990 decrease in sponsorship fee waivers compared to the prior year. The waivers decreased as rates rose from the near zero level they were at the past several years and as the increased assets of the Portfolio were invested in higher yielding investments.
PLGIT/PRIME Portfolio: The Portfolio’s average net assets increased 2456% year-over-year, which is refl ected in the increase in the net capital shares issued/(redeemed) above. These higher investable assets, along with the rise in yields in short-term investment rates, generated higher investment income from 2015 to 2016. The increase in investable assets also resulted in an increase in the net expenses since a signifi cant portion of the Portfolio’s expenses are calculated as a percentage of average net

PLGIT Annual Report | December 31, 2016 5
assets. The increase in the Portfolio’s net expenses is net of a $49,437 increase in management fee waivers from 2015 to 2016. The waivers increased despite the rise in short-term investment rates since the investment manager continued to waive a portion of its fees through the middle of 2016 to help the Portfolio’s returns following the effective date of the legislative changes in the Pennsylvania investment statutes which allowed more PLGIT investors to invest in this type of fund.
PLGIT/TERM PLGIT/ARM Portfolio Series DEC 17 PLGIT/TERM Series MMM May 24, 2016(1)
Year Ended Year Ended through Year Ended Year Ended December 31, December 31, December 31, December 31, December 31, 2016 2015 2016 2016(2) 2015
Investment Income $ 3,257,968 $ 1,161,621 $ 1,019,369 $ 780,457 $ 474,072Net Expenses (1,123,108) (932,651) (150,221) (194,333) (135,714)Net Investment Income 2,134,860 228,970 869,148 586,124 338,358Bond Pool Sponsorship Fees - - 3,840 6,890 5,463Net Realized Gains/ (Losses) on Sale of Investments 17,409 7,717 3,956 504 3,542Net Capital Shares Issued/(Redeemed) 133,335,967 (8,217,819) 304,981,983 (249,019,932) 248,079,051Change in Net Position $ 135,488,236 $(7,981,132) $ 305,858,927 $ (248,426,414) $ 248,426,414
(1) Commencement of operations for each respective PLGIT/TERM Series.(2) Scheduled termination date for PLGIT/TERM Series MMM.
PLGIT/ARM Portfolio: The Portfolio’s average net assets also increased 17% year-over-year, which is refl ected in the increase in the net capital shares issued/(redeemed) above. These higher investable assets, along with the rise in yields in short-term investment rates, resulted in a signifi cant increase in investment income from 2015 to 2016. The higher investable assets also resulted in an increase in the net expenses since a signifi cant portion of the Portfolio’s expenses are calculated as a percentage of average net assets. The increase in the Portfolio’s net expenses is also the result of a $45,855 decrease in management fee waivers compared to the prior year. The waivers decreased as rates rose from the near zero level they were at the past several years and as the increased assets of the Portfolio were invested in higher yielding investments.
PLGIT/TERM Series DEC 17: Since this Portfolio commenced operations during the current fi scal year, it had no changes in net position from the prior year. The Portfolio issued $372,985,438 of shares in the portion of the current fi scal year it was active and earned $1,019,369 of investment income as those assets were invested. The net expenses of the Portfolio include a management fee of 0.10% of its average daily net assets, so as assets grow this amount grows also. However, this amount may be reduced in the future by any management or other waivers which will be determined upon the Portfolio’s scheduled termination date on December 31, 2017.
PLGIT/TERM Series MMM: This Portfolio commenced operations during the prior fi scal year and terminated operations as scheduled on the current fi scal year-end date of December 31, 2016. Thus the increase in net position from the prior fi scal period was totally offset by a decrease in net position in the current fi scal period as all shares were redeemed by the termination date. The investment income increased from the prior to the current fi scal period as a result of the increase in short-term interest rates coupled with the current period being a full year versus the prior period being less than a full year based on its May 21, 2015 commencement of operations. The net expenses of this Portfolio refl ect $17,425 of management fees which were waived during the year ended December 31, 2016.
Financial Highlights: While not required in fi nancial statements presented in accordance with the GASB reporting framework mentioned previously, the Trust’s management believes the ratios and returns of the Portfolios are useful information to provide to investors. The 2016 returns of the PLGIT-Class, PLGIT/PLUS-Class and PLGIT/I-Class of the PLGIT Portfolio were 0.28%, 0.39% and 0.43%, up from 0.03%, 0.06% and 0.09%, respectively, in 2015. The expense ratios of each class vary so each class’ return will similarly vary. The 2016 returns of the PLGIT/PRIME Portfolio and PLGIT/ARM Portfolio were 0.47% and 0.38%, up from 0.09% and 0.05%, respectively, in 2015. The return of each investor’s investment in each PLGIT/TERM Series varies based on the timing and rate at which they invest. Income and expense ratios for each of the Portfolios for the current fi scal period, as compared to the prior fi scal period, as applicable, are outlined and described below:

6 PLGIT Annual Report | December 31, 2016
PLGIT Portfolio PLGIT/PRIME Portfolio Year Ended Year Ended Year Ended Year Ended December 31, December 31, December 31, December 31, 2016 2015 2016 2015
Ratio of Net Investment Income to Average Net Assets 0.60% 0.08% PLGIT/Class 0.27% 0.03% PLGIT/PLUS-Class 0.38% 0.06% PLGIT/I-Class 0.43% 0.09% Ratio of Net Investment Income to Average Net Assets, Before Fee Waivers and Expenses Paid Indirectly 0.55% -0.51% PLGIT/Class 0.26% -0.06% PLGIT/PLUS-Class 0.37% 0.04% PLGIT/I-Class 0.42% 0.07% Ratio of Expenses to Average Net Assets 0.21% 0.03% PLGIT/Class 0.30% 0.22% PLGIT/PLUS-Class 0.19% 0.19% PLGIT/I-Class 0.15% 0.16% Ratio of Expenses to Average Net Assets, Before Fee Waivers and Expenses Paid Indirectly 0.26% 0.62% PLGIT/Class 0.31% 0.31% PLGIT/PLUS-Class 0.20% 0.21% PLGIT/I-Class 0.16% 0.18%
PLGIT Portfolio: The increase in investment income noted above caused the 2016 ratios of net investment income to average net assets, after factoring in fee waivers and expenses paid indirectly, to rise by 0.24%, 0.32% and 0.34% for the PLGIT/Class, PLGIT/PLUS-Class and PLGIT/I-Class, respectively, versus 2015. Expenses paid indirectly represent compensating cash earnings credits on funds left on deposit at the Portfolio’s custodian bank. The ratio of expenses to average net assets on a pre-waiver basis did not change signifi cantly year-over-year for the classes of this Portfolio since the bulk of these expenses are calculated as a percentage of average net assets, though where they did change they were generally slightly lower in 2016 vs 2015 due to the asset growth of the Portfolio triggering management fee breakpoints, as well as allowing certain fi xed operating costs to be spread over a higher asset base.
PLGIT/PRIME Portfolio: The increase in investment income noted above caused the 2016 ratio of net investment income to average net assets, after factoring in fee waivers and expenses paid indirectly, to rise by 0.52% compared to 2015. The ratio of expenses to average net assets on a pre-waiver basis was 0.36% lower year-over-year, due mainly to the signifi cant growth in assets in 2016. Fee waivers and expenses paid indirectly reduced the expense ratio, and thus increased the net investment income ratio, by 0.05% in 2016.

PLGIT Annual Report | December 31, 2016 7
PLGIT/TERM PLGIT/ARM Portfolio Series DEC 17 PLGIT/TERM Series MMM May 24, 2016(1)
Year Ended Year Ended through Year Ended Year Ended(1)
December 31, December 31, December 31, December 31, December 31, 2016 2015 2016 2016(2) 2015
Ratio of Net Investment Income to Average Net Assets(3) 0.37% 0.05% 0.94% 0.41% 0.35%Ratio of Net Investment Income to Average Net Assets, Before Fee Waivers and Expenses Paid Indirectly (3) 0.37% 0.04% 0.94% 0.39% 0.34%Ratio of Expenses to Average Net Assets 0.20% 0.19% 0.16% 0.13% 0.14%Ratio of Expenses to Average Net Assets, Before Fee Waivers and Expenses Paid Indirectly 0.20% 0.20% 0.16% 0.15% 0.15%
(1) Commencement of operations for each respective PLGIT/TERM Series.(2) Scheduled termination date for PLGIT/TERM Series MMM.(3) Excludes unrealized gains or losses. See Note B. The ratios above are computed for each Portfolio taken as a whole. For each PLGIT/TERM series these ratios are calculated on an annualized basis using the period during which shares of each Portfolio were outstanding as noted above. The computation of such ratios for an individual investor in a PLGIT/TERM series and net asset value of each investor’s investment in a PLGIT/TERM series may vary based on the timing of capital transactions and rate upon which they invest.
PLGIT/ARM Portfolio: The increase in investment income noted above caused the 2016 ratio of net investment income to average net assets, after factoring in fee waivers and expenses paid indirectly, to rise by 0.32% compared to 2015. The ratio of expenses to average net assets on a pre-waiver basis was unchanged compared to the prior year. Fee waivers and expenses paid indirectly reduced the expense ratio, and thus increased the net investment income ratio, by less than 0.01% in 2016.
PLGIT/TERM Series DEC 17: Since this Portfolio commenced operations during the current fi scal year it had no ratios for the prior year. The Portfolio’s net investment income ratio of 0.94% refl ects the general interest rate environment as those assets were invested. The expense ratio includes a management fee of 0.10% of its average daily net assets, as well as other operating expenses. However, this ratio may be reduced in the future for any management or other waivers which will be determined upon the Portfolio’s scheduled termination date on December 31, 2017.
PLGIT/TERM Series MMM: This Portfolio commenced operations during the prior fi scal year and terminated operations as scheduled on the current fi scal year-end date of December 31, 2016. The ratio of expenses to average net assets on a pre-waiver basis did not change from the prior fi scal period to the current fi scal period since the bulk of these expenses are calculated as a percentage of average net assets. The ratio of net investment income to average net assets increased from the prior to the current fi scal period as a result of the increase in short-term interest rates. The ratios are net of investment management fee waivers of 0.02% during the current fi scal period.

8 PLGIT Annual Report | December 31, 2016
1 PLGIT is a portfolio of the Trust with three classes of shares: PLGIT-Class, PLGIT/PLUS-Class, and PLGIT/I-Class.2 PLGIT/TERM is a portfolio of the Trust with separate series.3 PLGIT-CD Purchase Program is a program designed to assist Investors to directly purchase CDs. Investments in the PLGIT-CD Purchase Program are direct investments of the Investor,
not assets of the Trust or under the control of the Board of Trustees.4 PLGIT/ARM is a money market portfolio (bond proceeds only). Individual portfolios containing direct investments of the Investor are also available upon request. Investments in an
Investor’s PLGIT/ARM individual portfolio account are direct investments of the Investor, not assets of the Trust or under the control of the Board of Trustees.5 PLGIT/PRIME is a portfolio of the Trust that includes investments in Commercial Paper. PLGIT/PRIME Shares are invested and redeemed by the Investor only through EON, the Trust’s
online account access system.6 The PLGIT/SAM Program consists of an individual portfolio or portfolios of fi xed-rate and longer-term investments selected in a manner consistent with applicable municipal code(s) and
the Investor’s investment policy. Investments in an Investor’s PLGIT/SAM Program individual portfolio account are direct investments of the Investor, not assets of the Trust or under the control of the Board of Trustees.
7 PLGIT/I-Class Shares are invested and redeemed by the Investor only through EON, the Trust’s online account access system.8 Or a larger amount so that the total value of the CD (including interest) would not exceed the applicable FDIC insurance limits.9 No withdrawal may be made within 30 days of deposit without incurring a penalty with respect to PLGIT/PLUS-Class Shares.10 No more than two redemptions or exchanges per calendar month may be made without incurring a penalty with respect to PLGIT/I-Class Shares and PLGIT/PRIME.
PLGIT/TERM2
PLGIT-CD3
PLGIT/ARM4
PLGIT/PRIME5
PLGIT/SAM6
Share Type PLGIT-Class PLGIT/PLUS-
ClassPLGIT/I-Class(Internet Only)7
Investment Period One Day Minimum All Deposits
30 Day Minimum One Day Minimum
60 Day Minimum
Maximum 1 Year
60 Day Minimum One Day Minimum One Day
MinimumNo Minimum or
Maximum
Balance Requirements No Minimum Balance
No Minimum Balance After Initial 30 days
$50,000 Minimum Initial Deposit
$50,000 Minimum Initial Deposit
$100,000 Minimum
$97,000 Minimum per
CD8No Minimum Balance
$50,000 Minimum Initial
DepositN/A
AdditionalDeposits
No MinimumUnlimitedDirect Deposit
Available
$5,000 MinimumUnlimitedDirect Deposit
Available
•$5,000 Minimum• Unlimited•Direct Deposit or
ACH only
$100,000 Minimum
$97,000 Minimum per
CD8
No MinimumUnlimited
No MinimumUnlimited
No MinimumUnlimited
WithdrawalsNo MinimumUnlimited next day
transfer at no cost
No Minimum9
Unlimited
No MinimumTwo per calendar
month10
At Maturity At MaturityNo MinimumUnlimited
No MinimumTwo per
calendar month10
No MinimumUnlimited
Checkwriting Unlimited Checking Available through PLGIT-Class
Available through PLGIT-Class N/A N/A Unlimited Checking Available through
PLGIT-ClassAvailable
through PLGIT-Class
Out-of-Pocket Charges/Fees
Some fees may apply for significant monthly volumes of:Outgoing wiresCheck reordersLockbox
None None None
Up to 25 Basis Points
Deducted Upfront or Prorated Monthly
See PLGIT/ARMInformation Statement
None
Based on average assets, min $15,000 / year for investment advisory services
Accounts Unlimited Unlimited Unlimited Unlimited Unlimited Unlimited Unlimited Unlimited
Interest EarningsCalculated DailyPaid Monthly
Calculated DailyPaid Quarterly
Calculated DailyPaid Quarterly
Fixed Rate of Interest
Paid At Redemption
Fixed Rate of Interest
Paid At Redemption
Calculated DailyPaid Monthly
Calculated Daily
Paid MonthlyN/A
StatementsEach TransactionMonth-endVia Internet
Each TransactionMonth-endVia Internet
Each TransactionMonth-endVia Internet
Each Transaction
QuarterlyVia Internet
Each Transaction
Month-end
Each TransactionMonth-endVia Internet
Each Transaction
Month-endVia Internet
Each Transaction
Month-endQuarterly
performance (if specified)
Via Internet
FUND PLGIT1
Programs at a Glance

PLGIT Annual Report | December 31, 2016 9
Report of Independent Auditors
To the Board of Trustees of the Pennsylvania Local Government Investment Trust
We have audited the accompanying fi nancial statements of the PLGIT Portfolio, PLGIT/PRIME Portfolio, PLGIT/ARM Portfolio, PLGIT/TERM Series DEC 17 and PLGIT/TERM Series MMM of the Pennsylvania Local Governement Investment Trust, which comprise the statements of net position as of December 31, 2016, and the related statements of changes in net position for the year or period then ended, and the related notes to the fi nancial statements.
Management’s Responsibility for the Financial StatementsManagement is responsible for the preparation and fair presentation of these fi nancial statements in conformity with U.S. generally accepted accounting principles; this includes the design, implementation, and maintenance of internal control relevant to the preparation and fair presentation of fi nancial statements that are free of material misstatement, whether due to fraud or error.
Auditor’s ResponsibilityOur responsibility is to express an opinion on these fi nancial statements based on our audits. We conducted our audits in accordance with auditing standards generally accepted in the United States. Those standards require that we plan and perform the audits to obtain reasonable assurance about whether the fi nancial statements are free of material misstatement.
An audit involves performing procedures to obtain audit evidence about the amounts and disclosures in the fi nancial statements. The procedures selected depend on the auditor’s judgment, including the assessment of the risks of material misstatement of the fi nancial statements, whether due to fraud or error. In making those risk assessments, the auditor considers internal control relevant to the entity’s preparation and fair presentation of the fi nancial statements in order to design audit procedures that are appropriate in the circumstances, but not for the purpose of expressing an opinion on the effectiveness of the entity’s internal control. Accordingly, we express no such opinion. An audit also includes evaluating the appropriateness of accounting policies used and the reasonableness of signifi cant accounting estimates made by management, as well as evaluating the overall presentation of the fi nancial statements.
We believe that the audit evidence we have obtained is suffi cient and appropriate to provide a basis for our audit opinion.
OpinionIn our opinion, the fi nancial statements referred to above present fairly, in all material respects, the fi nancial position of the PLGIT Portfolio, PLGIT/PRIME Portfolio, PLGIT/ARM Portfolio, PLGIT/TERM Series DEC 17 and PLGIT/TERM Series MMM of the Pennsylvania Local Government Investment Trust at December 31, 2016, and the changes in their net position for the year or period then ended, in conformity with U.S. generally accepted accounting principles.
Required Supplementary InformationU.S. generally accepted accounting principles require that the Management’s Discussion and Analysis on pages 2 through 7 be presented to supplement the basic fi nancial statements. Such information, although not a part of the basic fi nancial statements, is required by the Government Accounting Standards Board, which considers it to be an essential part of fi nancial reporting for placing the basic fi nancial statements in an appropriate operational, economic or historical context. We have applied certain limited procedures to the required supplementary information in accordance with auditing standards generally accepted in the United States, which consisted of inquiries of management about the methods of preparing the information and comparing the information for consistency with management’s responses to our inquiries, the basic fi nancial statements, and other knowledge we obtained during our audit of the basic fi nancial statements. We do not express an opinion or provide any assurance on the information because the limited procedures do not provide us with suffi cient evidence to express an opinion or provide any assurance.
Other Supplementary InformationOur audits were conducted for the purpose of forming an opinion on the basic fi nancial statements as a whole. The accompanying Schedules of Investments of the PLGIT Portfolio, PLGIT/PRIME Portfolio, PLGIT/ARM Portfolio and PLGIT/TERM Series DEC 17 as of December 31, 2016 are presented for purposes of additional analysis and are not required parts of the basic fi nancial statements. Such information is the responsibility of management. The information has not been subjected to the auditing procedures applied in the audits of the basic fi nancial statements and, accordingly, we express no opinion on them.
Philadelphia, Pennsylvania
April 27, 2017

10 PLGIT Annual Report | December 31, 2016
Statements of Net PositionDecember 31, 2016 PLGIT PLGIT/PRIME PLGIT/ARM PLGIT/TERM Portfolio Portfolio Portfolio Series DEC17 Series MMMAssetsInvestments . . . . . . . . . . . . . . . . . $ 1,557,812,496 $ 303,798,151 $ 515,146,065 $ 305,334,970 Cash and Cash Equivalents . . . . 394,347,430(1) 54,134,465(1) 107,676,874(1) 198,000 $ 40,925 Interest Receivable . . . . . . . . . . . 4,784,429 540,034 1,042,875 420,735 –Receivable for Securities Matured 100,000,000 – – – –Other Assets . . . . . . . . . . . . . . . . – – – 2,331 297Total Assets . . . . . . . . . . . . . . . . . 2,056,944,355 358,472,650 623,865,814 305,956,036 41,222LiabilitiesRedemptions Payable . . . . . . . . . 309,190 – 97,053 – –Subscriptions Received in Advance 1,324,970 – – – –Management Fees Payable. . . . . 373,561 59,230 87,724 58,496 17,567Association Sponsorship Fees Payable. . . . . . . . . . . . . . 41,967 9,820 – 12,113 7,580Banking Fees Payable. . . . . . . . . 15,571 4,658 4,434 2,008 342Legal Fees Payable . . . . . . . . . . . 2,777 484 6,000 408 31Audit Fees Payable . . . . . . . . . . . 28,000 18,500 19,500 22,500 15,500Other Accrued Expenses . . . . . . . 66,575 16,020 19,642 1,584 202Total Liabilities . . . . . . . . . . . . . . 2,162,611 108,712 234,353 97,109 41,222Net Position . . . . . . . . . . . . . . . . $ 2,054,781,744 $ 358,363,938 $ 623,631,461 $ 305,858,927 $ –Net Position Consists of: . . . . . PLGIT/PLGIT-Class (applicable to 1,219,123,141 shares of outstanding benefi cial interest2) $ 1,219,123,141 PLGIT/PLUS-Class (applicable to 218,585,549 shares of outstanding benefi cial interest2) $ 218,585,549 PLGIT/I-Class (applicable to 617,073,054 shares of outstanding benefi cial interest2) $ 617,073,054 PLGIT/PRIME Portfolio (applicable to 358,363,938 shares of outstanding benefi cial interest2) $ 358,363,938 PLGIT/ARM Portfolio (applicable to 623,631,461 shares of outstanding benefi cial interest2) $ 623,631,461 PLGIT/TERM Series DEC 17 (applicable to 307,091,475 shares of outstanding benefi cial interest, unlimited authorization, no par value) $305,858,927
(1) Includes cash and bank deposit accounts which are subject to a 1 day put. Guaranteed by Federal Home Loan Bank letters of credit.
(2) Unlimited authorization. No par value. Equivalent to $1.00 per share.
The accompanying notes are an integral part of these fi nancial statements.

PLGIT Annual Report | December 31, 2016 11
Statements of Changes in Net Position PLGIT PLGIT/PRIME PLGIT/ARM PLGIT/TERM Portfolio Portfolio Portfolio Series DEC 17 Series MMM May 24, 2016(1)
Year Ended Year Ended Year Ended through Year Ended December 31, December 31, December 31, December 31, December 31, 2016 2016 2016 2016 2016(2)
Income Investment Income . . . . . . . . . $ 10,903,854 $ 1,229,095 $ 3,257,968 $ 1,019,369 $ 780,457 Expenses Management Fees. . . . . . . . . . – 304,804 1,016,176 95,496 146,874 PLGIT-Class . . . . . . . . . . . . . 3,249,391 – – – – PLGIT/PLUS-Class . . . . . . . . 355,046 – – – – PLGIT/I-Class . . . . . . . . . . . . 729,601 – – – – Association Sponsorship Fees . 200,981 19,298 – 16,745 27,439 Cash Management Fees . . . . . . – 5,919 10,503 589 592 PLGIT-Class . . . . . . . . . . . . . 142,411 – – – – Custodian Fees . . . . . . . . . . . . . 77,374 10,778 28,619 5,394 7,232 Legal Fees . . . . . . . . . . . . . . . . . 51,784 18,744 36,000 7,900 4,770 Audit Fees . . . . . . . . . . . . . . . . . 28,000 18,500 19,500 22,500 23,565 Trustee Expenses . . . . . . . . . . . 35,936 3,013 – 2,039 2,742 Other Expenses . . . . . . . . . . . . . 103,554 22,497 22,813 – 2,328 Total Expenses . . . . . . . . . . . . . 4,974,078 403,553 1,133,611 150,663 215,542 Less: Management Fee Waivers (57,306) (83,825) – – (17,425) Association Sponsorship Fee Waivers . . . . . . . . . . . (17,493) – – (86) (3,253) Expenses Paid Indirectly . . . . . (178,580) (1,359) (10,503) (356) (531) Net Expenses . . . . . . . . . . . . . 4,720,699 318,369 1,123,108 150,221 194,333Net Investment Income . . . . . . . 6,183,155 910,726 2,134,860 869,148 586,124Other Income Bond Pool Sponsorship Fees . . 87,576 3,303 – 3,840 6,890 Net Realized Gain/(Loss) on Sale of Investments . . . . . . . . 32,945 3,159 17,409 3,956 504 Total Other Income . . . . . . . . . . 120,521 6,462 17,409 7,796 7,394Net Increase from Investment Operations Before Capital Transactions . . . . . . . . 6,303,676 917,188 2,152,269 876,944 593,518 Capital Shares Issued . . . . . . . 479,457,619 1,144,074,881 372,985,438 171,145,000 PLGIT-Class . . . . . . . . . . . . . 6,972,833,832 PLGIT/PLUS-Class. . . . . . . . 135,292,393 PLGIT/I-Class . . . . . . . . . . . . 887,279,460 Capital Shares Redeemed . . . (126,554,292) (1,010,738,914) (68,003,455) (420,164,932) PLGIT-Class . . . . . . . . . . . . . (6,757,912,826) PLGIT/PLUS-Class. . . . . . . . (115,685,669) PLGIT/I-Class . . . . . . . . . . . . (501,214,960) Change in Net Position . . . . . . . 626,895,906 353,820,515 135,488,236 305,858,927 (248,426,414)Net Position – Beginning of Period . . . . . . . 1,427,885,838 4,543,423 488,143,225 – 248,426,414Net Position – End of Period . . $ 2,054,781,744 $ 358,363,938 $ 623,631,461 $ 305,858,927 $ –
(1) Commencement of operations for PLGIT/TERM Series DEC 17.(2) Scheduled termination date for PLGIT/TERM Series MMM.The accompanying notes are an integral part of these fi nancial statements.

12 PLGIT Annual Report | December 31, 2016
Notes to Financial Statements
A. Organization and Reporting EntityPennsylvania Local Government Investment Trust (the “Trust”) was organized under an instrument of trust on February 1, 1981. An elected Board of Trustees is responsible for the overall management of the Trust, including formation and implementation of its investment and operating policies. The Trust is a non-taxable investment fund established for local governments and school districts in Pennsylvania under provisions of the Pennsylvania Intergovernmental Cooperation Act and related statutes. The Trust has not provided or obtained any legally binding guarantees to support the value of shares. For all matters requiring a vote of investors, each investor is entitled to one vote for each full share (and a fractional vote for each fractional share) of any portfolio of the Trust. The Trust is not required to register with the Securities and Exchange Commission (“SEC”) as an investment company. All participation in the Trust is voluntary.
The Trust currently consists of the PLGIT Portfolio, PLGIT/PRIME Portfolio, PLGIT/ARM Portfolio and PLGIT/TERM Series. The PLGIT Portfolio offers PLGIT-Class, PLGIT/PLUS-Class and PLGIT/I-Class shares (each a “Class”). Multiple PLGIT/TERM Series are created with staggered maturity dates. The fi nancial statements of each PLGIT/TERM Series are prepared on an interim date if the series will be opened for greater than 12 months and following the termination date of each individual PLGIT/TERM Series. These fi nancial statements and related notes encompass PLGIT Portfolio, PLGIT/PRIME Portfolio, PLGIT/ARM Portfolio, PLGIT/TERM Series DEC 17 and PLGIT/TERM Series MMM (each a “Portfolio” and collectively, the “Portfolios”). PLGIT/TERM Series DEC 17 commenced operations on May 24, 2016 and is scheduled to terminate its operations on December 31, 2017. PLGIT/TERM Series MMM commenced operations May 21, 2015 and terminated its operations on December 31, 2016.
PLGIT/TERM Series’ shares have termination dates of up to one year. PLGIT/TERM Series offer investors an estimated yield on their investments when the shares are purchased. The investment strategy of PLGIT/TERM Series is to match, as closely as possible, the cash fl ows required to meet investors’ planned redemptions, including the projected dividend, with the cash fl ows from the investment portfolio. Consistent with this strategy, active trading of securities held by the Portfolio will be practiced with the objective of enhancing the overall yield of the Portfolio. An investor only receives dividends from the investment of the PLGIT/TERM Series in which it is invested. At the termination date of any PLGIT/TERM Series, any excess net income of the Series may be distributed in the form of a supplemental dividend only to investors of the Series that are outstanding on the termination date of the Series, and the excess net income will be allocated on a pro rata basis to all investors then outstanding. The investment portfolio of each PLGIT/TERM Series is accounted for independent of the investment portfolio of any other Series or Portfolio of the Trust. In the event a PLGIT/TERM Series was to realize a loss (whether of principal or interest), no contribution would be made to such PLGIT/TERM Series from any other Series or Portfolio of the Trust to offset such loss. No Series would constitute security or collateral for any other Series or Portfolio.
B. Summary of Signifi cant Accounting PoliciesThe following is a summary of signifi cant accounting policies followed by the Trust in preparation of its fi nancial statements.
Measurement Focus and Basis of AccountingThe Trust reports transactions and balances using the economic resources management focus and the accrual basis of accounting. Under this method, revenues are recorded when earned and expenses are recorded at the time liabilities are incurred.
Cash and Cash EquivalentsThe Trust refl ects cash on deposit in bank accounts which are available within one business day as cash and cash equivalents. Certifi cates of deposit are disclosed separately as investments in the fi nancial statements.
Valuation of InvestmentsIn accordance with the authoritative guidance on fair value measurements and disclosures under Governmental Accounting Standards Board (“GASB”) Statement No. 72, the Trust discloses the fair value of its investments in a hierarchy that prioritizes the inputs to valuation techniques used to measure the fair value. The hierarchy gives the highest priority to valuations based upon unadjusted quoted prices in active markets for identical assets or liabilities (level 1 measurement) and the lowest priority to valuations based upon unobservable inputs that are signifi cant to the valuation (level 3 measurements). The guidance establishes three levels of the fair value hierarchy as follows:

PLGIT Annual Report | December 31, 2016 13
Level 1 – Quoted prices in active markets for identical assets.
Level 2 – Inputs other than quoted prices that are observable for the asset, including quoted prices for similar investments based on interest rates, credit risk and like factors.
Level 3 – Unobservable inputs for the assets, including the Portfolios’ own assumption for determining fair value.
The Trust’s investments are assigned a level based upon the observability of the inputs which are signifi cant to the overall valuation. In accordance with GASB Statement No. 79, securities held by the PLGIT Portfolio, PLGIT/PRIME Portfolio and PLGIT/ARM Portfolio are valued at amortized cost, which approximates fair value. GASB Statement No. 79 requires a comparison of these Portfolios’ investments on an amortized cost basis to fair values determined on a market value basis at least monthly. The market prices used to determine fair values in this comparison, as well as the fair values for investments held by the PLGIT/TERM Series, are derived from closing bid prices as of the last business day of the month as supplied by third-party pricing services. Where prices are not available from these generally recognized sources, the securities are priced using a yield-based matrix system to arrive at an estimated market value. Prices that fall between data points are interpolated. The inputs or methodology used for valuing securities are not necessarily an indication of the risk associated with investing in those securities. Since the value is not obtained from a quoted price in an active market, all securities held by the Portfolios at December 31, 2016 are categorized as Level 2. There were no transfers between levels in any of the Portfolios during the year ended December 31, 2016.
Investment TransactionsSecurity transactions are accounted for on trade date (date the order to buy or sell is executed). Costs used in determining realized gains and losses on the sale of investment securities are those of specifi c securities sold. Interest income is recorded using the accrual method. Discounts and premiums are accreted and amortized, respectively, to interest income over the lives of the respective securities. Unrealized losses of $39,203, which represent the change in the fair value of investment securities held by the PLGIT/TERM Series DEC 17 as of the reporting date, are included in investment income on the Statement of Changes in Net Position.
Repurchase AgreementsRepurchase agreements entered into with broker-dealers are secured by U.S. government or agency obligations. The Trust’s custodian takes possession of the collateral pledged for investments in repurchase agreements. The Trust also enters into tri-party repurchase agreements. Collateral pledged for tri-party repurchase agreements is held for the Trust by an independent third-party custodian bank until the maturity of the repurchase agreement. Repurchase agreements are collateralized at 102% of the obligation’s principal and interest value. In the event of default on the obligation to repurchase, the Trust has the right to liquidate the collateral and apply the proceeds in satisfaction of the obligation. In the event of default or bankruptcy by the other party to the agreement, realization and/or retention of the collateral may be subject to delays from legal proceedings.
Dividends and DistributionsOn a daily basis, the PLGIT Portfolio, PLGIT/PRIME Portfolio and PLGIT/ARM Portfolio declare dividends and distributions from their net investment income and net realized gains or losses from securities transactions, if any. Such dividends and distributions are payable to investors of record at the time of the previous computation of each Portfolio’s net asset value and are distributed to each investor’s account by purchase of additional shares of the respective Portfolio on the last day of each month for the PLGIT-Class, the PLGIT/PRIME Portfolio and the PLGIT/ARM Portfolio, and quarterly for the PLGIT/PLUS-Class and PLGIT/I-Class. For the year ended December 31, 2016, dividends totaling $3,376,526, $810,737 and $2,116,413 were distributed for the PLGIT-Class, PLGIT/PLUS-Class and PLGIT/I-Class, respectively, and dividends totaling $917,188 and $2,152,269 were distributed for the PLGIT/PRIME Portfolio and PLGIT/ARM Portfolio, respectively.
Dividends to investors in PLGIT/TERM Series are declared and paid on the termination date of each PLGIT/TERM Series, except for dividends on shares redeemed pursuant to a planned early redemption or a premature redemption before the termination date of such series, which will be declared and paid when such shares are redeemed. For the year ended December 31, 2016, dividends totaling $184,179 and $879,932 were distributed for PLGIT/TERM Series DEC 17 and MMM, respectively, and are included in the capital shares redeemed on the Statements of Changes in Net Position.
14 PLGIT Annual Report | December 31, 2016
Redemption RestrictionsShares of the PLGIT Portfolio, PLGIT/PRIME Portfolio and PLGIT/ARM Portfolio are available to be redeemed upon proper notice without restrictions under normal operating conditions. There are no limits to the number of redemptions that can be made as long as an investor has a suffi cient number of shares to meet their redemption request. The Trust’s Board of Trustees can suspend the right of withdrawal or postpone the date of payment if there is an emergency that makes the sale of any of the Portfolio’s securities or determination of its net asset value not reasonably practical.
Shares of PLGIT/TERM Series are purchased to mature upon pre-determined maturity dates selected by the investor at the time of purchase. Should an investor need to redeem shares in a PLGIT/TERM Series prematurely, they must provide notice at least 7 days prior to premature redemption date. The value of a pre-mature redemption is equal to the original price for such share, plus dividends thereon, at the projected yield less such share’s allocation of any losses incurred by the series, less a premature redemption penalty, if any. Refer to the Trust’s Information Statement for additional information.
Income and Expense AllocationsIncome, common expenses and realized gains and losses are allocated to the classes of the PLGIT Portfolio based on the relative net assets of each class when earned or incurred. Expenses specifi c a class or Portfolio of the Trust, are allocated to the class or Portfolio to which they relate. Certain expenses of the Trust, such as legal fees and Trustee expenses, are allocated between the Portfolios based on the relative net assets of each when such expenses are incurred.
Use of EstimatesThe preparation of fi nancial statements under accounting principles generally accepted in the United States of America (“GAAP”) requires management to make estimates and assumptions that affect the reported amounts of assets and liabilities and disclosure of contingent assets and liabilities at the date of the fi nancial statements and the reported amounts of revenues and expenses during the period. Actual results could differ from those estimates made by management.
Income Tax StatusThe Trust is not subject to Federal or state income tax upon the income realized by it. The Trust has evaluated this tax position to determine whether the tax position is “more likely-than-not” of being sustained by the applicable tax authority. Management has concluded that no provision for income tax is required for the Trust’s fi nancial statements.
Representations and Indemnifi cationsIn the normal course of business, the Trust enters into contracts on behalf of the Portfolios that contain a variety of representations which provide general indemnifi cations. The Portfolios’ maximum exposure under these arrangements is unknown as this would involve future claims that may be made against the Portfolios that have not yet occurred. However, based on experience the Trust expects the risk of loss to be remote.
Subsequent Events EvaluationThe Trust has evaluated subsequent events through April 27, 2017, the date through which procedures were performed to prepare the fi nancial statements for issuance. No events have taken place that meet the defi nition of a subsequent event requiring adjustment or disclosure in these fi nancial statements.
C. Investment RisksUnder GASB Statement No. 40, state and local governments and other municipal entities are required to disclose credit risk, concentration of credit risk, and interest rate risk for investment portfolios. The following risk disclosures of the PLGIT Portfolio, PLGIT/PRIME Portfolio, PLGIT/ARM Portfolio and PLGIT/TERM Series DEC 17 as of December 31, 2016 have been provided for the information of the Portfolios’ investors.
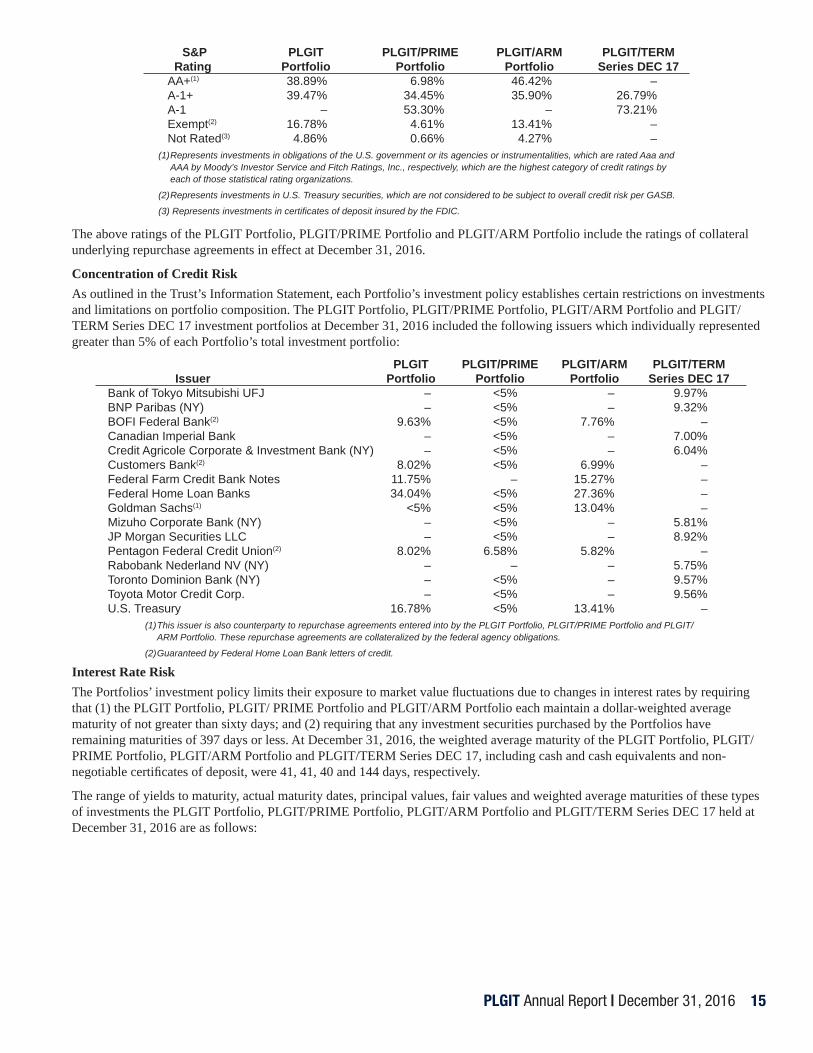
Credit RiskThe Portfolios’ investment policies are outlined in the Trust’s Information Statement. The Portfolios may only purchase securities which are permitted under Pennsylvania law for boroughs, towns, townships, counties, cities, school districts, and authorities of the Commonwealth of Pennsylvania. As of December 31, 2016, the PLGIT Portfolio, PLGIT/PRIME Portfolio, PLGIT/ARM Portfolio and PLGIT/TERM Series DEC 17 were comprised of investments which were, in aggregate, rated by Standard and Poor’s (“S&P”) as follows:
PLGIT Annual Report | December 31, 2016 15
S&P PLGIT PLGIT/PRIME PLGIT/ARM PLGIT/TERM Rating Portfolio Portfolio Portfolio Series DEC 17 AA+(1) 38.89% 6.98% 46.42% – A-1+ 39.47% 34.45% 35.90% 26.79% A-1 – 53.30% – 73.21% Exempt(2) 16.78% 4.61% 13.41% – Not Rated(3) 4.86% 0.66% 4.27% –
(1) Represents investments in obligations of the U.S. government or its agencies or instrumentalities, which are rated Aaa and AAA by Moody’s Investor Service and Fitch Ratings, Inc., respectively, which are the highest category of credit ratings by each of those statistical rating organizations.
(2) Represents investments in U.S. Treasury securities, which are not considered to be subject to overall credit risk per GASB.
(3) Represents investments in certifi cates of deposit insured by the FDIC.
The above ratings of the PLGIT Portfolio, PLGIT/PRIME Portfolio and PLGIT/ARM Portfolio include the ratings of collateral underlying repurchase agreements in effect at December 31, 2016.
Concentration of Credit RiskAs outlined in the Trust’s Information Statement, each Portfolio’s investment policy establishes certain restrictions on investments and limitations on portfolio composition. The PLGIT Portfolio, PLGIT/PRIME Portfolio, PLGIT/ARM Portfolio and PLGIT/TERM Series DEC 17 investment portfolios at December 31, 2016 included the following issuers which individually represented greater than 5% of each Portfolio’s total investment portfolio:
PLGIT PLGIT/PRIME PLGIT/ARM PLGIT/TERM Issuer Portfolio Portfolio Portfolio Series DEC 17 Bank of Tokyo Mitsubishi UFJ – <5% – 9.97% BNP Paribas (NY) – <5% – 9.32% BOFI Federal Bank(2) 9.63% <5% 7.76% – Canadian Imperial Bank – <5% – 7.00% Credit Agricole Corporate & Investment Bank (NY) – <5% – 6.04% Customers Bank(2) 8.02% <5% 6.99% – Federal Farm Credit Bank Notes 11.75% – 15.27% – Federal Home Loan Banks 34.04% <5% 27.36% – Goldman Sachs(1) <5% <5% 13.04% – Mizuho Corporate Bank (NY) – <5% – 5.81% JP Morgan Securities LLC – <5% – 8.92% Pentagon Federal Credit Union(2) 8.02% 6.58% 5.82% – Rabobank Nederland NV (NY) – – – 5.75% Toronto Dominion Bank (NY) – <5% – 9.57% Toyota Motor Credit Corp. – <5% – 9.56% U.S. Treasury 16.78% <5% 13.41% –
(1) This issuer is also counterparty to repurchase agreements entered into by the PLGIT Portfolio, PLGIT/PRIME Portfolio and PLGIT/ARM Portfolio. These repurchase agreements are collateralized by the federal agency obligations.
(2) Guaranteed by Federal Home Loan Bank letters of credit.
Interest Rate RiskThe Portfolios’ investment policy limits their exposure to market value fl uctuations due to changes in interest rates by requiring that (1) the PLGIT Portfolio, PLGIT/ PRIME Portfolio and PLGIT/ARM Portfolio each maintain a dollar-weighted average maturity of not greater than sixty days; and (2) requiring that any investment securities purchased by the Portfolios have remaining maturities of 397 days or less. At December 31, 2016, the weighted average maturity of the PLGIT Portfolio, PLGIT/PRIME Portfolio, PLGIT/ARM Portfolio and PLGIT/TERM Series DEC 17, including cash and cash equivalents and non-negotiable certifi cates of deposit, were 41, 41, 40 and 144 days, respectively.
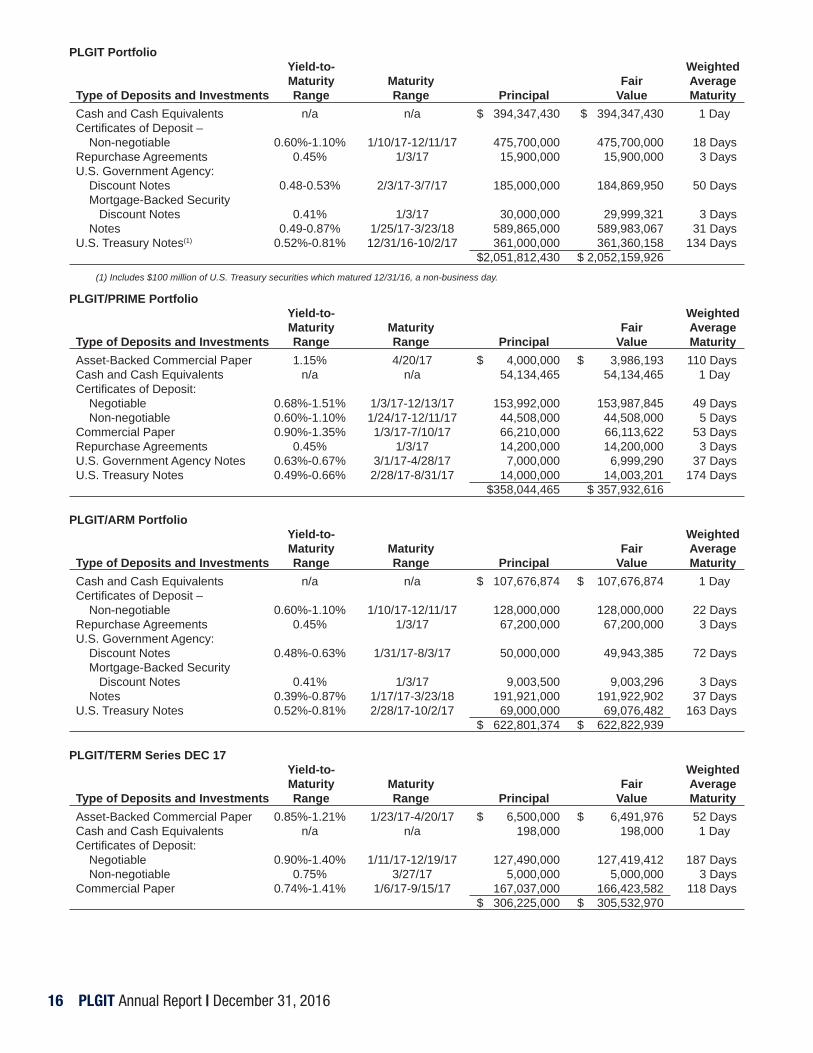
The range of yields to maturity, actual maturity dates, principal values, fair values and weighted average maturities of these types of investments the PLGIT Portfolio, PLGIT/PRIME Portfolio, PLGIT/ARM Portfolio and PLGIT/TERM Series DEC 17 held at December 31, 2016 are as follows:
16 PLGIT Annual Report | December 31, 2016
PLGIT Portfolio Yield-to- Weighted Maturity Maturity Fair Average Type of Deposits and Investments Range Range Principal Value Maturity Cash and Cash Equivalents n/a n/a $ 394,347,430 $ 394,347,430 1 Day Certifi cates of Deposit – Non-negotiable 0.60%-1.10% 1/10/17-12/11/17 475,700,000 475,700,000 18 Days Repurchase Agreements 0.45% 1/3/17 15,900,000 15,900,000 3 Days U.S. Government Agency: Discount Notes 0.48-0.53% 2/3/17-3/7/17 185,000,000 184,869,950 50 Days Mortgage-Backed Security Discount Notes 0.41% 1/3/17 30,000,000 29,999,321 3 Days Notes 0.49-0.87% 1/25/17-3/23/18 589,865,000 589,983,067 31 Days U.S. Treasury Notes(1) 0.52%-0.81% 12/31/16-10/2/17 361,000,000 361,360,158 134 Days
$2,051,812,430 $ 2,052,159,926 (1) Includes $100 million of U.S. Treasury securities which matured 12/31/16, a non-business day.
PLGIT/PRIME Portfolio Yield-to- Weighted Maturity Maturity Fair Average Type of Deposits and Investments Range Range Principal Value Maturity Asset-Backed Commercial Paper 1.15% 4/20/17 $ 4,000,000 $ 3,986,193 110 Days Cash and Cash Equivalents n/a n/a 54,134,465 54,134,465 1 Day Certifi cates of Deposit: Negotiable 0.68%-1.51% 1/3/17-12/13/17 153,992,000 153,987,845 49 Days Non-negotiable 0.60%-1.10% 1/24/17-12/11/17 44,508,000 44,508,000 5 Days Commercial Paper 0.90%-1.35% 1/3/17-7/10/17 66,210,000 66,113,622 53 Days Repurchase Agreements 0.45% 1/3/17 14,200,000 14,200,000 3 Days U.S. Government Agency Notes 0.63%-0.67% 3/1/17-4/28/17 7,000,000 6,999,290 37 Days U.S. Treasury Notes 0.49%-0.66% 2/28/17-8/31/17 14,000,000 14,003,201 174 Days
$358,044,465 $ 357,932,616
PLGIT/ARM Portfolio Yield-to- Weighted Maturity Maturity Fair Average Type of Deposits and Investments Range Range Principal Value Maturity Cash and Cash Equivalents n/a n/a $ 107,676,874 $ 107,676,874 1 Day Certifi cates of Deposit – Non-negotiable 0.60%-1.10% 1/10/17-12/11/17 128,000,000 128,000,000 22 Days Repurchase Agreements 0.45% 1/3/17 67,200,000 67,200,000 3 Days U.S. Government Agency: Discount Notes 0.48%-0.63% 1/31/17-8/3/17 50,000,000 49,943,385 72 Days Mortgage-Backed Security Discount Notes 0.41% 1/3/17 9,003,500 9,003,296 3 Days Notes 0.39%-0.87% 1/17/17-3/23/18 191,921,000 191,922,902 37 Days U.S. Treasury Notes 0.52%-0.81% 2/28/17-10/2/17 69,000,000 69,076,482 163 Days
$ 622,801,374 $ 622,822,939
PLGIT/TERM Series DEC 17 Yield-to- Weighted Maturity Maturity Fair Average Type of Deposits and Investments Range Range Principal Value Maturity Asset-Backed Commercial Paper 0.85%-1.21% 1/23/17-4/20/17 $ 6,500,000 $ 6,491,976 52 Days Cash and Cash Equivalents n/a n/a 198,000 198,000 1 Day Certifi cates of Deposit: Negotiable 0.90%-1.40% 1/11/17-12/19/17 127,490,000 127,419,412 187 Days Non-negotiable 0.75% 3/27/17 5,000,000 5,000,000 3 Days Commercial Paper 0.74%-1.41% 1/6/17-9/15/17 167,037,000 166,423,582 118 Days
$ 306,225,000 $ 305,532,970
PLGIT Annual Report | December 31, 2016 17
The weighted average maturities shown in the preceding tables are calculated based on the stated maturity dates with the following exceptions: (1) fl oating or variable rate securities are assumed to have an effective maturity of the date upon which the securities interest rate next resets; (2) the effective maturity of callable securities is assumed to be its stated maturity unless the security had been called as of the reporting date, in which case the effective maturity would be assumed to be its called date; and (3) the effective maturity of cash and cash equivalents are assumed to be one day. Refer to the Schedules of Investments included in the Supplementary Information that follows for further information.
D. Fees and Charges Management Fees
PFM Asset Management LLC is a registered investment adviser under the Investment Advisers Act of 1940. The Board of Trustees, on behalf of each of the Portfolios, has entered into an agreement with PFM Asset Management LLC (“PFMAM”) to provide management services to the Portfolios including investment advisory, distribution, shareholder accounting and certain administrative services.
Fees for all management services provided by PFMAM to the PLGIT-Class are calculated at an annual rate of 0.29% of the average daily net assets of the Portfolio up to $800 million, 0.24% on the next $300 million, and 0.21% on such assets in excess of $1.1 billion. Fees for all management services provided by PFMAM to PLGIT/PLUS-Class and the PLGIT/I-Class are calculated based on the combined average daily net assets of those classes at the following rates: up to $400 million, 0.20% for the PLGIT/PLUS-Class and 0.18% for the PLGIT/I-Class; on the next $400 million, 0.13% for the PLGIT/PLUS-Class and 0.11% for the PLGIT/I-Class; on the next $300 million, 0.12% for the PLGIT/PLUS-Class and 0.10% for the PLGIT/I-Class; and on such combined net assets in excess of $1.1 billion, 0.11% for the PLGIT/PLUS-Class and 0.09% for the PLGIT/I-Class. Fees for all management services provided by PFMAM to PLGIT/ARM are calculated at an annual rate of 0.20% of the average daily net assets of the Portfolio up to $300 million, 0.16% on the next $200 million, and 0.14% of such assets in excess of $500 million. Fees for all management services provided by PFMAM to PLGIT/PRIME are calculated at an annual rate of 0.20% of the average daily net assets of the Portfolio up to $400 million, 0.13% on the next $400 million, 0.12% on the next $300 million, and 0.11% of such assets in excess of $1.1 billion. Fees for all management services provided by PFMAM to PLGIT/TERM are calculated at an annual rate of 0.10% of the average daily net assets. Shares of the Trust’s portfolios are distributed by PFM Fund Distributors, Inc., a wholly owned subsidiary of PFMAM. PFM Fund Distributors, Inc. is not compensated by the Trust for these services.
In accordance with these contracts, PFMAM is obligated to reimburse the PLGIT/PLUS-Class, PLGIT/ARM Portfolio, PLGIT/PRIME Portfolio and each PLGIT/TERM Series for the amount by which annual operating expenses including management services, custodian, legal and audit fees exceed 0.30%, 0.25%, 0.30% and 0.18% of average daily net assets, respectively. There were no contractual reimbursements for the year ended December 31, 2016. PFMAM voluntarily waived $17,425 of the fees to which it was entitled for PLGIT/TERM Series MMM for the year ended December 31, 2016, however, these fee waivers were not subject to the Fee Reduction Agreements listed below.
The Trust has entered into Fee Reduction Agreements with PFMAM pursuant to which PFMAM may, but shall not be obligated to, temporarily reduce a portion of its fees payable from the PLGIT Portfolio’s PLGIT-Class, PLGIT/PLUS-Class and PLGIT/I-Class shares to assist those classes in an attempt to maintain a positive yield. In the event that PFMAM elects to initiate a fee reduction, such fee reduction shall be applicable to the computation of the net asset value (“NAV”) of the respective class on the business day immediately following the date on which PFMAM gives notice to the Trust on the rate of the fee reduction to be applied in calculating the NAV. The Trust has also entered into a Fee Reduction Agreement with PFMAM on behalf of the PLGIT/PRIME Portfolio, the terms of which are substantially identical to those related to the earlier Fee Reduction Agreement entered into on behalf of the PLGIT Portfolio’s classes. A fee reduction subject to either Fee Reduction Agreement shall remain in effect until notice is provided to the Trust by PFMAM regarding its intent to terminate its fee reduction or revise, upward or downward, the rate of its fee reduction.
Subject to the restrictions contained herein, at any time after a fee reduction has been terminated, PFMAM may elect to have the amount of its accumulated reduced fees restored in whole or in part for a class under the conditions described in that class’s Fee Reduction Agreement with the Trust by way of a payment of fees in excess of the rate it was entitled to, prior to any fee reduction, all as set forth in the respective Fee Reduction Agreement. In all cases, the amount of accumulated reduced fees to be restored in a given month may not exceed 115% of the fees payable under the terms of PFMAM’s related agreement with the Trust. No amount shall be paid to PFMAM at any time after the expiration of three years after such amount has been withheld by reason of the Fee Reduction Agreements.
18 PLGIT Annual Report | December 31, 2016
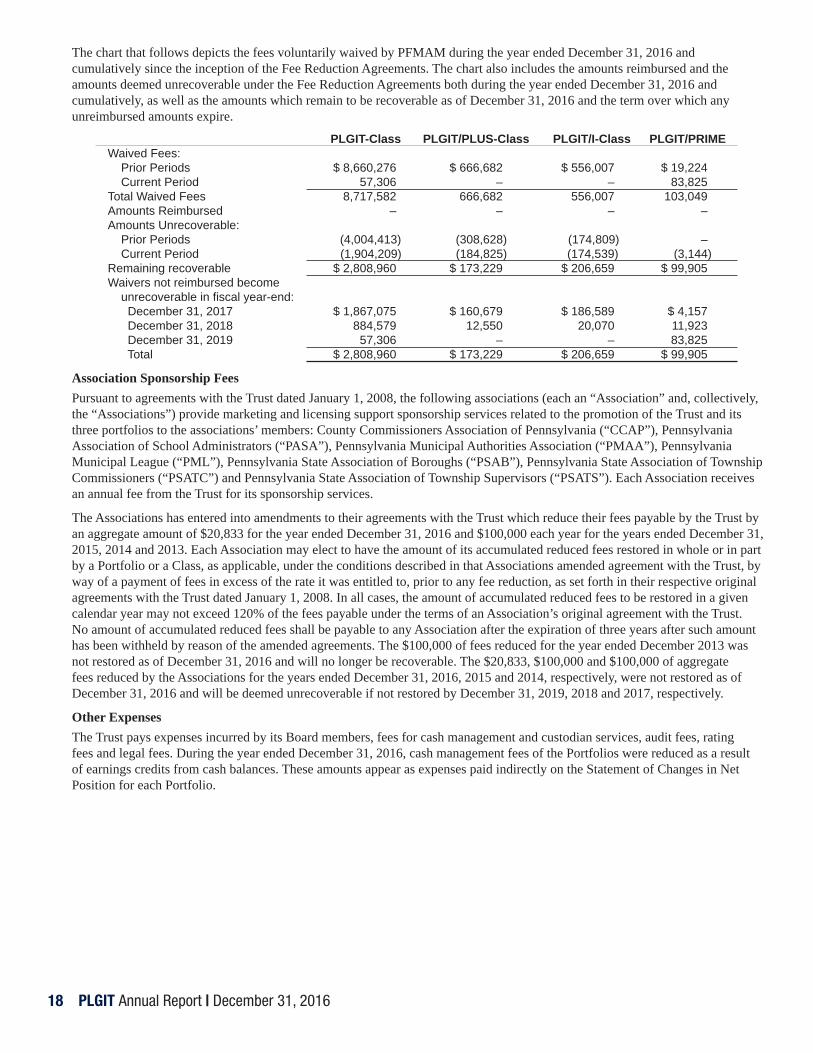
The chart that follows depicts the fees voluntarily waived by PFMAM during the year ended December 31, 2016 and cumulatively since the inception of the Fee Reduction Agreements. The chart also includes the amounts reimbursed and the amounts deemed unrecoverable under the Fee Reduction Agreements both during the year ended December 31, 2016 and cumulatively, as well as the amounts which remain to be recoverable as of December 31, 2016 and the term over which any unreimbursed amounts expire.
PLGIT-Class PLGIT/PLUS-Class PLGIT/I-Class PLGIT/PRIME Waived Fees: Prior Periods $ 8,660,276 $ 666,682 $ 556,007 $ 19,224 Current Period 57,306 – – 83,825 Total Waived Fees 8,717,582 666,682 556,007 103,049 Amounts Reimbursed – – – – Amounts Unrecoverable: Prior Periods (4,004,413) (308,628) (174,809) – Current Period (1,904,209) (184,825) (174,539) (3,144) Remaining recoverable $ 2,808,960 $ 173,229 $ 206,659 $ 99,905 Waivers not reimbursed become unrecoverable in fi scal year-end: December 31, 2017 $ 1,867,075 $ 160,679 $ 186,589 $ 4,157 December 31, 2018 884,579 12,550 20,070 11,923 December 31, 2019 57,306 – – 83,825 Total $ 2,808,960 $ 173,229 $ 206,659 $ 99,905
Association Sponsorship FeesPursuant to agreements with the Trust dated January 1, 2008, the following associations (each an “Association” and, collectively, the “Associations”) provide marketing and licensing support sponsorship services related to the promotion of the Trust and its three portfolios to the associations’ members: County Commissioners Association of Pennsylvania (“CCAP”), Pennsylvania Association of School Administrators (“PASA”), Pennsylvania Municipal Authorities Association (“PMAA”), Pennsylvania Municipal League (“PML”), Pennsylvania State Association of Boroughs (“PSAB”), Pennsylvania State Association of Township Commissioners (“PSATC”) and Pennsylvania State Association of Township Supervisors (“PSATS”). Each Association receives an annual fee from the Trust for its sponsorship services.
The Associations has entered into amendments to their agreements with the Trust which reduce their fees payable by the Trust by an aggregate amount of $20,833 for the year ended December 31, 2016 and $100,000 each year for the years ended December 31, 2015, 2014 and 2013. Each Association may elect to have the amount of its accumulated reduced fees restored in whole or in part by a Portfolio or a Class, as applicable, under the conditions described in that Associations amended agreement with the Trust, by way of a payment of fees in excess of the rate it was entitled to, prior to any fee reduction, as set forth in their respective original agreements with the Trust dated January 1, 2008. In all cases, the amount of accumulated reduced fees to be restored in a given calendar year may not exceed 120% of the fees payable under the terms of an Association’s original agreement with the Trust. No amount of accumulated reduced fees shall be payable to any Association after the expiration of three years after such amount has been withheld by reason of the amended agreements. The $100,000 of fees reduced for the year ended December 2013 was not restored as of December 31, 2016 and will no longer be recoverable. The $20,833, $100,000 and $100,000 of aggregate fees reduced by the Associations for the years ended December 31, 2016, 2015 and 2014, respectively, were not restored as of December 31, 2016 and will be deemed unrecoverable if not restored by December 31, 2019, 2018 and 2017, respectively.
Other ExpensesThe Trust pays expenses incurred by its Board members, fees for cash management and custodian services, audit fees, rating fees and legal fees. During the year ended December 31, 2016, cash management fees of the Portfolios were reduced as a result of earnings credits from cash balances. These amounts appear as expenses paid indirectly on the Statement of Changes in Net Position for each Portfolio.
PLGIT Annual Report | December 31, 2016 19
E. Bond Pool Sponsorship FeesThe Trust and the Emmaus General Authority (the “Authority”), a municipal authority organized by the Borough of Emmaus, Lehigh County, Pennsylvania sponsor various Bond Pool Programs (the “Programs”). Under these programs, the Authority loans the proceeds of certain of its revenue bonds to local governments in Pennsylvania. The Trust has the right, together with the Authority, to approve borrowers, program fees and certain other matters related to the Programs. The Trust has agreed to recommend the Programs to its investors and receives a fee, paid by the Authority, based on a percentage of the proceeds borrowed by investors. Such fees are allocated as income to the PLGIT Portfolio, PLGIT/PRIME Portfolio and PLGIT/TERM Series based on net assets, and are reported as Bond Pool Sponsorship Fees in the Statement of Changes in Net Position.
F. Self-Insurance Fund In 1989, the Trustees established a Self-Insurance Fund (the “Fund”) pursuant to a self-insurance fund agreement (the “Agreement”), the purpose of which is to indemnify each present and former Trustee and offi cer of the Trust and each former Trustee and offi cer of the former PLGIT Investment Trusts A, B and C against all liability and expense reasonably incurred or paid in connection with any claim, action, suit or proceeding involving any such Trustee or offi cer. At December 31, 2016, the Fund’s net assets aggregated $2,171,663, of which PLGIT Portfolio, PLGIT/ARM Portfolio and PLGIT/TERM Series’ proportionate shares were $1,594,136, $10,365 and $567,162, respectively. These amounts are not refl ected in the fi nancial statements included in this annual report. The Agreement provides that the Trustees of the Trust have the right to have the Trust make additional contributions to the Fund from time to time; such additional contributions are made at the discretion of the Trustees and are not mandatory. There were no contributions made during the year ended December 31, 2016. In addition, the Agreement provides that upon termination of the Agreement and liquidation of the Fund, the net assets of the Fund will be distributed to the Portfolios of the Trust.


Supplementary Information
(unaudited)
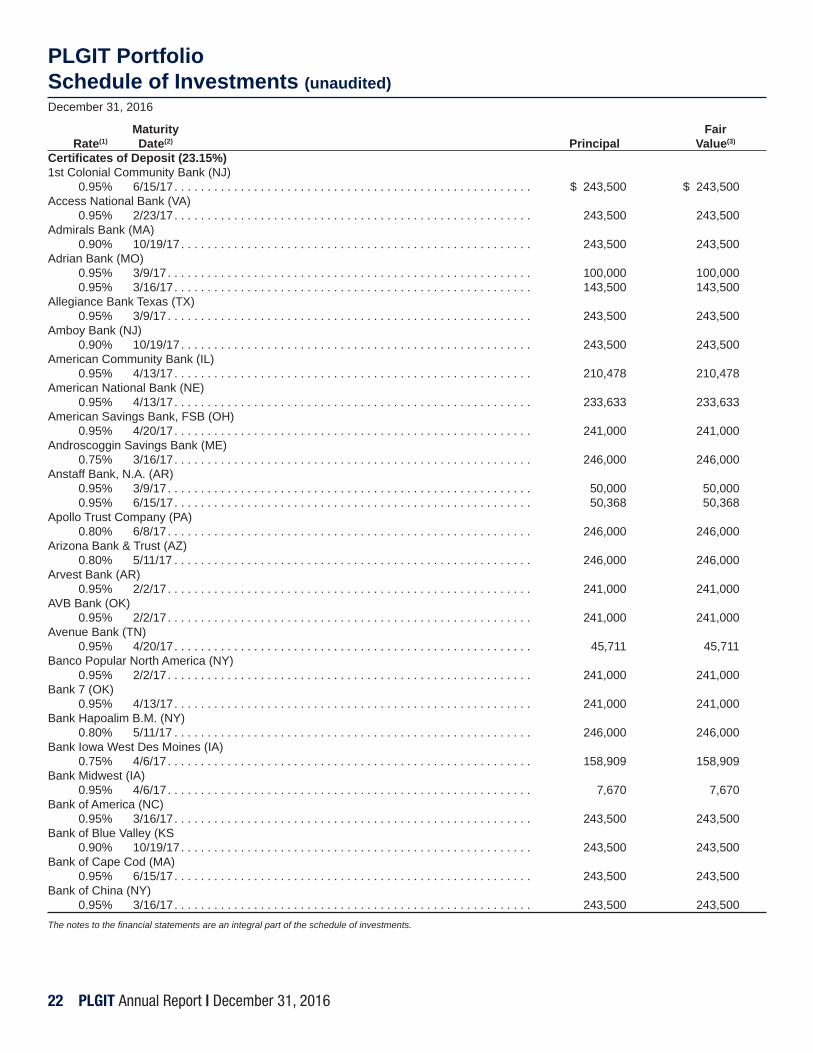
22 PLGIT Annual Report | December 31, 2016
PLGIT PortfolioSchedule of Investments (unaudited)December 31, 2016
Maturity Fair Rate(1) Date(2) Principal Value(3)
Certifi cates of Deposit (23.15%)1st Colonial Community Bank (NJ) 0.95% 6/15/17 . . . . . . . . . . . . . . . . . . . . . . . . . . . . . . . . . . . . . . . . . . . . . . . . . . . . . . $ 243,500 $ 243,500Access National Bank (VA) 0.95% 2/23/17 . . . . . . . . . . . . . . . . . . . . . . . . . . . . . . . . . . . . . . . . . . . . . . . . . . . . . . 243,500 243,500Admirals Bank (MA) 0.90% 10/19/17 . . . . . . . . . . . . . . . . . . . . . . . . . . . . . . . . . . . . . . . . . . . . . . . . . . . . . 243,500 243,500 Adrian Bank (MO) 0.95% 3/9/17 . . . . . . . . . . . . . . . . . . . . . . . . . . . . . . . . . . . . . . . . . . . . . . . . . . . . . . . 100,000 100,000 0.95% 3/16/17 . . . . . . . . . . . . . . . . . . . . . . . . . . . . . . . . . . . . . . . . . . . . . . . . . . . . . . 143,500 143,500Allegiance Bank Texas (TX) 0.95% 3/9/17 . . . . . . . . . . . . . . . . . . . . . . . . . . . . . . . . . . . . . . . . . . . . . . . . . . . . . . . 243,500 243,500Amboy Bank (NJ) 0.90% 10/19/17 . . . . . . . . . . . . . . . . . . . . . . . . . . . . . . . . . . . . . . . . . . . . . . . . . . . . . 243,500 243,500American Community Bank (IL) 0.95% 4/13/17 . . . . . . . . . . . . . . . . . . . . . . . . . . . . . . . . . . . . . . . . . . . . . . . . . . . . . . 210,478 210,478American National Bank (NE) 0.95% 4/13/17 . . . . . . . . . . . . . . . . . . . . . . . . . . . . . . . . . . . . . . . . . . . . . . . . . . . . . . 233,633 233,633American Savings Bank, FSB (OH) 0.95% 4/20/17 . . . . . . . . . . . . . . . . . . . . . . . . . . . . . . . . . . . . . . . . . . . . . . . . . . . . . . 241,000 241,000Androscoggin Savings Bank (ME) 0.75% 3/16/17 . . . . . . . . . . . . . . . . . . . . . . . . . . . . . . . . . . . . . . . . . . . . . . . . . . . . . . 246,000 246,000Anstaff Bank, N.A. (AR) 0.95% 3/9/17 . . . . . . . . . . . . . . . . . . . . . . . . . . . . . . . . . . . . . . . . . . . . . . . . . . . . . . . 50,000 50,000 0.95% 6/15/17 . . . . . . . . . . . . . . . . . . . . . . . . . . . . . . . . . . . . . . . . . . . . . . . . . . . . . . 50,368 50,368Apollo Trust Company (PA) 0.80% 6/8/17 . . . . . . . . . . . . . . . . . . . . . . . . . . . . . . . . . . . . . . . . . . . . . . . . . . . . . . . 246,000 246,000Arizona Bank & Trust (AZ) 0.80% 5/11/17 . . . . . . . . . . . . . . . . . . . . . . . . . . . . . . . . . . . . . . . . . . . . . . . . . . . . . . 246,000 246,000Arvest Bank (AR) 0.95% 2/2/17 . . . . . . . . . . . . . . . . . . . . . . . . . . . . . . . . . . . . . . . . . . . . . . . . . . . . . . . 241,000 241,000AVB Bank (OK) 0.95% 2/2/17 . . . . . . . . . . . . . . . . . . . . . . . . . . . . . . . . . . . . . . . . . . . . . . . . . . . . . . . 241,000 241,000Avenue Bank (TN) 0.95% 4/20/17 . . . . . . . . . . . . . . . . . . . . . . . . . . . . . . . . . . . . . . . . . . . . . . . . . . . . . . 45,711 45,711Banco Popular North America (NY) 0.95% 2/2/17 . . . . . . . . . . . . . . . . . . . . . . . . . . . . . . . . . . . . . . . . . . . . . . . . . . . . . . . 241,000 241,000Bank 7 (OK) 0.95% 4/13/17 . . . . . . . . . . . . . . . . . . . . . . . . . . . . . . . . . . . . . . . . . . . . . . . . . . . . . . 241,000 241,000Bank Hapoalim B.M. (NY) 0.80% 5/11/17 . . . . . . . . . . . . . . . . . . . . . . . . . . . . . . . . . . . . . . . . . . . . . . . . . . . . . . 246,000 246,000Bank Iowa West Des Moines (IA) 0.75% 4/6/17 . . . . . . . . . . . . . . . . . . . . . . . . . . . . . . . . . . . . . . . . . . . . . . . . . . . . . . . 158,909 158,909Bank Midwest (IA) 0.95% 4/6/17 . . . . . . . . . . . . . . . . . . . . . . . . . . . . . . . . . . . . . . . . . . . . . . . . . . . . . . . 7,670 7,670Bank of America (NC) 0.95% 3/16/17 . . . . . . . . . . . . . . . . . . . . . . . . . . . . . . . . . . . . . . . . . . . . . . . . . . . . . . 243,500 243,500 Bank of Blue Valley (KS 0.90% 10/19/17 . . . . . . . . . . . . . . . . . . . . . . . . . . . . . . . . . . . . . . . . . . . . . . . . . . . . . 243,500 243,500Bank of Cape Cod (MA) 0.95% 6/15/17 . . . . . . . . . . . . . . . . . . . . . . . . . . . . . . . . . . . . . . . . . . . . . . . . . . . . . . 243,500 243,500 Bank of China (NY) 0.95% 3/16/17 . . . . . . . . . . . . . . . . . . . . . . . . . . . . . . . . . . . . . . . . . . . . . . . . . . . . . . 243,500 243,500 The notes to the fi nancial statements are an integral part of the schedule of investments.
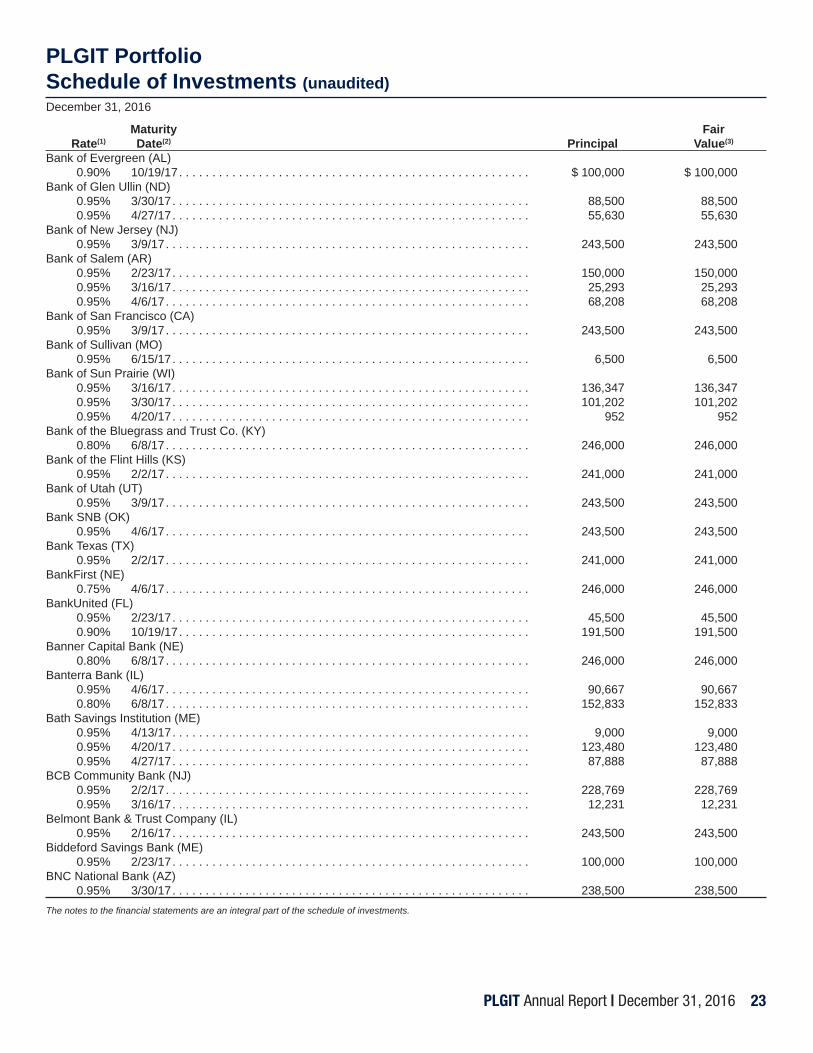
PLGIT Annual Report | December 31, 2016 23
PLGIT PortfolioSchedule of Investments (unaudited)December 31, 2016
Maturity Fair Rate(1) Date(2) Principal Value(3)
Bank of Evergreen (AL) 0.90% 10/19/17 . . . . . . . . . . . . . . . . . . . . . . . . . . . . . . . . . . . . . . . . . . . . . . . . . . . . . $ 100,000 $ 100,000 Bank of Glen Ullin (ND) 0.95% 3/30/17 . . . . . . . . . . . . . . . . . . . . . . . . . . . . . . . . . . . . . . . . . . . . . . . . . . . . . . 88,500 88,500 0.95% 4/27/17 . . . . . . . . . . . . . . . . . . . . . . . . . . . . . . . . . . . . . . . . . . . . . . . . . . . . . . 55,630 55,630Bank of New Jersey (NJ) 0.95% 3/9/17 . . . . . . . . . . . . . . . . . . . . . . . . . . . . . . . . . . . . . . . . . . . . . . . . . . . . . . . 243,500 243,500 Bank of Salem (AR) 0.95% 2/23/17 . . . . . . . . . . . . . . . . . . . . . . . . . . . . . . . . . . . . . . . . . . . . . . . . . . . . . . 150,000 150,000 0.95% 3/16/17 . . . . . . . . . . . . . . . . . . . . . . . . . . . . . . . . . . . . . . . . . . . . . . . . . . . . . . 25,293 25,293 0.95% 4/6/17 . . . . . . . . . . . . . . . . . . . . . . . . . . . . . . . . . . . . . . . . . . . . . . . . . . . . . . . 68,208 68,208Bank of San Francisco (CA) 0.95% 3/9/17 . . . . . . . . . . . . . . . . . . . . . . . . . . . . . . . . . . . . . . . . . . . . . . . . . . . . . . . 243,500 243,500 Bank of Sullivan (MO) 0.95% 6/15/17 . . . . . . . . . . . . . . . . . . . . . . . . . . . . . . . . . . . . . . . . . . . . . . . . . . . . . . 6,500 6,500 Bank of Sun Prairie (WI) 0.95% 3/16/17 . . . . . . . . . . . . . . . . . . . . . . . . . . . . . . . . . . . . . . . . . . . . . . . . . . . . . . 136,347 136,347 0.95% 3/30/17 . . . . . . . . . . . . . . . . . . . . . . . . . . . . . . . . . . . . . . . . . . . . . . . . . . . . . . 101,202 101,202 0.95% 4/20/17 . . . . . . . . . . . . . . . . . . . . . . . . . . . . . . . . . . . . . . . . . . . . . . . . . . . . . . 952 952Bank of the Bluegrass and Trust Co. (KY) 0.80% 6/8/17 . . . . . . . . . . . . . . . . . . . . . . . . . . . . . . . . . . . . . . . . . . . . . . . . . . . . . . . 246,000 246,000 Bank of the Flint Hills (KS) 0.95% 2/2/17 . . . . . . . . . . . . . . . . . . . . . . . . . . . . . . . . . . . . . . . . . . . . . . . . . . . . . . . 241,000 241,000 Bank of Utah (UT) 0.95% 3/9/17 . . . . . . . . . . . . . . . . . . . . . . . . . . . . . . . . . . . . . . . . . . . . . . . . . . . . . . . 243,500 243,500 Bank SNB (OK) 0.95% 4/6/17 . . . . . . . . . . . . . . . . . . . . . . . . . . . . . . . . . . . . . . . . . . . . . . . . . . . . . . . 243,500 243,500 Bank Texas (TX) 0.95% 2/2/17 . . . . . . . . . . . . . . . . . . . . . . . . . . . . . . . . . . . . . . . . . . . . . . . . . . . . . . . 241,000 241,000 BankFirst (NE) 0.75% 4/6/17 . . . . . . . . . . . . . . . . . . . . . . . . . . . . . . . . . . . . . . . . . . . . . . . . . . . . . . . 246,000 246,000 BankUnited (FL) 0.95% 2/23/17 . . . . . . . . . . . . . . . . . . . . . . . . . . . . . . . . . . . . . . . . . . . . . . . . . . . . . . 45,500 45,500 0.90% 10/19/17 . . . . . . . . . . . . . . . . . . . . . . . . . . . . . . . . . . . . . . . . . . . . . . . . . . . . . 191,500 191,500Banner Capital Bank (NE) 0.80% 6/8/17 . . . . . . . . . . . . . . . . . . . . . . . . . . . . . . . . . . . . . . . . . . . . . . . . . . . . . . . 246,000 246,000 Banterra Bank (IL) 0.95% 4/6/17 . . . . . . . . . . . . . . . . . . . . . . . . . . . . . . . . . . . . . . . . . . . . . . . . . . . . . . . 90,667 90,667 0.80% 6/8/17 . . . . . . . . . . . . . . . . . . . . . . . . . . . . . . . . . . . . . . . . . . . . . . . . . . . . . . . 152,833 152,833Bath Savings Institution (ME) 0.95% 4/13/17 . . . . . . . . . . . . . . . . . . . . . . . . . . . . . . . . . . . . . . . . . . . . . . . . . . . . . . 9,000 9,000 0.95% 4/20/17 . . . . . . . . . . . . . . . . . . . . . . . . . . . . . . . . . . . . . . . . . . . . . . . . . . . . . . 123,480 123,480 0.95% 4/27/17 . . . . . . . . . . . . . . . . . . . . . . . . . . . . . . . . . . . . . . . . . . . . . . . . . . . . . . 87,888 87,888BCB Community Bank (NJ) 0.95% 2/2/17 . . . . . . . . . . . . . . . . . . . . . . . . . . . . . . . . . . . . . . . . . . . . . . . . . . . . . . . 228,769 228,769 0.95% 3/16/17 . . . . . . . . . . . . . . . . . . . . . . . . . . . . . . . . . . . . . . . . . . . . . . . . . . . . . . 12,231 12,231Belmont Bank & Trust Company (IL) 0.95% 2/16/17 . . . . . . . . . . . . . . . . . . . . . . . . . . . . . . . . . . . . . . . . . . . . . . . . . . . . . . 243,500 243,500 Biddeford Savings Bank (ME) 0.95% 2/23/17 . . . . . . . . . . . . . . . . . . . . . . . . . . . . . . . . . . . . . . . . . . . . . . . . . . . . . . 100,000 100,000 BNC National Bank (AZ) 0.95% 3/30/17 . . . . . . . . . . . . . . . . . . . . . . . . . . . . . . . . . . . . . . . . . . . . . . . . . . . . . . 238,500 238,500 The notes to the fi nancial statements are an integral part of the schedule of investments.

24 PLGIT Annual Report | December 31, 2016
PLGIT PortfolioSchedule of Investments (unaudited)December 31, 2016
Maturity Fair Rate(1) Date(2) Principal Value(3)
BOFI Federal Bank 0.60%(5) 1/10/17 . . . . . . . . . . . . . . . . . . . . . . . . . . . . . . . . . . . . . . . . . . . . . . . . . . . . . . $ 80,000,000 $ 80,000,000 0.63%(5) 2/8/17 . . . . . . . . . . . . . . . . . . . . . . . . . . . . . . . . . . . . . . . . . . . . . . . . . . . . . . . 45,000,000 45,000,000 0.63%(5) 4/5/17 . . . . . . . . . . . . . . . . . . . . . . . . . . . . . . . . . . . . . . . . . . . . . . . . . . . . . . . 5,000,000 5,000,000 0.95% 4/6/17 . . . . . . . . . . . . . . . . . . . . . . . . . . . . . . . . . . . . . . . . . . . . . . . . . . . . . . . 243,500 243,500 0.63%(5) 4/10/17 . . . . . . . . . . . . . . . . . . . . . . . . . . . . . . . . . . . . . . . . . . . . . . . . . . . . . . 20,000,000 20,000,000BOKF (OK) 0.95% 3/16/17 . . . . . . . . . . . . . . . . . . . . . . . . . . . . . . . . . . . . . . . . . . . . . . . . . . . . . . 10,169 10,169 Branson Bank (MO) 0.95% 3/23/17 . . . . . . . . . . . . . . . . . . . . . . . . . . . . . . . . . . . . . . . . . . . . . . . . . . . . . . 91,807 91,807 Bremer Bank (MN) 0.95% 3/16/17 . . . . . . . . . . . . . . . . . . . . . . . . . . . . . . . . . . . . . . . . . . . . . . . . . . . . . . 243,500 243,500 Brentwood Bank (PA) 0.95% 3/23/17 . . . . . . . . . . . . . . . . . . . . . . . . . . . . . . . . . . . . . . . . . . . . . . . . . . . . . . 101,254 101,254 Caldwell Bank & Trust Company (LA) 0.95% 3/9/17 . . . . . . . . . . . . . . . . . . . . . . . . . . . . . . . . . . . . . . . . . . . . . . . . . . . . . . . 216,427 216,427 Cape Bank (NJ) 0.95% 3/23/17 . . . . . . . . . . . . . . . . . . . . . . . . . . . . . . . . . . . . . . . . . . . . . . . . . . . . . . 198,249 198,249 Capital Bank (FL) 0.95% 3/23/17 . . . . . . . . . . . . . . . . . . . . . . . . . . . . . . . . . . . . . . . . . . . . . . . . . . . . . . 243,500 243,500 Capital Bank (MD) 0.75% 3/16/17 . . . . . . . . . . . . . . . . . . . . . . . . . . . . . . . . . . . . . . . . . . . . . . . . . . . . . . 210,639 210,639 0.95% 4/13/17 . . . . . . . . . . . . . . . . . . . . . . . . . . . . . . . . . . . . . . . . . . . . . . . . . . . . . . 30,361 30,361Capitol Bank (WI) 0.95% 4/20/17 . . . . . . . . . . . . . . . . . . . . . . . . . . . . . . . . . . . . . . . . . . . . . . . . . . . . . . 241,000 241,000 Capstar Bank (TN) 0.95% 2/23/17 . . . . . . . . . . . . . . . . . . . . . . . . . . . . . . . . . . . . . . . . . . . . . . . . . . . . . . 243,500 243,500 Carolina Alliance Bank (SC) 0.95% 3/9/17 . . . . . . . . . . . . . . . . . . . . . . . . . . . . . . . . . . . . . . . . . . . . . . . . . . . . . . . 32,244 32,244 0.90% 10/19/17 . . . . . . . . . . . . . . . . . . . . . . . . . . . . . . . . . . . . . . . . . . . . . . . . . . . . . 211,256 211,256Carolina Trust Bank (NC) 0.80% 6/8/17 . . . . . . . . . . . . . . . . . . . . . . . . . . . . . . . . . . . . . . . . . . . . . . . . . . . . . . . 246,000 246,000 Centier Bank (IN) 0.75% 3/16/17 . . . . . . . . . . . . . . . . . . . . . . . . . . . . . . . . . . . . . . . . . . . . . . . . . . . . . . 246,000 246,000 Central Bank and Trust Co. (KS) 0.95% 3/16/17 . . . . . . . . . . . . . . . . . . . . . . . . . . . . . . . . . . . . . . . . . . . . . . . . . . . . . . 243,500 243,500 Central Bank of Oklahoma (OK) 0.95% 4/13/17 . . . . . . . . . . . . . . . . . . . . . . . . . . . . . . . . . . . . . . . . . . . . . . . . . . . . . . 241,000 241,000 Central National Bank (KS) 0.95% 2/23/17 . . . . . . . . . . . . . . . . . . . . . . . . . . . . . . . . . . . . . . . . . . . . . . . . . . . . . . 243,500 243,500 Central Valley Community Bank (CA) 0.95% 3/30/17 . . . . . . . . . . . . . . . . . . . . . . . . . . . . . . . . . . . . . . . . . . . . . . . . . . . . . . 238,500 238,500 Centreville Savings Bank (RI) 0.75% 3/16/17 . . . . . . . . . . . . . . . . . . . . . . . . . . . . . . . . . . . . . . . . . . . . . . . . . . . . . . 25,018 25,018 0.75% 4/6/17 . . . . . . . . . . . . . . . . . . . . . . . . . . . . . . . . . . . . . . . . . . . . . . . . . . . . . . . 220,982 220,982 CFBank (OH) 0.95% 2/9/17 . . . . . . . . . . . . . . . . . . . . . . . . . . . . . . . . . . . . . . . . . . . . . . . . . . . . . . . 3,640 3,640 Chambers Bank (AR) 0.95% 4/13/17 . . . . . . . . . . . . . . . . . . . . . . . . . . . . . . . . . . . . . . . . . . . . . . . . . . . . . . 241,000 241,000 Charlevoix State Bank (MI) 0.95% 3/23/17 . . . . . . . . . . . . . . . . . . . . . . . . . . . . . . . . . . . . . . . . . . . . . . . . . . . . . . 229,037 229,037 0.95% 4/27/17 . . . . . . . . . . . . . . . . . . . . . . . . . . . . . . . . . . . . . . . . . . . . . . . . . . . . . . 9,463 9,463 The notes to the fi nancial statements are an integral part of the schedule of investments.
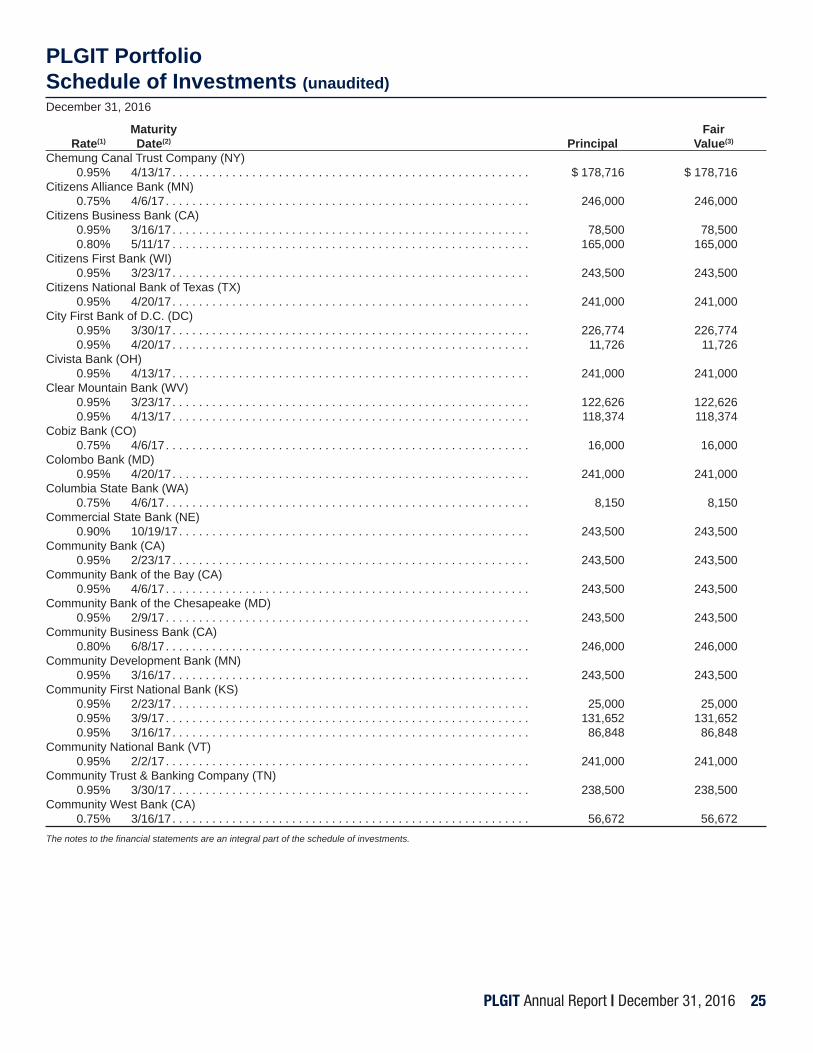
PLGIT Annual Report | December 31, 2016 25
PLGIT PortfolioSchedule of Investments (unaudited)December 31, 2016
Maturity Fair Rate(1) Date(2) Principal Value(3)
Chemung Canal Trust Company (NY) 0.95% 4/13/17 . . . . . . . . . . . . . . . . . . . . . . . . . . . . . . . . . . . . . . . . . . . . . . . . . . . . . . $ 178,716 $ 178,716 Citizens Alliance Bank (MN) 0.75% 4/6/17 . . . . . . . . . . . . . . . . . . . . . . . . . . . . . . . . . . . . . . . . . . . . . . . . . . . . . . . 246,000 246,000 Citizens Business Bank (CA) 0.95% 3/16/17 . . . . . . . . . . . . . . . . . . . . . . . . . . . . . . . . . . . . . . . . . . . . . . . . . . . . . . 78,500 78,500 0.80% 5/11/17 . . . . . . . . . . . . . . . . . . . . . . . . . . . . . . . . . . . . . . . . . . . . . . . . . . . . . . 165,000 165,000 Citizens First Bank (WI) 0.95% 3/23/17 . . . . . . . . . . . . . . . . . . . . . . . . . . . . . . . . . . . . . . . . . . . . . . . . . . . . . . 243,500 243,500 Citizens National Bank of Texas (TX) 0.95% 4/20/17 . . . . . . . . . . . . . . . . . . . . . . . . . . . . . . . . . . . . . . . . . . . . . . . . . . . . . . 241,000 241,000 City First Bank of D.C. (DC) 0.95% 3/30/17 . . . . . . . . . . . . . . . . . . . . . . . . . . . . . . . . . . . . . . . . . . . . . . . . . . . . . . 226,774 226,774 0.95% 4/20/17 . . . . . . . . . . . . . . . . . . . . . . . . . . . . . . . . . . . . . . . . . . . . . . . . . . . . . . 11,726 11,726Civista Bank (OH) 0.95% 4/13/17 . . . . . . . . . . . . . . . . . . . . . . . . . . . . . . . . . . . . . . . . . . . . . . . . . . . . . . 241,000 241,000 Clear Mountain Bank (WV) 0.95% 3/23/17 . . . . . . . . . . . . . . . . . . . . . . . . . . . . . . . . . . . . . . . . . . . . . . . . . . . . . . 122,626 122,626 0.95% 4/13/17 . . . . . . . . . . . . . . . . . . . . . . . . . . . . . . . . . . . . . . . . . . . . . . . . . . . . . . 118,374 118,374 Cobiz Bank (CO) 0.75% 4/6/17 . . . . . . . . . . . . . . . . . . . . . . . . . . . . . . . . . . . . . . . . . . . . . . . . . . . . . . . 16,000 16,000Colombo Bank (MD) 0.95% 4/20/17 . . . . . . . . . . . . . . . . . . . . . . . . . . . . . . . . . . . . . . . . . . . . . . . . . . . . . . 241,000 241,000 Columbia State Bank (WA) 0.75% 4/6/17 . . . . . . . . . . . . . . . . . . . . . . . . . . . . . . . . . . . . . . . . . . . . . . . . . . . . . . . 8,150 8,150 Commercial State Bank (NE) 0.90% 10/19/17 . . . . . . . . . . . . . . . . . . . . . . . . . . . . . . . . . . . . . . . . . . . . . . . . . . . . . 243,500 243,500 Community Bank (CA) 0.95% 2/23/17 . . . . . . . . . . . . . . . . . . . . . . . . . . . . . . . . . . . . . . . . . . . . . . . . . . . . . . 243,500 243,500 Community Bank of the Bay (CA) 0.95% 4/6/17 . . . . . . . . . . . . . . . . . . . . . . . . . . . . . . . . . . . . . . . . . . . . . . . . . . . . . . . 243,500 243,500 Community Bank of the Chesapeake (MD) 0.95% 2/9/17 . . . . . . . . . . . . . . . . . . . . . . . . . . . . . . . . . . . . . . . . . . . . . . . . . . . . . . . 243,500 243,500 Community Business Bank (CA) 0.80% 6/8/17 . . . . . . . . . . . . . . . . . . . . . . . . . . . . . . . . . . . . . . . . . . . . . . . . . . . . . . . 246,000 246,000 Community Development Bank (MN) 0.95% 3/16/17 . . . . . . . . . . . . . . . . . . . . . . . . . . . . . . . . . . . . . . . . . . . . . . . . . . . . . . 243,500 243,500 Community First National Bank (KS) 0.95% 2/23/17 . . . . . . . . . . . . . . . . . . . . . . . . . . . . . . . . . . . . . . . . . . . . . . . . . . . . . . 25,000 25,000 0.95% 3/9/17 . . . . . . . . . . . . . . . . . . . . . . . . . . . . . . . . . . . . . . . . . . . . . . . . . . . . . . . 131,652 131,652 0.95% 3/16/17 . . . . . . . . . . . . . . . . . . . . . . . . . . . . . . . . . . . . . . . . . . . . . . . . . . . . . . 86,848 86,848Community National Bank (VT) 0.95% 2/2/17 . . . . . . . . . . . . . . . . . . . . . . . . . . . . . . . . . . . . . . . . . . . . . . . . . . . . . . . 241,000 241,000Community Trust & Banking Company (TN) 0.95% 3/30/17 . . . . . . . . . . . . . . . . . . . . . . . . . . . . . . . . . . . . . . . . . . . . . . . . . . . . . . 238,500 238,500Community West Bank (CA) 0.75% 3/16/17 . . . . . . . . . . . . . . . . . . . . . . . . . . . . . . . . . . . . . . . . . . . . . . . . . . . . . . 56,672 56,672The notes to the fi nancial statements are an integral part of the schedule of investments.
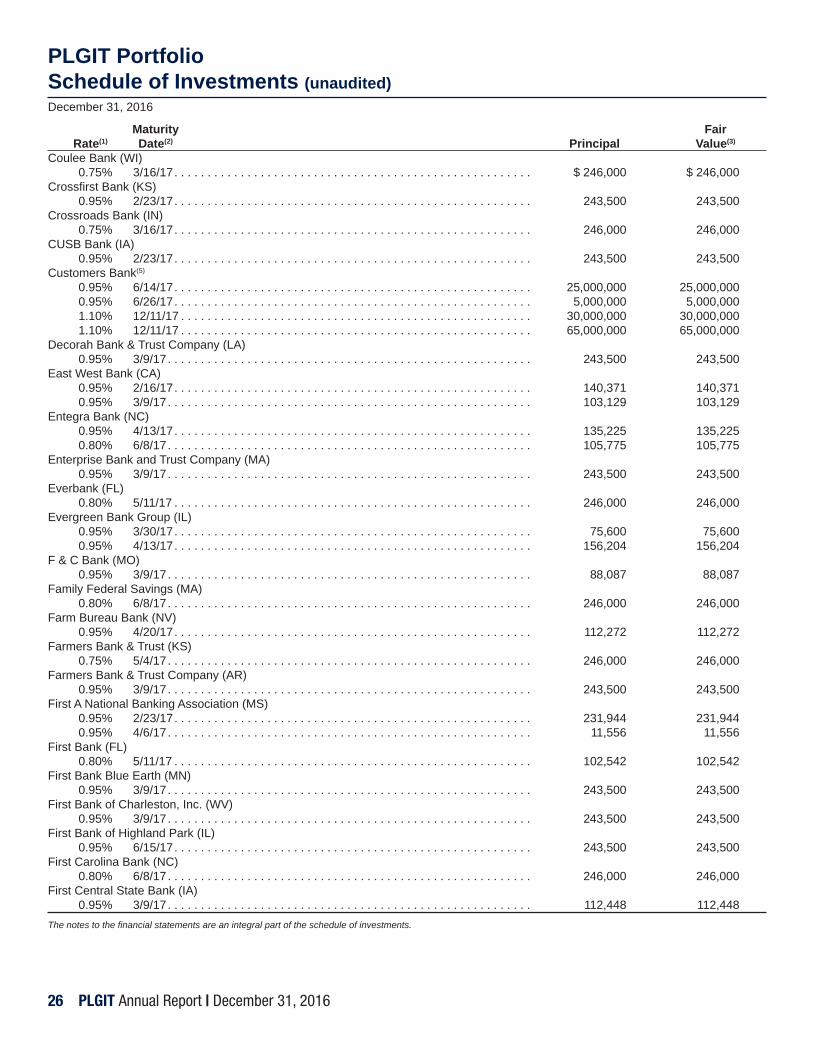
26 PLGIT Annual Report | December 31, 2016
PLGIT PortfolioSchedule of Investments (unaudited)December 31, 2016
Maturity Fair Rate(1) Date(2) Principal Value(3)
Coulee Bank (WI) 0.75% 3/16/17 . . . . . . . . . . . . . . . . . . . . . . . . . . . . . . . . . . . . . . . . . . . . . . . . . . . . . . $ 246,000 $ 246,000Crossfi rst Bank (KS) 0.95% 2/23/17 . . . . . . . . . . . . . . . . . . . . . . . . . . . . . . . . . . . . . . . . . . . . . . . . . . . . . . 243,500 243,500Crossroads Bank (IN) 0.75% 3/16/17 . . . . . . . . . . . . . . . . . . . . . . . . . . . . . . . . . . . . . . . . . . . . . . . . . . . . . . 246,000 246,000CUSB Bank (IA) 0.95% 2/23/17 . . . . . . . . . . . . . . . . . . . . . . . . . . . . . . . . . . . . . . . . . . . . . . . . . . . . . . 243,500 243,500Customers Bank(5)
0.95% 6/14/17 . . . . . . . . . . . . . . . . . . . . . . . . . . . . . . . . . . . . . . . . . . . . . . . . . . . . . . 25,000,000 25,000,000 0.95% 6/26/17 . . . . . . . . . . . . . . . . . . . . . . . . . . . . . . . . . . . . . . . . . . . . . . . . . . . . . . 5,000,000 5,000,000 1.10% 12/11/17 . . . . . . . . . . . . . . . . . . . . . . . . . . . . . . . . . . . . . . . . . . . . . . . . . . . . . 30,000,000 30,000,000 1.10% 12/11/17 . . . . . . . . . . . . . . . . . . . . . . . . . . . . . . . . . . . . . . . . . . . . . . . . . . . . . 65,000,000 65,000,000Decorah Bank & Trust Company (LA) 0.95% 3/9/17 . . . . . . . . . . . . . . . . . . . . . . . . . . . . . . . . . . . . . . . . . . . . . . . . . . . . . . . 243,500 243,500 East West Bank (CA) 0.95% 2/16/17 . . . . . . . . . . . . . . . . . . . . . . . . . . . . . . . . . . . . . . . . . . . . . . . . . . . . . . 140,371 140,371 0.95% 3/9/17 . . . . . . . . . . . . . . . . . . . . . . . . . . . . . . . . . . . . . . . . . . . . . . . . . . . . . . . 103,129 103,129Entegra Bank (NC) 0.95% 4/13/17 . . . . . . . . . . . . . . . . . . . . . . . . . . . . . . . . . . . . . . . . . . . . . . . . . . . . . . 135,225 135,225 0.80% 6/8/17 . . . . . . . . . . . . . . . . . . . . . . . . . . . . . . . . . . . . . . . . . . . . . . . . . . . . . . . 105,775 105,775 Enterprise Bank and Trust Company (MA) 0.95% 3/9/17 . . . . . . . . . . . . . . . . . . . . . . . . . . . . . . . . . . . . . . . . . . . . . . . . . . . . . . . 243,500 243,500 Everbank (FL) 0.80% 5/11/17 . . . . . . . . . . . . . . . . . . . . . . . . . . . . . . . . . . . . . . . . . . . . . . . . . . . . . . 246,000 246,000 Evergreen Bank Group (IL) 0.95% 3/30/17 . . . . . . . . . . . . . . . . . . . . . . . . . . . . . . . . . . . . . . . . . . . . . . . . . . . . . . 75,600 75,600 0.95% 4/13/17 . . . . . . . . . . . . . . . . . . . . . . . . . . . . . . . . . . . . . . . . . . . . . . . . . . . . . . 156,204 156,204 F & C Bank (MO) 0.95% 3/9/17 . . . . . . . . . . . . . . . . . . . . . . . . . . . . . . . . . . . . . . . . . . . . . . . . . . . . . . . 88,087 88,087 Family Federal Savings (MA) 0.80% 6/8/17 . . . . . . . . . . . . . . . . . . . . . . . . . . . . . . . . . . . . . . . . . . . . . . . . . . . . . . . 246,000 246,000 Farm Bureau Bank (NV) 0.95% 4/20/17 . . . . . . . . . . . . . . . . . . . . . . . . . . . . . . . . . . . . . . . . . . . . . . . . . . . . . . 112,272 112,272 Farmers Bank & Trust (KS) 0.75% 5/4/17 . . . . . . . . . . . . . . . . . . . . . . . . . . . . . . . . . . . . . . . . . . . . . . . . . . . . . . . 246,000 246,000 Farmers Bank & Trust Company (AR) 0.95% 3/9/17 . . . . . . . . . . . . . . . . . . . . . . . . . . . . . . . . . . . . . . . . . . . . . . . . . . . . . . . 243,500 243,500 First A National Banking Association (MS) 0.95% 2/23/17 . . . . . . . . . . . . . . . . . . . . . . . . . . . . . . . . . . . . . . . . . . . . . . . . . . . . . . 231,944 231,944 0.95% 4/6/17 . . . . . . . . . . . . . . . . . . . . . . . . . . . . . . . . . . . . . . . . . . . . . . . . . . . . . . . 11,556 11,556 First Bank (FL) 0.80% 5/11/17 . . . . . . . . . . . . . . . . . . . . . . . . . . . . . . . . . . . . . . . . . . . . . . . . . . . . . . 102,542 102,542 First Bank Blue Earth (MN) 0.95% 3/9/17 . . . . . . . . . . . . . . . . . . . . . . . . . . . . . . . . . . . . . . . . . . . . . . . . . . . . . . . 243,500 243,500 First Bank of Charleston, Inc. (WV) 0.95% 3/9/17 . . . . . . . . . . . . . . . . . . . . . . . . . . . . . . . . . . . . . . . . . . . . . . . . . . . . . . . 243,500 243,500 First Bank of Highland Park (IL) 0.95% 6/15/17 . . . . . . . . . . . . . . . . . . . . . . . . . . . . . . . . . . . . . . . . . . . . . . . . . . . . . . 243,500 243,500 First Carolina Bank (NC) 0.80% 6/8/17 . . . . . . . . . . . . . . . . . . . . . . . . . . . . . . . . . . . . . . . . . . . . . . . . . . . . . . . 246,000 246,000 First Central State Bank (IA) 0.95% 3/9/17 . . . . . . . . . . . . . . . . . . . . . . . . . . . . . . . . . . . . . . . . . . . . . . . . . . . . . . . 112,448 112,448The notes to the fi nancial statements are an integral part of the schedule of investments.

PLGIT Annual Report | December 31, 2016 27
PLGIT PortfolioSchedule of Investments (unaudited)December 31, 2016
Maturity Fair Rate(1) Date(2) Principal Value(3)
First Century Bank, Inc. (WV) 0.95% 3/30/17 . . . . . . . . . . . . . . . . . . . . . . . . . . . . . . . . . . . . . . . . . . . . . . . . . . . . . . $ 52,500 $ 52,500 First Choice Bank (NJ) 0.95% 3/30/17 . . . . . . . . . . . . . . . . . . . . . . . . . . . . . . . . . . . . . . . . . . . . . . . . . . . . . . 150,000 150,000 First Citizens Community Bank (PA) 0.95% 2/23/17 . . . . . . . . . . . . . . . . . . . . . . . . . . . . . . . . . . . . . . . . . . . . . . . . . . . . . . 150,011 150,011 First Commerce Bank (TN) 0.95% 2/16/17 . . . . . . . . . . . . . . . . . . . . . . . . . . . . . . . . . . . . . . . . . . . . . . . . . . . . . . 218,799 218,799 0.95% 3/23/17 . . . . . . . . . . . . . . . . . . . . . . . . . . . . . . . . . . . . . . . . . . . . . . . . . . . . . . 24,701 24,701First Commonwealth Bank (PA) 0.80% 6/8/17 . . . . . . . . . . . . . . . . . . . . . . . . . . . . . . . . . . . . . . . . . . . . . . . . . . . . . . . 201,000 201,000 First Community Bank of Eastern Arkansas (AR) 0.95% 3/23/17 . . . . . . . . . . . . . . . . . . . . . . . . . . . . . . . . . . . . . . . . . . . . . . . . . . . . . . 188,500 188,500First Dakota National Bank (SD) 0.90% 10/19/17 . . . . . . . . . . . . . . . . . . . . . . . . . . . . . . . . . . . . . . . . . . . . . . . . . . . . . 243,500 243,500 First Federal Savings and Loan Association (OR) 0.95% 3/30/17 . . . . . . . . . . . . . . . . . . . . . . . . . . . . . . . . . . . . . . . . . . . . . . . . . . . . . . 105,409 105,409 First Federal Savings Bank Of Lincolnton (NC) 0.95% 3/9/17 . . . . . . . . . . . . . . . . . . . . . . . . . . . . . . . . . . . . . . . . . . . . . . . . . . . . . . . 243,500 243,500 First Financial Bank (AR) 0.95% 3/16/17 . . . . . . . . . . . . . . . . . . . . . . . . . . . . . . . . . . . . . . . . . . . . . . . . . . . . . . 20,765 20,765 0.95% 4/20/17 . . . . . . . . . . . . . . . . . . . . . . . . . . . . . . . . . . . . . . . . . . . . . . . . . . . . . . 116,330 116,330 First Freedom Bank (TN) 0.95% 4/27/17 . . . . . . . . . . . . . . . . . . . . . . . . . . . . . . . . . . . . . . . . . . . . . . . . . . . . . . 238,500 238,500 First Guaranty Bank (LA) 0.75% 3/16/17 . . . . . . . . . . . . . . . . . . . . . . . . . . . . . . . . . . . . . . . . . . . . . . . . . . . . . . 246,000 246,000 First Liberty Bank (OK) 0.95% 3/9/17 . . . . . . . . . . . . . . . . . . . . . . . . . . . . . . . . . . . . . . . . . . . . . . . . . . . . . . . 243,500 243,500 First Merchants Bank (IN) 0.95% 2/9/17 . . . . . . . . . . . . . . . . . . . . . . . . . . . . . . . . . . . . . . . . . . . . . . . . . . . . . . . 243,500 243,500 First National Bank (LA) 0.95% 4/13/17 . . . . . . . . . . . . . . . . . . . . . . . . . . . . . . . . . . . . . . . . . . . . . . . . . . . . . . 53,598 53,598 0.80% 6/8/17 . . . . . . . . . . . . . . . . . . . . . . . . . . . . . . . . . . . . . . . . . . . . . . . . . . . . . . . 187,402 187,402 First National Bank (TX) 0.95% 2/2/17 . . . . . . . . . . . . . . . . . . . . . . . . . . . . . . . . . . . . . . . . . . . . . . . . . . . . . . . 63,755 63,755 First National Bank Albany/Breckenridge (TX) 0.75% 5/4/17 . . . . . . . . . . . . . . . . . . . . . . . . . . . . . . . . . . . . . . . . . . . . . . . . . . . . . . . 246,000 246,000 First National Bank of Oklahoma (OK) 0.95% 2/23/17 . . . . . . . . . . . . . . . . . . . . . . . . . . . . . . . . . . . . . . . . . . . . . . . . . . . . . . 243,500 243,500 First National Bank & Trust Co. (OK) 0.75% 4/6/17 . . . . . . . . . . . . . . . . . . . . . . . . . . . . . . . . . . . . . . . . . . . . . . . . . . . . . . . 220,434 220,434 First NBC Bank (LA) 0.95% 2/2/17 . . . . . . . . . . . . . . . . . . . . . . . . . . . . . . . . . . . . . . . . . . . . . . . . . . . . . . . 117,330 117,330 0.95% 3/30/17 . . . . . . . . . . . . . . . . . . . . . . . . . . . . . . . . . . . . . . . . . . . . . . . . . . . . . . 121,170 121,170First State Bank & Trust Co, Inc. (MO) 0.95% 4/13/17 . . . . . . . . . . . . . . . . . . . . . . . . . . . . . . . . . . . . . . . . . . . . . . . . . . . . . . 241,000 241,000 First State Bank (NE) 0.75% 3/16/17 . . . . . . . . . . . . . . . . . . . . . . . . . . . . . . . . . . . . . . . . . . . . . . . . . . . . . . 246,000 246,000First State Bank (OH) 0.75% 5/4/17 . . . . . . . . . . . . . . . . . . . . . . . . . . . . . . . . . . . . . . . . . . . . . . . . . . . . . . . 74,122 74,122 0.80% 5/11/17 . . . . . . . . . . . . . . . . . . . . . . . . . . . . . . . . . . . . . . . . . . . . . . . . . . . . . . 171,878 171,878 The notes to the fi nancial statements are an integral part of the schedule of investments.
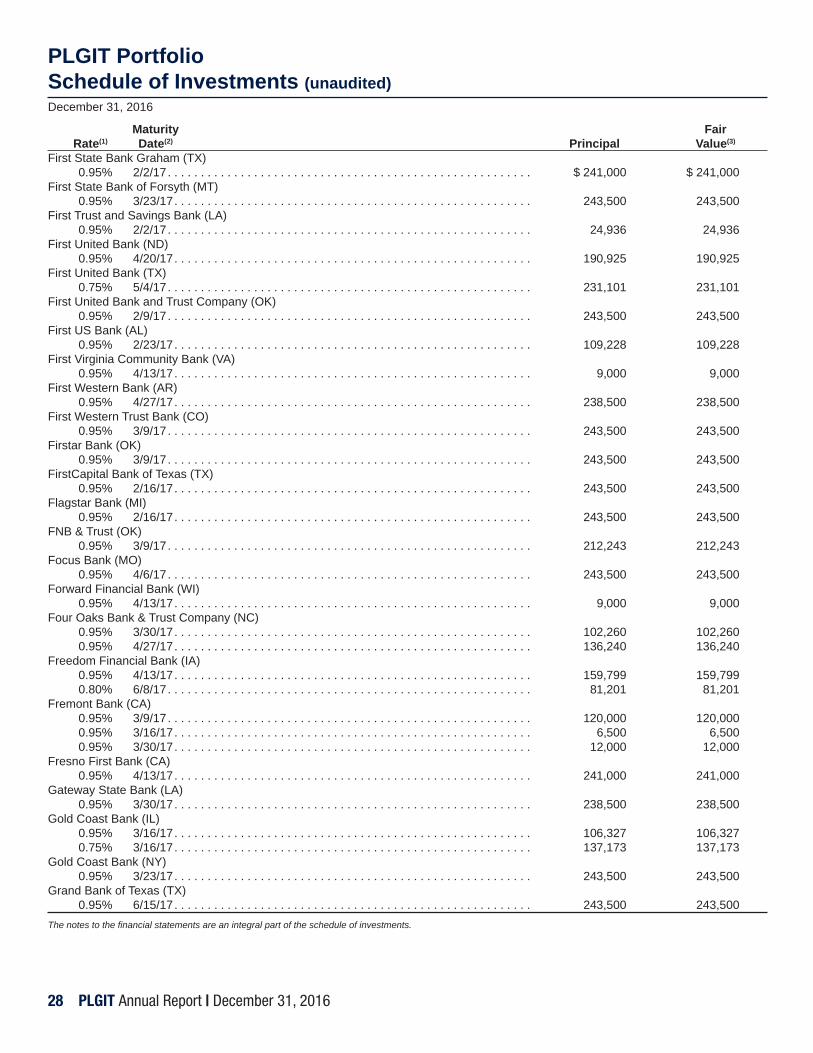
28 PLGIT Annual Report | December 31, 2016
PLGIT PortfolioSchedule of Investments (unaudited)December 31, 2016
Maturity Fair Rate(1) Date(2) Principal Value(3)
First State Bank Graham (TX) 0.95% 2/2/17 . . . . . . . . . . . . . . . . . . . . . . . . . . . . . . . . . . . . . . . . . . . . . . . . . . . . . . . $ 241,000 $ 241,000First State Bank of Forsyth (MT) 0.95% 3/23/17 . . . . . . . . . . . . . . . . . . . . . . . . . . . . . . . . . . . . . . . . . . . . . . . . . . . . . . 243,500 243,500 First Trust and Savings Bank (LA) 0.95% 2/2/17 . . . . . . . . . . . . . . . . . . . . . . . . . . . . . . . . . . . . . . . . . . . . . . . . . . . . . . . 24,936 24,936 First United Bank (ND) 0.95% 4/20/17 . . . . . . . . . . . . . . . . . . . . . . . . . . . . . . . . . . . . . . . . . . . . . . . . . . . . . . 190,925 190,925 First United Bank (TX) 0.75% 5/4/17 . . . . . . . . . . . . . . . . . . . . . . . . . . . . . . . . . . . . . . . . . . . . . . . . . . . . . . . 231,101 231,101 First United Bank and Trust Company (OK) 0.95% 2/9/17 . . . . . . . . . . . . . . . . . . . . . . . . . . . . . . . . . . . . . . . . . . . . . . . . . . . . . . . 243,500 243,500 First US Bank (AL) 0.95% 2/23/17 . . . . . . . . . . . . . . . . . . . . . . . . . . . . . . . . . . . . . . . . . . . . . . . . . . . . . . 109,228 109,228 First Virginia Community Bank (VA) 0.95% 4/13/17 . . . . . . . . . . . . . . . . . . . . . . . . . . . . . . . . . . . . . . . . . . . . . . . . . . . . . . 9,000 9,000 First Western Bank (AR) 0.95% 4/27/17 . . . . . . . . . . . . . . . . . . . . . . . . . . . . . . . . . . . . . . . . . . . . . . . . . . . . . . 238,500 238,500 First Western Trust Bank (CO) 0.95% 3/9/17 . . . . . . . . . . . . . . . . . . . . . . . . . . . . . . . . . . . . . . . . . . . . . . . . . . . . . . . 243,500 243,500 Firstar Bank (OK) 0.95% 3/9/17 . . . . . . . . . . . . . . . . . . . . . . . . . . . . . . . . . . . . . . . . . . . . . . . . . . . . . . . 243,500 243,500 FirstCapital Bank of Texas (TX) 0.95% 2/16/17 . . . . . . . . . . . . . . . . . . . . . . . . . . . . . . . . . . . . . . . . . . . . . . . . . . . . . . 243,500 243,500 Flagstar Bank (MI) 0.95% 2/16/17 . . . . . . . . . . . . . . . . . . . . . . . . . . . . . . . . . . . . . . . . . . . . . . . . . . . . . . 243,500 243,500 FNB & Trust (OK) 0.95% 3/9/17 . . . . . . . . . . . . . . . . . . . . . . . . . . . . . . . . . . . . . . . . . . . . . . . . . . . . . . . 212,243 212,243 Focus Bank (MO) 0.95% 4/6/17 . . . . . . . . . . . . . . . . . . . . . . . . . . . . . . . . . . . . . . . . . . . . . . . . . . . . . . . 243,500 243,500 Forward Financial Bank (WI) 0.95% 4/13/17 . . . . . . . . . . . . . . . . . . . . . . . . . . . . . . . . . . . . . . . . . . . . . . . . . . . . . . 9,000 9,000 Four Oaks Bank & Trust Company (NC) 0.95% 3/30/17 . . . . . . . . . . . . . . . . . . . . . . . . . . . . . . . . . . . . . . . . . . . . . . . . . . . . . . 102,260 102,260 0.95% 4/27/17 . . . . . . . . . . . . . . . . . . . . . . . . . . . . . . . . . . . . . . . . . . . . . . . . . . . . . . 136,240 136,240Freedom Financial Bank (IA) 0.95% 4/13/17 . . . . . . . . . . . . . . . . . . . . . . . . . . . . . . . . . . . . . . . . . . . . . . . . . . . . . . 159,799 159,799 0.80% 6/8/17 . . . . . . . . . . . . . . . . . . . . . . . . . . . . . . . . . . . . . . . . . . . . . . . . . . . . . . . 81,201 81,201Fremont Bank (CA) 0.95% 3/9/17 . . . . . . . . . . . . . . . . . . . . . . . . . . . . . . . . . . . . . . . . . . . . . . . . . . . . . . . 120,000 120,000 0.95% 3/16/17 . . . . . . . . . . . . . . . . . . . . . . . . . . . . . . . . . . . . . . . . . . . . . . . . . . . . . . 6,500 6,500 0.95% 3/30/17 . . . . . . . . . . . . . . . . . . . . . . . . . . . . . . . . . . . . . . . . . . . . . . . . . . . . . . 12,000 12,000Fresno First Bank (CA) 0.95% 4/13/17 . . . . . . . . . . . . . . . . . . . . . . . . . . . . . . . . . . . . . . . . . . . . . . . . . . . . . . 241,000 241,000 Gateway State Bank (LA) 0.95% 3/30/17 . . . . . . . . . . . . . . . . . . . . . . . . . . . . . . . . . . . . . . . . . . . . . . . . . . . . . . 238,500 238,500Gold Coast Bank (IL) 0.95% 3/16/17 . . . . . . . . . . . . . . . . . . . . . . . . . . . . . . . . . . . . . . . . . . . . . . . . . . . . . . 106,327 106,327 0.75% 3/16/17 . . . . . . . . . . . . . . . . . . . . . . . . . . . . . . . . . . . . . . . . . . . . . . . . . . . . . . 137,173 137,173Gold Coast Bank (NY) 0.95% 3/23/17 . . . . . . . . . . . . . . . . . . . . . . . . . . . . . . . . . . . . . . . . . . . . . . . . . . . . . . 243,500 243,500 Grand Bank of Texas (TX) 0.95% 6/15/17 . . . . . . . . . . . . . . . . . . . . . . . . . . . . . . . . . . . . . . . . . . . . . . . . . . . . . . 243,500 243,500 The notes to the fi nancial statements are an integral part of the schedule of investments.

PLGIT Annual Report | December 31, 2016 29
PLGIT PortfolioSchedule of Investments (unaudited)December 31, 2016
Maturity Fair Rate(1) Date(2) Principal Value(3)
Granite Bank (NH) 0.95% 3/9/17 . . . . . . . . . . . . . . . . . . . . . . . . . . . . . . . . . . . . . . . . . . . . . . . . . . . . . . . $ 243,500 $ 243,500 Guaranty Bank (MO) 0.95% 3/23/17 . . . . . . . . . . . . . . . . . . . . . . . . . . . . . . . . . . . . . . . . . . . . . . . . . . . . . . 57,464 57,464 Guaranty State Bank & Trust Company (KS) 0.95% 2/2/17 . . . . . . . . . . . . . . . . . . . . . . . . . . . . . . . . . . . . . . . . . . . . . . . . . . . . . . . 3,814 3,814 0.95% 2/9/17 . . . . . . . . . . . . . . . . . . . . . . . . . . . . . . . . . . . . . . . . . . . . . . . . . . . . . . . 3,759 3,759 0.95% 3/9/17 . . . . . . . . . . . . . . . . . . . . . . . . . . . . . . . . . . . . . . . . . . . . . . . . . . . . . . . 183,427 183,427 0.95% 4/13/17 . . . . . . . . . . . . . . . . . . . . . . . . . . . . . . . . . . . . . . . . . . . . . . . . . . . . . . 50,000 50,000Hawthorn Bank (MO) 0.95% 3/16/17 . . . . . . . . . . . . . . . . . . . . . . . . . . . . . . . . . . . . . . . . . . . . . . . . . . . . . . 243,500 243,500 Heartland Bank (IA) 0.95% 3/9/17 . . . . . . . . . . . . . . . . . . . . . . . . . . . . . . . . . . . . . . . . . . . . . . . . . . . . . . . 243,500 243,500 Heritage Bank of Ozarks (MO) 0.95% 4/6/17 . . . . . . . . . . . . . . . . . . . . . . . . . . . . . . . . . . . . . . . . . . . . . . . . . . . . . . . 243,500 243,500 Heritage Bank, Inc. (KY) 0.95% 3/30/17 . . . . . . . . . . . . . . . . . . . . . . . . . . . . . . . . . . . . . . . . . . . . . . . . . . . . . . 238,500 238,500 Horatio State Bank (AR) 0.95% 4/6/17 . . . . . . . . . . . . . . . . . . . . . . . . . . . . . . . . . . . . . . . . . . . . . . . . . . . . . . . 243,500 243,500 Horizon Bank (TX) 0.80% 6/8/17 . . . . . . . . . . . . . . . . . . . . . . . . . . . . . . . . . . . . . . . . . . . . . . . . . . . . . . . 246,000 246,000 Horizon Community Bank (AZ) 0.75% 4/6/17 . . . . . . . . . . . . . . . . . . . . . . . . . . . . . . . . . . . . . . . . . . . . . . . . . . . . . . . 246,000 246,000 Howard Bank (MD) 0.95% 3/16/17 . . . . . . . . . . . . . . . . . . . . . . . . . . . . . . . . . . . . . . . . . . . . . . . . . . . . . . 243,500 243,500 Idaho First Bank (ID) 0.75% 4/6/17 . . . . . . . . . . . . . . . . . . . . . . . . . . . . . . . . . . . . . . . . . . . . . . . . . . . . . . . 99,000 99,000 0.80% 6/8/17 . . . . . . . . . . . . . . . . . . . . . . . . . . . . . . . . . . . . . . . . . . . . . . . . . . . . . . . 99,000 99,000Independent Bank (TX) 0.95% 3/9/17 . . . . . . . . . . . . . . . . . . . . . . . . . . . . . . . . . . . . . . . . . . . . . . . . . . . . . . . 243,500 243,500 Inland Bank & Trust (IL) 0.95% 4/6/17 . . . . . . . . . . . . . . . . . . . . . . . . . . . . . . . . . . . . . . . . . . . . . . . . . . . . . . . 243,500 243,500 Insbank (TN) 0.95% 4/27/17 . . . . . . . . . . . . . . . . . . . . . . . . . . . . . . . . . . . . . . . . . . . . . . . . . . . . . . 100,000 100,000Integrity Bank & Trust (CO) 0.95% 3/30/17 . . . . . . . . . . . . . . . . . . . . . . . . . . . . . . . . . . . . . . . . . . . . . . . . . . . . . . 238,500 238,500 Interbank (OK) 0.95% 4/13/17 . . . . . . . . . . . . . . . . . . . . . . . . . . . . . . . . . . . . . . . . . . . . . . . . . . . . . . 115,000 115,000 0.75% 5/4/17 . . . . . . . . . . . . . . . . . . . . . . . . . . . . . . . . . . . . . . . . . . . . . . . . . . . . . . . 126,000 126,000Interstate Bank (TX) 0.75% 5/4/17 . . . . . . . . . . . . . . . . . . . . . . . . . . . . . . . . . . . . . . . . . . . . . . . . . . . . . . . 159,794 159,794Investors Community Bank (MO) 0.80% 5/11/17 . . . . . . . . . . . . . . . . . . . . . . . . . . . . . . . . . . . . . . . . . . . . . . . . . . . . . . 167,580 167,580Investors National Bank (MO) 0.95% 4/6/17 . . . . . . . . . . . . . . . . . . . . . . . . . . . . . . . . . . . . . . . . . . . . . . . . . . . . . . . 75,920 75,920Iowa State Bank (IA) 0.95% 3/23/17 . . . . . . . . . . . . . . . . . . . . . . . . . . . . . . . . . . . . . . . . . . . . . . . . . . . . . . 170,579 170,579Iowa State Bank of Algona (IA) 0.95% 3/30/17 . . . . . . . . . . . . . . . . . . . . . . . . . . . . . . . . . . . . . . . . . . . . . . . . . . . . . . 238,500 238,500Iowa State Bank of Wapello (IA) 0.80% 6/8/17 . . . . . . . . . . . . . . . . . . . . . . . . . . . . . . . . . . . . . . . . . . . . . . . . . . . . . . . 246,000 246,000 The notes to the fi nancial statements are an integral part of the schedule of investments.
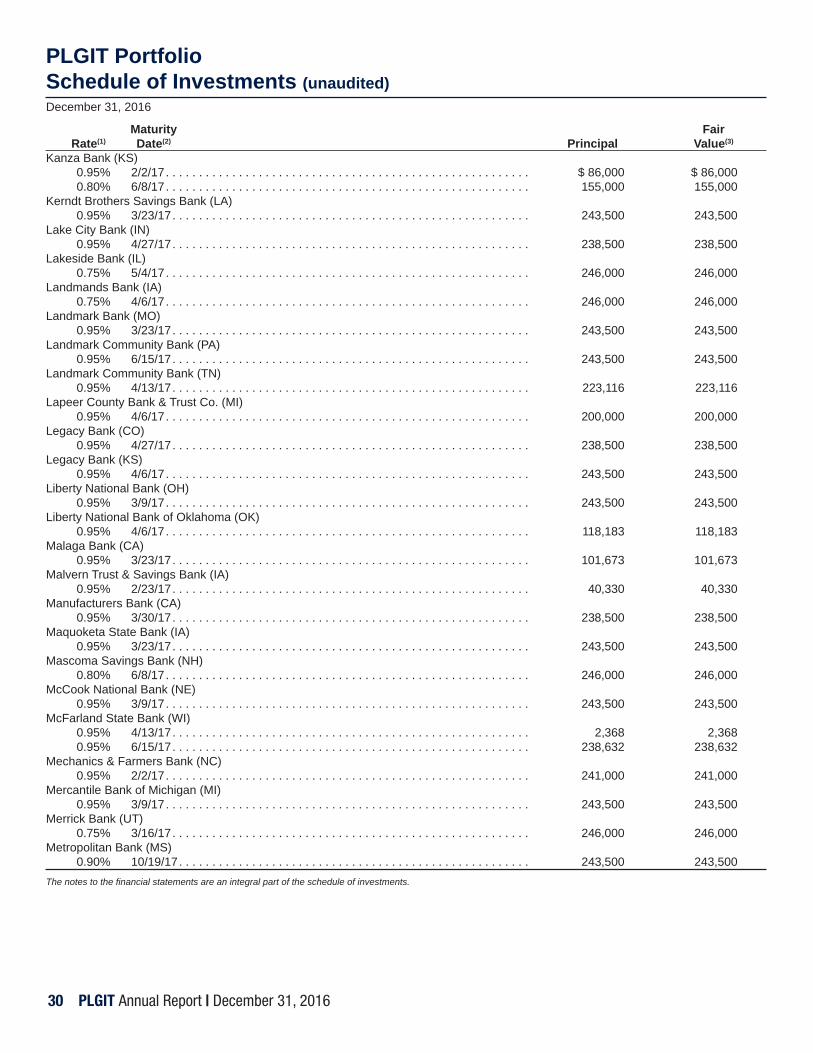
30 PLGIT Annual Report | December 31, 2016
PLGIT PortfolioSchedule of Investments (unaudited)December 31, 2016
Maturity Fair Rate(1) Date(2) Principal Value(3)
Kanza Bank (KS) 0.95% 2/2/17 . . . . . . . . . . . . . . . . . . . . . . . . . . . . . . . . . . . . . . . . . . . . . . . . . . . . . . . $ 86,000 $ 86,000 0.80% 6/8/17 . . . . . . . . . . . . . . . . . . . . . . . . . . . . . . . . . . . . . . . . . . . . . . . . . . . . . . . 155,000 155,000 Kerndt Brothers Savings Bank (LA) 0.95% 3/23/17 . . . . . . . . . . . . . . . . . . . . . . . . . . . . . . . . . . . . . . . . . . . . . . . . . . . . . . 243,500 243,500 Lake City Bank (IN) 0.95% 4/27/17 . . . . . . . . . . . . . . . . . . . . . . . . . . . . . . . . . . . . . . . . . . . . . . . . . . . . . . 238,500 238,500 Lakeside Bank (IL) 0.75% 5/4/17 . . . . . . . . . . . . . . . . . . . . . . . . . . . . . . . . . . . . . . . . . . . . . . . . . . . . . . . 246,000 246,000 Landmands Bank (IA) 0.75% 4/6/17 . . . . . . . . . . . . . . . . . . . . . . . . . . . . . . . . . . . . . . . . . . . . . . . . . . . . . . . 246,000 246,000 Landmark Bank (MO) 0.95% 3/23/17 . . . . . . . . . . . . . . . . . . . . . . . . . . . . . . . . . . . . . . . . . . . . . . . . . . . . . . 243,500 243,500 Landmark Community Bank (PA) 0.95% 6/15/17 . . . . . . . . . . . . . . . . . . . . . . . . . . . . . . . . . . . . . . . . . . . . . . . . . . . . . . 243,500 243,500 Landmark Community Bank (TN) 0.95% 4/13/17 . . . . . . . . . . . . . . . . . . . . . . . . . . . . . . . . . . . . . . . . . . . . . . . . . . . . . . 223,116 223,116 Lapeer County Bank & Trust Co. (MI) 0.95% 4/6/17 . . . . . . . . . . . . . . . . . . . . . . . . . . . . . . . . . . . . . . . . . . . . . . . . . . . . . . . 200,000 200,000 Legacy Bank (CO) 0.95% 4/27/17 . . . . . . . . . . . . . . . . . . . . . . . . . . . . . . . . . . . . . . . . . . . . . . . . . . . . . . 238,500 238,500Legacy Bank (KS) 0.95% 4/6/17 . . . . . . . . . . . . . . . . . . . . . . . . . . . . . . . . . . . . . . . . . . . . . . . . . . . . . . . 243,500 243,500 Liberty National Bank (OH) 0.95% 3/9/17 . . . . . . . . . . . . . . . . . . . . . . . . . . . . . . . . . . . . . . . . . . . . . . . . . . . . . . . 243,500 243,500Liberty National Bank of Oklahoma (OK) 0.95% 4/6/17 . . . . . . . . . . . . . . . . . . . . . . . . . . . . . . . . . . . . . . . . . . . . . . . . . . . . . . . 118,183 118,183 Malaga Bank (CA) 0.95% 3/23/17 . . . . . . . . . . . . . . . . . . . . . . . . . . . . . . . . . . . . . . . . . . . . . . . . . . . . . . 101,673 101,673Malvern Trust & Savings Bank (IA) 0.95% 2/23/17 . . . . . . . . . . . . . . . . . . . . . . . . . . . . . . . . . . . . . . . . . . . . . . . . . . . . . . 40,330 40,330Manufacturers Bank (CA) 0.95% 3/30/17 . . . . . . . . . . . . . . . . . . . . . . . . . . . . . . . . . . . . . . . . . . . . . . . . . . . . . . 238,500 238,500 Maquoketa State Bank (IA) 0.95% 3/23/17 . . . . . . . . . . . . . . . . . . . . . . . . . . . . . . . . . . . . . . . . . . . . . . . . . . . . . . 243,500 243,500 Mascoma Savings Bank (NH) 0.80% 6/8/17 . . . . . . . . . . . . . . . . . . . . . . . . . . . . . . . . . . . . . . . . . . . . . . . . . . . . . . . 246,000 246,000 McCook National Bank (NE) 0.95% 3/9/17 . . . . . . . . . . . . . . . . . . . . . . . . . . . . . . . . . . . . . . . . . . . . . . . . . . . . . . . 243,500 243,500 McFarland State Bank (WI) 0.95% 4/13/17 . . . . . . . . . . . . . . . . . . . . . . . . . . . . . . . . . . . . . . . . . . . . . . . . . . . . . . 2,368 2,368 0.95% 6/15/17 . . . . . . . . . . . . . . . . . . . . . . . . . . . . . . . . . . . . . . . . . . . . . . . . . . . . . . 238,632 238,632Mechanics & Farmers Bank (NC) 0.95% 2/2/17 . . . . . . . . . . . . . . . . . . . . . . . . . . . . . . . . . . . . . . . . . . . . . . . . . . . . . . . 241,000 241,000 Mercantile Bank of Michigan (MI) 0.95% 3/9/17 . . . . . . . . . . . . . . . . . . . . . . . . . . . . . . . . . . . . . . . . . . . . . . . . . . . . . . . 243,500 243,500 Merrick Bank (UT) 0.75% 3/16/17 . . . . . . . . . . . . . . . . . . . . . . . . . . . . . . . . . . . . . . . . . . . . . . . . . . . . . . 246,000 246,000 Metropolitan Bank (MS) 0.90% 10/19/17 . . . . . . . . . . . . . . . . . . . . . . . . . . . . . . . . . . . . . . . . . . . . . . . . . . . . . 243,500 243,500 The notes to the fi nancial statements are an integral part of the schedule of investments.
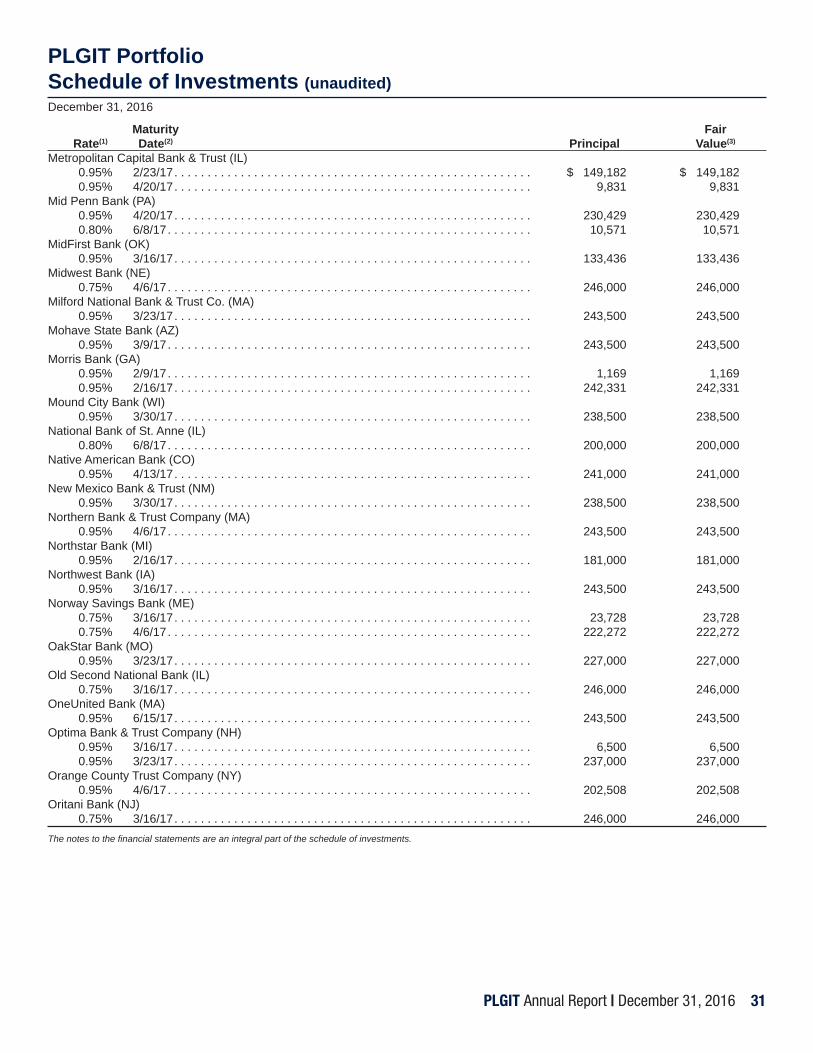
PLGIT Annual Report | December 31, 2016 31
PLGIT PortfolioSchedule of Investments (unaudited)December 31, 2016
Maturity Fair Rate(1) Date(2) Principal Value(3)
Metropolitan Capital Bank & Trust (IL) 0.95% 2/23/17 . . . . . . . . . . . . . . . . . . . . . . . . . . . . . . . . . . . . . . . . . . . . . . . . . . . . . . $ 149,182 $ 149,182 0.95% 4/20/17 . . . . . . . . . . . . . . . . . . . . . . . . . . . . . . . . . . . . . . . . . . . . . . . . . . . . . . 9,831 9,831Mid Penn Bank (PA) 0.95% 4/20/17 . . . . . . . . . . . . . . . . . . . . . . . . . . . . . . . . . . . . . . . . . . . . . . . . . . . . . . 230,429 230,429 0.80% 6/8/17 . . . . . . . . . . . . . . . . . . . . . . . . . . . . . . . . . . . . . . . . . . . . . . . . . . . . . . . 10,571 10,571MidFirst Bank (OK) 0.95% 3/16/17 . . . . . . . . . . . . . . . . . . . . . . . . . . . . . . . . . . . . . . . . . . . . . . . . . . . . . . 133,436 133,436 Midwest Bank (NE) 0.75% 4/6/17 . . . . . . . . . . . . . . . . . . . . . . . . . . . . . . . . . . . . . . . . . . . . . . . . . . . . . . . 246,000 246,000Milford National Bank & Trust Co. (MA) 0.95% 3/23/17 . . . . . . . . . . . . . . . . . . . . . . . . . . . . . . . . . . . . . . . . . . . . . . . . . . . . . . 243,500 243,500 Mohave State Bank (AZ) 0.95% 3/9/17 . . . . . . . . . . . . . . . . . . . . . . . . . . . . . . . . . . . . . . . . . . . . . . . . . . . . . . . 243,500 243,500 Morris Bank (GA) 0.95% 2/9/17 . . . . . . . . . . . . . . . . . . . . . . . . . . . . . . . . . . . . . . . . . . . . . . . . . . . . . . . 1,169 1,169 0.95% 2/16/17 . . . . . . . . . . . . . . . . . . . . . . . . . . . . . . . . . . . . . . . . . . . . . . . . . . . . . . 242,331 242,331Mound City Bank (WI) 0.95% 3/30/17 . . . . . . . . . . . . . . . . . . . . . . . . . . . . . . . . . . . . . . . . . . . . . . . . . . . . . . 238,500 238,500 National Bank of St. Anne (IL) 0.80% 6/8/17 . . . . . . . . . . . . . . . . . . . . . . . . . . . . . . . . . . . . . . . . . . . . . . . . . . . . . . . 200,000 200,000 Native American Bank (CO) 0.95% 4/13/17 . . . . . . . . . . . . . . . . . . . . . . . . . . . . . . . . . . . . . . . . . . . . . . . . . . . . . . 241,000 241,000New Mexico Bank & Trust (NM) 0.95% 3/30/17 . . . . . . . . . . . . . . . . . . . . . . . . . . . . . . . . . . . . . . . . . . . . . . . . . . . . . . 238,500 238,500 Northern Bank & Trust Company (MA) 0.95% 4/6/17 . . . . . . . . . . . . . . . . . . . . . . . . . . . . . . . . . . . . . . . . . . . . . . . . . . . . . . . 243,500 243,500 Northstar Bank (MI) 0.95% 2/16/17 . . . . . . . . . . . . . . . . . . . . . . . . . . . . . . . . . . . . . . . . . . . . . . . . . . . . . . 181,000 181,000 Northwest Bank (IA) 0.95% 3/16/17 . . . . . . . . . . . . . . . . . . . . . . . . . . . . . . . . . . . . . . . . . . . . . . . . . . . . . . 243,500 243,500 Norway Savings Bank (ME) 0.75% 3/16/17 . . . . . . . . . . . . . . . . . . . . . . . . . . . . . . . . . . . . . . . . . . . . . . . . . . . . . . 23,728 23,728 0.75% 4/6/17 . . . . . . . . . . . . . . . . . . . . . . . . . . . . . . . . . . . . . . . . . . . . . . . . . . . . . . . 222,272 222,272 OakStar Bank (MO) 0.95% 3/23/17 . . . . . . . . . . . . . . . . . . . . . . . . . . . . . . . . . . . . . . . . . . . . . . . . . . . . . . 227,000 227,000 Old Second National Bank (IL) 0.75% 3/16/17 . . . . . . . . . . . . . . . . . . . . . . . . . . . . . . . . . . . . . . . . . . . . . . . . . . . . . . 246,000 246,000 OneUnited Bank (MA) 0.95% 6/15/17 . . . . . . . . . . . . . . . . . . . . . . . . . . . . . . . . . . . . . . . . . . . . . . . . . . . . . . 243,500 243,500 Optima Bank & Trust Company (NH) 0.95% 3/16/17 . . . . . . . . . . . . . . . . . . . . . . . . . . . . . . . . . . . . . . . . . . . . . . . . . . . . . . 6,500 6,500 0.95% 3/23/17 . . . . . . . . . . . . . . . . . . . . . . . . . . . . . . . . . . . . . . . . . . . . . . . . . . . . . . 237,000 237,000Orange County Trust Company (NY) 0.95% 4/6/17 . . . . . . . . . . . . . . . . . . . . . . . . . . . . . . . . . . . . . . . . . . . . . . . . . . . . . . . 202,508 202,508 Oritani Bank (NJ) 0.75% 3/16/17 . . . . . . . . . . . . . . . . . . . . . . . . . . . . . . . . . . . . . . . . . . . . . . . . . . . . . . 246,000 246,000 The notes to the fi nancial statements are an integral part of the schedule of investments.
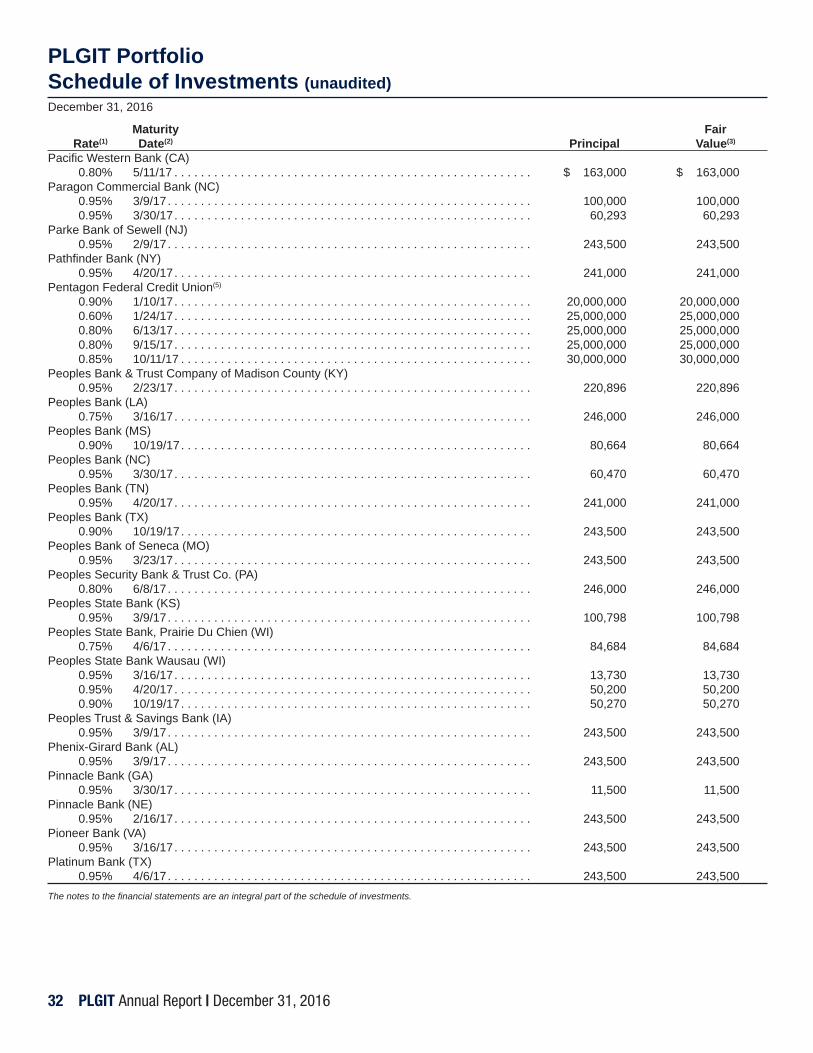
32 PLGIT Annual Report | December 31, 2016
PLGIT PortfolioSchedule of Investments (unaudited)December 31, 2016
Maturity Fair Rate(1) Date(2) Principal Value(3)
Pacifi c Western Bank (CA) 0.80% 5/11/17 . . . . . . . . . . . . . . . . . . . . . . . . . . . . . . . . . . . . . . . . . . . . . . . . . . . . . . $ 163,000 $ 163,000 Paragon Commercial Bank (NC) 0.95% 3/9/17 . . . . . . . . . . . . . . . . . . . . . . . . . . . . . . . . . . . . . . . . . . . . . . . . . . . . . . . 100,000 100,000 0.95% 3/30/17 . . . . . . . . . . . . . . . . . . . . . . . . . . . . . . . . . . . . . . . . . . . . . . . . . . . . . . 60,293 60,293Parke Bank of Sewell (NJ) 0.95% 2/9/17 . . . . . . . . . . . . . . . . . . . . . . . . . . . . . . . . . . . . . . . . . . . . . . . . . . . . . . . 243,500 243,500 Pathfi nder Bank (NY) 0.95% 4/20/17 . . . . . . . . . . . . . . . . . . . . . . . . . . . . . . . . . . . . . . . . . . . . . . . . . . . . . . 241,000 241,000Pentagon Federal Credit Union(5)
0.90% 1/10/17 . . . . . . . . . . . . . . . . . . . . . . . . . . . . . . . . . . . . . . . . . . . . . . . . . . . . . . 20,000,000 20,000,000 0.60% 1/24/17 . . . . . . . . . . . . . . . . . . . . . . . . . . . . . . . . . . . . . . . . . . . . . . . . . . . . . . 25,000,000 25,000,000 0.80% 6/13/17 . . . . . . . . . . . . . . . . . . . . . . . . . . . . . . . . . . . . . . . . . . . . . . . . . . . . . . 25,000,000 25,000,000 0.80% 9/15/17 . . . . . . . . . . . . . . . . . . . . . . . . . . . . . . . . . . . . . . . . . . . . . . . . . . . . . . 25,000,000 25,000,000 0.85% 10/11/17 . . . . . . . . . . . . . . . . . . . . . . . . . . . . . . . . . . . . . . . . . . . . . . . . . . . . . 30,000,000 30,000,000Peoples Bank & Trust Company of Madison County (KY) 0.95% 2/23/17 . . . . . . . . . . . . . . . . . . . . . . . . . . . . . . . . . . . . . . . . . . . . . . . . . . . . . . 220,896 220,896 Peoples Bank (LA) 0.75% 3/16/17 . . . . . . . . . . . . . . . . . . . . . . . . . . . . . . . . . . . . . . . . . . . . . . . . . . . . . . 246,000 246,000Peoples Bank (MS) 0.90% 10/19/17 . . . . . . . . . . . . . . . . . . . . . . . . . . . . . . . . . . . . . . . . . . . . . . . . . . . . . 80,664 80,664 Peoples Bank (NC) 0.95% 3/30/17 . . . . . . . . . . . . . . . . . . . . . . . . . . . . . . . . . . . . . . . . . . . . . . . . . . . . . . 60,470 60,470 Peoples Bank (TN) 0.95% 4/20/17 . . . . . . . . . . . . . . . . . . . . . . . . . . . . . . . . . . . . . . . . . . . . . . . . . . . . . . 241,000 241,000 Peoples Bank (TX) 0.90% 10/19/17 . . . . . . . . . . . . . . . . . . . . . . . . . . . . . . . . . . . . . . . . . . . . . . . . . . . . . 243,500 243,500 Peoples Bank of Seneca (MO) 0.95% 3/23/17 . . . . . . . . . . . . . . . . . . . . . . . . . . . . . . . . . . . . . . . . . . . . . . . . . . . . . . 243,500 243,500 Peoples Security Bank & Trust Co. (PA) 0.80% 6/8/17 . . . . . . . . . . . . . . . . . . . . . . . . . . . . . . . . . . . . . . . . . . . . . . . . . . . . . . . 246,000 246,000 Peoples State Bank (KS) 0.95% 3/9/17 . . . . . . . . . . . . . . . . . . . . . . . . . . . . . . . . . . . . . . . . . . . . . . . . . . . . . . . 100,798 100,798 Peoples State Bank, Prairie Du Chien (WI) 0.75% 4/6/17 . . . . . . . . . . . . . . . . . . . . . . . . . . . . . . . . . . . . . . . . . . . . . . . . . . . . . . . 84,684 84,684 Peoples State Bank Wausau (WI) 0.95% 3/16/17 . . . . . . . . . . . . . . . . . . . . . . . . . . . . . . . . . . . . . . . . . . . . . . . . . . . . . . 13,730 13,730 0.95% 4/20/17 . . . . . . . . . . . . . . . . . . . . . . . . . . . . . . . . . . . . . . . . . . . . . . . . . . . . . . 50,200 50,200 0.90% 10/19/17 . . . . . . . . . . . . . . . . . . . . . . . . . . . . . . . . . . . . . . . . . . . . . . . . . . . . . 50,270 50,270Peoples Trust & Savings Bank (IA) 0.95% 3/9/17 . . . . . . . . . . . . . . . . . . . . . . . . . . . . . . . . . . . . . . . . . . . . . . . . . . . . . . . 243,500 243,500 Phenix-Girard Bank (AL) 0.95% 3/9/17 . . . . . . . . . . . . . . . . . . . . . . . . . . . . . . . . . . . . . . . . . . . . . . . . . . . . . . . 243,500 243,500 Pinnacle Bank (GA) 0.95% 3/30/17 . . . . . . . . . . . . . . . . . . . . . . . . . . . . . . . . . . . . . . . . . . . . . . . . . . . . . . 11,500 11,500 Pinnacle Bank (NE) 0.95% 2/16/17 . . . . . . . . . . . . . . . . . . . . . . . . . . . . . . . . . . . . . . . . . . . . . . . . . . . . . . 243,500 243,500 Pioneer Bank (VA) 0.95% 3/16/17 . . . . . . . . . . . . . . . . . . . . . . . . . . . . . . . . . . . . . . . . . . . . . . . . . . . . . . 243,500 243,500 Platinum Bank (TX) 0.95% 4/6/17 . . . . . . . . . . . . . . . . . . . . . . . . . . . . . . . . . . . . . . . . . . . . . . . . . . . . . . . 243,500 243,500The notes to the fi nancial statements are an integral part of the schedule of investments.

PLGIT Annual Report | December 31, 2016 33
PLGIT PortfolioSchedule of Investments (unaudited)December 31, 2016
Maturity Fair Rate(1) Date(2) Principal Value(3)
Post Oak Bank (TX) 0.95% 3/30/17 . . . . . . . . . . . . . . . . . . . . . . . . . . . . . . . . . . . . . . . . . . . . . . . . . . . . . . $ 109,758 $ 109,758 Prairie Community Bank (IL) 0.95% 4/6/17 . . . . . . . . . . . . . . . . . . . . . . . . . . . . . . . . . . . . . . . . . . . . . . . . . . . . . . . 66,850 66,850 0.95% 4/13/17 . . . . . . . . . . . . . . . . . . . . . . . . . . . . . . . . . . . . . . . . . . . . . . . . . . . . . . 94,621 94,621 0.90% 10/19/17 . . . . . . . . . . . . . . . . . . . . . . . . . . . . . . . . . . . . . . . . . . . . . . . . . . . . . 75,000 75,000Premier Community Bank (WI) 0.95% 4/13/17 . . . . . . . . . . . . . . . . . . . . . . . . . . . . . . . . . . . . . . . . . . . . . . . . . . . . . . 166,692 166,692Premier Valley Bank (CA) 0.95% 2/23/17 . . . . . . . . . . . . . . . . . . . . . . . . . . . . . . . . . . . . . . . . . . . . . . . . . . . . . . 243,500 243,500 Progressive Bank (LA) 0.95% 2/9/17 . . . . . . . . . . . . . . . . . . . . . . . . . . . . . . . . . . . . . . . . . . . . . . . . . . . . . . . 23,055 23,055Prosperity Bank (TX) 0.95% 3/16/17 . . . . . . . . . . . . . . . . . . . . . . . . . . . . . . . . . . . . . . . . . . . . . . . . . . . . . . 243,500 243,500Providence Bank (NC) 0.95% 2/9/17 . . . . . . . . . . . . . . . . . . . . . . . . . . . . . . . . . . . . . . . . . . . . . . . . . . . . . . . 243,500 243,500Prudential Savings Bank (PA) 0.75% 3/16/17 . . . . . . . . . . . . . . . . . . . . . . . . . . . . . . . . . . . . . . . . . . . . . . . . . . . . . . 246,000 246,000Pulaski Bank (MO) 0.95% 2/2/17 . . . . . . . . . . . . . . . . . . . . . . . . . . . . . . . . . . . . . . . . . . . . . . . . . . . . . . . 241,000 241,000 Radius Bank (MA) 0.95% 2/2/17 . . . . . . . . . . . . . . . . . . . . . . . . . . . . . . . . . . . . . . . . . . . . . . . . . . . . . . . 241,000 241,000 Relyance Bank (AR) 0.95% 4/13/17 . . . . . . . . . . . . . . . . . . . . . . . . . . . . . . . . . . . . . . . . . . . . . . . . . . . . . . 157,314 157,314 0.95% 4/20/17 . . . . . . . . . . . . . . . . . . . . . . . . . . . . . . . . . . . . . . . . . . . . . . . . . . . . . . 83,686 83,686Republic Bank (AZ) 0.95% 2/9/17 . . . . . . . . . . . . . . . . . . . . . . . . . . . . . . . . . . . . . . . . . . . . . . . . . . . . . . . 243,500 243,500 Revere Bank (MD) 0.95% 3/9/17 . . . . . . . . . . . . . . . . . . . . . . . . . . . . . . . . . . . . . . . . . . . . . . . . . . . . . . . 243,500 243,500 Riverwood Bank (MN) 0.75% 3/16/17 . . . . . . . . . . . . . . . . . . . . . . . . . . . . . . . . . . . . . . . . . . . . . . . . . . . . . . 246,000 246,000 Royal Bank America (PA) 0.80% 5/11/17 . . . . . . . . . . . . . . . . . . . . . . . . . . . . . . . . . . . . . . . . . . . . . . . . . . . . . . 246,000 246,000 S&T Bank (PA) 0.95% 4/13/17 . . . . . . . . . . . . . . . . . . . . . . . . . . . . . . . . . . . . . . . . . . . . . . . . . . . . . . 241,000 241,000 Sabal Palm Bank (FL) 0.95% 2/2/17 . . . . . . . . . . . . . . . . . . . . . . . . . . . . . . . . . . . . . . . . . . . . . . . . . . . . . . . 4,000 4,000 0.95% 4/20/17 . . . . . . . . . . . . . . . . . . . . . . . . . . . . . . . . . . . . . . . . . . . . . . . . . . . . . . 85,469 85,469Saco & Biddeford Saving Institution (ME) 0.95% 3/16/17 . . . . . . . . . . . . . . . . . . . . . . . . . . . . . . . . . . . . . . . . . . . . . . . . . . . . . . 243,500 243,500 Santa Cruz County Bank (CA) 0.95% 4/6/17 . . . . . . . . . . . . . . . . . . . . . . . . . . . . . . . . . . . . . . . . . . . . . . . . . . . . . . . 243,500 243,500 Savings Bank (IA) 0.95% 3/9/17 . . . . . . . . . . . . . . . . . . . . . . . . . . . . . . . . . . . . . . . . . . . . . . . . . . . . . . . 102,514 102,514 0.95% 3/30/17 . . . . . . . . . . . . . . . . . . . . . . . . . . . . . . . . . . . . . . . . . . . . . . . . . . . . . . 38,487 38,487Seaside National Bank & Trust (FL) 0.95% 4/13/17 . . . . . . . . . . . . . . . . . . . . . . . . . . . . . . . . . . . . . . . . . . . . . . . . . . . . . . 166,000 166,000 0.95% 4/20/17 . . . . . . . . . . . . . . . . . . . . . . . . . . . . . . . . . . . . . . . . . . . . . . . . . . . . . . 75,000 75,000Security Bank (OK) 0.95% 3/16/17 . . . . . . . . . . . . . . . . . . . . . . . . . . . . . . . . . . . . . . . . . . . . . . . . . . . . . . 243,500 243,500 Settlers Bank (WI) 0.95% 3/16/17 . . . . . . . . . . . . . . . . . . . . . . . . . . . . . . . . . . . . . . . . . . . . . . . . . . . . . . 243,500 243,500 Signature Bank National Association (OH) 0.75% 4/6/17 . . . . . . . . . . . . . . . . . . . . . . . . . . . . . . . . . . . . . . . . . . . . . . . . . . . . . . . 246,000 246,000The notes to the fi nancial statements are an integral part of the schedule of investments.

34 PLGIT Annual Report | December 31, 2016
PLGIT PortfolioSchedule of Investments (unaudited)December 31, 2016
Maturity Fair Rate(1) Date(2) Principal Value(3)
Skagit Bank (WA) 0.80% 6/8/17 . . . . . . . . . . . . . . . . . . . . . . . . . . . . . . . . . . . . . . . . . . . . . . . . . . . . . . . $ 246,000 $ 246,000Southern Bancorp Bank (AR) 0.95% 2/23/17 . . . . . . . . . . . . . . . . . . . . . . . . . . . . . . . . . . . . . . . . . . . . . . . . . . . . . . 243,500 243,500 Southern Missouri Bank Marshfi eld (MO) 0.95% 3/9/17 . . . . . . . . . . . . . . . . . . . . . . . . . . . . . . . . . . . . . . . . . . . . . . . . . . . . . . . 243,500 243,500 Southern States Bank (AL) 0.95% 3/23/17 . . . . . . . . . . . . . . . . . . . . . . . . . . . . . . . . . . . . . . . . . . . . . . . . . . . . . . 243,500 243,500 Southpoint Bank (AL) 0.95% 4/13/17 . . . . . . . . . . . . . . . . . . . . . . . . . . . . . . . . . . . . . . . . . . . . . . . . . . . . . . 241,000 241,000 Southwest Bank (TX) 0.95% 2/23/17 . . . . . . . . . . . . . . . . . . . . . . . . . . . . . . . . . . . . . . . . . . . . . . . . . . . . . . 243,500 243,500SpiritBank (OK) 0.95% 2/23/17 . . . . . . . . . . . . . . . . . . . . . . . . . . . . . . . . . . . . . . . . . . . . . . . . . . . . . . 86,557 86,557 St. Louis Bank (MO) 0.75% 3/16/17 . . . . . . . . . . . . . . . . . . . . . . . . . . . . . . . . . . . . . . . . . . . . . . . . . . . . . . 118,769 118,769 0.90% 10/19/17 . . . . . . . . . . . . . . . . . . . . . . . . . . . . . . . . . . . . . . . . . . . . . . . . . . . . . 124,731 124,731 Standing Stone Bank (OH) 0.95% 2/2/17 . . . . . . . . . . . . . . . . . . . . . . . . . . . . . . . . . . . . . . . . . . . . . . . . . . . . . . . 241,000 241,000 Starion Financial (ND) 0.90% 10/19/17 . . . . . . . . . . . . . . . . . . . . . . . . . . . . . . . . . . . . . . . . . . . . . . . . . . . . . 243,500 243,500 State Bank (IA) 0.95% 3/9/17 . . . . . . . . . . . . . . . . . . . . . . . . . . . . . . . . . . . . . . . . . . . . . . . . . . . . . . . 106,195 106,195 0.95% 4/27/17 . . . . . . . . . . . . . . . . . . . . . . . . . . . . . . . . . . . . . . . . . . . . . . . . . . . . . . 132,305 132,305State Bank Financial (WI) 0.75% 4/6/17 . . . . . . . . . . . . . . . . . . . . . . . . . . . . . . . . . . . . . . . . . . . . . . . . . . . . . . . 246,000 246,000 State Bank of Alcester (SD) 0.75% 5/4/17 . . . . . . . . . . . . . . . . . . . . . . . . . . . . . . . . . . . . . . . . . . . . . . . . . . . . . . . 246,000 246,000 State Bank of Florence (WI) 0.95% 3/9/17 . . . . . . . . . . . . . . . . . . . . . . . . . . . . . . . . . . . . . . . . . . . . . . . . . . . . . . . 243,500 243,500 State Bank of Southern Utah (UT) 0.75% 4/6/17 . . . . . . . . . . . . . . . . . . . . . . . . . . . . . . . . . . . . . . . . . . . . . . . . . . . . . . . 206,977 206,977 0.80% 6/8/17 . . . . . . . . . . . . . . . . . . . . . . . . . . . . . . . . . . . . . . . . . . . . . . . . . . . . . . . 39,023 39,023State Bank of Toulon (IL) 0.80% 6/8/17 . . . . . . . . . . . . . . . . . . . . . . . . . . . . . . . . . . . . . . . . . . . . . . . . . . . . . . . 246,000 246,000 Sterling Bank (WI) 0.95% 4/6/17 . . . . . . . . . . . . . . . . . . . . . . . . . . . . . . . . . . . . . . . . . . . . . . . . . . . . . . . 243,500 243,500 Stockmans Bank (OK) 0.95% 2/23/17 . . . . . . . . . . . . . . . . . . . . . . . . . . . . . . . . . . . . . . . . . . . . . . . . . . . . . . 100,000 100,000 0.95% 4/13/17 . . . . . . . . . . . . . . . . . . . . . . . . . . . . . . . . . . . . . . . . . . . . . . . . . . . . . . 77,000 77,000Stonegate Bank (FL) 0.95% 4/27/17 . . . . . . . . . . . . . . . . . . . . . . . . . . . . . . . . . . . . . . . . . . . . . . . . . . . . . . 238,500 238,500Success Bank (IA) 0.95% 3/16/17 . . . . . . . . . . . . . . . . . . . . . . . . . . . . . . . . . . . . . . . . . . . . . . . . . . . . . . 243,500 243,500 Summit Community Bank, Inc. (WV) 0.90% 10/19/17 . . . . . . . . . . . . . . . . . . . . . . . . . . . . . . . . . . . . . . . . . . . . . . . . . . . . . 243,500 243,500Sumner Bank & Trust (TN) 0.75% 4/6/17 . . . . . . . . . . . . . . . . . . . . . . . . . . . . . . . . . . . . . . . . . . . . . . . . . . . . . . . 246,000 246,000Sunrise Bank (FL) 0.95% 2/2/17 . . . . . . . . . . . . . . . . . . . . . . . . . . . . . . . . . . . . . . . . . . . . . . . . . . . . . . . 97,397 97,397Sunshine Bank (FL) 0.95% 3/23/17 . . . . . . . . . . . . . . . . . . . . . . . . . . . . . . . . . . . . . . . . . . . . . . . . . . . . . . 152,109 152,109The notes to the fi nancial statements are an integral part of the schedule of investments.

PLGIT Annual Report | December 31, 2016 35
PLGIT PortfolioSchedule of Investments (unaudited)December 31, 2016
Maturity Fair Rate(1) Date(2) Principal Value(3)
Sunwest Bank (CA) 0.95% 4/6/17 . . . . . . . . . . . . . . . . . . . . . . . . . . . . . . . . . . . . . . . . . . . . . . . . . . . . . . . $ 11,178 $ 11,178 0.75% 4/6/17 . . . . . . . . . . . . . . . . . . . . . . . . . . . . . . . . . . . . . . . . . . . . . . . . . . . . . . . 75,480 75,480Texas Community Bank (TX) 0.80% 6/8/17 . . . . . . . . . . . . . . . . . . . . . . . . . . . . . . . . . . . . . . . . . . . . . . . . . . . . . . . 246,000 246,000 Texas National Bank of Jacksonville (TX) 0.95% 2/9/17 . . . . . . . . . . . . . . . . . . . . . . . . . . . . . . . . . . . . . . . . . . . . . . . . . . . . . . . 243,500 243,500 The American National Bank of Texas (TX) 0.95% 4/6/17 . . . . . . . . . . . . . . . . . . . . . . . . . . . . . . . . . . . . . . . . . . . . . . . . . . . . . . . 243,500 243,500 The Bank of Fayette County (TN) 0.75% 3/16/17 . . . . . . . . . . . . . . . . . . . . . . . . . . . . . . . . . . . . . . . . . . . . . . . . . . . . . . 246,000 246,000 The Brand Banking Company (GA) 0.80% 5/11/17 . . . . . . . . . . . . . . . . . . . . . . . . . . . . . . . . . . . . . . . . . . . . . . . . . . . . . . 246,000 246,000 The Brenham National Bank (TX) 0.75% 3/16/17 . . . . . . . . . . . . . . . . . . . . . . . . . . . . . . . . . . . . . . . . . . . . . . . . . . . . . . 246,000 246,000 The Citizens Bank (KY) 0.95% 2/2/17 . . . . . . . . . . . . . . . . . . . . . . . . . . . . . . . . . . . . . . . . . . . . . . . . . . . . . . . 241,000 241,000 The Citizens Bank of Clovis (NM) 0.95% 3/23/17 . . . . . . . . . . . . . . . . . . . . . . . . . . . . . . . . . . . . . . . . . . . . . . . . . . . . . . 200,000 200,000 0.95% 4/6/17 . . . . . . . . . . . . . . . . . . . . . . . . . . . . . . . . . . . . . . . . . . . . . . . . . . . . . . . 20,000 20,000The Citizens State Bank (OK) 0.95% 4/20/17 . . . . . . . . . . . . . . . . . . . . . . . . . . . . . . . . . . . . . . . . . . . . . . . . . . . . . . 101,974 101,974 The Commercial Savings Bank (OH) 0.95% 3/23/17 . . . . . . . . . . . . . . . . . . . . . . . . . . . . . . . . . . . . . . . . . . . . . . . . . . . . . . 100,000 100,000 0.95% 4/6/17 . . . . . . . . . . . . . . . . . . . . . . . . . . . . . . . . . . . . . . . . . . . . . . . . . . . . . . . 451 451 0.80% 6/8/17 . . . . . . . . . . . . . . . . . . . . . . . . . . . . . . . . . . . . . . . . . . . . . . . . . . . . . . . 100,560 100,560The Cortland Savings and Banking Co. (OH) 0.90% 10/19/17 . . . . . . . . . . . . . . . . . . . . . . . . . . . . . . . . . . . . . . . . . . . . . . . . . . . . . 243,500 243,500 The Eastern Colorado Bank (CO) 0.95% 3/16/17 . . . . . . . . . . . . . . . . . . . . . . . . . . . . . . . . . . . . . . . . . . . . . . . . . . . . . . 56,500 56,500The Fahey Banking Company (OH) 0.95% 2/2/17 . . . . . . . . . . . . . . . . . . . . . . . . . . . . . . . . . . . . . . . . . . . . . . . . . . . . . . . 241,000 241,000 The Farmers & Merchants Bank (AR) 0.95% 2/9/17 . . . . . . . . . . . . . . . . . . . . . . . . . . . . . . . . . . . . . . . . . . . . . . . . . . . . . . . 35,876 35,876 The Farmers & Merchants State Bank (OH) 0.75% 3/16/17 . . . . . . . . . . . . . . . . . . . . . . . . . . . . . . . . . . . . . . . . . . . . . . . . . . . . . . 246,000 246,000 The First Bank and Trust Company (VA) 0.95% 4/6/17 . . . . . . . . . . . . . . . . . . . . . . . . . . . . . . . . . . . . . . . . . . . . . . . . . . . . . . . 243,500 243,500The First National Bank of Granbury (TX) 0.75% 3/16/17 . . . . . . . . . . . . . . . . . . . . . . . . . . . . . . . . . . . . . . . . . . . . . . . . . . . . . . 246,000 246,000 The First National Bank of Moody (TX) 0.95% 3/30/17 . . . . . . . . . . . . . . . . . . . . . . . . . . . . . . . . . . . . . . . . . . . . . . . . . . . . . . 60,577 60,577 0.80% 6/8/17 . . . . . . . . . . . . . . . . . . . . . . . . . . . . . . . . . . . . . . . . . . . . . . . . . . . . . . . 39,634 39,634The First National Bank of Syracuse (KS) 0.90% 10/19/17 . . . . . . . . . . . . . . . . . . . . . . . . . . . . . . . . . . . . . . . . . . . . . . . . . . . . . 97,389 97,389 The First State Bank (OK) 0.80% 6/8/17 . . . . . . . . . . . . . . . . . . . . . . . . . . . . . . . . . . . . . . . . . . . . . . . . . . . . . . . 246,000 246,000 The FNB & Trust Company of Iron Mountain (MI) 0.75% 4/6/17 . . . . . . . . . . . . . . . . . . . . . . . . . . . . . . . . . . . . . . . . . . . . . . . . . . . . . . . 246,000 246,000 The FNB & Trust Company of Vinita (OK) 0.95% 2/23/17 . . . . . . . . . . . . . . . . . . . . . . . . . . . . . . . . . . . . . . . . . . . . . . . . . . . . . . 243,500 243,500 The notes to the fi nancial statements are an integral part of the schedule of investments.

36 PLGIT Annual Report | December 31, 2016
PLGIT PortfolioSchedule of Investments (unaudited)December 31, 2016
Maturity Fair Rate(1) Date(2) Principal Value(3)
The Fort Jennings State Bank (OH) 0.95% 3/30/17 . . . . . . . . . . . . . . . . . . . . . . . . . . . . . . . . . . . . . . . . . . . . . . . . . . . . . . $ 238,500 $ 238,500 The Freedom Bank of Virginia (VA) 0.95% 3/9/17 . . . . . . . . . . . . . . . . . . . . . . . . . . . . . . . . . . . . . . . . . . . . . . . . . . . . . . . 219,645 219,645 0.95% 3/16/17 . . . . . . . . . . . . . . . . . . . . . . . . . . . . . . . . . . . . . . . . . . . . . . . . . . . . . . 23,855 23,855The Leaders Bank (IL) 0.95% 3/9/17 . . . . . . . . . . . . . . . . . . . . . . . . . . . . . . . . . . . . . . . . . . . . . . . . . . . . . . . 243,500 243,500 The Metamora State Bank (OH) 0.95% 3/9/17 . . . . . . . . . . . . . . . . . . . . . . . . . . . . . . . . . . . . . . . . . . . . . . . . . . . . . . . 130,500 130,500 0.95% 3/23/17 . . . . . . . . . . . . . . . . . . . . . . . . . . . . . . . . . . . . . . . . . . . . . . . . . . . . . . 113,000 113,000The PrivateBank and Trust Company (IL) 0.95% 2/2/17 . . . . . . . . . . . . . . . . . . . . . . . . . . . . . . . . . . . . . . . . . . . . . . . . . . . . . . . 241,000 241,000 The Provident Bank (NJ) 0.75% 5/4/17 . . . . . . . . . . . . . . . . . . . . . . . . . . . . . . . . . . . . . . . . . . . . . . . . . . . . . . . 246,000 246,000The Shelby County State Bank (IA) 0.95% 4/27/17 . . . . . . . . . . . . . . . . . . . . . . . . . . . . . . . . . . . . . . . . . . . . . . . . . . . . . . 238,500 238,500 The Tri-County Bank (NE) 0.95% 4/20/17 . . . . . . . . . . . . . . . . . . . . . . . . . . . . . . . . . . . . . . . . . . . . . . . . . . . . . . 126,619 126,619 The Union State Bank of Everest (KS) 0.95% 3/23/17 . . . . . . . . . . . . . . . . . . . . . . . . . . . . . . . . . . . . . . . . . . . . . . . . . . . . . . 243,500 243,500 The Washington Trust Company of Westerly (RI) 0.75% 4/6/17 . . . . . . . . . . . . . . . . . . . . . . . . . . . . . . . . . . . . . . . . . . . . . . . . . . . . . . . 29,655 29,655 0.95% 4/20/17 . . . . . . . . . . . . . . . . . . . . . . . . . . . . . . . . . . . . . . . . . . . . . . . . . . . . . . 25,187 25,187Town and Country Bank (IL) 0.95% 3/23/17 . . . . . . . . . . . . . . . . . . . . . . . . . . . . . . . . . . . . . . . . . . . . . . . . . . . . . . 6,500 6,500 0.95% 4/13/17 . . . . . . . . . . . . . . . . . . . . . . . . . . . . . . . . . . . . . . . . . . . . . . . . . . . . . . 234,500 234,500Trailwest Bank (MT) 0.95% 4/20/17 . . . . . . . . . . . . . . . . . . . . . . . . . . . . . . . . . . . . . . . . . . . . . . . . . . . . . . 241,000 241,000 Transportation Alliance Bank, Inc. (UT) 0.95% 6/15/17 . . . . . . . . . . . . . . . . . . . . . . . . . . . . . . . . . . . . . . . . . . . . . . . . . . . . . . 243,500 243,500Treynor State Bank (IA) 0.95% 2/9/17 . . . . . . . . . . . . . . . . . . . . . . . . . . . . . . . . . . . . . . . . . . . . . . . . . . . . . . . 228,000 228,000Tristar Bank (TN) 0.95% 2/23/17 . . . . . . . . . . . . . . . . . . . . . . . . . . . . . . . . . . . . . . . . . . . . . . . . . . . . . . 159,549 159,549 Tristate Capital Bank (PA) 0.95% 2/16/17 . . . . . . . . . . . . . . . . . . . . . . . . . . . . . . . . . . . . . . . . . . . . . . . . . . . . . . 243,500 243,500TruBank (IA) 0.95% 3/16/17 . . . . . . . . . . . . . . . . . . . . . . . . . . . . . . . . . . . . . . . . . . . . . . . . . . . . . . 243,500 243,500 Two Rivers Bank & Trust (IA) 0.95% 4/6/17 . . . . . . . . . . . . . . . . . . . . . . . . . . . . . . . . . . . . . . . . . . . . . . . . . . . . . . . 243,500 243,500 Union State Bank of West Salem (WI) 0.75% 5/4/17 . . . . . . . . . . . . . . . . . . . . . . . . . . . . . . . . . . . . . . . . . . . . . . . . . . . . . . . 178,984 178,984 United Bank (AL) 0.95% 2/23/17 . . . . . . . . . . . . . . . . . . . . . . . . . . . . . . . . . . . . . . . . . . . . . . . . . . . . . . 70,191 70,191 0.90% 10/19/17 . . . . . . . . . . . . . . . . . . . . . . . . . . . . . . . . . . . . . . . . . . . . . . . . . . . . . 34,190 34,190United Bank (VA) 0.95% 4/6/17 . . . . . . . . . . . . . . . . . . . . . . . . . . . . . . . . . . . . . . . . . . . . . . . . . . . . . . . 230,810 230,810 United Bank (WV) 0.95% 4/20/17 . . . . . . . . . . . . . . . . . . . . . . . . . . . . . . . . . . . . . . . . . . . . . . . . . . . . . . 11,858 11,858 0.95% 4/27/17 . . . . . . . . . . . . . . . . . . . . . . . . . . . . . . . . . . . . . . . . . . . . . . . . . . . . . . 47,474 47,474 United Bank of Springdale (AR) 0.95% 3/16/17 . . . . . . . . . . . . . . . . . . . . . . . . . . . . . . . . . . . . . . . . . . . . . . . . . . . . . . 243,500 243,500 The notes to the fi nancial statements are an integral part of the schedule of investments.

PLGIT Annual Report | December 31, 2016 37
PLGIT PortfolioSchedule of Investments (unaudited)December 31, 2016
Maturity Fair Rate(1) Date(2) Principal Value(3)
United Mississippi Bank (MS) 0.95% 3/16/17 . . . . . . . . . . . . . . . . . . . . . . . . . . . . . . . . . . . . . . . . . . . . . . . . . . . . . . $ 243,500 $ 243,500 United Republic Bank (NE) 0.95% 4/13/17 . . . . . . . . . . . . . . . . . . . . . . . . . . . . . . . . . . . . . . . . . . . . . . . . . . . . . . 241,000 241,000 Unity Bank (MN) 0.95% 3/9/17 . . . . . . . . . . . . . . . . . . . . . . . . . . . . . . . . . . . . . . . . . . . . . . . . . . . . . . . 72,691 72,691 Unity Bank North (MN) 0.95% 2/23/17 . . . . . . . . . . . . . . . . . . . . . . . . . . . . . . . . . . . . . . . . . . . . . . . . . . . . . . 243,500 243,500 Unity National Bank of Houston (TX) 0.95% 3/9/17 . . . . . . . . . . . . . . . . . . . . . . . . . . . . . . . . . . . . . . . . . . . . . . . . . . . . . . . 243,500 243,500 USAmericaBank (FL) 0.75% 3/16/17 . . . . . . . . . . . . . . . . . . . . . . . . . . . . . . . . . . . . . . . . . . . . . . . . . . . . . . 246,000 246,000 Viewpoint Bank (TX) 0.95% 2/23/17 . . . . . . . . . . . . . . . . . . . . . . . . . . . . . . . . . . . . . . . . . . . . . . . . . . . . . . 59,110 59,110Village Bank and Trust (IL) 0.95% 4/20/17 . . . . . . . . . . . . . . . . . . . . . . . . . . . . . . . . . . . . . . . . . . . . . . . . . . . . . . 170,351 170,351Vision Bank (OK) 0.75% 4/6/17 . . . . . . . . . . . . . . . . . . . . . . . . . . . . . . . . . . . . . . . . . . . . . . . . . . . . . . . 159,866 159,866Washington County Bank (NE) 0.95% 2/23/17 . . . . . . . . . . . . . . . . . . . . . . . . . . . . . . . . . . . . . . . . . . . . . . . . . . . . . . 243,500 243,500WashingtonFirst Bank (VA) 0.75% 4/6/17 . . . . . . . . . . . . . . . . . . . . . . . . . . . . . . . . . . . . . . . . . . . . . . . . . . . . . . . 37,593 37,593Waumandee State Bank (WI) 0.95% 3/9/17 . . . . . . . . . . . . . . . . . . . . . . . . . . . . . . . . . . . . . . . . . . . . . . . . . . . . . . . 243,500 243,500 West Bank (IA) 0.95% 4/6/17 . . . . . . . . . . . . . . . . . . . . . . . . . . . . . . . . . . . . . . . . . . . . . . . . . . . . . . . 243,500 243,500 West Plains Bank and Trust Company (MO) 0.95% 4/20/17 . . . . . . . . . . . . . . . . . . . . . . . . . . . . . . . . . . . . . . . . . . . . . . . . . . . . . . 241,000 241,000Western National Bank (MN) 0.80% 6/8/17 . . . . . . . . . . . . . . . . . . . . . . . . . . . . . . . . . . . . . . . . . . . . . . . . . . . . . . . 246,000 246,000 Western National Bank Cass Lake (MN) 0.80% 6/8/17 . . . . . . . . . . . . . . . . . . . . . . . . . . . . . . . . . . . . . . . . . . . . . . . . . . . . . . . 246,000 246,000 Wilmington Savings Fund Society (DE) 0.80% 6/8/17 . . . . . . . . . . . . . . . . . . . . . . . . . . . . . . . . . . . . . . . . . . . . . . . . . . . . . . . 246,000 246,000 Wolverine Bank Federal Savings Bank (MI) 0.95% 2/23/17 . . . . . . . . . . . . . . . . . . . . . . . . . . . . . . . . . . . . . . . . . . . . . . . . . . . . . . 137,000 137,000 Yadkin Bank (NC) 0.75% 3/16/17 . . . . . . . . . . . . . . . . . . . . . . . . . . . . . . . . . . . . . . . . . . . . . . . . . . . . . . 246,000 246,000 York State Bank (NE) 0.75% 4/6/17 . . . . . . . . . . . . . . . . . . . . . . . . . . . . . . . . . . . . . . . . . . . . . . . . . . . . . . . 246,000 246,000 Total Certifi cates of Deposit . . . . . . . . . . . . . . . . . . . . . . . . . . . . . . . . . . . . . . . . . . . . . . . . . . . . . . . . . . . . . . . . . 475,700,000U.S. Government and Agency Obligations (51.89%)Fannie Mae Mortgage-Backed Security Discount Notes 0.41% 1/3/17 . . . . . . . . . . . . . . . . . . . . . . . . . . . . . . . . . . . . . . . . . . . . . . . . . . . . . . . 30,000,000 29,999,321Fannie Mae Notes 0.67% 6/12/17 . . . . . . . . . . . . . . . . . . . . . . . . . . . . . . . . . . . . . . . . . . . . . . . . . . . . . . 8,315,000 8,488,434Federal Farm Credit Banks Notes 0.60%(4) 2/1/17 . . . . . . . . . . . . . . . . . . . . . . . . . . . . . . . . . . . . . . . . . . . . . . . . . . . . . . . 65,000,000 64,997,215 0.78%(4) 3/29/17 . . . . . . . . . . . . . . . . . . . . . . . . . . . . . . . . . . . . . . . . . . . . . . . . . . . . . . 13,150,000 13,150,639 0.61%(4) 3/30/17 . . . . . . . . . . . . . . . . . . . . . . . . . . . . . . . . . . . . . . . . . . . . . . . . . . . . . . 30,000,000 29,991,228 0.62%(4) 4/20/17 . . . . . . . . . . . . . . . . . . . . . . . . . . . . . . . . . . . . . . . . . . . . . . . . . . . . . . 30,000,000 29,997,278 0.82%(4) 9/14/17 . . . . . . . . . . . . . . . . . . . . . . . . . . . . . . . . . . . . . . . . . . . . . . . . . . . . . . 25,000,000 24,998,204 0.77%(4) 12/27/17 . . . . . . . . . . . . . . . . . . . . . . . . . . . . . . . . . . . . . . . . . . . . . . . . . . . . . 20,000,000 19,971,310The notes to the fi nancial statements are an integral part of the schedule of investments.

38 PLGIT Annual Report | December 31, 2016
PLGIT PortfolioSchedule of Investments (unaudited)December 31, 2016
Maturity Fair Rate(1) Date(2) Principal Value(3)
Federal Home Loan Banks Discount Notes 0.51% 2/3/17 . . . . . . . . . . . . . . . . . . . . . . . . . . . . . . . . . . . . . . . . . . . . . . . . . . . . . . . $ 20,000,000 $ 19,990,742 0.48% 2/10/17 . . . . . . . . . . . . . . . . . . . . . . . . . . . . . . . . . . . . . . . . . . . . . . . . . . . . . . 65,000,000 64,965,333 0.53% 2/22/17 . . . . . . . . . . . . . . . . . . . . . . . . . . . . . . . . . . . . . . . . . . . . . . . . . . . . . . 50,000,000 49,961,722 0.53% 3/7/17 . . . . . . . . . . . . . . . . . . . . . . . . . . . . . . . . . . . . . . . . . . . . . . . . . . . . . . . 50,000,000 49,952,153 Federal Home Loan Banks Notes 0.52% 1/25/17 . . . . . . . . . . . . . . . . . . . . . . . . . . . . . . . . . . . . . . . . . . . . . . . . . . . . . . 15,000,000 14,999,524 0.49% 1/25/17 . . . . . . . . . . . . . . . . . . . . . . . . . . . . . . . . . . . . . . . . . . . . . . . . . . . . . . 35,000,000 34,998,889 0.85%(4) 1/26/17 . . . . . . . . . . . . . . . . . . . . . . . . . . . . . . . . . . . . . . . . . . . . . . . . . . . . . . 15,000,000 15,000,000 0.63%(4) 3/1/17 . . . . . . . . . . . . . . . . . . . . . . . . . . . . . . . . . . . . . . . . . . . . . . . . . . . . . . . 50,000,000 49,999,190 0.67%(4) 3/9/17 . . . . . . . . . . . . . . . . . . . . . . . . . . . . . . . . . . . . . . . . . . . . . . . . . . . . . . . 38,000,000 38,000,000 0.53% 3/10/17 . . . . . . . . . . . . . . . . . . . . . . . . . . . . . . . . . . . . . . . . . . . . . . . . . . . . . . 3,400,000 3,402,218 0.55% 4/12/17 . . . . . . . . . . . . . . . . . . . . . . . . . . . . . . . . . . . . . . . . . . . . . . . . . . . . . . 30,000,000 29,998,098 0.63% 4/28/17 . . . . . . . . . . . . . . . . . . . . . . . . . . . . . . . . . . . . . . . . . . . . . . . . . . . . . . 40,000,000 39,986,778 0.65% 6/9/17 . . . . . . . . . . . . . . . . . . . . . . . . . . . . . . . . . . . . . . . . . . . . . . . . . . . . . . . 6,950,000 6,960,580 0.73%(4) 11/10/17 . . . . . . . . . . . . . . . . . . . . . . . . . . . . . . . . . . . . . . . . . . . . . . . . . . . . . 25,000,000 24,994,624 0.77%(4) 11/15/17 . . . . . . . . . . . . . . . . . . . . . . . . . . . . . . . . . . . . . . . . . . . . . . . . . . . . . 22,000,000 22,000,000 0.78%(4) 3/23/18 . . . . . . . . . . . . . . . . . . . . . . . . . . . . . . . . . . . . . . . . . . . . . . . . . . . . . . 65,000,000 65,000,302 Freddie Mac Notes 0.75% 3/9/17 . . . . . . . . . . . . . . . . . . . . . . . . . . . . . . . . . . . . . . . . . . . . . . . . . . . . . . . 25,000,000 25,000,000 0.74%(4) 4/20/17 . . . . . . . . . . . . . . . . . . . . . . . . . . . . . . . . . . . . . . . . . . . . . . . . . . . . . . 13,050,000 13,049,404 0.87%(4) 7/21/17 . . . . . . . . . . . . . . . . . . . . . . . . . . . . . . . . . . . . . . . . . . . . . . . . . . . . . . 15,000,000 14,999,151 U.S. Treasury Notes 0.52% 2/28/17 . . . . . . . . . . . . . . . . . . . . . . . . . . . . . . . . . . . . . . . . . . . . . . . . . . . . . . 40,000,000 40,158,660 0.55% 5/11/17 . . . . . . . . . . . . . . . . . . . . . . . . . . . . . . . . . . . . . . . . . . . . . . . . . . . . . . 30,000,000 29,940,254 0.63% 6/30/17 . . . . . . . . . . . . . . . . . . . . . . . . . . . . . . . . . . . . . . . . . . . . . . . . . . . . . . 80,000,000 80,048,378 0.65% 8/15/17 . . . . . . . . . . . . . . . . . . . . . . . . . . . . . . . . . . . . . . . . . . . . . . . . . . . . . . 30,000,000 30,042,533 0.66% 8/31/17 . . . . . . . . . . . . . . . . . . . . . . . . . . . . . . . . . . . . . . . . . . . . . . . . . . . . . . 26,000,000 25,994,188 0.80% 8/31/17 . . . . . . . . . . . . . . . . . . . . . . . . . . . . . . . . . . . . . . . . . . . . . . . . . . . . . . 30,000,000 30,211,047 0.81% 10/2/17 . . . . . . . . . . . . . . . . . . . . . . . . . . . . . . . . . . . . . . . . . . . . . . . . . . . . . . 25,000,000 24,965,099 Total U.S. Government and Agency Obligations . . . . . . . . . . . . . . . . . . . . . . . . . . . . . . . . . . . . . . . . . . . . . . . . . 1,066,212,496Repurchase Agreements (0.77%)Goldman Sachs & Co. 0.45% 1/3/17 . . . . . . . . . . . . . . . . . . . . . . . . . . . . . . . . . . . . . . . . . . . . . . . . . . . . . . . 15,900,000 15,900,000 (Dated 12/30/16, repurchase price $15,900,795 collateralized by U.S. Ginnie Mae certifi cates, 3.50%-5.50%, maturing 8/15/39-9/20/46, fair value $16,218,811)Total Repurchase Agreements . . . . . . . . . . . . . . . . . . . . . . . . . . . . . . . . . . . . . . . . . . . . . . . . . . . . . . . . . . . . . . 15,900,000Total Investments (75.81%) (Amortized Cost $1,557,812,496) . . . . . . . . . . . . . . . . . . . . . . . . . . . . . . . . . . . . 1,557,812,496Other Assets in Excess of Other Liabilities (24.19%) . . . . . . . . . . . . . . . . . . . . . . . . . . . . . . . . . . . . . . . . . . 496,969,248Net Position (100.00%) . . . . . . . . . . . . . . . . . . . . . . . . . . . . . . . . . . . . . . . . . . . . . . . . . . . . . . . . . . . . . . . . . . . $ 2,054,781,744(1) Yield-to-maturity at original cost unless otherwise noted(2) Actual maturity dates.(3) See Note B to the fi nancial statements(4) Adjustable rate security. Rate shown is that which was in effect at December 31, 2016.(5) Guaranteed by Federal Home Loan Bank Letter of Credit and subject to put with 1 day notice.The notes to the fi nancial statements are an integral part of the schedule of investments.
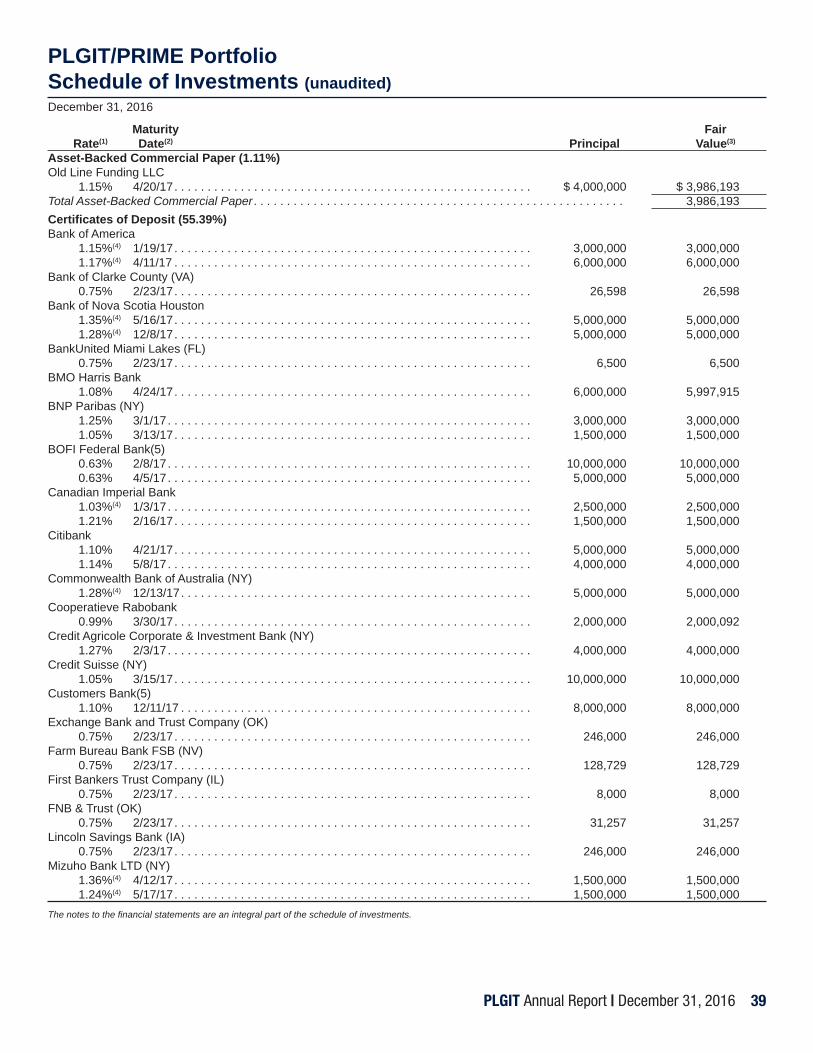
PLGIT Annual Report | December 31, 2016 39
PLGIT/PRIME PortfolioSchedule of Investments (unaudited)December 31, 2016
Maturity Fair Rate(1) Date(2) Principal Value(3)
Asset-Backed Commercial Paper (1.11%)Old Line Funding LLC 1.15% 4/20/17 . . . . . . . . . . . . . . . . . . . . . . . . . . . . . . . . . . . . . . . . . . . . . . . . . . . . . . $ 4,000,000 $ 3,986,193Total Asset-Backed Commercial Paper . . . . . . . . . . . . . . . . . . . . . . . . . . . . . . . . . . . . . . . . . . . . . . . . . . . . . . . . 3,986,193Certifi cates of Deposit (55.39%)Bank of America 1.15%(4) 1/19/17 . . . . . . . . . . . . . . . . . . . . . . . . . . . . . . . . . . . . . . . . . . . . . . . . . . . . . . 3,000,000 3,000,000 1.17%(4) 4/11/17 . . . . . . . . . . . . . . . . . . . . . . . . . . . . . . . . . . . . . . . . . . . . . . . . . . . . . . 6,000,000 6,000,000Bank of Clarke County (VA) 0.75% 2/23/17 . . . . . . . . . . . . . . . . . . . . . . . . . . . . . . . . . . . . . . . . . . . . . . . . . . . . . . 26,598 26,598Bank of Nova Scotia Houston 1.35%(4) 5/16/17 . . . . . . . . . . . . . . . . . . . . . . . . . . . . . . . . . . . . . . . . . . . . . . . . . . . . . . 5,000,000 5,000,000 1.28%(4) 12/8/17 . . . . . . . . . . . . . . . . . . . . . . . . . . . . . . . . . . . . . . . . . . . . . . . . . . . . . . 5,000,000 5,000,000BankUnited Miami Lakes (FL) 0.75% 2/23/17 . . . . . . . . . . . . . . . . . . . . . . . . . . . . . . . . . . . . . . . . . . . . . . . . . . . . . . 6,500 6,500BMO Harris Bank 1.08% 4/24/17 . . . . . . . . . . . . . . . . . . . . . . . . . . . . . . . . . . . . . . . . . . . . . . . . . . . . . . 6,000,000 5,997,915BNP Paribas (NY) 1.25% 3/1/17 . . . . . . . . . . . . . . . . . . . . . . . . . . . . . . . . . . . . . . . . . . . . . . . . . . . . . . . 3,000,000 3,000,000 1.05% 3/13/17 . . . . . . . . . . . . . . . . . . . . . . . . . . . . . . . . . . . . . . . . . . . . . . . . . . . . . . 1,500,000 1,500,000BOFI Federal Bank(5) 0.63% 2/8/17 . . . . . . . . . . . . . . . . . . . . . . . . . . . . . . . . . . . . . . . . . . . . . . . . . . . . . . . 10,000,000 10,000,000 0.63% 4/5/17 . . . . . . . . . . . . . . . . . . . . . . . . . . . . . . . . . . . . . . . . . . . . . . . . . . . . . . . 5,000,000 5,000,000Canadian Imperial Bank 1.03%(4) 1/3/17 . . . . . . . . . . . . . . . . . . . . . . . . . . . . . . . . . . . . . . . . . . . . . . . . . . . . . . . 2,500,000 2,500,000 1.21% 2/16/17 . . . . . . . . . . . . . . . . . . . . . . . . . . . . . . . . . . . . . . . . . . . . . . . . . . . . . . 1,500,000 1,500,000Citibank 1.10% 4/21/17 . . . . . . . . . . . . . . . . . . . . . . . . . . . . . . . . . . . . . . . . . . . . . . . . . . . . . . 5,000,000 5,000,000 1.14% 5/8/17 . . . . . . . . . . . . . . . . . . . . . . . . . . . . . . . . . . . . . . . . . . . . . . . . . . . . . . . 4,000,000 4,000,000Commonwealth Bank of Australia (NY) 1.28%(4) 12/13/17 . . . . . . . . . . . . . . . . . . . . . . . . . . . . . . . . . . . . . . . . . . . . . . . . . . . . . 5,000,000 5,000,000Cooperatieve Rabobank 0.99% 3/30/17 . . . . . . . . . . . . . . . . . . . . . . . . . . . . . . . . . . . . . . . . . . . . . . . . . . . . . . 2,000,000 2,000,092Credit Agricole Corporate & Investment Bank (NY) 1.27% 2/3/17 . . . . . . . . . . . . . . . . . . . . . . . . . . . . . . . . . . . . . . . . . . . . . . . . . . . . . . . 4,000,000 4,000,000Credit Suisse (NY) 1.05% 3/15/17 . . . . . . . . . . . . . . . . . . . . . . . . . . . . . . . . . . . . . . . . . . . . . . . . . . . . . . 10,000,000 10,000,000Customers Bank(5) 1.10% 12/11/17 . . . . . . . . . . . . . . . . . . . . . . . . . . . . . . . . . . . . . . . . . . . . . . . . . . . . . 8,000,000 8,000,000Exchange Bank and Trust Company (OK) 0.75% 2/23/17 . . . . . . . . . . . . . . . . . . . . . . . . . . . . . . . . . . . . . . . . . . . . . . . . . . . . . . 246,000 246,000Farm Bureau Bank FSB (NV) 0.75% 2/23/17 . . . . . . . . . . . . . . . . . . . . . . . . . . . . . . . . . . . . . . . . . . . . . . . . . . . . . . 128,729 128,729First Bankers Trust Company (IL) 0.75% 2/23/17 . . . . . . . . . . . . . . . . . . . . . . . . . . . . . . . . . . . . . . . . . . . . . . . . . . . . . . 8,000 8,000FNB & Trust (OK) 0.75% 2/23/17 . . . . . . . . . . . . . . . . . . . . . . . . . . . . . . . . . . . . . . . . . . . . . . . . . . . . . . 31,257 31,257Lincoln Savings Bank (IA) 0.75% 2/23/17 . . . . . . . . . . . . . . . . . . . . . . . . . . . . . . . . . . . . . . . . . . . . . . . . . . . . . . 246,000 246,000 Mizuho Bank LTD (NY) 1.36%(4) 4/12/17 . . . . . . . . . . . . . . . . . . . . . . . . . . . . . . . . . . . . . . . . . . . . . . . . . . . . . . 1,500,000 1,500,000 1.24%(4) 5/17/17 . . . . . . . . . . . . . . . . . . . . . . . . . . . . . . . . . . . . . . . . . . . . . . . . . . . . . . 1,500,000 1,500,000The notes to the fi nancial statements are an integral part of the schedule of investments.

40 PLGIT Annual Report | December 31, 2016
PLGIT/PRIME PortfolioSchedule of Investments (unaudited)December 31, 2016
Maturity Fair Rate(1) Date(2) Principal Value(3)
Mizuho Corporate Bank (NY) 1.44%(4) 2/17/17 . . . . . . . . . . . . . . . . . . . . . . . . . . . . . . . . . . . . . . . . . . . . . . . . . . . . . . $ 4,000,000 $ 4,000,000 1.40%(4) 3/8/17 . . . . . . . . . . . . . . . . . . . . . . . . . . . . . . . . . . . . . . . . . . . . . . . . . . . . . . . 1,000,000 1,000,000 Mutual of Omaha Bank (NE) 0.75% 2/23/17 . . . . . . . . . . . . . . . . . . . . . . . . . . . . . . . . . . . . . . . . . . . . . . . . . . . . . . 246,000 246,000 National Australia Bank (NY) 1.19%(4) 6/8/17 . . . . . . . . . . . . . . . . . . . . . . . . . . . . . . . . . . . . . . . . . . . . . . . . . . . . . . . 2,000,000 2,000,000Natixis (NY) 0.68% 1/3/17 . . . . . . . . . . . . . . . . . . . . . . . . . . . . . . . . . . . . . . . . . . . . . . . . . . . . . . . 8,000,000 8,000,000Nordea Bank Finland (NY) 1.18%(4) 2/13/17 . . . . . . . . . . . . . . . . . . . . . . . . . . . . . . . . . . . . . . . . . . . . . . . . . . . . . . 3,000,000 3,000,031 1.10% 3/1/17 . . . . . . . . . . . . . . . . . . . . . . . . . . . . . . . . . . . . . . . . . . . . . . . . . . . . . . . 2,000,000 2,000,290 Norinchukin Bank (NY) 0.94% 3/14/17 . . . . . . . . . . . . . . . . . . . . . . . . . . . . . . . . . . . . . . . . . . . . . . . . . . . . . . 7,000,000 7,000,000North Middlesex Savings Bank (MA) 0.75% 2/23/17 . . . . . . . . . . . . . . . . . . . . . . . . . . . . . . . . . . . . . . . . . . . . . . . . . . . . . . 246,000 246,000 Pentagon Federal Credit Union(5) 0.60% 1/24/17 . . . . . . . . . . . . . . . . . . . . . . . . . . . . . . . . . . . . . . . . . . . . . . . . . . . . . . 10,000,000 10,000,000 0.80% 9/15/17 . . . . . . . . . . . . . . . . . . . . . . . . . . . . . . . . . . . . . . . . . . . . . . . . . . . . . . 5,000,000 5,000,000 0.85% 10/11/17 . . . . . . . . . . . . . . . . . . . . . . . . . . . . . . . . . . . . . . . . . . . . . . . . . . . . . 5,000,000 5,000,000 Royal Bank of Canada (NY) 1.32%(4) 6/2/17 . . . . . . . . . . . . . . . . . . . . . . . . . . . . . . . . . . . . . . . . . . . . . . . . . . . . . . . 2,000,000 2,000,000 Skandinaviska Enskilda Banken (NY) 1.17%(4) 4/7/17 . . . . . . . . . . . . . . . . . . . . . . . . . . . . . . . . . . . . . . . . . . . . . . . . . . . . . . . 4,000,000 4,000,000 Societe Generale (NY) 1.30% 2/28/17 . . . . . . . . . . . . . . . . . . . . . . . . . . . . . . . . . . . . . . . . . . . . . . . . . . . . . . 6,000,000 5,998,955 1.25% 3/7/17 . . . . . . . . . . . . . . . . . . . . . . . . . . . . . . . . . . . . . . . . . . . . . . . . . . . . . . . 2,000,000 2,000,000 South Central State Bank (NE) 0.75% 2/23/17 . . . . . . . . . . . . . . . . . . . . . . . . . . . . . . . . . . . . . . . . . . . . . . . . . . . . . . 246,000 246,000 State Street Bank & Trust 1.11%(4) 3/10/17 . . . . . . . . . . . . . . . . . . . . . . . . . . . . . . . . . . . . . . . . . . . . . . . . . . . . . . 1,000,000 1,000,000 Sumitomo Mitsui Bank (NY) 1.25% 2/3/17 . . . . . . . . . . . . . . . . . . . . . . . . . . . . . . . . . . . . . . . . . . . . . . . . . . . . . . . 1,000,000 1,000,000 1.11% 2/24/17 . . . . . . . . . . . . . . . . . . . . . . . . . . . . . . . . . . . . . . . . . . . . . . . . . . . . . . 1,000,000 1,000,206 1.16%(4) 6/5/17 . . . . . . . . . . . . . . . . . . . . . . . . . . . . . . . . . . . . . . . . . . . . . . . . . . . . . . . 8,000,000 8,000,000 Surrey Bank & Trust (NC) 0.75% 2/23/17 . . . . . . . . . . . . . . . . . . . . . . . . . . . . . . . . . . . . . . . . . . . . . . . . . . . . . . 62,608 62,608Svenska Handelsbanken (NY) 1.20%(4) 2/3/17 . . . . . . . . . . . . . . . . . . . . . . . . . . . . . . . . . . . . . . . . . . . . . . . . . . . . . . . 5,000,000 5,000,000 0.90% 3/1/17 . . . . . . . . . . . . . . . . . . . . . . . . . . . . . . . . . . . . . . . . . . . . . . . . . . . . . . . 2,000,000 2,000,016 1.36%(4) 5/30/17 . . . . . . . . . . . . . . . . . . . . . . . . . . . . . . . . . . . . . . . . . . . . . . . . . . . . . . 3,000,000 3,000,000 The Delaware Bank & Trust 0.75% 2/23/17 . . . . . . . . . . . . . . . . . . . . . . . . . . . . . . . . . . . . . . . . . . . . . . . . . . . . . . 6,308 6,308 The Park National Bank (OH) 0.75% 2/23/17 . . . . . . . . . . . . . . . . . . . . . . . . . . . . . . . . . . . . . . . . . . . . . . . . . . . . . . 246,000 246,000 Toronto Dominion Bank (NY) 1.19%(4) 2/3/17 . . . . . . . . . . . . . . . . . . . . . . . . . . . . . . . . . . . . . . . . . . . . . . . . . . . . . . . 5,000,000 5,000,000 1.40% 7/13/17 . . . . . . . . . . . . . . . . . . . . . . . . . . . . . . . . . . . . . . . . . . . . . . . . . . . . . . 2,000,000 1,997,846 UBS AG (CT) 1.51%(4) 6/21/17 . . . . . . . . . . . . . . . . . . . . . . . . . . . . . . . . . . . . . . . . . . . . . . . . . . . . . . 7,000,000 7,000,000Valley National Bank (OK) 0.75% 2/23/17 . . . . . . . . . . . . . . . . . . . . . . . . . . . . . . . . . . . . . . . . . . . . . . . . . . . . . . 8,000 8,000 The notes to the fi nancial statements are an integral part of the schedule of investments.

PLGIT Annual Report | December 31, 2016 41
PLGIT/PRIME PortfolioSchedule of Investments (unaudited)December 31, 2016
Maturity Fair Rate(1) Date(2) Principal Value(3)
Washington Federal (WA) 0.75% 2/23/17 . . . . . . . . . . . . . . . . . . . . . . . . . . . . . . . . . . . . . . . . . . . . . . . . . . . . . . $ 246,000 $ 246,000 Wells Fargo Bank 1.00% 2/1/17 . . . . . . . . . . . . . . . . . . . . . . . . . . . . . . . . . . . . . . . . . . . . . . . . . . . . . . . 6,500,000 6,500,296 1.24%(4) 2/3/17 . . . . . . . . . . . . . . . . . . . . . . . . . . . . . . . . . . . . . . . . . . . . . . . . . . . . . . . 2,500,000 2,500,198 1.16%(4) 6/21/17 . . . . . . . . . . . . . . . . . . . . . . . . . . . . . . . . . . . . . . . . . . . . . . . . . . . . . . 2,000,000 2,000,000 Total Certifi cates of Deposit . . . . . . . . . . . . . . . . . . . . . . . . . . . . . . . . . . . . . . . . . . . . . . . . . . . . . . . . . . . . . . . . . 198,495,845Commercial Paper (18.45%)Bank of Montreal Chicago (IL) 1.01% 1/19/17 . . . . . . . . . . . . . . . . . . . . . . . . . . . . . . . . . . . . . . . . . . . . . . . . . . . . . . 2,000,000 1,999,000 0.90% 2/15/17 . . . . . . . . . . . . . . . . . . . . . . . . . . . . . . . . . . . . . . . . . . . . . . . . . . . . . . 3,000,000 2,996,625Bank of Tokyo Mitsubishi UFJ LTD 0.92% 1/11/17 . . . . . . . . . . . . . . . . . . . . . . . . . . . . . . . . . . . . . . . . . . . . . . . . . . . . . . 1,500,000 1,499,616 1.27% 4/7/17 . . . . . . . . . . . . . . . . . . . . . . . . . . . . . . . . . . . . . . . . . . . . . . . . . . . . . . . 3,500,000 3,488,240 1.24% 5/9/17 . . . . . . . . . . . . . . . . . . . . . . . . . . . . . . . . . . . . . . . . . . . . . . . . . . . . . . . 3,500,000 3,484,693BNP Paribas (NY) 1.23% 2/14/17 . . . . . . . . . . . . . . . . . . . . . . . . . . . . . . . . . . . . . . . . . . . . . . . . . . . . . . 2,000,000 1,997,018 1.28% 3/20/17 . . . . . . . . . . . . . . . . . . . . . . . . . . . . . . . . . . . . . . . . . . . . . . . . . . . . . . 2,000,000 1,994,497Canadian Imperial Bank 1.35%(4) 6/16/17 . . . . . . . . . . . . . . . . . . . . . . . . . . . . . . . . . . . . . . . . . . . . . . . . . . . . . . 5,000,000 5,000,000 Cooperatieve Rabobank 1.14% 2/1/17 . . . . . . . . . . . . . . . . . . . . . . . . . . . . . . . . . . . . . . . . . . . . . . . . . . . . . . . 5,000,000 4,995,134 Credit Agricole Corporate & Investment Bank (NY) 1.24% 4/17/17 . . . . . . . . . . . . . . . . . . . . . . . . . . . . . . . . . . . . . . . . . . . . . . . . . . . . . . 1,000,000 996,379 ING (US) Funding 1.12% 2/1/17 . . . . . . . . . . . . . . . . . . . . . . . . . . . . . . . . . . . . . . . . . . . . . . . . . . . . . . . 3,500,000 3,496,655 1.20% 2/13/17 . . . . . . . . . . . . . . . . . . . . . . . . . . . . . . . . . . . . . . . . . . . . . . . . . . . . . . 1,000,000 998,579 1.23% 3/1/17 . . . . . . . . . . . . . . . . . . . . . . . . . . . . . . . . . . . . . . . . . . . . . . . . . . . . . . . 1,010,000 1,007,981 0.94% 3/3/17 . . . . . . . . . . . . . . . . . . . . . . . . . . . . . . . . . . . . . . . . . . . . . . . . . . . . . . . 2,000,000 1,996,814 1.23% 3/22/17 . . . . . . . . . . . . . . . . . . . . . . . . . . . . . . . . . . . . . . . . . . . . . . . . . . . . . . 3,500,000 3,490,511 JP Morgan Securities LLC 1.01% 3/30/17 . . . . . . . . . . . . . . . . . . . . . . . . . . . . . . . . . . . . . . . . . . . . . . . . . . . . . . 3,000,000 2,992,666 1.20%(4) 7/10/17 . . . . . . . . . . . . . . . . . . . . . . . . . . . . . . . . . . . . . . . . . . . . . . . . . . . . . . 4,000,000 4,000,000 Metlife Short Term Funding 0.93% 1/3/17 . . . . . . . . . . . . . . . . . . . . . . . . . . . . . . . . . . . . . . . . . . . . . . . . . . . . . . . 4,000,000 3,999,793 0.93% 1/17/17 . . . . . . . . . . . . . . . . . . . . . . . . . . . . . . . . . . . . . . . . . . . . . . . . . . . . . . 3,500,000 3,498,554 Mizuho Corporate Bank (NY) 0.96% 1/4/17 . . . . . . . . . . . . . . . . . . . . . . . . . . . . . . . . . . . . . . . . . . . . . . . . . . . . . . . 3,000,000 2,999,761 Toronto Dominion Holding USA 0.90% 2/27/17 . . . . . . . . . . . . . . . . . . . . . . . . . . . . . . . . . . . . . . . . . . . . . . . . . . . . . . 4,000,000 3,994,300 Toyota Motor Credit Corp. 1.14%(4) 3/31/17 . . . . . . . . . . . . . . . . . . . . . . . . . . . . . . . . . . . . . . . . . . . . . . . . . . . . . . 3,200,000 3,200,000 1.28% 7/7/17 . . . . . . . . . . . . . . . . . . . . . . . . . . . . . . . . . . . . . . . . . . . . . . . . . . . . . . . 2,000,000 1,986,806 Total Commercial Paper . . . . . . . . . . . . . . . . . . . . . . . . . . . . . . . . . . . . . . . . . . . . . . . . . . . . . . . . . . . . . . . . . . . 66,113,622The notes to the fi nancial statements are an integral part of the schedule of investments.

42 PLGIT Annual Report | December 31, 2016
PLGIT/PRIME PortfolioSchedule of Investments (unaudited)December 31, 2016
Maturity Fair Rate(1) Date(2) Principal Value(3)
U.S. Government and Agency Obligations (5.86%)Federal Home Loan Banks Notes 0.63%(4) 3/1/17 . . . . . . . . . . . . . . . . . . . . . . . . . . . . . . . . . . . . . . . . . . . . . . . . . . . . . . . $ 3,000,000 $ 2,999,951 0.67%(4) 3/9/17 . . . . . . . . . . . . . . . . . . . . . . . . . . . . . . . . . . . . . . . . . . . . . . . . . . . . . . . 2,000,000 2,000,000 0.63% 4/28/17 . . . . . . . . . . . . . . . . . . . . . . . . . . . . . . . . . . . . . . . . . . . . . . . . . . . . . . 2,000,000 1,999,339U.S. Treasury Notes 0.49% 2/28/17 . . . . . . . . . . . . . . . . . . . . . . . . . . . . . . . . . . . . . . . . . . . . . . . . . . . . . . 5,000,000 5,000,064 0.64% 8/15/17 . . . . . . . . . . . . . . . . . . . . . . . . . . . . . . . . . . . . . . . . . . . . . . . . . . . . . . 3,000,000 3,004,369 0.66% 8/31/17 . . . . . . . . . . . . . . . . . . . . . . . . . . . . . . . . . . . . . . . . . . . . . . . . . . . . . . 6,000,000 5,998,768Total U.S Government and Agency Obligations . . . . . . . . . . . . . . . . . . . . . . . . . . . . . . . . . . . . . . . . . . . . . . . . . 21,002,491Repurchase Agreements (3.96%)Goldman Sachs & Co. 0.45% 1/3/17 . . . . . . . . . . . . . . . . . . . . . . . . . . . . . . . . . . . . . . . . . . . . . . . . . . . . . . . 14,200,000 14,200,000 (Dated 12/30/16, repurchase price $14,200,710, collateralized by Ginnie Mae certifi cates, 3.50%-4.50%, maturing 1/15/44-11/20/46, fair value $14,484,725)Total Repurchase Agreements . . . . . . . . . . . . . . . . . . . . . . . . . . . . . . . . . . . . . . . . . . . . . . . . . . . . . . . . . . . . . . 14,200,000Total Investments (84.77%)(Amortized Cost ($303,798,151) . . . . . . . . . . . . . . . . . . . . . . . . . . . . . . . . . . . . . 303,798,151Other Assets in Excess of Other Liabilities (15.23%) . . . . . . . . . . . . . . . . . . . . . . . . . . . . . . . . . . . . . . . . . . 54,565,787Net Position (100.00%) . . . . . . . . . . . . . . . . . . . . . . . . . . . . . . . . . . . . . . . . . . . . . . . . . . . . . . . . . . . . . . . . . . . $ 358,363,938(1) Yield-to-maturity at original cost unless otherwise noted(2) Actual maturity dates.(3) See Note B to the fi nancial statements(4) Adjustable rate security. Rate shown is that which was in effect at December 31, 2016.(5) Guaranteed by Federal Home Loan Bank Letter of Credit and subject to put with 1 day notice.The notes to the fi nancial statements are an integral part of the schedule of investments.
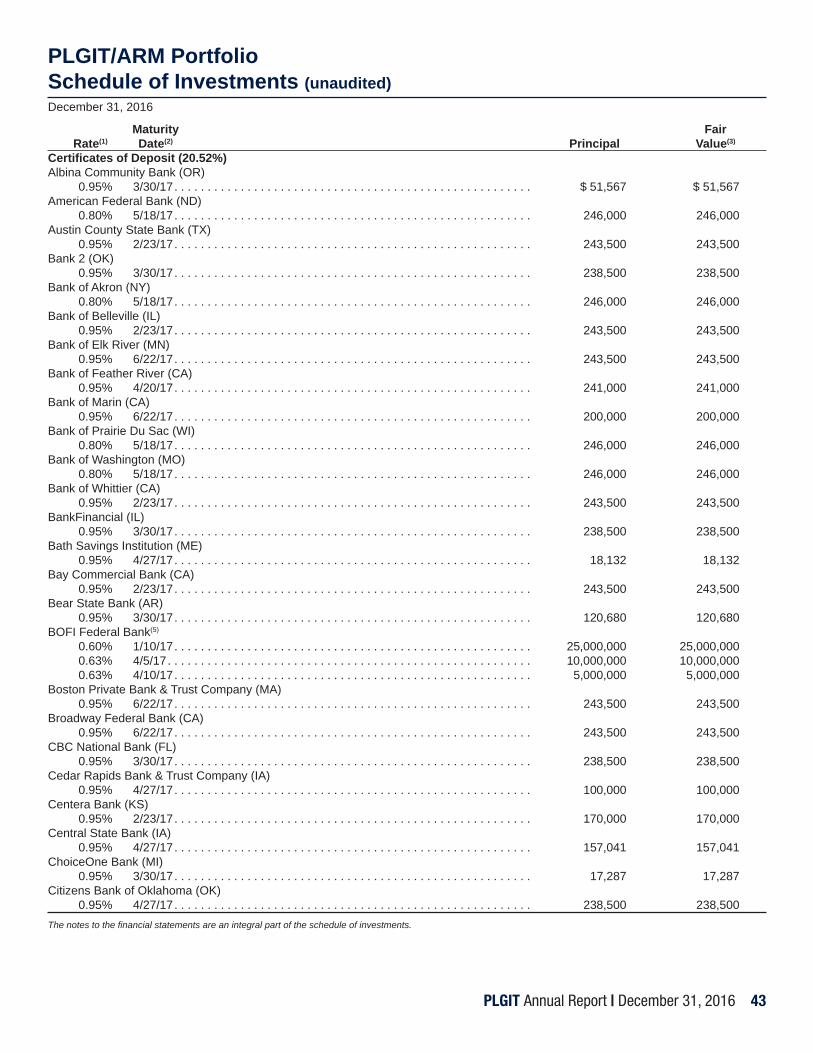
PLGIT Annual Report | December 31, 2016 43
PLGIT/ARM PortfolioSchedule of Investments (unaudited)December 31, 2016
Maturity Fair Rate(1) Date(2) Principal Value(3)
Certifi cates of Deposit (20.52%)Albina Community Bank (OR) 0.95% 3/30/17 . . . . . . . . . . . . . . . . . . . . . . . . . . . . . . . . . . . . . . . . . . . . . . . . . . . . . . $ 51,567 $ 51,567 American Federal Bank (ND) 0.80% 5/18/17 . . . . . . . . . . . . . . . . . . . . . . . . . . . . . . . . . . . . . . . . . . . . . . . . . . . . . . 246,000 246,000Austin County State Bank (TX) 0.95% 2/23/17 . . . . . . . . . . . . . . . . . . . . . . . . . . . . . . . . . . . . . . . . . . . . . . . . . . . . . . 243,500 243,500 Bank 2 (OK) 0.95% 3/30/17 . . . . . . . . . . . . . . . . . . . . . . . . . . . . . . . . . . . . . . . . . . . . . . . . . . . . . . 238,500 238,500 Bank of Akron (NY) 0.80% 5/18/17 . . . . . . . . . . . . . . . . . . . . . . . . . . . . . . . . . . . . . . . . . . . . . . . . . . . . . . 246,000 246,000 Bank of Belleville (IL) 0.95% 2/23/17 . . . . . . . . . . . . . . . . . . . . . . . . . . . . . . . . . . . . . . . . . . . . . . . . . . . . . . 243,500 243,500 Bank of Elk River (MN) 0.95% 6/22/17 . . . . . . . . . . . . . . . . . . . . . . . . . . . . . . . . . . . . . . . . . . . . . . . . . . . . . . 243,500 243,500Bank of Feather River (CA) 0.95% 4/20/17 . . . . . . . . . . . . . . . . . . . . . . . . . . . . . . . . . . . . . . . . . . . . . . . . . . . . . . 241,000 241,000 Bank of Marin (CA) 0.95% 6/22/17 . . . . . . . . . . . . . . . . . . . . . . . . . . . . . . . . . . . . . . . . . . . . . . . . . . . . . . 200,000 200,000 Bank of Prairie Du Sac (WI) 0.80% 5/18/17 . . . . . . . . . . . . . . . . . . . . . . . . . . . . . . . . . . . . . . . . . . . . . . . . . . . . . . 246,000 246,000 Bank of Washington (MO) 0.80% 5/18/17 . . . . . . . . . . . . . . . . . . . . . . . . . . . . . . . . . . . . . . . . . . . . . . . . . . . . . . 246,000 246,000 Bank of Whittier (CA) 0.95% 2/23/17 . . . . . . . . . . . . . . . . . . . . . . . . . . . . . . . . . . . . . . . . . . . . . . . . . . . . . . 243,500 243,500 BankFinancial (IL) 0.95% 3/30/17 . . . . . . . . . . . . . . . . . . . . . . . . . . . . . . . . . . . . . . . . . . . . . . . . . . . . . . 238,500 238,500 Bath Savings Institution (ME) 0.95% 4/27/17 . . . . . . . . . . . . . . . . . . . . . . . . . . . . . . . . . . . . . . . . . . . . . . . . . . . . . . 18,132 18,132 Bay Commercial Bank (CA) 0.95% 2/23/17 . . . . . . . . . . . . . . . . . . . . . . . . . . . . . . . . . . . . . . . . . . . . . . . . . . . . . . 243,500 243,500 Bear State Bank (AR) 0.95% 3/30/17 . . . . . . . . . . . . . . . . . . . . . . . . . . . . . . . . . . . . . . . . . . . . . . . . . . . . . . 120,680 120,680 BOFI Federal Bank(5)
0.60% 1/10/17 . . . . . . . . . . . . . . . . . . . . . . . . . . . . . . . . . . . . . . . . . . . . . . . . . . . . . . 25,000,000 25,000,000 0.63% 4/5/17 . . . . . . . . . . . . . . . . . . . . . . . . . . . . . . . . . . . . . . . . . . . . . . . . . . . . . . . 10,000,000 10,000,000 0.63% 4/10/17 . . . . . . . . . . . . . . . . . . . . . . . . . . . . . . . . . . . . . . . . . . . . . . . . . . . . . . 5,000,000 5,000,000Boston Private Bank & Trust Company (MA) 0.95% 6/22/17 . . . . . . . . . . . . . . . . . . . . . . . . . . . . . . . . . . . . . . . . . . . . . . . . . . . . . . 243,500 243,500 Broadway Federal Bank (CA) 0.95% 6/22/17 . . . . . . . . . . . . . . . . . . . . . . . . . . . . . . . . . . . . . . . . . . . . . . . . . . . . . . 243,500 243,500 CBC National Bank (FL) 0.95% 3/30/17 . . . . . . . . . . . . . . . . . . . . . . . . . . . . . . . . . . . . . . . . . . . . . . . . . . . . . . 238,500 238,500 Cedar Rapids Bank & Trust Company (IA) 0.95% 4/27/17 . . . . . . . . . . . . . . . . . . . . . . . . . . . . . . . . . . . . . . . . . . . . . . . . . . . . . . 100,000 100,000 Centera Bank (KS) 0.95% 2/23/17 . . . . . . . . . . . . . . . . . . . . . . . . . . . . . . . . . . . . . . . . . . . . . . . . . . . . . . 170,000 170,000 Central State Bank (IA) 0.95% 4/27/17 . . . . . . . . . . . . . . . . . . . . . . . . . . . . . . . . . . . . . . . . . . . . . . . . . . . . . . 157,041 157,041ChoiceOne Bank (MI) 0.95% 3/30/17 . . . . . . . . . . . . . . . . . . . . . . . . . . . . . . . . . . . . . . . . . . . . . . . . . . . . . . 17,287 17,287Citizens Bank of Oklahoma (OK) 0.95% 4/27/17 . . . . . . . . . . . . . . . . . . . . . . . . . . . . . . . . . . . . . . . . . . . . . . . . . . . . . . 238,500 238,500The notes to the fi nancial statements are an integral part of the schedule of investments.
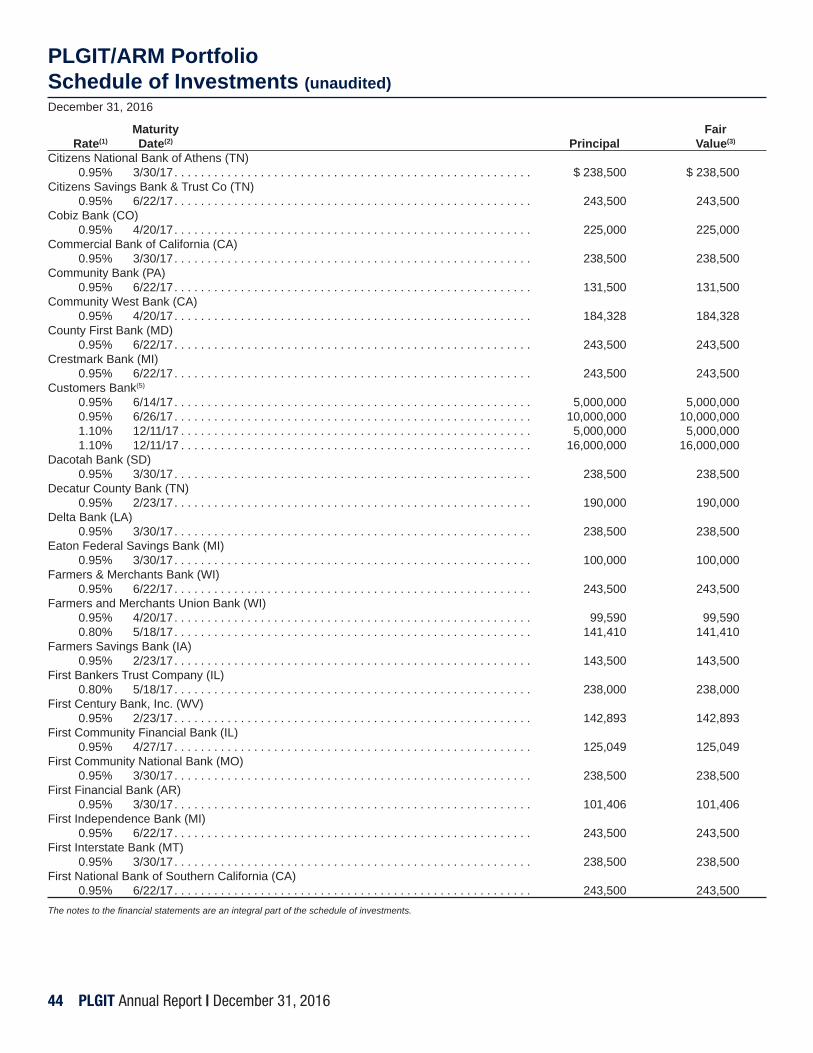
44 PLGIT Annual Report | December 31, 2016
PLGIT/ARM PortfolioSchedule of Investments (unaudited)December 31, 2016
Maturity Fair Rate(1) Date(2) Principal Value(3)
Citizens National Bank of Athens (TN) 0.95% 3/30/17 . . . . . . . . . . . . . . . . . . . . . . . . . . . . . . . . . . . . . . . . . . . . . . . . . . . . . . $ 238,500 $ 238,500Citizens Savings Bank & Trust Co (TN) 0.95% 6/22/17 . . . . . . . . . . . . . . . . . . . . . . . . . . . . . . . . . . . . . . . . . . . . . . . . . . . . . . 243,500 243,500Cobiz Bank (CO) 0.95% 4/20/17 . . . . . . . . . . . . . . . . . . . . . . . . . . . . . . . . . . . . . . . . . . . . . . . . . . . . . . 225,000 225,000Commercial Bank of California (CA) 0.95% 3/30/17 . . . . . . . . . . . . . . . . . . . . . . . . . . . . . . . . . . . . . . . . . . . . . . . . . . . . . . 238,500 238,500Community Bank (PA) 0.95% 6/22/17 . . . . . . . . . . . . . . . . . . . . . . . . . . . . . . . . . . . . . . . . . . . . . . . . . . . . . . 131,500 131,500 Community West Bank (CA) 0.95% 4/20/17 . . . . . . . . . . . . . . . . . . . . . . . . . . . . . . . . . . . . . . . . . . . . . . . . . . . . . . 184,328 184,328 County First Bank (MD) 0.95% 6/22/17 . . . . . . . . . . . . . . . . . . . . . . . . . . . . . . . . . . . . . . . . . . . . . . . . . . . . . . 243,500 243,500 Crestmark Bank (MI) 0.95% 6/22/17 . . . . . . . . . . . . . . . . . . . . . . . . . . . . . . . . . . . . . . . . . . . . . . . . . . . . . . 243,500 243,500 Customers Bank(5)
0.95% 6/14/17 . . . . . . . . . . . . . . . . . . . . . . . . . . . . . . . . . . . . . . . . . . . . . . . . . . . . . . 5,000,000 5,000,000 0.95% 6/26/17 . . . . . . . . . . . . . . . . . . . . . . . . . . . . . . . . . . . . . . . . . . . . . . . . . . . . . . 10,000,000 10,000,000 1.10% 12/11/17 . . . . . . . . . . . . . . . . . . . . . . . . . . . . . . . . . . . . . . . . . . . . . . . . . . . . . 5,000,000 5,000,000 1.10% 12/11/17 . . . . . . . . . . . . . . . . . . . . . . . . . . . . . . . . . . . . . . . . . . . . . . . . . . . . . 16,000,000 16,000,000Dacotah Bank (SD) 0.95% 3/30/17 . . . . . . . . . . . . . . . . . . . . . . . . . . . . . . . . . . . . . . . . . . . . . . . . . . . . . . 238,500 238,500 Decatur County Bank (TN) 0.95% 2/23/17 . . . . . . . . . . . . . . . . . . . . . . . . . . . . . . . . . . . . . . . . . . . . . . . . . . . . . . 190,000 190,000 Delta Bank (LA) 0.95% 3/30/17 . . . . . . . . . . . . . . . . . . . . . . . . . . . . . . . . . . . . . . . . . . . . . . . . . . . . . . 238,500 238,500 Eaton Federal Savings Bank (MI) 0.95% 3/30/17 . . . . . . . . . . . . . . . . . . . . . . . . . . . . . . . . . . . . . . . . . . . . . . . . . . . . . . 100,000 100,000 Farmers & Merchants Bank (WI) 0.95% 6/22/17 . . . . . . . . . . . . . . . . . . . . . . . . . . . . . . . . . . . . . . . . . . . . . . . . . . . . . . 243,500 243,500 Farmers and Merchants Union Bank (WI) 0.95% 4/20/17 . . . . . . . . . . . . . . . . . . . . . . . . . . . . . . . . . . . . . . . . . . . . . . . . . . . . . . 99,590 99,590 0.80% 5/18/17 . . . . . . . . . . . . . . . . . . . . . . . . . . . . . . . . . . . . . . . . . . . . . . . . . . . . . . 141,410 141,410 Farmers Savings Bank (IA) 0.95% 2/23/17 . . . . . . . . . . . . . . . . . . . . . . . . . . . . . . . . . . . . . . . . . . . . . . . . . . . . . . 143,500 143,500First Bankers Trust Company (IL) 0.80% 5/18/17 . . . . . . . . . . . . . . . . . . . . . . . . . . . . . . . . . . . . . . . . . . . . . . . . . . . . . . 238,000 238,000 First Century Bank, Inc. (WV) 0.95% 2/23/17 . . . . . . . . . . . . . . . . . . . . . . . . . . . . . . . . . . . . . . . . . . . . . . . . . . . . . . 142,893 142,893First Community Financial Bank (IL) 0.95% 4/27/17 . . . . . . . . . . . . . . . . . . . . . . . . . . . . . . . . . . . . . . . . . . . . . . . . . . . . . . 125,049 125,049First Community National Bank (MO) 0.95% 3/30/17 . . . . . . . . . . . . . . . . . . . . . . . . . . . . . . . . . . . . . . . . . . . . . . . . . . . . . . 238,500 238,500First Financial Bank (AR) 0.95% 3/30/17 . . . . . . . . . . . . . . . . . . . . . . . . . . . . . . . . . . . . . . . . . . . . . . . . . . . . . . 101,406 101,406First Independence Bank (MI) 0.95% 6/22/17 . . . . . . . . . . . . . . . . . . . . . . . . . . . . . . . . . . . . . . . . . . . . . . . . . . . . . . 243,500 243,500First Interstate Bank (MT) 0.95% 3/30/17 . . . . . . . . . . . . . . . . . . . . . . . . . . . . . . . . . . . . . . . . . . . . . . . . . . . . . . 238,500 238,500First National Bank of Southern California (CA) 0.95% 6/22/17 . . . . . . . . . . . . . . . . . . . . . . . . . . . . . . . . . . . . . . . . . . . . . . . . . . . . . . 243,500 243,500The notes to the fi nancial statements are an integral part of the schedule of investments.

PLGIT Annual Report | December 31, 2016 45
PLGIT/ARM PortfolioSchedule of Investments (unaudited)December 31, 2016
Maturity Fair Rate(1) Date(2) Principal Value(3)
First National Bank & Trust Company of Rochelle (IL) 0.95% 3/30/17 . . . . . . . . . . . . . . . . . . . . . . . . . . . . . . . . . . . . . . . . . . . . . . . . . . . . . . $ 82,713 $ 82,713 First Oklahoma Bank (OK) 0.95% 2/23/17 . . . . . . . . . . . . . . . . . . . . . . . . . . . . . . . . . . . . . . . . . . . . . . . . . . . . . . 243,500 243,500 First State Bank & Trust Company of Larned (KS) 0.80% 5/18/17 . . . . . . . . . . . . . . . . . . . . . . . . . . . . . . . . . . . . . . . . . . . . . . . . . . . . . . 246,000 246,000 First Tennessee Bank (TN) 0.80% 5/18/17 . . . . . . . . . . . . . . . . . . . . . . . . . . . . . . . . . . . . . . . . . . . . . . . . . . . . . . 246,000 246,000 First United Bank (ND) 0.95% 2/23/17 . . . . . . . . . . . . . . . . . . . . . . . . . . . . . . . . . . . . . . . . . . . . . . . . . . . . . . 50,075 50,075 Flatirons Bank (CO) 0.95% 3/30/17 . . . . . . . . . . . . . . . . . . . . . . . . . . . . . . . . . . . . . . . . . . . . . . . . . . . . . . 84,352 84,352FNB of Central Alabama (AL) 0.95% 2/23/17 . . . . . . . . . . . . . . . . . . . . . . . . . . . . . . . . . . . . . . . . . . . . . . . . . . . . . . 243,500 243,500 Fremont Bank (CA) 0.95% 2/23/17 . . . . . . . . . . . . . . . . . . . . . . . . . . . . . . . . . . . . . . . . . . . . . . . . . . . . . . 100,000 100,000 Georgia Banking Company (GA) 0.95% 6/22/17 . . . . . . . . . . . . . . . . . . . . . . . . . . . . . . . . . . . . . . . . . . . . . . . . . . . . . . 243,500 243,500 Grand Bank (OK) 0.95% 4/20/17 . . . . . . . . . . . . . . . . . . . . . . . . . . . . . . . . . . . . . . . . . . . . . . . . . . . . . . 241,000 241,000 Great Plains State Bank (NE) 0.95% 2/23/17 . . . . . . . . . . . . . . . . . . . . . . . . . . . . . . . . . . . . . . . . . . . . . . . . . . . . . . 243,500 243,500 Guaranty Bank (MO) 0.95% 4/20/17 . . . . . . . . . . . . . . . . . . . . . . . . . . . . . . . . . . . . . . . . . . . . . . . . . . . . . . 183,536 183,536 Gulf Coast Bank and Trust Company (LA) 0.95% 4/20/17 . . . . . . . . . . . . . . . . . . . . . . . . . . . . . . . . . . . . . . . . . . . . . . . . . . . . . . 241,000 241,000Heritage Bank of Nevada (NV) 0.95% 6/22/17 . . . . . . . . . . . . . . . . . . . . . . . . . . . . . . . . . . . . . . . . . . . . . . . . . . . . . . 243,500 243,500 HNB National Bank (MO) 0.80% 5/18/17 . . . . . . . . . . . . . . . . . . . . . . . . . . . . . . . . . . . . . . . . . . . . . . . . . . . . . . 246,000 246,000Independent Bank (MI) 0.95% 3/30/17 . . . . . . . . . . . . . . . . . . . . . . . . . . . . . . . . . . . . . . . . . . . . . . . . . . . . . . 238,500 238,500John Marshall Bank (VA) 0.95% 3/30/17 . . . . . . . . . . . . . . . . . . . . . . . . . . . . . . . . . . . . . . . . . . . . . . . . . . . . . . 238,500 238,500Labette Bank (KS) 0.80% 5/18/17 . . . . . . . . . . . . . . . . . . . . . . . . . . . . . . . . . . . . . . . . . . . . . . . . . . . . . . 69,943 69,943Landmark Community Bank (TN) 0.80% 5/18/17 . . . . . . . . . . . . . . . . . . . . . . . . . . . . . . . . . . . . . . . . . . . . . . . . . . . . . . 17,884 17,884Lapeer County Bank & Trust Co. (MI) 0.80% 5/18/17 . . . . . . . . . . . . . . . . . . . . . . . . . . . . . . . . . . . . . . . . . . . . . . . . . . . . . . 43,500 43,500Lusk State Bank (WY) 0.95% 6/22/17 . . . . . . . . . . . . . . . . . . . . . . . . . . . . . . . . . . . . . . . . . . . . . . . . . . . . . . 161,772 161,772MainStreet Bank (VA) 0.95% 2/23/17 . . . . . . . . . . . . . . . . . . . . . . . . . . . . . . . . . . . . . . . . . . . . . . . . . . . . . . 243,500 243,500Meridian Bank (PA) 0.95% 2/23/17 . . . . . . . . . . . . . . . . . . . . . . . . . . . . . . . . . . . . . . . . . . . . . . . . . . . . . . 243,500 243,500Merrimack County Savings Bank (NH) 0.80% 5/18/17 . . . . . . . . . . . . . . . . . . . . . . . . . . . . . . . . . . . . . . . . . . . . . . . . . . . . . . 246,000 246,000 Metropolitan Capital Bank & Trust (IL) 0.95% 4/20/17 . . . . . . . . . . . . . . . . . . . . . . . . . . . . . . . . . . . . . . . . . . . . . . . . . . . . . . 81,987 81,987 The notes to the fi nancial statements are an integral part of the schedule of investments.

46 PLGIT Annual Report | December 31, 2016
PLGIT/ARM PortfolioSchedule of Investments (unaudited)December 31, 2016
Maturity Fair Rate(1) Date(2) Principal Value(3)
Nebraska State Bank and Trust Co. (NE) 0.95% 4/20/17 . . . . . . . . . . . . . . . . . . . . . . . . . . . . . . . . . . . . . . . . . . . . . . . . . . . . . . $ 39,820 $ 39,820 0.95% 4/27/17 . . . . . . . . . . . . . . . . . . . . . . . . . . . . . . . . . . . . . . . . . . . . . . . . . . . . . . 198,680 198,680New Peoples Bank, Inc. (VA) 0.95% 2/23/17 . . . . . . . . . . . . . . . . . . . . . . . . . . . . . . . . . . . . . . . . . . . . . . . . . . . . . . 243,500 243,500 Northwest Bank (PA) 0.95% 4/20/17 . . . . . . . . . . . . . . . . . . . . . . . . . . . . . . . . . . . . . . . . . . . . . . . . . . . . . . 241,000 241,000 Oxford University Bank (MS) 0.95% 3/30/17 . . . . . . . . . . . . . . . . . . . . . . . . . . . . . . . . . . . . . . . . . . . . . . . . . . . . . . 238,500 238,500Pacifi c Western Bank (CA) 0.80% 5/18/17 . . . . . . . . . . . . . . . . . . . . . . . . . . . . . . . . . . . . . . . . . . . . . . . . . . . . . . 83,000 83,000Paragon Commercial Bank (NC) 0.95% 2/23/17 . . . . . . . . . . . . . . . . . . . . . . . . . . . . . . . . . . . . . . . . . . . . . . . . . . . . . . 78,207 78,207 Pentagon Federal Credit Union(5)
0.90% 1/10/17 . . . . . . . . . . . . . . . . . . . . . . . . . . . . . . . . . . . . . . . . . . . . . . . . . . . . . . 10,000,000 10,000,000 0.60% 1/24/17 . . . . . . . . . . . . . . . . . . . . . . . . . . . . . . . . . . . . . . . . . . . . . . . . . . . . . . 5,000,000 5,000,000 0.80% 9/15/17 . . . . . . . . . . . . . . . . . . . . . . . . . . . . . . . . . . . . . . . . . . . . . . . . . . . . . . 10,000,000 10,000,000 0.85% 10/11/17 . . . . . . . . . . . . . . . . . . . . . . . . . . . . . . . . . . . . . . . . . . . . . . . . . . . . . 5,000,000 5,000,000Peoples Bank (NC) 0.95% 3/30/17 . . . . . . . . . . . . . . . . . . . . . . . . . . . . . . . . . . . . . . . . . . . . . . . . . . . . . . 19,495 19,495 0.80% 5/18/17 . . . . . . . . . . . . . . . . . . . . . . . . . . . . . . . . . . . . . . . . . . . . . . . . . . . . . . 97,802 97,802Plaza Bank (CA) 0.95% 6/22/17 . . . . . . . . . . . . . . . . . . . . . . . . . . . . . . . . . . . . . . . . . . . . . . . . . . . . . . 45,574 45,574Premier Community Bank (OR) 0.95% 2/23/17 . . . . . . . . . . . . . . . . . . . . . . . . . . . . . . . . . . . . . . . . . . . . . . . . . . . . . . 243,500 243,500Premier Community Bank (WI) 0.80% 5/18/17 . . . . . . . . . . . . . . . . . . . . . . . . . . . . . . . . . . . . . . . . . . . . . . . . . . . . . . 9,661 9,661Progress Bank and Trust (AL) 0.95% 3/30/17 . . . . . . . . . . . . . . . . . . . . . . . . . . . . . . . . . . . . . . . . . . . . . . . . . . . . . . 238,500 238,500Progressive Bank (LA) 0.95% 2/23/17 . . . . . . . . . . . . . . . . . . . . . . . . . . . . . . . . . . . . . . . . . . . . . . . . . . . . . . 220,445 220,445Redding Bank of Commerce (CA) 0.95% 6/22/17 . . . . . . . . . . . . . . . . . . . . . . . . . . . . . . . . . . . . . . . . . . . . . . . . . . . . . . 243,500 243,500Rockford Bank and Trust Company (IL) 0.80% 5/18/17 . . . . . . . . . . . . . . . . . . . . . . . . . . . . . . . . . . . . . . . . . . . . . . . . . . . . . . 200,000 200,000Select Bank & Trust Co. (NC) 0.95% 6/22/17 . . . . . . . . . . . . . . . . . . . . . . . . . . . . . . . . . . . . . . . . . . . . . . . . . . . . . . 243,500 243,500Southeast Bank (TN) 0.80% 5/18/17 . . . . . . . . . . . . . . . . . . . . . . . . . . . . . . . . . . . . . . . . . . . . . . . . . . . . . . 246,000 246,000SpiritBank (OK) 0.95% 6/22/17 . . . . . . . . . . . . . . . . . . . . . . . . . . . . . . . . . . . . . . . . . . . . . . . . . . . . . . 156,943 156,943 Start Community Bank (CT) 0.95% 3/30/17 . . . . . . . . . . . . . . . . . . . . . . . . . . . . . . . . . . . . . . . . . . . . . . . . . . . . . . 11,500 11,500Stockmans Bank (OK) 0.95% 3/30/17 . . . . . . . . . . . . . . . . . . . . . . . . . . . . . . . . . . . . . . . . . . . . . . . . . . . . . . 61,500 61,500 Summit State Bank (CA) 0.95% 2/23/17 . . . . . . . . . . . . . . . . . . . . . . . . . . . . . . . . . . . . . . . . . . . . . . . . . . . . . . 243,500 243,500 Sunshine Bank (FL) 0.95% 6/22/17 . . . . . . . . . . . . . . . . . . . . . . . . . . . . . . . . . . . . . . . . . . . . . . . . . . . . . . 91,391 91,391 Sunwest Bank (CA) 0.95% 2/23/17 . . . . . . . . . . . . . . . . . . . . . . . . . . . . . . . . . . . . . . . . . . . . . . . . . . . . . . 32,322 32,322 Surrey Bank & Trust (NC) 0.80% 5/18/17 . . . . . . . . . . . . . . . . . . . . . . . . . . . . . . . . . . . . . . . . . . . . . . . . . . . . . . 183,392 183,392The notes to the fi nancial statements are an integral part of the schedule of investments.

PLGIT Annual Report | December 31, 2016 47
PLGIT/ARM PortfolioSchedule of Investments (unaudited)December 31, 2016
Maturity Fair Rate(1) Date(2) Principal Value(3)
The Bank of Tioga (ND) 0.95% 4/27/17 . . . . . . . . . . . . . . . . . . . . . . . . . . . . . . . . . . . . . . . . . . . . . . . . . . . . . . $ 238,500 $ 238,500The Camden National Bank (ME) 0.80% 5/18/17 . . . . . . . . . . . . . . . . . . . . . . . . . . . . . . . . . . . . . . . . . . . . . . . . . . . . . . 200,599 200,599 The Citizens Bank of Clovis (NM) 0.95% 4/20/17 . . . . . . . . . . . . . . . . . . . . . . . . . . . . . . . . . . . . . . . . . . . . . . . . . . . . . . 21,000 21,000 The Citizens Banking Company (OH) 0.95% 2/23/17 . . . . . . . . . . . . . . . . . . . . . . . . . . . . . . . . . . . . . . . . . . . . . . . . . . . . . . 243,500 243,500 The Eastern Colorado Bank (CO) 0.95% 6/22/17 . . . . . . . . . . . . . . . . . . . . . . . . . . . . . . . . . . . . . . . . . . . . . . . . . . . . . . 96,196 96,196 The Farmers & Merchants Bank (AR) 0.95% 6/22/17 . . . . . . . . . . . . . . . . . . . . . . . . . . . . . . . . . . . . . . . . . . . . . . . . . . . . . . 207,624 207,624The Talbot Bank of Easton (MD) 0.95% 2/23/17 . . . . . . . . . . . . . . . . . . . . . . . . . . . . . . . . . . . . . . . . . . . . . . . . . . . . . . 100,000 100,000Timberland Bank (WA) 0.95% 6/22/17 . . . . . . . . . . . . . . . . . . . . . . . . . . . . . . . . . . . . . . . . . . . . . . . . . . . . . . 243,500 243,500Traditional Bank, Inc. (KY) 0.95% 3/30/17 . . . . . . . . . . . . . . . . . . . . . . . . . . . . . . . . . . . . . . . . . . . . . . . . . . . . . . 238,500 238,500Treynor State Bank (IA) 0.95% 3/30/17 . . . . . . . . . . . . . . . . . . . . . . . . . . . . . . . . . . . . . . . . . . . . . . . . . . . . . . 10,500 10,500Tri Counties Bank (CA) 0.80% 5/18/17 . . . . . . . . . . . . . . . . . . . . . . . . . . . . . . . . . . . . . . . . . . . . . . . . . . . . . . 246,000 246,000Union Bank & Trust Company (NC) 0.80% 5/18/17 . . . . . . . . . . . . . . . . . . . . . . . . . . . . . . . . . . . . . . . . . . . . . . . . . . . . . . 246,000 246,000Union State Bank (TX) 0.95% 2/23/17 . . . . . . . . . . . . . . . . . . . . . . . . . . . . . . . . . . . . . . . . . . . . . . . . . . . . . . 243,500 243,500United Bank (VA) 0.95% 4/27/17 . . . . . . . . . . . . . . . . . . . . . . . . . . . . . . . . . . . . . . . . . . . . . . . . . . . . . . 7,690 7,690United Bank (WV) 0.95% 2/23/17 . . . . . . . . . . . . . . . . . . . . . . . . . . . . . . . . . . . . . . . . . . . . . . . . . . . . . . 179,169 179,169 United Community Bank (MN) 0.95% 4/27/17 . . . . . . . . . . . . . . . . . . . . . . . . . . . . . . . . . . . . . . . . . . . . . . . . . . . . . . 238,500 238,500Unity Bank (MN) 0.80% 5/18/17 . . . . . . . . . . . . . . . . . . . . . . . . . . . . . . . . . . . . . . . . . . . . . . . . . . . . . . 170,809 170,809 Univest Bank and Trust Co. (PA) 0.95% 4/27/17 . . . . . . . . . . . . . . . . . . . . . . . . . . . . . . . . . . . . . . . . . . . . . . . . . . . . . . 238,500 238,500 Urban Partnership Bank (IL) 0.95% 4/27/17 . . . . . . . . . . . . . . . . . . . . . . . . . . . . . . . . . . . . . . . . . . . . . . . . . . . . . . 238,500 238,500 Valley National Bank (OK) 0.80% 5/18/17 . . . . . . . . . . . . . . . . . . . . . . . . . . . . . . . . . . . . . . . . . . . . . . . . . . . . . . 238,000 238,000 Viewpoint Bank (TX) 0.95% 2/23/17 . . . . . . . . . . . . . . . . . . . . . . . . . . . . . . . . . . . . . . . . . . . . . . . . . . . . . . 184,390 184,390WashingtonFirst Bank (VA) 0.95% 4/27/17 . . . . . . . . . . . . . . . . . . . . . . . . . . . . . . . . . . . . . . . . . . . . . . . . . . . . . . 200,907 200,907Wolverine Bank Federal Savings Bank (MI) 0.80% 5/18/17 . . . . . . . . . . . . . . . . . . . . . . . . . . . . . . . . . . . . . . . . . . . . . . . . . . . . . . 100,000 100,000 Worthington National Bank (TX) 0.95% 4/20/17 . . . . . . . . . . . . . . . . . . . . . . . . . . . . . . . . . . . . . . . . . . . . . . . . . . . . . . 200,739 200,739 Total Certifi cates of Deposit . . . . . . . . . . . . . . . . . . . . . . . . . . . . . . . . . . . . . . . . . . . . . . . . . . . . . . . . . . . . . . . . . 128,000,000The notes to the fi nancial statements are an integral part of the schedule of investments.
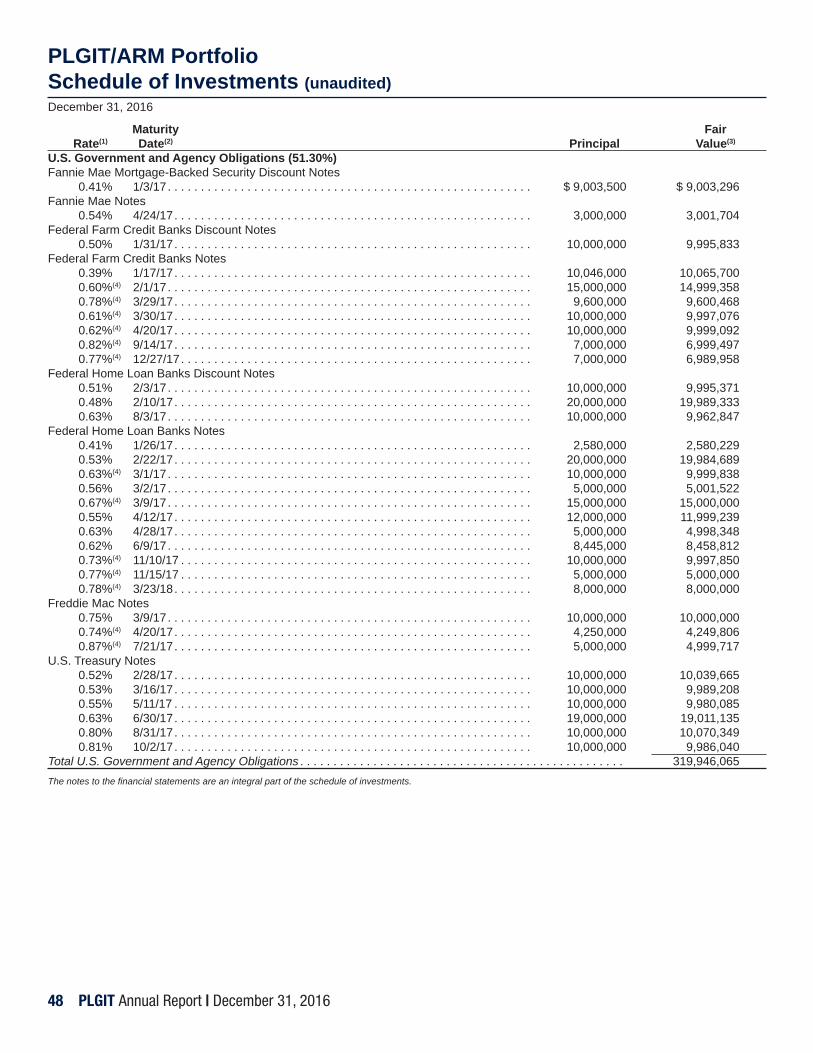
48 PLGIT Annual Report | December 31, 2016
PLGIT/ARM PortfolioSchedule of Investments (unaudited)December 31, 2016
Maturity Fair Rate(1) Date(2) Principal Value(3)
U.S. Government and Agency Obligations (51.30%)Fannie Mae Mortgage-Backed Security Discount Notes 0.41% 1/3/17 . . . . . . . . . . . . . . . . . . . . . . . . . . . . . . . . . . . . . . . . . . . . . . . . . . . . . . . $ 9,003,500 $ 9,003,296Fannie Mae Notes 0.54% 4/24/17 . . . . . . . . . . . . . . . . . . . . . . . . . . . . . . . . . . . . . . . . . . . . . . . . . . . . . . 3,000,000 3,001,704Federal Farm Credit Banks Discount Notes 0.50% 1/31/17 . . . . . . . . . . . . . . . . . . . . . . . . . . . . . . . . . . . . . . . . . . . . . . . . . . . . . . 10,000,000 9,995,833 Federal Farm Credit Banks Notes 0.39% 1/17/17 . . . . . . . . . . . . . . . . . . . . . . . . . . . . . . . . . . . . . . . . . . . . . . . . . . . . . . 10,046,000 10,065,700 0.60%(4) 2/1/17 . . . . . . . . . . . . . . . . . . . . . . . . . . . . . . . . . . . . . . . . . . . . . . . . . . . . . . . 15,000,000 14,999,358 0.78%(4) 3/29/17 . . . . . . . . . . . . . . . . . . . . . . . . . . . . . . . . . . . . . . . . . . . . . . . . . . . . . . 9,600,000 9,600,468 0.61%(4) 3/30/17 . . . . . . . . . . . . . . . . . . . . . . . . . . . . . . . . . . . . . . . . . . . . . . . . . . . . . . 10,000,000 9,997,076 0.62%(4) 4/20/17 . . . . . . . . . . . . . . . . . . . . . . . . . . . . . . . . . . . . . . . . . . . . . . . . . . . . . . 10,000,000 9,999,092 0.82%(4) 9/14/17 . . . . . . . . . . . . . . . . . . . . . . . . . . . . . . . . . . . . . . . . . . . . . . . . . . . . . . 7,000,000 6,999,497 0.77%(4) 12/27/17 . . . . . . . . . . . . . . . . . . . . . . . . . . . . . . . . . . . . . . . . . . . . . . . . . . . . . 7,000,000 6,989,958 Federal Home Loan Banks Discount Notes 0.51% 2/3/17 . . . . . . . . . . . . . . . . . . . . . . . . . . . . . . . . . . . . . . . . . . . . . . . . . . . . . . . 10,000,000 9,995,371 0.48% 2/10/17 . . . . . . . . . . . . . . . . . . . . . . . . . . . . . . . . . . . . . . . . . . . . . . . . . . . . . . 20,000,000 19,989,333 0.63% 8/3/17 . . . . . . . . . . . . . . . . . . . . . . . . . . . . . . . . . . . . . . . . . . . . . . . . . . . . . . . 10,000,000 9,962,847 Federal Home Loan Banks Notes 0.41% 1/26/17 . . . . . . . . . . . . . . . . . . . . . . . . . . . . . . . . . . . . . . . . . . . . . . . . . . . . . . 2,580,000 2,580,229 0.53% 2/22/17 . . . . . . . . . . . . . . . . . . . . . . . . . . . . . . . . . . . . . . . . . . . . . . . . . . . . . . 20,000,000 19,984,689 0.63%(4) 3/1/17 . . . . . . . . . . . . . . . . . . . . . . . . . . . . . . . . . . . . . . . . . . . . . . . . . . . . . . . 10,000,000 9,999,838 0.56% 3/2/17 . . . . . . . . . . . . . . . . . . . . . . . . . . . . . . . . . . . . . . . . . . . . . . . . . . . . . . . 5,000,000 5,001,522 0.67%(4) 3/9/17 . . . . . . . . . . . . . . . . . . . . . . . . . . . . . . . . . . . . . . . . . . . . . . . . . . . . . . . 15,000,000 15,000,000 0.55% 4/12/17 . . . . . . . . . . . . . . . . . . . . . . . . . . . . . . . . . . . . . . . . . . . . . . . . . . . . . . 12,000,000 11,999,239 0.63% 4/28/17 . . . . . . . . . . . . . . . . . . . . . . . . . . . . . . . . . . . . . . . . . . . . . . . . . . . . . . 5,000,000 4,998,348 0.62% 6/9/17 . . . . . . . . . . . . . . . . . . . . . . . . . . . . . . . . . . . . . . . . . . . . . . . . . . . . . . . 8,445,000 8,458,812 0.73%(4) 11/10/17 . . . . . . . . . . . . . . . . . . . . . . . . . . . . . . . . . . . . . . . . . . . . . . . . . . . . . 10,000,000 9,997,850 0.77%(4) 11/15/17 . . . . . . . . . . . . . . . . . . . . . . . . . . . . . . . . . . . . . . . . . . . . . . . . . . . . . 5,000,000 5,000,000 0.78%(4) 3/23/18 . . . . . . . . . . . . . . . . . . . . . . . . . . . . . . . . . . . . . . . . . . . . . . . . . . . . . . 8,000,000 8,000,000 Freddie Mac Notes 0.75% 3/9/17 . . . . . . . . . . . . . . . . . . . . . . . . . . . . . . . . . . . . . . . . . . . . . . . . . . . . . . . 10,000,000 10,000,000 0.74%(4) 4/20/17 . . . . . . . . . . . . . . . . . . . . . . . . . . . . . . . . . . . . . . . . . . . . . . . . . . . . . . 4,250,000 4,249,806 0.87%(4) 7/21/17 . . . . . . . . . . . . . . . . . . . . . . . . . . . . . . . . . . . . . . . . . . . . . . . . . . . . . . 5,000,000 4,999,717U.S. Treasury Notes 0.52% 2/28/17 . . . . . . . . . . . . . . . . . . . . . . . . . . . . . . . . . . . . . . . . . . . . . . . . . . . . . . 10,000,000 10,039,665 0.53% 3/16/17 . . . . . . . . . . . . . . . . . . . . . . . . . . . . . . . . . . . . . . . . . . . . . . . . . . . . . . 10,000,000 9,989,208 0.55% 5/11/17 . . . . . . . . . . . . . . . . . . . . . . . . . . . . . . . . . . . . . . . . . . . . . . . . . . . . . . 10,000,000 9,980,085 0.63% 6/30/17 . . . . . . . . . . . . . . . . . . . . . . . . . . . . . . . . . . . . . . . . . . . . . . . . . . . . . . 19,000,000 19,011,135 0.80% 8/31/17 . . . . . . . . . . . . . . . . . . . . . . . . . . . . . . . . . . . . . . . . . . . . . . . . . . . . . . 10,000,000 10,070,349 0.81% 10/2/17 . . . . . . . . . . . . . . . . . . . . . . . . . . . . . . . . . . . . . . . . . . . . . . . . . . . . . . 10,000,000 9,986,040Total U.S. Government and Agency Obligations . . . . . . . . . . . . . . . . . . . . . . . . . . . . . . . . . . . . . . . . . . . . . . . . . 319,946,065The notes to the fi nancial statements are an integral part of the schedule of investments.

PLGIT Annual Report | December 31, 2016 49
PLGIT/ARM PortfolioSchedule of Investments (unaudited)December 31, 2016
Maturity Fair Rate(1) Date(2) Principal Value(3)
Repurchase Agreements (10.78%)Goldman Sachs & Co. 0.45% 1/3/17 . . . . . . . . . . . . . . . . . . . . . . . . . . . . . . . . . . . . . . . . . . . . . . . . . . . . . . . $ 67,200,000 $ 67,200,000 (Dated 12/30/16, repurchase price $67,203,360 collateralized by Ginnie Mae certifi cates, 2.50%-6.00%, maturing 10/15/32-12/20/46, fair value $68,547,427)Total Repurchase Agreements . . . . . . . . . . . . . . . . . . . . . . . . . . . . . . . . . . . . . . . . . . . . . . . . . . . . . . . . . . . . . . 67,200,000Total Investments (82.60%)(Amortized Cost $515,146,065) . . . . . . . . . . . . . . . . . . . . . . . . . . . . . . . . . . . . . . 515,146,065Other Assets in Excess of Other Liabilities (17.40%) . . . . . . . . . . . . . . . . . . . . . . . . . . . . . . . . . . . . . . . . . . 108,485,396Net Position (100.00%) . . . . . . . . . . . . . . . . . . . . . . . . . . . . . . . . . . . . . . . . . . . . . . . . . . . . . . . . . . . . . . . . . . . $ 623,631,461(1) Yield-to-maturity at original cost unless otherwise noted(2) Actual maturity dates.(3) See Note B to the fi nancial statements(4) Adjustable rate security. Rate shown is that which was in effect at December 31, 2016.(5) Guaranteed by Federal Home Loan Bank Letter of Credit and subject to put with 1 day notice.The notes to the fi nancial statements are an integral part of the schedule of investments.
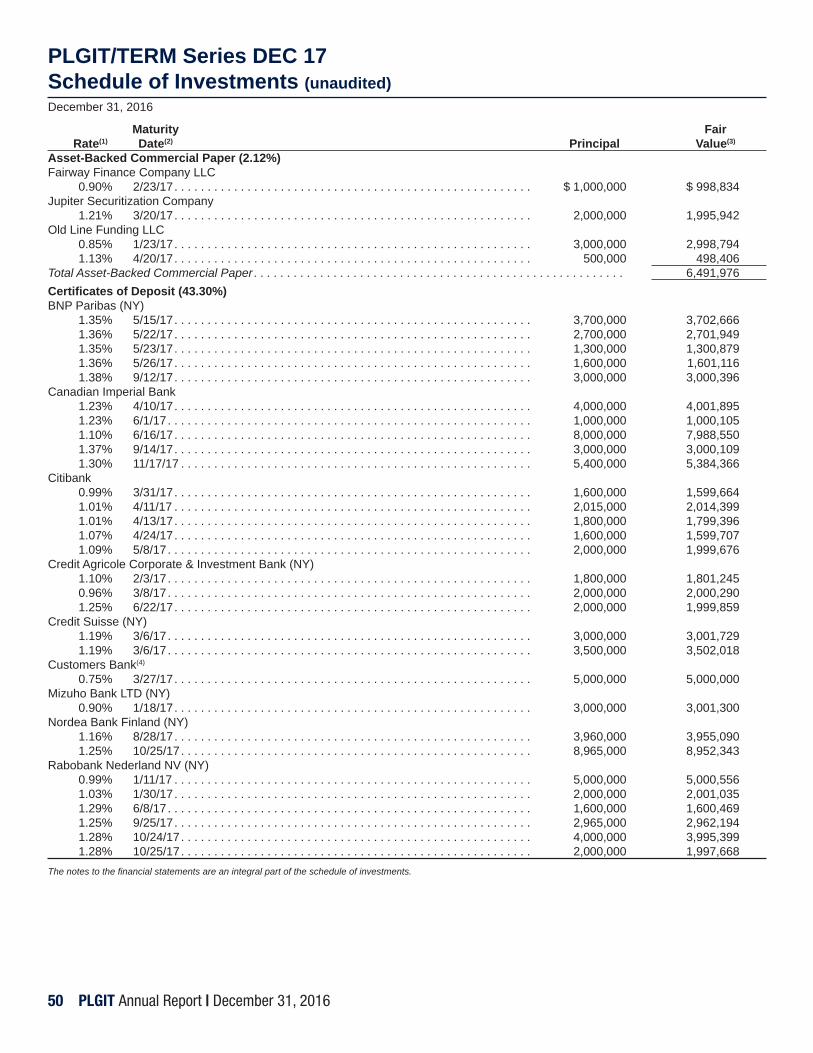
50 PLGIT Annual Report | December 31, 2016
PLGIT/TERM Series DEC 17Schedule of Investments (unaudited)December 31, 2016
Maturity Fair Rate(1) Date(2) Principal Value(3)
Asset-Backed Commercial Paper (2.12%)Fairway Finance Company LLC 0.90% 2/23/17 . . . . . . . . . . . . . . . . . . . . . . . . . . . . . . . . . . . . . . . . . . . . . . . . . . . . . . $ 1,000,000 $ 998,834Jupiter Securitization Company 1.21% 3/20/17 . . . . . . . . . . . . . . . . . . . . . . . . . . . . . . . . . . . . . . . . . . . . . . . . . . . . . . 2,000,000 1,995,942Old Line Funding LLC 0.85% 1/23/17 . . . . . . . . . . . . . . . . . . . . . . . . . . . . . . . . . . . . . . . . . . . . . . . . . . . . . . 3,000,000 2,998,794 1.13% 4/20/17 . . . . . . . . . . . . . . . . . . . . . . . . . . . . . . . . . . . . . . . . . . . . . . . . . . . . . . 500,000 498,406Total Asset-Backed Commercial Paper . . . . . . . . . . . . . . . . . . . . . . . . . . . . . . . . . . . . . . . . . . . . . . . . . . . . . . . . 6,491,976Certifi cates of Deposit (43.30%)BNP Paribas (NY) 1.35% 5/15/17 . . . . . . . . . . . . . . . . . . . . . . . . . . . . . . . . . . . . . . . . . . . . . . . . . . . . . . 3,700,000 3,702,666 1.36% 5/22/17 . . . . . . . . . . . . . . . . . . . . . . . . . . . . . . . . . . . . . . . . . . . . . . . . . . . . . . 2,700,000 2,701,949 1.35% 5/23/17 . . . . . . . . . . . . . . . . . . . . . . . . . . . . . . . . . . . . . . . . . . . . . . . . . . . . . . 1,300,000 1,300,879 1.36% 5/26/17 . . . . . . . . . . . . . . . . . . . . . . . . . . . . . . . . . . . . . . . . . . . . . . . . . . . . . . 1,600,000 1,601,116 1.38% 9/12/17 . . . . . . . . . . . . . . . . . . . . . . . . . . . . . . . . . . . . . . . . . . . . . . . . . . . . . . 3,000,000 3,000,396 Canadian Imperial Bank 1.23% 4/10/17 . . . . . . . . . . . . . . . . . . . . . . . . . . . . . . . . . . . . . . . . . . . . . . . . . . . . . . 4,000,000 4,001,895 1.23% 6/1/17 . . . . . . . . . . . . . . . . . . . . . . . . . . . . . . . . . . . . . . . . . . . . . . . . . . . . . . . 1,000,000 1,000,105 1.10% 6/16/17 . . . . . . . . . . . . . . . . . . . . . . . . . . . . . . . . . . . . . . . . . . . . . . . . . . . . . . 8,000,000 7,988,550 1.37% 9/14/17 . . . . . . . . . . . . . . . . . . . . . . . . . . . . . . . . . . . . . . . . . . . . . . . . . . . . . . 3,000,000 3,000,109 1.30% 11/17/17 . . . . . . . . . . . . . . . . . . . . . . . . . . . . . . . . . . . . . . . . . . . . . . . . . . . . . 5,400,000 5,384,366 Citibank 0.99% 3/31/17 . . . . . . . . . . . . . . . . . . . . . . . . . . . . . . . . . . . . . . . . . . . . . . . . . . . . . . 1,600,000 1,599,664 1.01% 4/11/17 . . . . . . . . . . . . . . . . . . . . . . . . . . . . . . . . . . . . . . . . . . . . . . . . . . . . . . 2,015,000 2,014,399 1.01% 4/13/17 . . . . . . . . . . . . . . . . . . . . . . . . . . . . . . . . . . . . . . . . . . . . . . . . . . . . . . 1,800,000 1,799,396 1.07% 4/24/17 . . . . . . . . . . . . . . . . . . . . . . . . . . . . . . . . . . . . . . . . . . . . . . . . . . . . . . 1,600,000 1,599,707 1.09% 5/8/17 . . . . . . . . . . . . . . . . . . . . . . . . . . . . . . . . . . . . . . . . . . . . . . . . . . . . . . . 2,000,000 1,999,676 Credit Agricole Corporate & Investment Bank (NY) 1.10% 2/3/17 . . . . . . . . . . . . . . . . . . . . . . . . . . . . . . . . . . . . . . . . . . . . . . . . . . . . . . . 1,800,000 1,801,245 0.96% 3/8/17 . . . . . . . . . . . . . . . . . . . . . . . . . . . . . . . . . . . . . . . . . . . . . . . . . . . . . . . 2,000,000 2,000,290 1.25% 6/22/17 . . . . . . . . . . . . . . . . . . . . . . . . . . . . . . . . . . . . . . . . . . . . . . . . . . . . . . 2,000,000 1,999,859 Credit Suisse (NY) 1.19% 3/6/17 . . . . . . . . . . . . . . . . . . . . . . . . . . . . . . . . . . . . . . . . . . . . . . . . . . . . . . . 3,000,000 3,001,729 1.19% 3/6/17 . . . . . . . . . . . . . . . . . . . . . . . . . . . . . . . . . . . . . . . . . . . . . . . . . . . . . . . 3,500,000 3,502,018 Customers Bank(4)
0.75% 3/27/17 . . . . . . . . . . . . . . . . . . . . . . . . . . . . . . . . . . . . . . . . . . . . . . . . . . . . . . 5,000,000 5,000,000Mizuho Bank LTD (NY) 0.90% 1/18/17 . . . . . . . . . . . . . . . . . . . . . . . . . . . . . . . . . . . . . . . . . . . . . . . . . . . . . . 3,000,000 3,001,300Nordea Bank Finland (NY) 1.16% 8/28/17 . . . . . . . . . . . . . . . . . . . . . . . . . . . . . . . . . . . . . . . . . . . . . . . . . . . . . . 3,960,000 3,955,090 1.25% 10/25/17 . . . . . . . . . . . . . . . . . . . . . . . . . . . . . . . . . . . . . . . . . . . . . . . . . . . . . 8,965,000 8,952,343Rabobank Nederland NV (NY) 0.99% 1/11/17 . . . . . . . . . . . . . . . . . . . . . . . . . . . . . . . . . . . . . . . . . . . . . . . . . . . . . . 5,000,000 5,000,556 1.03% 1/30/17 . . . . . . . . . . . . . . . . . . . . . . . . . . . . . . . . . . . . . . . . . . . . . . . . . . . . . . 2,000,000 2,001,035 1.29% 6/8/17 . . . . . . . . . . . . . . . . . . . . . . . . . . . . . . . . . . . . . . . . . . . . . . . . . . . . . . . 1,600,000 1,600,469 1.25% 9/25/17 . . . . . . . . . . . . . . . . . . . . . . . . . . . . . . . . . . . . . . . . . . . . . . . . . . . . . . 2,965,000 2,962,194 1.28% 10/24/17 . . . . . . . . . . . . . . . . . . . . . . . . . . . . . . . . . . . . . . . . . . . . . . . . . . . . . 4,000,000 3,995,399 1.28% 10/25/17 . . . . . . . . . . . . . . . . . . . . . . . . . . . . . . . . . . . . . . . . . . . . . . . . . . . . . 2,000,000 1,997,668 The notes to the fi nancial statements are an integral part of the schedule of investments.

PLGIT Annual Report | December 31, 2016 51
PLGIT/TERM Series DEC 17Schedule of Investments (unaudited)December 31, 2016
Maturity Fair Rate(1) Date(2) Principal Value(3)
Skandinaviska Enskilda Banken (NY) 0.95% 4/13/17 . . . . . . . . . . . . . . . . . . . . . . . . . . . . . . . . . . . . . . . . . . . . . . . . . . . . . . $ 500,000 $ 499,804 Societe Generale (NY) 1.05% 3/27/17 . . . . . . . . . . . . . . . . . . . . . . . . . . . . . . . . . . . . . . . . . . . . . . . . . . . . . . 3,980,000 3,980,828 1.05% 4/3/17 . . . . . . . . . . . . . . . . . . . . . . . . . . . . . . . . . . . . . . . . . . . . . . . . . . . . . . . 1,750,000 1,750,081 Sumitomo Mitsui Bank (NY) 1.05% 2/24/17 . . . . . . . . . . . . . . . . . . . . . . . . . . . . . . . . . . . . . . . . . . . . . . . . . . . . . . 3,500,000 3,503,387 Toronto Dominion Bank (NY) 1.32% 5/30/17 . . . . . . . . . . . . . . . . . . . . . . . . . . . . . . . . . . . . . . . . . . . . . . . . . . . . . . 1,000,000 1,000,505 1.27% 6/12/17 . . . . . . . . . . . . . . . . . . . . . . . . . . . . . . . . . . . . . . . . . . . . . . . . . . . . . . 5,000,000 5,000,789 1.39% 8/31/17 . . . . . . . . . . . . . . . . . . . . . . . . . . . . . . . . . . . . . . . . . . . . . . . . . . . . . . 1,700,000 1,692,585 1.07% 10/5/17 . . . . . . . . . . . . . . . . . . . . . . . . . . . . . . . . . . . . . . . . . . . . . . . . . . . . . . 1,500,000 1,499,433 1.35% 10/11/17 . . . . . . . . . . . . . . . . . . . . . . . . . . . . . . . . . . . . . . . . . . . . . . . . . . . . . 1,900,000 1,899,234 1.34% 10/13/17 . . . . . . . . . . . . . . . . . . . . . . . . . . . . . . . . . . . . . . . . . . . . . . . . . . . . . 990,000 989,499 1.28% 10/19/17 . . . . . . . . . . . . . . . . . . . . . . . . . . . . . . . . . . . . . . . . . . . . . . . . . . . . . 1,500,000 1,498,393 1.23% 11/2/17 . . . . . . . . . . . . . . . . . . . . . . . . . . . . . . . . . . . . . . . . . . . . . . . . . . . . . . 2,250,000 2,244,099 1.24% 11/14/17 . . . . . . . . . . . . . . . . . . . . . . . . . . . . . . . . . . . . . . . . . . . . . . . . . . . . . 2,700,000 2,695,061 1.31% 11/14/17 . . . . . . . . . . . . . . . . . . . . . . . . . . . . . . . . . . . . . . . . . . . . . . . . . . . . . 6,000,000 5,992,651 1.24% 11/17/17 . . . . . . . . . . . . . . . . . . . . . . . . . . . . . . . . . . . . . . . . . . . . . . . . . . . . . 500,000 498,326 1.26% 11/22/17 . . . . . . . . . . . . . . . . . . . . . . . . . . . . . . . . . . . . . . . . . . . . . . . . . . . . . 500,000 499,097 1.25% 11/28/17 . . . . . . . . . . . . . . . . . . . . . . . . . . . . . . . . . . . . . . . . . . . . . . . . . . . . . 1,100,000 1,097,786 1.40% 12/1/17 . . . . . . . . . . . . . . . . . . . . . . . . . . . . . . . . . . . . . . . . . . . . . . . . . . . . . . 1,000,000 999,292 1.35% 12/19/17 . . . . . . . . . . . . . . . . . . . . . . . . . . . . . . . . . . . . . . . . . . . . . . . . . . . . . 1,615,000 1,612,494 Total Certifi cates of Deposit . . . . . . . . . . . . . . . . . . . . . . . . . . . . . . . . . . . . . . . . . . . . . . . . . . . . . . . . . . . . . . . . . 132,419,412Commercial Paper (54.41%)Bank of Montreal Chicago 0.90% 2/15/17 . . . . . . . . . . . . . . . . . . . . . . . . . . . . . . . . . . . . . . . . . . . . . . . . . . . . . . 500,000 499,453 1.03% 3/20/17 . . . . . . . . . . . . . . . . . . . . . . . . . . . . . . . . . . . . . . . . . . . . . . . . . . . . . . 6,000,000 5,986,452 1.08% 3/21/17 . . . . . . . . . . . . . . . . . . . . . . . . . . . . . . . . . . . . . . . . . . . . . . . . . . . . . . 5,000,000 4,988,490 Bank of Tokyo Mitsubishi UFJ LTD 1.11% 1/30/17 . . . . . . . . . . . . . . . . . . . . . . . . . . . . . . . . . . . . . . . . . . . . . . . . . . . . . . 500,000 499,685 1.11% 2/1/17 . . . . . . . . . . . . . . . . . . . . . . . . . . . . . . . . . . . . . . . . . . . . . . . . . . . . . . . 1,600,000 1,598,920 1.14% 2/17/17 . . . . . . . . . . . . . . . . . . . . . . . . . . . . . . . . . . . . . . . . . . . . . . . . . . . . . . 1,800,000 1,798,119 1.00% 3/1/17 . . . . . . . . . . . . . . . . . . . . . . . . . . . . . . . . . . . . . . . . . . . . . . . . . . . . . . . 500,000 499,326 1.28% 3/21/17 . . . . . . . . . . . . . . . . . . . . . . . . . . . . . . . . . . . . . . . . . . . . . . . . . . . . . . 3,000,000 2,993,913 1.27% 3/20/17 . . . . . . . . . . . . . . . . . . . . . . . . . . . . . . . . . . . . . . . . . . . . . . . . . . . . . . 500,000 499,003 1.26% 4/4/17 . . . . . . . . . . . . . . . . . . . . . . . . . . . . . . . . . . . . . . . . . . . . . . . . . . . . . . . 850,000 847,829 1.27% 4/25/17 . . . . . . . . . . . . . . . . . . . . . . . . . . . . . . . . . . . . . . . . . . . . . . . . . . . . . . 4,000,000 3,986,532 1.25% 5/8/17 . . . . . . . . . . . . . . . . . . . . . . . . . . . . . . . . . . . . . . . . . . . . . . . . . . . . . . . 2,000,000 1,992,146 1.17% 5/11/17 . . . . . . . . . . . . . . . . . . . . . . . . . . . . . . . . . . . . . . . . . . . . . . . . . . . . . . 1,500,000 1,493,905 1.27% 5/22/17 . . . . . . . . . . . . . . . . . . . . . . . . . . . . . . . . . . . . . . . . . . . . . . . . . . . . . . 250,000 248,856 1.28% 5/30/17 . . . . . . . . . . . . . . . . . . . . . . . . . . . . . . . . . . . . . . . . . . . . . . . . . . . . . . 8,100,000 8,059,808 1.28% 6/5/17 . . . . . . . . . . . . . . . . . . . . . . . . . . . . . . . . . . . . . . . . . . . . . . . . . . . . . . . 2,500,000 2,486,885 1.28% 6/8/17 . . . . . . . . . . . . . . . . . . . . . . . . . . . . . . . . . . . . . . . . . . . . . . . . . . . . . . . 450,000 447,574 1.30% 6/21/17 . . . . . . . . . . . . . . . . . . . . . . . . . . . . . . . . . . . . . . . . . . . . . . . . . . . . . . 2,500,000 2,484,897 1.30% 6/26/17 . . . . . . . . . . . . . . . . . . . . . . . . . . . . . . . . . . . . . . . . . . . . . . . . . . . . . . 500,000 496,853 The notes to the fi nancial statements are an integral part of the schedule of investments.

52 PLGIT Annual Report | December 31, 2016
PLGIT/TERM Series DEC 17Schedule of Investments (unaudited)December 31, 2016
Maturity Fair Rate(1) Date(2) Principal Value(3)
BNP Paribas (NY) 1.05% 1/12/17 . . . . . . . . . . . . . . . . . . . . . . . . . . . . . . . . . . . . . . . . . . . . . . . . . . . . . . $ 1,205,000 $ 1,204,725 0.97% 2/10/17 . . . . . . . . . . . . . . . . . . . . . . . . . . . . . . . . . . . . . . . . . . . . . . . . . . . . . . 5,500,000 5,495,083 1.26% 3/17/17 . . . . . . . . . . . . . . . . . . . . . . . . . . . . . . . . . . . . . . . . . . . . . . . . . . . . . . 1,800,000 1,796,359 1.36% 5/2/17 . . . . . . . . . . . . . . . . . . . . . . . . . . . . . . . . . . . . . . . . . . . . . . . . . . . . . . . 1,010,000 1,006,280 1.23% 5/22/17 . . . . . . . . . . . . . . . . . . . . . . . . . . . . . . . . . . . . . . . . . . . . . . . . . . . . . . 4,000,000 3,982,028 1.28% 8/4/17 . . . . . . . . . . . . . . . . . . . . . . . . . . . . . . . . . . . . . . . . . . . . . . . . . . . . . . . 700,000 694,502 1.32% 8/11/17 . . . . . . . . . . . . . . . . . . . . . . . . . . . . . . . . . . . . . . . . . . . . . . . . . . . . . . 1,000,000 991,824 1.32% 8/14/17 . . . . . . . . . . . . . . . . . . . . . . . . . . . . . . . . . . . . . . . . . . . . . . . . . . . . . . 1,000,000 991,689 Cooperatieve Rabobank U.A. 0.96% 1/23/17 . . . . . . . . . . . . . . . . . . . . . . . . . . . . . . . . . . . . . . . . . . . . . . . . . . . . . . 1,800,000 1,799,386 1.13% 4/21/17 . . . . . . . . . . . . . . . . . . . . . . . . . . . . . . . . . . . . . . . . . . . . . . . . . . . . . . 2,600,000 2,592,689 Credit Agricole Corporate & Investment Bank (NY) 0.80% 2/1/17 . . . . . . . . . . . . . . . . . . . . . . . . . . . . . . . . . . . . . . . . . . . . . . . . . . . . . . . 1,500,000 1,499,067 1.19% 2/2/17 . . . . . . . . . . . . . . . . . . . . . . . . . . . . . . . . . . . . . . . . . . . . . . . . . . . . . . . 1,005,000 1,004,350 1.19% 2/7/17 . . . . . . . . . . . . . . . . . . . . . . . . . . . . . . . . . . . . . . . . . . . . . . . . . . . . . . . 1,000,000 999,223 0.88% 2/16/17 . . . . . . . . . . . . . . . . . . . . . . . . . . . . . . . . . . . . . . . . . . . . . . . . . . . . . . 1,000,000 998,968 1.15% 5/31/17 . . . . . . . . . . . . . . . . . . . . . . . . . . . . . . . . . . . . . . . . . . . . . . . . . . . . . . 4,825,000 4,801,247 1.23% 6/26/17 . . . . . . . . . . . . . . . . . . . . . . . . . . . . . . . . . . . . . . . . . . . . . . . . . . . . . . 3,357,000 3,336,351 Credit Suisse (NY) 1.23% 2/28/17 . . . . . . . . . . . . . . . . . . . . . . . . . . . . . . . . . . . . . . . . . . . . . . . . . . . . . . 1,100,000 1,098,680 1.18% 3/7/17 . . . . . . . . . . . . . . . . . . . . . . . . . . . . . . . . . . . . . . . . . . . . . . . . . . . . . . . 1,410,000 1,407,950 ING (US) Funding LLC 0.93% 3/3/17 . . . . . . . . . . . . . . . . . . . . . . . . . . . . . . . . . . . . . . . . . . . . . . . . . . . . . . . 4,200,000 4,193,314 1.19% 4/3/17 . . . . . . . . . . . . . . . . . . . . . . . . . . . . . . . . . . . . . . . . . . . . . . . . . . . . . . . 5,000,000 4,986,890 1.17% 5/15/17 . . . . . . . . . . . . . . . . . . . . . . . . . . . . . . . . . . . . . . . . . . . . . . . . . . . . . . 2,510,000 2,499,220 1.33% 6/26/17 . . . . . . . . . . . . . . . . . . . . . . . . . . . . . . . . . . . . . . . . . . . . . . . . . . . . . . 250,000 248,420 1.28% 8/11/17 . . . . . . . . . . . . . . . . . . . . . . . . . . . . . . . . . . . . . . . . . . . . . . . . . . . . . . 750,000 743,765 JP Morgan Securities LLC 0.90% 1/6/17 . . . . . . . . . . . . . . . . . . . . . . . . . . . . . . . . . . . . . . . . . . . . . . . . . . . . . . . 500,000 499,952 0.96% 2/17/17 . . . . . . . . . . . . . . . . . . . . . . . . . . . . . . . . . . . . . . . . . . . . . . . . . . . . . . 5,050,000 5,045,445 1.12% 2/24/17 . . . . . . . . . . . . . . . . . . . . . . . . . . . . . . . . . . . . . . . . . . . . . . . . . . . . . . 2,000,000 1,997,862 1.10% 4/18/17 . . . . . . . . . . . . . . . . . . . . . . . . . . . . . . . . . . . . . . . . . . . . . . . . . . . . . . 2,000,000 1,993,370 1.18% 5/18/17 . . . . . . . . . . . . . . . . . . . . . . . . . . . . . . . . . . . . . . . . . . . . . . . . . . . . . . 2,000,000 1,990,996 1.14% 6/13/17 . . . . . . . . . . . . . . . . . . . . . . . . . . . . . . . . . . . . . . . . . . . . . . . . . . . . . . 1,010,000 1,004,501 1.21% 6/16/17 . . . . . . . . . . . . . . . . . . . . . . . . . . . . . . . . . . . . . . . . . . . . . . . . . . . . . . 4,670,000 4,644,067 1.11% 6/23/17 . . . . . . . . . . . . . . . . . . . . . . . . . . . . . . . . . . . . . . . . . . . . . . . . . . . . . . 4,250,000 4,225,290 1.31% 7/17/17 . . . . . . . . . . . . . . . . . . . . . . . . . . . . . . . . . . . . . . . . . . . . . . . . . . . . . . 500,000 496,642 1.21% 7/21/17 . . . . . . . . . . . . . . . . . . . . . . . . . . . . . . . . . . . . . . . . . . . . . . . . . . . . . . 4,000,000 3,972,528 1.41% 9/15/17 . . . . . . . . . . . . . . . . . . . . . . . . . . . . . . . . . . . . . . . . . . . . . . . . . . . . . . 1,370,000 1,357,551 Metlife Short Term Funding 0.74% 1/31/17 . . . . . . . . . . . . . . . . . . . . . . . . . . . . . . . . . . . . . . . . . . . . . . . . . . . . . . 600,000 599,650 0.95% 3/27/17 . . . . . . . . . . . . . . . . . . . . . . . . . . . . . . . . . . . . . . . . . . . . . . . . . . . . . . 1,000,000 997,753 The notes to the fi nancial statements are an integral part of the schedule of investments.
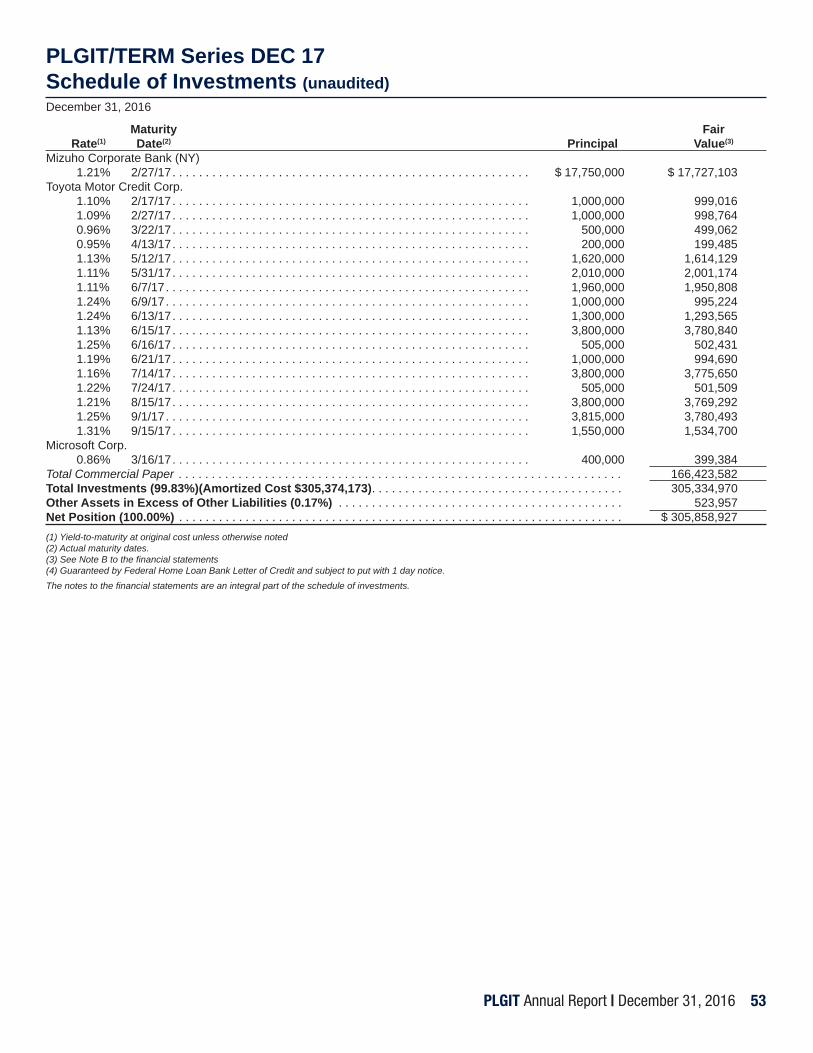
PLGIT Annual Report | December 31, 2016 53
PLGIT/TERM Series DEC 17Schedule of Investments (unaudited)December 31, 2016
Maturity Fair Rate(1) Date(2) Principal Value(3)
Mizuho Corporate Bank (NY) 1.21% 2/27/17 . . . . . . . . . . . . . . . . . . . . . . . . . . . . . . . . . . . . . . . . . . . . . . . . . . . . . . $ 17,750,000 $ 17,727,103 Toyota Motor Credit Corp. 1.10% 2/17/17 . . . . . . . . . . . . . . . . . . . . . . . . . . . . . . . . . . . . . . . . . . . . . . . . . . . . . . 1,000,000 999,016 1.09% 2/27/17 . . . . . . . . . . . . . . . . . . . . . . . . . . . . . . . . . . . . . . . . . . . . . . . . . . . . . . 1,000,000 998,764 0.96% 3/22/17 . . . . . . . . . . . . . . . . . . . . . . . . . . . . . . . . . . . . . . . . . . . . . . . . . . . . . . 500,000 499,062 0.95% 4/13/17 . . . . . . . . . . . . . . . . . . . . . . . . . . . . . . . . . . . . . . . . . . . . . . . . . . . . . . 200,000 199,485 1.13% 5/12/17 . . . . . . . . . . . . . . . . . . . . . . . . . . . . . . . . . . . . . . . . . . . . . . . . . . . . . . 1,620,000 1,614,129 1.11% 5/31/17 . . . . . . . . . . . . . . . . . . . . . . . . . . . . . . . . . . . . . . . . . . . . . . . . . . . . . . 2,010,000 2,001,174 1.11% 6/7/17 . . . . . . . . . . . . . . . . . . . . . . . . . . . . . . . . . . . . . . . . . . . . . . . . . . . . . . . 1,960,000 1,950,808 1.24% 6/9/17 . . . . . . . . . . . . . . . . . . . . . . . . . . . . . . . . . . . . . . . . . . . . . . . . . . . . . . . 1,000,000 995,224 1.24% 6/13/17 . . . . . . . . . . . . . . . . . . . . . . . . . . . . . . . . . . . . . . . . . . . . . . . . . . . . . . 1,300,000 1,293,565 1.13% 6/15/17 . . . . . . . . . . . . . . . . . . . . . . . . . . . . . . . . . . . . . . . . . . . . . . . . . . . . . . 3,800,000 3,780,840 1.25% 6/16/17 . . . . . . . . . . . . . . . . . . . . . . . . . . . . . . . . . . . . . . . . . . . . . . . . . . . . . . 505,000 502,431 1.19% 6/21/17 . . . . . . . . . . . . . . . . . . . . . . . . . . . . . . . . . . . . . . . . . . . . . . . . . . . . . . 1,000,000 994,690 1.16% 7/14/17 . . . . . . . . . . . . . . . . . . . . . . . . . . . . . . . . . . . . . . . . . . . . . . . . . . . . . . 3,800,000 3,775,650 1.22% 7/24/17 . . . . . . . . . . . . . . . . . . . . . . . . . . . . . . . . . . . . . . . . . . . . . . . . . . . . . . 505,000 501,509 1.21% 8/15/17 . . . . . . . . . . . . . . . . . . . . . . . . . . . . . . . . . . . . . . . . . . . . . . . . . . . . . . 3,800,000 3,769,292 1.25% 9/1/17 . . . . . . . . . . . . . . . . . . . . . . . . . . . . . . . . . . . . . . . . . . . . . . . . . . . . . . . 3,815,000 3,780,493 1.31% 9/15/17 . . . . . . . . . . . . . . . . . . . . . . . . . . . . . . . . . . . . . . . . . . . . . . . . . . . . . . 1,550,000 1,534,700 Microsoft Corp. 0.86% 3/16/17 . . . . . . . . . . . . . . . . . . . . . . . . . . . . . . . . . . . . . . . . . . . . . . . . . . . . . . 400,000 399,384 Total Commercial Paper . . . . . . . . . . . . . . . . . . . . . . . . . . . . . . . . . . . . . . . . . . . . . . . . . . . . . . . . . . . . . . . . . . . 166,423,582Total Investments (99.83%)(Amortized Cost $305,374,173) . . . . . . . . . . . . . . . . . . . . . . . . . . . . . . . . . . . . . . 305,334,970Other Assets in Excess of Other Liabilities (0.17%) . . . . . . . . . . . . . . . . . . . . . . . . . . . . . . . . . . . . . . . . . . . 523,957Net Position (100.00%) . . . . . . . . . . . . . . . . . . . . . . . . . . . . . . . . . . . . . . . . . . . . . . . . . . . . . . . . . . . . . . . . . . . $ 305,858,927(1) Yield-to-maturity at original cost unless otherwise noted(2) Actual maturity dates.(3) See Note B to the fi nancial statements(4) Guaranteed by Federal Home Loan Bank Letter of Credit and subject to put with 1 day notice.The notes to the fi nancial statements are an integral part of the schedule of investments.
4992 • 4/17
Offi cersThomas J. McElhone, President and Trustee
Commissioner, Shaler Township,Allegheny County
Kim Buchanan, Vice President and TrusteeBusiness Manager, Grove City Area School District,Mercer County
TrusteesSandra A. Bartosiewicz, Trustee
Finance and Budget Offi cer, Wyoming Valley Sanitary Authority,Luzerne County
Kathleen DePuy, TrusteeBorough Representative, Borough of Whitehall,Allegheny County
Ronald E. Evanko, TrusteeMayor, Borough of Blairsville,Indiana County
Sandra K. Green, TrusteeMayor, Borough of Kutztown,Berks County
Dennis Hameister, TrusteeSupervisor, Harris Township,Centre County
Brian Hessenthaler, TrusteeChief Operating Offi cer, Bucks County,Bucks County
Tim L. Horner, TrusteeSupervisor, Chapman Township,Clinton County
Dr. G. Brian Toth, TrusteeSuperintendent, St. Marys Area School District,Elk County
Sponsoring AssociationsPennsylvania State Association of Boroughs
Christopher Cap, Executive Director
Pennsylvania Municipal LeagueRichard J. Schuettler, Executive Director
Pennsylvania State Association of Township CommissionersRichard J. Schuettler, Executive Director
Pennsylvania State Association of Township SupervisorsDavid M. Sanko, Executive Director
Pennsylvania Municipal Authorities AssociationDouglas E. Bilheimer, Executive Director
Pennsylvania Association of School AdministratorsDr. Mark DiRocco, Executive Director
County Commissioners Association of PennsylvaniaDouglas E. Hill, Executive Director
Service ContractorsInvestment Adviser, Administrator & Transfer Agent
PFM Asset Management LLCOne Keystone Plaza, Suite 300North Front and Market StreetsHarrisburg, PA 17101-2044
CustodianU.S. Bank, N.A.50 S. 16th Street, Suite 2000Philadelphia, PA 19102
DepositoryWells Fargo Bank, N.A.123 South Broad StreetPhiladelphia, PA 19109
Independent AuditorsErnst & Young LLPOne Commerce Square2005 Market Street, Suite 700Philadelphia, PA 19103
Legal CounselSaul Ewing LLPCenter Square West1500 Market Street, 38th FloorPhiladelphia, PA 19102
Existing Solely For Your Successs
Post Offi ce Box 1027 • Harrisburg, PA 17108-1027For further information call toll-free: 1.800.572.1472 • Fax: 1.800.252.9551
www.plgit.com© 2017 Pennsylvania Local Government Investment Trust