pleiotrophin commits human bone marrow mesenchymal stromal
TRANSCRIPT

Pleiotrophin Commits Human Bone MarrowMesenchymal Stromal Cells towards Hypertrophy duringChondrogenesisThibault Bouderlique1,2¤a, Emilie Henault1, Angelique Lebouvier2,3, Guilhem Frescaline1¤b,
Phillipe Bierling3,4, Helene Rouard2,3, Jose Courty1, Patricia Albanese1*., Nathalie Chevallier2,3*.
1CNRS EAC 7149, CRRET Laboratory, Paris-Est University, Creteil, France, 2 EA3952, Cellular and Tissular Bioengineering Laboratory, Paris-Est University, Creteil, France,
3Cell Therapy Facility, EFS Ile de France, Creteil, France, 4 INSERM UMR955, Paris-Est University, Creteil, France
Abstract
Pleiotrophin (PTN) is a growth factor present in the extracellular matrix of the growth plate during bone development andin the callus during bone healing. Bone healing is a complicated process that recapitulates endochondral bonedevelopment and involves many cell types. Among those cells, mesenchymal stromal cells (MSC) are able to differentiatetoward chondrogenic and osteoblastic lineages. We aimed to determine PTN effects on differentiation properties of humanbone marrow stromal cells (hBMSC) under chondrogenic induction using histological analysis and quantitative reversetranscription polymerase chain reaction. PTN dramatically potentiated chondrogenic differentiation as indicated by a strongincrease of collagen 2 protein, and cartilage-related gene expression. Moreover, PTN increased transcription of hypertrophicchondrocyte markers such as MMP13, collagen 10 and alkaline phosphatase and enhanced calcification and the content ofcollagen 10 protein. These effects are dependent on PTN receptors signaling and PI3 K pathway activation. These datasuggest a new role of PTN in bone regeneration as an inducer of hypertrophy during chondrogenic differentiation ofhBMSC.
Citation: Bouderlique T, Henault E, Lebouvier A, Frescaline G, Bierling P, et al. (2014) Pleiotrophin Commits Human Bone Marrow Mesenchymal Stromal Cellstowards Hypertrophy during Chondrogenesis. PLoS ONE 9(2): e88287. doi:10.1371/journal.pone.0088287
Editor: Zoran Ivanovic, French Blood Institute, France
Received November 29, 2013; Accepted January 10, 2014; Published February 7, 2014
Copyright: � 2014 Bouderlique et al. This is an open-access article distributed under the terms of the Creative Commons Attribution License, which permitsunrestricted use, distribution, and reproduction in any medium, provided the original author and source are credited.
Funding: This work was partially supported by EFS Ile de France, University Paris Est and by the 7th Framework Program of the European Commission throughthe project REBORNE #241879. Thibault Bouderlique: doctoral fellowship was supported by the French Ministere de l’Enseignement et de la Recherche. Thefunders had no role in study design, data collection and analysis, decision to publish, or preparation of the manuscript.
Competing Interests: The authors have declared that no competing interests exist.
* E-mail: [email protected] (NC); [email protected] (PA)
¤a Current address: Department of Physiology and Pharmacology, Karolinska Institute, Department of Women’s and Children’s Health, Karolinska Hospital,Stockholm, Sweden¤b Current address: CNRS UMR 7052, Laboratoire de Bioingenierie et de Biomecanique Osteo-articulaire, Faculty of Medicine Diderot-Paris 7, Paris, France
. These authors contributed equally to this work.
Introduction
Bone formation during growth and regeneration passes through
a common process known as endochondral bone formation [1]. In
this process, chondrocytes in growth plates proliferate while
synthesizing a cartilaginous extracellular matrix (ECM) mainly
composed of proteoglycans and collagen 2 (col2). Following
differentiation, chondrocytes become hypertrophic. They increase
in size by up to ten fold and express specific hypertrophic markers
such as matrix metalloprotease 13 (MMP13), collagen 10 (col10)
and alkaline phosphatase (ALP). Hypertrophic chondrocytes
calcify their surrounding matrix before undergoing apoptosis [2].
Concomitant matrix degradation by MMPs [3] allows vessel
ingrowth and invading cells partially degrade the extracellular
matrix in preparation for the formation of mature bone by
osteoblasts. Osteoblasts deposit an osteoid matrix that will later
calcify. Throughout life, bone is submitted to a constant
remodeling process, alternating matrix degradation and bone
synthesis.
Mesenchymal stromal cells (MSC) from surrounding tissues
are the key cellular component of bone regeneration since they
can differentiate toward chondrogenic and osteoblastic lineages
[4,5]. During bone and cartilage formation, many growth
factors are tightly regulated to give rise to a suitable ECM. The
transforming growth factor (TGF) super-family, in particular
bone morphogenetic proteins (BMP) and TGF b, are the most
known factors involved in this processes [1]. However,
numerous other growth factors are also involved in bone and
cartilage organogenesis. Among them, Pleiotrophin (PTN) is a
136 amino acid growth factor that has been first isolated from
brain and bone matrices [6,7,8]. PTN has three known
receptors: anaplastic lymphoma kinase (ALK) defined as a high
affinity receptor [9], heparan sulfate proteoglycan syndecan 3
(SDC3) and chondroitin sulfate proteoglycan protein tyrosine
phosphatase receptor type z (PTPRz), both defined as low
affinity receptors [10,11].
PTN is widely expressed in many tissues during fetal
development [12,13] whereas its post-natal expression is predom-
inantly restricted to nervous system and bone [13]. PTN has been
implicated in many processes such as neurite outgrowth during
brain development [14] and endothelial cell properties in normal
PLOS ONE | www.plosone.org 1 February 2014 | Volume 9 | Issue 2 | e88287
and pathological angiogenesis (for review see [15]). Studies suggest
that PTN is involved in the development and regeneration of bone
and cartilage because the protein is localized around hypertrophic
chondrocytes and osteoprogenitors in rat, mice and chicken
developing leg [16,17,18]. Moreover, in vitro studies showed that
PTN treatment stimulates the proteoglycan synthesis of bovine
mature chondrocytes [19] and enhances chondrogenesis of
chicken limb bud mesenchymal cells in pellet culture [20]. Other
in vitro experiments showed that PTN induces migration of
osteoblast cell lines [18] and osteoprogenitors from human bone
marrow [21]. PTN also improves osteoblastic differentiation of
bone marrow derived stromal cells [21,22].
PTN overexpression under the regulation of the osteocalcin
promoter in transgenic mice induces a higher bone mineral
content and a delayed bone growth rate compared to wild-type
mice[23]. However relevance of PTN effects on bone physiology
still remains controversial since Lehmann and colleagues showed
no specific bone phenotype in PTN deficient mice [24]. Imai
and colleagues confirmed that PTN global knockout and wild
type mice had the same skeletal morphology although, they
observed growth retardation in weight-bearing bones [25].
These data suggest an effect on the growth plate behaviour
during growth, thereby indicating an effect of PTN on
chondrocytes differentiation. However, no data are available
describing a potential effect of PTN on the commitment of
chondrocytes to hypertrophy.
The aim of this study was to define the effects of PTN on human
bone marrow stromal cell (hBMSC) differentiation towards
chondroblastic lineage with a focus on chondrocyte hypertrophy.
We evaluated chondrocytic commitment of hBMSC in presence of
recombinant human PTN by histological and quantitative reverse
transcription polymerase chain reaction analysis. We then focused
on hypertrophic differentiation and established a potential new
role of PTN during endochondral bone formation.
Materials and Methods
Human Bone Marrow Stromal Cell IsolationHuman bone marrow was obtained from iliac crest marrow
aspirates of patients undergoing standard bone marrow transplan-
tation procedures (Henri Mondor Hospital, AP-HP Creteil,
France) after signature of an informed consent form. Researchers
did not take part in collecting these samples. Anonymous sample
(3- to 5-ml volumes) from three healthy donors (26–38 years old)
were provided to EA3952 for the purpose of research only, under
the European project REBORNE, grant agreement number
NuIDRCB: 2011-A00797-34 and ethical committee approval
NuCPP: 2011-R28. Nucleated cells from fresh marrow were
seeded at a density of 2.105 cells/cm2 in 225-cm2 flasks. A cell
sample was used for the confirmation of hBMSC characteristics as
previously described [26]. Briefly, all the hBMSC were positive for
CD90, CD105, CD73, and negative for CD34 and CD45, and
were able to differentiate into osteogenic, chondrogenic and
adipogenic lineages (Figure 1). hBMSCs were expanded in a-modified Eagle’s medium (aMEM) (Life technologies, Cergy
Pontoise, France) containing 10% lot-selected fetal bovine serum
(FBS) (StemCell Technologies, Grenoble, France) supplemented
with 0,5% Cifloxacin (Bayer Pharma, Puteaux, France). Culture
medium was changed twice every week and cultures were
maintained in a humidified atmosphere with 5% CO2 at 37uC.When cells reached 80–90% confluence (passage zero, P0), they
were detached using trypsin/EDTA (PAA Laboratories, Austria)
and then reseeded at 103 cells/cm2 (passage one, P1).
Characterisation and Differentiation of Human BMSCThe capacity of hBMSC to differentiate into the osteogenic and
adipogenic lineages was determined. For this purpose, cells were
seeded in 6-well plates. For osteogenic differentiation, at 25%
confluence the media was supplemented with 50 mM ascorbic
acid-2-phosphate, 10 mM b-glycerophosphate and 0,1 mM dexa-
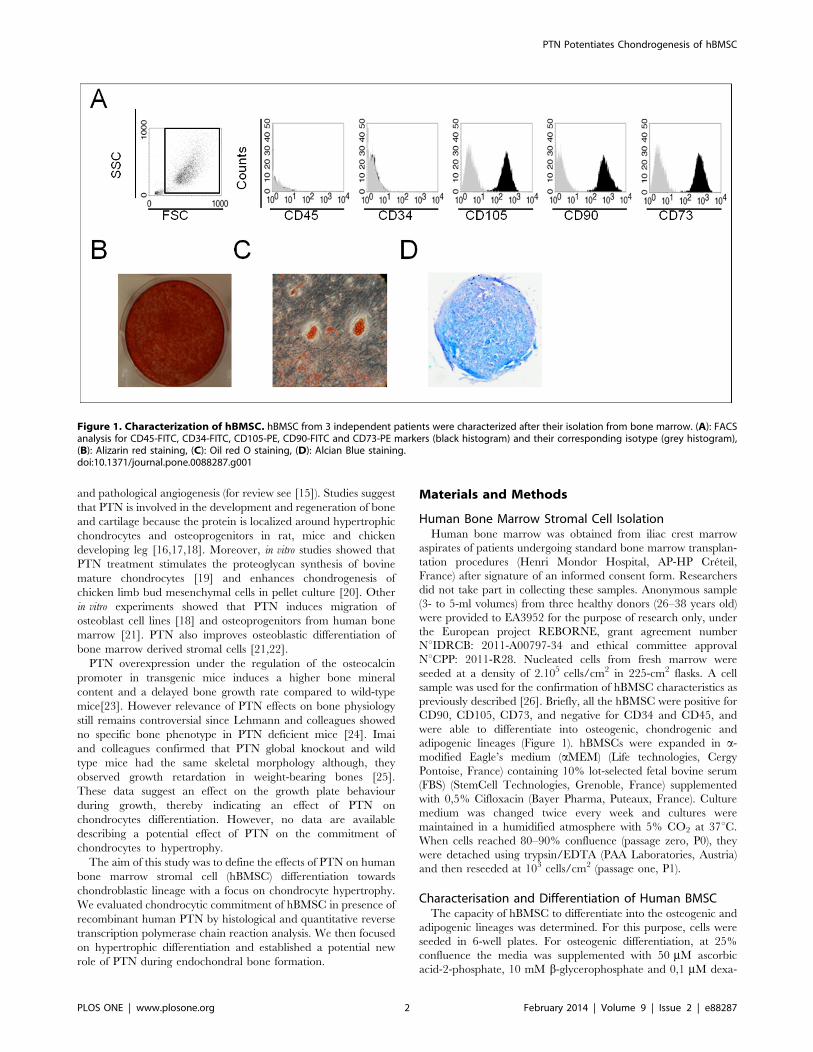
Figure 1. Characterization of hBMSC. hBMSC from 3 independent patients were characterized after their isolation from bone marrow. (A): FACSanalysis for CD45-FITC, CD34-FITC, CD105-PE, CD90-FITC and CD73-PE markers (black histogram) and their corresponding isotype (grey histogram),(B): Alizarin red staining, (C): Oil red O staining, (D): Alcian Blue staining.doi:10.1371/journal.pone.0088287.g001
PTN Potentiates Chondrogenesis of hBMSC
PLOS ONE | www.plosone.org 2 February 2014 | Volume 9 | Issue 2 | e88287

methasone (Sigma, Saint Quentin Fallavier, France). On day 21,
the monolayers were fixed in 70% ethanol for 1 h at 4uC and
stained for 15 min with alizarin red-S (Sigma) at room temper-
ature (RT). For adipogenic differentiation, at 80% confluence the
media was replaced by a high glucose medium (Invitrogen)
supplemented with 10% FBS, 0,1 mM dexamethasone, 0,2 mM
indomethacin, 0,01 mg/ml insulin and 0,5 mM IBMX. On day
21, the monolayers were fixed using 4% paraformaldehyde for
5 min at RT, and then stained for 15 min with 0,3% oil-red O
(Sigma)/60% isopropanol.
Flow CytometryhBMSCs (P1) from three BM were resuspended in phosphate
buffer containing 2% FBS with fluorescein isothiocyanate (FITC)-
or phycoerythrin (PE)-coupled antibodies against CD105 (Caltag
Laboratory, CA, USA), CD90, CD73, CD34 or CD45, or the
corresponding mouse IgG1 isotype (all from Becton Dickinson and
Company, Franklin Lakes, NJ, USA) for 15 min at RT. The cells
were washed and examined using a FACScan flow cytometer. The
data were analysed using the Cell Quest software (Becton,
Dickinson and Company). Positive expression was defined as
fluorescence greater than 95% of that of the corresponding
isotype-matched control antibodies.
Chondrogenic DifferentiationDifferentiations were performed at passage two. Chondrogenic
differentiation was performed in pellet culture using the Stempro
Chondrogenesis Differentiation Kit (Life technologies), as de-
scribed by manufacturer, with increasing doses of PTN. Briefly,
36105 hBMSC were seeded in V-bottomed wells and centrifu-
gated to form a pellet. Medium was removed and cells incubated
for three hours in a humidified atmosphere with 5% CO2 at 37uC.The pellet was detached by adding differentiation medium.
Medium was changed twice a week until analysis. On days 0, 7,
Table 1. Primer sequences.
Gene Primer sequence Accession number Product size
Housekeeping gene
Glyceraldehyde-3-phosphate forward 5’-TGC CTG ATG AGA CAG AGG TG-3’ NM_0020463 97
dehydrogenase (GAPDH) reverse 5’-TCC ACC TGG ACA GGA TTA GC-3’
Chondroblastic markers
SRY-box9 (Sox9) forward 5’-AGA CAG CCC CCT ATC GAC TT-3’ NM_000346.3 108
reverse 5’-CGG CAG GTA CTG GTC AAA CT-3’
Collagen 9A1 (col9) forward 5’-GCA GGT TTG CAT GAG AGT CA-3’ NM_078485.3 142
reverse 5’-TGG GAA ACC ATT CTC TCC AG-3’
Cartilage oligomeric matrix protein (COMP) forward 5’-ACA ATG ACG GAG TCC CTG AC-3’ NM_000095.2 115
reverse 5’-TCT GCA TCA AAG TCG TCC TG-3’
Proteoglycan core
Aggrecan (ACAN) forward 5’-AGG AGT CCC TGA CCT GGT TT-3’ NM_001135.3 108
reverse 5’-TTC AAC CAA ACT GGT GTC CA-3’
Biglycan (BGN) forward 5’-GGA CTC TGT CAC ACC CAC CT-3’ NM_001711.4 159
reverse 5’-AGC TCG GAG ATG TCG TTG TT-3’
Decorin (DCN) forward 5’-GGA CCG TTT CAA CAG AGA GG-3’ NM_133507.2 147
reverse 5’-GAC CAC TCG AAG ATG GCA TT-3’
Versican (VCAN) forward 5’-GGT GCA CTT TGT GAG CAA GA-3’ NM_001119808.1 159
reverse 5’-TTC GTG AGA CAG GAT GCT TG-3’
Hypertrophic markers
Alkaline phosphatase (ALP) forward 5’-CCA CGT CTT CAC ATT TGG TG-3’ NM_000478.4 96
reverse 5’-GCA GTG AAG GGC TTC TTG TC-3’
Matrix metalloproteinase 13 (MMP13) forward 5’-TTG AGC TGG ACT CAT TGT CG-3’ NM_002427.3 172
reverse 5’-GGA GCC TCT CAG TCA TGG AG-3’
Collagen 10A1 (col10) forward 5’-GCT AAG GGT GAA AGG GGT TC-3’ NM_000493.3 118
reverse 5’-CTC CAG GAT CAC CTT TTG GA-3’
PTN receptors
Anaplastic lymphoma forward 5’-GCC AGA AAC TGC CTC TTG AC-3’ NM_004304.4 90
receptor tyrosine kinase (ALK) reverse 5’-GCT CGC CCT GTA GAT GTC TC-3’
Protein tyrosine phosphatase forward 5’-CCC CAA CAA GAG GAA GTG AA-3’ NM_002851.2 80
receptor type z (PTPRz) reverse 5’-AGT GAC TGG TTG GGA AGT GG-3’
Syndecan 3 (SDC3) forward 5’-CCA GAG ACC TTC CTG ACC AC-3’ NM_014654.3 85
reverse 5’-CTT CTG GCA GCT CGA AGT CT-3’
doi:10.1371/journal.pone.0088287.t001
PTN Potentiates Chondrogenesis of hBMSC
PLOS ONE | www.plosone.org 3 February 2014 | Volume 9 | Issue 2 | e88287

14, pellets were lysed for RNA extraction. On day 14, pellets were
frozen to perform sulfated glycosaminoglycans (GAG) extraction
as previously described [27]. GAG quantification was conducted
using five pellets per condition for three patients, and normalized
by pellet volume. On day 21, pellets were fixed in 4%
formaldehyde for further histological analysis. The same chon-
drogenic differentiation protocol was applied in the presence of
15 mM Ly294002 (a potent inhibitor of PI3K; Sigma) or 100 ng/
ml P111-136 peptide (corresponding to the C-terminal domain of
PTN; LTKPKPQAESKKKKKEGKKQEKMLD; Altergen,
Schiltigheim, France) from day 0 to day 14. Chondrogenic
differentiation was assessed at days 14 and 21 by qRT-PCR
analysis and histological analysis respectively.
Quantitative Real-time Reverse Transcription–polymeraseChain Reaction (qRT-PCR)Total mRNA from chondroblastic cultures was isolated using
TRIzolH reagent (Life technologies) respectively, as described by
manufacturers. DNase (Promega, France)-treated RNA were
reverse transcribed with RT Superscript III (Life technologies),
cDNA real-time amplification was performed with FastStart
Universal SYBR Green Master (Rox; Roche, Meylan, France)
following the manufacturer’s instructions and monitored with the
ABI Prism 7500 Sequence Detection System (PerkinElmer/
Applied Biosystem, Rotkreuz, Switzerland). Primers (Table 1)
were designed by Primer3output software [28] and obtained from
Eurofins MWG (Huntsville, Germany). Primer efficiency between
95% and 100% was ensured. Results were normalized to GAPDH
(DCT=CTgene of interest -CTGAPDH) and are reported as relative
gene expression (2-DCT).
Histological AnalysisChondrogenic pellets were fixed in 4% formaldehyde (Sigma
Aldrich) and embedded in paraffin. Sections (3 mm) were stained
with Alcian blue 8GX and counterstained with hematoxylin (both
from Sigma Aldrich), or stained with alizarin red-S alone.
Immunohistochemical staining for collagen 2 (clone 6b3; Merck-
Millipore Saint-Quentin en Yveline, France) and collagen 10
(Sigma Aldrich) was carried out after antigen retrieval with boiling
citrate buffer for two minutes (Dako, Trappes, France) and
incubation with primary antibody (1/100) overnight at 4uC.Antibody detection was performed using a goat anti-mouse
multiHRP (MerckMillipore) and histogreen (Eurobio-Abcys, Les
Ulis, France), sections were counterstained with hematoxylin
(Sigma Aldrich).
Statistical AnalysisResults were expressed as mean of values 6 standard error
mean (SEM) from three independent patients with at least three to
five values per condition and per patient. Statistical analyses were
performed using a one-way ANOVA Kruskall-Wallis test
(GraphPad Software). Differences between groups with a p-value
of #0.05 were considered to be significant.
Figure 2. PTN increases cartilage specific protein and gene expression during hBMSC chondrogenic differentiation. hBMSC from 3independent patients were cultured in micromass with chondrogenic medium in absence or with increasing doses of PTN (0 pg/ml white boxes,50 pg/ml grey boxes and 500 pg/ml black boxes) for 21 days. All conditions were performed in triplicate per patient. (A): Collagen 2 immunostainingof chondrogenic pellets. Side box shows an enlargement (x3) of the black square. Bars represent 100 mm. (B): Real-time polymerase chain reactionanalysis of cartilage related genes expression. RNA were purified from hBMSC at day 0 and after 7 and 14 days of culture without or with PTN.Expression levels of cartilage genes: SRY-box9 (Sox9), Cartilage Oligomeric Matrix Protein (COMP) and Collagen9A1 (Col9) are normalized toGlyceraldehyde 3-Phosphate Dehydrogenase (GAPDH). Values are the mean6SEM. The gene expression values at day 0 are represented bystraightened lines. Statistical analysis were performed, with a one way anova Kruskal-Wallis test, between values from free-PTN conditions (whiteboxes) at day 0, 7 and 14 (##: p,0.01; ###: p,0.001), and between values from increasing PTN doses from the same day (**: p,0.01; ***: p,0.001).doi:10.1371/journal.pone.0088287.g002
PTN Potentiates Chondrogenesis of hBMSC
PLOS ONE | www.plosone.org 4 February 2014 | Volume 9 | Issue 2 | e88287

Results
Characterization of hBMSCBefore further analysis, hBMSC were analysed for mesenchy-
mal stromal cells surface markers and differentiation properties
(Figure 1). hBMSC are negative for CD45 and CD34 and positive
for CD105, CD90 and CD73 (Figure 1A). hBMSC are able to
differentiate towards osteoblastic phenotype (Figure 1B), adipocyte
lineage (Figure 1C) and chondrocytic lineage (Figure 1D).
PTN Potentiates Chondrogenic Differentiation of hBMSCChondrogenic potential of PTN was tested using hBMSC
cultured in pellets with chondroinductive medium (CM). Pellet
slices were immunostained for col2 at day 21 (Figure 2A). No
staining was observed in the presence of the secondary antibody
alone. In the absence of PTN, CM pellets showed a minimal
staining and same results were obtained on pellets treated with
50 pg/ml of PTN. Surprisingly pellets treated with 500 pg/ml
of PTN had strong col2 staining compared to other conditions.
Using microscopy at high magnification indicates chondrocytes
within a col2-rich extracellular matrix (Figure 2A). Chondro-
genic marker expression was further analyzed by qRT-PCR at
days 0, 7 and 14 (Figure 2C). Between day 0 and day 7 the
transcription of Sox9, COMP and col9 genes was not modified
in CM alone. Between day 7 and day 14, CM condition was
associated with an up regulation of Sox9 (8-fold) and COMP (3-
fold) expressions. PTN at 50 pg/ml had no significant effect on
chondrogenic gene expression as compared to CM alone. In
contrast, addition of 500 pg/ml of PTN induced a large
increase in the expression of Sox9 (600-fold), collagen 9 (160-
fold) and COMP (50-fold) at day 14, as compared to CM alone.
PTN Stimulates Proteoglycan Synthesis DuringChondrogenic Differentiation of hBMSCGAG synthesis is of major importance in cartilage by giving it
compressive strength and participating to organize collagen fibrils
[29]. We evaluated the effects of PTN on sulfated GAG amount in
hBMSC pellets by alcian blue staining at day 21. In the absence of
PTN, pellets showed little alcian blue staining. However, when
pellets were treated with PTN they were strongly stained,
(especially with the 500 pg/ml dose) indicating high GAG content.
When the pellets were viewed at high magnification, cells could be
seen in lacunae surrounded by GAG–rich extracellular matrix,
proving effective chondrogenic differentiation (Figure 3A). Quan-
tification of GAG content confirmed our histological observations
(Figure 3B) since PTN treated pellets (500 pg/ml) had a significant
two-fold increase in sGAG amount compared to CM alone. GAG
chains bind to protein cores within the ECM. The expression of
core proteins aggrecan (ACAN), decorin (DCN), versican (VCAN)
and biglycan (BGN) were assessed by qRT-PCR at days 0, 7 and
14. In the absence of PTN, CM significantly enhanced ACAN
expression at day 7 and DCN expression at day 14 whereas no
effects were observed on VCAN and BGN expression (Figure 3C).
ACAN expression was drastically decreased at day 14 in CM.
ACAN expression at day 7 was decreased, with both 50 pg/ml
and 500 pg/ml PTN treatments, whereas a clear induction of
Figure 3. PTN increases glycosaminoglycans content of chondrogenic induced hBMSC. hBMSC from 3 independent patients werecultured in micromass with chondrogenic medium in the absence or with increasing doses of PTN (0 pg/ml white boxes, 50 pg/ml grey boxes and500 pg/ml black boxes) for 21 days. All conditions were performed in triplicate per patient. (A): Alcian blue staining of sulfated GAGS in chondrogenicpellets. Side box shows an enlargement (x3) of the black square. Bars represent 100 mm. (B): Total sulfated GAGs quantification. After 14 days inmicromass culture, sulfated GAGs were extracted from pellets and quantified as previously described [27]. GAG amount was normalized according topellet volume and reported as mg of total GAGs per mm3. (C): Real-time polymerase chain reaction analysis of proteoglycan protein core-geneexpression. RNA were purified from hBMSC at day 0 and after 7 and 14 days of culture without or with PTN. Expression levels of proteoglycans coreexpression Aggrecan (ACAN), Biglycan (BGN), Decorin (DCN), Versican (VCAN) are related to Glyceraldehyde 3-Phosphate Dehydrogenase (GAPDH).Values are the mean6SEM. The gene expression values at day 0 are represented by straightened lines. Statistical analysis were performed, with a oneway anova Kruskal-Wallis test, between values from free-PTN conditions (white boxes) at day 0, 7 and 14 (###: p,0.001), and between values fromincreasing PTN doses from the same day (*: p,0.05; **: p,0.01; ***: p,0.001).doi:10.1371/journal.pone.0088287.g003
PTN Potentiates Chondrogenesis of hBMSC
PLOS ONE | www.plosone.org 5 February 2014 | Volume 9 | Issue 2 | e88287

expression was observed at day 14 as compared to CM alone. This
result suggests that PTN could be involved in modulation of
ACAN expression during chondrogenic differentiation. PTN
treatments induced an increase of DCN expression from day 7
to day 14. Compared to CM alone, PTN treatments significantly
augmented expression of VCAN at day 14. Finally, 500 pg/ml
PTN treatment strongly induced expression of BGN at day 14.
These data clearly indicate an inductive effect of PTN on
proteoglycan core expression during chondrogenic differentiation.
PTN Induces Hypertrophy in Chondro-induced hBMSCNext, we investigated the effects of PTN on the hypertrophic
differentiation of chondro-induced hBMSC. We stained pellets
with alizarin red-S (Figure 4A) and for col10 (Figure 4B) at day
21. Pellets treated with 500 pg/ml of PTN showed an intense
red staining with hot-spots around hypertrophic cells, whereas
the lower PTN dose (50 pg/ml) and CM medium alone, had
minimal staining (Figure 4A). Mineralizing cells were mainly
found at the edge of the pellet. Higher power magnification of
the alizarin red-S -positive area indicated that these cells may
be undergoing physiological hypertrophy because the cells were
larger in comparison with those around them. Furthermore,
pellets treated with 500 pg/ml of PTN showed an intense
staining for col10 whereas the two others conditions showed
only basal levels. Staining was not observed in the sole presence
of the secondary antibody (Figure 4B). We then analyzed
expression of hypertrophic markers by qRT-PCR on days 0, 7
and 14. MMP13 and col10 were not detected at day 0. CM
induced MMP13 and col10 expression by day 7 and day 14,
while ALP expression decreased during chondrogenic induction.
Figure 4. PTN induces hypertrophic differentiation of hBMSC. hBMSC from 3 independent patients were cultured in micromass withchondrogenic medium in absence or with increasing doses of PTN (0 pg/ml white boxes, 50 pg/ml grey boxes and 500 pg/ml black boxes) for 21days. All conditions were performed in triplicate per patient. (A): Alizarin red staining of chondrogenic pellets. (B): Collagen10 immunostaining ofchondrogenic pellets. Side box shows an enlargement (x3) of the black square. Bars represent 100 mm. (C): Real-time polymerase chain reactionanalysis of hypertrophic related genes expression. RNA were purified from hBMSC at day 0 and cultured without or with PTN at day 7 and 14.Expression levels of hypertrophic genes Matrix Metalloprotease 13 (MMP13), Collagen 10A1 (Col10) and Alkaline Phosphatase (ALP) are related toGlyceraldehyde 3-Phosphate Dehydrogenase (GAPDH). Values are the mean6SEM. The gene expression values at day 0 are represented bystraightened lines when they are different of 0. Statistical analysis were performed, with a one way anova Kruskal-Wallis test, between values fromfree-PTN conditions (white boxes) at day 0, 7 and 14 (##: p,0.01; ###: p,0.001) and between values from increasing PTN doses from the sameday (*: p,0.05; **: p,0.01).doi:10.1371/journal.pone.0088287.g004
PTN Potentiates Chondrogenesis of hBMSC
PLOS ONE | www.plosone.org 6 February 2014 | Volume 9 | Issue 2 | e88287

We observed that whereas 50 pg/ml of PTN had no effect as
compared to CM alone, 500 pg/ml of PTN strongly increased
expression of MMP13 (60-fold) and col10 (15-fold) at day 14 as
compared to CM alone. Moreover, ALP expression was induced
at day 14 by PTN treatment at 500 pg/ml (Figure 4C). These
data clearly show an inductive effect of PTN on the
commitment of hBMSC toward a hypertrophic state.
The Expression of PTN Receptors are Modulated duringChondrogenic DifferentiationAs we had shown that PTN plays a role in chondrogenic
hypertrophic differentiation of hBMSC, we investigated the
expression profiles of PTN receptors by qRT-PCR analysis during
hBMSC chondrogenic differentiation. The three receptors are
expressed in hBMSC before differentiation, with a higher gene
expression of SDC3 compared to PTPRz and ALK (Figure 5A).
We then analyzed their expression patterns during chondroinduc-
tion of hBMSC in CM conditions. Whereas ALK expression was
not modulated during chondrocytic differentiation in the absence
of PTN, its expression was strongly and transiently induced at day
7 by the 500 pg/ml dose of PTN. In contrast, PTPRz expression
was induced by CM treatment at day 14 and no significant
modulation was observed with 500 pg/ml of PTN. Surprisingly
PTPRz expression was prematurely induced at day 7 with 50 pg/
ml of PTN but did not increase at day 14. Finally, SDC3
expression was down regulated during chondroinduction at day 7
and 14 but was strongly up regulated by PTN treatments with a
significant increase for 500 pg/ml at day 14. Our data indicate the
presence of the three known PTN receptors on hBMSC and the
modulation of their expression during hBMSC chondrogenesis.
The Chondroinductive Effects PTN are Dependent onPTN Receptor and Pi3K SignalingReceptors ALK and PTPRz have previously been shown to
activate the PI3K pathway [9,30], which is involved in chondro-
cyte hypertrophy [31]. However, there is currently no link
between ALK or PTPRz and chondrocyte hypertrophy. We
investigated the implication of these receptors by using a peptide
corresponding to PTN C-terminal domain (P111-136), as a
competitive inhibitor for PTN signaling through ALK and
PTPRz. Involvement of the PI3K pathway in the PTN-induced
hypertrophy was also tested using Ly294002, a potent inhibitor of
PI3K.
We cultured hBMSC under chondrogenic conditions, with
PTN at 500 pg/ml or vehicle (DMSO) in the presence or absence
of the inhibitors. Treatment with DMSO did not modify the effect
of PTN on the expression of hypertrophy-related genes (Figure 6A
and 4C). In the absence of PTN, P111-136 and Ly294002 did not
modify the expression of these genes. However, in the presence of
PTN, both P111-136 and Ly294002 treatments resulted in a
return to the baseline expression of MMP13, col10 and ALP. As
previously described, PTN induced a higher accumulation of col10
in the ECM, mainly at the edge of the pellet (Figure 6B and 4B).
However, Ly294002 and P111-136 treatments resulted in a
decreased col10 immunostaining in presence of exogenous PTN,
and surprisingly also in its absence (Figure 6B). These data indicate
that chondrogenic induction by PTN passes at least in part
through ALK and PTPRz and further PI3K activation.
Discussion
Bone formation and repair can be obtained by a direct
intramembraneous bone formation or by an endochondral
formation, involving a cartilage template prior to ossification.
These processes involve complex extracellular matrix protein
deposition and growth factor expression. Among them PTN is a
heparin-binding growth factor expressed in the growth plate of
mice during pre-natal and post-natal bone formation. Its
expression is down regulated during adulthood but is induced in
the callus during bone healing [17,32]. Moreover, human patients
with fracture union showed higher seric levels of PTN than
patients with delayed union [33]. We hypothesized here that PTN
effect in bone could be due in part to its activity on chondrogenic
differentiation during endochondral bone formation. We then
decided to test the effect of PTN during chondroblastic
differentiation of hBMSC.
Figure 5. PTN receptors are expressed on undifferentiated hBMSC and PTN modulates their expression during chondrogenicdifferentiation. hBMSC from 3 independent patients were cultured in micromass with chondrogenic medium in absence or with increasing dosesof PTN (0 pg/ml white boxes, 50 pg/ml grey boxes and 500 pg/ml black boxes). All conditions were performed in triplicate per patient. (A): Real-timepolymerase chain reaction analysis of PTN receptors genes expression before differentiation induction. Expression levels of Anaplastic Lymphomareceptor tyrosine Kinase (ALK), Protein Tyrosine Phosphatase Receptor type z (PTPRz) and Syndecan3 (SDC3) are related to Glyceraldehyde 3-Phosphate DeHydrogenase (GAPDH). (B): Real-time polymerase chain reaction analysis of PTN receptors genes on hBMSC during chondrogenicdifferentiation at days 7 and 14. Values are the mean6SEM. The gene expression values at day 0 are represented by straightened lines. Statisticalanalysis were performed, with a one way anova Kruskal-Wallis test, between values from free-PTN conditions (white boxes) at day 0, 7 and 14 (##:p,0.01; ###: p,0.001), and between values from increasing PTN doses from the same day (**: p,0.01).doi:10.1371/journal.pone.0088287.g005
PTN Potentiates Chondrogenesis of hBMSC
PLOS ONE | www.plosone.org 7 February 2014 | Volume 9 | Issue 2 | e88287

We show that higher doses of PTN (500 pg/ml) enhances the
expression of cartilage specific protein (Sox9, col2, col9 and
COMP), proteoglycan core (BGN, DCN and VCAN) and GAG
synthesis during chondrogenic differentiation of hBMSC. Previous
data had already indicated that PTN potentiates late chondrogenic
marker expression such as col2 and modulates GAG synthesis and
expression of proteoglycan core proteins such as BGC and ACAN
[19]. However, these data were obtained using mature chondro-
cytes from articular cartilage whereas our results indicate for the
first time that PTN can have a chondrogenic differentiation
potential even on immature adult hBMSC.
Previous studies indicated that the PTN protein is present in
hypertrophic zone of growth plate and callus in mice, rat and
chicken [16,17,32], expressed by chondroblasts and osteoblasts.
Our results demonstrate that PTN enhances hypertrophic markers
expression such as MMP13, col10 and ALP during chondrogenic
differentiation of hBMSC. This suggests that PTN is involved in
chondrocytic hypertrophy, a key step of endochondral bone
formation [2]. It remains to be elucidated if PTN acts alone to
induce hypertrophy or if it mediates hypertrophy through
interactions with other growth factors such as TGF b or BMP
that were previously described as inducers of chondrogenesis and
to act synergistically with PTN [1,34].
Previous results obtained by Tapp and colleagues showed that
PTN inhibits mature chondrocytes proliferation in vitro [19]. As we
showed that PTN induces chondrogenic hypertrophy of hBMSC,
we hypothesize that the growth retardation observed in PTN over-
expressing mice [23] could be due to chondrocytes leaving the
proliferating zone and becoming prematurely hypertrophic.
Surprisingly, the absence of PTN also results in growth retardation
in young PTN-knockout mice [25]. As we showed that PTN
induces chondrocytic hypertrophy, this could be explained by a
reduced hypertrophy of chondrocytes in PTN knock out mice.
The analysis of the gene expression profiles of PTN receptors
indicates that the three known receptors ALK, PTPRz and SDC3
are expressed by hBMSC. SDC3 has the higher expression
Figure 6. PTN chondroinductive effects are inhibited by inhibitors of PTN receptors and Pi3K. hBMSC were cultured in micromass withchondrogenic medium with 0 pg/ml or 500 pg/ml of PTN with or without Ly294002 (15 mM) or p111-136 peptide (100 ng/ml). All conditions wereperformed in triplicate. (A): Real-time polymerase chain reaction analysis of late chondrogenic marker genes after 14 days of treatment. Expressionlevels of Matrix Metalloprotease 13 (MMP13), Collagen 10A1 (Col10) and Alkaline Phosphatase (ALP) are related to Glyceraldehyde 3-PhosphateDehydrogenase (GAPDH). Values are the mean6SEM. Statistical analysis were performed, with a one way anova Kruskal-Wallis test between DMSOtreated and Ly294002 or P111-136 treated hBMSC (*: p,0.05; ***: p,0.001). (B): Collagen10 immunostaining of chondrogenic pellets. Side box showsan enlargement (x3) of the black square. Bars represent 100mm.doi:10.1371/journal.pone.0088287.g006
PTN Potentiates Chondrogenesis of hBMSC
PLOS ONE | www.plosone.org 8 February 2014 | Volume 9 | Issue 2 | e88287

compared to PTPRz and ALK that are very low in these
undifferentiated cells. As Seghatoleslami et al. have previously
showed that blocking SDC3 with an antibody inhibits chondro-
genic differentiation [35], we can hypothesize that the chondro-
genic differentiation of hBMSC observed after PTN addition is
mediated in part through SDC3 signalling. PTN is expressed in
the callus [32]. As SDC3 has also been shown to be involved in
osteoblasts migration [18], the expression of SDC3 by hBMSC
could allow them to be recruited on site via the PTN/SDC3
pathway where they can play a role in callus formation [4].
Chondrogenic differentiation of hBMSC was associated with an
up-regulation of PTPRz and a down-regulation of SDC3, whereas
ALK expression was not induced. This shows that these two
proteoglycans are modulated during chondrogenesis and may play
a role in this commitment. PTPRz has already been involved in
bone growth through its expression by osteoblasts [36], however
no data are available on its link with chondrogenesis. hBMSC
chondrogenic differentiation is associated with an up-regulation of
PTPRz expression. PTPRz is a constitutive phosphatase involved
in activation of the b-catenin pathway [37]. As b -catenin is
essential for cartilage and bone development [38], it would be of
interest to test if PTPRz regulation could be involved in
chondrogenic differentiation through the b-catenin pathway.
The specific induction of ALK and SDC3 by PTN in the
chondrogenic medium may suggest their involvement on the
hBMSC hypertrophic commitment. Increased expression of ALK
associated to its activation by PTN ligand could allow PI3K/Akt
pathway activation [9], which is involved in chondrocyte
hypertrophy and ECM mineralization [31,39]. PTPRz expression
is not modulated by PTN, nevertheless its interaction with PTN
inhibits its phosphatase activity [40] which may increase
phosphorylation level of ALK and PI3K/Akt pathway activation.
We can hypothesize that during chondrogenic differentiation,
PTPRz and ALK activities are in balance for controlling
chondrogenic and hypertrophic phenotypes. The inhibition of
PTN effect on hypertrophic differentiation by the P111-136
peptide and Ly294002 indicates that PTN effects pass at least
through ALK or PTPRz, and PI3K activation. In the absence of
exogenous PTN, these two inhibitors also had an inhibitory effect
on a basal col10 protein accumulation. This suggests that during
chondrogenic differentiation hBMSC could start to synthesize
PTN that could have induced col10 synthesis. These data suggest
that adding exogenous PTN at the beginning of the culture
enhanced the chondroinduction and accelerates the differentiation
toward hypertrophic state, whereas in absence of exogenous PTN,
hypertrophic differentiation will appear later mainly because of
endogenous PTN synthesis.
Finally, it has been shown that SDC3 is expressed by
hypertrophic chondrocytes in growth plate and during osteoar-
thritis [41], however, its role is not known in these processes. As
SDC3 was involved in cytoskeleton organization through the Src/
cortactin pathway [42], it will be of interest to study this pathway
in chondrocyte shape control during hypertrophy induction.
Conclusion
Our findings show that PTN treatment potentiates chondro-
genic differentiation of hBMSC and induces their hypertrophy
highlighting a new role of PTN in bone metabolism. This new
PTN effect could be an important cue in the shift of chondrocytes
toward hypertrophy observed in the callus during bone regener-
ation. The angiogenic role of PTN may be an additional
advantage in producing a physiological repair in bone lesion
using a scaffold containing PTN and hBMSC.
Acknowledgments
Authors want to acknowledge Dr. Phillip Newton from Karolinska Institute
for proof reading.
Author Contributions
Conceived and designed the experiments: TB PA NC. Performed the
experiments: TB EH AL GF. Analyzed the data: TB PA NC. Contributed
reagents/materials/analysis tools: PA NC JC HR PB. Wrote the paper: TB
PA NC.
References
1. Schindeler A, McDonald MM, Bokko P, Little DG (2008) Bone remodelingduring fracture repair: The cellular picture. Semin Cell Dev Biol 19: 459–466.
2. Olsen BR, Reginato AM, Wang W (2000) Bone development. Annu Rev CellDev Biol 16: 191–220.
3. Wilson S, Hashamiyan S, Clarke L, Saftig P, Mort J, et al. (2009)
Glycosaminoglycan-mediated loss of cathepsin K collagenolytic activity inMPS I contributes to osteoclast and growth plate abnormalities. Am J Pathol
175: 2053–2062.
4. Bielby R, Jones E, McGonagle D (2007) The role of mesenchymal stem cells in
maintenance and repair of bone. Injury 38 Suppl 1: S26–32.
5. Schipani E, Kronenberg HM (2008) Adult mesenchymal stem cells.
6. Courty J, Dauchel MC, Caruelle D, Perderiset M, Barritault D (1991) Mitogenicproperties of a new endothelial cell growth factor related to pleiotrophin.
Biochem Biophys Res Commun 180: 145–151.
7. Merenmies J, Rauvala H (1990) Molecular cloning of the 18-kDa growth-
associated protein of developing brain. J Biol Chem 265: 16721–16724.
8. Tezuka K, Takeshita S, Hakeda Y, Kumegawa M, Kikuno R, et al. (1990)Isolation of mouse and human cDNA clones encoding a protein expressed
specifically in osteoblasts and brain tissues. Biochem Biophys Res Commun 173:
246–251.
9. Stoica GE, Kuo A, Powers C, Bowden ET, Sale EB, et al. (2002) Midkine bindsto anaplastic lymphoma kinase (ALK) and acts as a growth factor for different
cell types. J Biol Chem 277: 35990–35998.
10. Raulo E, Chernousov MA, Carey DJ, Nolo R, Rauvala H (1994) Isolation of a
neuronal cell surface receptor of heparin binding growth-associated molecule(HB-GAM). Identification as N-syndecan (syndecan-3). J Biol Chem 269:
12999–13004.
11. Maeda N, Nishiwaki T, Shintani T, Hamanaka H, Noda M (1996) 6B4proteoglycan/phosphacan, an extracellular variant of receptor-like protein-
tyrosine phosphatase zeta/RPTPbeta, binds pleiotrophin/heparin-binding
growth-associated molecule (HB-GAM). J Biol Chem 271: 21446–21452.
12. Mitsiadis TA, Salmivirta M, Muramatsu T, Muramatsu H, Rauvala H, et al.
(1995) Expression of the heparin-binding cytokines, midkine (MK) and HB-GAM (pleiotrophin) is associated with epithelial-mesenchymal interactions
during fetal development and organogenesis. Development 121: 37–51.
13. Vanderwinden JM, Mailleux P, Schiffmann SN, Vanderhaeghen JJ (1992)
Cellular distribution of the new growth factor pleiotrophin (HB-GAM) mRNAin developing and adult rat tissues. Anat Embryol (Berl) 186: 387–406.
14. Rauvala H (1989) An 18-kd heparin-binding protein of developing brain that isdistinct from fibroblast growth factors. EMBO J 8: 2933–2941.
15. Perez-Pinera P, Berenson JR, Deuel TF (2008) Pleiotrophin, a multifunctionalangiogenic factor: mechanisms and pathways in normal and pathological
angiogenesis. Curr Opin Hematol 15: 210–214.
16. Dreyfus J, Brunet-de Carvalho N, Duprez D, Raulais D, Vigny M (1998) HB-
GAM/pleiotrophin: localization of mRNA and protein in the chickendeveloping leg. Int J Dev Biol 42: 189–198.
17. Petersen W, Rafii M (2001) Immunolocalization of the angiogenetic factorpleiotrophin (PTN) in the growth plate of mice. Arch Orthop Trauma Surg 121:
414–416.
18. Imai S, Kaksonen M, Raulo E, Kinnunen T, Fages C, et al. (1998) Osteoblast
recruitment and bone formation enhanced by cell matrix-associated heparin-binding growth-associated molecule (HB-GAM). J Cell Biol 143: 1113–1128.
19. Tapp H, Hernandez DJ, Neame PJ, Koob TJ (1999) Pleiotrophin inhibitschondrocyte proliferation and stimulates proteoglycan synthesis in mature
bovine cartilage. Matrix Biol 18: 543–556.
20. Dreyfus J, Brunet-de Carvalho N, Duprez D, Raulais D, Vigny M (1998) HB-
GAM/pleiotrophin but not RIHB/midkine enhances chondrogenesis inmicromass culture. Exp Cell Res 241: 171–180.
21. Yang X, Tare RS, Partridge KA, Roach HI, Clarke NM, et al. (2003) Inductionof human osteoprogenitor chemotaxis, proliferation, differentiation, and bone
formation by osteoblast stimulating factor-1/pleiotrophin: osteoconductive
biomimetic scaffolds for tissue engineering. J Bone Miner Res 18: 47–57.
PTN Potentiates Chondrogenesis of hBMSC
PLOS ONE | www.plosone.org 9 February 2014 | Volume 9 | Issue 2 | e88287

22. Tare RS, Oreffo RO, Clarke NM, Roach HI (2002) Pleiotrophin/Osteoblast-
stimulating factor 1: dissecting its diverse functions in bone formation. J BoneMiner Res 17: 2009–2020.
23. Tare RS, Oreffo RO, Sato K, Rauvala H, Clarke NM, et al. (2002) Effects of
targeted overexpression of pleiotrophin on postnatal bone development.Biochem Biophys Res Commun 298: 324–332.
24. Lehmann W, Schinke T, Schilling AF, Catala-Lehnen P, Gebauer M, et al.(2004) Absence of mouse pleiotrophin does not affect bone formation in vivo.
Bone 35: 1247–1255.
25. Imai S, Heino TJ, Hienola A, Kurata K, Buki K, et al. (2009) Osteocyte-derivedHB-GAM (pleiotrophin) is associated with bone formation and mechanical
loading. Bone 44: 785–794.26. Chevallier N, Anagnostou F, Zilber S, Bodivit G, Maurin S, et al. (2010)
Osteoblastic differentiation of human mesenchymal stem cells with plateletlysate. Biomaterials 31: 270–278.
27. Barbosa I, Garcia S, Barbier-Chassefiere V, Caruelle JP, Martelly I, et al. (2003)
Improved and simple micro assay for sulfated glycosaminoglycans quantificationin biological extracts and its use in skin and muscle tissue studies. Glycobiology
13: 647–653.28. Rozen S, Skaletsky H (2000) Primer3 on the WWW for general users and for
biologist programmers. Methods Mol Biol 132: 365–386.
29. Knudson CB, Knudson W (2001) Cartilage proteoglycans. Semin Cell Dev Biol12: 69–78.
30. Polykratis A, Katsoris P, Courty J, Papadimitriou E (2005) Characterization ofheparin affin regulatory peptide signaling in human endothelial cells. J Biol
Chem 280: 22454–22461.31. Ikegami D, Akiyama H, Suzuki A, Nakamura T, Nakano T, et al. (2011) Sox9
sustains chondrocyte survival and hypertrophy in part through Pik3ca-Akt
pathways. Development 138: 1507–1519.32. Petersen W, Wildemann B, Pufe T, Raschke M, Schmidmaier G (2004) The
angiogenic peptide pleiotrophin (PTN/HB-GAM) is expressed in fracturehealing: an immunohistochemical study in rats. Arch Orthop Trauma Surg 124:
603–607.
33. Weiss S, Zimmermann G, Pufe T, Varoga D, Henle P (2009) The systemic
angiogenic response during bone healing. Arch Orthop Trauma Surg 129: 989–
997.
34. Sato Y, Takita H, Ohata N, Tamura M, Kuboki Y (2002) Pleiotrophin regulates
bone morphogenetic protein (BMP)-induced ectopic osteogenesis. J Biochem
131: 877–886.
35. Seghatoleslami MR, Kosher RA (1996) Inhibition of in vitro limb cartilage
differentiation by syndecan-3 antibodies. Dev Dyn 207: 114–119.
36. Schinke T, Gebauer M, Schilling AF, Lamprianou S, Priemel M, et al. (2008)
The protein tyrosine phosphatase Rptpzeta is expressed in differentiated
osteoblasts and affects bone formation in mice. Bone 42: 524–534.
37. Meng K, Rodriguez-Pena A, Dimitrov T, Chen W, Yamin M, et al. (2000)
Pleiotrophin signals increased tyrosine phosphorylation of beta beta-catenin
through inactivation of the intrinsic catalytic activity of the receptor-type protein
tyrosine phosphatase beta/zeta. Proc Natl Acad Sci U S A 97: 2603–2608.
38. Chen M, Zhu M, Awad H, Li TF, Sheu TJ, et al. (2008) Inhibition of beta-
catenin signaling causes defects in postnatal cartilage development. J Cell Sci
121: 1455–1465.
39. Fukai A, Kawamura N, Saito T, Oshima Y, Ikeda T, et al. (2010) Akt1 in
murine chondrocytes controls cartilage calcification during endochondral
ossification under physiologic and pathologic conditions. Arthritis Rheum 62:
826–836.
40. Perez-Pinera P, Zhang W, Chang Y, Vega JA, Deuel TF (2007) Anaplastic
lymphoma kinase is activated through the pleiotrophin/receptor protein-
tyrosine phosphatase beta/zeta signaling pathway: an alternative mechanism
of receptor tyrosine kinase activation. J Biol Chem 282: 28683–28690.
41. Pfander D, Swoboda B, Kirsch T (2001) Expression of early and late
differentiation markers (proliferating cell nuclear antigen, syndecan-3, annexin
VI, and alkaline phosphatase) by human osteoarthritic chondrocytes. Am J Pathol
159: 1777–1783.
42. Couchman JR (2010) Transmembrane signaling proteoglycans. Annu Rev Cell
Dev Biol 26: 89–114.
PTN Potentiates Chondrogenesis of hBMSC
PLOS ONE | www.plosone.org 10 February 2014 | Volume 9 | Issue 2 | e88287