playground physics impact study
TRANSCRIPT

Enhancing Middle School Science Lessons With Playground Activities: A Study of the Impact of Playground Physics
Lawrence B. Friedman, PhD
Jonathan Margolin, PhD
Andrew Swanlund, PhD
Sonica Dhillon
Feng Liu, PhD
APRIL 2017


Enhancing Middle School Science Lessons With Playground Activities: A Study of the Impact of Playground Physics
April 2017
Lawrence B. Friedman, PhD
Jonathan Margolin, PhD
Andrew Swanlund, PhD
Sonica Dhillon
Feng Liu, PhD
1000 Thomas Jefferson Street NW Washington, DC 20007-3835 202.403.5000
www.air.org
Copyright © 2017 American Institutes for Research. All rights reserved.
This research project was support by grant #U411C110310 from the U.S. Department of Education’s Office of Innovation and Improvement. 0994_04/17


Contents Page
Executive Summary ......................................................................................................................... i Student Outcomes ........................................................................................................................ i Program Fidelity of Implementation and Use.............................................................................. i Conclusions................................................................................................................................. ii
Chapter 1: Introduction ................................................................................................................... 1
Playground Physics Program...................................................................................................... 1
Research Questions and Study Design ....................................................................................... 6
Chapter 2: Study Design, Sample, and Data Sources ..................................................................... 7
Sample ........................................................................................................................................ 7
Data Sources ............................................................................................................................. 13
Key Program Components and Criteria for Fidelity of Implementation .................................. 17
Chapter 3: Student Outcomes ....................................................................................................... 19
Baseline Equivalence................................................................................................................ 19
Playground Physics Impact on Students................................................................................... 20
Does the Effect of Playground Physics Differ as a Function of Gender or Ethnicity?............. 23
Summary of Student Outcomes and Limitations...................................................................... 23
Chapter 4: Implementation of Playground Physics and Its Relationship to Student Outcomes ...................................................................................................................................... 24
To what extent were Playground Physics components implemented with fidelity? ................ 24
How extensively did teachers use Playground Physics to teach physics? ................................ 26
Summary of Fidelity of Implementation and Relationship to Student Outcomes.................... 29
Chapter 5: Discussion ................................................................................................................... 30
Playground Physics Promotes Greater Knowledge and Understanding of Physics Concepts.................................................................................................................................... 30
Playground Physics Was Not Associated With Differences in Engagement or Attitudes ....... 31
References..................................................................................................................................... 33
Appendix A. Playground Physics Curriculum Activities............................................................... A-1
Appendix B. Student Outcome Measures................................................................................... B-1
Appendix C. Teacher Survey...................................................................................................... C-1

Appendix D. Impact Analysis Technical Approach ................................................................... D-1
Appendix E. Output from Statistical Models...............................................................................E-1
Appendix F. Knowledge Assessment Responses and Standards Alignment...............................F-1
Appendix G. 2014–15 Fidelity of Implementation Analysis...................................................... G-1
Appendix H. Supplemental Analysis.......................................................................................... H-1

Executive Summary Playground Physics is a technology-based application and accompanying curriculum designed by New York Hall of Science (NYSCI) to support middle school students’ science engagement and learning of force, energy, and motion. The program includes professional development, the Playground Physics app, and a curriculum aligned with New York State Learning Standards, Common Core State Standards, and Next Generation Science Standards. The iOS app allows students to record and review videos through three “lenses”: motion, force (Newton’s third law), and energy, and the curriculum integrates informal and formal, inquiry-based learning strategies to promote greater student knowledge and understanding of physics. The program was designed to be implemented in a formal school setting during the regular school day.
This report describes the results of an experimental study of the Playground Physics program’s impact on learning of physics concepts, student engagement, and science-related attitudes. Sixty New York City middle grade teachers were randomly assigned to treatment or control conditions. Treatment teachers were asked to participate in Playground Physics professional development and use Playground Physics as part of their physics instruction during the 2015–16 academic year; control teachers were asked to use their regular instruction. In total, 15 teachers left the study. The final sample included student data from 24 treatment teachers and 21 control teachers.
Student Outcomes
Student knowledge of physics concepts, engagement in science class, and science-related attitudes were measured at two points in time: once prior to teacher implementation of Playground Physics (fall 2015) and once after teacher completion of physics instruction (winter/spring 2016). Students completed a knowledge assessment comprising 20 multiple-choice questions aligned to four New York science standards related to the content covered in the Playground Physics program. Students also completed a survey containing groups of items that addressed engagement in science class and the following constructs of science-related attitudes: interest in science, science self-concept, intrinsic motivation, and educational and career plans relevant to science.
A two-level hierarchical linear model with students nested within teachers was employed to examine differences in these outcomes between students of teachers who used Playground Physics as part of their physics instruction and those who did not. Means and differences were regression adjusted to account for student grade level, demographic characteristics, and performance on pretest measures, as well as teacher years of instructional experience. Impact results for each outcome measure were calculated separately. Students of treatment teachers showed significantly greater physics knowledge at posttest than students of control teachers. No differences were noted for student engagement in science class or the four constructs of science-related attitudes. Teachers in the two conditions did not differ with respect to the total number of days spent teaching these physics topics, indicating that the Playground Physics curriculum was more efficient than the business-as-usual curriculum.
Program Fidelity of Implementation and Use
The analysis of fidelity of implementation examined the extent to which program developers and participating teachers implemented the Playground Physics program as intended. NYSCI identified three critical components for fidelity of implementation: teacher attendance at
American Institutes for Research Enhancing Middle School Science Lessons With Playground Activities—i

professional development, receipt of curriculum materials, and classroom use of the Playground Physics curriculum. The latter was defined as implementing two of three units for at least 160 minutes each (although two partial lessons could be combined to count as one lesson). During the 2015–16 academic year, Playground Physics met the fidelity criteria, as expressed as a percentage of teachers, for each component.
Beyond the question of fidelity, several patterns in classroom implementation provided context for interpreting findings about student outcomes. First, teachers spent the most time, on average, on the motion unit than on either of the other two units. It is unlikely that this emphasis is driving the observed impact on physics knowledge because descriptive findings (i.e., percentage correct) do not indicate a greater advantage of treatment students for the topic motion. Second, treatment teachers did not spend a significantly greater amount of time addressing the three physics topics than control teachers. Therefore, it is unlikely that the observed impact on physics knowledge is explained by differences in instructional time devoted to physics instruction. Finally, treatment teachers, on average, used Playground Physics for the majority of their motion, force, and energy instructional time. In summary, the finding of implementation fidelity across key components, along with the absence of a difference between conditions in instructional time, supports the conclusion that the Playground Physics program had an impact on students’ physics knowledge.
Conclusions
Playground Physics appears to be effective for improving the physics learning outcomes of middle school students. Possible explanations for this finding include greater student engagement (despite the absence of group differences on a student-reported measure), better alignment to the standards upon which the outcome measures were based, and more vivid and intuitively understandable depictions of the concepts being taught. This finding of impact on student knowledge should be interpreted with caution. Because of differential attrition of teachers from the sample, statistical adjustment was required to satisfy baseline equivalence, and it is possible that differences between the groups could exist and are unaccounted for in the analytic model. Furthermore, the study was conducted in a single school district. It is possible that the impact of Playground Physics would not generalize to other districts (where other science curricula are used) or to other student populations.
There were no differences between treatment and control students with respect to their self-reported levels of engagement. The retrospective survey may not have been sensitive to differences in affect experienced several days prior to the survey. Similarly, no differences were noted between groups with respect to intrinsic motivation, interest in science, science self-concept, and educational aspirations in science. The duration of the curriculum unit may not have been great enough to have influenced these attitudes. Also, given the high proportion of students who rated themselves highly on these constructs, it is possible that the measures were not sensitive to small but important group differences.
Playground Physics was not designed to be a stand-alone curriculum, and teachers varied considerably in the extent to which they incorporated their regular curriculum in their Physics units. This suggests that the effect of Playground Physics is robust to variations in implementation. More study is needed to determine whether different approaches to implementing Playground Physics are equally efficacious.
American Institutes for Research Enhancing Middle School Science Lessons With Playground Activities—ii

Chapter 1: Introduction The National Action Plan for Addressing the Critical Needs of the U.S. Science, Technology, Engineering, and Mathematics Education System (National Science Board, 2007) calls for better integration of informal and formal science education. This is a prominent objective in the President's Council of Advisors on Science and Technology (PCAST) report on K–12 STEM Education for America’s Future (PCAST, 2010). The PCAST report also suggests that “every middle school and high school should have a partner in a science, technology, engineering, or mathematics (STEM) field, such as a research organization, college, university, museum, zoo, aquaria [sic], or company…” (p. 102). Both formal and informal science education have their limitations. Formal science education engages only a small percentage of students and has been less successful for low-income and female students or students from ethnic or racial groups underrepresented in science and engineering careers (Atwater, Wiggins, & Gardner, 1995; Brickhouse, 1994; Kahle & Meece, 1994). Informal science environments are acknowledged to be less effective in building the kind of formalized science knowledge that is the goal of schooling, especially without the time, sequencing, and consistency necessary for learners to develop systematically deep conceptual understanding (Bevan, Dillon, Hein, Macdonald, Michalchik, et al., 2010; DeWitt & Storksdieck, 2008).
To retain more and more diverse students in the STEM pipeline, we need better ways of combining elements from both informal and formal science learning environments to support student improvement in their science affect and learning. To this end, the Sara Lee Schupf Family Center for Play, Science, and Technology Learning (SciPlay) at the New York Hall of Science (NYSCI), in partnership with the American Institutes for Research (AIR) and New York City Department of Education, is working to bring students’ physical play experiences from playgrounds into formal classrooms. Awarded an i3 grant in 2011, the Playground Physics project focused on underserved and underrepresented middle school students across New York City. The goal of the project was to leverage students’ physical play to increase student engagement with physics and understanding of complex physics concepts: motion, force, and energy. The resulting Playground Physics app visually links children’s actual physical play to abstract physics representations. The app platform provides space for iterative exploration of their movement, encourages collaboration, and supports scientific argumentation. This report describes the results of an experimental study about the impact of the Playground Physics program on physics knowledge and science-related affect.
Playground Physics Program
The Playground Physics curriculum integrates the elements of informal learning that promote student engagement—such as play and unstructured exploration—and elements of formal learning that lead to greater knowledge and understanding of scientific concepts, such as opportunities for student inquiry (Kanter & Konstantopoulus, 2010). Informal science environments have been shown to have a positive impact on aspects of students’ science affect, including intrinsic motivation (Bell, Lewenstein, Shouse, & Feder, 2009; Zuckerman, Porac, Lathin, Smith, & Deci, 1978) and engagement (Tisdal, 2004). Inquiry-based lessons in formal science classrooms have been shown to help students address alternative conceptions and improve their understanding of, and ability to use, scientific principles (Kanter, 2010; Kanter &
American Institutes for Research Enhancing Middle School Science Lessons With Playground Activities—1

Schreck, 2006; Kolodner et al., 2003; Krajcik, McNeill, & Reiser, 2008; Linn, Bell, & Davis, 2004; Marx, Blumenfeld, Krajcik, Fishman, Soloway, Geier, & Tal, 2004; Rivet & Krajcik, 2004; Schneider, 2002). As depicted under outcomes in Figure 1.1, NYSCI hypothesize that following NYSCI provision of resources and teacher implementation of Playground Physics, greater engagement in science lessons, combined with greater knowledge and understanding of physics concepts, will promote more positive attitudes toward science. These include improved academic self-concept related to science and greater interest in pursuing academic and career opportunities in science. Past research has shown that these science-related attitudes are predictive of selection of science-oriented college majors (Ing & Nylund-Gibson, 2013; Maltese & Tai, 2011).
Figure 1.1. Playground Physics Logic Model
American Institutes for Research Enhancing Middle School Science Lessons With Playground Activities—2

The Playground Physics curriculum highlights the principles of physics that are present in different types of playground experiences. The curriculum makes play the focus of learning and uses a series of structured lessons to present the physics concepts in a formal way. Playground Physics includes an app developed by NYSCI as part of its suite of Digital Noticing Tools™. The iOS-based Playground Physics app allows students to record videos of each other engaging in playground-type play and then to review these videos through three different lenses designed to highlight the physics principles of motion, force (Newton’s third law), and energy (respectively). An activity guide aligned with New York State Learning Standards, Common Core State Standards, and Next Generation Science Standards plus professional development workshops designed for middle school teachers were developed to support app use. The following section summarizes these components of the Playground Physics program.
Playground Physics iOS App. For this study, NYSCI provided iPads with the Playground Physics iOS app installed to teachers implementing Playground Physics. The Playground Physics app, which functions on iPad devices, is designed to help students build a bridge between the kinesthetic experience of physical play (e.g., running, jumping, sliding) and physics concepts. Students can use the app to record ordinary play activities (e.g., cartwheeling, jumping, running, swinging) and analyze their recordings in three modes: Motion, Force, and Energy. In the Motion lens, students can see how distance, speed, and direction change when things move. In the Force lens, children can identify force pairs in the performance. In the Energy lens, children can explore a person’s or object’s potential and kinetic energy.
After entering required calibration information about mass, height, and distance, students can use dots to trace the path of the object or person on the screen. These dots become data points that the app uses to generate graphical displays of the distance traveled, speed, and either force or
American Institutes for Research Enhancing Middle School Science Lessons With Playground Activities—3

energy, depending on which lens the children are exploring. Children can control how fast or how slowly they want to move through the video and pause to examine particular points in the video and on the graphs. Using this feature, children can find the points where they are moving the fastest or the slowest, where a force is pushing or pulling, and where their kinetic and potential energies are at their highest and lowest points, and they can add stickers to visually illustrate those points as their videos playback. In addition, the video and the graphs are linked so that children can see the graphs unfolding as the video of their movement is playing, which can be used to help students build understanding of the relationships between energy, force, and motion concepts and can be used as evidence to support their reasoning. As exemplified in Figure 1.2, students can capture different kinds of motion. They can play back the video and use the features of the app (lens, stickers, graphs) to bridge their understanding of motion and the physics concepts of energy, force, and motion.
Figure 1.2. Playground Physics iOS App Screen Shots
Students can share recordings with their teachers via a secure, password-protected website. The app can be downloaded for free from the iTunes app store: https://itunes.apple.com/us/app/playground-physics/id947124790?ls=1&mt=8.
Playground Physics Activity Guide and Curriculum. The Playground Physics activity guide supports teacher instruction focused on motion, force, and energy while using the Playground Physics iOS app. The activity guide, which can be downloaded from the NYSCI Noticing ToolTM website,1 includes a teacher guide and a student activity workbook that are organized into three curriculum units. These units were written to align with the following four New York State Intermediate Level Science Standards:
• 4.1c (energy): Most activities in everyday life involve one form of energy beingtransformed into another. For example, the chemical energy in gasoline is transformedinto mechanical energy in an automobile engine. Energy, in the form of heat, is almostalways one of the products of energy transformations.
1 http://noticing.nysci.org/apps/playground-physics/
American Institutes for Research Enhancing Middle School Science Lessons With Playground Activities—4

• 4.1e (energy): Energy can be considered to be either kinetic energy, which is the energyof motion, or potential energy, which depends on relative position.
• 5.1b (motion): The motion of an object can be described by its position, direction ofmotion, and speed. The position or direction of motion of an object can be changed bypushing or pulling.
5.1e (force): For every action there is an equal and opposite reaction.
For each unit, the teacher guide includes a review of the content knowledge in that unit as well as common student misconceptions about the topic. The curriculum includes two different instructional strategies for each unit: a curriculum sequence and a guided science investigation.
• The curriculum sequence is a series of lessons within each unit that lead students througha guided inquiry process incorporating the Playground Physics app. The first lesson ineach unit helps teachers formatively assess students’ prior knowledge of the content. Thenext lessons in the unit are sequenced to lead students through a guided inquiry processusing the app. The lessons build on one another to lead students through the prerequisiteknowledge necessary to understand the scientific explanations related to the topic of theunit. Optional lessons in each unit provide students with additional activities in which toengage with the content. Students end the sequence by reflecting on how their ideas havechanged since the introduction to the unit.
• The science investigation leads students through the process of designing and conductingan experiment using the Playground Physics app. Students do not follow the lessonstructure but, rather, use the app to explore phenomena of their own choosing within thetopic areas of motion, force, and energy. This includes determining variables; writing anexperimental question; predicting what will happen in the experiment; recordingobservations from their experiment using a claim, evidence, and reasoning format; andthen reflecting on the experience.
In addition to these three units, the activity guide includes an introductory lesson activity to help educators familiarize their students with the functions of the Playground Physics app. A high-level description of curriculum activities can be found in Appendix A.
Playground Physics Professional Development Activities. The Playground Physics professional development activities were designed to help teachers understand how to use the app and activity guide as part of their motion, force, and energy instruction. During professional development, teachers explore the concepts of energy, motion, and force and practice how they might use the Playground Physics app and activity guide to engage their students in science learning. For this study, professional development was provided in two sessions occurring in October 2015, with a total duration of approximately 9 hours. On the first day, workshop facilitators from NYSCI demonstrated the use of the app, provided teachers with an orientation to the curriculum, and described the two different instructional approaches to implementing Playground Physics. NYSCI offered an online option for participating in day one of the professional development; teachers could choose whether they wanted to attend the face-to-face or online (asynchronous) formats. On the second day, teachers learned how to work the app, practiced using it, and participated as learners in the motion unit of the curriculum. Facilitators then reviewed the lessons in the curriculum sequence for the other two units and described the
American Institutes for Research Enhancing Middle School Science Lessons With Playground Activities—5

science investigation instructional approach. Teachers and facilitators also discussed strategies for using the app with English language learners.
Research Questions and Study Design
This report describes the results of an experimental study, conducted during the 2015–16 academic year, that examined the impact of the Playground Physics program on students’ learning of physics concepts, engagement with physics instruction, and long-term attitudes toward science, intrinsic motivation, and educational aspirations. The report also addresses exploratory questions about their teachers’ opinions of Playground Physics professional development and curriculum materials.
The experiment randomly assigned 60 New York City teachers either to use Playground Physics to teach the concepts of motion, force, and energy or to teach these topics using their regular curriculum. The study examined whether students of teachers who used Playground Physics were more knowledgeable of key physics concepts (motion, force, energy) and more engaged in science class compared to students of teachers who used their regular physics instruction after the experimental period. In addition, the study examined whether there were differences in student attitudes toward science learning and interest in science careers after the experimental period. Pre- and posttest student knowledge assessments and surveys, as described in the next chapter, were used to collect data on student characteristics and capture changes in the outcomes. In addition, teacher surveys, professional development delivery, and attendance records and materials delivery records were analyzed to determine whether the program’s key components (professional development, delivery of curriculum materials, and classroom use of Playground Physics) were implemented with fidelity. The study answers the following questions:
1. Does participation in Playground Physics influence middle school students’ knowledge ofphysics concepts?
2. Does participation in Playground Physics influence middle school students’ engagementin science class?
3. Does participation in Playground Physics influence middle school students’ intrinsicmotivation, attitudes toward learning science, and attitudes toward science careers?
4. Were the key components of Playground Physics implemented with fidelity?5. To what extent did teachers use Playground Physics to teach individual physics topics,
and to what extent did they supplement the Playground Physics curriculum with othercurriculum resources?
Additional analyses of teacher survey data were used to describe teacher opinions of the Playground Physics professional development and curriculum materials as well as their opinions of the facilitators and barriers of program use. These analyses are not directly related to the impact study and therefore are included in Appendix F.
American Institutes for Research Enhancing Middle School Science Lessons With Playground Activities—6

Chapter 2: Study Design, Sample, and Data Sources In this chapter, we present the experiment’s sample and data sources.
Sample
NYSCI recruited 60 teachers during the spring and summer of 2015 from 48 New York City public schools and two charter school to participate in the 2015–16 Playground Physics impact study. There were seven schools with two or more teachers participating in the study, and school was not a blocking factor in assignment to condition (i.e., teachers in the same school could be assigned to different conditions). NYSCI contacted teachers through e-mail lists, social media posts, and an announcement posted to its website. Criteria for participation were as follows: Teaching science to students in at least one of the following grades in the 2015–16 school
year: sixth, seventh, or eighth grade
Teaching each of the following topics in the 2015–16 school year: motion, force, orenergy.
The recruitment process made it clear to teachers that participation was voluntary and that they could leave the study at any time without penalty.
Random Assignment and Timeline of Implementation
Prior to the 2015–16 school year, researchers from AIR randomly assigned 60 teachers to two conditions: treatment (Playground Physics) and control (business as usual). NYSCI provided Playground Physics professional development during fall (October) 2015 and program materials (app and activity guide) to the teachers assigned to the treatment condition. NYSCI program leaders asked these teachers to implement the Playground Physics curriculum when teaching the topics of motion, force, and energy. NYSCI asked the teachers assigned to the control condition to use their regular curriculum to teach motion, force, and energy. Control teachers received Playground Physics professional development and program materials in June 2016, as an incentive following the completion of data collection for the study. NYSCI staff collected student rosters from teachers after assignment to condition, in September 2015, because the assignment of students to classrooms was not finalized until the start of the school year. In total, there were 1,928 students in treatment teacher rosters and 1,478 students in control teacher roster files.
NYSCI provided treatment teachers with professional development and the activity guide component of the curriculum materials in October 2015. During professional development, NYSCI staff asked treatment teachers to use the Playground Physics curriculum to teach motion, force, and energy at any point during the 2015–16 school year. Similarly, during a study overview webinar presented to control teachers, NYSCI asked them to use their regular curriculum to teach motion, force, and energy at any point during the 2015–16 school year. NYSCI asked both treatment and control teachers to administer knowledge assessments and student surveys to their students. Teachers administered the pretest student survey and knowledge assessment in October and November 2015 following participation in professional development or the study overview webinar. AIR administered the posttest knowledge
American Institutes for Research Enhancing Middle School Science Lessons With Playground Activities—7

assessment, posttest student survey, and teacher survey following teacher completion of their motion, force, and energy units. Because of variation in the timing of physics lessons across teachers, posttest data collection extended from December 2016 through May 2016. Further details about administration procedures are provided in the Data Sources section of this chapter.
Sample Attrition
In the treatment condition, six of the 30 teachers (20%) left the study. Treatment teachers dropped out for the following reasons: following assignment to condition, they failed to respond to our communications (two teachers); they were no longer teaching physics (two teachers); they had competing priorities (one teacher); or they failed to participate in all study activities and did not provide a reason (one teacher). Rosters from the remaining 24 treatment teachers indicated that they taught 1,868 students; 1,006 (54%) of these students did not assent or have parental consent, and 51 students (3%) moved or left the study.
In the control condition, nine of the 30 teachers (30%) left the study. Control teachers dropped out for the following reasons: following assignment to condition, they failed to respond to our communications (four teachers); they were no longer teaching physics (one teacher); they had competing priorities (one teacher); or they did not provide a reason (three teachers). Rosters from the remaining 21 control teachers indicated that they taught 1,229 students; 714 (58%) of these students did not assent to participate or did not have written parental consent,2 and an additional six students (less than 1%) moved and left the study.
Two analytic samples were created: one for completion of the knowledge assessment and one for completion of the student survey (comprising five attitudinal outcome measures). In order to be included in either sample, students needed to have a pre- and posttest for the instrument. In the treatment condition, 67 (8%) of the 811 did not have a pre- and post-knowledge assessment, and 63 (8%) did not have a pre- and posttest student survey. In total, the final treatment analytic sample was 744 students for the knowledge assessment and 748 for the student survey. For the control condition, 87 (17%) of the 509 students did not have a pre- and post-knowledge assessment, and 106 (21%) did not have a pre- and posttest student survey. In total, the final control analytic sample was 422 students for the knowledge assessment and 403 for the student survey.3 Removing control students who did not have pre- and post- student survey reduced the control teacher sample from 21 teachers to 20 teachers for the study survey sample. Figure 2.2 provides a consort diagram for teacher and students.
2 To participate in the study, students needed to assent to participate and provide written parental consent. Teachers coordinated distribution and collection of parent consent and student assent forms with support from NYSCI.3 In some cases, students did not complete all of the five measures included on the survey. Therefore, the ns for the survey-based measures vary within conditions.
American Institutes for Research Enhancing Middle School Science Lessons With Playground Activities—8

Figure 2.2. Consort Diagram of Impact Study Analytic Sample
American Institutes for Research Enhancing Middle School Science Lessons With Playground Activities—9

a For inclusion in the study, student assent and parental consent of school records were needed.
Sample Characteristics
Teacher and classroom characteristics were examined by condition. In particular, the study collected data on teacher total instructional experience, experience with science instruction, and experience with physics instruction. Teacher degree attainment and comfort with supplementing the curriculum with digital resources were also examined. The total number of classes and students in the study and the grade levels served were documented by condition.
Teacher Characteristics. There were 24 teachers in the final treatment sample and 21 teachers in the final control sample. The level of teacher experience was similar across the two
American Institutes for Research Enhancing Middle School Science Lessons With Playground Activities—10

conditions, although treatment teachers had slightly more experience than control teachers. In particular, treatment teachers had an average of 10.8 years of total teaching experience, 9.1 years of science instruction experience, and 6.7 years of physics instruction experience. Control teachers had an average of 9.3 years of total teaching experience, 8.6 years of science instruction experience, and 5.9 years of physics instruction experience. Table 2.1 describes teacher instructional experience by condition.
Table 2.1. Teacher Instructional Experience by Condition
Experience
Treatmenta
n = 23 Control n = 21
Mean Standard Deviation Mean
Standard Deviation
Total instructional experience 10.8 5.9 9.3 6.1 Science instruction 9.1 6.3 8.6 5.5 Physics instruction 6.7 6.3 5.9 4.3
Source: Treatment and control teacher survey. a One treatment teacher did not respond to this question in the teacher survey.
A master’s degree was the most commonly reported highest degree earned for both treatment (22, 96%) and control teachers (18, 86%). Table 2.2 depicts the highest degree earned by condition.
Table 2.2. Highest Degree Earned by Condition
Experience Highest Degree Earned
Treatmenta
n = 23 Control n = 21
Bachelor’s 0 2 Master’s 22 18 Doctorate 1 1
Source: Treatment and control teacher survey. a One treatment teacher did not respond to this question in the teacher survey.
Classroom Characteristics. Students who had either one set of pre- and post-knowledge assessment or student survey data were included in the review of classroom characteristics. There were 759 students with at least one outcome measure in the treatment condition and 438 students in the control condition. On average, there were 2.4 classes (range 1–5 classes) per teacher in the treatment condition and 2.2 classes (range 1–5 classes) per teacher in the control condition. In treatment classrooms there 13.1 students (range 1–26), and in control classrooms, there was an average of 9.3 students (range 1–21) in the final analytic sample. Table 2.2 summarizes the mean and range for number of classroom and students by condition.
American Institutes for Research Enhancing Middle School Science Lessons With Playground Activities—11

Table 2.4. Number of Classrooms per Teacher by Condition
Number of Classrooms Number of Students in Classrooms
Condition Treatment (n = 24)
Control (n = 21) Treatment (n = 24)
Control (n = 21)
Minimum 1 1 1 1
Maximum 5 5 26 21
Mean (SD) 2.4 (1.4) 2.2 (1.1) 13.1 (7.3) 9.3 (5.7)
Source: Author generated.
Student characteristics. Student characteristics include grade level, gender, race/ethnicity, English learner (EL) status, student with disability (SWD) status, and poverty status. We overserved differences between the conditions with respect to several of these characteristics. With respect to grade level, most treatment students (71%) were in grade 6 whereas about two-thirds of control students were in grade 8 (Table 2.5).
Table 2.5. Number of Students by Grade and Condition
Grade Treatment (n = 759)
Control (n = 438)
6 539 (71.0%) 63 (14.4%)
7 82 (11.0%) 86 (19.6%)
8 138 (18.2%) 286 (65.3%)
Other (Blended fifth- and sixth-grade class)
0 (0.0%) 3 (1.0%)
Source: Author generated.
As described in the Data Sources section of this chapter, we obtained demographic characteristics for 845 of the 1,197 students (71%) who had non-missing pre- and posttest data for at least one set of outcome data. The treatment group had a slightly higher proportion of females than the control group (54% to 51%). The two groups had roughly the same proportion of Black students (13% to 14%), but the proportion of Hispanic students was much higher in the control group (46%) than in the treatment group (26%). Conversely, the treatment group had a higher proportion of White and Ethnicity-Other students, as described in Table 2.6. The control group had somewhat higher proportions of students classified as EL (12%) and SWD (17%) than the treatment group (2% and 10%, respectively), and also had a greater number of students with poverty status (78% versus 61%). Statistical controls for these characteristics are discussed in Chapter 3: Student Outcomes.
American Institutes for Research Enhancing Middle School Science Lessons With Playground Activities—12

Table 2.6. Student Characteristics by Condition
Treatment (n = 545)
Control (n = 300)
Gender Female 54.3% 51.0% Male 45.7% 49.0%
Race Black 13.0% 14.3% Hispanic 26.4% 46.0% White 21.1% 13.0% Other 39.4% 26.7%
English Language Learner 2.4% 12.0% Student With Disability 9.7% 16.7% Poverty 60.6% 77.7%
Data Sources
This section details the data sources used for the study. Implementation data sources included professional development delivery and attendance records, material delivery records, and teacher surveys. Student outcome data sources included a pre- and post-test student survey and knowledge assessment.
To understand how Playground Physics was implemented in treatment classrooms, data were captured from professional development delivery and attendance records, material delivery records, and teacher surveys. The Playground Physics program had three critical implementation components: delivery of professional development, delivery of materials and support, and teacher implementation of the Playground Physics curriculum.4 NYSCI was expected to provide, and treatment teachers were expected to attend, the Playground Physics professional development workshops; NYSCI was expected to provide curriculum materials to each teacher, including a class set of iPads with the app installed and a program curriculum; and treatment teachers were expected to fully implement at least one of the three units, using either Curriculum Sequence or Science Investigation for the unit.
Student Science Knowledge Assessment. Students’ physics content knowledge was assessed before and after teachers completed physics instruction using either Playground Physics or their regular curriculum. The assessment consisted of items from multiple sources, including publicly available state assessment items (New York, Massachusetts, Illinois, and California) and research-based instruments (American Association for the Advancement of Science, n.d.; Hestenes, Wells, & Swackhamer, 1992; Mozart, n.d.). The pre- and post-test knowledge assessments each had 20 items, 10 of which were overlapping. Items were selected based on their broad alignment to the following New York State Learning Standards described in the
4 These critical components and their criteria were defined by program developers at NYSCI.
American Institutes for Research Enhancing Middle School Science Lessons With Playground Activities—13

previous chapter. In total, four of the 20 questions on both the pre- and posttest knowledge assessment focused on standard 4.1c (energy), seven questions focused on standard 4.1e (energy), four questions focused on standard 5.1b (motion), and five focused on standard 5.1e (force). The pre- and posttest knowledge assessments are reproduced in Appendix B.
Pre- and Posttest Student Survey. Students completed a paper-and-pencil survey before and after their teachers completed physics instruction using either Playground Physics or their regular curriculum. The student survey included forced-choice questions related to the following four constructs: engagement in science class, attitudes toward science, intrinsic motivation, and educational aspirations. The pre- and posttest versions of the survey were identical. The survey instrument is reproduced in Appendix B.
• Engagement in science class. The survey included a retrospective measure ofengagement in science class. Engagement, as defined by Shernoff and Vandell (2007), isthe experience of concentration, enjoyment, and interest while participating in classroomactivity. The 14 items related to engagement asked students to rate their experiences inscience class over the preceding 2 weeks. Seven questions focused on concentration,three focused on enjoyment, and four focused on interest. These items were adapted fromthe following surveys: Consortium on Chicago School Research (2011), EngagementVersus Disaffection With Learning Survey (Skinner, Furrer, Marchand, & Kindermann,2008), and Tinio’s Academic Engagement Scale for grade-school students (Tinio, 2009).The items asked students to rate their agreement with statements such as the following:“In science class I actively participated,” “In science class, I enjoyed working with myclassmates,” and “In science class I liked the ways we learned things.”
• Intrinsic motivation. Student intrinsic motivation was measured through five forced-choice items, using a four-point agree-disagree scale. These items were adapted from anintrinsic motivation scale developed by Elliot and Church (1997) as well as from theMotivated Strategies for Learning Questionnaire developed by Pintrich and DeGroot(1990). The items ask students to rate their agreement with statements such as thefollowing: “I wanted to learn as much as possible from this class.”
• Interest in science. Student interest in science was measured through 11 forced-choiceitems, using a four-point agree-disagree scale, that examined global sentiments regardingscience learning. The items were adapted from Attitudes Toward Science in SchoolAssessment (Germann, 1988), Test of Science-Related Attitudes (Fraser, 1978), andKanter and Konstantopoulos (2010). These 11 questions examined global sentimentsregarding science learning. Representative items include “I like learning about science”and “I like talking to friends about science.”
• Science self-concept. We measured science self-concept using a measure reported byMarsh (1990). It comprised six questions related to students’ beliefs about their ability inscience class. Representative items include “I learn things quickly in science” and “I getgood grades in science.”
American Institutes for Research Enhancing Middle School Science Lessons With Playground Activities—14

• Science-related aspirations. To measure students’ educational and occupational plans inthe student survey, we adapted questions identified by Eccles, Vida, & Barber (2004) tocreate a four-point response scale examining middle school student future science plans.The five items focused on the likelihood of college attendance, selection of sciencecoursework in college, major in science in college, desire to obtain science occupation,and likelihood of seeking a science-related job.
Administration of surveys and knowledge assessments. To understand how student affect and knowledge changed as a result of participating in the Playground Physics program, data were captured using a student survey and knowledge assessment. Teachers administered the paperand-pencil survey and knowledge assessment at two points in time: prior to teacher implementation of Playground Physics (October 2015) and within 2 weeks after completing their final instructional unit. NYSCI staff communicated with teachers about their anticipated completion of their physics instruction for the year, and AIR researchers prepared and shipped posttest forms to coincide with each teacher’s date of completion. AIR researchers requested that teachers administer the posttests as soon as possible after completion of instruction (and no more than 2 weeks following completion). Because of variations in the timing of physics instruction across teachers, posttest data collection extended from December 2015 through May 2016. The following sections provide more detail on the instruments used to measure student outcomes.
Internal Consistency of Student Outcomes Instruments. We used Rasch analysis (Andrich, 1978; Wright & Masters, 1982) implemented with WINSTEPS (Linacre, 2005) to psychometrically scale the knowledge assessments and the student survey constructs. This procedure converted the ordinal data from the surveys, and the binary data from the knowledge assessment, into interval scale scores using a logit metric. We included these scale scores in confirmatory and exploratory analyses of program impact. The Rasch analysis allowed us to evaluate the fit of the reliability of the scores for each construct scale and the fit of the items to the underlying constructs. To assist with the interpretation of the survey scale scores, we mapped the scale scores to the response scale, so that a given scale score on a measure could be categorized according to the respondent’s most typical response to the items comprising the measure. For example, for the posttest measure of Engagement, the cut scores of 27, 34, and 56 demarcated the four response options of Strongly Disagree, Disagree, Agree, and Strongly Agree. Thus, the scale score of 36 would correspond to a typical response of Agree to the Engagement items.
A prior study of 18 teachers implementing the Playground Physics curriculum examined the internal consistency of student outcome measures collected via the student survey and knowledge assessment, to determine whether items within the same scale measuring the same general construct would produce similar scores. This study (Dhillon, Margolin, Liu, & Williams, 2016) estimated two measures of the functioning for each construct—Rasch reliability and Cronbach’s alpha. Rasch reliability incorporates information on the precision of the estimates of respondents’ scores and the fit of individual response patterns to model predictions. Cronbach’s alpha is an index of the reliability of raw survey responses. Table 2.6 describes the internal consistency of the student outcome instruments reported in that study.
American Institutes for Research Enhancing Middle School Science Lessons With Playground Activities—15

Table 2.6. Student Outcome Instrument Reliability and Internal Consistency
Instruments Internal Consistency (Cronbach’s Alpha)
Rasch Reliability
Knowledge Assessment Pretest 0.42 0.53 Posttest 0.82 0.77 Student Affect Surveya
Engagement (concentration, enjoyment, and interest) 0.90 0.84 Science self-concept 0.72 0.58 Interest in science 0.92 0.88 Intrinsic motivation 0.88 0.76 Educational aspirations 0.85 0.80
Source: Dhillon and Margolin (2016). a The student affect surveys were identical at pre- and posttest. The data from the two administrations were combined to examine reliability and internal consistency.
Internal consistency ratings for all outcome measures, as measured by the Rasch statistic, surpassed the What Works Clearinghouse minimum benchmark of 0.5 (What Works Clearinghouse, 2012). Cronbach’s alpha surpassed the 0.5 criterion for all measures except for the pretest knowledge assessment. It is suspected that the internal consistency of the pretest knowledge assessment could not be accurately measured because students had little to no exposure to physics instruction before the pretest. The items likely were more difficult than the student’s ability level at the time of pretest administration.
Student Demographic Data. We requested data on the demographic characteristics of participating students from the New York City Department of Education (NYCDOE). The administrative file provided by the agency included the following demographic variables that were included as covariates in the impact model:
• Race/Ethnicity, identifying subgroups of White, Hispanic, Black, and Other
• Gender
• English language learner (ELL) status
• Student with disability (SWD) status
• Poverty status
NYCDOE provided data for the students in the study from the 2014–15 school year—namely, the year prior to the study. The administrative data file provided by NYCDOE contained records for 845 of the 1,197 students in the sample (71%).
Professional development delivery and attendance records. NYSCI provided attendance sheets that identified which teachers participated in the face-to-face professional development
American Institutes for Research Enhancing Middle School Science Lessons With Playground Activities—16

workshop session. A separate workshop session could be taken either online or face-to-face; thus, attendance records for the online session were not available.
Teacher surveys. Two versions of teacher surveys were created for teachers in the treatment and control conditions, respectively. Both surveys asked teachers to describe the number of class periods they devoted to physics instruction within each of the three topic areas (force, motion, and energy), and both included questions about teacher background (e.g., years of teaching experience, years teaching science, degree type). If a teacher taught physics in more than one classroom, he or she was asked to report on activities with respect to the class that was scheduled second during the school day. Treatment teachers were asked to report, for each topic, the number of class periods they used Playground Physics, which instructional strategy they used (curriculum sequence and/or science investigation), and the extent to which they used their regular physics curriculum along with Playground Physics.
Researchers from AIR invited teachers to complete the survey on a rolling basis according to their completion of physics instruction. The survey was administered to teachers in batches so that each batch included the teachers who recently completed their instruction. Reflecting the different schedules for physics instruction, there were six waves of teacher survey administration, roughly one per month beginning in December and ending in May. All 24 treatment teachers and 21 control teachers remaining in the sample responded to the survey. See Appendix C for the teacher survey instrument.
Key Program Components and Criteria for Fidelity of Implementation
Playground Physics had three key components: teacher participation in professional development, teacher receipt of program materials (i.e., iPads for classroom use of the app), and classroom implementation of the Playground Physics curriculum. For each component, NYSCI identified operational definitions on the teacher level, and then specified criteria for fidelity in terms of the proportion of teachers meeting the operational definition for each component. These fidelity criteria reflected NYSCI’s assumptions of the level of implementation necessary for the program to have its hypothesized impact. Table 2.7 summarizes the components, indicators, and data sources used to examine program implementation fidelity.
Table 2.7. Playground Physics Indicator and Component Measures of Fidelity
Indicator Operational Definition Data Collection Criteria for Component Fidelity
Component 1: Participation in Professional Development Activities Teacher attendance at Playground Physics Professional Development
Teacher attends day two (6 hours) of Playground Physics professional development
Professional Development Attendance Records
80% of teachers attend day two of Playground Physics professional development
Component 2: Receipt of Program Materials Teacher receipt of class set of iPads with app installed
Teacher receives a class set of iPads with Playground Physics app installed
Teacher iPad receipt forms
At least 90% of teachers receive a class set of iPads with
American Institutes for Research Enhancing Middle School Science Lessons With Playground Activities—17
Indicator Operational Definition Data Collection Criteria for Component Fidelity
Teacher receipt of Playground Physics curriculum
Teacher provided with Playground Physics activity guide
Teacher Survey app installed and Playground Physics curriculum.
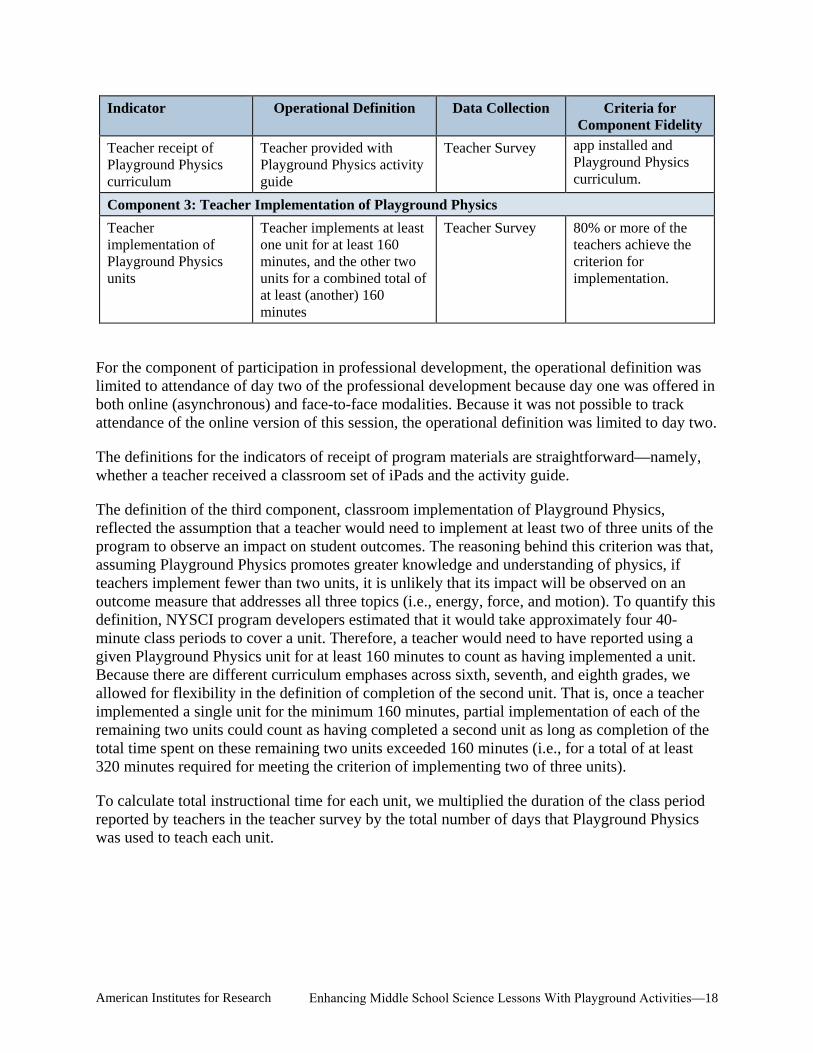
Component 3: Teacher Implementation of Playground Physics Teacher implementation of Playground Physics units
Teacher implements at least one unit for at least 160 minutes, and the other two units for a combined total of at least (another) 160 minutes
Teacher Survey 80% or more of the teachers achieve the criterion for implementation.
For the component of participation in professional development, the operational definition was limited to attendance of day two of the professional development because day one was offered in both online (asynchronous) and face-to-face modalities. Because it was not possible to track attendance of the online version of this session, the operational definition was limited to day two.
The definitions for the indicators of receipt of program materials are straightforward—namely, whether a teacher received a classroom set of iPads and the activity guide.
The definition of the third component, classroom implementation of Playground Physics, reflected the assumption that a teacher would need to implement at least two of three units of the program to observe an impact on student outcomes. The reasoning behind this criterion was that, assuming Playground Physics promotes greater knowledge and understanding of physics, if teachers implement fewer than two units, it is unlikely that its impact will be observed on an outcome measure that addresses all three topics (i.e., energy, force, and motion). To quantify this definition, NYSCI program developers estimated that it would take approximately four 40minute class periods to cover a unit. Therefore, a teacher would need to have reported using a given Playground Physics unit for at least 160 minutes to count as having implemented a unit. Because there are different curriculum emphases across sixth, seventh, and eighth grades, we allowed for flexibility in the definition of completion of the second unit. That is, once a teacher implemented a single unit for the minimum 160 minutes, partial implementation of each of the remaining two units could count as having completed a second unit as long as completion of the total time spent on these remaining two units exceeded 160 minutes (i.e., for a total of at least 320 minutes required for meeting the criterion of implementing two of three units).
To calculate total instructional time for each unit, we multiplied the duration of the class period reported by teachers in the teacher survey by the total number of days that Playground Physics was used to teach each unit.
American Institutes for Research Enhancing Middle School Science Lessons With Playground Activities—18

Chapter 3: Student Outcomes NYSCI hypothesizes that Playground Physics will promote greater engagement in science lessons, deeper and more effective learning of science concepts, and more positive attitudes about science. This chapter reports the results of the study with respect to these hypothesized impacts.
Baseline Equivalence
In this section, we examine the baseline equivalence of treatment and control group students on the pretest measures of the hypothesized outcomes: knowledge assessment, science engagement, intrinsic motivation, attitudes toward science, and educational aspirations.
Baseline equivalence with respect to pretest measures was evaluated by calculating effect sizes (Hedges’ g) for the differences between students of treatment and control teachers on each measure. Following Ho, Imai, King, and Stuart (2007), we adopted a criterion of an effect of greater than .25 to indicate that the groups are nonequivalent. Although students of treatment teachers had higher mean scores on all pretest measures, none of these differences exceeded the criterion of greater than .25 (Table 3.1). To minimize the influence of differences in student affect and physics knowledge prior to participation in the study, statistical adjustments were made in the student outcomes analyses; pretest measures were included as covariates in the statistical models of program impact.5 Details on the analytic model used to estimate baseline differences can be found in Appendix D.
Table 3.1. Means and Standard Deviation in Pretest Measures Between Students of Treatment and Control Teachers
Pretest Measure Number of Students Pretest Mean (SD) Effect Size (Hedge’s g)
Treatment Control Treatment Control
Knowledge Assessment 744 422 -0.8 (0.8) -0.9 (0.7) 0.11 Engagement 743 401 2.07 (1.6) 1.73 (1.5) 0.22 Intrinsic Motivation 742 400 3.24 (2.5) 2.79 (2.6) 0.18 Interest in Science 748 403 1.61 (1.9) 1.23 (1.9) 0.20 Science Self-Concept 746 403 1.6 (1.9) 1.3 (1.9) 0.14 Science-Related Aspirations 741 401 1.0 (1.8) 0.7 (1.8) 0.15
Note: Data represent scale scores using a logit metric. SDs are the unadjusted student-level SDs. Treatment group includes 24 teacher clusters, and control group includes 21 clusters for knowledge assessment and 20 clusters for the five attitudinal measures. Source: Author calculation.
5 According to the What Works Clearinghouse Procedures and Standards Handbook (v. 3.0, p. 15), effect size differences for a baseline characteristic between 0.05 and 0.25 require a statistical adjustment to satisfy baseline equivalence.
American Institutes for Research Enhancing Middle School Science Lessons With Playground Activities—19
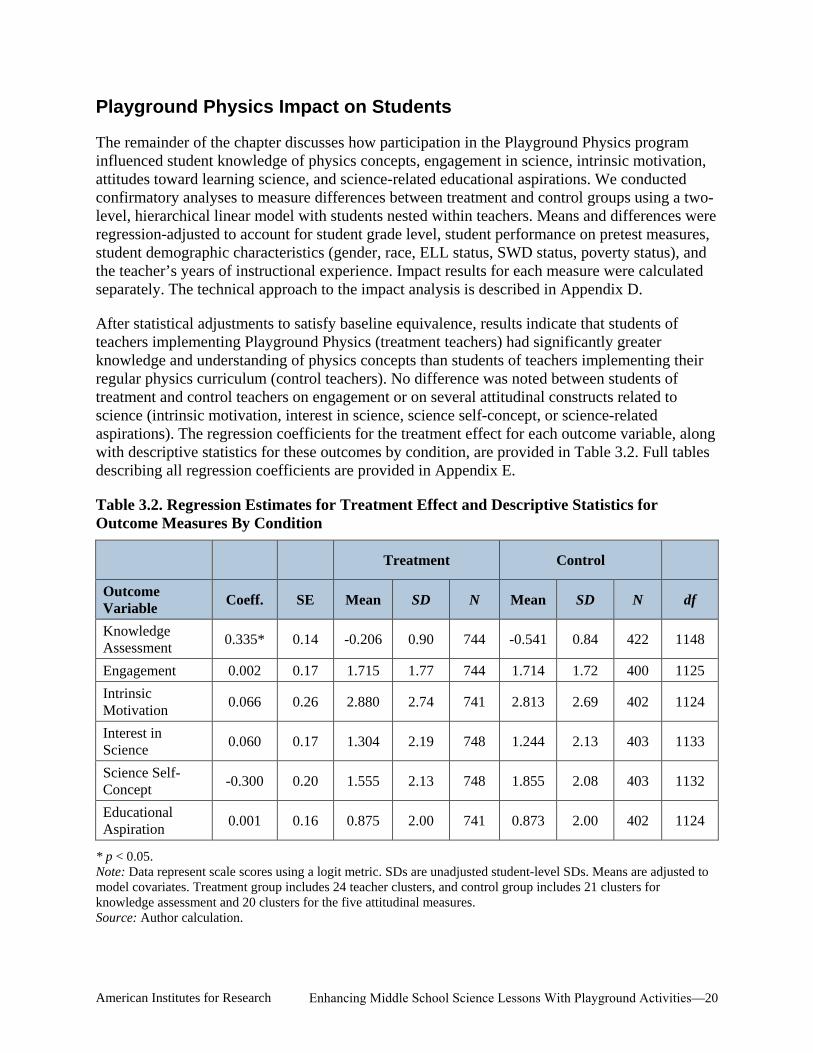
Playground Physics Impact on Students
The remainder of the chapter discusses how participation in the Playground Physics program influenced student knowledge of physics concepts, engagement in science, intrinsic motivation, attitudes toward learning science, and science-related educational aspirations. We conducted confirmatory analyses to measure differences between treatment and control groups using a two-level, hierarchical linear model with students nested within teachers. Means and differences were regression-adjusted to account for student grade level, student performance on pretest measures, student demographic characteristics (gender, race, ELL status, SWD status, poverty status), and the teacher’s years of instructional experience. Impact results for each measure were calculated separately. The technical approach to the impact analysis is described in Appendix D.
After statistical adjustments to satisfy baseline equivalence, results indicate that students of teachers implementing Playground Physics (treatment teachers) had significantly greater knowledge and understanding of physics concepts than students of teachers implementing their regular physics curriculum (control teachers). No difference was noted between students of treatment and control teachers on engagement or on several attitudinal constructs related to science (intrinsic motivation, interest in science, science self-concept, or science-related aspirations). The regression coefficients for the treatment effect for each outcome variable, along with descriptive statistics for these outcomes by condition, are provided in Table 3.2. Full tables describing all regression coefficients are provided in Appendix E.
Table 3.2. Regression Estimates for Treatment Effect and Descriptive Statistics for Outcome Measures By Condition
Treatment Control
Outcome Variable Coeff. SE Mean SD N Mean SD N df
Knowledge Assessment 0.335* 0.14 -0.206 0.90 744 -0.541 0.84 422 1148
Engagement 0.002 0.17 1.715 1.77 744 1.714 1.72 400 1125 Intrinsic Motivation 0.066 0.26 2.880 2.74 741 2.813 2.69 402 1124
Interest in Science 0.060 0.17 1.304 2.19 748 1.244 2.13 403 1133
Science Self-Concept -0.300 0.20 1.555 2.13 748 1.855 2.08 403 1132
Educational Aspiration 0.001 0.16 0.875 2.00 741 0.873 2.00 402 1124
* p < 0.05. Note: Data represent scale scores using a logit metric. SDs are unadjusted student-level SDs. Means are adjusted to model covariates. Treatment group includes 24 teacher clusters, and control group includes 21 clusters for knowledge assessment and 20 clusters for the five attitudinal measures. Source: Author calculation.
American Institutes for Research Enhancing Middle School Science Lessons With Playground Activities—20

The following sections summarize these findings and provide additional context for their interpretation from a descriptive analysis of differences between treatment and control groups.
How does participation in Playground Physics influence middle school students’ knowledge of physics concepts?
As mentioned, students of teachers implementing Playground Physics had a higher mean scale score on the posttest assessment of physics knowledge (M = -.17, SD = .84) than students of teachers implementing their regular physics curriculum (M = -.53, SD = .90; Table 4.2). Descriptive analyses of the measure of physics knowledge indicate that treatment students demonstrated greater knowledge of content across the different standards tested, as indicated by percent correct at posttest (students in the two groups were roughly equivalent across the standards at pretest). The greatest difference in performance between treatment and control students was on questions related to energy transformation (standard 4.1c) and to kinetic and potential energy (standard 4.1e); the percentage-point difference between the two groups was about 14 and 12, respectively, as summarized in Table 3.3. Appendix F provides a full breakdown of performance on pre- and posttest knowledge assessment by question.
Table 3.3. Average Percent Correct on Pre- and Posttest Knowledge Assessment by New York State Standard and Condition
New York State Standard
Pretest (% correct)
Posttest (% correct)
Treatment (n = 744)
Control (n = 422)
Treatment (n = 744)
Control (n = 422)
4.1c Energy Transformation 26.3% 25.7% 40.5% 34.6% 4.1e Kinetic and Potential Energy 46.3% 42.7% 59.7% 47.9% 5.1b Characteristics of Motion 30.1% 28.4% 42.0% 38.6% 5.1e Newton’s Third Law 26.8% 27.0% 40.2% 37.8% Overall 34.4% 32.6% 47.5% 40.9%
Source: Author calculation.
How does participation in Playground Physics influence middle schoolstudents’ engagement in science class?
As mentioned, the mean engagement scale score of students in the treatment condition (M = 1.87, SD = 1.77) was not significantly greater than students in the control condition (M = 1.53, SD = 1.72; see Table 4.2). To understand this result, we categorized students according to their most typical response to the survey items (as described in the Data Sources section in Chapter 2). The distribution of students among the four possible responses is depicted in Table 3.4 for both conditions. At posttest, 98% of students of treatment teachers were categorized as typically selecting Agree (74%) or Really Agree (23%) to items expressing their engagement in science classroom. Similarly, 97% of students of control teachers typically reported that they agreed (80%) or really agreed (17%) they were engaged in their science classroom. Given that nearly every student responded on the positive end of the scale, and most
American Institutes for Research Enhancing Middle School Science Lessons With Playground Activities—21

typically selected one of the four response options, the scale may not have been sensitive enough to detect differences between the groups.
Table 3.4. Proportion of Students Typically Selecting Different Response Options on the Engagement Scale at Pretest and Posttest by Condition
Typical Response Pretest Posttest Treatment Control Treatment Control
Really Agree 26.0% 20.7% 23.4% 16.8% Agree 73.4% 77.1% 74.5% 80.5% Disagree 0.5% 2.2% 2.2% 2.0% Really Disagree 0.1% 0.0% 0.0% 0.8%
Source: Author calculation.
How does participation in Playground Physics influence middle schoolstudents’ motivation, attitudes toward learning science, and science-related aspirations careers?
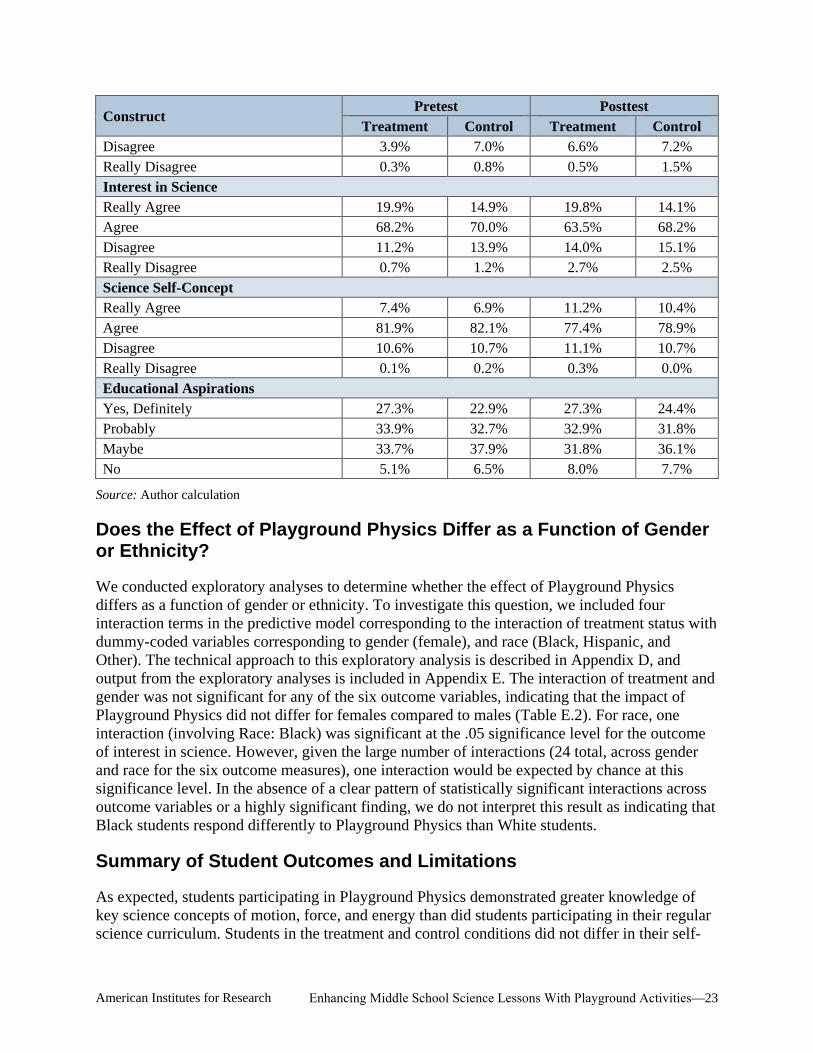
As mentioned, no statistically significant impact was found for the attitudinal constructs of motivation, interest in science, science self-concept, or interest in pursuing a science career (see Table 3.5). We conducted a descriptive analysis of the distribution of students’ typical responses to these four scales to determine whether the absence of an observed difference between the conditions could have been the result of a restriction or range. Table 3.5 displays the distribution of typical responses across response options for these scales. Three of the scales had a distribution of typical responses that was similar to the engagement scale. Namely, the intrinsic motivation, science self-concept, and interest in science scales each had more than 80% of students selecting Agree or Really Agree as their typical response at posttest, in both conditions. For all three scales, a majority of students selected the second-highest rating of Agree. Given that the range of responses is restricted to the positive end of the scale, these three measures may not have been sensitive enough to detect differences between the groups. This lack of sensitivity of these measures is a plausible explanation for the lack of observed group differences.
By contrast, the typical responses to the science-related aspirations scale were fairly evenly distributed among three of the four response options (corresponding to Definitely, Probably, and Maybe). Therefore, the absence of a difference between the treatment and control conditions is likely not attributable to a lack of sensitivity of the measure to the intervention.
Table 3.5. Proportion of Students Typically Selecting Difference Response Options on the Intrinsic Motivation, Attitudes and Aspiration Constructs at Pretest and Posttest by Condition
Construct Pretest Posttest
Treatment Control Treatment Control Intrinsic Motivation Really Agree 39.5% 31.5% 36.7% 26.6% Agree 56.3% 60.8% 56.1% 64.7%
American Institutes for Research Enhancing Middle School Science Lessons With Playground Activities—22
Construct Pretest Posttest
Treatment Control Treatment Control Disagree 3.9% 7.0% 6.6% 7.2% Really Disagree 0.3% 0.8% 0.5% 1.5% Interest in Science Really Agree 19.9% 14.9% 19.8% 14.1% Agree 68.2% 70.0% 63.5% 68.2% Disagree 11.2% 13.9% 14.0% 15.1% Really Disagree 0.7% 1.2% 2.7% 2.5% Science Self-Concept Really Agree 7.4% 6.9% 11.2% 10.4% Agree 81.9% 82.1% 77.4% 78.9% Disagree 10.6% 10.7% 11.1% 10.7% Really Disagree 0.1% 0.2% 0.3% 0.0% Educational Aspirations Yes, Definitely 27.3% 22.9% 27.3% 24.4% Probably 33.9% 32.7% 32.9% 31.8% Maybe 33.7% 37.9% 31.8% 36.1% No 5.1% 6.5% 8.0% 7.7%
Source: Author calculation
Does the Effect of Playground Physics Differ as a Function of Gender or Ethnicity?
We conducted exploratory analyses to determine whether the effect of Playground Physics differs as a function of gender or ethnicity. To investigate this question, we included four interaction terms in the predictive model corresponding to the interaction of treatment status with dummy-coded variables corresponding to gender (female), and race (Black, Hispanic, and Other). The technical approach to this exploratory analysis is described in Appendix D, and output from the exploratory analyses is included in Appendix E. The interaction of treatment and gender was not significant for any of the six outcome variables, indicating that the impact of Playground Physics did not differ for females compared to males (Table E.2). For race, one interaction (involving Race: Black) was significant at the .05 significance level for the outcome of interest in science. However, given the large number of interactions (24 total, across gender and race for the six outcome measures), one interaction would be expected by chance at this significance level. In the absence of a clear pattern of statistically significant interactions across outcome variables or a highly significant finding, we do not interpret this result as indicating that Black students respond differently to Playground Physics than White students.
Summary of Student Outcomes and Limitations
As expected, students participating in Playground Physics demonstrated greater knowledge of key science concepts of motion, force, and energy than did students participating in their regular science curriculum. Students in the treatment and control conditions did not differ in their self-
American Institutes for Research Enhancing Middle School Science Lessons With Playground Activities—23

rated levels of engagement, nor with respect to intrinsic motivation, interest in science, science self-concept, and science-related aspirations. The restriction of range in student response to these survey scales suggests that these measures may not have been sensitive to the impact of Playground Physics. Exploratory analyses did not produce evidence of differences among subgroups related to gender or race in their response to Playground Physics.
Chapter 4: Implementation of Playground Physics and Its Relationship to Student Outcomes In this chapter, we present Playground Physics implementation findings and their relationship to student outcomes. Fidelity of implementation examines how well NYSCI and teachers who received Playground Physics implemented the program as intended. NYSCI identified the following as critical components of the program: delivery of professional development, delivery of materials and support, and teacher implementation of the Playground Physics curriculum. This chapter also examines how classroom implementation varied across topics, the extent to which treatment teachers blended the program with their regular curriculum, and how the amount of time spent on physics topics in the treatment condition compared to the amount of time devoted to physics topics in the control condition.
To what extent were Playground Physics components implementedwith fidelity?
This section summarizes data on the fidelity of implementation of each key component of Playground Physics, as defined in Table 2.7. Overall, Playground Physics was implemented with fidelity. Data from teacher surveys and program records indicate that teachers participated in professional development activities, received expected program materials, and typically implemented at least two of three Playground Physics units in the classroom. Table 4.1 summarizes the measurement of fidelity for each of the program components. (Findings from a previous study of implementation fidelity are included in Appendix G.)
Table 4.1. Playground Physics Adequate Component Fidelity Ratings Met
Program Component
Criteria for Adequate Component Implementation
Frequency Percent Met
Criterion? Treatment Teachers (N = 24)
Participation in Professional Development Activities
80% or more of teachers attend day two of Playground Physics professional development. 24 100% Yes
Receipt of Curriculum Materials
90% or more of teachers receive (1) a class set of iPads with app installed, and (2) Playground Physics activity guide.
24 100% Yes
Teacher Implementation of Playground Physics
80% or more of the teachers implement one unit for at least 160 minutes, and the other two units for a combined total of at least (another) 160 minutes.
20 83.3% Yes
American Institutes for Research Enhancing Middle School Science Lessons With Playground Activities—24

Source: Author analysis of treatment teacher survey, professional development attendance records, and iPad receipt forms.
Participation in professional development activities. The professional development component metric included one indicator, teacher attendance of day two of Playground Physics professional development. To achieve fidelity on the professional development component, a minimum of 80% of teachers needed to attend this professional development session. Professional development attendance records collected from NYSCI program staff indicated that all 24 (100%) treatment teachers attended face-to-face professional development, meeting the criterion for fidelity of implementation.
Receipt of curriculum materials. The materials and supports component metric included two indicators: (1) teachers’ receipt of a class set of iPads with app installed, and (2) teachers’ receipt of the Playground Physics curriculum. To attain fidelity on the material and support component, at least 90% of teachers needed to receive a class set of iPads with app installed and the Playground Physics curriculum. Review of iPad receipt forms confirmed that all 24 (100%) treatment teachers received a class set of iPads, and teacher survey data indicated that all 24 (100%) treatment teachers received the Playground Physics curriculum. Therefore, implementation of the materials and supports component met the criterion for fidelity.
Teacher Implementation of Playground Physics. To attain fidelity on the implementation of Playground Physics component, 80% or more of the treatment teachers needed to implement two of the three units. Implementation of a unit was benchmarked at 160 minutes of classroom time spent on the unit. As explained in Table 2.7, partial implementation of two units could count as fully implementing a unit if the combined duration exceeded 160 minutes. In total, 20 of 24 teachers (83%) implemented at least two units, thereby meeting the criterion for component fidelity. Four teachers met the 160-minute benchmark for all three units, 10 teachers met the 160-minute benchmark for two of the three units, and six teachers met the benchmark for one unit and provided instruction in the other two units for a combined duration that exceeded 160 minutes.
Table 4.2 summarizes those lessons that were fully implemented (i.e., 160 or more minutes) and those that were partially implemented (40 to 159 minutes). Most treatment teachers (79%) fully implemented the motion unit, whereas just over half as many teachers fully implemented the force and energy units (42% and 46%, respectively). For these latter two units, 42% and 50% (respectively) partially implemented the lessons. Thus, most lessons were implemented at least in part by nearly every teacher, but only the motion unit typically was implemented for a duration of time that constituted full unit implementation.
Table 4.2 Percentage of Treatment Teachers With No, Partial, or Full Implementation of Instructional Units (N = 24)
Level of Unit Implementation
Units None Partial
(40–159 minutes) Full (160 or More
Minutes) Motion 4.2% 16.7% 79.2% Force 0.0% 41.7% 41.7% Energy 4.2% 50.0% 45.8%
American Institutes for Research Enhancing Middle School Science Lessons With Playground Activities—25

Source: Author calculation.
The next section examines additional factors of implementation pertaining to the amount of time that students spent on each unit in the treatment condition, as well as time spent on each physics topic in both conditions.
How extensively did teachers use Playground Physics to teachphysics?
The purpose of this section is to describe the extent to which teachers used Playground Physics to teach the topics of motion, force, energy and how their emphasis on these topics compared to that of control teachers. This information is intended to provide context for interpreting the impact findings reported in Chapter 3. Appendix H presents additional descriptive findings about different approaches adopted by teachers when using the Playground Physics curriculum and about their perceptions of the program.
Instructional time used to teach unit. On the teacher survey, teachers in both conditions reported the total number of class periods spent on the topics of motion, force, and energy. We analyzed responses to these items to determine whether the impact of the treatment condition might be attributable to a greater amount of time spent on these topics by treatment teachers. The mean amount of time spent by treatment teachers across all three topics was 929 minutes (SD = 374) compared to 793 minutes (SD = 320) spent by control teachers. This difference was not statistically significant, t (43) = 1.30. Figure 4.1 breaks out the average number of minutes spent on motion, force, and energy (respectively) by condition. Across each topic, the mean number of minutes was greater among treatment teachers than among control teachers, but these differences were not statistically significant.
American Institutes for Research Enhancing Middle School Science Lessons With Playground Activities—26

Figure 4.1. Average Number of Minutes Spent Teaching Energy, Motion, and Force by Condition
Source: Treatment and control teacher survey.
Use of regular curriculum with Playground Physics. Treatment teachers who indicated that they implemented a given unit of Playground Physics were asked whether and how they used their regular (non-Playground Physics) curriculum to teach that topic. Teachers could indicate that they used the Playground Physics curriculum only, that they supplemented the Playground Physics curriculum with their regular curriculum, or that they used all of their regular curriculum and supplemented it with Playground Physics. For each unit, the majority of treatment teachers reported supplementing the Playground Physics curriculum with their regular curriculum (motion: 56% of teachers; force: 55% of teachers; energy: 65% of teachers). About a third of teachers stated that they used only Playground Physics to teach motion and force, and 17% of teachers used only Playground Physics to teach energy. The least selected teacher response was using their entire regular motion curriculum and supplementing it with Playground Physics (motion: 13% of teachers; force: 15% of teachers; energy: 17% of teachers). Figure 4.2 details how much teachers used their regular (non-Playground Physics) curriculum by unit.
American Institutes for Research Enhancing Middle School Science Lessons With Playground Activities—27

Figure 4.2. Treatment Teacher Ratings of How Much They Used Their Regular (non-Playground Physics) Curriculum
American Institutes for Research Enhancing Middle School Science Lessons With Playground Activities—28

Source: Treatment teacher survey.
Related to this question, we calculated a ratio for each teacher of the amount of time spent using Playground Physics to teach a unit to the total amount of time spent teaching that unit. Consistent with the findings suggesting that teachers frequently supplemented Playground Physics with their regular curriculum, the majority of instructional time that teachers provided for force, energy, and motion involved the use of Playground Physics. On average, treatment teachers used Playground Physics in 74% (SD = 28%) of motion class periods, 66% (SD = 39%) of force class periods, and 64% (SD = 30%) of energy class periods. Figure 3.3 summarizes the proportion of class periods during which treatment teachers used Playground Physics for each of the three units.
Figure 4.3. Average Proportion of Instructional Time Treatment Teachers Used Playground Physics
Source: Treatment teacher survey.
These findings demonstrate that treatment teachers typically used Playground Physics in conjunction with their regular curriculum.
Summary of Fidelity of Implementation and Relationship to StudentOutcomes
The implementation of the Playground Physics program met fidelity criteria for key components related to participation in professional development, receipt of curriculum materials, and classroom implementation of the curriculum. We observed several patterns in classroom implementation that provide context for interpreting findings about student outcomes. First, treatment teachers spent the most time, on average, on the motion unit than on either of the other two units. However, descriptive findings do not indicate that the advantage in physics knowledge of treatment relative to control students was greater for the unit on motion. Thus, it is unlikely
American Institutes for Research Enhancing Middle School Science Lessons With Playground Activities—29

that the emphasis on the motion unit was driving the observed impact on physics knowledge. Second, treatment teachers did not spend a significantly greater amount of time addressing the three physics topics than control teachers. Therefore, it is unlikely that the observed impact on physics knowledge is explained by differences in time devoted to physics instruction. Finally, findings from the teacher survey clarified the difference between the treatment and control conditions. In the former condition, most teachers did not exclusively teach Playground Physics but, rather, combined it with their regular curriculum. Nevertheless, treatment teachers on average used Playground Physics for the majority of their motion, force, and energy instructional time. In summary, the finding of implementation fidelity across key components, along with the absence of a difference between conditions in instructional time, supports the conclusion that the Playground Physics program had a direct impact on students’ physics knowledge.
Chapter 5: Discussion Playground Physics was designed to integrate playful elements of informal learning into an inquiry-oriented curriculum designed to be implemented in formal school settings. NYSCI hypothesized that this curricular approach would promote greater knowledge and understanding of physics, greater engagement in science lessons, and more positive student attitudes toward science and science education.
Playground Physics Promotes Greater Knowledge and Understandingof Physics Concepts
Results indicate that, as expected, students of teachers implementing Playground Physics demonstrated greater understanding of physics concepts than students of teachers implementing their regular curriculum. Because teachers were randomly assigned to condition and the analysis statistically controlled for prior student knowledge, student characteristics, and teacher experience, it is unlikely that differences in those factors can explain the observed group differences. Thus, this study provides evidence that Playground Physics is more effective than the regular curriculum being used by teachers in our sample, which was located in New York City. The reason for the greater effectiveness of Playground Physics is not yet clear. Because Playground Physics was designed to be a highly engaging supplementary Physics curriculum, it is possible that greater engagement explains this result. Yet, our retrospective survey measure of engagement did not reveal any difference between the two groups. It is possible that a retrospective measure of engagement (in which a student reflects on his or her engagement over the preceding 2 weeks in science class) is not sensitive to variations in engagement that are occurring in the moment of lessons. Similarly, it is possible that the scale of the engagement measure wasn’t sensitive to the impact of Playground Physics, as suggested by the fact that the vast majority of students in both groups chose Agree or Strongly Agree.6 A second explanation is that the Playground Physics curriculum was better aligned to the New York State Standards upon which the outcome measure was based than the regular curriculum, but we did not collect data examining differences in alignment. A third possibility is that the activities in Playground
6 The findings from teacher survey lend support to the suggestion that the student survey did not accurately measure student engagement. Teachers perceived students to be more engaged in Playground Physics lessons than those of the standard physics curriculum. These findings are reporting in Appendix H (see Figure H-2).
American Institutes for Research Enhancing Middle School Science Lessons With Playground Activities—30

Physics led to greater learning by providing richer, more vivid examples of physics concepts, independent of the level of engagement or alignment to standards.
A less plausible explanation is that teachers in the treatment condition spent more time teaching physics concepts than teachers in the control condition. There was a trend toward greater instructional time in the former condition, but this difference was not significant. Furthermore, if the discrepancy in amount of time devoted to the topics was driving this effect, we would expect to see the greatest divergence in understanding for the topic area where the discrepancy in instructional time was greatest (which, in this study, was the topic of Motion). We cannot examine this question with precise measures because we did not develop scale scores aligned with the individual standards. However, a descriptive analysis of percent correct on the knowledge assessment shows that the difference between the two groups was no greater for Motion than for the other two topics (see Table 3.3).
Playground Physics was designed to be a supplementary curriculum. Accordingly, teachers combined it with their regular curriculum, in varying ratios. This suggests that the effect of Playground Physics is robust to variations in implementation. More study is needed to determine whether different approaches to blending the regular curriculum with the program are equally efficacious.
The finding of greater effectiveness of Playground Physics should be interpreted with caution. Statistical adjustment was required to satisfy baseline equivalence, and it is possible that differences between the groups could exist and are unaccounted for in the analytic model. Furthermore, the study was conducted in a single school district. It is possible that the impact of Playground Physics would not generalize to other districts (where other science curricula are used), or to other student populations.
Playground Physics Was Not Associated With Differences inEngagement or Attitudes
There were no differences between treatment and control students with respect to their self-reported levels of engagement. As noted previously, the retrospective survey may not have been sensitive to differences in affect experienced several days prior to the survey.7 Similarly, no differences were noted between groups with respect to intrinsic motivation, interest in science, science self-concept, and educational aspirations in science. The duration of the curriculum unit may not have been great enough to have influenced these attitudes. In other words, if a student’s attitudes about science are fairly stable, they are unlikely to be influenced by an intervention of only a few weeks. Moreover, the hypothesized logic model was for increases in both engagement and knowledge to promote changes in attitude, so it is not known whether these attitudes would have changed if the program enhanced student engagement as well as knowledge. One less likely explanation for the null findings is that there was a restriction of range in student responses to the engagement and attitudes surveys. Although there was a very high rate of agreement, most
7 Teachers were instructed to administer the posttest survey and knowledge assessment as soon as possible following the completion of physics instruction, and the retrospective survey items asked students to reflect on their level of engagement over the preceding 2 weeks.
American Institutes for Research Enhancing Middle School Science Lessons With Playground Activities—31

students typically did not select the highest rating category; therefore, it appears that the response scales could have captured differences in student attitudes if they existed. Because of the limitations of these measurements, further investigation is needed to understand whether and how Playground Physics (or some other approach to integrating informal play with formal science instruction) would lead to long-term changes in attitudes related to science. For example, future studies could use behavioral measures of interest in the topics covered (e.g., amount of time students voluntarily spend working on physics problems).
In any event, it is important to consider other factors that may influence the attitudinal outcomes examined in this study, including interest in science and one’s science self-concept. Recent research suggests that these attitudes are dependent on a number of factors that were not measured in this study. These include the extent to which scientific practice is consistent with students’ identity and valued by their family and peers (Archer, Dewitt, Osborne, Dillon, Willis, & Wong, 2012), level of achievement in STEM-related classes, and whether those classes are composed on the basis of prior achievement (Trautwein, Ludtke, Marsh, Koller, & Baumert, 2006) and positive interactions with peers or role models related to science (Salchegger, 2016). Future research on Playground Physics should take these factors into account.
American Institutes for Research Enhancing Middle School Science Lessons With Playground Activities—32

References American Association for the Advancement of Science. (n.d.). AAAS science assessment.
Retrieved from http://assessment.aaas.org/
Andrich, D. (1978). A rating formulation for ordered response categories. Psychometrika, 43(4), 561–573.
Archer, L., Dewitt, J., Osborne, J., Dillon, J. Willis, B., Wong, B. (2012). “Balancing acts”: Elementary school girls’ negotiations of femininity, achievement, and science. Science Education, 96(6), 967–989.
Atwater, M. M., Wiggins, J., & Gardner, C. M. (1995). A study of urban middle school students with high and low attitudes toward science. Journal of Research in Science Teaching, 32(6), 665-677.
Bell, P., Lewenstein, B., Shouse, A. W., & Feder, M. A. (Eds.). (2009). Learning science in informal environments: People, places, and pursuits. Washington, DC: The National Academies Press.
Bevan, B., J. Dillon, G. E. Hein, M. Macdonald, V. Michalchik, D. Miller, D. Root, L RudderKilkenny, M. Xanthoudaki, and S. Yoon. 2010. Making science matter: Collaborations between informal science education organizations and schools. Washington, DC: Center for Advancement of Informal Science Education.
Brickhouse, N. (1994). Bringing in the outsiders: Reshaping the sciences of the future. Journal of curriculum Studies, 26(4), 401-416.
Consortium on Chicago School Research. (2011). 2011 my voice my school survey code book. Retrieved from https://ccsr.uchicago.edu/sites/default/files/uploads/survey/211%20Student%20Survey%20Codebook.pdf
DeWitt, J., & Storksdieck, M. (2008). A short review of school field trips: Key findings from the past and implications for the future. Visitor Studies, 11(2), 181-197.
Dhillon, G., Margolin, J., Liu, F., & Williams, R. (2015). Playground Physics implementation study. Chicago, IL: American Institutes for Research. Retrieved from www.air.org/playgroundphysics
Eccles, J. S., Vida, M. N., & Barber, B. (2004). The relation of early adolescents’ college plans and both academic ability and task-value believes to subsequent college enrollment. Journal of Early Adolescence, 24(1), 63–77.
Elliot, A. J., & Church, M. A. (1997). A hierarchical model of approach and avoidance achievement motivation. Journal of Personality and Social Psychology, 72, 218–232. doi:10.1037/0022-3514.72.1.218
American Institutes for Research Enhancing Middle School Science Lessons With Playground Activities—33

Fraser, B. J. (1978). Development of a test of science-related attitudes. Science Education, 62(4), 509–515.
Germann, P. J. (1988). Development of the attitude toward science in school assessment and its use to investigate the relationship between science achievement and attitude toward science in school. Journal of research in science teaching, 25(8), 689–703.
Hestenes, D., Wells, M., & Swackhamer, G. (1992). Force concept inventory. The Physics Teacher, 30(3), 141–158.
Ho, D., Imai, K., King, G., & Stuart, E. A. (2007). Matching as nonparametric preprocessing for reducing model dependence in parametric causal inference. Political Analysis, 15(3), 199–236.
Ing, M., & Nylund-Gibson, K. (2013). Linking early science and mathematics attitudes to longterm science, technology, engineering, and mathematics career attainment: Latent class analysis with proximal and distal outcomes. Educational Research and Evaluation, 19(6), 510–524.
Kahle, J. B., & Meece, J. (1994). Research on gender issues in the classroom. Handbook of research on science teaching and learning, 542-557.
Kanter, D. E. (2010). Doing the project and learning the content: Designing project-based science curricula for meaningful understanding. Science Education, 94(3), 525–551.
Kanter, D. E., & Konstantopoulos, S. (2010). The impact of a project-based science curriculum on minority student achievement, attitudes, and careers: The effects of teacher content and pedagogical content knowledge and inquiry-based practices. Science Education, 94(5), 855–887.
Kanter, D. E., & Schreck, M. A. (2006). Learning content using complex data in project-based science: An example from high school biology in urban classrooms. New Directions in Teaching and Learning, 108, 77–91.
Kolodner, J. L., Camp, P. J., Crismond, D., Fasse, B. B., Gray, J., Holbrook, … Ryan, M. (2003). Problem-based learning meets case-based reasoning in the middle-school science classroom: Putting learning by design into practice. Journal of the Learning Sciences, 12(4), 495–547.
Krajcik, J. S., McNeill, K. L., & Reiser, B. J. (2008). Learning-goals-driven design model: Developing curriculum materials that align with national standards and incorporate project-based pedagogy. Science Education, 92(1), 1–32.
Linacre, J. M. (2005). WINSTEPS: Rasch measurement computer program [Computer software]. Chicago: Winsteps.com.
Linn, M. C., Bell, P., & Davis, E. A. (2004). Internet environments for science education. Mahwah, NJ: Lawrence Erlbaum.
American Institutes for Research Enhancing Middle School Science Lessons With Playground Activities—34

Maltese, A. V., & Tai, R. H. (2011). Pipeline persistence: Examining the association of educational experiences with earned degrees in STEM among U.S. students. Science Education, 95(5), 877–907. http://eric.ed.gov/?id=EJ936523
Marsh, H. W. (1990). The structure of academic self-concept: The Marsh/Shavelson model. Journal of Educational Psychology, 82(4), 623.
Marx, R., Blumenfeld, P., Krajcik, J., Fishman, B., Soloway, E., Geier, R., & Tal, T. (2004). Inquiry based science in the middle grades: Assessment of learning in urban systemic reform. Journal of Research in Science Education, 41(10), 1063–1080.
Mozart. (n.d.) Test inventory and development. Retrieved from https://www.cfa.harvard.edu/smgphp/mosart/aboutmosart_2.html
National Science Board (2007). National Action Plan for Addressing the Critical Needs of the U.S. Science, Technology, Engineering, and Mathematics Education System. Downloaded April 11, 2017 from https://www.nsf.gov/pubs/2007/nsb07114/nsb07114.pdf
Pintrich, P. R., & DeGroot, E. V. (1990). Motivational and self-regulated learning components of classroom academic performance. Journal of Educational Psychology, 82 (1), 33–40.
President's Council of Advisors on Science and Technology (2010) Prepare and inspire: K-12 education in science, technology, engineering, and math for America’s future. Downloaded February 18, 2017 from https://nsf.gov/attachments/117803/public/2a--Prepare_and_Inspire--PCAST.pdf
Rivet, A., & Krajcik, J. S. (2004). Achieving standards in urban systemic reform: An example of a sixth grade project-based science curriculum. Journal of Research in Science Teaching, 41(7), 669–692.
Salchegger, S. (2016). Selective school systems and academic self-concept: How explicit and implicit school-level tracking relate to the big-fish–little-pond effect across cultures. Journal of Educational Psychology, 108, 405–423.
Schneider, R. M. (2002). Performance of students in project-based science classrooms on a national measure of science achievement. Journal of Research in Science Teaching, 39(5), 410–422.
Shernoff, D. J., & Vandell, D. L. (2007). Engagement in after-school program activities: Quality of experience from the perspective of participants. Journal of Youth and Adolescence, 36(7), 891–903.
Skinner, E., Furrer, C., Marchand, G., & Kindermann, T. (2008). Engagement and disaffection in the classroom: Part of a larger motivational dynamic? Journal of Educational Psychology, 100(4), 765.
American Institutes for Research Enhancing Middle School Science Lessons With Playground Activities—35
Tinio, M. F. O. (2009). Academic engagement scale for grade school students. The Assessment Handbook, 2(1), 64–75.
Tisdal, C. (2004). Going APE! at the Exploratorium: Interim summative evaluation report. Chicago: Selinda Research Associates. Retrieved from http://informalscience.org/ evaluations/report_153.pdf
Trautwein, U., Ludtke, O., Marsh, H. W., Koller, O., & Baumert, J. (2006). Tracking, grading, and student motivation: Using group composition and status to predict self-concept and interest in ninth-grade mathematics. Journal of Educational Psychology, 98, 788–806.
What Works Clearinghouse. (2012). Evidence Review Protocol for Science Interventions, Version 2.0. Retrieved from https://ies.ed.gov/ncee/wwc/Docs/ReferenceResources/ science_protocol_v2.pdf
Wright, B. D. (1996). Time 1 to time 2 (pre-test to post-test) comparison: Racking and stacking. Rasch Measurement Transactions, 10(1), 478.
Wright, B. D., & Masters, G. N. (1982). Rating scale analysis: Rasch measurement. Chicago, IL: MESA Press.
Zuckerman, M., Porac, J., Lathin, D., Smith, R., & Deci, E. L. (1978). On the importance of self-determination for intrinsically motivated behavior. Personality and Social Psychology Bulletin, 4, 443–446.
American Institutes for Research Enhancing Middle School Science Lessons With Playground Activities—36

Appendix A. Playground Physics Curriculum Activities A description of the Playground Physics curriculum activities by unit is provided below. Program materials can be downloaded from the NYSCI noticing tool website: http://noticing.nysci.org/.
Getting Started
• LESSON 0.1 GETTING STARTED: INTRODUCTION TO PLAYGROUNDPHYSICS. This segment provides a high-level overview of the program components andorganization of the Playground Physics activity guide.
• LESSON 0.2 GETTING STARTED: BINGO. This activity helps students familiarizethemselves with the features of the Playground Physics app and helps them use the app torecord playful performances.
• LESSON 0.3: GETTING STARTED FUN WITH PHYSICS CENTERS(OPTIONAL). This lesson lays out suggested “centers” (activities) that student groupscan rotate through to collect videos required for later lessons.
• LESSON 0.4: GETTING STARTED SCIENCE INVESTIGATION (OPTIONAL).This lesson provides a template that can be used to guide students through the process ofconducting a science investigation. Students first plan their experiment, then makepredictions, observe their results, and use scientific principles to explain the results. Thislesson can be used to explore any of the lenses (motion, force, or energy) within thePlayground Physics app and can be completed as a stand-alone lesson or in addition tothe lessons in each unit.
Motion
• LESSON 1.0 MOTION: BACKGROUND CONTENT AND TEACHERINFORMATION. In this section, teachers will find information about the content that isfeatured throughout the unit. The information can be used as a reference when questionsabout motion arise in the classroom. The vocabulary in the lessons is described in verysimple terms for use with middle school students who are just starting to explore complexphysics ideas. Students will learn more detailed information about this same content andthe calculations behind the concepts in later grades. For now, teachers focus on thesimplified ideas as a way to introduce the content to students.
• LESSON 1.1 MOTION: PLAYING CATCH PART I. In this lesson, students playcatch with a friend and write a description of what they observe about the motion of theball when they play catch. This lesson is a starting place to help students connect to theirown experiences and does not require the use of the Playground Physics app.
• LESSON 1.2 MOTION: FUN WITH MOTION. In this lesson, students explore theirplay through the use of the app.
• LESSON 1.3 MOTION: PLAYING CATCH PART II. In this lesson, students return tothe activity of playing catch and explore the motion of the ball through the use of the app.
American Institutes for Research Enhancing Middle School Science Lessons With Playground Activities—A-1

• LESSON 1.4 MOTION: PLAYING CATCH PART III In this lesson, students lookfor patterns in their data and as a class compare/come to an agreement about the patternsthat exist in the motion of the ball while playing catch.
• LESSON 1.5 MOTION: DATA MATCH (OPTIONAL). This activity providesstudents with extra practice thinking about data presented in tables and graphs and whatthose data look like in action.
• LESSON 1.6 MOTION: FOUR CORNERS (OPTIONAL). This activity elicitsstudent thinking about representations of motion and the concept of speed. Through the“four corners” activity, students are required to use evidence to support their argument.
• LESSON 1.7 MOTION: ODD ONE OUT (OPTIONAL). This activity groups itemsrelated to motion that seem similar and challenges students to choose which item in thegroup is not like the others. Students use supporting evidence to explain their reasoning.
• LESSON 1.8 MOTION: HOME RUN! Students revisit the writing they did at thebeginning of the lesson to add in more details and demonstrate all that they have learnedabout motion.
Force
• LESSON 2.0 FORCE: BACKGROUND CONTENT AND TEACHERINFORMATION. This section includes information about the content that is featuredthroughout the unit. Teachers can use the information as a reference when questionsabout force arise in the classroom. The vocabulary in the lessons is described in verysimple terms for use with middle school students who are just beginning to explorecomplex physics ideas. Students will learn more detailed information about this contentand the calculations behind the concepts in later grades. For now, it is recommended thatteachers focus on the simplified ideas as a way to introduce the content to students.
• LESSON 2.1 FORCE: JUMPING ROPE PART I. In this lesson, students jump ropeand write a description of what they observe about the forces on their bodies as they leavethe ground and then return again. This lesson is a starting place to help students connect totheir own lived experiences and does not require the use of the Playground Physics app.
• LESSON 2.2 FORCE: FUN WITH FORCE. In this lesson, students get to exploretheir play through the use of the app.
• LESSON 2.3 FORCE: JUMPING ROPE PART II. In this lesson, students return tothe activity of jumping rope and explore the forces at play through the use of the app.
• LESSON 2.4 FORCE: JUMPING ROPE PART III. In this lesson, students look forpatterns in their data and, as a class, compare/come to an agreement about the patternsthat exist in the forces that act on a person who is jumping rope.
• LESSON 2.5 FORCE: FOUR CORNERS (OPTIONAL). This activity elicits studentthinking about forces. Through the “four corners” activity, students are required to useevidence to support their argument.
American Institutes for Research Enhancing Middle School Science Lessons With Playground Activities—A-2

• LESSON 2.6 FORCE: ODD ONE OUT (OPTIONAL). This activity groups itemsrelated to force that seem similar and challenges students to choose which item in thegroup is not like the others. Students use supporting evidence to explain their reasoning.
• LESSON 2.7 FORCE: DOUBLE DUTCH. In this lesson, students revisit the writingthey did at the beginning of the unit to add in more details and demonstrate all that theyhave learned about forces.
Energy
• LESSON 3.0 ENERGY: BACKGROUND CONTENT AND TEACHERINFORMATION. In this section, you will find information about the content that isfeatured throughout the unit. You can use the information to refresh your memory or as areference when questions about energy arise in your classroom. The vocabulary in thelessons is described in simple terms for use with middle school students who are just startingto explore complex physics ideas. Students will learn more detailed information about thissame content and the calculations behind the concepts in later grades. For now, we suggestfocusing on the simplified ideas as a way to introduce the content to your students.
• LESSON 3.1 ENERGY: SWINGING—PART I. In this lesson, students swing andwrite a description of what they observe about energy as they swing back and forth. Thislesson is a starting place to help students connect to their own experiences and does notrequire the use of the Playground Physics app.
• LESSON 3.2 ENERGY: FUN WITH ENERGY. In this lesson, students get to exploretheir play through the use of the app.
• LESSON 3.3 ENERGY: SWINGING—PART II. In this lesson, students return to theactivity of swinging and explore the energy involved with swinging through the use ofthe app.
• LESSON 3.4 ENERGY: SWINGING—PART III. In this lesson, students look forpatterns in their data and, as a class, compare/come to an agreement about the patternsthat exist in the energy of someone swinging.
• LESSON 3.5 ENERGY: FOUR CORNERS (OPTIONAL). This activity elicitsstudent thinking about potential energy and kinetic energy. Through the “four corners”activity, students are required to use evidence to support their argument.
• LESSON 3.6 ENERGY: ODD ONE OUT (OPTIONAL). This activity groups itemsrelated to energy that seem similar and challenges students to choose which item in thegroup is not like the others. Students use supporting evidence to explain their reasoning.
• LESSON 3.7 ENERGY: SWINGING HIGHER. In this lesson, students revisit thewriting they did at the beginning of the unit to add in more details and demonstrate allthat they have learned about energy.
American Institutes for Research Enhancing Middle School Science Lessons With Playground Activities—A-3

Appendix B. Student Outcome Measures B.1. Playground Physics Student Survey Aligned to Student Affect Constructs
Section 18: Below are several sentences about science. For each sentence, check the box that describes how much you agree with that sentence.
When you think about doing science, howmuch do you agree or disagree with the following sentences?
ReallyDisagree Disagree Agree Really
Agree
1. Compared to others my age, I am good atscience.
2. I get good grades in science.
3. Work in science is easy for me.
4. I’m hopeless when it comes to science.*
5. I learn things quickly in science.
6. I have always done well in science.
Section 29: Below are several sentences about science. For each sentence, check the box that describes how much you agree with that sentence.
When you think about your interest in science, how much do you agree ordisagree with the following sentences?
ReallyDisagree Disagree Agree Really
Agree
7. I would like to learn more about science.
8. Science is a topic that I enjoy studying.
9. Science is boring.
10. Learning to solve new science problems isinteresting.
11. I like learning about science.
12. I enjoy hearing about science.
13. I would enjoy belonging to a science club.
14. I like talking to friends about science.
15. Science is one of the most interestingschool subjects.
16. What I learn in science class can be usedto solve everyday problems.
17. I like reading books about science.
8 Measures student attitudes toward science: Science self-concept 9 Measures student attitudes toward science: Interest in science
American Institutes for Research Enhancing Middle School Science Lessons With Playground Activities—B-1

Section 310: When you think about your experiences in this class, how much do you agree or disagree with the following sentences?
In this science class… ReallyDisagree Disagree Agree Really
Agree 18. I paid careful attention.
19. I actively participated.
20. I took part in class assignments.
21. I listened very carefully.
22. I worked hard on what I was supposed todo.
23. I stayed focused on the class activity.
24. I ignored what the teacher was saying. *
25. I enjoyed the activities we did.
26. Class was fun.
27. I enjoyed working with my classmates.
28. I often felt frustrated. *
29. Sometimes I got so interested in my workI didn’t want to stop.
30. I liked the ways we learned things.
31. I often felt bored.*
Section 411: Please rate your level of agreement for each of these sentences about your science class.
ReallyDisagree Disagree Agree Really
Agree 32. I want to learn as much as possible from
this class.
33. It is important for me to understand eachscience lesson completely.
34. I want to be able to remember what Ilearned in this class even after the year isover.
35. I like getting assignments in this class thatreally challenge me to learn new things.
36. I hope to know a lot more about sciencewhen this school year is over.
10 Measures student engagement; questions 18–25 measure concentration, questions 26–29 measure enjoyment, and questions 30–31 measure interest.11 Measures student intrinsic motivation
American Institutes for Research Enhancing Middle School Science Lessons With Playground Activities—B-2

Section 512: We now want to know about your plans for the future. For each question below, let us know if you think you will do what we are asking about.
When you think about the future, howlikely are you to do the following? No Maybe Probably Yes,
Definitely 37. Take more than the required number of
science classes in high school?
38. Take Advanced Placement scienceclasses, courses that give college credit,in high school?
39. Attend college?
40. Take science classes in college?
41. Major in a science-related field incollege?
42. Look for a job which uses science?
Section 613: You will read several sentences about your experience using SciPlay, an app that can help students learn about science concepts through video recordings. For each statement, indicate whether you used the SciPlay app.
In this science class… Yes No Not Sure 43. I recorded videos using the SciPlay app.
44. I traced the path of objects using the SciPlayapp.
45. I used stickers in the SciPlay app.
* Survey items were reverse coded for the scaling.
12 Measures student educational aspirations 13 Questions treated as manipulation check to see if students recall participation in Playground Physics.
American Institutes for Research Enhancing Middle School Science Lessons With Playground Activities—B-3
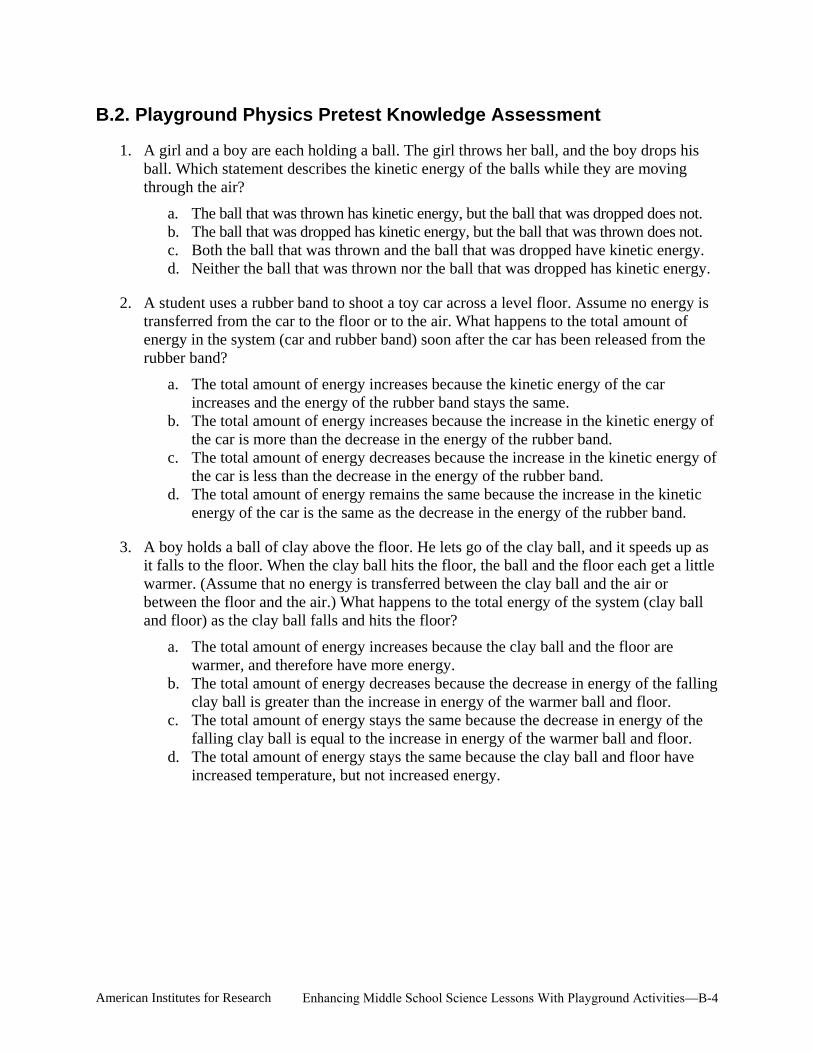
B.2. Playground Physics Pretest Knowledge Assessment
1. A girl and a boy are each holding a ball. The girl throws her ball, and the boy drops hisball. Which statement describes the kinetic energy of the balls while they are movingthrough the air?
a. The ball that was thrown has kinetic energy, but the ball that was dropped does not.b. The ball that was dropped has kinetic energy, but the ball that was thrown does not.c. Both the ball that was thrown and the ball that was dropped have kinetic energy.d. Neither the ball that was thrown nor the ball that was dropped has kinetic energy.
2. A student uses a rubber band to shoot a toy car across a level floor. Assume no energy istransferred from the car to the floor or to the air. What happens to the total amount ofenergy in the system (car and rubber band) soon after the car has been released from therubber band?
a. The total amount of energy increases because the kinetic energy of the carincreases and the energy of the rubber band stays the same.
b. The total amount of energy increases because the increase in the kinetic energy ofthe car is more than the decrease in the energy of the rubber band.
c. The total amount of energy decreases because the increase in the kinetic energy ofthe car is less than the decrease in the energy of the rubber band.
d. The total amount of energy remains the same because the increase in the kineticenergy of the car is the same as the decrease in the energy of the rubber band.
3. A boy holds a ball of clay above the floor. He lets go of the clay ball, and it speeds up asit falls to the floor. When the clay ball hits the floor, the ball and the floor each get a littlewarmer. (Assume that no energy is transferred between the clay ball and the air orbetween the floor and the air.) What happens to the total energy of the system (clay balland floor) as the clay ball falls and hits the floor?
a. The total amount of energy increases because the clay ball and the floor arewarmer, and therefore have more energy.
b. The total amount of energy decreases because the decrease in energy of the fallingclay ball is greater than the increase in energy of the warmer ball and floor.
c. The total amount of energy stays the same because the decrease in energy of thefalling clay ball is equal to the increase in energy of the warmer ball and floor.
d. The total amount of energy stays the same because the clay ball and floor haveincreased temperature, but not increased energy.
American Institutes for Research Enhancing Middle School Science Lessons With Playground Activities—B-4

4. Imagine a ball on a track where no energy is transferred from the ball to the track or tothe air. The ball starts from rest at the position labeled Start. Will the ball have enoughenergy to go over the hill on the track?
a. Yes, because the energy that the ball gains as it goes down the first slope will begreater than the amount of energy it will lose as it goes up the hill.
b. Yes, because the ball gains energy the entire time it is moving, so it will haveenough energy to go over the hill.
c. No, because the total amount of energy in the system remains the same, so theball cannot go any higher than the point it started from.
d. No, because the total amount of energy of the ball will decrease as it moves alongthe track, and it will not have enough energy to go over the hill.
5. Two pine cones are falling from a pine tree. Both pine cones are falling at the samespeed. Pine Cone 1 weighs less than Pine Cone 2. Which statement describes the kineticenergy of the pine cones?
American Institutes for Research Enhancing Middle School Science Lessons With Playground Activities—B-5

a. Pine Cone 1 has more kinetic energy.b. Pine Cone 2 has more kinetic energy.c. Both pine cones have the same amount of kinetic energy.d. Neither pine cone has any kinetic energy.
6. Two identical balls are rolling down a hill. Ball 2 is rolling faster than Ball 1. Which ballhas more kinetic energy?
a. Ball 1 has more kinetic energy.b. Ball 2 has more kinetic energy.c. Both balls have the same amount of kinetic energy.d. More information is needed to determine which ball has more kinetic energy.
7. A student places two books on a table. One book weighs less than the other book. Whichbook has less gravitational potential energy? (Consider the reference point for the groundto be the floor.)
a. The book that weighs less has less gravitational potential energy.b. The book that weighs more has less gravitational potential energy.c. Both books have the same amount of gravitational potential energy.d. Neither book has any gravitational potential energy.
8. A coconut is falling from a palm tree. In which position does the coconut have the mostgravitational potential energy?
Position 1 Position 2 Position 3 Position 4
a. Position 1b. Position 2c. Position 3d. Position 4
American Institutes for Research Enhancing Middle School Science Lessons With Playground Activities—B-6

9. Which of the following is an example of the transformation of gravitational potentialenergy into kinetic energy?
a. A tire rolling along a level floor
b. A ball going up after being tossed into the air
c. A drop of water falling from a faucet into a sink
d. A car on a flat oval race track
10. A girl and a boy are playing on a teeter-totter. They both weigh the same. While the boyis down and the girl is up, which child has more gravitational potential energy?
a. The boy has more gravitational potential energy.b. The girl has more gravitational potential energy.c. They have the same amount of gravitational potential energy.d. They do not have any gravitational potential energy.
11. A boy holds a book above the floor. He lets go of the book and the book speeds up as itfalls to the floor. Which statement describes the energy of the book as it falls?
a. Its kinetic energy increases and its gravitational potential energy increases.b. Its gravitational potential energy decreases but its kinetic energy does not change.c. Its gravitational potential energy decreases and its kinetic energy increases.d. Its kinetic energy increases but its gravitational potential energy does not change.
American Institutes for Research Enhancing Middle School Science Lessons With Playground Activities—B-7

12. An escalator at a shopping mall is 10 m long and moves at a constant speed of 0.5 m/s. IfJosé steps onto the escalator at the bottom while it is moving, how long will it take him totravel the 10 m?
a. 5 sb. 10 sc. 15 sd. 20 s
13. Which graph below shows an object slowing down?
14. A ball is thrown straight up into the air. What happens to the ball’s speed as it goes upand as it comes down?
a. The ball goes up at a constant speed, stops, and then comes down at a constant speed.b. The ball goes up at a constant speed, stops, and then moves faster and faster as it
comes down.c. The ball goes up at a slower and slower speed, stops, and then comes down at a
constant speed.d. The ball goes up at a slower and slower speed, stops, and then comes down faster
and faster.
American Institutes for Research Enhancing Middle School Science Lessons With Playground Activities—B-8
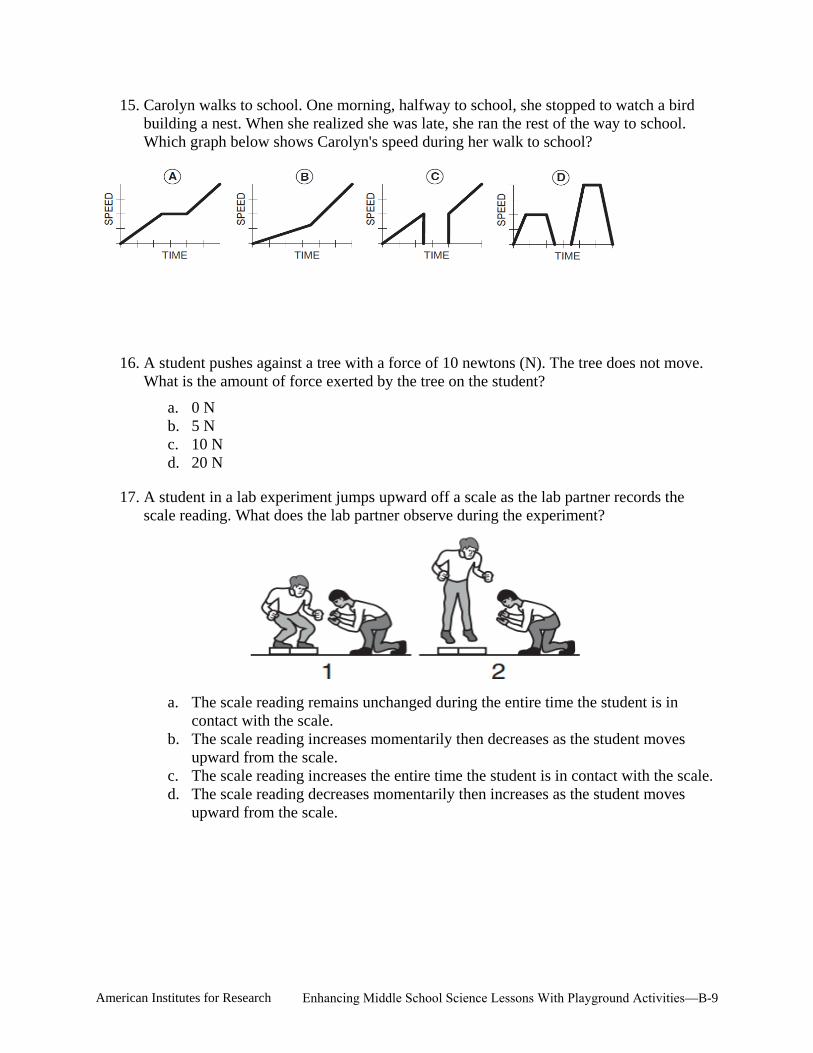
15. Carolyn walks to school. One morning, halfway to school, she stopped to watch a birdbuilding a nest. When she realized she was late, she ran the rest of the way to school.Which graph below shows Carolyn's speed during her walk to school?
16. A student pushes against a tree with a force of 10 newtons (N). The tree does not move.What is the amount of force exerted by the tree on the student?
a. 0 Nb. 5 Nc. 10 Nd. 20 N
17. A student in a lab experiment jumps upward off a scale as the lab partner records thescale reading. What does the lab partner observe during the experiment?
a. The scale reading remains unchanged during the entire time the student is incontact with the scale.
b. The scale reading increases momentarily then decreases as the student movesupward from the scale.
c. The scale reading increases the entire time the student is in contact with the scale.d. The scale reading decreases momentarily then increases as the student moves
upward from the scale.
American Institutes for Research Enhancing Middle School Science Lessons With Playground Activities—B-9
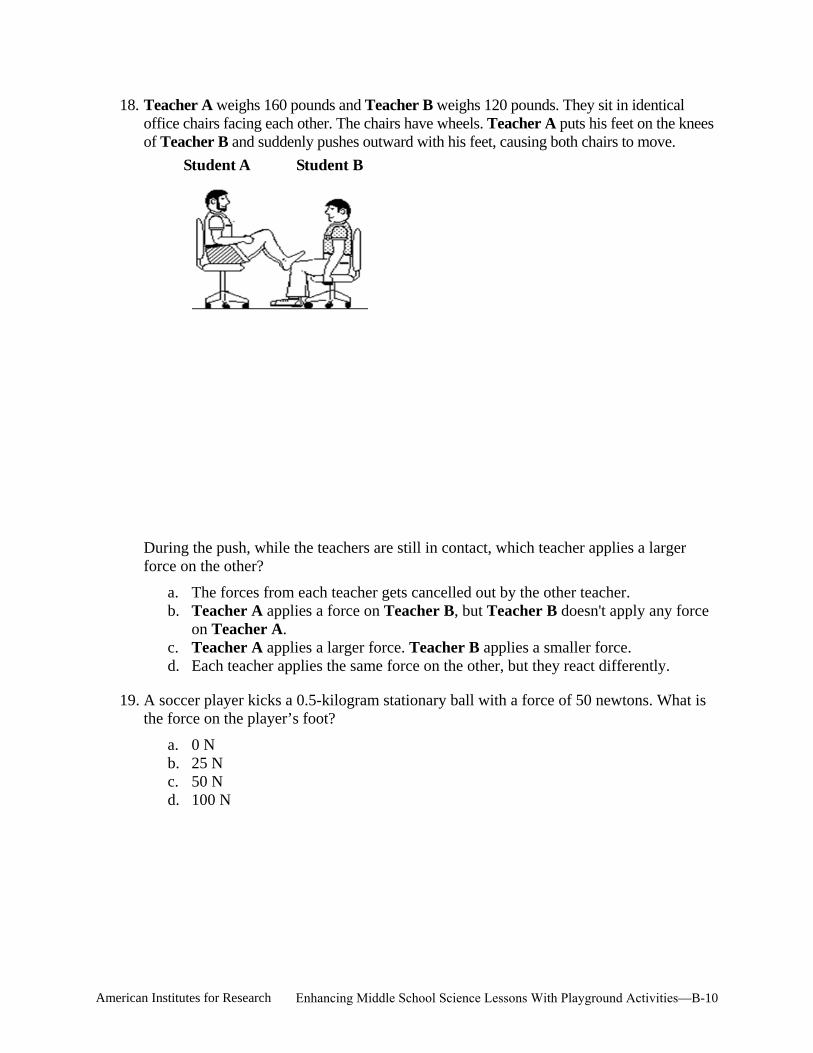
18. Teacher A weighs 160 pounds and Teacher B weighs 120 pounds. They sit in identicaloffice chairs facing each other. The chairs have wheels. Teacher A puts his feet on the kneesof Teacher B and suddenly pushes outward with his feet, causing both chairs to move.
Student A Student B
During the push, while the teachers are still in contact, which teacher applies a larger force on the other?
a. The forces from each teacher gets cancelled out by the other teacher.b. Teacher A applies a force on Teacher B, but Teacher B doesn't apply any force
on Teacher A.c. Teacher A applies a larger force. Teacher B applies a smaller force.d. Each teacher applies the same force on the other, but they react differently.
19. A soccer player kicks a 0.5-kilogram stationary ball with a force of 50 newtons. What isthe force on the player’s foot?
a. 0 Nb. 25 Nc. 50 Nd. 100 N
American Institutes for Research Enhancing Middle School Science Lessons With Playground Activities—B-10

20. A worker in a warehouse pushes two wooden boxes across a floor at a constant speed, asshown in the diagram below.
The arrow in the diagram represents the force Box 1 exerts on Box 2. Which arrow represents the reaction force?
a.
b.
c. d.
American Institutes for Research Enhancing Middle School Science Lessons With Playground Activities—B-11

B.3. Playground Physics Posttest Knowledge Assessment
1. A girl and a boy are each holding a ball. The girl throws her ball, and the boy drops hisball. Which statement describes the kinetic energy of the balls while they are movingthrough the air?
a. The ball that was thrown has kinetic energy, but the ball that was dropped doesnot.
b. The ball that was dropped has kinetic energy, but the ball that was thrown doesnot.
c. Both the ball that was thrown and the ball that was dropped have kinetic energy.d. Neither the ball that was thrown nor the ball that was dropped has kinetic energy.
2. An engineer is building a roller coaster and wants the roller coaster car to go over twohills. In order for the roller coaster car to make it over both hills, should the first hill behigher or lower than the second hill?
a. The first hill has to be higher than the second hill because the roller coaster carwill lose energy as it rolls along the track, so it will not be able to get over asecond hill that is as high as the first hill.
b. The first hill can be lower than the second hill because the roller coaster car willgain enough energy as it rolls along the track to get over a second hill that ishigher than the first hill.
c. It doesn’t matter which hill is higher as long as they are both lower than thestarting point because no energy is lost as the roller coaster car rolls along thetrack, so it can get over any hill that is lower than the starting point.
d. It doesn’t matter which hill is higher because even though the total amount ofenergy that the roller coaster car has will decrease going uphill, it will increaseenough going downhill to get over any size hill.
3. A boy holds a ball of clay above the floor. He lets go of the clay ball, and it speeds up asit falls to the floor. When the clay ball hits the floor, the ball and the floor each get a littlewarmer. (Assume that no energy is transferred between the clay ball and the air orbetween the floor and the air.) What happens to the total energy of the system (clay balland floor) as the clay ball falls and hits the floor?
a. The total amount of energy increases because the clay ball and the floor arewarmer, and therefore have more energy.
b. The total amount of energy decreases because the decrease in energy of the fallingclay ball is greater than the increase in energy of the warmer ball and floor.Although
c. The total amount of energy stays the same because the decrease in energy of thefalling clay ball is equal to the increase in energy of the warmer ball and floor.
d. The total amount of energy stays the same because the clay ball and floor haveincreased temperature, but not increased energy.
American Institutes for Research Enhancing Middle School Science Lessons With Playground Activities—B-12

4. Is energy transformed while a rock is falling from a cliff?a. Yes, kinetic energy is transformed into gravitational potential energy as the rock
falls.b. Yes, gravitational potential energy is transformed into kinetic energy as the rock
falls.c. No, because the rock lost all of its gravitational potential energy once it started to
move.d. No, because one form of energy cannot be transformed into another form of
energy.
5. Two pine cones are falling from a pine tree. Both pine cones are falling at the samespeed. Pine Cone 1 weighs less than Pine Cone 2. Which statement describes the kineticenergy of the pine cones?
a. Pine Cone 1 has more kinetic energy.b. Pine Cone 2 has more kinetic energy.c. Both pine cones have the same amount of kinetic energy.d. Neither pine cone has any kinetic energy.
American Institutes for Research Enhancing Middle School Science Lessons With Playground Activities—B-13

6. A man is driving a car. He slows down to stop at a stop sign. When does the car have themost kinetic energy?
a. When the car's speed is 30 miles per hourb. When the car's speed is 15 miles per hourc. When the car's speed is 0 miles per hourd. The car's kinetic energy is the same at all speeds
7. Object 1 and Object 2 are the same distance from the center of Earth, but Object 1 hasmore gravitational potential energy than Object 2. How does the weight of Object 1compare to the weight of Object 2?
a. Object 1 weighs more than Object 2b. Object 1 weighs less than Object 2.c. Object 1 weighs the same as Object 2.d. More information is needed to compare the weights of the objects.
8. A coconut is falling from a palm tree. In which position does the coconut have the mostgravitational potential energy?
Position 1 Position 2 Position 3 Position 4
a. Position 1b. Position 2c. Position 3d. Position 4
American Institutes for Research Enhancing Middle School Science Lessons With Playground Activities—B-14

a.
b.
c.
9. Which of the following is an example of the transformation of gravitational potentialenergy into kinetic energy?
A tire rolling along a level floor
A ball going up after being tossed into the air
A drop of water falling from a faucet into a sink d. A car on a flat oval race track
10. A person hangs three pictures on the wall. The pictures all weigh the same. Picture 1 andPicture 2 are at the same height above the floor. Picture 3 is directly below Picture 1.Which pictures have the same amount of gravitational potential energy?
a. Pictures 1 and 2b. Pictures 1 and 3c. Pictures 2 and 3d. Pictures 1, 2, and 3
11. How does changing the speed of an object affect the kinetic energy of the object?a. A decrease in speed causes an increase in kinetic energy.b. An increase in speed causes an increase in kinetic energy.c. An increase in speed causes no change in kinetic energy.d. A decrease in speed causes no change in kinetic energy.
12. In 2 seconds, a ball travels 100 cm. What is the average speed of the ball?a. 25 cm/secb. 50 cm/secc. 100 cm/secd. 200 cm/sec
13. Kaitly is watching a wind-up toy walking across a table. She observes that the toy covers1 cm every second for 10 seconds. What graph below most closely represents the toy'sjourney across the table?
14. A ball is thrown straight up into the air. What happens to the ball’s speed as it goes upand as it comes down?
a. The ball goes up at a constant speed, stops, and then comes down at a constant speed.b. The ball goes up at a constant speed, stops, and then moves faster and faster as it
comes down.c. The ball goes up at a slower and slower speed, stops, and then comes down at a
constant speed.
American Institutes for Research Enhancing Middle School Science Lessons With Playground Activities—B-15

d. The ball goes up at a slower and slower speed, stops, and then comes down fasterand faster
15. Carolyn walks to school. One morning, halfway to school, she stopped to watch a birdbuilding a nest. When she realized she was late, she ran the rest of the way to school.Which graph below shows Carolyn's speed during her walk to school?
16. A student pushes against a wall with 20 N of force and the wall does not move. Howmuch force does the wall exert?
a. 0 Nb. Less than 20 Nc. 20 Nd. More than 20 N
American Institutes for Research Enhancing Middle School Science Lessons With Playground Activities—B-16

17. A student in a lab experiment jumps upward off a scale as the lab partner records thescale reading. What does the lab partner observe during experiment?
a. The scale reading remains unchanged during the entire time the student is incontact with the scale.
b. The scale reading increases momentarily then decreases as the student movesupward from the scale.
c. The scale reading increases the entire time the student is in contact with the scale.d. The scale reading decreases momentarily then increases as the student moves
upward from the scale.
18. A toy school bus and a toy car crash head-on. Which applies a larger force on the other?a. The toy bus, because it's heavierb. Neither applies any force on the other; the toy car gets smashed up because it's in
the way of the toy busc. The toy bus applies a force on the toy car, but the toy car doesn't apply any force
on the toy busd. They both apply the same force on each other; the toy car gets smashed up
because it has less substance
19. A soccer player kicks a 0.5-kilogram stationary ball with a force of 50 newtons. What isthe force on the player’s foot?
a. 0 Nb. 25 Nc. 50 Nd. 100 N
20. A worker in a warehouse pushes two wooden boxes across a floor at a constant speed, asshown in the diagram below.
The arrow in the diagram represents the force Box 1 exerts on Box 2. Which arrow represents the reaction force?
a. b. c. d.
American Institutes for Research Enhancing Middle School Science Lessons With Playground Activities—B-17

Appendix C. Teacher Survey C.1. Playground Physics Teacher Survey – Impact Study, Treatment Condition
Introduction
Welcome to the Playground Physics Teacher Survey!
You will be presented with several questions related to 4 topic areas: (1) Training and Support (2) Playground Physics App and Curriculum Use (3) Playground Physics Opinions (4) Background Information
This survey is for teachers who are participating in the Playground Physics study during the 2015-16 school year. This survey should not be taken by school administrators, science consultants, or other non-teaching staff.
Please click the "Next" button at the bottom of each screen to advance to the following page of the survey. The survey should take about 15–20 minutes to complete.
Training and Support
In this section, you will be asked to describe your experiences with Playground Physics professional development and support.
1. Did New York Hall of Science (NYSCI) provide you with the following resources?*(Yes, No)
a. Class set of iPads with the Playground Physics app installedb. Playground Physics curriculum (Activity Guide)
2. How well did NYSCI’s professional development prepare you to teach PlaygroundPhysics? (Select one)
a. Not at all/slightlyb. Somewhatc. Moderatelyd. Very much so
3. What advice would you give to NYSCI about how to improve professional development?(Open response)
You have completed Section 1 of 4. Please press the Next button to continue to the next section.
American Institutes for Research Enhancing Middle School Science Lessons With Playground Activities—C-1

Playground Physics App. and Curriculum Use
In this section, you will be asked about the different Playground Physics lessons your class used.
Please answer the following questions with a single science classroom in mind. If you used Playground Physics with more than one classroom, answer these questions with respect to the class that was scheduled second during the school day.
4. Please write the start and end times for the class period during which Playground Physicswas used. If it was used with more than one class period, select the class that is scheduledsecond during the day.*
a. Start time:b. End time:
5. How many students are in this class? * (Enter integer)
6. What grade level is this class? * (Select all that apply)a. 6b. 7c. 8d. Other (please describe)
7. What proportion of students in this class are English Language Learners?* (Select one)a. Noneb. 1% – 20%c. 21% – 40%d. 41% – 60%e. 61% – 80%f. 81% – 100%g. Not sure
8. What proportion of students in this class have an Individualized Education Plan (IEP)?*(Select one)
a. Noneb. 1% – 20%c. 21% – 40%d. 41% – 60%e. 61% – 80%f. 81% – 100%g. Not sure
American Institutes for Research Enhancing Middle School Science Lessons With Playground Activities—C-2

Getting Started
9. How did you introduce the Playground Physics app to your class? (choose all that apply)a. Used lesson 0.2 Getting Started – Bingob. Modified 0.2 Getting Started – Bingoc. Created my own lesson to introduce the appd. I did not teach a separate lesson to teach my students how to use the app
Branching: If c or d is selected jump to next question. If a or b is selected jump to the next section.
10. Please describe how you introduced Playground Physics app to your class. (Open response)
Implementation of Motion Lessons
Reminder: Please answer the following questions with a single science classroom in mind. If you used Playground Physics with more than one classroom, answer these questions with respect to the class that was scheduled second during the school day.
11. In total, how many class periods have you spent teaching motion (e.g. speed, position)this year? Include all class periods spent on this topic, whether they involved PlaygroundPhysics or any other curriculum.* (Enter integer 0 – 9 or 10 or more, select one)
Branching: If 1 – 10 or more, jump to next question. If 0, jump to next section. 12. Did you use Playground Physics to teach motion concepts to this classroom?* (Select
one)a. Yesb. No
Branching: If yes, jump to next question. If no, jump to Q21.
13. Of the [QXX] class periods you taught motion to this class, how many class periodsinvolved Playground Physics?* (Enter integer 1 – 9 or 10 or more, select one)
14. Did you use Playground Physics Option 1 (the progression of lessons for Unit 1) to teachmotion to this class? This option included the following lessons from Unit 1: (Iimplemented all of the parts, I implemented some of the parts, I didn’t implement any ofthe parts, No; Select one)• 1.1 – Playing Catch I• 1.2 – Fun with Motion• 1.3 – Playing Catch II• 1.4 – Playing Catch III• 1.8 – Home Run!
American Institutes for Research Enhancing Middle School Science Lessons With Playground Activities—C-3

15. Did you use Playground Physics Option 2 (0.4– Science Investigation) to teach motion tothis class? (Select one)
a. Yesb. Yes, but we didn’t have time to finish it.c. No
16. Which, if any, of the following optional Playground Physics lessons did you use to teachmotion to this class? (Select all that apply)
a. Optional Lesson 1.5 – Data Matchb. Optional Lesson 1.6 – Four Cornersc. Optional Lesson 1.7 – Odd One Outd. None of the lesson options were used
17. Along with Playground Physics, how much of your regular (non-Playground Physics)motion curriculum did you use? (Select one)
a. None. I used only Playground Physics to teach motion.b. Some. I supplemented Playground Physics with some materials and activities
from my regular curriculum.c. All. I used all of my regular curriculum and supplemented it with Playground
Physics.
18. To what extent did you find Playground Physics supported student learning of motion?(Select one)
a. Not at all/slightlyb. Somewhatc. Moderatelyd. Very much so
19. The next time you teach motion, would you use Playground Physics again? (Select one)a. Yesb. Yes, with changesc. Maybed. No
20. Please explain your previous two ratings.(Open response)
Branching: If yes was selected in Q12, jump to next section after Q20 is answered. If no was selected in Q12, jump from Q12 to Q21.
21. Briefly explain why you decided not to use Playground Physics to teach motion. (Openresponse)
American Institutes for Research Enhancing Middle School Science Lessons With Playground Activities—C-4

Implementation of Force Lessons
Reminder: Please answer the following questions with a single science classroom in mind. If you used Playground Physics with more than one classroom, answer these questions with respect to the class that was scheduled second during the school day.
22. In total, how many class periods have you spent teaching force (e.g. Newton's third lawof equal and opposite forces) this year? Include all class periods spent on this topic,whether they involved Playground Physics or any other curriculum.* (Enter integer 0 – 9or 10 or more, select one)
Branching: If 1 – 10 or more, jump to next question. If 0, jump to next section.
23. Did you use Playground Physics to teach force concepts to this classroom?* (Select one)a. Yesb. No
Branching: If yes, jump to next question. If no, jump to Q32.
24. Of the [QXX] class periods you taught force to this class, how many class periods involved Playground Physics?* (Enter integer 1 – 9 or 10 or more, select one)
25. Did you use Playground Physics Option 1 (the progression of lessons for Unit 2) to teachforce to this class? This option included the following lessons from Unit 2: (Iimplemented all of the parts, I implemented some of the parts, I didn’t implement any ofthe parts, ; Select one)• 2.1 – Jumping Rope I• 2.2 – Fun with Force• 2.3 – Jumping Rope II• 2.4 – Jumping Rope III• 2.7 – Double Dutch!
26. Did you use Playground Physics Option 2 (0.4– Science Investigation) to teach force tothis class? (Select one)
a. Yesb. Yes, but we didn’t have time to finish it.c. No
27. Which, if any, of the following optional Playground Physics lessons did you use to teachforce to this class? (Select all that apply)
a. Optional Lesson 2.5 – Four Cornersb. Optional Lesson 2.6 – Odd One Outc. None of the lesson options were used
American Institutes for Research Enhancing Middle School Science Lessons With Playground Activities—C-5

28. Along with Playground Physics, how much of your regular (non-Playground Physics)force curriculum did you use? (Select one)
a. None. I used only Playground Physics to teach force.b. Some. I supplemented Playground Physics with some materials and activities
from my regular curriculum.c. All. I used all of my regular curriculum and supplemented it with Playground
Physics.
29. To what extent did you find Playground Physics supported student learning of force?(Select one)
a. Not at all/slightlyb. Somewhatc. Moderatelyd. Very much so
30. The next time you teach force, would you use Playground Physics again? (Select one)a. Yesb. Yes, with changesc. Maybed. No
31. Please explain your previous ratings. (Open response)
Branching: If yes was selected in Q23, jump to next section after Q31 is answered. If no was selected in Q23, jump from Q23 to Q32.
32. Briefly explain why you decided not to use Playground Physics to teach force. (Openresponse)
Implementation of Energy Lessons
Reminder: Please answer the following questions with a single science classroom in mind. If you used Playground Physics with more than one classroom, answer these questions with respect to the class that was scheduled second during the school day.
33. In total, how many class periods have you spent teaching energy (e.g., energytransformation, potential energy, kinetic energy) this year? Include all class periods spenton this topic, whether they involved Playground Physics or any other curriculum.* (Enterinteger 0 – 9 or 10 or more, select one)
Branching: If 1 – 10 or more, jump to next question. If 0, jump to next section.
34. Did you use Playground Physics to teach energy concepts to this classroom?* (Select one)a. Yesb. No
Branching: If yes, jump to next question. If no, jump to Q43.
American Institutes for Research Enhancing Middle School Science Lessons With Playground Activities—C-6

35. Of the [QXX] class periods you taught energy to this class, how many class periodsinvolved Playground Physics?* (Enter integer 1 – 9 or 10 or more, select one)
36. Did you use Playground Physics Option 1 (the lesson progression for Unit 3) to teachenergy to this class? This option included the following lessons from Unit 3: (Iimplemented all of the parts, I implemented some of the parts, I didn’t implement any ofthe parts,; Select one)• 3.1 – Swinging I• 3.2 – Fun with Energy• 3.3 – Swinging II• 3.4 – Swinging III• 3.7 – Swinging Higher!
37. Did you use Playground Physics Option 2 (0.4– Science Investigation) to teach energy tothis class? (Select one)
a. Yesb. Yes, but we didn’t have time to finish it.c. No
38. Which, if any, of the following optional Playground Physics lessons did you use to teachenergy to this class? (Select all that apply)
a. Optional Lesson 3.5 – Four Cornersb. Optional Lesson 3.6 – Odd One Outc. I did not use any of the optional lessons.
39. Along with Playground Physics, how much of your regular (non-Playground Physics)energy curriculum did you use? (Select one)
a. None. I used only the Playground Physics to teach energy.b. Some. I supplemented the Playground Physics with some materials and activities
from my regular curriculum.c. All. I used all of my regular curriculum and supplemented it with Playground
Physics.
40. To what extent did you find Playground Physics supported student learning of energy?(Select one)
a. Not at all/slightlyb. Somewhatc. Moderatelyd. Very much so
41. The next time you teach energy, would you use Playground Physics again? (Select one)e. Yesf. Yes, with changesg. Maybeh. No
American Institutes for Research Enhancing Middle School Science Lessons With Playground Activities—C-7

42. Please explain your previous two ratings.(Open response)
Branching: If yes was selected in Q34, jump to next section after Q42 is answered. If no was selected in Q34, jump from Q34 to Q43.
43. Briefly explain why you decided not to use Playground Physics to teach energy. (Openresponse)
You have completed Section 2 of 4. Please press the Next button to continue to the next section.
Playground Physics Opinions
44. How easy was it for students to use the Playground Physics app? (Select one)a. Not easy at allb. Somewhat easyc. Moderately easyd. Very easye. Did not use this feature
45. Describe the level of student engagement during the Playground Physics lessons, whereengagement is defined as focus on instructional activities. (Select one)
a. Students were less engaged than in conventional lessons on these topics.b. Students were equally engaged as in conventional lessons on these topics.c. Students were more engaged than in conventional lessons on these topics.
46. How well did the Playground Physics curriculum match with... (Not at all/slightly,somewhat, moderately, very much so, select one)
a. Your students' physics ability level in this classb. New York state science standards for this grade levelc. Your instructional style
47. Please describe student reactions to Playground Physics. (Open response)
48. In your opinion, what aspects of Playground Physics worked well? (Open response)
49. In your opinion, what aspects of Playground Physics did not work well? (Open response)
50. What additional advice would you give to NYSCI about how to improve PlaygroundPhysics?(Open response)
You have completed Section 3 of 4. Please press the Next button to continue to the next section.
American Institutes for Research Enhancing Middle School Science Lessons With Playground Activities—C-8

Background Information
The following items will ask you to describe your current teaching assignments and characteristics of your teacher preparation.
51. Which school do you teach at?* (Select one, prepopulated list)
52. Including this year, how many years have you been teaching?* (Enter integer)
53. Including this year, how many years have you been teaching science?* (Enter integer)
54. Including this year, how many years have you been teaching physics?* (Enter integer)
55. Select the highest degree you have earned. (Select one)a. Associatesb. Bachelorsc. Mastersd. Doctorate
56. How comfortable are you with supplementing your science curriculum with digitalresources (e.g., simulations, science-related computer games, etc.)? (Select one)
a. Not at all comfortableb. Somewhat comfortablec. Mostly comfortabled. Very comfortable
You have completed Section 4 of 4. Please press Finish to submit the survey.
American Institutes for Research Enhancing Middle School Science Lessons With Playground Activities—C-9

C.2. Physics instruction Teacher Survey – Impact Study, ControlCondition
Introduction
Welcome to the Physics Instruction Survey!
You will be presented with several questions related to 2 topic areas: (1) Physics instruction (2) Background Information
This survey is for teachers who are participating in the Playground Physics study during the 2015-16 school year. This survey should not be taken by school administrators, science consultants, or other non-teaching staff.
Please click the "next" button at the bottom of each screen to advance to the following page of the survey. The survey should take about 15-20 minutes to complete.
Physics instruction
Please answer the following questions with a single science classroom in mind. If you taught physics in more than one classroom, answer these questions with respect to the class that was scheduled second during the school day.
1. Please write the start and end times for the class period during which you taught physics.If you taught physics in more than one class period, select the class that is scheduledsecond during the day.*
a. Start time:b. End time:
2. How many students are in this class? * (Enter integer)
3. What grade level is this class? * (Select all that apply)a. 6b. 7c. 8d. Other (please describe)
4. What proportion of students in this class are English Language Learners?* (Select one)a. Noneb. 1% – 20%c. 21% – 40%d. 41% – 60%e. 61% – 80%f. 81% – 100%g. Not sure
American Institutes for Research Enhancing Middle School Science Lessons With Playground Activities—C-10

5. What proportion of students in this class have an Individualized Education Plan (IEP)?* (Select one)
a. Noneb. 1% – 20%c. 21% – 40%d. 41% – 60%e. 61% – 80%f. 81% – 100%g. Not sure
6. In total, how many class periods have you spent teaching energy (e.g., energytransformation, potential energy, kinetic energy) this year?* (Enter integer 0 – 9 or 10 ormore, select one)
Branching: If 1 – 10 or more, jump to next question. If 0, jump to Q9
7. To what extent did you find the curriculum materials you used to teach physics this yearsupported student learning of energy? (Select one)
i. Not at all/slightlyj. Somewhatk. Moderatelyl. Very much so
8. In total, how many class periods have you spent teaching motion (e.g. speed, position)this year?* (Enter integer 0 – 9 or 10 or more, select one)
Branching: If 1 – 10 or more, jump to next question. If 0, jump to Q11.
9. To what extent did you find the curriculum materials you used to teach physics this yearsupported student learning of motion? (Select one)
a. Not at all/slightlyb. Somewhatc. Moderatelyd. Very much so
10. In total, how many class periods have you spent teaching force (e.g. Newton's third lawof equal and opposite forces) this year?* (Enter integer 0 – 9 or 10 or more, select one)
Branching: If 1 – 10 or more, jump to next question. If 0, jump to Q12
11. To what extent did you find the curriculum materials you used to teach physics this yearsupported student learning of force? (Select one)
a. Not at all/slightlyb. Somewhatc. Moderatelyd. Very much so
American Institutes for Research Enhancing Middle School Science Lessons With Playground Activities—C-11

12. Did you use any Playground Physics materials to teach … (Yes, no, unsure)?* a. Energyb. Forcec. Motion
Branching: If Yes or unsure, jump to next question. If No, jump to next section.
13. If yes, please explain how you used Playground Physics materials as part of your physicsinstruction. (Open response)
You have completed Section 1 of 2. Please press the Next button to continue to the next section.
Background Information
The following items will ask you to describe your current teaching assignments and characteristics of your teacher preparation.
14. Which school do you teach at?* (Select one, prepopulated list)
15. Including this year, how many years have you been teaching?* (Enter integer)
16. Including this year, how many years have you been teaching science?* (Enter integer)
17. Including this year, how many years have you been teaching physics?* (Enter integer)
18. Select the highest degree you have earned. (Select one)a. Associatesb. Bachelorsc. Mastersd. Doctorate
19. How comfortable are you with supplementing your science curriculum with digitalresources (e.g., simulations, science-related computer games, etc.)? (Select one)
a. Not at all comfortableb. Somewhat comfortablec. Mostly comfortabled. Very comfortable
You have completed Section 2 of 2. Please press Finish to submit the survey.
American Institutes for Research Enhancing Middle School Science Lessons With Playground Activities—C-12

Appendix D. Impact Analysis Technical Approach This appendix describes the technical approach to establishing baseline equivalence of the Treatment and Control groups and evaluating the differences between these groups with respect to the measures of student outcomes.
Establishing Baseline Equivalence
The student “pre-” survey and knowledge assessment for each of the domains of hypothesized impact (students’ engagement and attitudes toward science and knowledge of science concepts) were used to assess baseline equivalence. The average scores on pretest measures were used to compare across treatment conditions. The standard mean difference (SMD) was calculated using the following formula:
ut − uc
(n −1)SD2 + (n −1)SD2 t t c c
nt + nc − 2
ucwhere ut is the mean of treatment students and is the mean of comparison students, nt is thenumber of treatment students and nc is the number of comparison students, SDt is the standard deviation of treatment students and SDc is the standard deviation of comparison students.
Evaluating Group Differences
AIR used the following equation for the HLM to examine impacts of participating in the Playground Physics learning opportunities on eighth students’ engagement and attitudes toward science and knowledge of science concepts.
In this model, is the outcome of interest for student i under teacher j; is the model intercept;
TXj is the treatment indicator for teachers j; is the mean difference between the treatment and
control group or the main effect of treatment; is a vector of student-level covariates
(including a premeasure of the outcome and other characteristics such as grade level); is a vector of coefficients associated with each of those covariates showing the association of the
premeasure and each student-level characteristic and the outcome; is a vector of teacher
characteristics, such as years of experience; is a vector of coefficients associated with each of
American Institutes for Research Enhancing Middle School Science Lessons With Playground Activities—D-1
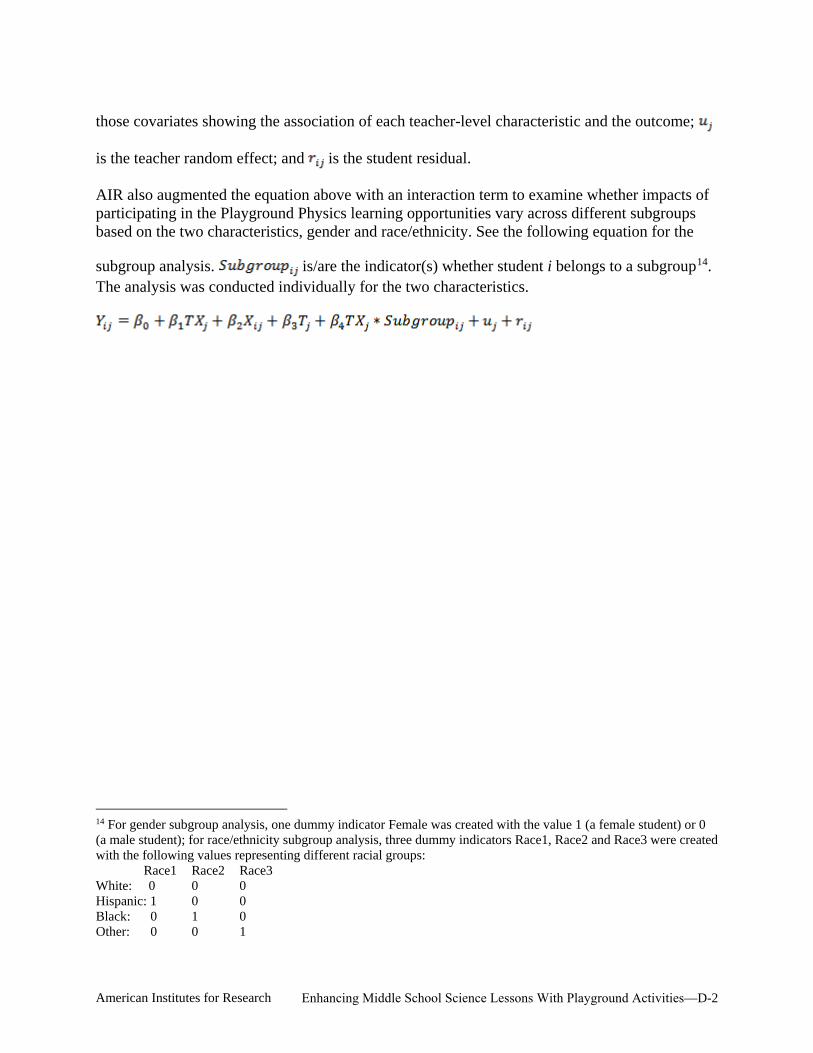
those covariates showing the association of each teacher-level characteristic and the outcome;
is the teacher random effect; and is the student residual.
AIR also augmented the equation above with an interaction term to examine whether impacts of participating in the Playground Physics learning opportunities vary across different subgroups based on the two characteristics, gender and race/ethnicity. See the following equation for the
subgroup analysis. is/are the indicator(s) whether student i belongs to a subgroup14. The analysis was conducted individually for the two characteristics.
14 For gender subgroup analysis, one dummy indicator Female was created with the value 1 (a female student) or 0 (a male student); for race/ethnicity subgroup analysis, three dummy indicators Race1, Race2 and Race3 were created with the following values representing different racial groups:
Race1 Race2 Race3 White: 0 0 0 Hispanic: 1 0 0 Black: 0 1 0 Other: 0 0 1
American Institutes for Research Enhancing Middle School Science Lessons With Playground Activities—D-2

Appendix E. Output from Statistical Models Table E.1. Output from Confirmatory Analyses: Regression Coefficients and Standard Errors fromStatistical Models Predicting Each Outcome Variable.
Covariate KnowledgeAssessment
Engagement
Intrinsic Motivation
Science Interest
Science Self-
Concept Science
Aspirations Intercept -0.955
(0.546) 1.495
(0.863) 3.610
(1.423) 0.966
(0.972) 3.142
(1.069) 0.040
(0.956) Treatment Status 0.335
(0.145) 0.002
(0.167) 0.066
(0.262) 0.06
(0.168) -0.300 (0.202)
0.001 (0.163)
Pretest 0.322 (0.031)
0.683 (0.026)
0.555 (0.027)
0.773 (0.025)
0.665 (0.027)
0.679 (0.026)
Teaching Experience
0.005 (0.011)
0.002 (0.012)
-0.019 (0.019)
-0.016 (0.012)
-0.002 (0.015)
0.009 (0.012)
Grade 6 0.474 (0.533)
-1.104 (0.860)
-2.141 (1.417)
-0.731 (0.968)
-2.241 (1.065)
0.039 (0.952)
Grade 7 0.806 (0.549)
-1.017 (0.873)
-2.273 (1.437)
-0.708 (0.98)
-2.399 (1.081)
0.235 (0.963)
Grade 8 0.568 (0.536)
-1.238 (0.856)
-2.708 (1.410)
-0.708 (0.963)
-2.345 (1.060)
0.000 (0.948)
Female -0.094 (0.053)
-0.003 (0.097)
-0.058 (0.161)
-0.163 (0.112)
-0.090 (0.121)
-0.112 (0.11)
White 0.203 (0.088)
-0.119 (0.161)
-0.120 (0.269)
-0.083 (0.185)
-0.096 (0.203)
-0.045 (0.183)
Black 0.106 (0.104)
-0.136 (0.191)
-0.215 (0.320)
0.072 (0.22)
0.109 (0.238)
0.159 (0.217)
Other 0.329 (0.077)
0.118 (0.138)
0.254 (0.230)
0.156 (0.159)
0.108 (0.172)
0.328 (0.157)
ELL -0.248 (0.120)
-0.112 (0.221)
-0.111 (0.373)
0.145 (0.254)
0.081 (0.275)
-0.092 (0.254)
SWD -0.225 (0.092)
-0.247 (0.165)
-0.077 (0.274)
-0.318 (0.188)
-0.421 (0.205)
-0.052 (0.186)
Poverty -0.041 (0.059)
0.066 (0.108)
0.014 (0.181)
0.011 (0.125)
0.109 (0.135)
-0.057 (0.124)
Days Absent -0.002 (0.003)
-0.009 (0.006)
-0.001 (0.011)
0.007 (0.007)
-0.008 (0.008)
0.000 (0.007)
American Institutes for Research Enhancing Middle School Science Lessons With Playground Activities—E-1

Table E.2. Output from Exploratory Analyses of Interaction of Gender with Treatment: RegressionCoefficients and Standard Errors from Statistical Models Predicting Each Outcome Variable
Variable KnowledgeAssessment
Engagement
Intrinsic Motivation
Science Interest
Science Self-
Concept Science
Aspirations (Intercept) (SE)
-0.762 (0.543)
1.397 (0.876)
3.521 (1.438)
0.907 (0.978)
3.050 (1.080)
0.000 (0.970)
Treatment Status (SE)
0.309 (0.144)
-0.095 (0.180)
-0.025 (0.282)
-0.075 (0.179)
-0.225 (0.215)
-0.121 (0.181)
Pretest (SE)
0.310 (0.030)
0.678 (0.026)
0.546 (0.027)
0.766 (0.025)
0.658 (0.027)
0.678 (0.026)
Teaching Experience (SE)
0.006 (0.011)
0.003 (0.012)
-0.015 (0.019)
-0.014 (0.012)
0 (0.015)
0.011 (0.012)
Grade 6 (SE)
0.462 (0.526)
-1.091 (0.862)
-2.189 (1.414)
-0.721 (0.963)
-2.329 (1.064)
0.062 (0.954)
Grade 7 (SE)
0.792 (0.542)
-1.007 (0.877)
-2.342 (1.435)
-0.690 (0.974)
-2.516 (1.08)
0.268 (0.967)
Grade 8 (SE)
0.569 (0.529)
-1.201 (0.858)
-2.694 (1.407)
-0.649 (0.958)
-2.409 (1.059)
0.063 (0.950)
Female (SE)
-0.104 (0.081)
-0.146 (0.152)
-0.138 (0.251)
-0.378 (0.175)
0.101 (0.188)
-0.315 (0.173)
Hispanic (SE)
-0.044 (0.085)
0.042 (0.155)
-0.091 (0.258)
-0.017 (0.177)
-0.035 (0.193)
0.171 (0.176)
Black (SE)
-0.132 (0.103)
-0.062 (0.188)
-0.184 (0.313)
0.089 (0.214)
0.184 (0.233)
0.146 (0.213)
Other (SE)
0.260 (0.081)
0.371 (0.148)
0.726 (0.248)
0.422 (0.170)
0.402 (0.184)
0.512 (0.169)
ELL (SE)
-0.271 (0.12)
-0.125 (0.221)
-0.173 (0.373)
0.129 (0.254)
0.006 (0.275)
-0.101 (0.255)
SWD (SE)
-0.166 (0.093)
-0.187 (0.167)
0.083 (0.277)
-0.228 (0.190)
-0.328 (0.207)
0.009 (0.188)
Poverty (SE)
-0.031 (0.059)
0.081 (0.108)
0.045 (0.180)
0.032 (0.124)
0.119 (0.134)
-0.041 (0.124)
Days Absent (SE)
-0.000 (0.003)
-0.007 (0.006)
0.005 (0.011)
0.011 (0.007)
-0.005 (0.008)
0.003 (0.007)
Treatment*Female (SE)
0.024 (0.095)
0.227 (0.177)
0.153 (0.295)
0.339 (0.204)
-0.281 (0.22)
0.321 (0.202)
American Institutes for Research Enhancing Middle School Science Lessons With Playground Activities—E-2

Table E.3. Output from Exploratory Analyses of Interaction of Race with Treatment: Regression Coefficients and Standard Errors from Statistical Models Predicting Each Outcome Variable
Variable KnowledgeAssessment
Engagement
Intrinsic Motivation
Science Interest
Science Self-
Concept Science
Aspirations (Intercept) (SE)
-0.794 (0.544)
1.360 (0.883)
3.430 (1.448)
1.026 (0.980)
2.948 (1.092)
-0.146 (0.972)
Treatment Status (SE)
0.367 (0.152)
-0.039 (0.201)
-0.004 (0.319)
-0.239 (0.202)
-0.157 (0.244)
0.07 (0.202)
Pretest (SE)
0.311 (0.030)
0.676 (0.026)
0.543 (0.027)
0.766 (0.025)
0.657 (0.027)
0.676 (0.026)
Teaching Experience (SE)
0.006 (0.011)
0.002 (0.013)
-0.017 (0.020)
-0.015 (0.012)
-0.001 (0.015)
0.01 (0.012)
Grade 6 (SE)
0.452 (0.526)
-1.047 (0.866)
-2.045 (1.419)
-0.691 (0.961)
-2.245 (1.071)
0.11 (0.953)
Grade 7 (SE)
0.788 (0.542)
-1.032 (0.881)
-2.280 (1.440)
-0.715 (0.972)
-2.464 (1.088)
0.275 (0.965)
Grade 8 (SE)
0.562 (0.529)
-1.203 (0.861)
-2.602 (1.412)
-0.649 (0.956)
-2.348 (1.066)
0.084 (0.949)
Female (SE)
-0.083 (0.052)
-0.007 (0.097)
-0.057 (0.161)
-0.187 (0.112)
-0.080 (0.121)
-0.107 (0.111)
Hispanic (SE)
0.002 (0.113)
0.141 (0.207)
0.119 (0.344)
-0.179 (0.236)
0.221 (0.257)
0.441 (0.234)
Black (SE)
-0.039 (0.150)
-0.330 (0.277)
-0.611 (0.460)
-0.514 (0.316)
0.178 (0.344)
0.066 (0.314)
Other (SE)
0.310 (0.127)
0.435 (0.231)
0.680 (0.382)
0.090 (0.263)
0.662 (0.286)
0.523 (0.261)
ELL (SE)
-0.282 (0.121)
-0.181 (0.224)
-0.222 (0.377)
0.138 (0.256)
-0.042 (0.279)
-0.154 (0.258)
SWD (SE)
-0.163 (0.093)
-0.196 (0.167)
0.055 (0.277)
-0.240 (0.190)
-0.347 (0.208)
0.004 (0.188)
Poverty (SE)
-0.034 (0.059)
0.074 (0.108)
0.034 (0.181)
0.035 (0.124)
0.110 (0.134)
-0.055 (0.124)
Days Absent (SE)
-0.000 (0.003)
-0.006 (0.006)
0.006 (0.011)
0.012 (0.007)
-0.005 (0.008)
0.003 (0.007)
Treatment*Hispanic (SE)
-0.071 (0.122)
-0.172 (0.225)
-0.384 (0.373)
0.225 (0.256)
-0.424 (0.279)
-0.462 (0.255)
Treatment*Black (SE)
-0.142 (0.172)
0.449 (0.315)
0.702 (0.524)
0.967* (0.360)
-0.011 (0.392)
0.18 (0.357)
Treatment*Other (SE)
-0.068 (0.131)
-0.066 (0.239)
0.081 (0.396)
0.485 (0.272)
-0.372 (0.297)
0.009 (0.27)
*p < .01.
American Institutes for Research Enhancing Middle School Science Lessons With Playground Activities—E-3

Appendix F. Knowledge Assessment Responses andStandards Alignment Table F.1. Response Distributions of Knowledge Assessment, Pretest and PosttestAdministrations
Question New York Standard Pre-Post Question
Match
Pretest (% correct)
Posttest (% correct)
Treatment (n=744)
Control (n = 422)
Treatment (n=744)
Control (n=422)
1 4.1c Same 48.1% 46.7% 72.8% 63.5% 2 4.1c Different 15.7% 16.4% 7.5% 8.5% 3 4.1c Same 16.7% 16.6% 19.6% 20.1% 4 4.1c Different 24.9% 23.2% 62.2% 46.4% 5 4.1e Same 36.3% 34.8% 44.5% 33.9% 6 4.1e Different 70.6% 61.4% 77.0% 65.6% 7 4.1e Different 57.8% 48.3% 55.5% 43.1% 8 4.1e Same 50.4% 50.0% 51.2% 46.4% 9 4.1e Same 34.3% 30.8% 44.6% 34.6% 10 4.1e Different 46.4% 41.9% 71.4% 49.1% 11 4.1e Different 28.8% 31.5% 73.8% 62.6% 12 5.1b Different 41.5% 34.6% 82.3% 71.8% 13 5.1b Different 49.2% 49.3% 52.8% 52.6% 14 5.1b Same 23.7% 21.3% 33.1% 25.6% 15 5.1b Same 6.7% 7.3% 9.7% 6.9% 16 5.1e Different 29.4% 29.6% 32.0% 36.3% 17 5.1e Same 56.0% 52.6% 63.6% 55.9% 18 5.1e Different 8.1% 9.5% 31.3% 32.0% 19 5.1e Same 30.6% 32.9% 37.5% 35.8% 20 5.1e Same 12.6% 13.0% 28.6% 27.7%
Notes: 4.1c (energy): Most activities in everyday life involve one form of energy being transformed into another. For example, the chemical energy in gasoline is transformed into mechanical energy in an automobile engine. Energy, in the form of heat, is almost always one of the products of energy transformations. 4.1e (energy): Energy can be considered to be either kinetic energy, which is the energy of motion, or potential energy, which depends on relative position. 5.1b (motion): The motion of an object can be described by its position, direction of motion, and speed. The position or direction of motion of an object can be changed by pushing or pulling. 5.1e (force): For every action there is an equal and opposite reaction.
American Institutes for Research Enhancing Middle School Science Lessons With Playground Activities—F-1

Appendix G. 2014–15 Fidelity of Implementation Analysis During the 2014–15 school year, NYSCI and AIR conducted a study of Playground Physics implementation in classrooms of 18 teachers from 11 schools (Dhillon, Margolin, Liu, & Williams, 2015). Nine of the 11 schools were in the New York City region, and two schools were from the greater New York area. For this implementation analysis, NYSCI identified three critical components of the program: professional development, curriculum materials, and classroom implementation of Playground Physics. Nested within each component were indicators that were combined together to form the component measures. For each of components and each of the indicators they comprised, NYSCI identified a criterion for fidelity of implementation. Table G-1summarizes the indicators and components used to examine program implementation fidelity.15
To achieve fidelity on the professional development component, NYSCI was expected to deliver 100 percent of all sessions offered, and at least 81 percent of all teachers participating in the study were expected to complete three sessions. The indicators for the professional development component include:
• Delivery of professional development. NYSCI was expected to offer three professionaldevelopment sessions to teachers: two evening sessions and one weekend session. NYSCIoffered two options per session. To attain fidelity on this professional development indicator,NYSCI needed to hold all six professional development sessions offered to teachers.
• Attendance of professional development. Teachers were expected to attend threeprofessional development sessions: two weekday evening sessions and one weekendsession. To attain fidelity on this indicator, teachers needed to attend all three sessions.
To attain fidelity on the curriculum material component, 95 percent of all teachers needed to receive the Playground Physics app, activity guide, and two iPads.
To attain fidelity on the classroom implementation of Playground Physics component, 81 percent or more of all participating teachers had to use Playground Physics in seven or more class periods and teach the three content areas (energy, force, motion). The indicators for the implementation of Playground Physics component include the following:
• Use of Playground Physics. To attain fidelity of this indicator, teachers were expected touse Playground Physics (app, curriculum, and iPads) as part of classroom instruction inseven or more class periods for implementation.
• Delivery of Playground Physics content area instruction. To attain fidelity of thisindicator, teachers were expected to use the Playground Physics curriculum when theyprovided instruction on all three physics content areas (energy, force, motion).
15 This appendix includes a simplified version of the fidelity criteria used by Dhillon et al (2015). Their report included both “adequate” and “high” levels of fidelity for each indicator. The fidelity criteria in this appendix correspond to the high level of fidelity reported by Dhillon et al. (2015).
American Institutes for Research Enhancing Middle School Science Lessons With Playground Activities—G-1

Table G-1. Playground Physics Indicator and Component Measures of Fidelity
Indicator OperationalDefinition
Data Collection Criteria Indicator Fidelity Criteria for
Component Fidelity Professional Development NYSCI delivery Playground Physics professional development
Deliver three days of professional development to teachers
Developer attendance records
Delivery of three sessions NYSCI delivery of all three days of professional development, and 81 percent of all teachers attend all three days of professional development.
Teacher attendance of Playground
Attend three professional development
Developer attendance records
Attendance of all three professional development sessions
Physics sessions (two professional after school development and one
weekend) Curriculum Materials Teacher Teacher Teacher Teacher receipt of all three Ninety-five percent or receipt of provided with survey materials more teachers receive Playground app, activity all materials. Physics guide, 2 iPads materials Classroom Implementation of Playground Physics Teacher usage of Playground Physics
Number of days Playground Physics app and curriculum were used
Teacher survey
Use Playground Physics in seven or more class periods
Eighty-one percent of teachers use Playground Physics in at least seven periods and cover all three physics content areas (energy, force, motion) using Playground Physics.
Teacher delivery of Playground Physics instruction
Number of Playground Physics content areas introduced to students
Teacher survey
Teacher covers all three physics content areas (energy, force, motion) using Playground Physics.
Fidelity of Implementation and Use Results
To examine fidelity of implementation, Playground Physics indicators were combined to create a composite score for professional development, materials, and enactment of Playground Physics. Table G-2 and G-3 provide Playground Physics indicators and component fidelity ratings.
Professional development. NYSCI professional development attendance records indicated all six planned sessions were administered by NYSCI; therefore, professional development was delivered with fidelity, 14 (78 percent) of 18 teachers attended all three sessions and four (22 percent) attended two sessions. Because the criterion for this indicator was NYSCI delivery of all three days of professional development and for at least 81 percent of teachers to complete all three sessions, implementation of the professional development component did not meet the fidelity criterion.
American Institutes for Research Enhancing Middle School Science Lessons With Playground Activities—G-2

Curriculum Materials. Sixteen (89 percent) of the 18 participating teachers stated they received all three program materials (the Playground Physics app, activity guide, and two iPads). The implementation of this component narrowly missed the fidelity of implementation criterion of 95 percent of teachers receiving all materials.
Classroom Implementation of Playground Physics. The classroom implementation of Playground Physics component metric included two indicators: teacher use of Playground Physics and teacher delivery of Playground Physics instruction. Of the 18 participating teachers, 14 (78 percent) used Playground Physics during seven or more class periods and met the criterion for indicator implementation fidelity.
To attain indicator fidelity on teacher delivery of Playground Physics instruction, teachers needed to cover all three physics content areas (energy, force, motion) using Playground Physics. In total, 14 (78 percent) teachers met this criterion. Twelve (67 percent) of the 18 teachers met the fidelity criterion for both indicators of Playground Physics enactment. Therefore, teachers overall did not meet the component criterion for fidelity of implementation, which was for 81 percent or more teachers use Playground Physics in at least seven periods and cover all three physics content using Playground Physics.
Table G-2. Playground Physics Indicator Fidelity Ratings
Program Indicators Indicator Rating Criteria Frequency Percent
(N = 18) Professional Development NYSCI delivery Playground Physics Professional Development
Delivery of three sessions 18 100%
Teacher attendance of Playground Physics Professional Development
Attendance of all three professional development sessions
14 77.8%
Materials Teacher receipt Playground Physics materials
Teacher receipt of all materials (app, activity guide, 2 iPads)
16 88.9%
Enactment of Playground Physics Teacher usage of Playground Physics
Use Playground Physics in seven or more class periods
14 77.8%
Teacher delivery of Playground Physics Instruction
Teacher covers all three physics content areas (energy, force, motion) using Playground Physics.
14 77.8%
American Institutes for Research Enhancing Middle School Science Lessons With Playground Activities—G-3

Table G-3. Playground Physics Component Fidelity Ratings
ProgramIndicators Criteria for Component Implementation
Frequency Percent Met Criterion? (N = 18)
Playground Physics professional development
NYSCI delivery of all three days of professional development. 81 percent of all teachers attended all three days of professional development.
14 77.8% No
Curriculum materials
Ninety-five percent or more teachers receive all three materials: app, activity guide and 2 iPads.
16 88.9% No
Classroom implementation of Playground Physics
Eighty-one percent of teachers use Playground Physics in at least seven periods and cover all three physics content areas (energy, force, motion) using Playground Physics.
12 66.7% No
American Institutes for Research Enhancing Middle School Science Lessons With Playground Activities—G-4

Appendix H. Supplemental Analysis This set of supplemental analysis provides a more detailed look at how teachers varied in their approaches to implementing Playground Physics, and how teachers reacted to the program’s professional development and curriculum materials. This information is intended to provide the developers with formative feedback toward improvement of program supports. These findings are all drawn from the teacher survey.
Use of Different Instructional Strategies and Flexible Components
Whereas Chapter 4 described the extent of implementation (i.e., amount of time spent per topic or unit), this section describes variations in use of the different instructional strategies (i.e., the curriculum sequence and science investigation) and the components of the curriculum that could be flexibly integrated into instruction. These components include the optional lessons and the introductory module.
Use of Playground Physics Instructional Strategies
As discussed in chapter 4, the level of implementation varied across the three instructional units. For each of these units, teachers more typically implemented some or all of the curriculum sequence instructional strategy than the science investigation instructional strategy. They following summarizes the prevalence of each strategy by unit (see also Table D.1.1:
• Motion. Nearly every teacher (23 of 24 or 96%) implemented some (58%) or all (38%) ofthe parts of the curriculum sequence for the Motion unit. At the same time, 13 of theseteachers (54% of the total) indicated that they used the science investigation instructionalstrategy, either in part (38%) or in its entirety (21%).
• Force. Over four fifths of teachers (20 of 24 or 83%) implemented some (62%) or all(21%) of the parts of the curriculum sequence for the Force unit. At the same time, 11 ofthese teachers (46% of the total) indicated that they used the science investigationinstructional strategy, either in part (21%) or in its entirety (25%).
• Energy. Over four fifths of teachers (20 of 24 or 83%) implemented some (58%) or all(25%) of the parts of the curriculum sequence for the Force unit. At the same time, 8 ofthese teachers (33% of the total) indicated that they used the science investigationinstructional strategy, either in part (12%) or in its entirety (21%).
American Institutes for Research Enhancing Middle School Science Lessons With Playground Activities—H-1

Table H.1. Crossmap of Teacher Use of Curriculum Sequence and Science Investigation
Use of Curriculum Sequence
Use of Science Investigation
Total Yes Yes, but didn’t finish Noa
Motion (Unit 1) I implemented all of the parts. 2 (8.3%)* 4 (16.7%)* 3 (12.5%)* 9 (37.5%) I implemented some of the parts. 3 (12.5%)* 5 (20.8%) 6 (25.0%) 14 (58.3%) I didn’t implement any of the parts.a 0 (0.0%) 0 (0.0%) 1 (4.2%) 1 (4.2%) Total 5 (20.8%) 9 (37.5%) 10 (41.7%) 24 (100%) Force (Unit 2) I implemented all of the parts. 2 (8.3%)* 1 (4.2%)* 2 (8.3%)* 5 (20.8%) I implemented some of the parts. 4 (16.7%)* 4 (16.7%) 7 (29.2%) 15 (62.5%) I didn’t implement any of the parts.a 0 (0.0%) 0 (0.0%) 4 (16.7%) 4 (16.7%) Total 6 (25.0%) 5 (20.8%) 13 (54.2%) 24 (100%) Energy (Unit 3) I implemented all of the parts. 3 (12.5%)* 0 (0.0%) 3 (12.5%)* 6 (25.0%) I implemented some of the parts. 2 (8.3%)* 3 (12.5%) 9 (37.5%) 14 (58.3%) I didn’t implement any of the parts.a 0 (0.0%) 0 (0.0%) 4 (16.7%) 4 (16.7%) Total 5 (20.8%) 3 (12.5%) 16 (66.7%) 24 (100%)
Note. * Denotes teachers who met fidelity requirements for implementation of Playground Physics. a Includes individuals who did not respond to the question in the survey. Source: Treatment teacher survey.
Use of optional lessons. Treatment teachers were also asked whether they used any of the Playground Physics optional lessons as part of their motion, force, and energy instruction. Overall, the use of optional lessons was low. A large portion of treatment teachers stated that they did not use the optional lessons to teach motion (10, 42%), force (9, 37%) and energy (15, 62%). The Odd One Out lesson was most commonly used in motion (8, 33%) and force (7, 29%) instruction. The Four Corners and Odd One Out Activity were equally used (4, 17% each) for energy instruction. Table D1.2 offers the proportion of treatment teachers who used Playground Physics optional lessons to teach motion, force and energy.
American Institutes for Research Enhancing Middle School Science Lessons With Playground Activities—H-2

Table H.2 Proportion of Treatment Teachers Who Used Optional Lesson to Teach Motion, Forceand Energy
Optional Lesson Frequency Percent Motion 1.5 – Data Match 6 25.0% 1.6 – Four Corners 7 29.2% 1.7 – Odd One Out 8 33.3% None of the lesson options were used 10 41.7% Force 2.5 – Four Corners 6 25.0% 2.6 – Odd One Out 7 29.2% None of the lesson options were used 9 37.5% Energy 3.5 – Four Corners 4 16.7% 3.6 – Odd One Out 4 16.7% I did not use any of the optional lessons.
15 62.5%
Note. Teachers could select multiple responses. Source: Treatment teacher survey.
Approaches to introducing Playground Physics. When asked how Playground Physics was introduced to their classes, 10 (42%) of the 23 treatment teachers reported using lesson 0.2 Getting Started – Bingo and 7 (29%) modified 0.2 Getting Started – Bingo and seven (29%) reported creating their own lesson to introduce the app. Seven teachers responded to an open ended question asking how they introduced Playground Physics include. The 13 comments centered on the following three themes
• Provide guided practice (6 comments). These teachers indicated that they providedguided practice, such as leading students through an exercise on how to record videosusing object or students. An example of a representative comment was, “We walked themthrough the app and how to use it and then we gave them several different materials toexperiment with to make videos and analyze them.”
• Demonstrate app features (4 comments). Several teachers comments indicated that theydemonstrated the app features in the classroom. An example of a representative commentwas, “I showed them using the Smartboard how to do it…”
• Show the app video (3 comments). Teachers stated that they should the program appvideo. An example of a representative comment was, “I used the video on the iPad aboutthe app to introduce it to my class.”
American Institutes for Research Enhancing Middle School Science Lessons With Playground Activities—H-3

Reactions to Playground Physics
This section provides descriptive findings on treatment teacher’s reactions to the Playground Physics program as well as their perceptions of student reactions to the materials using data collected through the treatment teacher survey during the 2015–16 school year.
This chapter addresses the following three questions: 1. How well did professional development prepare teachers to implement Playground Physics?2. What were teachers’ perceptions of the program and its influence on students?3. What were the facilitators and barriers of Playground Physics use?
Generally, most treatment teachers believed professional development prepared them to use the Playground Physics curriculum. Treatment teachers also indicated that they would use the curriculum in the future, believed it was equally or more engaging than their regular physics curriculum and that it moderately or very much so supported student learning of each of the three content areas. Including more curriculum content and app functionality were the most commonly noted recommendations for improvement.
How Well Did Professional Development Prepare Teachers toImplement Playground Physics?
Treatment teachers were asked to provide feedback on how well NYSCI’s professional development prepared them to Playground Physics and how professional development could be improved. Nearly all teachers believed professional development prepared them to use the Playground Physics curriculum. The most commonly reported suggestion for professional development improvement was to include more time for teachers to practice using the Playground Physics app.
Preparation for program use. When teachers were asked if NYSCI’s professional development prepared them to teach the Playground Physics, most teachers (87%) stated the professional development prepared them either very much so (50%) or moderately (37%). Figure 4.1 summarizes treatment teacher opinions about Playground Physics preparation.
American Institutes for Research Enhancing Middle School Science Lessons With Playground Activities—H-4
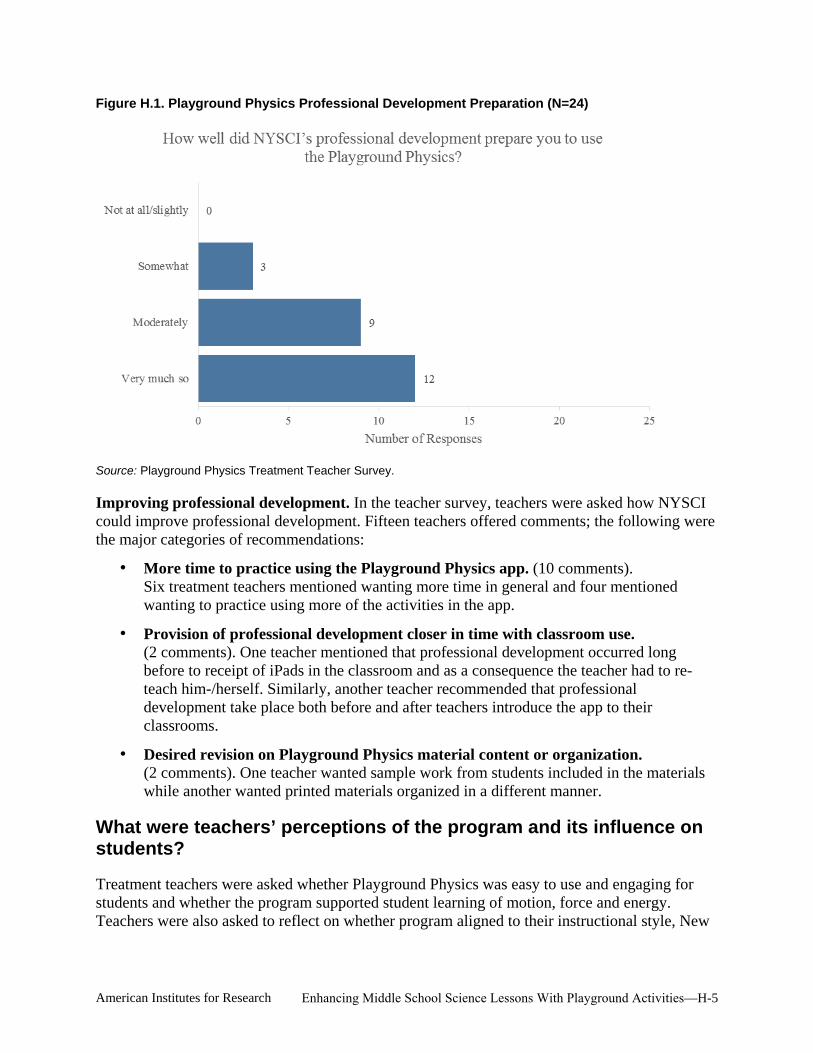
Figure H.1. Playground Physics Professional Development Preparation (N=24)
Source: Playground Physics Treatment Teacher Survey.
Improving professional development. In the teacher survey, teachers were asked how NYSCI could improve professional development. Fifteen teachers offered comments; the following were the major categories of recommendations:
• More time to practice using the Playground Physics app. (10 comments).Six treatment teachers mentioned wanting more time in general and four mentionedwanting to practice using more of the activities in the app.
• Provision of professional development closer in time with classroom use.(2 comments). One teacher mentioned that professional development occurred longbefore to receipt of iPads in the classroom and as a consequence the teacher had to reteach him-/herself. Similarly, another teacher recommended that professionaldevelopment take place both before and after teachers introduce the app to theirclassrooms.
• Desired revision on Playground Physics material content or organization.(2 comments). One teacher wanted sample work from students included in the materialswhile another wanted printed materials organized in a different manner.
What were teachers’ perceptions of the program and its influence onstudents?
Treatment teachers were asked whether Playground Physics was easy to use and engaging for students and whether the program supported student learning of motion, force and energy. Teachers were also asked to reflect on whether program aligned to their instructional style, New
American Institutes for Research Enhancing Middle School Science Lessons With Playground Activities—H-5

York science standards and student ability level. And, finally, teachers were asked whether they would use the program again in the future.
Most teachers reported that Playground Physics supported student learning of motion, force and energy. More so, students found Playground Physics easy to use and were equally or more engaged compared to conventional lessons. Most teachers would use the program with no or some changes the next time they taught each unit and believed that the program aligned to their instructional style and to New York science standards. They were less inclined to report the program aligned to their student’s ability level.
Engagement and ease of use of the program. When asked how easy the program was to use by students, 18 (78%) of 23 treatment teachers reported students found the Playground Physics moderately easy (35%) or very easy (43%) to use. In addition, all teachers reported that their classes were equally (22%) or more engaged (78%) in Playground Physics lessons compared to conventional lessons on these topics. Figures 4.2 and 4.3 provide the frequency of class ease of use of the program app and engagement in the program lessons
Figure H.2. Teacher Ratings of Students’ Ease of Use of the Playground Physics App (N = 23)
Source: Treatment teacher survey.
American Institutes for Research Enhancing Middle School Science Lessons With Playground Activities—H-6

Figure H.3. Class Engagement in Playground Physics Compared to Conventional Lessons (N = 23)
Source: Treatment teacher survey.
Student reaction to program. Treatment teachers were asked to describe, in open ended format, student reactions to Playground Physics. Eighteen teachers made 23 comments on how students reacted to the program. The comments centered on the following three themes:
• Students were engaged with the app (13 comments). These teachers mentioned thatstudents were excited to use the app and iPads. An example of a representative commentwas, “The students enjoyed playing and the app kept them engaged.”
• Students liked the program (6 comments). Six teacher comments simply stated thatstudents liked or loved the program. An example of a representative comment was, “Theyloved it!”
• Student struggled to understand physics concepts (2 comments). Two teachers statedstudents were interested in using the app but were unable to use the program to deepentheir understanding of physics concepts. An example of a representative comment was,“Students … had trouble interpreting the data and graphs and linking the information tothe concepts in class.”
Use of program to support to student learning. Teachers were asked to what extent they found Playground Physics supported student learning of motion, force, and energy. A large majority of teachers (72%) believed Playground Physics moderately (27%) or very much so (45%) supported student learning of motion. About two thirds of teachers believed Playground Physics moderately (20%) or very much so (45%) supported student learning of force and believed Playground Physics moderately (39%) or very much so (30%) supported student learning of energy. These findings are displayed in Figure 4.4.
American Institutes for Research Enhancing Middle School Science Lessons With Playground Activities—H-7

Figure H.4. Number of Teachers Who Believe Playground Physics Supports Student Learning ofMotion, Force and Energy
Source: Treatment teacher survey.
Use of program in the future. Over four fifths (83%) of teachers stated they would use the program with no or some changes the next time they taught both motion and energy and 14 (70%) of 20 treatment teachers would use the program with no or some changes the next time they taught force. These findings are displayed in Figure 4.5.
American Institutes for Research Enhancing Middle School Science Lessons With Playground Activities—H-8

Figure H.5. Number of Teachers Who Would Use Playground Physics Next Time They TaughtMotion, Force and Energy
Source: Treatment teacher survey.
Program alignment to instructional style, standard and student ability. Treatment teachers were asked how well the Playground Physics curriculum matched their instructional style, the New York state science standards for this grade level, and students' physics ability level in this class. Twenty (91%) of 23 teachers reported the program matched moderately (48%) or very much so (39%) to their instructional style. Similarly, 21 teachers (91%) reported the program matched moderately (48%) or very much so (43%) to New York science standards.
Teachers were less inclined to report Playground Physics aligned to student ability level. Compared to teacher instructional style and New York science standards, fewer teachers (16, 69%) reported the program matched moderately (26%) or very much so (43%) to student ability level. Figure 4.6 details the frequency of Playground Physics curriculum matching teacher instructional style, student ability level, and New York science standards.
American Institutes for Research Enhancing Middle School Science Lessons With Playground Activities—H-9

Figure H.6. Playground Physics Curriculum Alignment to Treatment Teacher Instructional Style,Student Ability Level, and New York Science Standards
How well did the Playground Physics curriculum match with...
Not at all/Slightly Somewhat Moderately Very Much So
Teacher Instructional Style (n = 23)
Student Ability Level (n = 23)
New York Science Standards (n = 23)
7 6 10
2
3
11
11
10
9
0 5 10 15 20 25 Number of Teachers
Source: Treatment teacher survey.
What Aspects of Playground Physics Worked Well and Which Did Not?
Treatment teachers were asked to describe, in open-ended manner, what aspects of the program went well and what did not. They were also given the opportunity to provide advice to NYSCI on how to improve the program. Teachers most commonly stated that the technology features of the program worked well and that the program afforded their students hands-on experience with physics concepts. Teachers were mostly concerned about the quality and effectiveness of the curriculum materials and student difficulty with using the app. To improve the program, teachers suggested adding more content to the curriculum and adding features to the app.
Aspects of the program that worked well. Treatment teachers were asked to comment on what aspects of Playground Physics worked well and did not work well. Twenty-two teachers made 30 comments about aspects of the program that worked well. The comments centered on the following four themes16:
• Technology features (12 comments). Three teachers mentioned liking the opportunity touse technology in their classroom and three teachers mentioned liking the ability to makevideos. Five teachers thought the annotation features (e.g., path, graphing, stickers)worked well and one teacher appreciated that actual speeds, potential energy, kinetic
16 Four comments were too general to categorize, including two that stated simply that the entire program worked well.
American Institutes for Research Enhancing Middle School Science Lessons With Playground Activities—H-10

energy and motion were displayed in the app. An example of a representative comment was, “making their own videos and annotating them.”
• Hands-on experience (6 comments). Six teachers mentioned that they appreciated thehands-on experience afforded to students by using the app. An example of arepresentative comment was, “The hands-on aspect of the program was excellent.”
• Student learning through program (4 comments). Four teachers stated that they likedthat the program helped students understand the relationships between different concepts(e.g. motion and speed, energy and height/mass). An example of a representativecomment was, “Showing the change in motion while playing catch [was useful]. [Thestudents] could see how the force of gravity increased the speed.”
• Student engagement (4 comments). Four teachers mentioned that students were engagedwhen using the app or participating in curriculum activities. An example of a representativecomment was, “The lessons were clear and the app was generally engaging.”
Aspects of the program that did not work well. Sixteen teachers made 18 comments about aspects of the program that did not work well. The comments centered on the following four themes:
• Quality or effectiveness of materials (6 comments). One teachers mentioned that thepictures in the handouts were hard to read and interpret once photocopies were made.Another stated that he/she did not like the worksheets and a third teacher stated that thesequencing of the lesson was repetitive. An example of a representative comment was,“The sequence of lessons was good at first but they were becoming bored with it by thelast set of lessons.”
• Using the app correctly (5 comments). Three teachers stated that students had difficultrecording videos at the proper angle, another mentioned having difficulty setting calipersto measure distance from ground and height and one teacher simply stated that the appwas confusing at times. An example of a representative comment was, “Understandingthat video had to be shot in a particular way for the app to work [was a challenge].”
• Technology access or use (3 comments). Two teachers mentioned that there wereglitches with the iPads or app and one teacher mentioned that they did not feel like theyhad enough iPads for their class. An example of a representative comment was, “Forceand energy both crashed at certain points.”
• Time with the program (3 comments). Three teachers commented that they would liketo have had more time to play with or use the app in their classroom17.
Additional advice from program participants. In the teacher survey, teachers were given the opportunity to provide additional advice. The comments provided were often recommendations for improving the Playground Physics program. Twelve treatment teachers made 17 recommendations. The recommendations centered on the following four themes:
17 NYSCI delivered a set of iPads to each participating treatment teacher. However, teachers had access to the iPads for a fixed amount of time.
American Institutes for Research Enhancing Middle School Science Lessons With Playground Activities—H-11

• Add content to curriculum activities (7 comments). Seven teachers had a variety ofsuggestions for increasing the quality of curriculum materials, including adding moreinformation on how to analyze graphs, adding vocabulary and tips, including moreactivities, adding a literacy component to support Common Core and NGSS, add moredepth to three lessons, including more experimentation and including higher qualityscreenshots in curriculum materials. For example, one teacher said, “[The] curriculumneeds more graph analysis pre-taught to fully appreciate the graph.”
• Add more functionality to the app (5 comments). Five teachers had differentsuggestions for adding more to the functionality of the app, including allowing studentsto plot and print data in graphs, add animations to the app, vary activities in the app, andmake it easier to measure force in the app. For example, one teacher suggested that thedevelopers, “Vary the activities on the apps. Add vocabulary and tips.”
• Address technology glitches (2 comments). Two teachers suggested that the app beperiodically de-bugged to avoid crashing. For example, one teacher recommendedNYSCI, “…fix the bugs that keep crashing the app.”
• Include more professional development time for teachers (2 comments). Two teacherscommented that they would like more professional development time to practice usingthe program. For example, one teacher stated, “I think maybe one additional PD sessionwould have helped me feel more comfortable with the app.”
Summary of Reactions to Playground Physics
The data collected through the teacher survey allowed all treatment teachers participating in the study an opportunity to voice their opinion on the Playground Physics program and can be used by the developers to improve the program. Nearly all teachers believed professional development prepared them to use the Playground Physics program. The most commonly reported suggestion for professional development improvement was to include more time for teachers to practice using the Playground Physics app.
The majority of treatment teachers reported students found the Playground Physics easy to use and reported students were equally or more engaged in Playground Physics lessons compared to conventional lessons on these units. Similarly, many teachers believed Playground Physics supported student learning and would use the program in the future with no or some changes the next time they taught motion, force and energy. Most treatment teachers also reported that Playground Physics aligned to their instructional style and New York science standards but were less likely to state it aligned to their student’s ability level.
When asked what aspects of the program went well, four themes emerged: technology features of the program, hands on experience, student engagement and student learning. When asked what aspects of the program did not go well, teachers stated accessing and using technology was a challenge, as well as correctly using the app, quality and effectiveness of the program materials and limited time with the app. These teachers recommended that NYSCI address the technology challenges, add more functionality and content to the program and increase professional development time.
American Institutes for Research Enhancing Middle School Science Lessons With Playground Activities—H-12


ABOUT AMERICAN INSTITUTES FOR RESEARCH
Established in 1946, with headquarters in Washington, D.C.,
American Institutes for Research (AIR) is an independent,
nonpartisan, not-for-profit organization that conducts behavioral
and social science research and delivers technical assistance
both domestically and internationally. As one of the largest
behavioral and social science research organizations in the
world, AIR is committed to empowering communities and
institutions with innovative solutions to the most critical
challenges in education, health, workforce, and international
development.
1000 Thomas Jefferson Street NW Washington, DC 20007-3835 202.403.5000
www.air.org
LOCATIONS
Domestic Washington, D.C.
Atlanta, GA
Austin, TX
Baltimore, MD
Cayce, SC
Chapel Hill, NC
Chicago, IL
Columbus, OH
Frederick, MD
Honolulu, HI
Indianapolis, IN
Metairie, LA
Naperville, IL
New York, NY
Rockville, MD
Sacramento, CA
San Mateo, CA
Waltham, MA
International Egypt
Honduras
Ivory Coast
Kyrgyzstan
Liberia
Tajikistan
Zambia
0994_04/17